

Abstract
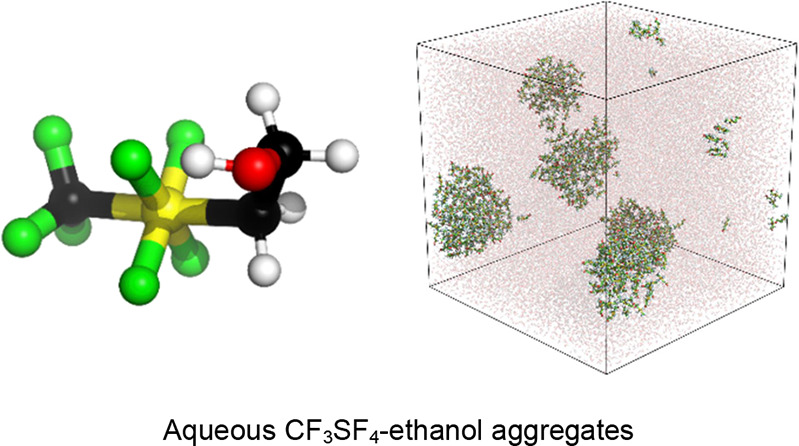
2-Tetrafluoro(trifluoromethyl)-λ6-sulfanylethan-1-ol (CF3SF4-ethanol) combines the polar hydrophobicity of tetrafluoro(trifluoromethyl)-λ6-sulfanyl (CF3SF4) group with the polarity of simple alcohols. The properties of aqueous solutions of the well-known fluorinated alcohols 2,2,2-trifluoroethanol (TFE) and 1,1,1,3,3,3-hexafluoroisopropanol (HFIP) were compared with those of aqueous solutions of the novel CF3SF4-ethanol. Those properties were computed using all atom molecular dynamics simulations with OPLS-compatible parameters. DFT ab initio calculations were used to accurately describe the nonsymmetrical, hypervalent sulfur in CF3SF4-ethanol. Although the molecular and conformational characteristics of CF3SF4-ethanol are like those of both TFE and HFIP, the greater hydrophobicity and lower polarity of CF3SF4-ethanol resulted in solution phase aggregation at a much lower concentration. The properties computed for TFE and HFIP in this work were consistent with published computational and experimental studies. CF3SF4-ethanol is predicted to be environmentally benign and hence an excellent green solvent candidate while possessing many of the same properties as TFE or HFIP.
1. Introduction
Many of the novel effects of aqueous solutions of fluorinated alcohols, such as 2,2,2-trifluoroethanol (TFE) and 1,1,1,3,3,3-hexafluoroisopropanol (HFIP), arise from the large ionization constants, induced dipole interactions, polarity, and lipophilicity of these compounds.1,2 Fluorinated alcohols have extensive biological, agricultural, industrial, and chemical applications.2−6 Aqueous solutions of fluorinated alcohols have found widespread utility in synthetic reactions, solvolytic experiments, and protein structure analysis studies.7,8 Unfortunately, the chemical and thermal stability of the fluorinated alcohols can result in undesirable environmental and biological accumulation.
The structure and dynamics of aqueous solutions of small organic molecules profoundly influence the properties of those mixtures. Phenomena, such as micelle formation by surfactants, polymer aggregation, or alcohol-induced protein denaturation9 are governed by those properties. Intermolecular interactions of the small molecules with the solvent as well as other solutes can modulate hydrogen bonding, ion-dipole interactions, dipole–dipole, induced dipole–dipole, and induced dipole-induced dipole forces. Nonetheless, studies of chemical solvation in mixed solvent systems are frustrated by the complexity of the intermolecular contact networks and the lack of suitable techniques to probe those contacts.
Aqueous fluorinated alcohols form stable, well-organized three-dimensional supramolecular assemblies in aqueous solutions more readily than nonfluorinated alcohols.10 The greater propensity of HFIP and TFE to form clusters correlates with the tendency of these alcohols to favor protein and peptide conformational transitions. The tendency of HFIP–water mixtures to more effectively promote both cluster formation and conformational transitions than TFE–water mixtures is consistent with the effect of increasing fluorination promoting aggregation.11−14 The fluorine content of the alcohol affects the concentration-dependent dynamics of aqueous alcohol solutions.
As peptide-solvent interactions influence the secondary structure, changes in peptide conformation can be used to investigate solvent interactions. The addition of small molecules, such as fluorinated alcohols, to aqueous protein and peptide solutions can promote the formation of helical motifs,7,8,15 can induce the collapse of peptides into globule-like intermediates, and may stabilize intermediate peptide structures.1,16,17 Although the exact nature of alcohol interactions with these biomolecules is unclear, hydrophobicity-induced alcohol aggregation is known to promote polypeptide assembly.10,18 The displacement of water minimizes H-bonding with the solvent, thereby favoring the formation of stabilizing intrapeptide H-bonds. Fluorinated alcohols such as TFE and HFIP can stabilize the secondary structure of peptides by altering hydrophobic interactions6 of the side chains of unfolded, random coil peptides. Enhancement of the rate of protein folding by fluorinated alcohols is a consequence of the excluded volume-effect1,8,10,15−17,19−23 where the partial exclusion of water facilitates conformational change.24
The utility of TFE and HFIP motivated the study of a novel hydrophobic fluorinated alcohol, 2-tetrafluoro(trifluoromethyl)-λ6-sulfanylethan-1-ol (CF3SF4-ethanol). CF3SF4-ethanol combines the polar hydrophobicity of the tetrafluoro(trifluoromethyl)-λ6-sulfanyl (CF3SF4) group with the polarity of simple alcohols. Previously, site-specific incorporation of the tetrafluoro(trifluoromethyl)-λ6-sulfanyl (CF3SF4) moiety was employed to demonstrate the polar hydrophobicity of this group.25 CF3SF4-ethanol combines the properties of both TFE and HFIP. The electron-withdrawing effect of the CF3SF4 functional group is equivalent to that of the CF3 group but with higher hydrophobicity. With one more additional fluorine than HFIP and four more fluorines than TFE, CF3SF4-ethanol is the most hydrophobic molecule of the group. Unlike other fluorinated alcohols, CF3SF4-ethanol is easily biodegradable and predicted to be environmentally benign. CF3SF4-ethanol may be an excellent green solvent candidate while being as efficacious as TFE or HFIP in a variety of applications.
This novel alcohol is easily prepared by the triethylborane-promoted addition reaction of tetrafluoro(trifluoromethyl)-λ6-sulfanyl chloride (trans-CF3SF4Cl)26 to vinyl acetate and subsequent reduction of the adduct.
The relative propensities of TFE, HFIP, and CF3SF4-ethanol to aggregate were analyzed using dynamic light scattering (DLS) experiments in conjunction with all atom molecular dynamics simulations. New Optimized Potentials for Liquid Simulations (OPLS)27 compatible parameters for octahedral, hypervalent sulfur coordinated with heterogenous ligands are described. Analyses indicated that CF3SF4-ethanol displayed a higher affinity for aggregation at lower concentrations than HFIP or TFE.
2. Experimental Section
2.1. Synthesis of trans-CF3SF4Cl
A solution of 5.4 mL of perchloromethyl mercaptan (50 mmol, 1.0 equiv), 16 g of rigorously dried potassium fluoride powder (275.4 mmol, 5.5 equiv), and 15 mL of sulfolane was heated at 260 °C for 6 h and the resulting intermediates, (CF3S)2 and CF3SCl, were collected over dry ice in 80% yield. Then, the intermediates were stirred with 16 g of dried KF powder (275.4 mmol, 5.5 equiv), 0.7 mL of bromine (3.1 g/cm3, 13.6 mmol, 0.1 equiv), and 14.5 g of chlorine (0.2 mol, 1.0 equiv) dissolved in 71 mL of dry acetonitrile at −10 °C for 6 h to afford trans-CF3SF4Cl. After the mixture was cooled to −198 °C, the product was distilled by gradually warming the reaction flask to 0 °C and was collected over 8 mL pentane in 34% yield. The yield was determined by 19F NMR using benzotrifluoride as an internal standard and agrees with literature values.26
2.2. Synthesis of 2-(Tetrafluoro(trifluoromethyl)-λ6-sulfanylethan-1-ol)
trans-CF3SF4Cl gas and 0.1 mL of triethylborane (0.7 mmol,1.0 equiv) were incorporated in a solution of 0.87 g of vinyl acetate (11.6 mmol, 1.0 equiv) in 10 mL of pentane. The mixture was stirred for 30 min before the radical addition reaction was quenched by the addition of aqueous NaHCO3 and extracted twice with diethyl ether. Combined organic layers were dried with MgSO4 and concentrated under vacuum to afford crude 1-chloro-2-(tetrafluoro(trifluoromethyl)-λ6-sulfanyl)ethyl acetate26 as a colorless oil in 70% yield. The product was isolated using silica gel column chromatography and characterized using 19F NMR. The obtained NMR spectra were consistent with the published spectra.26 At 0 °C, 5.0 mL of LiAlH4 (1.0 M in Et2O, 1.2 equiv) was gradually added to a solution of 0.3 g (1.004 mmol, 1.0 equiv) of the purified 1-chloro-2-(tetrafluoro(trifluoromethyl)-λ6-sulfanyl)ethyl acetate in 10.0 mL of diethyl ether. After 30 min, 4–5 drops of saturated ammonium chloride solution were added, and the mixture was stirred for 1 h at room temperature. Subsequently, the aqueous layer was extracted with diethyl ether three times. The resulting organic layers were combined, dried with MgSO4, and concentrated under vacuum (400 mPa) at 40 °C under argon conditions to afford 2-(tetrafluoro(trifluoromethyl)-λ6-sulfanyl)ethan-1-ol in 40% yield by distillation.28 The yield was determined by 19F NMR using benzotrifluoride as an internal standard. Rf = 0.39 (Hex/EtOAc 7:3); 1H-NMR (500 MHz, chloroform-d) δ 4.02(dddd, J = 12.9, 9.4, 5.8, 1.7 Hz 2H), 4.13(dddt, J = 8.4, 5.7, 3.6, 1, 6 Hz, 2H), 2.06–1.99(m, H), 19F NMR (471 MHz, chloroform-d) δ 42.86 (qt, JF–F = 25.4, 8.8 Hz), −63.71 (p, JH–F = 25.4 Hz). HRMS (DART-ESI, m/z): (M + H)+ calculated for 223.00, found: 223.030.
2.3. Dynamic Light Scattering (DLS)
DLS experiments were conducted using a Zetasizer Nano ZS (Malvern, USA) instrument with a 632.8 nm laser. Samples are prepared in deionized water with a sample size of 1.0 mL. Aqueous mixtures of TFE were first investigated at high alcohol concentrations (70% v/v) and then gradually diluted with water (60%, 50%, 40%, 30%, 20%) until the aggregation propensity was below the limit of detection (10% v/v). The same procedure was used for the HFIP–water solution, where DLS data were obtained for 50, 40, 30, 20, 10, and 8% HFIP and the CF3SF4–ethanol aqueous mixtures, where the following alcohol concentrations were investigated: 50, 20, 10, 8, 6, 4.5, and 1% (v/v). Measurements were not obtained for CF3SF4–ethanol since the extent of cluster formation was beyond the instrument’s limit of detection, even at low alcohol concentrations. Water was used as a reference.
2.4. DFT Computations
Ab initio DFT geometry and charge calculations were performed using the Q-Chem 5.1.2 quantum chemistry software.29 The initial structures were constructed by incorporating experimentally derived bonds and angles into idealized geometries.30,31 Then, equilibrium structure geometry optimization and energy calculations were conducted in the gas phase with the B3LYP density functional32 using a cc-pVQZ basis set33 with a DFT-D3 dispersion correction.34 Charges and dipole moments were computed using the RESP35 protocol with the PBE0 functional in conjunction with Jensen’s polarization consistent pc-3 basis set.36 Experimentally derived bonds and angles30,31 were employed in gas phase equilibrium structure geometry optimization and energy calculations with the B3LYP density functional37 using a cc-pVQZ basis set33 and a DFT-D3 dispersion correction.34 B3LYP, a commonly used functional for small organic molecules,25,26,38−40 provided reasonable accuracy for energies compared to other functionals.32 With SF6, B3LYP has been shown to capture more essential vibrational and energetic properties in comparison with the CCSD and B3PW91 methods.41,42 Dunning’s large quadruple-zeta basis set33 supplies additional polarization functions for both hydrogen and heavy atoms, a feature that is essential for modeling S–F bonds in a hypervalent environment.41,42 This basis set provides additional flexibility for the construction of valence orbitals near the infinite basis set limit. Furthermore, previous studies have demonstrated that the QZ basis set supplies more accurate S–F bond lengths than the DZ or TZ basis sets in combination with the B3LYP functional.42
Charges and dipole moments were computed using the RESP35 protocol with the PBE0 functional in conjunction with Jensen’s polarization consistent pc-3 basis set.36 The PBE0 density functional provided excellent polarization37 and dipole moments32 necessary to model charges. The pc-3 basis set is comparable to the cc-pVQZ basis set used for geometry optimization36 but is better suited for converging the overall structure of the ground-state electron density.36 While the common CHELPG method43 produces best fit charges that minimize least-squared differences between the quantum and classical electrostatic potential measured outside the molecule, it may over-polarize specific chemical groups. To circumvent this, the RESP method utilizes CHELPG-like charges with a modest hyperbolic restraint to the total charge of each atom to minimize over polarization effects, while concurrently having only a minimal effect on the fit to the electrostatic potential.
2.5. Molecular Dynamics Calculations
Molecular dynamics (MD) simulations of the mixed solvent systems were carried out using all atom simulation method incorporated in GROMACS 2019.4 molecular dynamics simulation package44 and the OPLS-AA force field parameters available in the GROMACS topology were utilized. The geometry-optimized synclinal conformer was used in structural models of the fluorinated alcohols to elucidate the interconversion dynamics between the synclinal and the antiperiplanar rotamers. Aqueous mixtures were used with concentrations for TFE of 10% (v/v), 15, 20, 25, and 30%; for HFIP of 8% (v/v), 10, 15, 20, 30, and 40%; and for CF3SF4-ethanol of 0.25% (v/v), 0.5, 1, 2.5, 4.5, 6, 8, 10, 15, and 25%. The total number of alcohol molecules to water molecules employed in MD simulations is shown in Table 1. The number of solute molecules in a (11.6 nm)3 cube was determined using the volume fraction and the densities reported in Table 7. The molarity of the solvent system was calculated using that information. In a (11.6 nm)3 cube, the desired number of alcohol molecules was solvated with the TIP4P-Ewald45 water model. The energy of the system was minimized for 1000 steps using the steepest descent algorithm with a step size of 0.01 nm. Then, NVT trajectories were propagated using a leapfrog integrator46 with a Berendsen thermostat47 and a 2 fs timestep. Each solvated system was equilibrated by performing simulations for 25 ns at 300 K and 1 bar. Computational analyses were performed with the last 2 ns of simulation data. The size distribution of molecular clusters in the gas phase was affected using the g-clustsize tool incorporated in GROMACS for the all alcohol–water system. The g-clustsize tool provides insights into the clustering behavior for the alcohol–water system, allowing analysis of the size distribution of clusters and identification of the most significant cluster based on size. For CF3SF4–ethanol, the size distribution of molecular clusters was estimated using the gmx clustsize tool utilizing a 0.6 nm cutoff. The clustering degree was defined as the size of the largest cluster. At lower concentrations, where more than one cluster exists, gmx clustsize calculates the size distribution of the most significant/largest cluster to calculate the size distribution. For higher concentrations, it considers the entire cluster.
Table 1. Total Number of Alcohol/Water Molecules Utilized in Simulation.
| %(v/v) | NTFE/water | NHFIP/water | NCF3SF4-ethanol/water |
|---|---|---|---|
| 0.5 | 50/51354 | ||
| 1.0 | 100/50979 | ||
| 2.5 | 200/50191 | ||
| 4.5 | 400/48,690 | ||
| 6.0 | 500/47,945 | ||
| 8.0 | 1000/47,586 | 700/47,792 | 700/46,653 |
| 10.0 | 1400/45,872 | 1200/44,987 | 1000/44,147 |
| 15.0 | 1800/44,320 | 1400/43,907 | 1350/41,571 |
| 20.0 | 2600/41,118 | 1800/41,695 | |
| 25.0 | 3400/37,954 | 2800/36,336 | 2000/36,834 |
| 30.0 | 4200/34,973 | 3600/32,171 | |
| 40.0 | 5150/31,526 | 4500/27,849 | 3900/24,085 |
Radial distribution function (RDF) between alcohol molecules was analyzed using the g(r) tool in GROMACS. The tool calculated RDFs from one reference set of position of alcohol (reference) (set with -ref) to one or more sets of positions of alcohol (selection) (set with -sel). Similarly, the RDF g(r) was calculated from the oxygen of the alcohol (reference) to the hydrogen of the alcohol (selection) for TFE, HFIP, and CF3SF4-ethanol with a cut off range of 0.1 nm. The RDFs between the hydrogen of the alcohols (Reference) and the oxygen of water (Selection) were also calculated in the solvated system.
3. Results and Discussion
3.1. CF3SF4–Ethanol Preparation
CF3SF4–ethanol was prepared by the triethylborane-promoted addition of trans-CF3SF4Cl to vinyl acetate.26 (Scheme 1).
Scheme 1. Reagents and Conditions for the Preparation of trans-CF3SF4Cl.

(a) KF, sulfolane, 260 °C, 6 h, 80% yield. (b) KF, CH3CN, Br2, Cl2, −10 °C, 6 h, 34% yield. (c) CF3SF4Cl, Et3B, pentane, 0 °C, 30 min, 70% yield. (d) LiAlH4, diethyl ether, 0 °C, 30 min, 40% yield.
The reactive sulfanyl chloride was synthesized by fluoride displacement of the carbon-bound chlorine of perchloromethyl mercaptan (CCl3SCl) to form a 3:2 mixture of intermediates (CF3S)2 and CF3SCl. Oxidative chlorofluorination of the intermediates with a mixture of potassium fluoride and molecular chlorine formed desired sulfanyl chloride.26 Addition of the trans-CF3SF4Cl to vinyl acetate affords the addition product, 1-chloro-2-(tetrafluoro(trifluoromethyl)-λ6-sulfanyl)ethylacetate (70–80%).48 Reduction to 2-(tetrafluoro(trifluoromethyl)-λ6-sulfanyl)ethan-1-ol was affected with lithium excess aluminum hydride in 40% yield.28
3.2. Computed Geometries
In solution, two major conformers for TFE, HFIP, and CF3SF4-ethanol were identified. The antiperiplanar and synclinal conformers were defined by the C–C1–O–H torsion (ϕ) for TFE and CF3SF4-ethanol and the H1–C–O–H ϕ for HFIP (Figure 1). The geometry-optimized structures supplied C–C1–O–H ϕ values of −62.73 and −72.58° for the synclinal conformer and −179.7 and −76.22° for the antiperiplanar conformer of TFE and CF3SF4-ethanol. The measured C–C1–O–H ϕ in the microwave spectrum for TFE of 68.97°30 and the measured H1–C–O–H ϕ from the crystal structure of HFIP of 62.6°49 are consistent with the ϕ values determined in the DFT-geometry-optimized synclinal conformers of TFE and HFIP. The computed bonds, angles, and dihedrals for TFE and HFIP are comparable with previous parameterizations.50−55 In CF3SF4–ethanol, the square planar array of equatorial fluorines was found to be distorted toward the trifluoromethyl group in both conformers. The resulting average CCF3–S–F angles and C–S–F angles of 88.6 and 91.39° for the synclinal conformer and 88.8 and 91.70° for the antiperiplanar conformer are indicative of a pseudo-octahedral environment. This 1–3° distortion from the anticipated values of 90° in an octahedral environment is consistent with previous studies on fluorinated hypervalent sulfur compounds.26,56 In addition, the S–C–C1–O ϕ differs significantly between CF3SF4–ethanol conformers, with values of 79.09° in the synclinal conformer and 172.3° in the antiperiplanar conformer (see Figure 1). This arises from the rotation of the C–O bond between conformers;56 with regard to sulfur, the C–O bond is bent out of the plane in the synclinal conformation (Figure 1b,c) and is pseudo-planar in the antiperiplanar conformation (Figure 1d,e). Other bond lengths and angles were comparable in both conformers for all alcohols. Detailed structural parameters for both geometry-optimized rotamers of CF3SF4-ethanol, TFE, and HFIP are separately presented in Tables S1–S3.
Figure 1.
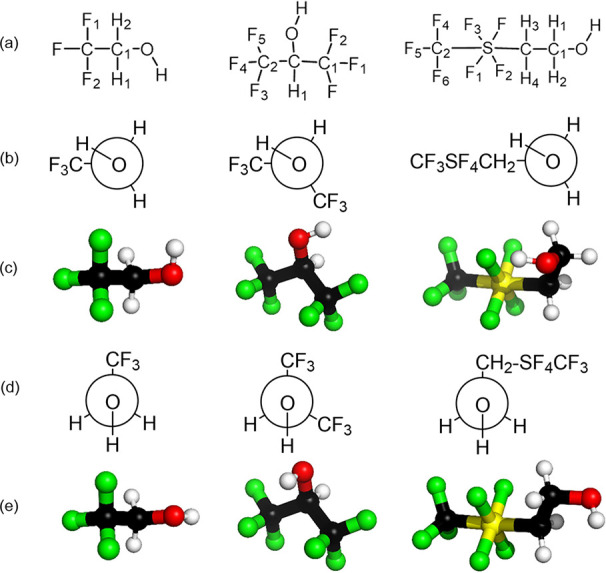
Structural representations for the synclinal and antiperiplanar conformers of TFE, HFIP, and CF3SF4-ethanol. Shown above are structural formulas (a), Newman projections for the synclinal conformer (b), the ball and stick model for the synclinal conformer (c), Newman projections for the antiperiplanar conformer (d), and the ball and stick model for the antiperiplanar conformer (e).
3.3. Computed Charges
Description of the nonbonded interactions at the van der Waals radii required determination of the Lennard-Jones parameters, σ and ϵ, for TFE and HFIP from the OPLS-AA nonbonded parameters database as implemented in GROMACS 2019.4.47,57−63 Values for the interatomic van der Waals distance, σ, and the depth of the potential well, ϵ, were comparable with previous models.38,50−54,64 In CF3SF4-ethanol, the Lennard-Jones parameters for all atoms except sulfur were also acquired from the OPLS-AA nonbonded parameters (Table 2). The van der Waals parameters for sulfur were set to zero since the central atom in an octahedral setting is not in direct contact with any atoms.40,65
Table 2. Summary of the Proposed CF3SF4–Ethanol OPLS Force Field Parameters.
| atom type | atom ID | chargea | chargeb | σc | ϵd |
|---|---|---|---|---|---|
| OPLS_124 | S | 0.3011 | 0.5276 | 0 | 0 |
| OPLS_135 | C | –0.2266 | –0.1852 | 3.5000 | 2.76144 × 10⁻¹ |
| OPLS_135 | C1 | 0.0437 | 0.1528 | 3.5000 | 2.76144 × 10⁻¹ |
| OPLS_154 | O | –0.5127 | –0.5297 | 3.1200 | 7.11280 × 10⁻¹ |
| OPLS_155 | H | 0.3700 | 0.3408 | 0 | 0 |
| OPLS_140 | H1 | 0.0920 | 0.0734 | 2.5000 | 1.25520 × 10⁻¹ |
| OPLS_140 | H2 | 0.0920 | 0.0734 | 2.5000 | 1.25520 × 10⁻¹ |
| OPLS_140 | H3 | 0.1774 | 0.1471 | 2.5000 | 1.25520 × 10⁻¹ |
| OPLS_140 | H4 | 0.1774 | 0.1471 | 2.5000 | 1.25520 × 10⁻¹ |
| OPLS_164 | F | –0.1569 | –0.2086 | 2.9400 | 2.55224 × 10⁻¹ |
| OPLS_164 | F1 | –0.1569 | –0.2086 | 2.9400 | 2.55224 × 10⁻¹ |
| OPLS_164 | F2 | –0.1569 | –0.2086 | 2.9400 | 2.55224 × 10⁻¹ |
| OPLS_135 | F3 | –0.1569 | –0.2086 | 2.9400 | 2.55224 × 10⁻¹ |
| OPLS_164 | C2 | 0.5329 | 0.4363 | 3.5000 | 2.76144 × 10⁻¹ |
| OPLS_164 | F4 | –0.1403 | –0.1164 | 2.9400 | 2.55224 × 10⁻¹ |
| OPLS_164 | F5 | –0.1403 | –0.1164 | 2.9400 | 2.55224 × 10⁻¹ |
| OPLS_164 | F6 | –0.1403 | –0.1164 | 2.9400 | 2.55224 × 10⁻¹ |
Charges for the synclinal conformer are presented in atomic units.
Charges for the antiperiplanar conformer are presented in atomic units.
σ are the interparticle van der Waals distance parameters in Å as implemented in the OPLS force field in GROMACS 2019.4.
ϵ represents the depth of the Leonard-Jones potential well in kJ/mol as implemented in the OPLS force field in GROMACS 2019.4.
Beyond the van der Waals radii, the long-range intermolecular forces are primarily determined by the total charge density of each molecule. To accurately describe these inherently quantum mechanical interactions using classical RESP charges, reproduction of the electrostatic potential at all points of space in this region is necessary. RESP atomic charges for both conformers are presented in Table S4 for TFE, Table S5 for HFIP, and Table 2 for CF3SF4–ethanol. The classical charges for TFE and HFIP agreed with previous parameterizations. The bonded parameters for TFE and HFIP can be found in Tables S6 and S7 and those for CF3SF4-ethanol are listed in Table 3.38,40,50−54,64
Table 3. Bonded Parameters Used for CF3SF4–Ethanol.
| bond
stretching parameters for CF3SF4–ethanol
used in simulation (eq 1) | ||
|---|---|---|
| bond | req (Å) | kr (kJ/mol nm2) |
| S–C | 1.87 | 212553.0 |
| S–F | 1.68 | 261172.0 |
| S–C2 | 1.98 | 212552.0 |
| C–C1 | 1.53 | 253630.0 |
| C–H3 | 1.09 | 281086.2 |
| C1–O | 1.41 | 262841.0 |
| C1–H1 | 1.10 | 281089.0 |
| O–H | 0.96 | 307928.1 |
| C2–F | 1.32 | 304437.2 |
| bond
angle parameters used in simulation (eq 2) | ||
|---|---|---|
| angle | θeq/° | kθ (kJ/mol rad2) |
| S–C–C1 | 115.09 | 666.93 |
| S–C–H3 | 104.16 | 464.51 |
| S–C2–F4 | 109.51 | 669.65 |
| C–S–F | 90.50 | 344.18 |
| C–S–C2 | 177.58 | 321.25 |
| C–C1–O | 110.26 | 418.40 |
| C–C1–H1 | 110.70 | 313.80 |
| C1–O–H | 108.50 | 460.25 |
| O1–C1–H1 | 109.50 | 292.88 |
| F–S–F1 | 90.30 | 370.70 |
| F1–S–F3 | 176.80 | 370.70 |
| F1–S–C2 | 90.60 | 344.18 |
| F4–C2–F5 | 109.60 | 644.33 |
| dihedral
parameters used in simulations (Ryckaert–Bellemans type) (eq 3) | ||||
|---|---|---|---|---|
| dihedral | C0 | C1 | C2 | C3 |
| S–C–C1–O | 0.65084 | 1.95253 | 0.0 | –2.60338 |
| F–S–C–C1 | 0.60436 | 1.81307 | 0.0 | –2.41742 |
| C–S–C2–F | 0.60436 | 1.81307 | 0.0 | –2.41742 |
| O–C1–C–H3 | 1.40600 | –1.04600 | 0.0 | 0.0 |
| H–O–C1–H2 | 0.995779 | 2.98736 | 0.0 | –3.98316 |
| C–C1–O–H | 1.71544 | 0.96232 | 2.67776 | 0.0 |
In CF3SF4–ethanol, the RESP atomic charges depicted increased electron density on electronegative atoms, partially positive aliphatic carbons, and hydrogens and a partially positive hypervalent sulfur. The node at sulfur in the HOMO induces the distribution of additional electron density on the apical substituents, localizing negative charge at carbon C and the CF3 group. The inductive effect of fluorine in CF3, however, siphons electronic density away from C2, resulting in a positive charge associated with C2 and negative charges associated with F4, F5, and F6 (Figure 1a and Table 2). These findings implicated that the classically derived RESP charges for CF3SF4–ethanol were chemically reasonable.
The energies for bond stretching and angle bending were represented by
| 1 |
| 2 |
where kr and kθ are force constants for bond stretching and angle bending, respectively; r and req are the distance and equilibrium distance between bonded atoms, and θ and θeq are the angle and the equilibrium angle between atom trios.
The energy for torsions is given by the Ryckaert–Bellemans-type expression:
| 3 |
where C0, C1, C2, and C3 are the torsion parameters for each dihedral angle and Ψ = ϕ – 180° is the dihedral angle.
An accurate model for the description of the electrostatic potential is not required to precisely describe the electron density within the van der Waals radii. Although atoms with an associated negative charge will be closely related with areas of electron density, charge fitting may result in minor discrepancies between the classical and quantum interpretation. A comparison of the ab initio density and classically derived RESP representation of the electronic structure of each fluorinated alcohol is appropriate.
3.4. Computed Dipole Moment
The DFT total molecular dipole moment, encompassing both nuclear and electronic contributions, was calculated using eq 4:
| 4 |
where μ is the total dipole moment, p(r′) is the charge density, r′ is the position, and τ represents all space. The quantum charge density may be represented as the classical RESP charges followed by integration over all space to yield following eq 5 describing the classical dipole moment.
| 5 |
where q is the ith point charge and r⃗ denotes the position vector for the ith charge from the molecular center of mass. The magnitude of the DFT moments and classical dipole moments for both conformers of TFE, HFIP, and CF3SF4–ethanol can be found in Table 4 and are pictorially depicted in Figure 2. Although the classical dipoles compared well with the DFT dipole moments, the magnitudes of those dipoles were marginally higher than the ab initio representation because of the charge fitting procedure. Molecular dipole moments for the antiperiplanar conformer of the fluorinated alcohols were greater than the synclinal conformer, except for the more symmetric HFIP. A larger dipole moment directly corresponds to greater charge separation. The order of polarity can be predicted for each conformer: HFIP > TFE > CF3SF4-ethanol for the synclinal conformer and TFE > CF3SF4-ethanol > HFIP for the antiperiplanar conformer. There is no clear correlation between the fluorine content and the resulting molecular dipole moment.
Table 4. Net Dipole Moments for CF3SF4–Ethanol.
|
synclinal |
antiperiplanar |
|||
|---|---|---|---|---|
| DFTa | classicala | DFTa | classicala | |
| TFE | 1.81 | 2.00 | 3.38 | 3.44 |
| HFIP | 2.43 | 2.60 | 0.51 | 0.52 |
| CF3SF4–ethanol | 1.53 | 1.61 | 2.34 | 2.47 |
Dipole moments in Debye (D).
Figure 2.

Total molecular dipole moments. Demonstrated above are the synclinal conformations of (a) TFE, (c) HFIP, and (e) CF3SF4–ethanol and the antiperiplanar conformation of (b) TFE, (d) HFIP, and (f) CF3SF4–ethanol. The ground-state electron density at the PBE0/pc-3 level of theory with a surface isovalue of 0.1 electron/Bohr3 is depicted in the images on the left. Classically derived RESP charges are portrayed in the images on the right with the color intensity of each atom proportional to the value of the charge. Red is associated with negative charge and blue is associated with positive charge. Blue arrows on the left depict the direction of the total dipole moment calculated from the sum of ground-state electron density and the nuclei, while the arrows on the right show the dipole moment calculated from the atomic charges. The length of each arrow is proportional to the magnitude of the total dipole moment and the length of all arrows uses the same proportionality constant. The arrow points in the direction of the greatest magnitude of positive charge.
3.5. Computed Energies
The electronic energy associated with each fluorinated alcohol was analyzed at the B3LYP/cc-pVQZ level of theory and presented in Table 5. In the gas phase, the lowest energies were found for CF3SF4–ethanol, followed sequentially by HFIP and TFE. Apart from HFIP, the synclinal conformers of each fluorinated alcohol were slightly more stable than the antiperiplanar conformers. The relative energy differences between conformers were similar: 1.8 kcal/mol for TFE and CF3SF4–ethanol and 1.5 kcal/mol for HFIP (Figure 3). At 298 K, the conformer energy differences are greater than 0.59 kcal/mol.
Table 5. Energies for Fluorinated Alcohols.
| synclinala | antiperiplanara | |
|---|---|---|
| TFE | –284256.9035 | –284254.9736 |
| HFIP | –495848.0265 | –495849.5815 |
| CF3SF4–ethanol | –809499.2280 | –809497.4775 |
Energies are presented in kcal/mol.
Figure 3.

Relative energies for the synclinal (left) and antiperiplanar rotamers of TFE (a), HFIP (b), and CF3SF4–ethanol (c). Arrows indicate the required energy for bond rotation to switch to that conformation.
Previous studies have suggested that the synclinal conformer may be stabilized by weak, nonbonded intramolecular interactions between the hydroxyl group and the halogen atom in nonpolar conditions.
Analyses of the relative stabilities (Figure 3) of the synclinal and antiperiplanar conformers of the fluorinated alcohols are necessarily complex. With TFE, the synclinal conformation has the carbon-CF3 dipole gauche to the O-H dipole, facilitating an intramolecular interaction between the proton of the OH group with a fluorine of the trifluoromethyl group in a highly stabilizing interaction. On assumption of the antiperiplanar conformation, when that favorable interaction is overcome, the enhanced acidity of the O-H proton results in a pronounced increase in the molecular dipole.51−54 A similar phenomenon is in play in the conformers of HFIP. However, the overall influence of the enhanced acidity in the antiperiplanar conformation is to diminish the molecular dipole.50,55 With CF3SF4–ethanol, both the magnitude and the direction of the molecular dipole vary with the change in the conformation. In the antiperiplanar conformation, ionization of the O–H bond results in a local interaction that is complementary to the dipole induced by the CF3SF4-group with the result that the molecular dipole is greater. The lower energy synclinal conformer has a diminished molecular dipole as the two contributing bond dipoles are in opposition. With an increase in solvent polarity, intermolecular solvent-alcohol interactions disrupt intramolecular dipolar interactions.
3.6. Pure Alcohol Simulation
Simulations were conducted on pure TFE, HFIP, and CF3SF4–ethanol at 298.15 K under NPT ensemble conditions using GROMACS(Table 6). Periodic boundary conditions, nonbonded interaction cutoffs, temperature coupling, and pressure coupling were all turned off. The density and heat of vaporization of these pure alcohols are reported in Table 7. Comparison of the experimental and previously reported experimental data50,66−69 was in good agreement, confirming the accuracy of our system parameters.
Table 6. Thermodynamic Properties of Pure TFE, HFIP, and CF3SF4–Ethanol at 298.15 K.
| pure alcohol | Nalcohol | densitycal g/cm3 | densityexp g/cm3 | ΔHvaporizationcal kJ/mol | ΔHvaporizationexp kJ/mol |
|---|---|---|---|---|---|
| TFE | 400 | 1.32 | 1.39 | 44.25 | 43.97 |
| HFIP | 316 | 1.58 | 1.60 | 42.68 | 41.58 |
| CF3SF4-ethanol | 220 | 2.58 | 2.18 | 44.73 | 42.91 |
3.7. Radial Distribution Functions
The molecular dynamic simulation results were analyzed by RDF calculations. RDFs provide the probability of finding an average number of particles around a reference particle at various distances. The RDFs for TFE, HFIP, and CF3SF4–ethanol (Figures S1–S3) were used to derive the average particle cluster size at various concentrations for each fluorinated alcohol (Figure 4). The fluorinated alcohols were homogenously solvated at the beginning of each simulation. At concentrations of 20–30%, those homogenously solvated TFE molecules slowly aggregated to form small clusters, resulting in an initial increase in the number and size of aggregates. With an increase in TFE concentration, the gradual fusion of the smaller clusters led to an expansion of the average cluster size while decreasing the total number of clusters. At 40% TFE concentration, complete water–alcohol liquid phase separation occurred computationally, leading to a single large aggregate. Similar behavior was exhibited by the more polar HFIP. Cluster formation began at 15–20% HFIP and resulted in phase separation at a HFIP concentration of 30%. These findings are consistent with what is known in the literature.2,50,51,55,70,71 With aqueous CF3SF4–ethanol, small clusters formed at an alcohol concentration of 4.5%, with a maximum cluster size at concentrations of 10%. The computational study indicated that CF3SF4-ethanol exhibited solution phase dynamics analogous to those of TFE and HFIP, but at much lower alcohol concentrations. Figure 5 depicts the cluster formation found in the alcohol–water systems.
Figure 4.

Average cluster size in simulated TFE, HFIP, and CF3SF4–ethanol aqueous mixtures is shown as a function of alcohol concentration.
Figure 5.

Cluster formation observed in (a) 40% (v/v) TFE–water system, (b) 30% (v/v) HFIP–water system, and c) 8% (v/v) CF3SF4–ethanol–water system.
3.8. Conformational Dependence on Concentration
Although the fluorinated alcohols molecules in each mixture initially were introduced in a synclinal conformation, after equilibration, both the synclinal and the antiperiplanar conformations were populated to varying degrees. The antiperiplanar conformers of TFE, HFIP, and CF3SF4-ethanol were predominant at the lower concentrations. When the alcohol concentration in the mixture was increased, there was a corresponding increase in the synclinal population. The majority of the antiperiplanar conformers at these higher concentrations were found at the water–alcohol boundary. Conversely, most synclinal conformers were located within the alcohol aggregations. These findings suggested that the concentrations of TFE, HFIP, and CF3SF4–ethanol modulated the interconversion and localization of the synclinal and antiperiplanar conformers. This concentration dependence may arise from shifting affinities. At lower alcohol concentrations, the polar water environment disrupted favorable interactions between the fluorines and the adjacent hydroxyl group, stabilizing the antiperiplanar conformation. Under these conditions, alcohol–water interactions were either preferred over alcohol–alcohol interactions. As the alcohol concentration was increased, however, transient alcohol–alcohol interactions became more common and promoted favorable intramolecular synclinal interactions.
Figure 6a shows the RDF g(r) for the interalcohol hydrogen bonding between the hydroxyl oxygen and the hydroxy proton of TFE (40% v/v), HFIP (30% v/v), and CF3SF4–ethanol (11% v/v). The g(r) between the oxygen and the proton of the hydroxyl of TFE (Figure 6a, red) and HFIP (Figure 6a, blue) have a first peak at 0.198 nm. These findings are consistent with the published findings.72 For CF3SF4–ethanol (Figure 6a, green), the first peak appears at 0.194 nm. The higher intensity for CF3SF4–ethanol is consistent with the strength of O–H–O hydrogen bonds with CF3SF4–ethanol interactions being significantly stronger than the corresponding HFIP and TFE interactions. The intensity of the first peak of the g(r) between the oxygen and proton of the HFIP hydroxyl group almost one-quarter those of CF3SF4–ethanol, and nearly half those found for TFE. The significantly greater intermolecular H-bonding between CF3SF4–ethanol in bulk is consistent with the aggregation of CF3SF4–ethanol at much lower concentrations (11%) than HFIP (30%) and TFE (40%).
Figure 6.

(a) RDF between Oalc–Halc between TFE (40%), HFIP(30%), and CF3SF4–ethanol(11%). (b) RDF between Halc–Owater between TFE–water (40%), HFIP–water (30%), and CF3SF4–ethanol–water(11%).
The RDFs, g(r), derived from the interaction of the oxygen of water and the proton of the fluorinated alcohols, were also determined. As fluorinated alcohols can be better hydrogen-bond donors than acceptors, the probable interaction between the hydrogen atom from OH of alcohols and oxygen atom of water(Halc–Owater) is important to determine to understand the hydrogen bonding between the fluorinated alcohols and water. The g(r) for TFE (Figure 6b, red line) shows the first peak at 0.19 nm, whereas for HFIP and CF3SF4–ethanol, the first peaks are at 0.196 and 0.192 nm, respectively. All the fluorinated alcohols H bond with water, but TFE interacts with water with a marginally greater intensity than either HFIP or CF3SF4–ethanol. It is apparent from these results that the hydrophobicity induced by the number of fluorine atoms in fluorinated alcohols impacts the interaction between the Halc and Owater. The intensity peak indicates that the hydrogen bonding between CF3SF4–ethanol and water is weaker in comparison with the same interactions of TFE or HFIP.
The greater propensity of CF3SF4–ethanol to undergo interalcohol H-bonding and weak H-bonding with water that was observed in MD simulations is consistent with experimental observations. This property of CF3SF4–ethanol plays a significant role in forming a heterogeneous environment.
3.9. Dynamic Light Scattering
Dynamic light scattering (DLS) experiments were used to validate the computed aggregation of TFE, HFIP, and CF3SF4–ethanol in water. The observed experimental hydrodynamic radii (Figure 7) correlate with the computed cluster size. The emergence of smaller clusters at lower TFE and HFIP concentrations was consistent with greater alcohol aggregation at higher concentrations. The plateau effect at the highest alcohol concentrations is indicative of a large-scale phase separation. Unfortunately, even at low concentrations of CF3SF4–ethanol, phase separation of the aqueous mixture prevented data collection. These findings are consistent with the solution phase behavior predicted by the molecular dynamics simulations as well as the DLS studies from other groups.10
Figure 7.

Average hydrodynamic radius for clusters observed in DLS experiments was determined for various alcohol concentrations.
4. Conclusions
A novel CF3SF4–containing alcohol was prepared that demonstrated the polar hydrophobicity of the CF3SF4-group. The properties of the new alcohol were compared with those of well-known fluorinated alcohols. Key structural, conformational, and quantum mechanical characteristics of CF3SF4–ethanol were compared with those of TFE and HFIP using ab initio DFT calculations. The B3LYP/cc-pVQZ-optimized geometry of CF3SF4–ethanol showed that the plane of the equatorial fluorines was distorted toward the CF3 group of the CF3SF4 group. The optimized room temperature, gas phase structures of CF3SF4-ethanol, and TFE favor the synclinal conformer while the antiperiplanar conformer of HFIP was preferred. The stability of the synclinal conformer may arise from weak, nonbonded interactions between the equatorial fluorines and the nearby hydroxyl group. Extrapolation of the classical and quantum mechanical dipole moments at the PBE0/pc-3 level suggests that CF3SF4-ethanol, in either the conformation, is less polar than either synclinal or antiperiplanar TFE or synclinal HFIP. Ab initio DFT geometry (B3LYP/cc-pVQZ) and charge (PBE0/pc-3) calculations were used to develop new OPLS-compatible parameters for CF3SF4–ethanol. The molecular mechanics model was validated by comparison of the published experimental and computational studies of TFE and HFIP. The more hydrophobic and lipophilic CF3SF4–ethanol displayed a greater affinity for aggregation at much lower concentrations than TFE and HFIP. Because of this hydrophobicity-driven aggregation, CF3SF4–ethanol may be an exemplary cosolvent for stabilizing the secondary and tertiary structure of proteins and peptides in aqueous solution. Although increased fluorine content results in a greater propensity for aggregation, a clear relationship between the fluorine content of an alcohol and aggregation affinity was not established. Despite the reduced polarity, the molecular, conformational, and solution phase behavior of CF3SF4-ethanol was analogous to that of TFE and HFIP but at lower alcohol concentrations.
Acknowledgments
We appreciate our respective laboratory members for their thoughtful discussions and suggestions, and their time in reading and reviewing this work. We graciously thank Dr. Mehmet V. Yigit for access to his instruments and resources to conduct the DLS experiments. We thank Christopher W. Smith for his careful guidance in collecting and analyzing DLS data.
Supporting Information Available
The Supporting Information is available free of charge at https://pubs.acs.org/doi/10.1021/acsomega.3c02019.
Computational results to include bond lengths, bond and dihedral angles, and computed charges for HFIP and TFE conformers; RDF plots for TFE-TFE, HFIP-HFIP, CF3SF4–ethanol–CF3SF4–ethanol interactions and for aqueous solutions of the TFE, HFIP, and CF3SF4–ethanol; and NMR and MS data for CF3SF4-ethanol (PDF)
Author Contributions
∥ S.B. and S.K. contributed equally to this study.
A.C. gratefully acknowledges the support of NSF-MCB 1651877, and J.T.W. gratefully acknowledges the support of NSF-CHE 1464936 and NSF-CHE 2154772.
The authors declare no competing financial interest.
Supplementary Material
References
- Buck M. Trifluoroethanol and colleagues: cosolvents come of age. Recent studies with peptides and proteins. Q. Rev. Biophys. 1998, 31, 297–355. 10.1017/S003358359800345X. [DOI] [PubMed] [Google Scholar]
- Colomer I.; Chamberlain A. E. R.; Haughey M. B.; Donohoe T. J. Hexafluoroisopropanol as a highly versatile solvent. Nat. Rev. Chem. 2017, 1, 0088 10.1038/s41570-017-0088. [DOI] [Google Scholar]
- Pradhan S.; Roy S.; Ghosh S.; Chatterjee I. Regiodivergent aromatic electrophilic substitution using nitrosoarenes in hexafluoroisopropanol: a gateway for diarylamines and p-iminoquinones synthesis. Adv. Synth. Catal. 2019, 361, 4294–4301. 10.1002/adsc.201900788. [DOI] [Google Scholar]
- Jana S.; Yang Z.; Li F.; Empel C.; Ho J. M.; Koenigs R. M. Photoinduced proton-transfer reactions for mild O-H functionalization of unreactive alcohols. Angew. Chem. Int. Edit. 2020, 59, 5562–5566. 10.1002/anie.201915161. [DOI] [PMC free article] [PubMed] [Google Scholar]
- Saya J. M.; Berabez R.; Broersen P.; Schuringa I.; Kruithof A.; Orru R. V. A.; Ruijter E. Hexafluoroisopropanol as the acid component in the Passerini reaction: one-pot access to β-amino alcohols. Org. Lett. 2018, 20, 3988–3991. 10.1021/acs.orglett.8b01561. [DOI] [PMC free article] [PubMed] [Google Scholar]
- To T.; Mizusaki H.; Murai A.; Matsugami M.; Takamuku T. Conformational change of L-phenylalanine in fluorinated alcohol-water mixed solvents studied by IR, NMR, and MD simulations. J. Mol. Liq. 2019, 290, 111192 10.1016/j.molliq.2019.111192. [DOI] [Google Scholar]
- Thomas P. D.; Dill K. A. Local and nonlocal interactions in globular proteins and mechanisms of alcohol denaturation. Protein Sci. 1993, 2, 2050–2065. 10.1002/pro.5560021206. [DOI] [PMC free article] [PubMed] [Google Scholar]
- Nelson J. W.; Kallenbach N. R. Stabilization of the ribonuclease S-peptide α-helix by trifluoroethanol. Proteins: Struct., Funct., Bioinf. 1986, 1, 211–217. 10.1002/prot.340010303. [DOI] [PubMed] [Google Scholar]
- Matsugami M.; Yamamoto R.; Kumai T.; Tanaka M.; Umecky T.; Takamuku T. Hydrogen bonding in ethanol-water and trifluoroethanol-water mixtures studied by NMR and molecular dynamics simulation. J. Mol. Liq. 2016, 217, 3–11. 10.1016/j.molliq.2015.06.050. [DOI] [Google Scholar]
- Gast K.; Siemer A.; Zirwer D.; Damaschun G. Fluoroalcohol-induced structural changes of proteins: some aspects of cosolvent-protein interactions. Eur. Biophys. J. 2001, 30, 273–283. 10.1007/s002490100148. [DOI] [PubMed] [Google Scholar]
- Gerig J. T. Examination of trifluoroethanol interactions with Trp-Cage in trifluoroethanol-water at 298 K through molecular dynamics simulations and intermolecular nuclear Overhauser effects. J. Phys. Chem. B 2019, 123, 3248–3258. 10.1021/acs.jpcb.9b01171. [DOI] [PubMed] [Google Scholar]
- Ramirez L.; Shekhtman A.; Pande J. Nuclear magnetic resonance-based structural characterization and backbone dynamics of recombinant bee venom melittin. Biochemistry 2018, 57, 2775–2785. 10.1021/acs.biochem.8b00156. [DOI] [PMC free article] [PubMed] [Google Scholar]
- Roy S.; Biswas B.; Ghosh N.; Singh P. C.; Mondal J. A. Hydrophobic hydration of fluoroalkyl (C–F) is distinctly different from that of Its hydrogenated counterpart (C–H), as observed by Raman difference with simultaneous curve fitting analysis. J. Phys. Chem. C 2019, 123, 27012–27019. 10.1021/acs.jpcc.9b07678. [DOI] [Google Scholar]
- Ridgway Z.; Zhang X.; Wong A. G.; Abedini A.; Schmidt A. M.; Raleigh D. P. Analysis of the role of the conserved disulfide in amyloid formation by human islet amyloid polypeptide in homogeneous and heterogeneous environments. Biochemistry 2018, 57, 3065–3074. 10.1021/acs.biochem.8b00017. [DOI] [PMC free article] [PubMed] [Google Scholar]
- Dyson H. J.; Wright P. E. Peptide conformation and protein folding. Curr. Opin. Struct. Biol. 1993, 3, 60–65. 10.1016/0959-440X(93)90203-W. [DOI] [Google Scholar]
- Luo Y.; Baldwin R. L. Trifluoroethanol stabilizes the pH 4 folding intermediate of sperm whale apomyoglobin. J. Mol. Biol. 1998, 279, 49–57. 10.1006/jmbi.1998.1774. [DOI] [PubMed] [Google Scholar]
- Rajan R.; Balaram P. A model for the interaction of trifluoroethanol with peptides and proteins. Int. J. Pept. Protein Res. 1996, 48, 328–336. 10.1111/j.1399-3011.1996.tb00849.x. [DOI] [PubMed] [Google Scholar]
- Biffinger J. C.; Kim H. W.; DiMagno S. G. The polar hydrophobicity of fluorinated compounds. ChemBioChem 2004, 5, 622–627. 10.1002/cbic.200300910. [DOI] [PubMed] [Google Scholar]
- Luo P.; Baldwin R. L. Mechanism of helix induction by trifluoroethanol: a framework for extrapolating the helix-forming properties of peptides from trifluoroethanol/water mixtures back to water. Biochemistry 1997, 36, 8413–8421. 10.1021/bi9707133. [DOI] [PubMed] [Google Scholar]
- Naeem A.; Khan K. A.; Khan R. H. Characterization of a partially folded intermediate of papain induced by fluorinated alcohols at low pH. Arch. Biochem. Biophys. 2004, 432, 79–87. 10.1016/j.abb.2004.08.019. [DOI] [PubMed] [Google Scholar]
- Sonnichsen F. D.; Van Eyk J. E.; Hodges R. S.; Sykes B. D. Effect of trifluoroethanol on protein secondary structure: an NMR and CD study using a synthetic actin peptide. Biochemistry 1992, 31, 8790–8798. 10.1021/bi00152a015. [DOI] [PubMed] [Google Scholar]
- Gast K.; Zirwer D.; Muller-Frohne M.; Damaschun G. Trifluoroethanol-induced conformational transitions of proteins: insights gained from the differences between alpha-lactalbumin and ribonuclease A. Protein Sci. 1999, 8, 625–634. 10.1110/ps.8.3.625. [DOI] [PMC free article] [PubMed] [Google Scholar]
- Hong D.-P.; Hoshino M.; Kuboi R.; Goto Y. Clustering of fluorine-substituted alcohols as a factor responsible for their marked effects on proteins and peptides. J. Am. Chem. Soc. 1999, 121, 8427–8433. 10.1021/ja990833t. [DOI] [Google Scholar]
- Othon C. M.; Kwon O. H.; Lin M. M.; Zewail A. H. Solvation in protein (un)folding of melittin tetramer-monomer transition. Proc. Natl. Acad. Sci. U. S. A. 2009, 106, 12593–12598. 10.1073/pnas.0905967106. [DOI] [PMC free article] [PubMed] [Google Scholar]
- Kirsch P.; Hahn A.. Liquid crystals based on hypervalent sulfur fluorides: The trans-(trifluoromethyl)tetrafluorosulfuranyl Group; WILEY-VCH Verlag: Weinheim, 2006; Vol. 2006, pp. 1125–1131. [Google Scholar]
- Ikeda A.; Zhong L.; Savoie P. R.; von Hahmann C. N.; Zheng W.; Welch J. T. Synthesis of trifluoromethyl tetrafluoro-λ6-sulfanyl-substituted alkenes, ketones, and acids: polar hydrophobic building blocks. Eur. J. Org. Chem. 2018, 2018, 772–780. 10.1002/ejoc.201701568. [DOI] [Google Scholar]
- Yan X. C.; Robertson M. J.; Tirado-Rives J.; Jorgensen W. L. Improved description of sulfur charge anisotropy in OPLS force fields: model development and parameterization. J. Phys. Chem. B 2017, 121, 6626–6636. 10.1021/acs.jpcb.7b04233. [DOI] [PMC free article] [PubMed] [Google Scholar]
- Joliton A.; Plancher J.-M.; Carreira E. M. Formation of [alpha]-SF5-enolate enables preparation of 3-SF5-quinolin-2-ones, 3-SF5-quinolines, and 3-SF5-pyridin-2-ones: evaluation of their physicochemical properties. Angew. Chem. Int. Ed. 2016, 55, 2113–2117. 10.1002/anie.201510380. [DOI] [PubMed] [Google Scholar]
- Shao Y.; Molnar L. F.; Jung Y.; Kussmann J.; Ochsenfeld C.; Brown S. T.; Gilbert A. T.; Slipchenko L. V.; Levchenko S. V.; O’Neill D. P.; DiStasio R. A. Jr.; Lochan R. C.; Wang T.; Beran G. J.; Besley N. A.; Herbert J. M.; Lin C. Y.; Van Voorhis T.; Chien S. H.; Sodt A.; Steele R. P.; Rassolov V. A.; Maslen P. E.; Korambath P. P.; Adamson R. D.; Austin B.; Baker J.; Byrd E. F.; Dachsel H.; Doerksen R. J.; Dreuw A.; Dunietz B. D.; Dutoi A. D.; Furlani T. R.; Gwaltney S. R.; Heyden A.; Hirata S.; Hsu C. P.; Kedziora G.; Khalliulin R. Z.; Klunzinger P.; Lee A. M.; Lee M. S.; Liang W.; Lotan I.; Nair N.; Peters B.; Proynov E. I.; Pieniazek P. A.; Rhee Y. M.; Ritchie J.; Rosta E.; Sherrill C. D.; Simmonett A. C.; Subotnik J. E.; Woodcock H. L. 3rd; Zhang W.; Bell A. T.; Chakraborty A. K.; Chipman D. M.; Keil F. J.; Warshel A.; Hehre W. J.; Schaefer H. F. 3rd; Kong J.; Krylov A. I.; Gill P. M.; Head-Gordon M. Advances in methods and algorithms in a modern quantum chemistry program package. Phys. Chem. Chem. Phys. 2006, 8, 3172–3191. 10.1039/B517914A. [DOI] [PubMed] [Google Scholar]
- Xu L. H.; Fraser G. T.; Lovas F. J.; Suenram R. D.; Gillies C. W.; Warner H. E.; Gillies J. Z. The microwave spectrum and OH internal rotation dynamics of gauche-2,2,2-trifluoroethanol. J. Chem. Phys. 1995, 103, 9541–9548. 10.1063/1.469968. [DOI] [Google Scholar]
- Lipinski G.; Mallik B.; Merz K. In situ crystallization technique – an approach to circumvent crystal structures with high Z′-crystallization behavior of (CF3)2C–OH. Z. Anorg. Allg. Chem. 2017, 643, 683–688. 10.1002/zaac.201700050. [DOI] [Google Scholar]
- Hait D.; Head-Gordon M. How accurate is density functional theory at predicting dipole moments? An assessment using a new database of 200 benchmark values. J. Chem. Theory Comput. 2018, 14, 1969–1981. 10.1021/acs.jctc.7b01252. [DOI] [PubMed] [Google Scholar]
- Woon D. E.; Dunning T. H. Gaussian basis sets for use in correlated molecular calculations. V. Core-valence basis sets for boron through neon. J. Chem. Phys. 1995, 103, 4572–4585. 10.1063/1.470645. [DOI] [Google Scholar]
- Smith D. G.; Burns L. A.; Patkowski K.; Sherrill C. D. Revised damping parameters for the D3 dispersion correction to density functional theory. J. Phys. Chem. Lett. 2016, 7, 2197–2203. 10.1021/acs.jpclett.6b00780. [DOI] [PubMed] [Google Scholar]
- Cornell W. D.; Cieplak P.; Bayly C. I.; Kollman P. A. Application of RESP charges to calculate conformational energies, hydrogen bond energies, and free energies of solvation. J. Am. Chem. Soc. 1993, 115, 9620–9631. 10.1021/ja00074a030. [DOI] [Google Scholar]
- Jensen F. Polarization consistent basis sets: principles. J. Chem. Phys. 2001, 115, 9113–9125. 10.1063/1.1413524. [DOI] [Google Scholar]
- Hait D.; Head-Gordon M. How accurate are static polarizability predictions from density functional theory? An assessment over 132 species at equilibrium geometry. Phys. Chem. Chem. Phys. 2018, 20, 19800–19810. 10.1039/C8CP03569E. [DOI] [PubMed] [Google Scholar]
- O’Hagan D. Understanding organofluorine chemistry. An introduction to the C-F bond. Chem. Soc. Rev. 2008, 37, 308–319. 10.1039/B711844A. [DOI] [PubMed] [Google Scholar]
- Dellis D.; Samios J. Molecular force field investigation for sulfur hexafluoride: A computer simulation study. Fluid Phase Equilib. 2010, 291, 81–89. 10.1016/j.fluid.2009.12.018. [DOI] [Google Scholar]
- Buissonneaud D. Y.; van Mourik T.; O’Hagan D. A DFT study on the origin of the fluorine gauche effect in substituted fluoroethanes. Tetrahedron 2010, 66, 2196–2202. 10.1016/j.tet.2010.01.049. [DOI] [Google Scholar]
- Denis P. A. Basis set requirements for sulfur compounds in density functional theory: a comparison between correlation consistent, polarized consistent, and pople-type basis sets. J. Chem. Theory Comput. 2005, 1, 900–907. 10.1021/ct0500702. [DOI] [PubMed] [Google Scholar]
- Dincer S.; Dincer M. S.; Duzkaya H.; Tezcan S. S.. Analysis of molecular orbital properties of SF6 with density functional theory (DFT). In 2019 3rd International Symposium on Multidisciplinary Studies and Innovative Technologies (ISMSIT); IEEE: 2019; pp. 1–4. [Google Scholar]
- Breneman C. M.; Wiberg K. B. Determining atom-centered monopoles from molecular electrostatic potentials. The need for high sampling density in formamide conformational analysis. J. Comput. Chem. 1990, 11, 361–373. 10.1002/jcc.540110311. [DOI] [Google Scholar]
- Van Der Spoel D.; Lindahl E.; Hess B.; Groenhof G.; Mark A. E.; Berendsen H. J. C. GROMACS: Fast, flexible, and free. J. Comput. Chem. 2005, 26, 1701–1718. 10.1002/jcc.20291. [DOI] [PubMed] [Google Scholar]
- Horn H. W.; Swope W. C.; Pitera J. W.; Madura J. D.; Dick T. J.; Hura G. L.; Head-Gordon T. Development of an improved four-site water model for biomolecular simulations: TIP4P-Ew. J. Chem. Phys. 2004, 120, 9665–9678. 10.1063/1.1683075. [DOI] [PubMed] [Google Scholar]
- Hockney R. W.; Goel S. P.; Eastwood J. W. Quiet high-resolution computer models of a plasma. J. Comput. Phys. 1974, 14, 148–158. 10.1016/0021-9991(74)90010-2. [DOI] [Google Scholar]
- Berendsen H. J. C.; Postma J. P. M.; van Gunsteren W. F.; DiNola A.; Haak J. R. Molecular dynamics with coupling to an external bath. J. Chem. Phys. 1984, 81, 3684–3690. 10.1063/1.448118. [DOI] [Google Scholar]
- Zhong L.The preparation and characterization of tetrafluoro-lambda∼6∼sulfanes; University at Albany. Department of Chemistry, 2017. [Google Scholar]
- Lipinski G.; Mallik B.; Merz K. In situ crystallization technique – an approach to circumvent crystal structures with high Z′-crystallization behavior of (CF3)2CH–OH. Z. Anorg. Allg. Chem. 2017, 643, 683–688. 10.1002/zaac.201700050. [DOI] [Google Scholar]
- Fioroni M.; Burger K.; Mark A. E.; Roccatano D. Model of 1,1,1,3,3,3-hexafluoro-propan-2-ol for molecular dynamics simulations. J. Phys. Chem. B 2001, 105, 10967–10975. 10.1021/jp012476q. [DOI] [Google Scholar]
- Fioroni M.; Burger K.; Mark A. E.; Roccatano D. A new 2,2,2-Trifluoroethanol model for molecular dynamics simulations. J. Phys. Chem. B 2000, 104, 12347–12354. 10.1021/jp002115v. [DOI] [Google Scholar]
- Gerig J. T. Toward a molecular dynamics force field for simulations of 40% trifluoroethanol-water. J. Phys. Chem. B 2014, 118, 1471–1480. 10.1021/jp408879g. [DOI] [PubMed] [Google Scholar]
- Chitra R.; Smith P. E. A comparison of the properties of 2,2,2-trifluoroethanol and 2,2,2-trifluoroethanol/water mixtures using different force fields. J. Chem. Phys. 2001, 115, 5521–5530. 10.1063/1.1396676. [DOI] [Google Scholar]
- Chitra R.; Smith P. E. Properties of 2,2,2-trifluoroethanol and water mixtures. J. Chem. Phys. 2001, 114, 426. 10.1063/1.1330577. [DOI] [Google Scholar]
- Yamaguchi T.; Imura S.; Kai T.; Yoshida K. Structure of hexafluoroisopropanol–water mixtures by molecular dynamics simulations. Z. Naturforsch. A 2013, 68, 145–151. 10.5560/zna.2012-0100. [DOI] [Google Scholar]
- Savoie P. R.; Welch J. M.; Higashiya S.; Welch J. T. Control of hydroxyl group conformation by the pentafluorosulfanyl group. J. Fluorine Chem. 2013, 148, 1–5. 10.1016/j.jfluchem.2013.01.013. [DOI] [Google Scholar]
- Abraham M. J.; Murtola T.; Schulz R.; Páll S.; Smith J. C.; Hess B.; Lindahl E. GROMACS: High performance molecular simulations through multi-level parallelism from laptops to supercomputers. SoftwareX 2015, 1-2, 19–25. 10.1016/j.softx.2015.06.001. [DOI] [Google Scholar]
- Berendsen H. J. C.; van der Spoel D.; van Drunen R. GROMACS: A message-passing parallel molecular dynamics implementation. Comput. Phys. Commun. 1995, 91, 43–56. 10.1016/0010-4655(95)00042-E. [DOI] [Google Scholar]
- Hess B.; Kutzner C.; van der Spoel D.; Lindahl E. GROMACS 4: Algorithms for highly efficient, load-balanced, and scalable molecular simulation. J. Chem. Theory Comput. 2008, 4, 435–447. 10.1021/ct700301q. [DOI] [PubMed] [Google Scholar]
- Lindahl E.; Hess B.; van der Spoel D. GROMACS 3.0: a package for molecular simulation and trajectory analysis. J. Mol. Modell. 2001, 7, 306–317. 10.1007/s008940100045. [DOI] [Google Scholar]
- Abraham M. J., van der Spoel D., Lindahl E.; Hess B., the GROMACS development team , GROMACS user manual version 2019.4, 2019.
- Páll S.; Abraham M. J.; Kutzner C.; Hess B.; Lindahl E. Tackling exascale software challenges in molecular dynamics simulations with GROMACS. In Solving Software Challenges for Exascale; Markidis S.; Laure E., Eds.; Springer International Publishing: Cham, 2015; pp. 3–27. [Google Scholar]
- Pronk S.; Pall S.; Schulz R.; Larsson P.; Bjelkmar P.; Apostolov R.; Shirts M. R.; Smith J. C.; Kasson P. M.; van der Spoel D.; Hess B.; Lindahl E. GROMACS 4.5: a high-throughput and highly parallel open source molecular simulation toolkit. Bioinformatics 2013, 29, 845–854. 10.1093/bioinformatics/btt055. [DOI] [PMC free article] [PubMed] [Google Scholar]
- Roccatano D.; Fioroni M.; Zacharias M.; Colombo G. Effect of hexafluoroisopropanol alcohol on the structure of melittin: A molecular dynamics simulation study. Protein Sci. 2005, 14, 2582–2589. 10.1110/ps.051426605. [DOI] [PMC free article] [PubMed] [Google Scholar]
- Olivet A.; Vega L. F. Optimized molecular force field for sulfur hexafluoride simulations. J. Chem. Phys. 2007, 126, 144502. 10.1063/1.2714953. [DOI] [PubMed] [Google Scholar]
- Morgado P.; Garcia A. R.; Ilharco L. M.; Marcos J.; Anastácio M.; Martins L. F. G.; Filipe E. J. M. Liquid mixtures involving hydrogenated and fluorinated alcohols: Thermodynamics, spectroscopy, and simulation. J. Phys. Chem. B 2016, 120, 10091–10105. 10.1021/acs.jpcb.6b04297. [DOI] [PubMed] [Google Scholar]
- Morgado P.; Lewis J. B.; Laginhas C. M. C.; Martins L. F. G.; McCabe C.; Blas F. J.; Filipe E. J. M. Systems involving hydrogenated and fluorinated chains: Volumetric properties of perfluoroalkanes and perfluoroalkylalkane surfactants. J. Phys. Chem. B 2011, 115, 15013–15023. 10.1021/jp207567y. [DOI] [PubMed] [Google Scholar]
- Pereira L. A. M.; Martins L. F. G.; Ascenso J. R.; Morgado P.; Ramalho J. P. P.; Filipe E. J. M. Diffusion coefficients of fluorinated surfactants in water: Experimental results and prediction by computer simulation. J. Chem. Eng. Data 2014, 59, 3151–3159. 10.1021/je500211w. [DOI] [Google Scholar]
- Silva G. M. C.; Morgado P.; Filipe E. J. M. Towards Aqueous – Fluorous – Hydrogenous emulsions: Phase equilibria and liquid structure of (water + 1H,1H-Perfluorobutanol + 1-butanol) ternary mixture. Fluid Phase Equilib. 2020, 522, 112737 10.1016/j.fluid.2020.112737. [DOI] [Google Scholar]
- Culik R. M.; Abaskharon R. M.; Pazos I. M.; Gai F. Experimental validation of the role of trifluoroethanol as a nanocrowder. J. Phys. Chem. B 2014, 118, 11455–11461. 10.1021/jp508056w. [DOI] [PMC free article] [PubMed] [Google Scholar]
- Yoshida K.; Yamaguchi T.; Adachi T.; Otomo T.; Matsuo D.; Takamuku T.; Nishi N. Structure and dynamics of hexafluoroisopropanol-water mixtures by x-ray diffraction, small-angle neutron scattering, NMR spectroscopy, and mass spectrometry. J. Chem. Phys. 2003, 119, 6132–6142. 10.1063/1.1602070. [DOI] [Google Scholar]
- Jalili S.; Akhavan M. Molecular dynamics simulation study of association in trifluoroethanol/water mixtures. J. Comput. Chem. 2010, 31, 286–294. 10.1002/jcc.21316. [DOI] [PubMed] [Google Scholar]
Associated Data
This section collects any data citations, data availability statements, or supplementary materials included in this article.