Abstract
Fewer than half of all patients with advanced-stage high-grade serous ovarian cancers (HGSCs) survive more than five years after diagnosis, but those who have an exceptionally long survival could provide insights into tumor biology and therapeutic approaches. We analyzed 60 patients with advanced-stage HGSC who survived more than 10 years after diagnosis using whole-genome sequencing, transcriptome and methylome profiling of their primary tumor samples, comparing this data to 66 short- or moderate-term survivors. Tumors of long-term survivors were more likely to have multiple alterations in genes associated with DNA repair and more frequent somatic variants resulting in an increased predicted neoantigen load. Patients clustered into survival groups based on genomic and immune cell signatures, including three subsets of patients with BRCA1 alterations with distinctly different outcomes. Specific combinations of germline and somatic gene alterations, tumor cell phenotypes and differential immune responses appear to contribute to long-term survival in HGSC.
Patients diagnosed with advanced HGSC have a 5-year survival rate of 41%1, and fewer than 15% survive more than 10 years2. Treatment usually consists of debulking surgery followed by adjuvant platinum and paclitaxel-based chemotherapy, or increasingly, neoadjuvant chemotherapy and interval debulking surgery3. Tumor stage and the extent of surgical removal are important clinical predictors of patient survival4,5.
HGSC has the highest frequency of germline alterations in homologous recombination DNA repair genes including BRCA1 and BRCA26–8 and is among the most chromosomally unstable of any cancer type9 with near ubiquitous somatic TP53 alterations 7,10. Prognostic biomarkers include gene expression-based molecular subtype11, CCNE1 gene amplification12, tumor immune cell infiltration13, and tumor DNA repair status14–16. Approximately 50% of HGSC have defects in homologous recombination-mediated DNA repair pathway genes 7,14 and homologous recombination defective cancers show increased sensitivity to platinum and inhibitors of poly(ADP-ribose) polymerase 1 (PARPi)17–20. Patients with germline BRCA1 or BRCA2 mutations have a longer 5-year survival than noncarriers6,21, although this survival advantage is lost in patients with BRCA1 mutations over time22.
A subgroup of patients with HGSC with apparently poor prognosis disease at presentation have a remarkable response to treatment and extraordinary long-term survival, including a small number with incomplete removal of macroscopic disease following surgery23. The extent to which known clinical, immune and molecular biomarkers can explain exceptionally long survival in HGSC is unclear. Here, we genomically characterize patients with HGSC who have survived more than 10 years after diagnosis.
Results
Long-term survivor cohort
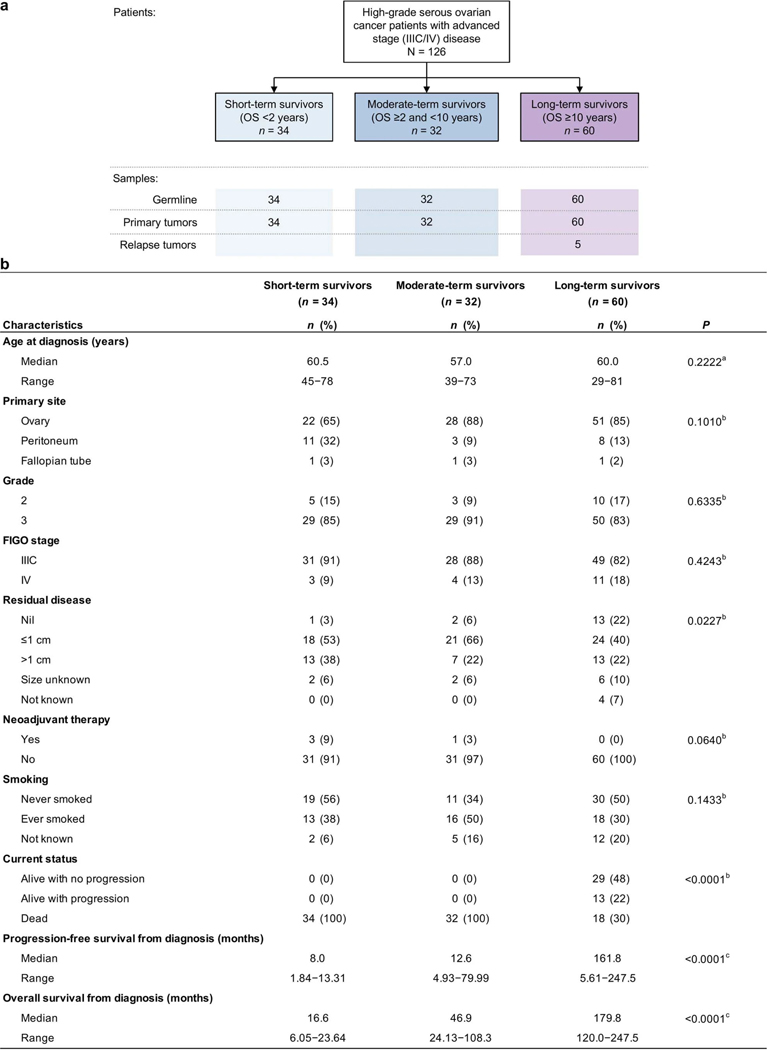
We accessed Australian and United States ovarian cancer biobanks with detailed, longitudinal clinical follow-up data collection to ascertain 60 long-term survivors (overall survival (OS) greater than 10 years from diagnosis). These were compared with patients from our earlier study14 that included 34 short-term survivors (OS < 2 years) and 32 moderate-term survivors (OS ≥ 2 and <10 years; Extended Data Fig. 1a). All patients had advanced-stage HGSC (stage IIIC–IV), and 70% (42/60) of long-term survivors were alive at last follow-up, including 72% (43/60) with macroscopic residual disease at the conclusion of primary surgery, which is a well-accepted adverse prognostic factor (Extended Data Fig. 1b and Supplementary Table 1). Among the long-term survivors with residual disease were a subset with no disease recurrence (51%, 22/43), indicating an exceptional response to primary treatment.
Pervasive DNA repair pathway alterations
We analyzed data from whole-genome sequencing (WGS; mean coverage 64× tumor and 40× normal DNA), RNA sequencing (RNA-seq; average 115 million paired reads) and methylome analysis on 126 cases: primary tumor samples from 60 long-term survivor patients, and leveraging existing sequencing data from our previous study14, 7 of the included long-term survivors, 34 short-term survivors and 32 moderate-term survivors (Supplementary Tables 2–4).
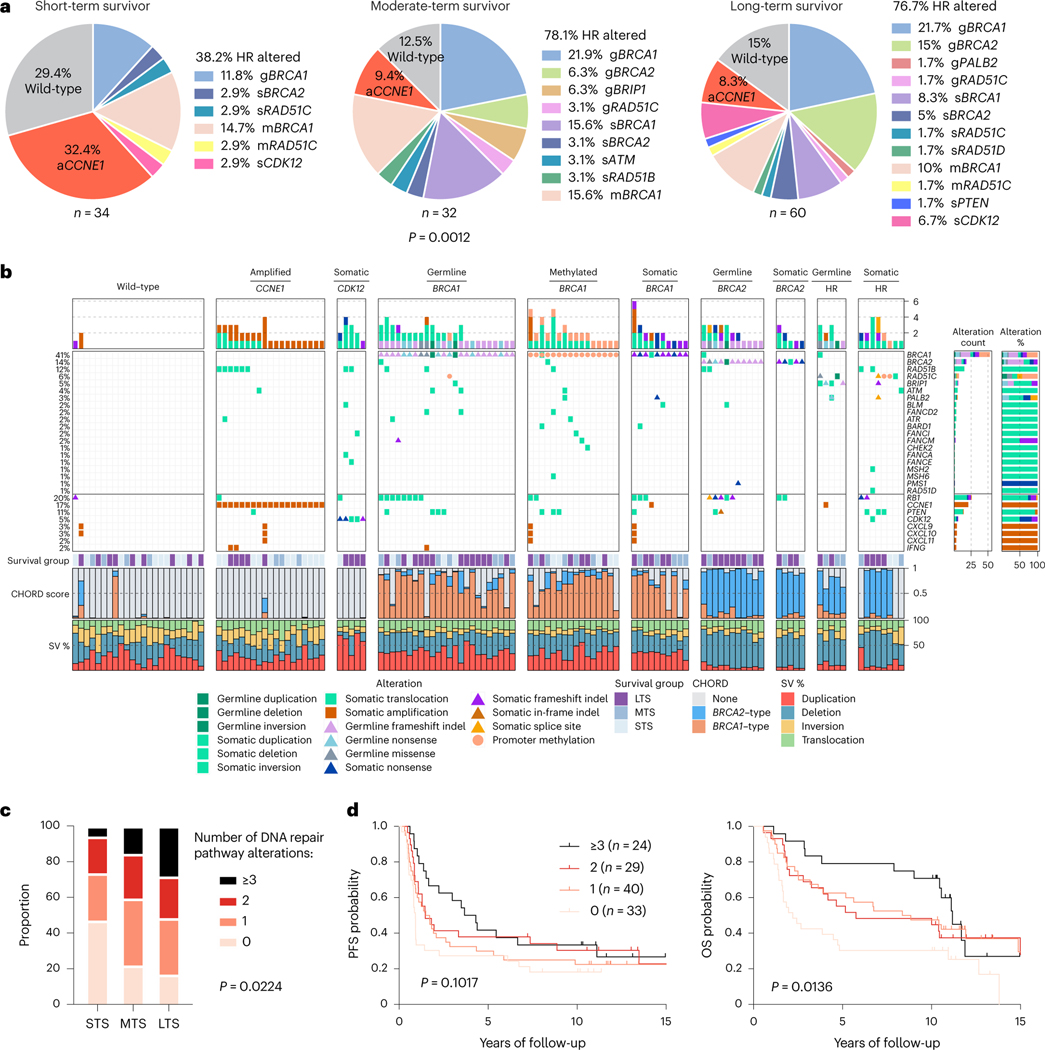
The combined germline and somatic homologous recombination alteration rate in long-term survivors (76.7%, 46/60) and moderate-term survivors (78.1%, 25/32) were similar but were higher compared with short-term survivors (38.2%, 13/34; P = 0.0012; Fig. 1a). These included germline mutations in BRCA1, BRCA2, BRIP1, PALB2 and RAD51C, somatic mutations in BRCA1, BRCA2, ATM, CDK12, PTEN, RAD51B, RAD51C and RAD51D (Supplementary Tables 5 and 6) and promoter methylation in BRCA1 and RAD51C. Consistent with previous findings24,25, CCNE1 gene amplification was largely mutually exclusive with BRCA1 (false discovery rate adjusted P value (Padj) = 0.0169; co-occurrence in 1/126 primary tumors, 0.79%) and BRCA2 alterations (Padj = 0.4554; co-occurrence in zero cases; Supplementary Note and Fig. 1b) and more prevalent in short-term survivors (Fig. 1a). The tumors of six long-term survivors showed CCNE1 amplification (Fig. 1b), an unexpected finding, as it is an established poor prognostic marker associated with primary platinum resistance12,14. Inference of immune cell subsets from transcript data26 revealed enrichment of activated CD4 memory T cells (Padj = 0.0050) and CD8 T cells (Padj = 0.0100) in CCNE1 amplified tumors in long-term survivors (n = 6) compared to short-term survivors (n = 11; Supplementary Note).
Fig. 1 |. HGSCs with multiple altered DNA repair pathway genes are associated with long-term survival.
a, Proportion of patients affected by homologous recombination (HR) DNA repair pathway gene alterations and CCNE1 gene amplification (aCCNE1) in each survival group. Homologous recombination alterations include pathogenic germline (g) or somatic (s) mutations, and BRCA1 or RAD51C promoter methylation (m) as indicated. One alteration is counted for patients with more than one change, prioritizing alterations by variant allele frequency and/or by evidence of genomic scarring associated with the candidate driver alteration. Differences in proportions of homologous recombination-altered, CCNE1 amplified and wild-type tumors between survival groups were assessed by chi-square. b, Bars at the top represent the number of alterations in each listed gene per patient. Pathogenic germline and somatic alterations in homologous recombination pathway genes are shown, as well as alterations in other DNA repair associated genes, immune genes and CCNE1. Each patient (column) is annotated with survival group (LTS, long-term survivor; MTS, moderate-term survivor; STS, short-term survivor). Bars indicate the level of homologous recombination deficiency (HRD) in each primary tumor sample, measured as probabilities of BRCA1-type (orange) HRD, BRCA2-type(blue) HRD, or homologous recombination proficiency (none, gray), as predicted by CHORD28. Bar plots at the bottom indicate the proportion of total detected structural variants (SV) classified as duplications, deletions, inversions or interchromosomal translocations. Samples are grouped by the primary gene alteration identified in each patient. Alteration count and proportion of alteration types per gene are shown as bar plots on the right. c, Proportion of patients with 0, 1, 2 or 3 or more DNA repair pathway alterations by survival group (LTS, long-term survivor; MTS, moderate-term survivor; STS, short-term survivor). Differences in proportions between groups were assessed by chi-square. d, Kaplan-Meier analysis of progression-free survival (PFS) (left) and OS in patients (right) with 0, 1, 2 or 3 or more DNA repair pathway alterations. P values calculated by Mantel-Cox log-rank test.
We found examples of multiple co-occurring mutations in genes involved in chromosome stability and DNA repair (Fig. 1b), most commonly due to structural variants that interrupted open reading frames. Long-term survivors had a higher proportion of tumors (28.3%, 17/60) with three or more altered DNA repair genes compared to moderate-(15.6%, 5/32) and short-term survivors (5.9%, 2/34; P = 0.0224; Fig. 1c). Patients whose tumors exhibited three or more DNA repair gene alterations had longer OS (median OS, 11.2 years) compared to those with two (median OS, 5.8 years), one (median OS 8.6 years) or no DNA repair gene alterations (median OS, 2.2 years; P = 0.0136; Fig. 1d). DNA repair pathway alterations were ranked from highest to lowest cancer cell fraction in each sample, finding that the majority were clonal in the first- (95.4%, 83/87) and second-ranked alterations (72.1%, 31/43), whereas in tumor samples with more than two DNA repair alterations, the third and fourth alterations were more likely to be subclonal (Supplementary Note).
Homologous recombination-deficient (HRD) tumors rely on error-prone DNA repair such as non-homologous end joining, which generates distinct mutational scars27. We confirmed the functional impact of homologous recombination alterations using CHORD28, integrating base substitution, small-scale insertion and deletion (indel), and structural rearrangement signatures to classify tumor genomes as BRCA1-type HRD, BRCA2-type HRD, or homologous recombination proficient (Fig. 1b). Among tumors considered to be HRD (CHORD score >0.5), for almost all (97.1%, 67/69), we identified the likely homologous recombination gene alteration driving the signature. Although generally either the BRCA1-type or BRCA2-type score was dominant, some tumors showed evidence of a mixture of both signatures, and in some cases, this finding could be attributed to two or more altered homologous recombination genes (Fig. 1b). MMAY00758 was a long-term survivor patient who experienced >11 years progression-free and had three homologous recombination pathway gene alterations, with a germline RAD51C missense mutation and somatic structural variants in BRCA1 and BRIP1 and evidence of both BRCA2-type (0.68) and BRCA1-type (0.27) HRD scores (Fig. 1b; for additional examples, see Supplementary Note). Mutations in CDK12 have been postulated to contribute to an HRD phenotype29; however, an assessment of mutational scarring indicated that these tumors were homologous recombination intact (Fig. 1b).
Recurrent mutations in long-term survivors
We confirmed our previous findings14 of ubiquitous TP53 mutations, infrequent nonsynonymous single-nucleotide variants (SNVs) and indels in other cancer-associated genes, and common somatically acquired structural variants and copy-number alterations (Supplementary Data 1–3, Supplementary Table 7 and Supplementary Note), including disruption of RB1, NF1, PTEN and RAD51B. MYH9, EZH2, ARID1B, TBL1XR1, ARID1A, YWHAE, CREBBP, RHOA, ATRX, AXIN1 and STAG1 were identified as also disrupted by gene breakage (Padj < 0.1; Supplementary Data 2). Despite frequent gene breakage in HGSC, only two recurrent in-frame gene fusions were identified (USP7-CARHSP1 and KIF1B-PGD), both at a frequency of 1.6% (2/126 primary tumors; Supplementary Note).
Somatic alterations were enriched in specific cancer-associated genes among the survival groups (Extended Data Fig. 2). Given the limited number of independent HGSC whole genomes, we used more readily available gene expression information7,30 to validate findings. Among tumor suppressor genes frequently inactivated in long-term survivors, low mRNA expression of ARID1B, RB1 and NF1 was associated with longer OS (Supplementary Table 8; P< 0.05). ARID1A and ARID1B, two cancer-associated genes involved in switch/sucrose non-fermentable (SWI/SNF) signaling, were both commonly disrupted by structural variants and had a combined somatic alteration rate of 30% (18/60) in long-term survivors, compared to 15.6% (5/32) and 17.6% (6/34) in moderate- and short-term survivors, respectively (Extended Data Fig. 2a). We also noted copy-number variants (CNVs) involving cytokines (for example, CXCL9 and IFNG) occurred at different frequencies in the survival cohorts (Supplementary Note).
Disease recurrence in long-term survivors
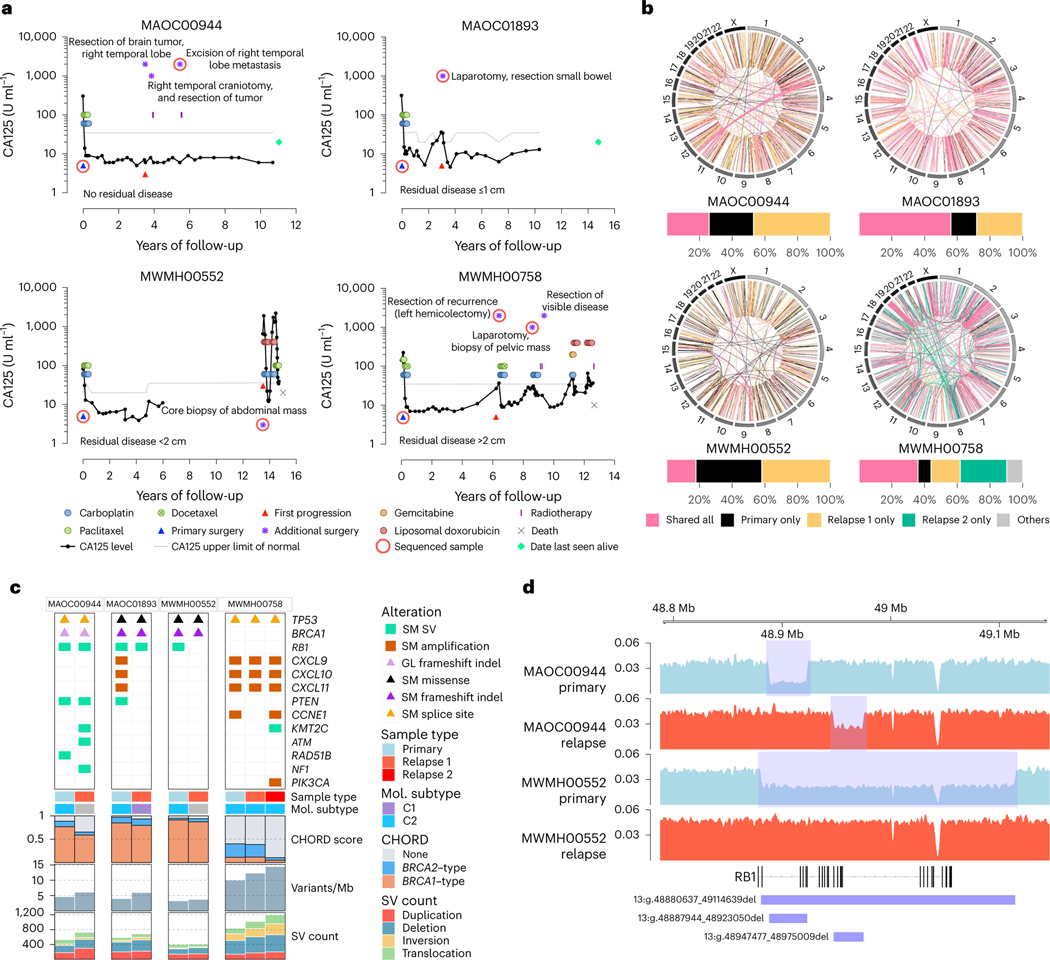
Tumor collection during recurrence and long-term survival are both uncommon events, but we obtained samples from four patients at relapse (Fig. 2a). Tumor-specific somatic alterations indicated that in all patients, samples were consistent with recurrence of their primary tumor rather than a new malignancy (Fig. 2b,c and Supplementary Note). BRCA1/2 reversion mutations commonly impart acquired treatment resistance31 but were not detected in the relapse samples of three patients with BRCA1 mutations.
Fig. 2 |. Genomic analysis of matched primary and recurrent HGSC in four long-term survivors.
a, Serum CA125 levels (solid black lines) on a log scale (y axis) of long-term survivor relapse cases (n = 4), measured at various intervals over time (x axis). The upper limit of normal for CA125 (dotted gray lines) can vary depending on the CA125 assay performed. Colored circles and rectangles represent different lines of treatment as indicated. All patients were diagnosed with stage IIIC HGSC at primary surgery (blue triangle). Also indicated is the time of first progression (red triangle), additional surgeries (purple asterisks), sequenced sample (red ring), death (gray cross) or date last seen alive (green diamond). b, Circos plots summarize the structural variants (lines) that are shared or unique between primary and relapse samples for each case as indicated. Bar plots below show the proportion of total shared and unique structural variants (SVs) in each patient. In the patient with two relapse samples, structural variants that were shared only by two tumor samples were classified as “others”. c, Somatic (SM) and germline (GL) alterations in primary and relapse tumor samples in genes of interest (rows). Each sample (column) is annotated with sample type (primary or relapse) and molecular (Mol.) subtype11 if RNA was available. Bars indicate the level of HRD in each tumor sample, measured as probabilities of BRCA1-type(orange) HRD, BRCA2-type(blue) HRD, or homologous recombination proficient (none, gray), as predicted by CHORD28. Bar plots at the bottom indicate somatic mutation burden in variants per megabase (Mb) and SV counts in each sample. d, BigWig tracks of DNA sequencing coverage (y axis) in two paired primary (shaded blue) and relapse (shaded red) tumor samples showing the locations (x axis) of deletions (blue rectangles) identified in RB1.
Patient MWMH00552 experienced 13.5 years of disease-free remission before progressing rapidly and dying 18 months later from progressive disease. Remarkably, although a large deletion over RB1 was found in the primary tumor, the emergent clone at recurrence lacked this deletion and the patient experienced relatively short duration responses to subsequent chemotherapy (Fig. 2c,d). Patient MAOC00944 had two different RB1 deletions in their primary and relapse sample (Fig. 2d) and was still alive at last follow-up (>10 years) despite brain metastases. These findings support our observations here and previously23 that co-occurrence of RB1 and BRCA1 mutations are associated with favorable response and outcome.
Patient MWMH00758 experienced cycles of recurrence and remission following an initial progression-free interval of >6 years. The primary tumor had amplification of chemokines (CXCL9, CXCL10 and CXCL11) and was classified as the C2/immunoreactive molecular subtype11 (Fig. 2c), and this classification was maintained at first and second relapse, consistent with the notion that the favorable immune subtype imparted a degree of tumor control over a lengthy period. Patient MAOC01893 had a solitary recurrence removed 3 years after diagnosis and then remained progression-free and was alive at last follow-up, 15 years after diagnosis (Fig. 2a). Of these four cases, the genomic alterations in the recurrent tumor in MAOC01893 was most similar to the primary tumor (Fig. 2b). However, although the primary tumor showed amplification of CXCL9, CXCL10 and CXCL11 and was C2/immunoreactive molecular subtype11, consistent with good outcome, the recurrence was C1/mesenchymal molecular subtype and lacked amplification of the chemokine genes (Fig. 2c). This finding suggests that the recurrence represented a treatment-resistant clone with features associated with worse outcome and the patient may have experienced a substantial clinical benefit from surgical removal.
Mutational signatures across survival groups
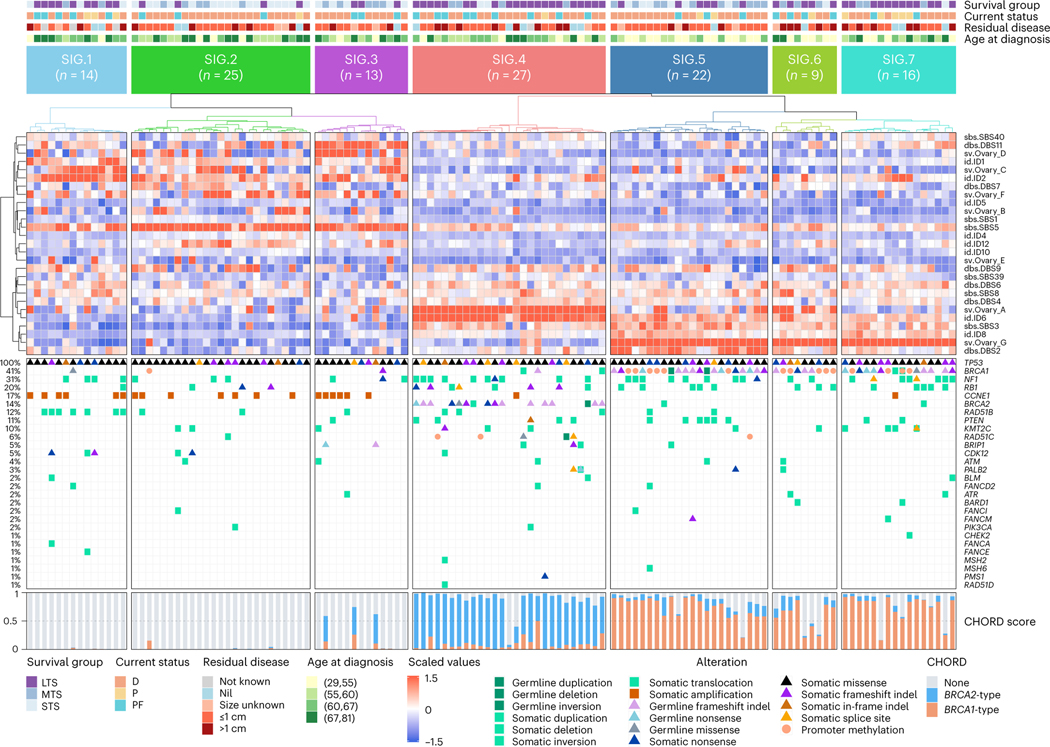
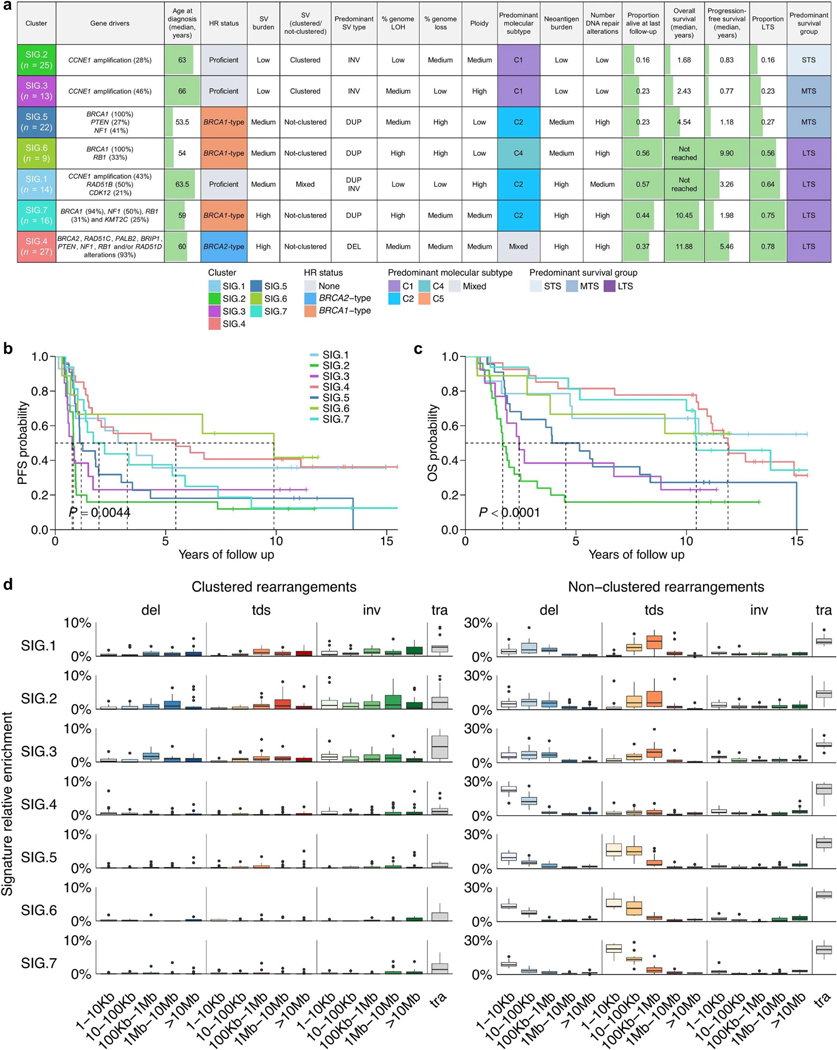
To identify genomic variation patterns that define survival subgroups, we evaluated the contribution of previously identified genome-wide mutational signatures, including base substitution signatures32, indel signatures32 and ovary-specific rearrangement signatures33 (that is, Ovary_A to Ovary_G; Methods and Supplementary Tables 9 and 10). Based on the most prominent 27 signatures (mean relative exposure >0.04 across all 126 samples), we performed unsupervised clustering of primary tumor samples. Samples segregated into seven clusters (SIG.1–7; Fig. 3) with distinct molecular phenotypes (summarized in Extended Data Fig. 3a), with SIG.1, SIG.4, SIG.6 and SIG.7 associated with longer survival (progression-free survival, P = 0.0044; OS, P < 0.0001; Extended Data Fig. 3b,c).
Fig. 3 |. Long-term survivor tumor genomes are characterized by distinct molecular phenotypes.
Heatmap of mutational signatures following consensus clustering based on proportions of mutational signature exposures in each primary tumor sample (n = 126). Patient (column) scaled z-scores are shown in the heatmap. Seven mutational signature clusters were identified (SIG.1-SIG.7), and each patient (column) is annotated with survival group (LTS, long-term survivor; MTS, moderate-term survivor; STS, short-term survivor), status at last follow-up (D, dead; P, progressed and alive; PF, progression-free and alive), residual disease and age at diagnosis (in years; quartiles). Bars represent the BRCA1-type (orange) and BRCA2-type (blue) HRD (CHORD28) scores of each tumor sample, and germline and somatic alterations affecting genes of interest are shown in the bottom panel.
Clusters SIG.1 (n = 14), SIG.2 (n = 25) and SIG.3 (n = 13) were characterized by the tandem duplication (>100 kb) phenotype34,35 associated with loss-of-function CDK12 mutations and CCNE1 amplification (Padj = 0.0004; Extended Data Figs. 3d and 4a). Tumors in these groups were homologous recombination proficient (Padj < 0.0001), and patients were older at diagnosis (Padj = 0.0020; Extended Data Figs. 4b and 5a). Despite having homologous recombination proficient tumors with a high frequency of CCNE1 amplification (43%, 6/14), features typically associated with poor outcomes, cluster SIG.1 mostly comprised of long-term survivors (64%, 9/14; median OS not reached). Tumors in cluster SIG.1 had a high number of duplications (Padj < 0.0001) and inversions (Padj = 0.0029), a higher mutation burden and neoantigen count (Padj < 0.0001), somatic alterations in RAD51B (50%, 7/14; Padj = 0.0276) and enrichment of indel signatures 1 and 2 (Padj < 0.0001; Extended Data Fig. 5b), both thought to be caused by slippage during DNA replication and associated with defective DNA mismatch repair32. By contrast, SIG.2 and SIG.3 tumors had fewer mutations and structural variants, the lowest predicted neoantigen burdens and a lack of DNA repair gene alterations and were associated with the shortest survival (median OS, 1.7 and 2.4 years, respectively). SIG.3 tumors were also enriched for rearrangement signature Ovary_D (unknown driver; Padj = 0.0002) and double-base substitution (DBS) signature 11 (unknown etiology; Padj < 0.0001), whereas SIG.2 tumors were enriched for single-base substitution (SBS) signature 5 (unknown etiology; Padj < 0.0001), indel signature 4 (unknown etiology; Padj < 0.0001) and DBS signature 7 (Padj < 0.0001), thought to be associated with defective DNA mismatch repair.
Cluster SIG.4 tumors (n = 27) were highly enriched for BRCA2-type nonclustered 1- to 100-kb deletions (consistent with rearrangement signature Ovary_A; Padj < 0.0001), DBS signature 4 (unknown etiology; Padj < 0.0001), indel signature 6 (associated with HRD; Padj < 0.0001) and alterations in BRCA2 (Padj < 0.0001), as well as multiple other DNA repair pathway genes (Padj < 0.0001; Fig. 3 and Extended Data Figs. 3–5). Cluster SIG.4 genomes had the highest median mutation burden and neoantigen count and almost all (25/27, 93%) had a high BRCA2-type CH0RD score (Padj < 0.0001). Consistent with the previously identified BRCA2/deletion HGSC subgroup36, cluster SIG.4 had the highest survival rate (21/27 (78%) long-term survivors), with a median OS of 11.9 years.
BRCA1-altered tumor subgroups with differential outcomes
Clusters SIG.5 (n = 22), SIG.6 (n = 9) and SIG.7 (n = 16) were characterized by BRCA1 alterations (100%, 100% and 94%, respectively, Padj <0.0001), but the three groups had distinctly different survival outcomes (Extended Data Figs. 3 and 4). All showed nonclustered 1- to 100-kb tandem duplications, enrichment of rearrangement signature Ovary_G, and BRCA1-type HRD scores (Padj < 0.0001; Fig. 3 and Extended Data Figs. 3–5), consistent with their BRCA1 mutational status. Of the BRCA1 groups, cluster SIG.7 had the highest proportion of long-term survivors (75%, 12/16; median OS, 10.4 years), followed by SIG.6 (56%, 5/9; median OS, not reached) and SIG.5 (27%, 6/22; median OS, 4.5 years).
In a subset analysis considering only the BRCA1-altered clusters, the key mutational signatures driving these clusters were DBS signature 2 in SIG.5 (Padj = 0.0050), rearrangement signature Ovary_A in SIG.6 (Padj = 0.0092) and SBS signature 40 (unknown etiology) in SIG.7 (Padj = 0.0092; Supplementary Note). DBS signature 2 is proposed to be associated with tobacco smoking and/or exposure to acetaldehyde, which is a constituent of cigarette smoke but also a metabolite of alcohol32. Self-reported smoking history was available for 84.9% (107/126) of cases, and across the seven mutational signature clusters, SIG.5 had the highest frequency of smokers (66.7%, 12/18; Padj = 0.5092; Extended Data Fig. 4b). We compared the relative contribution of all mutational signatures between never-smokers (n = 60) and ever smokers (n = 47), and the most predominant mutational signature in smokers was DBS signature 2 (Padj = 0.5490; Supplementary Note). Of all the mutational signature clusters, SIG.5 had the youngest age of diagnosis (Padj = 0.0020; Extended Data Fig. 5a), consistent with these patients being at a higher risk of developing cancer due to combined BRCA1 deficiency and a history of smoking.
The prominence of rearrangement signature Ovary_A in cluster SIG.6 indicates there is a mixture of BRCA1 and BRCA2 deficiency in this subgroup; this was corroborated by a higher prevalence of BRCA2-type nonclustered 1- to 100-kb deletions in SIG.6 relative to SIG.5 and SIG.7 (Extended Data Fig. 3d) and the detection of both BRCA1-type and BRCA2-type HRD scores in SIG.6 tumors (Fig. 3). Tumors with combined BRCA1 and BRCA2 loss of function may have greater sensitivity to platinum chemotherapy. Indeed, despite cluster SIG.6 having a high proportion (56%, 5/9) of suboptimal residual disease (>1 cm) following surgical cytoreduction (Padj = 0.6131), this BRCA1 subgroup had the longest progression-free survival (median 9.9 years, P = 0.0044), indicating SIG.6 tumors were particularly platinum chemosensitive (Extended Data Figs. 3 and 4).
Patterns of DNA methylation
To determine whether tumor DNA methylation profiles were associated with exceptional outcomes, we performed consensus clustering of the 1% most variable CpG sites (number of probes = 3,645) across all 126 primary tumors. Compared to mutational signatures, differential DNA methylation patterns were less discriminatory, with the five distinct methylation clusters (MET.1, n = 46; MET.2, n = 14; MET.3, n = 17; MET.4, n = 19; MET.5, n = 30) showing moderate to weak associations with progression-free (P = 0.1949) and OS (P = 0.0587; Extended Data Fig. 6). The strongest genomic difference between methylation clusters was BRCA1 alteration status, with enrichment of BRCA1-altered tumors (72%, 33/46) in cluster MET.1 (Padj < 0.0001; Supplementary Note). Patients in MET.1 had a relatively poor survival (median OS, 5.7 years) compared to MET.2 (median OS, 11.9 years), the most closely related cluster in the dendrogram. The most striking differences between the two groups were the proportion of smokers (MET.1 64% (23/36) vs. MET.2 8.3% (1/12), Padj = 0.0225) and younger age of MET.1 patients (Padj = 0.0059). Therefore, the MET.1 cluster also identifies a subset of BRCA1-altered tumors associated with smoking and a relatively poor survival, largely overlapping with cluster SIG.5 (Supplementary Note).
Tumor mutation burden and immune transcriptional patterns
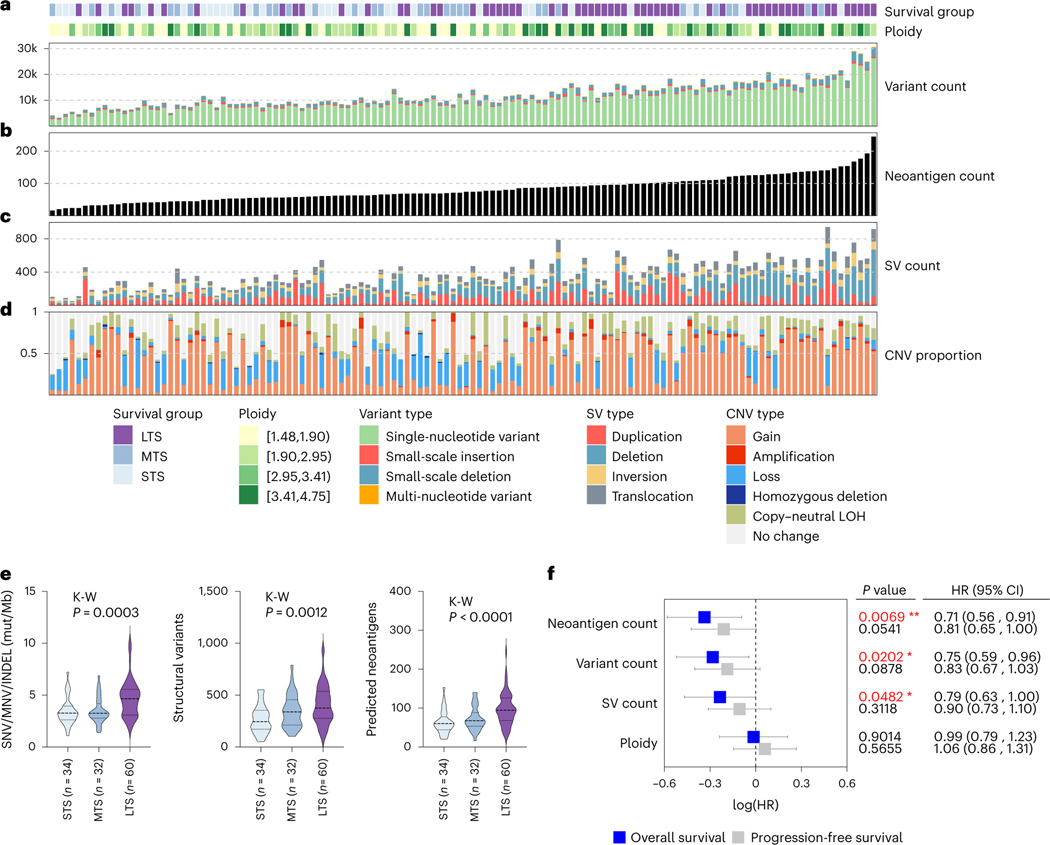
Ovarian cancer was among the first documented examples of an association between lymphocytic infiltration and survival37, an observation confirmed in large patient cohorts13,38 and individual case reports39. We therefore characterized mutational burden as a driver of immune response within the survival groups (Fig. 4 and Supplementary Note). Consistent with a previous report40, long-term survivor tumor samples had a higher tumor mutation burden (median of 4.66 mutations/Mb) compared to short-term (3.27 mutations/Mb) and moderate-term survivors (3.25 mutations/Mb, P = 0.0003), and concordantly, long-term survivors had the highest number of predicted neoantigens (P < 0.0001; Fig. 4e). Both moderate- and long-term survivor tumors had more structural variants compared to short-term survivors (P = 0.0012; Fig. 4e). Tumor neoantigen count was more strongly associated with better survival (hazard ratio (HR) = 0.71, 95% confidence interval (CI) = 0.56–0.91, P = 0.0069) compared with the number of mutations (HR: 0.75, 95% CI: 0.59–0.96, P = 0.0202) and structural variants (HR: 0.79, 95% CI: 0.63–1.0, P = 0.0482; Fig. 4f).
Fig. 4 |. Elevated somatic mutation burden in long-term survivors.
a, Bars indicate the total variant count of each primary tumor sample (n = 126), including SNVs, small-scale insertions and deletions (INDELs) and multinucleotide variants (MNVs). b, Tumor samples are ordered left to right from fewest to largest number of neoantigens (black bars). c, Bars indicate total number of large-scale structural variants (SVs) in primary tumors, including duplications, deletions, inversions and interchromosomal translocations. d, Bars indicate the proportion of each tumor genome affected by CNVs, including regions of gain, amplification, loss, homozygous deletion and copy-neutral loss of heterozygosity (LOH). e, Violin plots represent the tumor mutation burden, structural variant count and predicted neoantigen counts of tumor genomes in each survival group. Dashed lines represent the median and dotted lines represent the lower and upper quartiles. Kruskal-Wallis (K-W) test P values are reported. STS, short-term survivor; MTS, moderate-term survivor; LTS, long-term survivor; mut/Mb, mutations per megabase. f, Forest plot indicates the HR (squares) and 95% Cl (whiskers) for progression-free and OS (n = 126 patients) calculated using a univariate Cox proportional hazard regression model based on genomic features as indicated; P values < 0.05 are colored red (*P < 0.05, **P < 0.01) and were not adjusted for multiple comparisons.
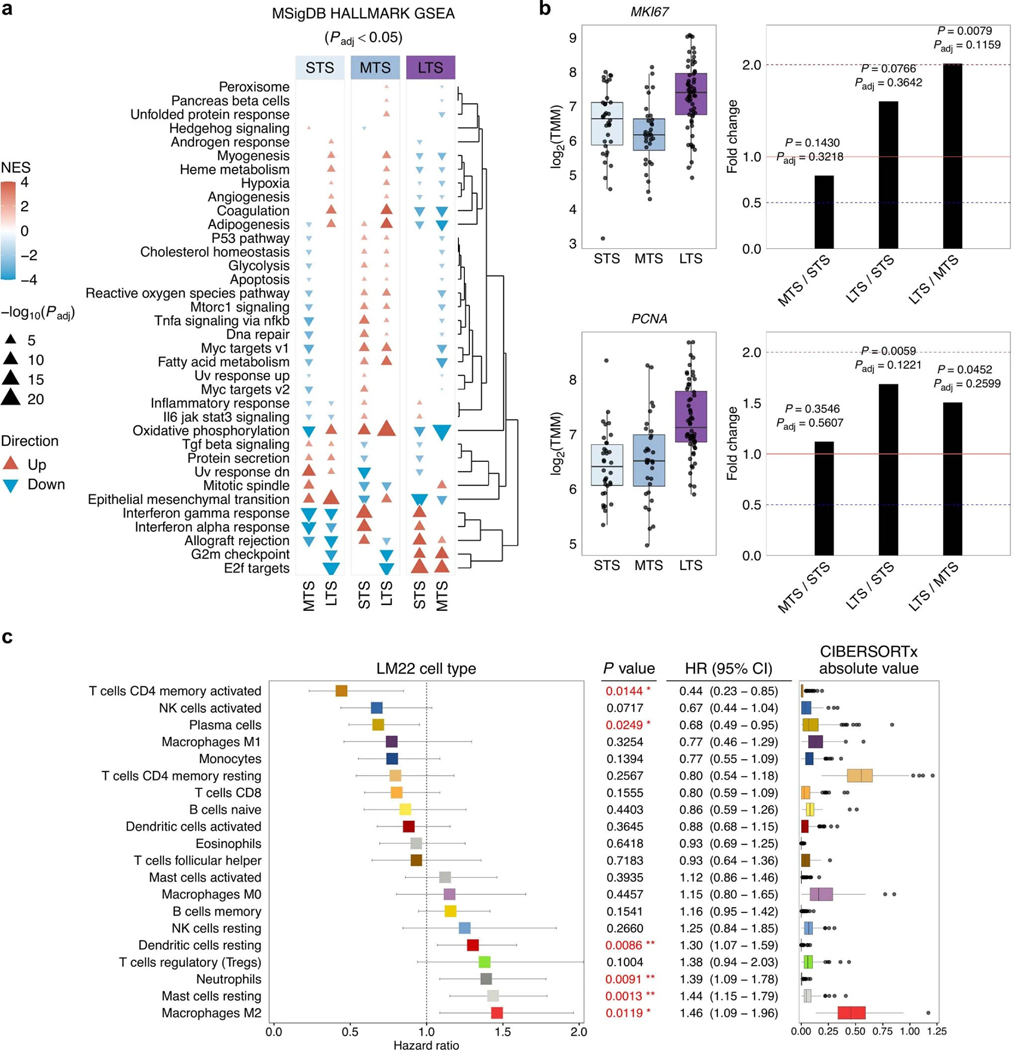
We compared primary tumor gene expression profiles between survival groups using fast gene set enrichment analysis (FGSEA41) and observed significantly perturbed MSigDB hallmark gene sets42 (FGSEA Padj < 0.05; Extended Data Fig. 7a). The top five enriched gene sets between long-term survivors and short-term survivors were E2F targets (overexpressed or ‘up’ in long-versus short-term survivors), epithelial mesenchymal transition (down), allograft rejection (up), interferon gamma response (up) and G2M checkpoint (up; FGSEA Padj < 0.0001; Extended Data Fig. 7a; Supplementary Data 4). Tumors in long-term survivors had an increased expression of cell proliferation-related genes PCNA and MKI67 (Extended Data Fig. 7b), indicating that tumor cells in long-term survivors may have exceptionally deregulated cell cycle progression and increased proliferation. This is consistent with our previous finding that Ki-67-positivity of tumor cell nuclei, a marker of proliferation, is significantly higher in patients with prolonged progression-free survival and OS23.
We used an established deconvolution method26 to estimate the abundance of immune cell types from bulk RNA-seq data (Supplementary Tables 11, 12). CIBERSORTx absolute scores correlated with CD8+ T cell density, both in the tumor epithelium (P < 0.0001) and the stromal compartment (P = 0.0002), which were previously quantified by immunohistochemistry23 in a subset of primary tumors (n = 54; Supplementary Note). Scores of the most prominent cell populations (detected in >5% of samples) were treated as a continuous variable and correlated with survival. Activated memory CD4 T cells (HR: 0.44, 95% Cl: 0.23–0.85, P = 0.0144) and plasma cells (HR: 0.68, 95% Cl: 0.49–0.95, P = 0.0249) were associated with improved OS, whereas resting mast cells (HR: 1.44, 95% Cl: 1.15–1.78, P = 0.0013) and M2 macrophages (HR: 1.46, 95% Cl: 1.09–1.96, P = 0.0119) were associated with an increased risk of death (Extended Data Fig. 7c).
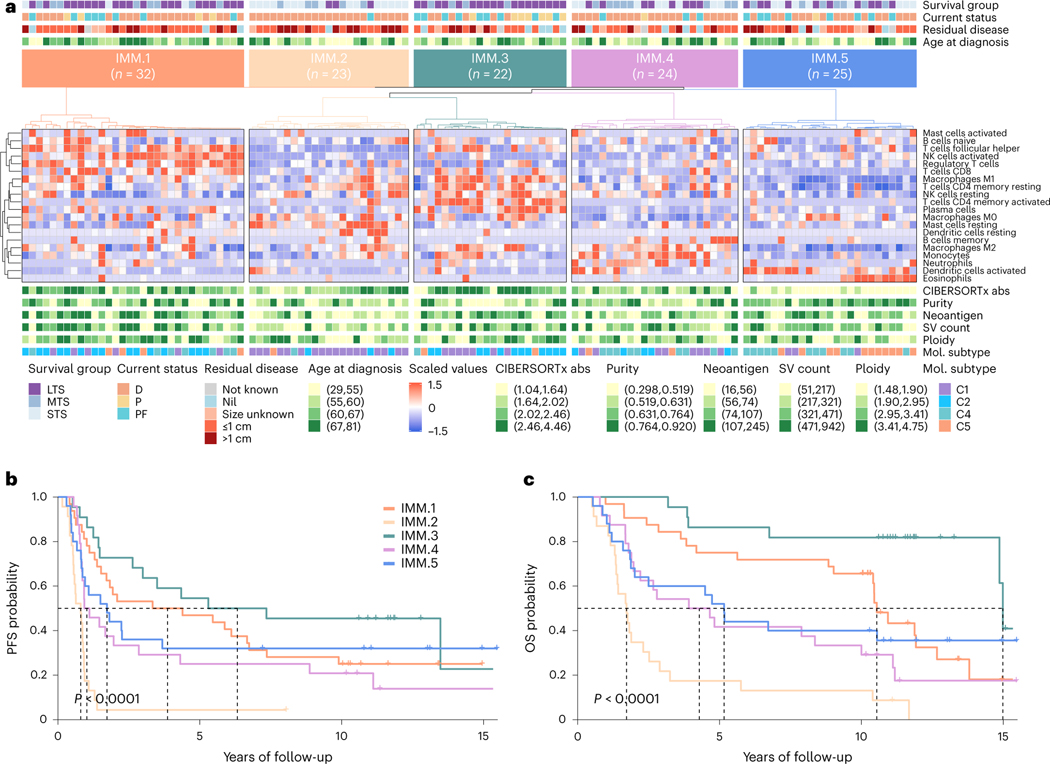
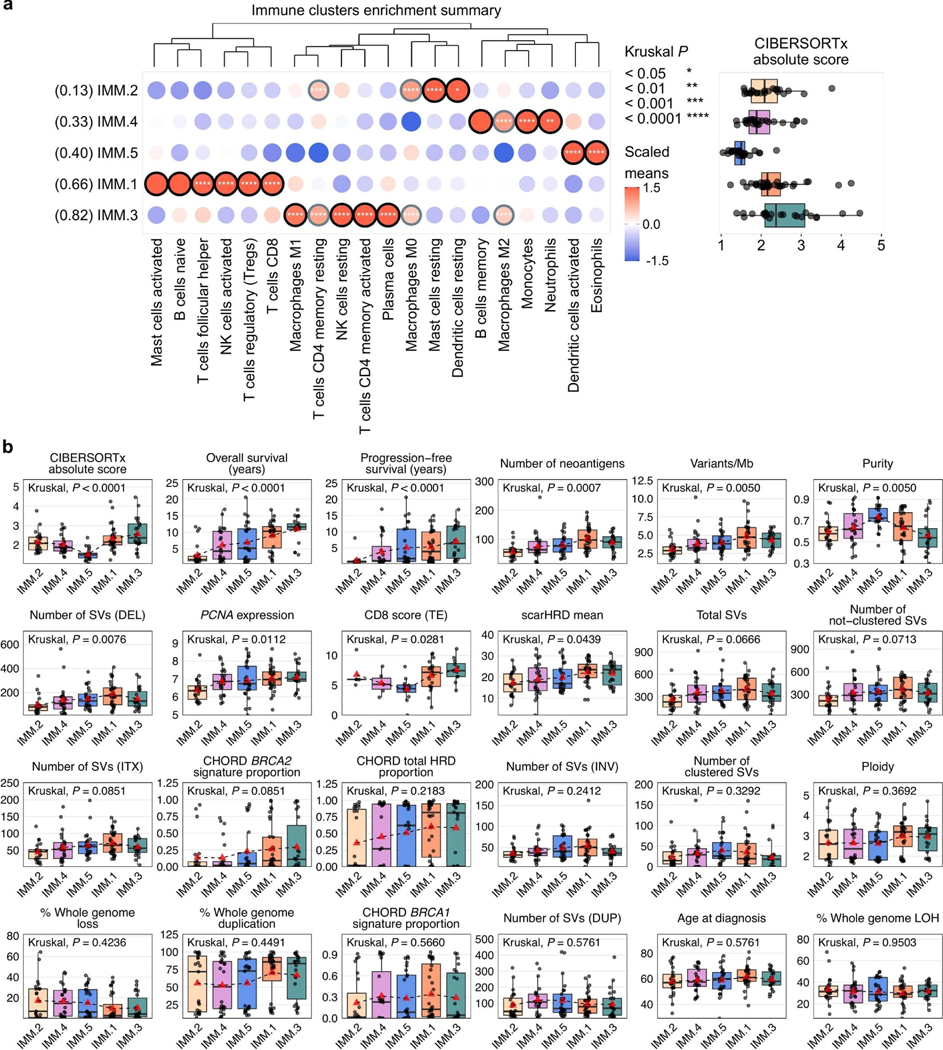
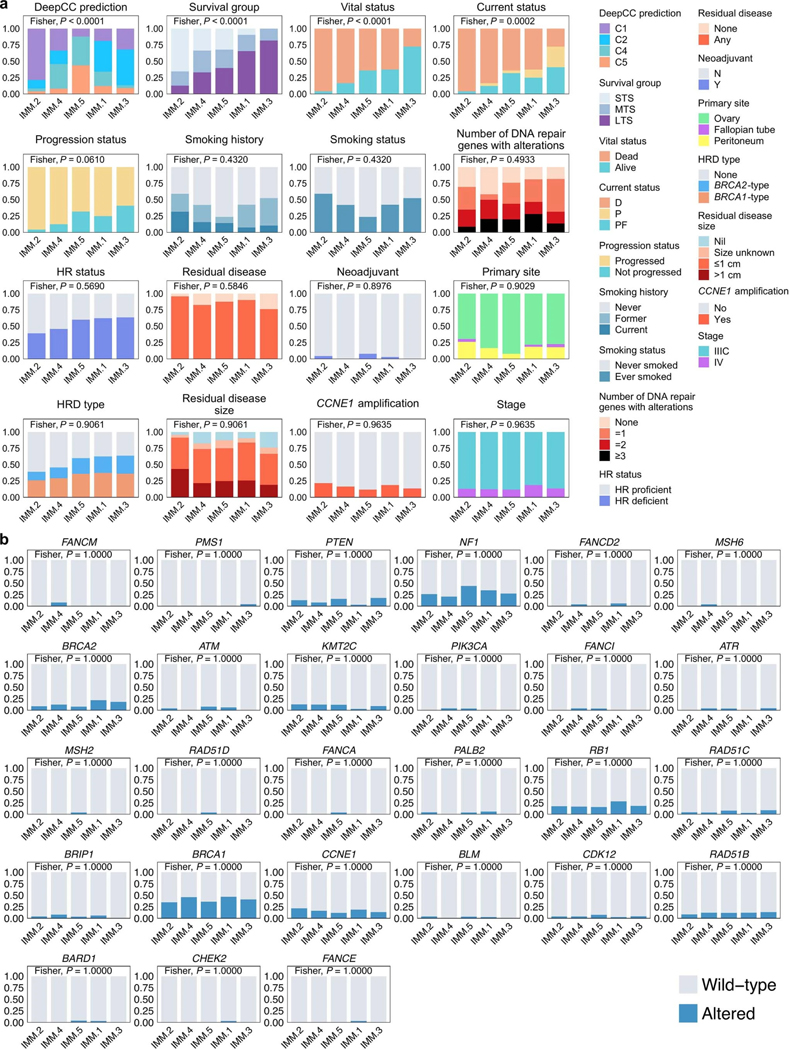
Unsupervised clustering of primary tumor samples using the computationally estimated immune cell densities identified five patient groups associated with differential survival outcomes (1MM.1–5; Fig. 5). Patients in cluster 1MM.3 (n = 22) had the longest progression-free survival (median 6.3 years, P < 0.0001) and OS (median 15.0 years, P < 0.0001), with tumor samples enriched for plasma cells, activated memory CD4 T cells, M1 macrophages and resting natural killer (NK) cells (Padj < 0.0001; Extended Data Fig. 8a). Cluster 1MM.1 patients (n = 32) had the second longest OS (median 10.5 years) and were particularly enriched for CD8 T cells, activated NK cells, regulatory T cells and follicular helper T cells (Padj < 0.0001). Tumor genomes in clusters 1MM.1 and 1MM.3 had the highest and second highest neoantigen burden respectively (Padj = 0.0007; Extended Data Fig. 8b). By contrast, samples from cluster 1MM.2 (n = 23) have the lowest neoantigen burden, the shortest OS (median 1.7 years), and were enriched for resting mast cells and dendritic cells (Padj < 0.05). Concordantly, samples in cluster 1MM.2 were predominantly classified as the C1/mesenchymal molecular subtype (78.3%, 18/23), whereas samples in clusters 1MM.1 and 1MM.3 were predominantly the C2/immunoreactive molecular subtype (46.9% (15/32) and 54.5% (12/22) respectively; Padj < 0.0001; Extended Data Fig. 9a). Consistent with having an active immune response, 1MM.1 and 1MM.3 tumors had higher densities of CD8+ T cells in the tumor epithelium compared to other clusters (Padj = 0.0281; Extended Data Fig. 8b).
Fig. 5 |. Immune phenotypes of long-term survivors.
a, Heatmap of scaled abundance of immune cell types following consensus clustering based on CIBERSORTx26 estimated absolute abundance of immune cell types from bulk RNA-seq data of each primary tumor (n = 126). Five immune clusters were identified (IMM.1-IMM.5), and each patient (column) is annotated with survival group (LTS, long-term survivor; MTS, moderate-term survivor; STS, short-term survivor), status at last follow-up (D, dead; P, progressed and alive; PF, progression-free and alive), residual disease size and age at diagnosis (quartiles). CIBERSORTx absolute (abs) immune scores, tumor purity, neoantigen counts, structural variant (SV) counts and ploidy estimates are shown as quartiles. Tumor samples are also classified according to molecular subtype11 (Cl, mesenchymal; C2, immunoreactive; C4, differentiated; C5, proliferative). b,c, Kaplan-Meier analysis of progression-free survival (b) and OS (c) in patients stratified by immune clusters. P values were calculated by Mantel-Cox log-rank test, and dotted lines indicate median survival.
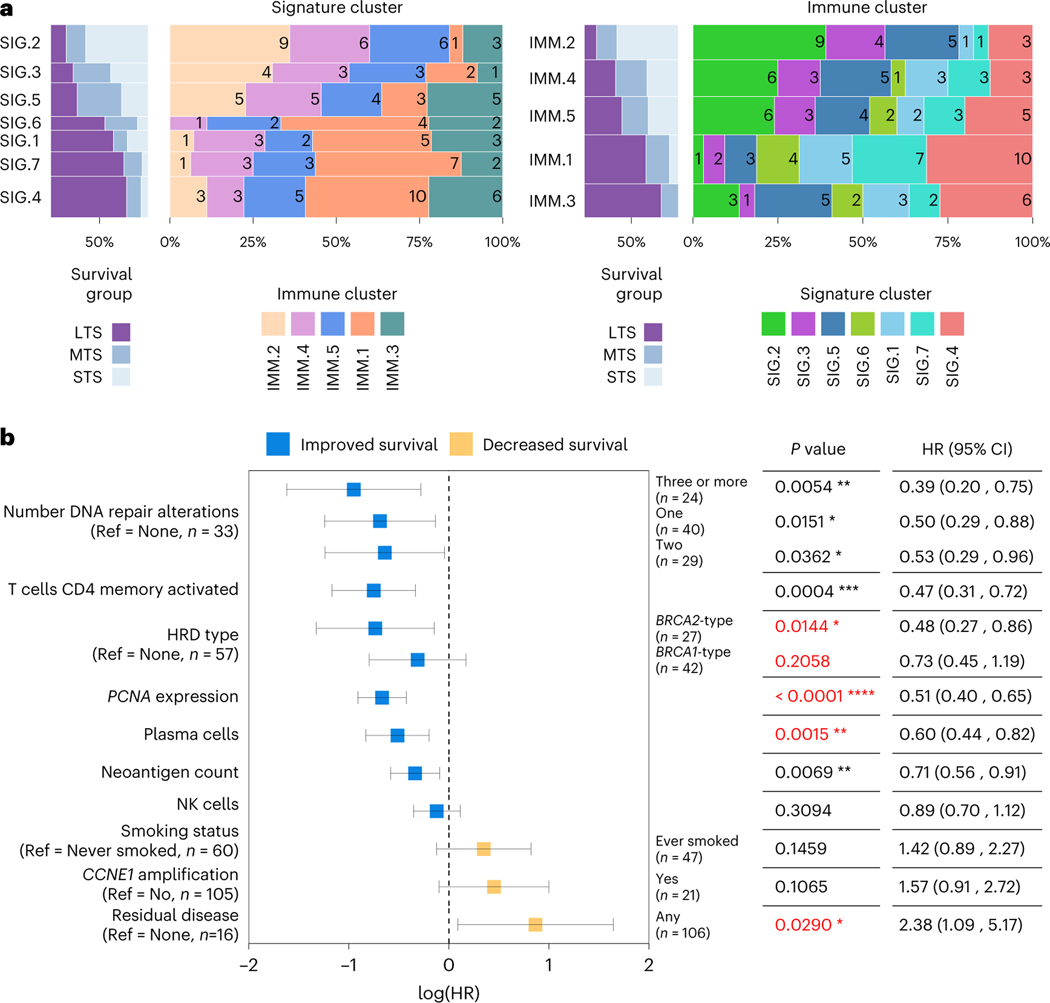
Although the two long-term survival immune clusters 1MM.1 and 1MM.3 were characterized by elevated HRD scores (scarHRD mean, Padj = 0.0439; BRCA2-type CHORD, Padj = 0.0859; Extended Data Fig. 8b), no particular DNA repair gene alteration was associated with the immune clusters (Extended Data Fig. 9b). In a subgroup analysis, differences in immune cell composition were observed between the BRCA1-altered mutational signature clusters: the most notable being elevated expression of the activated NK cell signature in clusters SIG.6 and SIG.7 compared to SIG.5 (SIG.5 versus SIG.6 Padj = 0.0760, SIG.5 versus SIG.7 Padj = 0.0580; Supplementary Note). Concordantly, immune cluster 1MM.1, which is enriched with the activated NK cell signature, was the dominant immune cluster in both SIG.6 (44.4%, 4/9) and SIG.7 (43.8%, 7/16) and the least abundant immune cluster in SIG.5 tumors (13.6%, 3/22; P = 0.4688; Fig. 6a and Supplementary Note).
Fig. 6 |. Key features associated with exceptional survival in HGSC.
a, Spine plots showing the proportion of samples shared between the mutational signature clusters (left) and the immune clusters (right), with the number of overlapping samples indicated inside the colored bars. Also shown is the proportion of survival groups (STS, short-term survivor; MTS, moderate-term survivor; LTS, long-term survivor) in each cluster. Each of the two types of clusters is ordered horizontally and vertically by the overall proportion of LTS. The height of the bars indicates the number of samples in the cluster. b, Forest plot illustrates the HR (squares) and 95% CI (whiskers) for OS calculated using a univariate Cox proportional hazard regression model based on selected features; results were not adjusted for multiple comparisons (*P < 0.05, **P < 0.01, ***P < 0.001, ****P < 0.0001). Features are sorted top to bottom by smallest to largest HR and P values less than 0.05 in multivariable model are colored red. Complete univariable and multivariable results, including feature associations with progression-free survival, are provided in Supplementary Tables 13, 14. Ref indicates the reference used for categorical features, and n indicates the number of samples in the categorical group.
Predictors of long-term survival
We considered the key features identified in this study, finding seven were individually associated with OS (Fig. 6b and Supplementary Table 13; univariable Cox regression model), including the number of DNA repair gene alterations (three or more HR: 0.39, 95% CI: 0.20–0.75, P = 0.0054), activated CD4 memory T cells (HR: 0.47, 95% CI: 0.31–0.72, P = 0.0004), BRCA2-type HRD (HR: 0.48, 95% CI: 0.27–0.86, P = 0.0144), PCNA expression (HR: 0.51, 95% CI: 0.40–0.65, P < 0.0001), plasma cells (HR: 0.60, 95% CI: 0.44–0.82, P = 0.0015), neoantigen count (HR: 0.71, 95% CI: 0.56–0.91, P = 0.0069) and residual disease (HR: 2.38, 95% CI: 1.09–5.17, P = 0.0290). When combined in a multivariable regression model, four features were statistically associated with OS, including HRD type (BRCA2-type HR: 0.33, 95% CI: 0.17–0.66, P = 0.0018; BRCA1-type HR: 0.45, 95% CI: 0.25–0.82, P = 0.0086), PCNA expression (HR: 0.50, 95% CI: 0.38–0.67, P < 0.0001), plasma cells (HR: 0.54, 95% CI: 0.37–0.78, P = 0.0011) and residual disease (HR: 3.15, 95% CI: 1.37–7.21, P = 0.0067; Supplementary Table 14).
Discussion
Cancer studies have focused on the determinants of treatment failure (that is, primary and acquired drug therapy resistance), with comparatively little attention on those patients who exceed expectations, despite their potential to provide therapeutic insights23,43,44. By accessing samples and data from studies that collectively include over 3,800 patients with HGSC, we were able to perform whole-genome characterization of HGSC in 60 exceptional survivors.
Conceivably, exceptional survival in HGSC may be determined by a dominant rare event or by the interaction of multiple factors that are individually common but due to chance are infrequent in combination. Our finding of the association of survival with a variety of factors involving the patient’s genome, tumor somatic mutational profile, and immune response strongly supports the latter explanation and is consistent with a diversity of molecular and clinical pathways to long-term survival in HGSC23,40.
Synthetic lethality induced by PARPi on a BRCA altered background provides a potent example of the clinical effect of simultaneously targeting DNA repair processes45. In a genetic parallel, we found that co-occurring alterations in DNA repair pathway genes are associated with long-term survival. In some instances, this was associated with evidence of both BRCA1-type and BRCA2-type HRD within a tumor, often due to structural variants that inactivate homologous recombination pathway genes. Indeed, inactivation of homologous recombination pathway genes by structural variants is a common and perhaps unappreciated source of HRD in HGSC14,46,47. It is plausible that multiple genetic defects in DNA repair may render tumor cells exceptionally sensitive to chemotherapy, as recently reported in an exceptional responder with metastatic breast cancer44, or perhaps impede the development of resistance.
We previously reported23, and validated here, how co-occurrence of RB1 and BRCA1 or BRCA2 loss-of-function mutations is associated with long-term survival. Interestingly, RB1 has a non-canonical function in homologous recombination DNA repair48 in addition to cell cycle regulation. Our comparison of primary and relapse tumor samples in a small number of patients provided additional evidence for a key role of co-occurring RB1 and BRCA1 mutations in exceptional response and good outcome.
One of the strongest associations with long-term survival were markers of enhanced proliferation. While enhanced proliferation is generally associated with aggressive cancer phenotypes, faster replication may also render cells more susceptible to chemotherapy. Higher proliferative counts in long-term survivors could also relate to a reduced ability of the cells to enter a quiescent state, which has been associated with the development of treatment resistance in lung49 and ovarian cancer50. A subset of long-term survivors had CCNE1 amplification and evidence of enhanced immune activity, suggesting that an engaged tumor-immune microenvironment can overcome the poor primary treatment response typically associated with CCNE1 amplification and homologous recombination proficiency.
The determinants of long-term survival in HGSC are complex, and progress will depend on detailed discovery studies43 and validation of specific findings in large, clinically annotated patient cohorts with long follow-up51. Refining comparisons43 will also be key, as exemplified by the three subsets of patients, all with BRCA1 mutations but with distinctly different survival outcomes. Clusters SIG.5 and MET.1 identify a subgroup of more aggressive BRCA1-driven tumors associated with a younger age of onset, whose unique genomic signature associated with tobacco or alcohol exposure, relatively lower NK cell infiltration and/or less frequent compounded HRD may drive a diminution in survival. A recent study found that cigarette smoking is associated with worse survival among women with germline BRCA1/2 mutations compared to noncarriers52. Furthermore, a large cohort study of asymptomatic individuals found that NK cell activity decreases in smokers in a dose-dependent manner53, indicating a plausible link between smoking-associated NK cell deficit and an elevated risk of malignancy, particularly in BRCA1 mutation carriers. Collectively our molecular data support the observation that survival outcomes in women with BRCA1-altered HGSC may be influenced by prior mutagen exposure, a potentially modifiable risk factor.
We have identified distinct HGSC subgroups separated by mutational processes, DNA methylation and immune response, and found that differential outcomes may be associated with compounding lifestyle-related exposures, surgical outcomes, anti-tumor immune activity, cell cycle deregulation and/or disruption of multiple DNA repair pathways. Although most of our patients predate the introduction of PARPi, given that response to platinum is predictive of PARPi sensitivity19, our findings may also provide insights into long-term PARPi response.
Online content
Any methods, additional references, Nature Portfolio reporting summaries, source data, extended data, supplementary information, acknowledgements, peer review information; details of author contributions and competing interests; and statements of data and code availability are available at https://doi.org/10.1038/s41588-022-01230-9.
Methods
Study participants and patient samples
This project was conducted with approval from the Peter MacCallum Cancer Centre Human Research Ethics Committee, the Western Sydney Local Health District Human Research Ethics Committee and the Mayo Clinic Institutional Review Board. The study population consisted of women diagnosed with epithelial ovarian cancer between 1980 and 2019, enrolled in the Australian Ovarian Cancer Study (AOCS), the Gynaecological Oncology Biobank at Westmead Hospital (Sydney) and the Mayo Clinic. Participation in these studies was voluntary (patients were not compensated), and written informed consent was provided by all participants. Women with histologically confirmed high-grade serous ovarian carcinoma and survival time available (n = 3,824) were considered for the study.
Inclusion criteria.
Cases were selected as follows: (i) histologically confirmed high-grade (grade 2 or 3) serous ovarian, fallopian or peritoneal carcinoma; (ii) International Federation of Gynecology and Obstetrics stage IIIC or IV disease; (iii) primary treatment incorporating a platinum-based agent; (iv) fresh-frozen tumor obtained during primary debulking surgery and matched blood samples available or previously analyzed14. Survival categories were defined as follows: (i) short-term survivors had died less than 2 years from diagnosis, (ii) moderate-term survivors had survived at least 2 years since diagnosis but died before 10 years and (iii) long-term survivors had an OS of at least 10 years after diagnosis (Extended Data Fig. 1a). This definition of long-term survival is consistent with previous studies23,54. To confirm high-grade serous carcinoma, all eligible cases underwent pathology review as previously described23.
Clinical definitions.
Progression-free survival was defined as the time between histological diagnosis and disease progression, as determined by imaging or CA125 serum levels according to the Gynecological Cancer Intergroup criteria, or death. OS was defined as the time interval between histological diagnosis and death (all causes) or date of last follow-up. Never-smokers were those participants who had self-reported never smoking (or having smoked less than 100 cigarettes in their lifetime) before diagnosis.
Cohorts.
Sequencing of 73 patients was previously described14 (7 long-term survivors, 34 short-term survivors and 32 moderate-term survivors) as part of the International Cancer Genome Consortium (ICGC) Ovarian Cancer project. Additional sequencing of samples from 53 long-term survivors was performed here as part of the Multidisciplinary Ovarian Cancer Outcomes Group (MOCOG) study. Genomic data from the ICGC and MOCOG cohorts were uniformly processed and analyzed for the current study. The analysis cohort consisted of 126 female patients with HGSC (Extended Data Fig. 1a), diagnosed between the ages of 29 and 81 years (Extended Data Fig. 1b and Supplementary Table 1).
Biospecimens.
Normal DNA was isolated from peripheral lymphocytes or lymphoblastoid cell lines using the salting out method, the QIAamp DNA Blood Mini Kit (QIAGEN) or the FlexiGene DNA Kit (QIAGEN) using the AutoGen FlexSTAR+ instrument according to the manufacturer’s instructions. Tumor DNA was extracted from fresh frozen cryosectioned tumor tissue using either the DNeasy Blood & Tissue Kit (QIAGEN), the AllPrep DNA/RNA/miRNA Universal Kit (QIAGEN) or the Gentra Puregene Kit (QIAGEN) according to the manufacturer’s instructions. Tumor RNA was extracted from fresh frozen cryosectioned tumor tissue using the mirVana miRNA Isolation Kit (Ambion/Life Technologies), the AllPrep DNA/RNA/miRNA Universal Kit (QIAGEN) or the RNeasy Mini Kit (QIAGEN) using the QIAcube automated system according to the manufacturer’s instructions. DNA was quantified using the Qubit dsDNA BR Assay (Invitrogen), the Lunatic spectrometer (Unchained Labs) and the Quant-iT PicoGreen dsDNA Assay Kit (Invitrogen). RNA quality and quantity were assessed using the Bioanalyzer RNA 6000 Nano assay (Agilent) and the NanoDrop Spectrophotometer (Thermo Fisher Scientific).
Molecular assays
Single-nucleotide polymorphism (SNP) arrays and quality control.
Tumor and matched normal DNA was assayed with the Infinium OmniExpress-24 BeadChip arrays, arrays scanned and data processed using Genotyping module 2.0.3 software in GenomeStudio 2.0.3 to calculate logR ratios and B-allele frequencies according to manufacturer’s instructions (Illumina) at the Australian Genome Research Facility (AGRF; Melbourne, Australia). HYSYS55 was used to confirm correspondence of normal and tumor DNA, and tumor cellularity was assessed using qPure56 and ASCAT57, based on B-allele frequencies for ~67k common probes between HumanOmni2.5–8v1_A, HumanOmni25M-8v1–1_B, InfiniumOmniExpress-24v1–2_A1 and InfiniumOmniExpress-24v1–3_A1 SNP array platforms. Tumor DNA samples with estimated tumor cellularity >40% proceeded to WGS and methylation arrays. B-allele frequencies were also used to visually inspect profiles across tumor and germline samples.
Methylation arrays.
Quality assessment was performed by QuantiFluor (Promega) and 500 ng tumor DNA was bisulfite converted with the EZ DNA Methylation kit (Zymo Research) and assayed using the Infinium MethylationEPIC BeadChip arrays according to manufacturer’s instructions (Illumina) at the AGRF.
WGS.
Sequence libraries were generated from tumor and matched normal genomic DNA using the KAPA HyperPrep PCR-free library preparation kit (Roche) according to manufacturer’s instructions. Sequencing was carried out by the Kinghorn Centre for Clinical Genomics Sequencing Laboratory (Sydney, Australia) on the HiSeq X Ten System (Illumina) to a minimum base coverage of 30-fold for normal DNA and 60-fold for tumor DNA samples.
RNA-seq.
Quality assessment was performed using the Bioanalyzer RNA 6000 Nano assay (Agilent), finding a median RNA integrity number of 9.0 (range 4.7 to 10). Libraries were generated using Illumina Stranded mRNA Prep and 150-bp paired-end sequencing was performed to a minimum of 100 million reads on Illumina NovaSeq 6000 instruments at the AGRF in accordance with the manufacturer’s instructions.
Processing of whole-genome sequence data
FASTQ files were assessed for sequencing quality using FASTQC (v0.11.8) and for contaminants using FastQ Screen58 (v0.11.4). The files were trimmed of adapters, low-quality bases and N content using fastq-mcf from ea-utils (v1.05). Sequence data were mapped to the human genome reference GRCh37 b37 using BWA mem59 (v0.7.17-r1188), producing BAM files. BAM files were then sorted, lanes merged and duplicates marked using Picard Tools (v2.17.3). Bases were recalibrated using GATK60 BaseRecalibrator (v4.0.10.1). Coverage was calculated using GATK DepthOfCoverage (v3.8–1-0-gf15c1c3ef), and metrics such as insert size distribution, OxoG, base quality, GC bias and quality distribution were generated using Picard Tools (v2.17.3). GATK HaplotypeCaller (v4.0.10.1) was used on germline BAMs to generate Genomic Variant Call Format files, which were used as the ‘Panel of Normal’ for Mutect2 variant calling. Tumor purity and ploidy was estimated using FACETS61 (v0.6.1).
Variant detection
Germline variant calling.
Germline base substitution and INDEL variants were called using VarDictJava (v1.5.7 with -r = 2 -Q = 10 -f = 0.1) for genes of interest (Supplementary Table 5).
Somatic base substitution and INDEL calling.
Four variant calling tools were used to call somatic base substitutions and INDELs, as follows: Mutect2 (ref. 60) (v4.0.11.0 with defaults), VarDictJava62 (v1.5.7 with -r = 2 -Q = 10 -V = 0.05 -f = 0.01), Strelka2 (ref. 63) (v2.9.9 with defaults), and VarScan2 (ref. 64) (SAMtools65 v1.9 for mpileup and VarScan2 v2.4.3 with-min-coverage 7-min-var-freq 0.05-min-freq-for-hom 0.75-p-value 0.99-somatic-p-value 0.05-strand-filter 0). Variant calls from all four tools were then decomposed (that is, multiallelic to biallelic) and normalized (that is, left trimmed) using vt66 (v0.57721). The passing variants for each caller were then processed using GATK ReadBackPhasing (v3.8-1-0-gf15c1c3ef with-phase-QualityThresh 10-enableMergePhasedSegregatingPolymorphism-sToMNP-min_base_quality_score 10-min_mapping_quality_score 10-maxGenomicDistanceForMNP 2). The main purpose of running this tool was to combine contiguous SNVs to multinucleotide variants (for example, a DBS). The variant call format (VCF) files per caller were then merged using GATK CombineVariants (v3.8-1-0-gf15c1c3ef with -genotypeMergeOptions UNIQUIFY-priority Strelka2, Mutect2, VarScan2, VarDictJava). The combined VCF was split and left trimmed using vt. Any variants that failed all callers were excluded. The VCF was annotated for homopolymers and tandem repeats using GATK Varian-tAnnotator (v3.8-1-0-gf15c1c3ef with-reference_window_stop 1000-A HomopolymerRun-A TandemRepeatAnnotator). High-confidence variants were those that passed at least two callers, had at least one variant containing read in each strand, were not in the Duke and DAC blacklisted regions and were not in the list of FrequentLy mutAted GeneS (FLAGS67).
Structural variant detection.
Four callers were used to identify somatic structural variants: Manta68+ BreakPointInspector (v1.5.0), GRIDSS69 (v2.0.1), Smoove (v0.2.2) and SvABA70 (v134). Structural variant calls were separated into germline and somatic VCFs. For each germline/somatic VCF from the four callers, a custom R script used the StructuralVariantAnnotation and rtracklayer71 libraries to merge the SVs and generate a combined VCF from the four callers. A value of 10 was used for the maxgap parameter along with the strand orientation of the method findBreakpointOverlaps to identify common structural variants across the callers. Structural variants were annotated as duplication, deletion, inversion or translocation using a simple event type classifier provided by the GRIDSS package. Breakpoints called by at least two callers were deemed high confidence.
CNV detection.
SNP pileup frequencies on common SNPs (dbSNP build 151, reference = GRCh37.p13, N = 37,906,831) were generated for tumor and normal BAMs. Pileups were generated using the snp-pileup tool (with-pseudo-snps 100-min-map-quality 10-min-base-quality 10-max-depth 5000-min-read-counts 15,0) as provided by the developers of FACETS61 (v0.6.1). The pileups were then used for cnv_facets (v0.13.0), which is a convenience tool for FACETS that executes all necessary steps to generate a VCF from the BAMs. Various values of pre-processing and processing cvals along with nbhd-snp were used for the analysis. The settings with the most robust CNV calls and purity agreement with the SNP array data were used for further analysis. The settings used for FACETS were (-nbhd-snp=500-cval=50 1000-depth=15 5000).
Whole-genome duplication and whole-genome loss.
Whole-genome duplication percentages were assessed using previously established methods72. Briefly, the percentage genome with a major copy number (MCN) of greater than or equal to two was calculated. The same method was applied to assess whole-genome loss, where percentage genome with a total copy number of less than or equal to one was calculated.
Annotation of variants in genes of interest
High-confidence base substitutions and INDELs were filtered to remove (1) variants with less than four supporting reads and/or variants without bidirectional read support, (2) all silent (synonymous) mutations with no prior evidence of being pathogenic, (3) common variants with a global minor allele frequency > 0.001 in the Genome Aggregation Databse (gnomAD) v2.1.1 (https://gnomad.broadinstitute.org/) and (4) variants previously found to be benign or low clinical significance in one or more mutation databases (https://www.ncbi.nlm.nih.gov/clinvar/, https://brcaexchange.org/). Structural variants that were detected within a gene footprint were considered truncating if the variant was (1) a translocation that breaks the gene anywhere between the translation start site and the first base of the final coding exon, (2) a deletion, duplication, or inversion that spans one or more exons (unless it only spans the final coding exon) or (3) a deletion, duplication or inversion that results in a frameshift within an exon (unless it is within the final coding exon). CNVs were considered pathogenic if (1) a region of homozygous deletion (gene level copy number = 0) spans the whole gene or a coding exon (unless it only spans the final coding exon), or (2) a region of amplification (gene level copy number ≥7) spans the whole gene.
Evidence of mutation was sought from both WGS and RNA-seq data, and manual review of germline and somatic variants in genes of interest was carried out using Integrative Genomics Viewer73. Manually curated genes and pathogenic variants with supporting evidence are listed in Supplementary Tables 5–7. Mutations reported in Supplementary Tables 5–7 were only those deemed pathogenic, that is truncating mutations (nonsense, splice site, frameshift, deletions, duplications, inversions and translocations that disrupt the coding transcript) and missense variants previously reported as pathogenic or likely pathogenic in curated mutation databases (https://tp53.isb-cgc.org/, https://www.ncbi.nlm.nih.gov/clinvar/, https://brcaexchange.org/)
Homologous recombination pathway analysis
In addition to pathogenic germline and somatic mutations in genes involved with homologous recombination and DNA repair (Supplementary Tables 5 and 6), the promoter methylation status of BRCA1 and RAD51C was determined in tumor samples using methylation array data and gene expression (Supplementary Methods). Tumor samples with multiple potential driver gene alterations were assigned to a primary alteration category in the following order of preference: (1) germline mutation in homologous recombination gene (BRCA1, BRCA2, BRIP1, PALB2, RAD51C, or RAD51D), (2) somatic promoter methylation of BRCA1 or RAD51C, (3) somatic mutation in homologous recombination gene (BRCA1, BRCA2, BRIP1, PALB2, RAD51C, or RAD51D), (4) somatic CDK12 mutation, (5) somatic CCNE1 amplification, (6) somatic mutation in putative homologous recombination gene (BARD1, BLM, CHEK2, FANCA, FANCD2, FANCE, FANCI, FANCM, PTEN, ATM, ATR, or RAD51B), (7) somatic mutation in mismatch repair gene (MSH2, MSH6, PMS1, or PMS2), (8) wild-type(no germline or somatic homologous recombination alteration, CDK12 mutation, CCNE1 amplification, or mismatch repair mutation). Where multiple potential driver mutations were identified, the variant allele frequency and/or mutational signatures were used to assign the likely driver.
Multiple DNA repair pathway alterations.
To determine the number of DNA repair alterations per sample, all independent germline and somatic alterations were tallied in the following gene sets: (1) homologous recombination pathway genes, (2) putative homologous recombination pathway genes, (3) mismatch repair genes and (4) CDK12 and RB1.
Homologous recombination deficiency.
Homologous recombination deficiency was estimated in tumor samples using CHORD28 and scarHRD74.
Mutational signatures
Mutational signatures were generated for high-confidence variants as described above. Variants for each sample were converted into catalogs or categories of mutational spectra for SBSs, DBSs and INDELs using the R package ICAMS v2.0.10.9001 (https://github.com/steverozen/ICAMS) and the function ‘VCFsToCatalogs’. Each type of mutational catalog contains a number of contexts based on the COSMIC definitions32, namely 96 contexts for SBSs, 78 contexts for DBSs and 84 contexts for INDELs. This provides a sample by mutation context matrix per SBS, DBS and INDEL type. Structural variant signature catalogs consisting of 32 contexts were generated using the R package signature.tools. lib33 (v0.0.0.9000) and the function ‘bedpeToRearrCatalogue’. The SBS, DBS and INDEL catalogs were then fit to the COSMIC Mutational Signatures v3.2 database (https://cancer.sanger.ac.uk/signatures/), and the structural variant catalogs were fit to the ovary-specific rearrangement signatures (https://signal.mutationalsignatures.com/). Further details on mutational signature fitting and clustering are described in the Supplementary Methods.
Neoantigen prediction
HLA types were generated using HLA-VBSeq75 (v11_22_2018) for neoantigen prediction as follows. Unmapped reads and reads mapped to HLA regions were extracted usingjvarkit samviewwithmate (ec2c236) and converted to FASTQ files using samtools view (v1.9) along with Picard Tools SamToFastq (v2.17.3); these were then mapped using BWA mem (v0.7.17-r1188) to the HLA v2 database based on IMGT/HLA Database76 release 3.31.0 and Japanese HLA reference dataset for HLA estimation. The HLA types were fed into pVACtools77 pVACseq (v1.3.5) to identify and construct neoantigens from the high-confidence variants. Briefly, high-confidence coding variants in VCF format were annotated using the VEP (v92.4) plugin ‘Downstream’, which provides the predicted downstream protein sequence and the change in length relative to the reference protein, and the plugin ‘Wildtype’, which includes the transcript protein sequence in the annotation. RNA read counts for the annotated variants were generated using bam_readcount_helper.py and added to the VCF using vatools vcf-readcount-annotator. Normalized transcripts per million were added using vatools vcf-expression-annotator. Finally, pVACseq was run against this final annotated VCF for both MHC Class I and MHC Class II predictions.
RNA-seq data processing and quality control
Initial quality control checks on raw FASTQ files were performed using FastQC (v0.11.8). Reads were trimmed for low quality, adapters, N content and poly(A) tails using fastq-mcf (v1.05), and contamination assessed using FastQ Screen (v0.11.4). Reads were mapped to the human reference GRCh37.92 using the STAR78 two pass method (v2.6.0b). Mapped reads were sorted using Picard Tools (v2.17.3). Additional quality control after mapping was performed using Picard Tools CollectRnaSeqMetrics (v2.17.3) and RSeQC79 (v2.6.4). Counts were generated on the Ensembl release GRCh37.92 gene annotation using HTSeq80 (v0.10.0). Counts were generated on the exons only using the ‘intersection-nonempty’ mode.
Raw counts data were filtered to only include protein coding genes. To remove lowly expressed genes, the data were converted to CPM (counts per million = number of reads mapped to a gene × 106/total number of mapped reads), and only genes where at least 10 samples had a CPM of greater than 0.5 were kept for further processing. The data were normalized using the trimmed mean of M values (TMM) method in edgeR81 and batch effects removed using the removeBatchEffect function of limma82. Further details on batch correction and expression analyses are provided in the Supplementary Methods.
Methylation data processing and quality control
Methylation data quality control assessment and processing were performed using the R package minfi83 (v1.32.0). Probes failing detection (P >0.01), SNP positions and cross-reactive probes (as collected in https://github.com/sirselim/illumina450k_filtering) were excluded. Data were normalized using the minfi function ‘preprocessFunnorm’ (Functional normalization as described previously84), and beta values were generated. Probes were annotated to the Ensembl release GRCh37.92 gene transfer format annotation. Beta values for samples from EPIC and 450k arrays were combined to contain shared probes and batch corrected using the ‘ComBat’ function in the R package sva85 (v3.34.0).
Statistical analyses
Differences in proportions of categorical variables between groups were assessed by the chi-square or Fisher’s exact test as appropriate. Continuous variables were evaluated using either a Kruskal-Wallis test or a Mann-Whitney test. The Kaplan-Meier methodology was applied to estimate and plot progression-free and OS probabilities and the corresponding time to event were compared between groups using the log-rank (Mantel-Cox) test. For display purposes, the x axis in Kaplan-Meier plots is capped at 15 years. Outcomes were assessed using univariable and multivariable Cox proportional hazards models, for continuous and categorical features, using the ‘coxph’ function of the R package survival (v3.2–7) with default parameters. Continuous variables were scaled and centered across the cohort using the R function ‘scale’. Correlations between continuous variables were assessed by Spearman correlation. All statistical tests were two sided and considered significant when P < 0.05. The Benjamini-Hochberg procedure was applied to correct P values for the impact of multiple testing, with false discovery rate-adjusted P values denoted by Padj. R (v3.6.3) and Prism (v9.2.0) were used for statistical analyses.
Reporting summary
Further information on research design is available in the Nature Portfolio Reporting Summary linked to this article.
Extended Data
Extended Data Fig. 1: Patient cohort.
a, Overview of patients (n = 126) and tumor samples analyzed in this study. In addition to paired germline and primary tumor samples in all patients, 5 relapse tumor samples were also analyzed from 4 long-term survivor patients. OS, overall survival. b, Clinical characteristics of patients by survival group. All patients received primary platinum therapy. aKruskal–Wallis, bChi-square, or clog-rank Mantel–Cox test P values comparing survival groups reported.
Extended Data Fig. 2: Frequently altered cancer genes across survival groups.
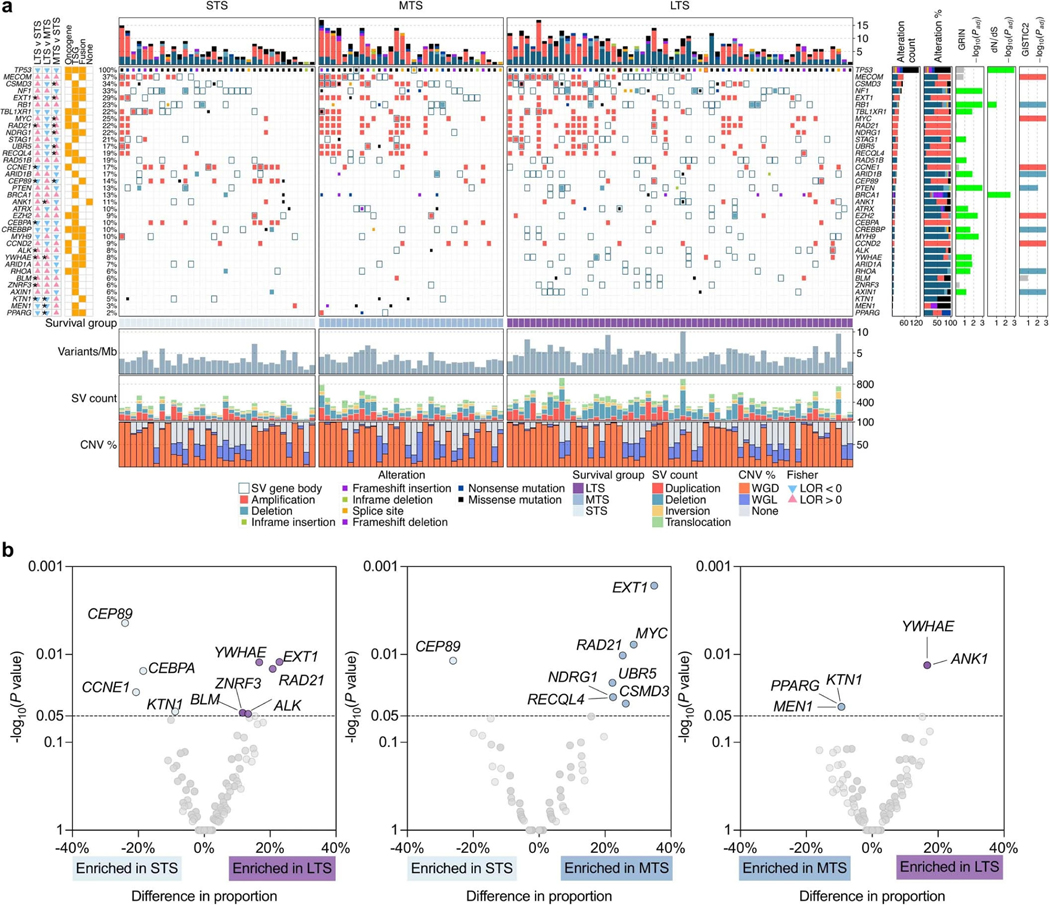
a, Overview of somatic alterations in driver genes detected by GRIN, dNdScv, GISTIC, and/or in cancer-associated genes (COSMIC Cancer Gene Census) that are enriched in a survival group relative to another survival group. From left: two-sided Fisher’s test of the difference in proportions of altered samples between survival groups, triangles and color indicate direction of the log odds ratio (LOR; blue = down, pink = up), asterisks indicate P value < 0.05 (see Supplementary Table 6 for P values), P values were not adjusted for multiple comparisons; role of gene in COSMIC Cancer Gene Census (TSG, tumor suppressor gene); genomic alterations split by survival groups, bars at the top indicate the number of alterations in each listed gene per patient; bar plot of the number of samples with an alteration (alteration type indicated by color); bar plots showing the proportion of alteration types per gene; P values were calculated using the genomic random interval (GRIN) statistical model (one-sided) for recurrent structural variants (SV) (see Supplementary Data 2 for GRIN P values), the dNdScv likelihood-ratio test (two-sided) for recurrent base substitutions and small-scale deletions and insertions (see Supplementary Data 1 for dNdScv P values), and GISTIC2 permutation-of-markers test (one-sided) for recurrent copy-number variants (CNV) with red indicating amplification and blue indicating deletion (see Supplementary Data 3 for GISTIC2 P values), P values were adjusted for multiple comparisons using the Benjamini-Hochberg procedure (dNdScv, GISTIC2) or the robust false discovery rate procedure (GRIN) and are shown as negative log10 P values and capped at 0.001 for display purposes. Each patient (column) is annotated with survival group (LTS, long-term survivor; MTS, moderate-term survivor; STS, short-term survivor). Below the alterations are bar plots indicating somatic mutation burden in variants per megabase (Mb); SV count including duplications, deletions, inversions and intrachromosomal rearrangements; and the proportion of the tumor genome that is duplicated (WGD) or lost (WGL). b, Pairwise comparison of the alteration frequencies between survival groups for genes in the COSMIC Cancer Gene Census. The difference in relative alteration frequency is shown on the x-axis and the P value (Fisher’s test, two-sided) is shown on the y-axis. Symbols of genes with P values < 0.05 are displayed. Multiple hypothesis correction was not applied in this analysis as adjusted P values were all greater than 0.1. Alterations in this analysis included non-synonymous mutations, homozygous deletions, amplifications and structural variants in coding genes that are expressed.
Extended Data Fig. 3: Key features of mutational signature clusters and associated survival outcomes.
a, Summary of the key clinical and genomic features of each mutational signature cluster. Clusters are ordered top to bottom by lowest to highest proportion of long-term survivors (LTS) in each cluster. HR, homologous recombination; LOH, loss-of-heterozygosity; SV, structural variant; MTS, moderate-term survivor; STS, short-term survivor; DUP, duplications; DEL, deletions; INV, inversions. b, Kaplan–Meier analysis of progression-free and c, overall survival in patients stratified by signature clusters. P values calculated by Mantel–Cox log-rank test and dotted lines indicate median survival. d, Boxplots summarize the proportion (y-axis) of clustered and nonclustered rearrangements by size (x-axis) and type, for each mutational signature cluster (SIG.1 n = 14, SIG.2 n = 25, SIG.3 n = 13, SIG.4 n = 27, SIG.5 n = 22, SIG.6 n = 9, SIG.7 n = 16); boxes show the interquartile range (25–75th percentiles), central lines indicate the median, whiskers show the smallest/largest values within 1.5 times the interquartile range and values outside it are shown as individual data points. Del, deletions; tds, tandem duplications; inv, inversions, tra, interchromosomal translocations; Kb, kilobase; Mb, megabase.
Extended Data Fig. 4: Categorical features of mutational signature clusters.
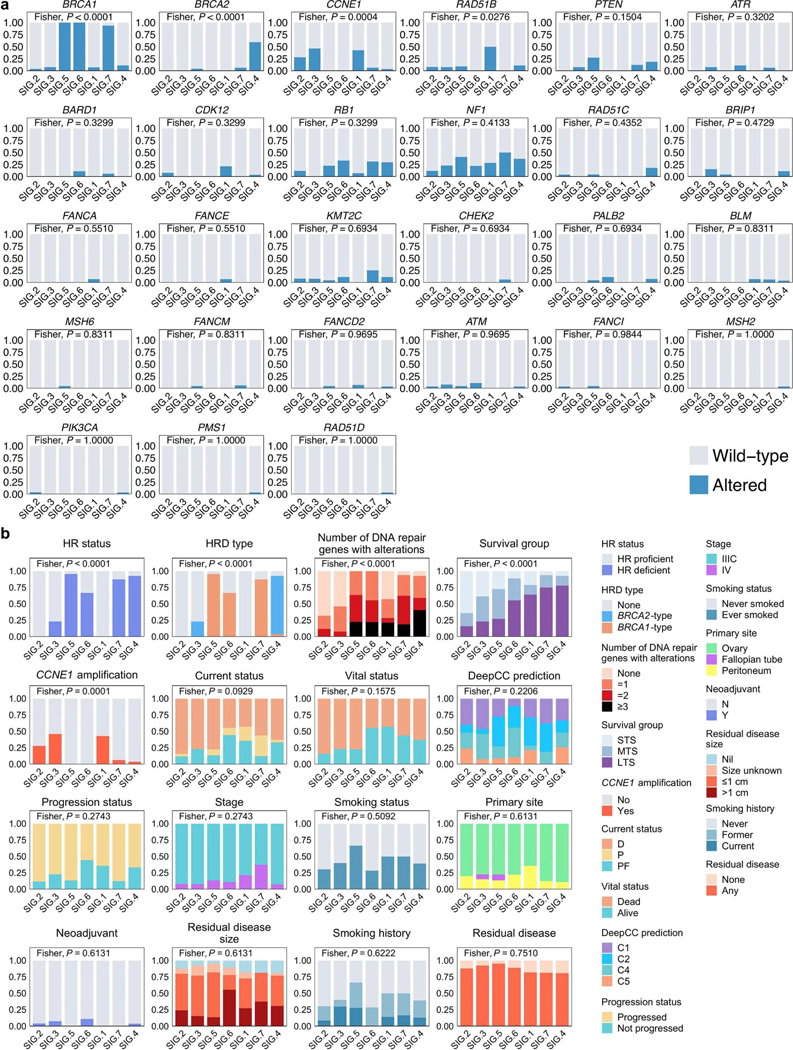
a, Proportion of patients affected by gene alterations per mutational signature cluster. Genes are ordered by significance using Fisher’s exact test (two-sided) and clusters are ordered by the proportion of long-term survivors. b, Proportion of patients with categorical features per cluster. Features are ordered by significance using Fisher’s exact test (two-sided) and the clusters are arranged by the proportion of long-term survivors. The Fisher’s test P values displayed in (a) and (b) are Benjamini-Hochberg adjusted P values. Features include homologous recombination (HR) status, homologous recombination deficiency (HRD) type, number of DNA repair pathway alterations, survival group (LTS, long-term survivor; MTS, moderate-term survivor; STS, short-term survivor), status at last follow-up (D, dead; P, progressed and alive; PF, progression-free and alive), self-reported smoking status, DeepCC molecular subtype (C1, mesenchymal; C2, immunoreactive; C4, differentiated; C5, proliferative), and neoadjuvant treatment (Y, yes; N, no).
Extended Data Fig. 5: Clinical and genomic features of mutational signature clusters.
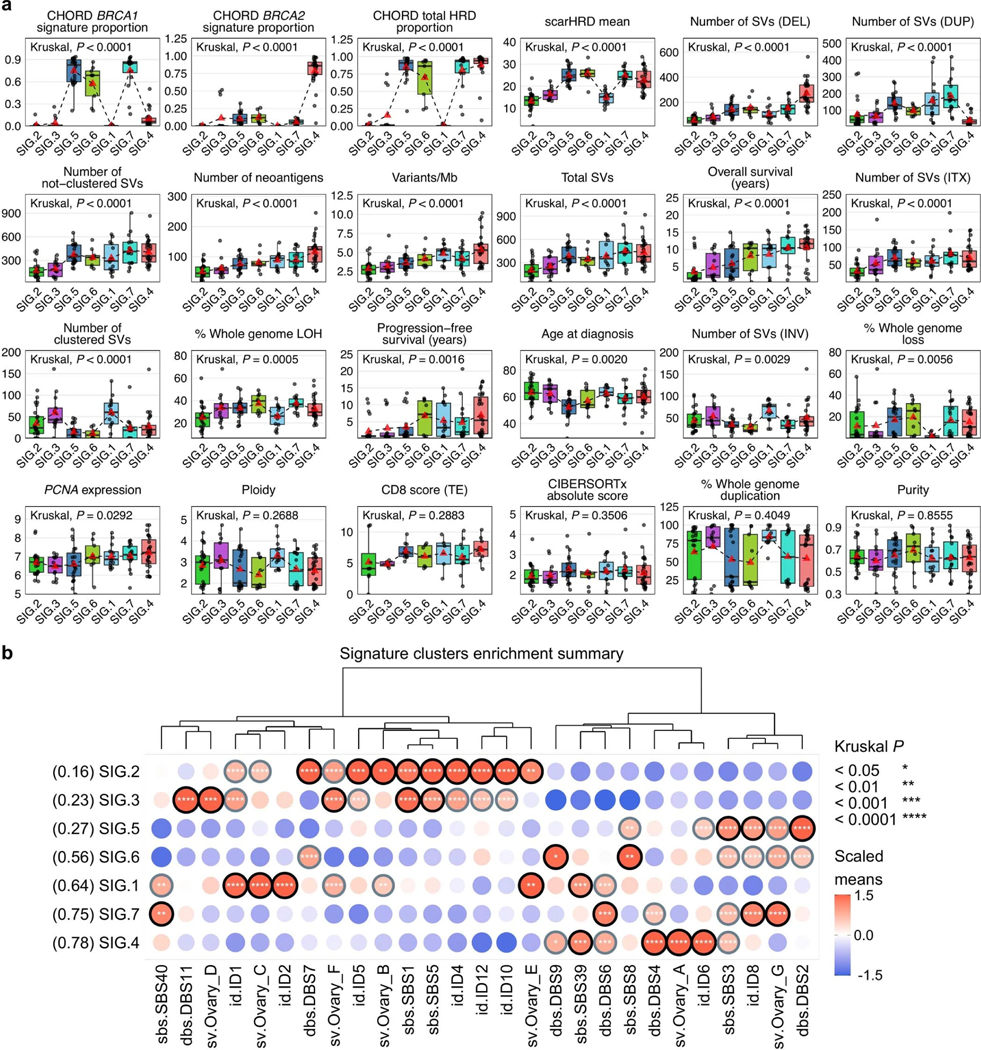
a, Boxplots summarize numerical, clinical and genomic features by mutational signature cluster; points represent each sample, boxes show the interquartile range (25–75th percentiles), central lines indicate the median, whiskers show the smallest/largest values within 1.5 times the interquartile range, red triangles indicate the mean, and dotted lines join the means of each cluster to visualize the trend. The Kruskal–Wallis test P values displayed are Benjamini-Hochberg adjusted P values. Features are ordered by their significance and clusters are ordered by the proportion of long-term survivors. CD8 scores were available for n = 54 primary tumors as previously measured by immunohistochemistry23 and scored as density of CD8+ T cells (average cells/mm2, y axis) in the tumor epithelium (TE). HRD, homologous recombination deficiency; DEL, deletions; DUP; duplications; SV, structural variants; Mb, megabase; ITX, intrachromosomal rearrangements; LOH, loss-of-heterozygosity; INV, inversions. b, Bubble plot summary of mutational signature enrichment across signature clusters. The dendrogram is reused from the signature clustering (Fig. 3) to order the mutational signature types (columns). Mutational signature clusters (rows) are sorted by the proportion of long-term survivors in each cluster, indicated in brackets. The color and size of bubbles indicate the z-score scaled values of the mean signature exposure per cluster. Bubbles with a z-score of greater than or equal to 1 have a black border and bubbles with a z-score of greater than 0.5 but less than 1 have a gray border. Bordered bubbles have asterisks filled in to indicate Kruskal–Wallis test P values adjusted for multiple testing using Benjamini-Hochberg correction.
Extended Data Fig. 6: DNA methylation clustering of primary tumor genomes.
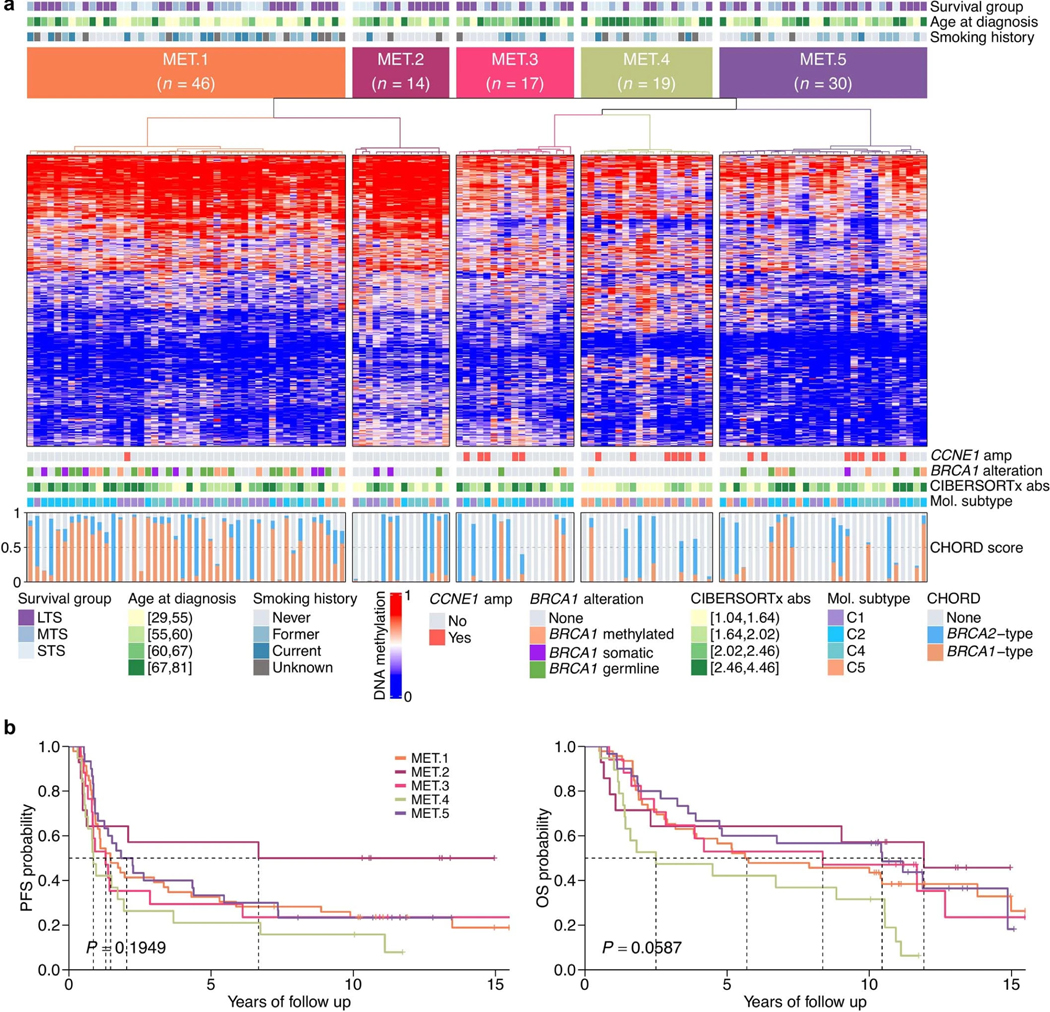
a, Heatmap of methylation data following consensus clustering of primary tumors (columns) based on the standardized CpG probe intensities (M-values) of the 1% most variable CpG probes (rows; number of probes = 3,645) across all primary tumor samples (n = 126). The heatmap scale shows the beta values. Five methylation clusters were identified (MET.1–MET.5), and each patient (column) is annotated with survival group (LTS, long-term survivor; MTS, moderate-term survivor; STS, short-term survivor), age at diagnosis (quartiles), and self-reported smoking history. Tumor samples are also classified according to CCNE1 amplification (amp) status, BRCA1 alteration status, CIBERSORTx absolute (abs) immune scores (quartiles), and molecular subtype11 (C1, mesenchymal; C2, immunoreactive; C4, differentiated; C5, proliferative). Bars in the bottom panel represent the BRCA1 (orange) and BRCA2 (blue) type homologous recombination deficiency (CHORD28) scores of each tumor sample. b, Kaplan–Meier analysis of progression-free (PFS) and overall survival (OS) in patients stratified by methylation clusters. P values calculated by Mantel–Cox log-rank test and dotted lines indicate median survival in years since diagnosis.
Extended Data Fig. 7: Transcriptional phenotypes in long-term survivors.
a, Clustered heatmap summarizing gene set enrichment analysis (GSEA) using the hallmark Molecular Signatures Database (MSigDB) gene sets. Direction and color of triangles relate to the normalized enrichment score (NES) as generated by FGSEA. P values (two-sided) were calculated using the FGSEA default Monte Carlo method; the size of the triangles corresponds to the negative log10 Benjamini-Hochberg adjusted P value (Padj). The columns are split by survival groups (STS, short-term survivor; MTS, moderate-term survivor; LTS, long-term survivor), with the direction of enrichment denoted by the group in the heading (numerator) versus the two other groups labeled below. b, Boxplots summarize expression of MKI67 and PCNA proliferation gene markers across the survival groups (left; STS n = 34, MTS n = 32, LTS n = 60); points represent each sample, boxes show the interquartile range (25–75th percentiles), central lines indicate the median, and whiskers show the smallest/largest values within 1.5 times the interquartile range. Differential expression analysis was performed using DESeq2 to determine fold change (right) of gene expression between survival groups (two-tailed Wald test, both unadjusted P values and Benjamini-Hochberg adjusted P values (Padj) are shown). c, Forest plot (left) indicates the hazard ratio (HR, squares) and 95% confidence interval (CI; whiskers) for overall survival calculated using a univariate Cox proportional hazard regression model based on the LM22 immune cell types detected by CIBERSORTx analysis (n = 126 patients). Cell types are arranged by HR. P values < 0.05 are colored red (*P < 0.05, **P < 0.01) and were not adjusted for multiple comparisons. Absolute enrichment scores per cell type across the cohort are shown in boxplots (right); boxes show the interquartile range (25–75th percentiles), central lines indicate the median, whiskers show the smallest/largest values within 1.5 times the interquartile range and values outside it are shown as individual data points.
Extended Data Fig. 8: Genomic and clinical features of immune clusters.
a, A condensed bubble plot of the various LM22 cell types used for the immune clustering (IMM.1 n = 32, IMM.2 n = 23, IMM.3 n = 22, IMM.4 n = 24, IMM.5 n = 25). The dendrogram is reused from the immune clustering (Fig. 5a) to order the cell types. Immune clusters (rows) are sorted by the proportion of long-term survivors indicated in brackets. The color and size of bubbles indicate z-score scaled values of the mean abundance of cell types per cluster. Bubbles with a z-score of greater than or equal to 1 have a black border, and those with a z-score of greater than 0.5 but less than 1 have a gray border. Asterisks indicate Kruskal–Wallis test P values adjusted for multiple testing using Benjamini-Hochberg correction. Boxplots (right) summarize CIBERSORTx absolute scores of each cluster; points represent each sample, boxes show the interquartile range (25–75th percentiles), central lines indicate the median, and whiskers show the smallest/largest values within 1.5 times the interquartile range. b, Boxplots summarize numerical, clinical and genomic features by immune cluster (IMM.1 n = 32, IMM.2 n = 23, IMM.3 n = 22, IMM.4 n = 24, IMM.5 n = 25); points represent each sample, boxes show the interquartile range (25–75th percentiles), central lines indicate the median, whiskers show the smallest/largest values within 1.5 times the interquartile range, red triangles indicate the mean, and dotted lines join the means of each cluster to visualize the trend. The Kruskal–Wallis test P values displayed are Benjamini-Hochberg adjusted. Features are ordered by their significance and clusters are ordered by the proportion of long-term survivors. CD8 scores were available for n = 54 primary tumors as previously measured by immunohistochemistry23 and scored as density of CD8+ T cells (average cells/mm2, y axis) in the tumor epithelium (TE). HRD, homologous recombination deficiency; DEL, deletions; DUP; duplications; SV, structural variants; Mb, megabase; ITX, intrachromosomal rearrangements; LOH, loss-of-heterozygosity; INV, inversions.
Extended Data Fig. 9: Categorical features of immune clusters.
a, Proportion of patients with categorical features per cluster. Features are ordered by significance using Fisher’s exact test (two-sided) and the clusters are arranged by the proportion of long-term survivors. Features include homologous recombination (HR) status, homologous recombination deficiency (HRD) type, number of DNA repair pathway alterations, survival group (LTS, long-term survivor; MTS, moderate-term survivor; STS, short-term survivor), status at last follow-up (D, dead; P, progressed and alive; PF, progression-free and alive), self-reported smoking status, DeepCC molecular subtype (C1, mesenchymal; C2, immunoreactive; C4, differentiated; C5, proliferative), and neoadjuvant treatment (Y, yes; N, no). b, Proportion of patients affected by gene alterations per immune cluster. Genes are ordered by significance using Fisher’s exact test (two-sided) and clusters are ordered by the proportion of long-term survivors. The Fisher’s test P values displayed in (a) and (b) are Benjamini-Hochberg adjusted P values.
Supplementary Material
Acknowledgements
We thank P. Webb, K. Byth, R. Lupat, J. Ellul and the Peter MacCallum Cancer Centre Research Computing Facility for their contributions to the study. This work was supported by the U.S. Army Medical Research and Materiel Command Ovarian Cancer Research Program (Award No. W81XWH-16-2-0010 and W81XWH-21-1-0401), the National Health and Medical Research Council of Australia (1092856, 1117044 and 2008781 to D.D.L.B., and 1186505 to D.W.G.), and the U.S. National Cancer Institute (P30CA046592 for C.L.P. and P30CA008748 for M.C.P.). This research was made possible by generous support from the Border Ovarian Cancer Awareness Group, the Garvan Research Foundation, the Graf Family Foundation, Mrs Margaret Rose AM, Arthur Coombs and family, and the Piers K Fowler Fund. The Australian Ovarian Cancer Study (AOCS) gratefully acknowledges the cooperation of participating institutions in Australia and the contribution of study nurses, research assistants and all clinical and scientific collaborators. The complete AOCS Group can be found at www.aocstudy.org. We would like to thank all of the women who participated in the study. AOCS was supported by the U.S. Army Medical Research and Materiel Command (DAMD17-01-1-0729), The Cancer Council Victoria, Queensland Cancer Fund, The Cancer Council New South Wales, The Cancer Council South Australia, The Cancer Council Tasmania, The Cancer Foundation of Western Australia and the National Health and Medical Research Council of Australia (NHMRC; ID199600, ID400413, ID400281). AOCS gratefully acknowledges additional support from Ovarian Cancer Australia and the Peter MacCallum Cancer Foundation. We thank all the women who participated in the GynBiobank and gratefully acknowledge the Departments of Gynaecological Oncology, Medical Oncology and Anatomical Pathology at Westmead Hospital, Sydney. The Gynaecological Oncology Biobank at Westmead was funded by the NHMRC (ID310670, ID628903), the Cancer Institute NSW (12/RIG/1-17, 15/RIG/1-16) and the Department of Gynaecological Oncology, Westmead Hospital, and acknowledges financial support from the Sydney West Translational Cancer Research Centre, funded by the Cancer Institute NSW (15/TRC/1-01). E.L.C. was supported by NHMRC grant APP1161198. F.A.M.S. was supported by a Swiss National Foundation EarlyPostdoc Fellowship (P2BEP3-172246), Swiss Cancer Research Foundation grant BIL KFS-3942-08-2016 and a Professor Dr Max Cloëtta and Uniscientia Foundation grant. A.M.P. and J.D.B. were supported by Cancer Research UK (A22905). B.H.N. was supported by the BC Cancer Foundation, Canada’s Networks of Centres of Excellence (BioCanRx), Genome BC and the Canada Foundation for Innovation. D.D.L.B. was supported by the U.S. National Cancer Institute U54 program (U54CA209978).
S.F., K.A., N.T. and A.D. received grant funding from AstraZeneca for unrelated work. G.A.-Y. received grant funding from AstraZeneca and Roche-Genentech for unrelated work. M.F. declares honoraria for advisory boards AstraZeneca, GSK, Incyclix, Lilly, MSD, Novartis and Takeda; consultancy for AstraZeneca, Eisai and Novartis; speaker’s fee and travel from AstraZeneca; speaker’s fee from ACT Genomics; and institutional research funding from AstraZeneca, BeiGene, Novartis; all for unrelated work. J.D.B. received funding from Aprea and Clovis Oncology for unrelated work. D.D.L.B. received funding from AstraZeneca, Genentech-Roche and BeiGene for unrelated work.
Footnotes
Code availability
No custom code or software was used in the data analyses. All results can be replicated using publicly available tools and software. The tools and versions used are fully described in the Methods and Supplementary Information.
Competing interests
The remaining authors declare no competing interests.
Additional information
Extended data is available for this paper at https://doi.org/10.1038/s41588-022-01230-9.
Supplementary information The online version contains supplementary material available at https://doi.org/10.1038/s41588-022-01230-9.
Peer review information Nature Genetics thanks the anonymous reviewers for their contribution to the peer review of this work. Peer reviewer reports are available.
Data availability
ICGC datasets: Previously published WGS and RNA-seq data generated as part of the ICGC Ovarian Cancer project14 are available from the European Genome-phenome Archive (EGA) repository (https://ega-archive.org) as a single BAM file for each sample type (tumor/normal) under the accession code EGAD00001000877. Due to the sensitive nature of these patient data sets, access is subject to approval from the ICGC Data Access Compliance Office (https://docs.icgc.org/download/data-access/), an independent body who authorizes controlled access to ICGC sequencing data. ICGC SNP array and methylation data sets have been deposited into the Gene Expression Omnibus (GEO; https://www.ncbi.nlm.nih.gov/geo/) under accession code GSE65821, without access restrictions. ICGC gene count level transcriptomic data have been deposited into the GEO under accession code GSE209964.
MOCOG datasets: WGS, RNA-seq and SNP array data from long-term survivors generated as part of the MOCOG study have been deposited in the EGA repository under accession code EGAS00001005984. WGS and RNA-seq data are available as raw FASTQ files for each sample type (tumor/normal) and SNP array data are available as raw signal intensity files in text format for each sample type (tumor/normal). Access to patient sequence data can be gained for academic use through application to the independent Data Access Committee (dac@petermac.org). Responses to data requests will be provided within two weeks. Information on how to apply for access is available at the EGA under accession code EGAS00001005984. The MOCOG cohort raw methylation data sets have been submitted to the GEO under accession code GSE211687, with no access restrictions.
Uniformly processed somatic variant data from the ICGC and MOCOG cohorts have been deposited in Synapse under accession code syn34616347, and processed expression and methylation data from both cohorts have been submitted into the GEO under accession code GSE211687, without access restrictions.
Population frequencies of genetic variants can be accessed via the Genome Aggregation Database (gnomAD) at https://gnomad.broadinstitute.org/. Supporting evidence for pathogenicity of genomic alterations can be accessed via ClinVar (https://www.ncbi.nlm.nih.gov/clinvar/), BRCA Exchange (https://brcaexchange.org/) and the TP53 Database (https://tp53.isb-cgc.org/). The Ensembl ranked order of severity of variant consequences is available at: https://rn.ensembl.org/info/genome/variation/prediction/predicted_data.html. Precomputed TCGA ovarian serous cystadenocarcinoma survival analysis data can be downloaded from OncoLnc (http://www.oncolnc.org/). Mutational signature reference databases can be accessed via COSMIC (https://cancer.sanger.ac.uk/signatures/) and Signal (https://signal.mutationalsignatures.com/). The LM22 signature matrix used for immune cell deconvolution can be downloaded at https://cibersortx.stanford.edu/. The COSMIC Cancer Gene Census can be accessed at https://cancer.sanger.ac.uk/census. MSigDB hallmark gene sets can be accessed at https://www.gsea-msigdb.org/gsea/msigdb/. Illumina methylation probes that were filtered out due to poor performance (for example, cross-reactive or nonspecific probes) can be found at https://github.com/sirselim/illumina450k_filtering. Germline polymorphic sites for reference and variant allele read counts used in FACETS analysis can be found at ftp://ftp.ncbi.nih.gov/snp/organisms/human_9606_b151_GRCh37p13/VCF/common_all_20180423.vcf.gz. The gene transfer format used for annotation and RNA-seq counts is available at ftp://ftp.ensembl.org/pub/grch37/release-92/. All other data are available within the article and its supplementary information files.
References
- 1.Millstein J. et al. Prognostic gene expression signature for high-grade serous ovarian cancer. Ann. Oncol 31, 1240–1250 (2020). [DOI] [PMC free article] [PubMed] [Google Scholar]
- 2.Hoppenot C, Eckert MA, Tienda SM & Lengyel E. Who are the long-term survivors of high grade serous ovarian cancer? Gynecol. Oncol 148, 204–212 (2018). [DOI] [PubMed] [Google Scholar]
- 3.Fago-Olsen CL et al. Does neoadjuvant chemotherapy impair long-term survival for ovarian cancer patients? A nationwide Danish study. Gynecol. Oncol 132, 292–298 (2014). [DOI] [PubMed] [Google Scholar]
- 4.Chi DS et al. What is the optimal goal of primary cytoreductive surgery for bulky stage IIIC epithelial ovarian carcinoma (EOC)? Gynecol. Oncol 103, 559–564 (2006). [DOI] [PubMed] [Google Scholar]
- 5.Horowitz NS et al. Does aggressive surgery improve outcomes? Interaction between preoperative disease burden and complex surgery in patients with advanced-stage ovarian cancer: an analysis of GOG 182. J. Clin. Oncol 33, 937–943 (2015). [DOI] [PMC free article] [PubMed] [Google Scholar]
- 6.Alsop K. et al. BRCA mutation frequency and patterns of treatment response in BRCA mutation-positive women with ovarian cancer: A report from the Australian ovarian cancer study group. J. Clin. Oncol 30, 2654–2663 (2012). [DOI] [PMC free article] [PubMed] [Google Scholar]
- 7.The Cancer Genome Atlas Research Network. Integrated genomic analysis of ovarian cancer. Nature 474, 609–615 (2011). [DOI] [PMC free article] [PubMed] [Google Scholar]
- 8.Walsh T. et al. Mutations in 12 genes for inherited ovarian, fallopian tube, and peritoneal carcinoma identified by massively parallel sequencing. Proc. Natl Acad. Sci. USA 108, 18032–18037 (2011). [DOI] [PMC free article] [PubMed] [Google Scholar]
- 9.Ciriello G. et al. Emerging landscape of oncogenic signatures across human cancers. Nat. Genet 45, 1127–1133 (2013). [DOI] [PMC free article] [PubMed] [Google Scholar]
- 10.Ahmed AA et al. Driver mutations in TP53 are ubiquitous in high grade serous carcinoma of the ovary. J. Pathol 221, 49–56 (2010). [DOI] [PMC free article] [PubMed] [Google Scholar]
- 11.Tothill RW et al. Novel molecular subtypes of serous and endometrioid ovarian cancer linked to clinical outcome. Clin. Cancer Res 14, 5198–5208 (2008). [DOI] [PubMed] [Google Scholar]
- 12.Etemadmoghadam D. et al. Integrated genome-wide DNA copy number and expression analysis identifies distinct mechanisms of primary chemoresistance in ovarian carcinomas. Clin. Cancer Res 15, 1417–1427 (2009). [DOI] [PMC free article] [PubMed] [Google Scholar]
- 13.Hwang WT, Adams SF, Tahirovic E, Hagemann IS & Coukos G. Prognostic significance of tumor-infiltrating T cells in ovarian cancer: A meta-analysis. Gynecol. Oncol 124, 192–198 (2012). [DOI] [PMC free article] [PubMed] [Google Scholar]
- 14.Patch AM et al. Whole-genome characterization of chemoresistant ovarian cancer. Nature 521, 489–494 (2015). [DOI] [PubMed] [Google Scholar]
- 15.Wang YK et al. Genomic consequences of aberrant DNA repair mechanisms stratify ovarian cancer histotypes. Nat. Genet 49, 856–864 (2017). [DOI] [PubMed] [Google Scholar]
- 16.Macintyre G. et al. Copy number signatures and mutational processes in ovarian carcinoma. Nat. Genet 50, 1262–1270 (2018). [DOI] [PMC free article] [PubMed] [Google Scholar]
- 17.Pennington KP et al. Germline and somatic mutations in homologous recombination genes predict platinum response and survival in ovarian, fallopian tube, and peritoneal carcinomas. Clin. Cancer Res 20, 764–775 (2014). [DOI] [PMC free article] [PubMed] [Google Scholar]
- 18.Farmer H. et al. Targeting the DNA repair defect in BRCA mutant cells as a therapeutic strategy. Nature 434, 917–921 (2005). [DOI] [PubMed] [Google Scholar]
- 19.Fong PC et al. Poly(ADP)-ribose polymerase inhibition: frequent durable responses in BRCA carrier ovarian cancer correlating with platinum-free interval. J. Clin. Oncol 28, 2512–2519 (2010). [DOI] [PubMed] [Google Scholar]
- 20.Swisher EM et al. Rucaparib in relapsed, platinum-sensitive high-grade ovarian carcinoma (ARIEL2 Part 1): an international, multicentre, open-label, phase 2 trial. Lancet Oncol. 18, 75–87 (2017). [DOI] [PubMed] [Google Scholar]
- 21.Bolton KL et al. Association between BRCA1 and BRCA2 mutations and survival in women with invasive epithelial ovarian cancer. JAMA 307, 382–390 (2012). [DOI] [PMC free article] [PubMed] [Google Scholar]
- 22.Candido-dos-Reis FJ et al. Germline mutation in BRCA1 or BRCA2 and ten-year survival for women diagnosed with epithelial ovarian cancer. Clin. Cancer Res 21, 652–657 (2015). [DOI] [PMC free article] [PubMed] [Google Scholar]
- 23.Garsed DW et al. Homologous recombination DNA repair pathway disruption and retinoblastoma protein loss are associated with exceptional survival in high-grade serous ovarian cancer. Clin. Cancer Res 24, 569–580 (2018). [DOI] [PubMed] [Google Scholar]
- 24.Ciriello G, Cerami E, Sander C. & Schultz N. Mutual exclusivity analysis identifies oncogenic network modules. Genome Res. 22, 398–406 (2012). [DOI] [PMC free article] [PubMed] [Google Scholar]
- 25.Etemadmoghadam D. et al. Synthetic lethality between CCNE1 amplification and loss of BRCA1. Proc. Natl Acad. Sci. USA 110, 19489–19494 (2013). [DOI] [PMC free article] [PubMed] [Google Scholar]
- 26.Newman AM et al. Determining cell type abundance and expression from bulk tissues with digital cytometry. Nat. Biotechnol 37, 773–782 (2019). [DOI] [PMC free article] [PubMed] [Google Scholar]
- 27.Miller RE et al. ESMO recommendations on predictive biomarker testing for homologous recombination deficiency and PARP inhibitor benefit in ovarian cancer. Ann. Oncol 31, 1606–1622 (2020). [DOI] [PubMed] [Google Scholar]
- 28.Nguyen L, Martens WMJ, Van Hoeck A. & Cuppen E. Pan-cancer landscape of homologous recombination deficiency. Nat. Commun 11, 1–12 (2020). [DOI] [PMC free article] [PubMed] [Google Scholar]
- 29.Joshi PM, Sutor SL, Huntoon CJ & Karnitz LM Ovarian cancer-associated mutations disable catalytic activity of CDK12, a kinase that promotes homologous recombination repair and resistance to cisplatin and poly(ADP-ribose) polymerase inhibitors. J. Biol. Chem 289, 9247–9253 (2014). [DOI] [PMC free article] [PubMed] [Google Scholar]
- 30.Anaya J. OncoLnc: Linking TCGA survival data to mRNAs, miRNAs, and lncRNAs. Peer J. Comp. Sci 2, e67 (2016). [Google Scholar]
- 31.Norquist B. et al. Secondary somatic mutations restoring BRCA1/2 predict chemotherapy resistance in hereditary ovarian carcinomas. J. Clin. Oncol 29, 3008–3015 (2011). [DOI] [PMC free article] [PubMed] [Google Scholar]
- 32.Alexandrov LB et al. The repertoire of mutational signatures in human cancer. Nature 578, 94–101 (2020). [DOI] [PMC free article] [PubMed] [Google Scholar]
- 33.Degasperi A. et al. A practical framework and online tool for mutational signature analyses show inter-tissue variation and driver dependencies. Nat. Cancer 1, 249–263 (2020). [DOI] [PMC free article] [PubMed] [Google Scholar]
- 34.Popova T. et al. Ovarian cancers harboring inactivating mutations in CDK12 display a distinct genomic instability pattern characterized by large tandem duplications. Cancer Res. 76, 1882–1891 (2016). [DOI] [PubMed] [Google Scholar]
- 35.Wu YM et al. Inactivation of CDK12 delineates a distinct immunogenic class of advanced prostate cancer. Cell 173, 1770–1782.e1714 (2018). [DOI] [PMC free article] [PubMed] [Google Scholar]
- 36.Funnell T. et al. Integrated structural variation and point mutation signatures in cancer genomes using correlated topic models. PLoS Comput. Biol 15, 1–24 (2019). [DOI] [PMC free article] [PubMed] [Google Scholar]
- 37.Zhang L. et al. Intratumoral T cells, recurrence, and survival in epithelial ovarian cancer. N. Engl. J. Med 348, 203–213 (2003). [DOI] [PubMed] [Google Scholar]
- 38.Ovarian Tumor Tissue Analysis (OTTA) Consortium. Dose-response association of CD8+ tumor-infiltrating lymphocytes and survival time in high-grade serous ovarian cancer. JAMA Oncol. 3, e173290 (2017). [DOI] [PMC free article] [PubMed] [Google Scholar]
- 39.Jiménez-Sánchez A. et al. Heterogeneous tumor-immune microenvironments among differentially growing metastases in an ovarian cancer patient. Cell 170, 927–938.e920 (2017). [DOI] [PMC free article] [PubMed] [Google Scholar]
- 40.Yang SYC et al. Landscape of genomic alterations in high-grade serous ovarian cancer from exceptional long- and short-term survivors. Genome Med 10, 81 (2018). [DOI] [PMC free article] [PubMed] [Google Scholar]
- 41.Korotkevich G. et al. Fast gene set enrichment analysis. Preprint at bioRxiv 10.1101/060012 (2021). [DOI]
- 42.Liberzon A. et al. The molecular signatures database hallmark gene set collection. Cell Syst. 1, 417–425 (2015). [DOI] [PMC free article] [PubMed] [Google Scholar]
- 43.Saner FAM et al. Going to extremes: determinants of extraordinary response and survival in patients with cancer. Nat. Rev. Cancer 19, 339–348 (2019). [DOI] [PMC free article] [PubMed] [Google Scholar]
- 44.Wheeler DA et al. Molecular features of cancers exhibiting exceptional responses to treatment. Cancer Cell 39, 38–53.e37 (2021). [DOI] [PMC free article] [PubMed] [Google Scholar]
- 45.Moore K. et al. Maintenance olaparib in patients with newly diagnosed advanced ovarian cancer. N. Engl. J. Med 379, 2495–2505 (2018). [DOI] [PubMed] [Google Scholar]
- 46.Ewing A. et al. Structural Variants at the BRCA1/2 loci are a common source of homologous repair deficiency in high-grade serous ovarian carcinoma. Clin. Cancer Res 27, 3201–3214 (2021). [DOI] [PMC free article] [PubMed] [Google Scholar]
- 47.Swisher EM et al. Characterization of patients with long-term responses to rucaparib treatment in recurrent ovarian cancer. Gynecol. Oncol 163, 490–497 (2021). [DOI] [PubMed] [Google Scholar]
- 48.Velez-Cruz R. et al. RB localizes to DNA double-strand breaks and promotes DNA end resection and homologous recombination through the recruitment of BRG1. Genes Dev. 30, 2500–2512 (2016). [DOI] [PMC free article] [PubMed] [Google Scholar]
- 49.Fan W. et al. MET-independent lung cancer cells evading EGFR kinase inhibitors are therapeutically susceptible to BH3 mimetic agents. Cancer Res. 71, 4494–4505 (2011). [DOI] [PMC free article] [PubMed] [Google Scholar]
- 50.Cole A. NFATC4 promotes quiescence and chemotherapy resistance in ovarian cancer. JCI Insight 5, e131486 (2020). [DOI] [PMC free article] [PubMed] [Google Scholar]
- 51.Sieh W. et al. Hormone-receptor expression and ovarian cancer survival: an Ovarian Tumor Tissue Analysis consortium study. Lancet Oncol. 14, 853–862 (2013). [DOI] [PMC free article] [PubMed] [Google Scholar]
- 52.Gersekowski K. et al. Germline BRCA variants, lifestyle and ovarian cancer survival. Gynecol. Oncol 165, 437–445 (2022). [DOI] [PMC free article] [PubMed] [Google Scholar]
- 53.Jung YS et al. Impact of smoking on human natural killer cell activity: A large cohort study. J. Cancer Prev 25, 13–20 (2020). [DOI] [PMC free article] [PubMed] [Google Scholar]
- 54.Cress RD, Chen YS, Morris CR, Petersen M. & Leiserowitz GS Characteristics of long-term survivors of epithelial ovarian cancer. Obstet. Gynecol 126, 491–497 (2015). [DOI] [PMC free article] [PubMed] [Google Scholar]
- 55.Schröder J, Corbin V. & Papenfuss AT HYSYS: Have you swapped your samples? Bioinformatics 33, 596–598 (2017). [DOI] [PMC free article] [PubMed] [Google Scholar]
- 56.Song S. et al. qpure: A tool to estimate tumor cellularity from genome-wide single-nucleotide polymorphism profiles. PLoS One 7, 5–11 (2012). [DOI] [PMC free article] [PubMed] [Google Scholar]
- 57.Van Loo P. et al. Allele-specific copy number analysis of tumors. Proc. Natl Acad. Sci. USA 107, 16910–16915 (2010). [DOI] [PMC free article] [PubMed] [Google Scholar]
- 58.Wingett SW & Andrews S. FastQ Screen: A tool for multi-genome mapping and quality control. F1000Res. 7, 1338 (2018). [DOI] [PMC free article] [PubMed] [Google Scholar]
- 59.Li H. & Durbin R. Fast and accurate short read alignment with Burrows-Wheeler transform. Bioinformatics 25, 1754–1760 (2009). [DOI] [PMC free article] [PubMed] [Google Scholar]
- 60.McKenna A. et al. The Genome Analysis Toolkit: a MapReduce framework for analyzing next-generation DNA sequencing data. Genome Res. 20, 1297–1303 (2010). [DOI] [PMC free article] [PubMed] [Google Scholar]
- 61.Shen R. & Seshan VE FACETS: Allele-specific copy number and clonal heterogeneity analysis tool for high-throughput DNA sequencing. Nucleic Acids Res. 44, 1–9 (2016). [DOI] [PMC free article] [PubMed] [Google Scholar]
- 62.Lai Z. et al. VarDict: a novel and versatile variant caller for next-generation sequencing in cancer research. Nucleic Acids Res. 44, e108 (2016). [DOI] [PMC free article] [PubMed] [Google Scholar]
- 63.Kim S. et al. Strelka2: fast and accurate calling of germline and somatic variants. Nat. Methods 15, 591–594 (2018). [DOI] [PubMed] [Google Scholar]
- 64.Koboldt DC et al. VarScan 2: somatic mutation and copy number alteration discovery in cancer by exome sequencing. Genome Res. 22, 568–576 (2012). [DOI] [PMC free article] [PubMed] [Google Scholar]
- 65.Danecek P. et al. Twelve years of SAMtools and BCFtools. Gigascience 10, 1–4 (2021). [DOI] [PMC free article] [PubMed] [Google Scholar]
- 66.Tan A, Abecasis GR & Kang HM Unified representation of genetic variants. Bioinformatics 31, 2202–2204 (2015). [DOI] [PMC free article] [PubMed] [Google Scholar]
- 67.Shyr C. et al. FLAGS, frequently mutated genes in public exomes. BMC Med. Genomics 7, 64 (2014). [DOI] [PMC free article] [PubMed] [Google Scholar]
- 68.Chen X. et al. Manta: Rapid detection of structural variants and indels for germline and cancer sequencing applications. Bioinformatics 32, 1220–1222 (2016). [DOI] [PubMed] [Google Scholar]
- 69.Cameron DL et al. GRIDSS: Sensitive and specific genomic rearrangement detection using positional de Bruijn graph assembly. Genome Res. 27, 2050–2060 (2017). [DOI] [PMC free article] [PubMed] [Google Scholar]
- 70.Wala JA et al. SvABA: Genome-wide detection of structural variants and indels by local assembly. Genome Res. 28, 581–591 (2018). [DOI] [PMC free article] [PubMed] [Google Scholar]
- 71.Lawrence M, Gentleman R. & Carey V. rtracklayer: An R package for interfacing with genome browsers. Bioinformatics 25, 1841–1842 (2009). [DOI] [PMC free article] [PubMed] [Google Scholar]
- 72.Bielski CM et al. Genome doubling shapes the evolution and prognosis of advanced cancers. Nat. Genet 50, 1189–1195 (2018). [DOI] [PMC free article] [PubMed] [Google Scholar]
- 73.Robinson JT et al. Integrative genomics viewer. Nat. Biotechnol 29, 24–26 (2011). [DOI] [PMC free article] [PubMed] [Google Scholar]
- 74.Sztupinszki Z. et al. Migrating the SNP array-based homologous recombination deficiency measures to next generation sequencing data of breast cancer. NPJ Breast Cancer 4, 16 (2018). [DOI] [PMC free article] [PubMed] [Google Scholar]
- 75.Nariai N. et al. HLA-VBSeq: Accurate HLA typing at full resolution from whole-genome sequencing data. BMC Genomics 16, 1–6 (2015). [DOI] [PMC free article] [PubMed] [Google Scholar]
- 76.Robinson J. et al. IPD-IMGT/HLA Database. Nucleic Acids Res. 48, D948–D955 (2020). [DOI] [PMC free article] [PubMed] [Google Scholar]
- 77.Hundal J. et al. PVACtools: A computational toolkit to identify and visualize cancer neoantigens. Cancer Immunol. Res 8, 409–420 (2020). [DOI] [PMC free article] [PubMed] [Google Scholar]
- 78.Dobin A. et al. STAR: Ultrafast universal RNA-seq aligner. Bioinformatics 29, 15–21 (2013). [DOI] [PMC free article] [PubMed] [Google Scholar]
- 79.Wang L, Wang S. & Li W. RSeQC: Quality control of RNA-seq experiments. Bioinformatics 28, 2184–2185 (2012). [DOI] [PubMed] [Google Scholar]
- 80.Anders S, Pyl PT & Huber W. HTSeq-A Python framework to work with high-throughput sequencing data. Bioinformatics 31, 166–169 (2015). [DOI] [PMC free article] [PubMed] [Google Scholar]
- 81.Robinson MD, McCarthy DJ & Smyth GK edgeR: A Bioconductor package for differential expression analysis of digital gene expression data. Bioinformatics 26, 139–140 (2009). [DOI] [PMC free article] [PubMed] [Google Scholar]
- 82.Ritchie ME et al. Limma powers differential expression analyses for RNA-sequencing and microarray studies. Nucleic Acids Res. 43, e47 (2015). [DOI] [PMC free article] [PubMed] [Google Scholar]
- 83.Aryee MJ et al. Minfi: a flexible and comprehensive Bioconductor package for the analysis of Infinium DNA methylation microarrays. Bioinformatics 30, 1363–1369 (2014). [DOI] [PMC free article] [PubMed] [Google Scholar]
- 84.Fortin J-P et al. Functional normalization of 450k methylation array data improves replication in large cancer studies. Genome Biol. 15, 503 (2014). [DOI] [PMC free article] [PubMed] [Google Scholar]
- 85.Leek JT, Johnson WE, Parker HS, Jaffe AE & Storey JD The sva package for removing batch effects and other unwanted variation in high-throughput experiments. Bioinformatics 28, 882–883 (2012). [DOI] [PMC free article] [PubMed] [Google Scholar]
Associated Data
This section collects any data citations, data availability statements, or supplementary materials included in this article.
Supplementary Materials
Data Availability Statement
ICGC datasets: Previously published WGS and RNA-seq data generated as part of the ICGC Ovarian Cancer project14 are available from the European Genome-phenome Archive (EGA) repository (https://ega-archive.org) as a single BAM file for each sample type (tumor/normal) under the accession code EGAD00001000877. Due to the sensitive nature of these patient data sets, access is subject to approval from the ICGC Data Access Compliance Office (https://docs.icgc.org/download/data-access/), an independent body who authorizes controlled access to ICGC sequencing data. ICGC SNP array and methylation data sets have been deposited into the Gene Expression Omnibus (GEO; https://www.ncbi.nlm.nih.gov/geo/) under accession code GSE65821, without access restrictions. ICGC gene count level transcriptomic data have been deposited into the GEO under accession code GSE209964.
MOCOG datasets: WGS, RNA-seq and SNP array data from long-term survivors generated as part of the MOCOG study have been deposited in the EGA repository under accession code EGAS00001005984. WGS and RNA-seq data are available as raw FASTQ files for each sample type (tumor/normal) and SNP array data are available as raw signal intensity files in text format for each sample type (tumor/normal). Access to patient sequence data can be gained for academic use through application to the independent Data Access Committee (dac@petermac.org). Responses to data requests will be provided within two weeks. Information on how to apply for access is available at the EGA under accession code EGAS00001005984. The MOCOG cohort raw methylation data sets have been submitted to the GEO under accession code GSE211687, with no access restrictions.
Uniformly processed somatic variant data from the ICGC and MOCOG cohorts have been deposited in Synapse under accession code syn34616347, and processed expression and methylation data from both cohorts have been submitted into the GEO under accession code GSE211687, without access restrictions.
Population frequencies of genetic variants can be accessed via the Genome Aggregation Database (gnomAD) at https://gnomad.broadinstitute.org/. Supporting evidence for pathogenicity of genomic alterations can be accessed via ClinVar (https://www.ncbi.nlm.nih.gov/clinvar/), BRCA Exchange (https://brcaexchange.org/) and the TP53 Database (https://tp53.isb-cgc.org/). The Ensembl ranked order of severity of variant consequences is available at: https://rn.ensembl.org/info/genome/variation/prediction/predicted_data.html. Precomputed TCGA ovarian serous cystadenocarcinoma survival analysis data can be downloaded from OncoLnc (http://www.oncolnc.org/). Mutational signature reference databases can be accessed via COSMIC (https://cancer.sanger.ac.uk/signatures/) and Signal (https://signal.mutationalsignatures.com/). The LM22 signature matrix used for immune cell deconvolution can be downloaded at https://cibersortx.stanford.edu/. The COSMIC Cancer Gene Census can be accessed at https://cancer.sanger.ac.uk/census. MSigDB hallmark gene sets can be accessed at https://www.gsea-msigdb.org/gsea/msigdb/. Illumina methylation probes that were filtered out due to poor performance (for example, cross-reactive or nonspecific probes) can be found at https://github.com/sirselim/illumina450k_filtering. Germline polymorphic sites for reference and variant allele read counts used in FACETS analysis can be found at ftp://ftp.ncbi.nih.gov/snp/organisms/human_9606_b151_GRCh37p13/VCF/common_all_20180423.vcf.gz. The gene transfer format used for annotation and RNA-seq counts is available at ftp://ftp.ensembl.org/pub/grch37/release-92/. All other data are available within the article and its supplementary information files.


