

Abstract
Motivation
Lead identification is a fundamental step to prioritize candidate compounds for downstream drug discovery process. Machine learning (ML) and deep learning (DL) approaches are widely used to identify lead compounds using both chemical property and experimental information. However, ML or DL methods rarely consider compound similarity information directly since ML and DL models use abstract representation of molecules for model construction. Alternatively, data mining approaches are also used to explore chemical space with drug candidates by screening undesirable compounds. A major challenge for data mining approaches is to develop efficient data mining methods that search large chemical space for desirable lead compounds with low false positive rate.
Results
In this work, we developed a network propagation (NP) based data mining method for lead identification that performs search on an ensemble of chemical similarity networks. We compiled 14 fingerprint-based similarity networks. Given a target protein of interest, we use a deep learning-based drug target interaction model to narrow down compound candidates and then we use network propagation to prioritize drug candidates that are highly correlated with drug activity score such as IC50. In an extensive experiment with BindingDB, we showed that our approach successfully discovered intentionally unlabeled compounds for given targets. To further demonstrate the prediction power of our approach, we identified 24 candidate leads for CLK1. Two out of five synthesizable candidates were experimentally validated in binding assays. In conclusion, our framework can be very useful for lead identification from very large compound databases such as ZINC.
MSC: 0000, 1111
Keywords: Lead identification, Data mining, Chemical network construction, Network propagation
Graphical abstract

Highlights
-
•
We developed a network-based lead identification framework for a target of interest.
-
•
We construct ensembled chemical similarity networks and identify unknown compounds.
-
•
Our framework outperforms baselines on drug activity score correlation.
-
•
In a case study of CLK1, two out of five candidates were validated in binding assays.
1. Introduction
Drug discovery is a complex and time-consuming process that often requires more than 10 years of developmental pipelines [21], [2]. After a target protein of interest is determined, the main task at the pre-clinical stages of drug discovery is lead identification to prioritize drug candidates. Since lead identification is an important task, a number of computational and experimental techniques have been developed. Among them are high-throughput screening, molecular docking (MD) simulation, or virtual screening [46].
Recently, machine learning (ML) approaches have advanced technologies for lead identification by providing a more efficient and accurate prediction power on large-scale data [69]. ML can help optimize the efficacy and specificity for identifying potential drug candidates by exploring chemical space [60], [39], [7]. ML models even can generate testable hypotheses by identifying new drug targets or chemical scaffolds and providing guidance for the lead optimization process [49]. On the other hand, deep learning (DL) approaches recently gained great attention for its unprecedented data modeling power to define the decision boundary by predicting protein-ligand binding affinities [54], or by generating novel chemical structures [5], [28], [68], [55].
A seminal work by Zhavoronkov et al. [68] used a variational autoencoder (VAE)-based generative model in a reinforcement learning (RL) framework. To guide the chemical space for de novo molecule generation, compounds in the ZINC Clean collection were pre-trained by the tensor train decomposition technique. They also performed extensive experimental validations on the predicted molecules. Although they used the ZINC database for pre-training, this method is not designed to consider existing molecules directly in terms of compound structure similarity information. Network-based drug repurposing methods have also been successfully developed, demonstrating the power of artificial intelligence (AI) for lead identification [53], [55].
1.1. Lead identification as data mining problem on chemical similarity networks
Data mining approaches have been widely used in numerous application domains [63]. For drug discovery, data mining approaches have also long been used. An open-source data mining tool (KNIME) [4] has been used for various drug discovery problems, ranging from target identification to lead optimization [41]. Recently, data mining approaches have achieved remarkable success in identifying lead compounds from the chemical databases. Stokes et al. [55] identified eight antibacterial drugs that differ structurally from known antibiotics using a directed message-passing neural network (D-MPNN) model [65] that is trained using 3,225 compounds that are already known to have E. coli growth inhibition. Słabicki et al. [52] discovered a molecular glue candidate, CR8, as a molecular glue of E3 ligase and Cyclin K through systematically mining databases for correlations between the cytotoxicity of 4,518 clinical and preclinical small molecules and the expression levels of E3 ligase components across hundreds of human cancer cell lines.
However, these successful data mining approaches did not utilize compound “structure similarity” information explicitly and also require additional experimental data such as growth inhibition for E. coli and gene expression data in the context of cytotoxicity. Data mining of lead identification requires enumeration and evaluation of all compounds in large databases such as 1.3 billion (of which 736 million are lead-like) purchasable compounds at ZINC20 [23], 144 million compounds compiled at PubChem [29], and 977 million enumerated drug-like compounds at GDB-13 [6]. Thus, we need a new data mining approach for identifying probable drug candidates with an efficient exploration strategy on chemical space starting with known molecules [15]. In this work, we propose a more general data mining approach that utilizes compound “structure similarity” information explicitly and requires only publicly available general databases.
1.2. Problem statement
Given a set Q of compounds to be explored and a set C of verified compounds interacting with a target protein p, the lead identification problem is to find new lead compounds in Q that are interact with p. That is, the lead identification problem is to prioritize the compounds in Q according to their interaction strength with p. In other words, the main task is to consider “all” compounds in Q, e.g., ZINC, starting with information of a small number of compounds in C that are generally available in public databases such as BindingDB. For example, 10 million drug-like compounds of ZINC are used as Q, and 298 compounds interacting with p in BindingDB are used as C. Table 1 lists the notations frequently used in the paper.
Table 1.
Frequently used notations.
| Symbol | Description |
|---|---|
| Q | Set of compounds to be prioritized |
| C | Set of compounds that interact with a target protein p |
1.3. Challenges
The main goal of lead identification is to prioritize drug-like compounds with sufficient biochemical activity for given targets. The following challenges are addressed in this study:
Chemical space is too large to search for lead compounds. Given the target protein and available experimental values (i.e. IC50), we first have to narrow down the candidate search space for efficient data mining. However, as mentioned above, chemical space in benchmark databases is extremely large, ranging from 144 million compounds compiled at PubChem [29] to 1.3 billion (of which 736 million are lead-like) purchasable compounds at ZINC20 [23]. In our study, we address this issue by constructing and utilizing dual-boundary of chemical space for in silico screening (Step 1 in Section 1.4).
There are many chemical similarity measures for compounds. Which one should be used for lead identification? Various similarity measures are developed for chemical compounds. Thus, there is bias from the choice of the descriptors or features, the choice of similarity measures, and the datasets used. There are three major categories of compound similarity measures that represent chemical compounds: structure-based fingerprints, molecular descriptors, and deep learning-based embedding methods [33]. Presence of specific substructures is important in drug interactions [19] and pharmacokinetic properties [50], while deep learning-based approaches are widely accepted for general purpose embeddings [25], [66], [11]. Thus, there can be bias depending on the choice of descriptors used for developing machine learning models [48]. Chemical similarity methods are used to compare and rank compounds based on their structural and chemical properties. Different methods have been developed to calculate chemical similarities, such as Tanimoto similarity, and Euclidean distance. Tanimoto similarity focuses on the presence or absence of certain features, while Euclidean distance considers the quantitative difference in all of the features. Thus, each method has its own assumptions and limitations, which can lead to bias in the similarity measures [34]. In addition, the dataset used for calculating the similarity may introduce bias, as the compounds in the dataset will be representative of certain cheminformatics purposes [32], or sufficiently generalizable for pre-training deep neural network models [16]. In our study, we address this issue by constructing and utilizing 14 chemical similarity networks (Step2 in Section 1.4).
Can data mining process identify lead compounds for poorly characterized target proteins? When using experimental values in identifying lead compounds, we need to use both chemical similarity network and drug-target interaction (DTI) data information. Like other chemical and biological data resources, drug-target interaction (DTI) data is also highly imbalanced in labels [14]. In other words, popular ligands or targets are extensively studied to build a densely connected network. Efforts were made to address the label imbalance issue to identify lead compounds for poorly characterized targets where the number of verified compounds for a protein target p, , is small. In this case, training DL and ML models with is quite difficult. Constructing effective decision boundaries using ML or DL is challenging because there is only a small number of compounds known to be active for a target protein and the task is to search for candidates in the huge and complex chemical space of databases such as ChEMBL [13] or PubChem, which is known as data gap issue [35], [67]. We view our similarity-based data mining framework as an effective way to address this data gap issue by determining associations between compounds with known activities and a large number of uncharacterized compounds. We argue that, in this case, similarity-based data mining techniques can be much more effective. In our study, we show that our network propagation approach works better than widely used nearest neighbor methods (See experimental results in Section 3.3).
How can we reduce false positives in drug candidates? Existing virtual screening methods often suffer from many false positives. A study by Adeshina et al. [1] achieved only 12% of success rate in its top-scoring compounds when tested with biochemical experimental procedures. Serial ZINC databases have compiled compound subset libraries excluding pan-assay interference compounds (PAINS) to reduce false positives in high-throughput screening (HTS) by defining 86 structural alerts [9]. In ATC code, drugs of the same code often share high structural similarity [64]. This is because, as synthetic drugs do not naturally occur/are not in an evolutionary sense, but they are designed to maximize efficacy and minimize side effects by introducing minor/subtle changes in peripheral substructures, remaining the backbone structures. Though similarity-based methods were successful in predicting in silico drug labels, they suffer from many false positives. In a drug-ATC correlation analysis, more than 40% of drug-ATC pairs were not identified in an external data set. We note that using multiple types of similarity measures showed improved performance by reducing false positives and negatives [34]. Moreover, currently available data mining methods on early-stage drug discovery process are trying to reduce false positive rate on datasets with highly imbalanced class labels [59], [51], [43]. Additionally, it is helpful to use multiple descriptors which can provide us with a more comprehensive view of the chemical space of a compound dataset [37]. In our study, we address this issue by prioritizing lead candidates on the ensemble of 14 chemical similarity networks with network propagation (Step 3 in Section 1.4).
1.4. Our approach
We developed a data mining search framework that identifies leads for given a target protein based on chemical similarity networks. Our data mining search framework produced quite promising results by addressing the aforementioned technical challenges. The major three steps of our approach are 1) Constructing a dual boundary on chemical space using both DTI and drug-likeness information, 2) Building an ensemble of chemical similarity networks, and 3) Exploring the enriched chemical space using network propagation to prioritize drug candidates. Details on our approach are as follows:
Step 1: Construction of dual-boundary of chemical space We defined two types of boundaries for the chemical space: (1) drug-like and (2) target-specific chemical spaces. Drug-like compounds were retrieved from the ZINC database that curated millions of peer-reviewed compounds in terms of drug-likeness and specified chemical properties [22]. Target-specific drug candidates were identified using an ensemble-based DL approach for DTI [36].
Sep 2: Ensemble of chemical similarity networks We used 14 fingerprint methods to calculate similarity among chemical compounds in the reduced chemical space from the previous step. In our study, to select suitable similarity metrics of chemical networks for lead identification, the fingerprint-based methods are evaluated using public DTI benchmark datasets. In the end, there are no perfect similarity measures for chemical compounds and we used all 14 networks in an ensemble form.
Step 3: Prioritization of candidates by network propagation We used network propagation (NP) to simulate the impact of known ligand-target information on the set of 14 large-scale similarity networks. NP is a computational method for analyzing and propagating information of knowledge as seed through networks. Cowen et al. [8] showed the effectiveness of NP for building biological networks from various biological datasets, statistical analysis of these networks, and visualization tools. The method leverages the whole structure of a network to propagate information, which can lead to more accurate predictions or identifications of key nodes. In addition, NP can identify nodes that are not directly connected to the seed nodes but are important or relevant. These characteristics of NP are very well suited for lead compound identification because NP can aggregate neighborhood information along multiple paths rather than relying on direct neighbors. We aggregated the NP results of 14 large-scale similarity networks to prioritize drug candidates. Among the 10,082,034 compounds in the initial chemical space, we were able to choose 24 highly probable lead candidates for experimental validation.
2. Materials and methods
An overview of our method is illustrated in Fig. 1. Initially, chemical compounds are collected from public chemical databases (Section 2.1). The compounds are screened by state-of-the-art drug-target interaction models to select lead candidates that are likely to interact with a target protein (Section 2.2). Then, a chemical similarity network is constructed by each fingerprint-based method for the selected candidates (Section 2.3). For each network, candidates in the network are prioritized using network propagation with known compounds information related to the target of interest and then these candidate ranking results are aggregated to determine final lead candidates (Section 2.5). Each part is detailed in the following sections.
Fig. 1.

Overview of our framework for lead identification that is based on network-based data mining from a large chemical landscape. (A) In silico screening: an ensemble of drug-target interaction (DTI) models is used to identify target-specific potential ligand candidates. (B) Construction of 14 chemical networks using similarity-based methods: Edges are determined by all pair-wise chemical similarities using 14 different chemical similarity measures. By combining corresponding nodes and edges, target-specific chemical networks are constructed. (C) Network propagation (NP) for prioritizing lead candidates: There are two essential components of NP: seeds and chemical similarity networks. Given the seeds from BindingDB and networks from (B), NP prioritizes every chemical compound in the networks. (D) Generation of a prioritized list and experimental validation. By aggregating the prioritized results from 14 target-specific networks, lead compounds are identified. To confirm the predictive power of our search framework, we performed enzyme assay for identified leads.
2.1. Datasets
Public chemical datasets were utilized to collect initial chemical compounds for identifying lead compounds. ZINC20 provides 1.3 billion purchasable compounds and categorizes them according to their chemical properties and activities. Specifically, we downloaded Simplified Molecular Input Line Entry System (SMILES) data for 10,082,034 compounds that are included in the clean group, from ZINC20 website (https://zinc20.docking.org/). These compounds were used for the lead identification problem and they were screened in silico for their interacting activity with a target protein, and lead candidates were identified.
Public protein-ligand binding datasets were utilized to optimize chemical networks and evaluate the performance of our approach. 990,630 drug-target pairs (548,633 drugs and 5,077 proteins) from BindingDB [12] were downloaded from the Therapeutics Data Commons (TDC) [17]. The dataset was used to evaluate performance of various embedding schemes. During the lead identification process, compounds in BindingDB were also used as C that highly interact with a target protein p.
2.2. Reduction of compound candidates
The drug-like chemical space can be defined by the public chemical database. In this study, 10,082,034 compounds from the ZINC database are collected to define drug-like chemical compounds. Among the chemical compounds, target-specific compounds are determined by drug-target interaction (DTI) prediction models. EnsDTI [36] is an ensemble model for the DTI task that consists of five deep learning-based models (DeepDTA [40], DeepConv-DTI [31], CPI-Prediction [57], DeepPurpose [18], and MDeePred [47]) and three machine learning-based models (support vector machine, random forest, and multi-layer perceptron). It provides a probability score for drug interaction activity against a target protein. In order to comprehensively reflect the results of state-of-the-art DTI models, we used EnsDTI. The threshold value of the probability score for the EnsDTI model to define candidate compounds was 0.7, which was reported to be the optimal AUC threshold value for the model (Supplementary Figure S1).
2.3. Networks construction with chemical similarity
For a compounds set Q and C, chemical networks are constructed based on chemical similarity metrics. To calculate the chemical similarity, 14 fingerprint-based methods [27] are used (Supplementary Table S1).
Molecular fingerprints (FP) are represented as a binary vector of n-dimension. Given two chemical FPs and , Jaccard score [24] is used to calculate the similarity between the chemical compounds. This allows us to quantify the extent to which the chemical makeup of the two drugs is similar [20]. Jaccard score is widely used in cheminformatics and we utilize it due to its strong external consistency and good performance particularly on large datasets [10].
| (1) |
For each chemical similarity metric, a chemical network is constructed by an undirected and unweighted graph that consists of a set of nodes and a set of edges. consists of two types of compounds: (i) target-specific compounds Q to be explored for identifying new lead compounds and (ii) seed compounds C having strong interaction for a target protein p. The initial weights of nodes in C are set to 1, otherwise 0. is a set of edges that a chemical similarity between its connected nodes is greater than edge threshold . To identify lead candidates, we construct 14 fingerprint-based similarity networks. The hyper-parameter of fingerprint-based networks is used with default settings 0.85, which has been used in many studies [58], [26], [62], [38], [61]. Supplementary Figure S2 also shows that IC50 value have significant similarity between compounds with a similarity of 0.85 or higher.
2.4. Mining of candidates with network propagation on chemical networks
The chemical networks are explored with the network propagation technique to identify lead candidates. Given a chemical network N containing n compounds as nodes, the adjacency matrix is matrix, where the elements in indicate whether two nodes are adjacent in the network. Let is node weights after t-step propagation. Each element of initial vector is set to 0 or 1 as described in the previous section. The process of NP is propagating information of node itself to neighboring nodes, by multiplying by to obtain step results . In other words, a whole vector of node weights updated from previous status considering network topology. Iteratively, information is diffused to direction of interaction until convergence. The hyper-parameter α is used to control the probability of restarting from the initial weight vector [42]. The analysis shown in Supplementary Figure S3 and Supplementary Table S2 demonstrates the robustness of the prediction results over a wide range of alpha values, including 0.05, 0.1, 0.2, 0.3, 0.4, and 0.5. In this paper, we set alpha to 0.1.
| (2) |
2.5. Lead identification by ensembled network prioritization
For each chemical network, a set of candidate compounds is determined by NP. In this study, the scores of NP results ranged from 0 to 1.238. To select lead candidates, we set 0.2 empirically as a default threshold. Then, candidates from at least two chemical networks are selected as final lead candidates. Results in Supplementary Figure S4, Supplementary Tables S3, and S4 show that our experimentally defined threshold of 0.2 achieves the highest reduction in compound screening while retaining potentially good compounds.
3. Results
We applied our proposed lead identification framework for CLK1 kinase target to show the results up to lead identification. The source code is publicly available at https://github.com/J-Sub/ChemNP. The application results are shown below in order of steps in our framework.
3.1. Reduction of compound candidate
As mentioned in Section 1.4, we performed compound candidate reduction to effectively identify leads of a given target protein. Possible drug-like chemical compound space is about 1060 [44], which is very huge, so it is necessary to filter. We adopt the ZINC20 database to reduce the space to 10 million compounds. For target-specific leads, EnsDTI, a DTI tool, was used. We queried CLK1 as a target to EnsDTI, to reduce the candidate compounds to 35,286 compounds. As shown in Table 2, this process effectively reduce search space for compounds potentially related to a target protein, CLK1 in this case.
Table 2.
Reduction of the chemical space size with respect to our analysis framework described in Fig. 1.

3.2. Network construction with chemical similarity
The 14 chemical similarity networks were constructed by the proposed method including 35,286 compounds as Q and 298 compounds as C. When examining the constructed network, chemical nodes with known activity show a pattern in which similar chemicals are gathered rather than spread in random positions in the network.
Fig. 2A is a merged network visualization to show connectivity to the two identified candidate compounds (AGD22000100006 and AGD22000100008) in red that were experimentally validated in this study. Nodes in blue are compounds that are known to bind to CLK1 and nodes in gray are compounds that are not known to bind to CLK1. The edges of the network in Fig. 2A were constructed by constructing edges that are present in at least a network of 14 similarity networks. Note that there are only gray nodes adjacent to the two experimentally validated compounds. Thus, simply looking for compounds neighboring with compounds that are known to bind to CLK1 (nodes in blue) would not identify novel compounds (AGD22000100006 and AGD22000100008). By performing network propagations to aggregate effects along the multiple paths from compounds that are known to bind to CLK1 (nodes in blue), the two red-colored lead candidates were identified and experimentally validated even without directly neighboring seed compounds. In Fig. 2B, distances to neighboring compounds from the two identified lead compounds in the constructed network are shown for each of the two novel compounds, AGD22000100006 (left plot) and AGD22000100008 (right plot), which shows that nearest neighbors alone are not sufficient to identify novel compounds. The average distances from the two red-colored lead compounds (AGD22000100006 and AGD22000100008) to the neighboring compounds of known and unknown activity were 4.61 and 2.89, respectively.
Fig. 2.

Visualization of the 14 chemical similarity-based network merged for CKL1 lead identification. (A) The merged network of 14 fingerprint similarity networks. Blue colored nodes indicate compounds used as seed for NP experiments and red colored nodes are experimentally validated compounds in this study. Grey-colored nodes are compounds that are not known to bind to CLK1. Note that there are no blue nodes directly adjacent to the red nodes, thus knowing nearest neighbors are not sufficient to identify novel compounds for CLK1. (B) Two line plots at the bottom represent distance to neighboring drugs for the two identified lead compounds in the constructed network in A. The neighboring drugs are categorized into two types: chemicals with known and unknown activity in red and grey colors, respectively.
3.3. Mining on chemical network
We will explain the network mining process with a concrete example, CLK1, because we verified the prediction results in binding assays. In addition, we intended to show that the NP-based network mining technique is indeed effective for lead identification. An obvious and widely used data mining method is the k-nearest neighbor prediction method. In this section, we show that the NP-based network mining method is much more powerful than the k-nearest neighbor prediction method with real examples. For the CLK1-specific chemical network, we first used the kNN method to the lead identification problem. For simplicity, we focused on chemical similarity of standard FP. Similar results were obtained for the other 13 fingerprints.
First, we simulate the prioritization experiments with different numbers of seed compounds. The goal of this simulation experiment is when a given target compound has very few number of known ligand-target information in public databases. The seed compounds are used for propagating information in NP, and for assigning nearest neighbors in kNN experiments. The kNN score is calculated according to the equations (3) and (4). p is the probability with kNN score.
| (3) |
| (4) |
As shown in Fig. 3, for both NP and kNN experiments, the more seeds we use, the higher correlation to IC50 values was observed. This is obvious as more confidence will be made with richer prior knowledge on the known drugs for each target. Also, we observed the higher correlation for the number of seed variations 4, 8, and 30, while comparable correlation was observed for the other seed counts 2 and 100. This result indicates that NP outperforms kNN in lead identification for target proteins that have fewer number of known targets. This is because up to 60% of the proteins in the database have information on fewer than 100 matched drugs (Table 3).
Fig. 3.
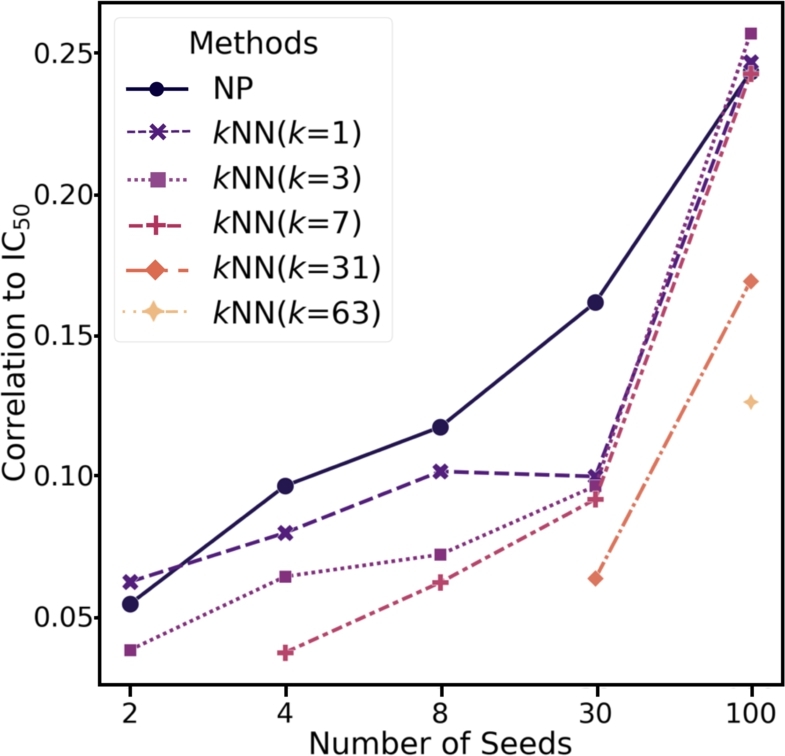
Comparison of the IC50 values with kNN and NP scores. NP produces score for each compound given the number of seed compounds for simulation, while kNN calculates the frequency of assigned labels of the k nearest neighbor compounds given the number of seed compounds. X-axis represents the number of seeds used for each method. Y-axis label represents the Pearson's correlation coefficient with IC50 for each method.
Table 3.
Distribution of binding affinity data points in BindingDB database. DTI data points refer to known drug-target interaction pairs in the database. The variable x represents the count of matching DTI data points, where, for example, 2,661 targets (36.028% of population) have 10 or fewer DTIs.
| Number of DTI data points | Number of targets | Population |
|---|---|---|
| 1000 ≤ x | 542 | 7.338% |
| 100 < x ≤ 1000 | 1,750 | 23.693% |
| 10 < x ≤ 100 | 2,433 | 32.941% |
| x ≤ 10 | 2,661 | 36.028% |
| Total | 7,386 | 100% |
Second, we compared the prioritization results from both NP and kNN in terms of how many candidates are selected as priority leads. Fig. 4 shows that the kNN results in a large number of ties, especially for a small k < 10. The ratios of compounds with the highest kNN score are 37.5% (13,239), 6.9% (2,429), and 0.6% (219) for k=1, 3, and 7, respectively. This means that the kNN would result in many false positive leads of poorly characterized target proteins, i.e., given small C, due to the maximum k is bounded by the number of compounds in C.
Fig. 4.

The distributions of kNN and NP scores for 35,286 compounds. (A) The panel shows the distribution of NP scores. A number with a red arrow indicates the number of compounds. (B) Each panel represents the kNN score distribution for k=1, 3, 7, and 31.
Next, we investigated why NP is more efficient to identify lead candidates than DTI tools. For a fair experiment, the test set obtained from the data split provided by the TDC was equally predicted. Cutoff to be test labeled was given as 500nM. EnsDTI evaluated the test set with a pre-trained model for general kinases instead of a specific kinase target, and NP conducted an experiment according to Section 2.4. For NP, we set compounds with IC50 under 500nM as seed in the train set. We compared EnsDTI prediction value of BindingDB known compounds in test set and NP score based on fp2 fingerprint network. The scatter chart of DTI model and NP is shown in Fig. 5. As can be seen, the prediction of NP shows a higher correlation with IC50 than DTI tools. The main finding in this experiment is that DTI tools can be used to identify compounds that are likely to target a given protein. However, current DTI tools are not powerful enough to predict binding efficacy in terms of IC50. NP-based rankings are informative in predicting binding efficacy in terms of IC50.
Fig. 5.

Correlations between true IC50 values and predicted values of methods for DTI tools vs. the NP-based method. The left plot visualizes the results of deep learning method (EnsDTI), and the right plot visualizes the result of NP. EnsDTI and NP were performed on the BindingDB database for target CLK1.
3.4. Ensemble network propagation score for lead identification
We identified lead candidates for CLK1 using the proposed method. Out of the 35,286 target-specific compounds, 123 compounds with NP scores greater than 0.2 were found in at least one network. Among them, 24 compounds were selected as lead candidates according to the proposed methods in Section 2.5. The list of 24 selected compounds is in Supplementary Table S6. For in vitro testing of structural diversity among the 24 lead candidates, we excluded three lead candidates that had a similarity greater than 0.99 to higher-ranked candidates with at least one molecular fingerprint. Finally, considering synthetic accessibility, five candidates were selected for experimental validation.
3.5. Experimental validation on CLK1
For the five lead candidates, CLK1 kinase activities were measured in a reaction mixture containing 10 mM Magnesium acetate, [γ-33P]-ATP in a reaction buffer (8 mM MOPS pH 7.0, 0.2 mM EDTA, 1 mM sodium orthovanadate, 5 mM sodium β-glycerophosphate, 200 μM ERMRPRKRQGSVRRRV) containing 1 μM compound. We followed guidelines in the relevant references [3], [45] to set a 50% inhibition threshold at a concentration of 1 μM as guideline for performing assay tests. The reaction was started by adding Mg/ATP, and the mixture was incubated at room temperature for 4 minutes, and then 0.5% phosphoric acid was added to stop the reaction. Take 10 μL of the reaction solution, transfer it to P30 filtermat, and wash it with 0.425% phosphoric acid four times. After that, measure absorbance using scintillation counting. The control group was measured except for the compound absorbance.
Three out of the five lead candidates showed promising results in binding assays. Specifically, two compounds (AGD22000100008 and AGD22000100006) inhibited the CLK1 activity by 51% and 49% compared to the control, respectively. Detailed experimental values are summarized in Table 4. Fig. 6 shows the two identified lead compounds and their neighboring compounds in the network. Note that the neighboring compounds are structurally different from the two identified lead compounds. This indicates that NP techniques can find new and diverse chemical entities despite the presence of data gaps.
Table 4.
The experimental results of CLK1 kinase activity for five lead candidates. Each number in the table represents the protein activity ratio relative to control. The activity column shows the result of two experiments for each compound. Compounds in bold indicate the activity is less than 55%. The mean activity column displays the average value and standard deviation in each experiment.
| Compounds (@ 1 μM) | Activity | Mean Activity |
|---|---|---|
| (% Control) | (% Control) | |
| AGD22000100002 | 78 | 75(3.0) |
| 72 | ||
| AGD22000100003 | 101 | 99(2.5) |
| 96 | ||
| AGD22000100006 | 52 | 49(3.0) |
| 46 | ||
| AGD22000100008 | 52 | 51(1.0) |
| 50 | ||
| AGD22000100009 | 145 | 155(10.0) |
| 165 | ||
Fig. 6.

The structures of the two identified lead compounds were shown to have inhibitory activity against CLK1 and the seed compounds with the most similar structures in terms of fingerprint calculations. A and B are denoted as AGD22000100006 and AGD22000100008, respectively.
4. Discussion and conclusion
In this study, we developed a data mining framework for lead identification given a target protein as a query. Our approach uses NP to simulate and aggregate the information from direct/indirect neighbors to prioritize drug candidates. To prevent the potential bias in chemical similarity measures, 14 different fingerprint similarity networks were constructed and used. Our approach significantly reduced the false positive rate, outperforming kNN against the simulation on sparsely labeled DTI information. The main advantage of our approach is that potential leads can be identified with a lower false positive rate even on poorly characterized target proteins in terms of DTI. Note that deep learning or machine learning models can hardly be effectively constructed for poorly characterized target proteins as the number of known samples is small for training. Our data mining approach on chemical similarity networks can be an effective approach to model-based approaches. We identified 24 lead candidates for CLK1 targets out of 35,286 compounds in chemical space and confirmed the enzymatic activity of two compounds (AGD22000100006 and AGD22000100008) for CLK1 protein by in vitro experimental methods.
Network propagation is advantageous in handling missing or utilizing insubstantial experimental data compared to QSAR [56], as it utilizes network structure and propagates information from compounds with known activities to candidate compounds. In contrast, QSAR models require a complete and well-organized dataset for training, which may not be available for compounds of interest, making network propagation more effective in handling data gaps [35], [67]. However, QSAR models are often more interpretable, providing explicit mathematical equations relating molecular descriptors to target activity, while network propagation predictions may be less interpretable due to their complex iterative information propagation steps in the network.
However, there is still room for more accurate lead identification by aggregating DTI information from other resources, especially for chemical space larger than the ZINC collection. Benchmark databases should also be extensively used for generalizable data mining. A seminal work [30] performed extensive experiments on kinase inhibitors for 243 kinase inhibitors. According to their landscape of kinase inhibition, a majority of the kinase inhibitors show high selectivity, while many approved drugs show non-specific binding patterns. We should also be noted that inhibitory power of kinase inhibitors highly depends on applied concentrations. Thus, in silico data mining approach should be extended to be concentration- and selectivity-aware.
As for future work, we will explore more descriptors or molecular fingerprints of different types to improve the robustness and scalability of our proposed framework. We used binary fingerprints only in our lead identification framework, but it is possible to use continuous descriptors such as mol2vec [25]. We found that our proposed candidate list was consistent when we included mol2vec (Supplementary Table S5). As deep learning technologies continue to advance, it may be desirable to incorporate descriptors of new types for the construction of the compound network. In addition, we can also use other similarity metrics such as cosine or Euclidean in addition to the Jaccard score which is known to be effective for binary vectors. In summary, the construction of chemical networks is a new topic and a number of issues remain to be explored as deep learning or new AI technologies advance.
CRediT authorship contribution statement
Jungseob Yi: Investigation, Software, Validation, Visualization, Writing – original draft, Writing – review & editing. Sangseon Lee: Supervision, Writing – original draft, Writing – review & editing. Sangsoo Lim: Visualization, Writing – original draft. Changyun Cho: Visualization. Yinhua Piao: Visualization. Marie Yeo: Validation. Dongkyu Kim: Validation. Sun Kim: Conceptualization, Funding acquisition, Supervision, Writing – original draft, Writing – review & editing. Sunho Lee: Conceptualization, Funding acquisition, Software, Supervision, Visualization, Writing – original draft, Writing – review & editing.
Declaration of Competing Interest
The authors declare that they have no known competing financial interests or personal relationships that could have appeared to influence the work reported in this paper.
Acknowledgement
This research was supported by Institute of Information & communications Technology Planning & Evaluation (IITP) grant funded by the Korea government (MSIT) [NO. 2021-0-01343, Artificial Intelligence Graduate School Program (Seoul National University)], by the Bio & Medical Technology Development Program of the National Research Foundation (NRF) funded by the Ministry of Science & ICT (2022M3E5F3085681), by the Bio & Medical Technology Development Program of the National Research Foundation (NRF) funded by the Ministry of Science & ICT (RS-2023-00257479), and by the Bio & Medical Technology Development Program of the National Research Foundation (NRF) funded by the Ministry of Science & ICT (NRF-2022M3E5F3085677). The ICT at Seoul National University provides research facilities for this study and this work was funded by AIGENDRUG CO., LTD.
Footnotes
Supplementary material related to this article can be found online at https://doi.org/10.1016/j.csbj.2023.08.016.
Appendix A. Supplementary material
The following is the Supplementary material related to this article.
The supplementary material contains Supplementary Tables 1–6, and Supplementary Figures 1–6.
References
- 1.Adeshina Y.O., Deeds E.J., Karanicolas J. Machine learning classification can reduce false positives in structure-based virtual screening. Proc Natl Acad Sci. 2020;117:18477–18488. doi: 10.1073/pnas.2000585117. [DOI] [PMC free article] [PubMed] [Google Scholar]
- 2.Aittokallio T. 2022. What are the current challenges for machine learning in drug discovery and repurposing? [DOI] [PubMed] [Google Scholar]
- 3.Bendels S., Bissantz C., Fasching B., Gerebtzoff G., Guba W., Kansy M., et al. Safety screening in early drug discovery: an optimized assay panel. J Pharmacol Toxicol Methods. 2019;99 doi: 10.1016/j.vascn.2019.106609. [DOI] [PubMed] [Google Scholar]
- 4.Berthold M.R., Cebron N., Dill F., Gabriel T.R., Kötter T., Meinl T., et al. Knime-the konstanz information miner: version 2.0 and beyond. ACM SIGKDD Explor Newsl. 2009;11:26–31. [Google Scholar]
- 5.Bian Y., Xie X.Q. Generative chemistry: drug discovery with deep learning generative models. J Mol Model. 2021;27:1–18. doi: 10.1007/s00894-021-04674-8. [DOI] [PMC free article] [PubMed] [Google Scholar]
- 6.Blum L.C., Reymond J.L. 970 million druglike small molecules for virtual screening in the chemical universe database gdb-13. J Am Chem Soc. 2009;131:8732–8733. doi: 10.1021/ja902302h. [DOI] [PubMed] [Google Scholar]
- 7.Bock F.E., Aydin R.C., Cyron C.J., Huber N., Kalidindi S.R., Klusemann B. A review of the application of machine learning and data mining approaches in continuum materials mechanics. Front Mater. 2019;6:110. [Google Scholar]
- 8.Cowen L., Ideker T., Raphael B.J., Sharan R. Network propagation: a universal amplifier of genetic associations. Nat Rev Genet. 2017;18:551–562. doi: 10.1038/nrg.2017.38. [DOI] [PubMed] [Google Scholar]
- 9.Dahlin J.L., Nissink J.W.M., Strasser J.M., Francis S., Higgins L., Zhou H., et al. Pains in the assay: chemical mechanisms of assay interference and promiscuous enzymatic inhibition observed during a sulfhydryl-scavenging hts. J Med Chem. 2015;58:2091–2113. doi: 10.1021/jm5019093. [DOI] [PMC free article] [PubMed] [Google Scholar]
- 10.Dunn T.B., Seabra G.M., Kim T.D., Juárez-Mercado K.E., Li C., Medina-Franco J.L., et al. Diversity and chemical library networks of large data sets. J Chem Inf Model. 2021;62:2186–2201. doi: 10.1021/acs.jcim.1c01013. [DOI] [PubMed] [Google Scholar]
- 11.Fang Y., Zhang Q., Yang H., Zhuang X., Deng S., Zhang W., et al. Proceedings of the AAAI conference on artificial intelligence. 2022. Molecular contrastive learning with chemical element knowledge graph; pp. 3968–3976. [Google Scholar]
- 12.Gao K.Y., Fokoue A., Luo H., Iyengar A., Dey S., Zhang P., et al. IJCAI. 2018. Interpretable drug target prediction using deep neural representation; pp. 3371–3377. [Google Scholar]
- 13.Gaulton A., Hersey A., Nowotka M., Bento A.P., Chambers J., Mendez D., et al. The chembl database in 2017. Nucleic Acids Res. 2017;45:D945–D954. doi: 10.1093/nar/gkw1074. [DOI] [PMC free article] [PubMed] [Google Scholar]
- 14.Gilson M.K., Liu T., Baitaluk M., Nicola G., Hwang L., Chong J. Bindingdb in 2015: a public database for medicinal chemistry, computational chemistry and systems pharmacology. Nucleic Acids Res. 2016;44:D1045–D1053. doi: 10.1093/nar/gkv1072. [DOI] [PMC free article] [PubMed] [Google Scholar]
- 15.Gromski P.S., Henson A.B., Granda J.M., Cronin L. How to explore chemical space using algorithms and automation. Nat Rev Chem. 2019;3:119–128. [Google Scholar]
- 16.Hu W., Liu B., Gomes J., Zitnik M., Liang P., Pande V., et al. Strategies for pre-training graph neural networks. 2019. arXiv:1905.12265 ArXiv preprint.
- 17.Huang K., Fu T., Gao W., Zhao Y., Roohani Y., Leskovec J., et al. NeurIPS datasets and benchmarks. 2021. Therapeutics data commons: machine learning datasets and tasks for drug discovery and development. [Google Scholar]
- 18.Huang K., Fu T., Glass L.M., Zitnik M., Xiao C., Sun J. Deeppurpose: a deep learning library for drug-target interaction prediction. Bioinformatics. 2020 doi: 10.1093/bioinformatics/btaa1005. [DOI] [PMC free article] [PubMed] [Google Scholar]
- 19.Huang K., Xiao C., Hoang T., Glass L., Sun J. Proceedings of the AAAI conference on artificial intelligence. 2020. Caster: predicting drug interactions with chemical substructure representation; pp. 702–709. [Google Scholar]
- 20.Huang L., Luo H., Li S., Wu F.X., Wang J. Drug–drug similarity measure and its applications. Brief Bioinform. 2021;22 doi: 10.1093/bib/bbaa265. [DOI] [PubMed] [Google Scholar]
- 21.Hughes J.P., Rees S., Kalindjian S.B., Philpott K.L. Principles of early drug discovery. Br J Pharmacol. 2011;162:1239–1249. doi: 10.1111/j.1476-5381.2010.01127.x. [DOI] [PMC free article] [PubMed] [Google Scholar]
- 22.Irwin J.J., Shoichet B.K. Zinc - a free database of commercially available compounds for virtual screening. J Chem Inf Model. 2005;45:177–182. doi: 10.1021/ci049714. [DOI] [PMC free article] [PubMed] [Google Scholar]
- 23.Irwin J.J., Tang K.G., Young J., Dandarchuluun C., Wong B.R., Khurelbaatar M., et al. Zinc20—a free ultralarge-scale chemical database for ligand discovery. J Chem Inf Model. 2020;60:6065–6073. doi: 10.1021/acs.jcim.0c00675. [DOI] [PMC free article] [PubMed] [Google Scholar]
- 24.Jaccard P. Nouvelles recherches sur la distribution florale. Bull Soc Vaud Sci Nat. 1908;44:223–270. [Google Scholar]
- 25.Jaeger S., Fulle S., Turk S. Mol2vec: unsupervised machine learning approach with chemical intuition. J Chem Inf Model. 2018;58:27–35. doi: 10.1021/acs.jcim.7b00616. [DOI] [PubMed] [Google Scholar]
- 26.Jasial S., Hu Y., Vogt M., Bajorath J. Activity-relevant similarity values for fingerprints and implications for similarity searching. F1000Res. 2016;5 doi: 10.12688/f1000research.8357.1. [DOI] [PMC free article] [PubMed] [Google Scholar]
- 27.Ji H., Deng H., Lu H., Zhang Z. Predicting a molecular fingerprint from an electron ionization mass spectrum with deep neural networks. Anal Chem. 2020;92:8649–8653. doi: 10.1021/acs.analchem.0c01450. https://github.com/hcji/PyFingerprint [DOI] [PubMed] [Google Scholar]
- 28.Jin W., Barzilay R., Jaakkola T. International conference on machine learning. PMLR; 2018. Junction tree variational autoencoder for molecular graph generation; pp. 2323–2332. [Google Scholar]
- 29.Kim S., Thiessen P.A., Bolton E.E., Chen J., Fu G., Gindulyte A., et al. Pubchem substance and compound databases. Nucleic Acids Res. 2016;44:D1202–D1213. doi: 10.1093/nar/gkv951. [DOI] [PMC free article] [PubMed] [Google Scholar]
- 30.Klaeger S., Heinzlmeir S., Wilhelm M., Polzer H., Vick B., Koenig P.A., et al. The target landscape of clinical kinase drugs. Science. 2017;358 doi: 10.1126/science.aan4368. [DOI] [PMC free article] [PubMed] [Google Scholar]
- 31.Lee I., Keum J., Nam H. Deepconv-dti: prediction of drug-target interactions via deep learning with convolution on protein sequences. PLoS Comput Biol. 2019;15 doi: 10.1371/journal.pcbi.1007129. [DOI] [PMC free article] [PubMed] [Google Scholar]
- 32.Lim S., Lee S., Piao Y., Choi M., Bang D., Gu J., et al. On modeling and utilizing chemical compound information with deep learning technologies: a task-oriented approach. Comput Struct Biotechnol J. 2022 doi: 10.1016/j.csbj.2022.07.049. [DOI] [PMC free article] [PubMed] [Google Scholar]
- 33.Lim S., Lu Y., Cho C.Y., Sung I., Kim J., Kim Y., et al. A review on compound-protein interaction prediction methods: data, format, representation and model. Comput Struct Biotechnol J. 2021;19:1541–1556. doi: 10.1016/j.csbj.2021.03.004. [DOI] [PMC free article] [PubMed] [Google Scholar]
- 34.Liu Z., Guo F., Gu J., Wang Y., Li Y., Wang D., et al. Similarity-based prediction for anatomical therapeutic chemical classification of drugs by integrating multiple data sources. Bioinformatics. 2015;31:1788–1795. doi: 10.1093/bioinformatics/btv055. [DOI] [PubMed] [Google Scholar]
- 35.López-López E., Fernández-de Gortari E., Medina-Franco J.L. Yes sir! On the structure–inactivity relationships in drug discovery. Drug Discov Today. 2022;27:2353–2362. doi: 10.1016/j.drudis.2022.05.005. [DOI] [PubMed] [Google Scholar]
- 36.Lu Y., Lim S., Park S., Choi M., Cho C., Kang S., et al. bioRxiv; 2023. Ensdti-kinase: web-server for predicting kinase-inhibitor interactions with ensemble computational methods and its applications. [Google Scholar]
- 37.Medina-Franco J.L., Chávez-Hernández A.L., López-López E., Saldívar-González F.I. Chemical multiverse: an expanded view of chemical space. Mol Inf. 2022;41 doi: 10.1002/minf.202200116. [DOI] [PMC free article] [PubMed] [Google Scholar]
- 38.Muchmore S.W., Debe D.A., Metz J.T., Brown S.P., Martin Y.C., Hajduk P.J. Application of belief theory to similarity data fusion for use in analog searching and lead hopping. J Chem Inf Model. 2008;48:941–948. doi: 10.1021/ci7004498. [DOI] [PubMed] [Google Scholar]
- 39.Nguyen D.H., Nguyen C.H., Mamitsuka H. Recent advances and prospects of computational methods for metabolite identification: a review with emphasis on machine learning approaches. Brief Bioinform. 2019;20:2028–2043. doi: 10.1093/bib/bby066. [DOI] [PMC free article] [PubMed] [Google Scholar]
- 40.Öztürk H., Özgür A., Ozkirimli E. Deepdta: deep drug–target binding affinity prediction. Bioinformatics. 2018;34:i821–i829. doi: 10.1093/bioinformatics/bty593. [DOI] [PMC free article] [PubMed] [Google Scholar]
- 41.Mazanetz M.P., Marmon R.J., Reisser C.B.T., Morao I. Drug discovery applications for knime: an open source data mining platform. Curr Top Med Chem. 2012;12:1965–1979. doi: 10.2174/156802612804910331. [DOI] [PubMed] [Google Scholar]
- 42.Pan J.Y., Yang H.J., Faloutsos C., Duygulu P. Proceedings of the tenth ACM SIGKDD international conference on knowledge discovery and data mining. 2004. Automatic multimedia cross-modal correlation discovery; pp. 653–658. [Google Scholar]
- 43.Pietraszek T., Tanner A. Data mining and machine learning—towards reducing false positives in intrusion detection. Inf Sec Tech Rep. 2005;10:169–183. [Google Scholar]
- 44.Polishchuk P.G., Madzhidov T.I., Varnek A. Estimation of the size of drug-like chemical space based on gdb-17 data. J Comput-Aided Mol Des. 2013;27:675–679. doi: 10.1007/s10822-013-9672-4. [DOI] [PubMed] [Google Scholar]
- 45.Pugsley M.K., de Korte T., Udupa V., Authier S., Curtis M.J. 2019. Methodological and technological advances in safety pharmacology–new or simply nuanced? [DOI] [PubMed] [Google Scholar]
- 46.Reddy A.S., Pati S.P., Kumar P.P., Pradeep H., Sastry G.N. Virtual screening in drug discovery-a computational perspective. Curr Protein Pept Sci. 2007;8:329–351. doi: 10.2174/138920307781369427. [DOI] [PubMed] [Google Scholar]
- 47.Rifaioglu A.S., Cetin Atalay R., Cansen Kahraman D., Doğan T., Martin M., Atalay V. Mdeepred: novel multi-channel protein featurization for deep learning-based binding affinity prediction in drug discovery. Bioinformatics. 2021;37:693–704. doi: 10.1093/bioinformatics/btaa858. [DOI] [PubMed] [Google Scholar]
- 48.Sabando M.V., Ponzoni I., Milios E.E., Soto A.J. Using molecular embeddings in qsar modeling: does it make a difference? Brief Bioinform. 2022;23 doi: 10.1093/bib/bbab365. [DOI] [PubMed] [Google Scholar]
- 49.Schneider P., Walters W.P., Plowright A.T., Sieroka N., Listgarten J., Goodnow R.A., et al. Rethinking drug design in the artificial intelligence era. Nat Rev Drug Discov. 2020;19:353–364. doi: 10.1038/s41573-019-0050-3. [DOI] [PubMed] [Google Scholar]
- 50.Shen J., Cheng F., Xu Y., Li W., Tang Y. Estimation of adme properties with substructure pattern recognition. J Chem Inf Model. 2010;50:1034–1041. doi: 10.1021/ci100104j. [DOI] [PubMed] [Google Scholar]
- 51.Sink R., Gobec S., Pecar S., Zega A. False positives in the early stages of drug discovery. Curr Top Med Chem. 2010;17:4231–4255. doi: 10.2174/092986710793348545. [DOI] [PubMed] [Google Scholar]
- 52.Słabicki M., Kozicka Z., Petzold G., Li Y.D., Manojkumar M., Bunker R.D., et al. The cdk inhibitor cr8 acts as a molecular glue degrader that depletes cyclin k. Nature. 2020;585:293–297. doi: 10.1038/s41586-020-2374-x. [DOI] [PMC free article] [PubMed] [Google Scholar]
- 53.Stebbing J., Sánchez Nievas G., Falcone M., Youhanna S., Richardson P., Ottaviani S., et al. Jak inhibition reduces sars-cov-2 liver infectivity and modulates inflammatory responses to reduce morbidity and mortality. Sci Adv. 2021;7 doi: 10.1126/sciadv.abe4724. [DOI] [PMC free article] [PubMed] [Google Scholar]
- 54.Stepniewska-Dziubinska M.M., Zielenkiewicz P., Siedlecki P. Development and evaluation of a deep learning model for protein–ligand binding affinity prediction. Bioinformatics. 2018;34:3666–3674. doi: 10.1093/bioinformatics/bty374. [DOI] [PMC free article] [PubMed] [Google Scholar]
- 55.Stokes J.M., Yang K., Swanson K., Jin W., Cubillos-Ruiz A., Donghia N.M., et al. A deep learning approach to antibiotic discovery. Cell. 2020;180:688–702. doi: 10.1016/j.cell.2020.01.021. [DOI] [PMC free article] [PubMed] [Google Scholar]
- 56.Tropsha A. Best practices for qsar model development, validation, and exploitation. Mol Inf. 2010;29:476–488. doi: 10.1002/minf.201000061. [DOI] [PubMed] [Google Scholar]
- 57.Tsubaki M., Tomii K., Sese J. Compound–protein interaction prediction with end-to-end learning of neural networks for graphs and sequences. Bioinformatics. 2019;35:309–318. doi: 10.1093/bioinformatics/bty535. [DOI] [PubMed] [Google Scholar]
- 58.Ucak U.V., Ashyrmamatov I., Ko J., Lee J. Retrosynthetic reaction pathway prediction through neural machine translation of atomic environments. Nat Commun. 2022;13:1–10. doi: 10.1038/s41467-022-28857-w. [DOI] [PMC free article] [PubMed] [Google Scholar]
- 59.Usama M. American Association for Artificial Intelligence; 1996. Advances in knowledge discovery and data mining. [Google Scholar]
- 60.Vamathevan J., Clark D., Czodrowski P., Dunham I., Ferran E., Lee G., et al. Applications of machine learning in drug discovery and development. Nat Rev Drug Discov. 2019;18:463–477. doi: 10.1038/s41573-019-0024-5. [DOI] [PMC free article] [PubMed] [Google Scholar]
- 61.Vogt M., Bajorath J. Introduction of a generally applicable method to estimate retrieval of active molecules for similarity searching using fingerprints. ChemMedChem: Chem Enab Drug Dis. 2007;2:1311–1320. doi: 10.1002/cmdc.200700090. [DOI] [PubMed] [Google Scholar]
- 62.Wassermann A.M., Lounkine E., Glick M. Bioturbo similarity searching: combining chemical and biological similarity to discover structurally diverse bioactive molecules. J Chem Inf Model. 2013;53:692–703. doi: 10.1021/ci300607r. [DOI] [PubMed] [Google Scholar]
- 63.Weaver D.C. Applying data mining techniques to library design, lead generation and lead optimization. Curr Opin Chem Biol. 2004;8:264–270. doi: 10.1016/j.cbpa.2004.04.005. [DOI] [PubMed] [Google Scholar]
- 64.Wu L., Ai N., Liu Y., Wang Y., Fan X. Relating anatomical therapeutic indications by the ensemble similarity of drug sets. J Chem Inf Model. 2013;53:2154–2160. doi: 10.1021/ci400155x. [DOI] [PubMed] [Google Scholar]
- 65.Yang K., Swanson K., Jin W., Coley C., Eiden P., Gao H., et al. Analyzing learned molecular representations for property prediction. J Chem Inf Model. 2019;59:3370–3388. doi: 10.1021/acs.jcim.9b00237. [DOI] [PMC free article] [PubMed] [Google Scholar]
- 66.Yi H.C., You Z.H., Huang D.S., Kwoh C.K. Graph representation learning in bioinformatics: trends, methods and applications. Brief Bioinform. 2022;23 doi: 10.1093/bib/bbab340. [DOI] [PubMed] [Google Scholar]
- 67.Zhao L., Ciallella H.L., Aleksunes L.M., Zhu H. Advancing computer-aided drug discovery (cadd) by big data and data-driven machine learning modeling. Drug Discov Today. 2020;25:1624–1638. doi: 10.1016/j.drudis.2020.07.005. [DOI] [PMC free article] [PubMed] [Google Scholar]
- 68.Zhavoronkov A., Ivanenkov Y.A., Aliper A., Veselov M.S., Aladinskiy V.A., Aladinskaya A.V., et al. Deep learning enables rapid identification of potent ddr1 kinase inhibitors. Nat Biotechnol. 2019;37:1038–1040. doi: 10.1038/s41587-019-0224-x. [DOI] [PubMed] [Google Scholar]
- 69.Zhu H. Big data and artificial intelligence modeling for drug discovery. Annu Rev Pharmacol Toxicol. 2020;60:573. doi: 10.1146/annurev-pharmtox-010919-023324. [DOI] [PMC free article] [PubMed] [Google Scholar]
Associated Data
This section collects any data citations, data availability statements, or supplementary materials included in this article.
Supplementary Materials
The supplementary material contains Supplementary Tables 1–6, and Supplementary Figures 1–6.