

Summary
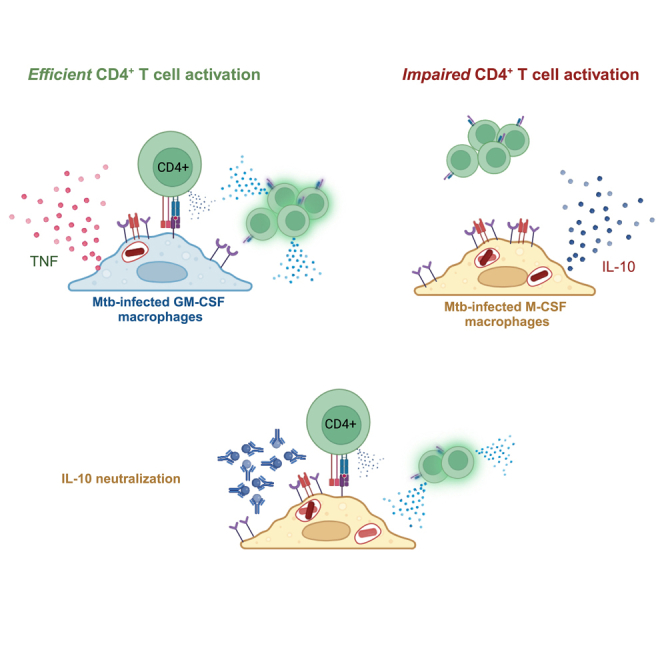
Direct recognition of Mycobacterium tuberculosis (Mtb)-infected cells is required for protection by CD4+ T cells. While impaired T cell recognition of Mtb-infected macrophages was demonstrated in mice, data are lacking for humans. Using T cells and monocyte-derived macrophages (MDMs) from individuals with latent Mtb infection (LTBI), we quantified the frequency of memory CD4+ T cell activation in response to autologous MDMs infected with virulent Mtb. We observed robust T cell activation in response to Mtb infection of M1-like macrophages differentiated using GM-CSF, while M2-like macrophages differentiated using M-CSF were poorly recognized. However, non-infected GM-CSF and M-CSF MDMs loaded with exogenous antigens elicited similar CD4+ T cell activation. IL-10 was preferentially secreted by infected M-CSF MDMs, and neutralization improved T cell activation. These results suggest that preferential infection of macrophages with an M2-like phenotype limits T cell-mediated protection against Mtb. Vaccine development should focus on T cell recognition of Mtb-infected macrophages.
Subject areas: Immunology, Immune response, Microbiology
Graphical abstract
Highlights
-
•
Human memory CD4+ T cells recognize Mtb-infected M1 but not M2-like macrophages
-
•
Both macrophage subsets activate CD4+ T cells when loaded with inactivated Mtb
-
•
IL-10 is preferentially expressed by Mtb-infected M2-like (M-CSF) macrophages
-
•
IL-10 neutralization augments T cell recognition of infected M2-like macrophages
Immunology; Immune response; Microbiology
Introduction
Mycobacterium tuberculosis (Mtb), the intracellular bacterium that causes tuberculosis (TB), kills over one million people each year, and prior to the COVID19 pandemic was the leading cause of death from an infectious disease.1 CD4+ T cells are critical for control of Mtb infection as mice lacking CD4+ T cells rapidly die of overwhelming TB disease.2 A crucial feature of conventional αβTCR+ CD4+ T cells is their ability to recognize foreign antigen through the interaction of the T cell antigen receptor (TCR) and peptide-laden class-II major histocompatibility complex (MHC-II) on antigen-presenting cells (APCs). To control Mtb infection, T cells must directly interact with infected cells in an MHC-restricted manner.3,4,5 However, not all T cells specific for Mtb antigens recognize infected cells. During chronic Mtb infection in the mouse model, TGFβ production in lung granulomas,6 downregulation of certain mycobacterial antigens,7 and impairment of MHC-II and costimulatory receptor expression have been shown to limit Mtb-specific T cell responses.8 However, recent work has demonstrated that Mtb also limits T cell activation early after infection of macrophages,4,5,9,10,11,12,13,14,15,16 which are the cellular niche for Mtb.
Mtb-specific T cell responses in the lung are delayed approximately 2 weeks after aerosol Mtb challenge in mice17,18,19 and T cell accumulation in the lungs is only marginally accelerated in vaccinated or previously infected hosts.4,9,11,20,21 Using high-dose aerosol Mtb infection in mice, two studies recently found that lung-resident alveolar macrophages (AMs) comprise nearly all the cells that become infected during the first 10 days after inoculation.22,23 After this initial period, monocyte-derived macrophages (MDMs) and dendritic cells (DCs) are recruited to the lungs, become infected with and transport Mtb to lung draining mediastinal lymph nodes (MLNs) where Mtb-specific T cell activation occurs.22,23,24,25,26 Taken together, the mouse model of TB indicates that early infection of AMs neither induces a robust inflammatory response nor facilitates T cell activation, resulting in a delay in recruitment of Mtb-specific T cell responses.
Human and murine macrophages were historically categorized as either classical/pro-inflammatory “M1” or alternative/anti-inflammatory “M2” populations and are recapitulated by differentiating monocytes using GM-CSF or M-CSF, respectively, followed by infection, exposure to cytokines or pattern-recognition receptor (PRR) ligands.27,28,29,30 Upon infection with Mtb, GM-CSF MDMs secrete TNF, IL-12, IL-23, and CCL17, while M-CSF MDMs were shown to secrete IL-10 and MCP-1,27,31,32 indicating a functional dichotomy in their responses. A wider spectrum of human macrophage phenotypes was demonstrated in response to combinations of PRR ligands and cytokines added during macrophage differentiation.33 Yet, overlap in their gene expression patterns has also been observed, highlighting macrophage phenotypic plasticity in response to inflammation.28,30,33,34 Like MDMs, AMs were initially thought to be influenced by both GM-CSF and M-CSF,35 but more recent attention has focused on GM-CSF. Produced by alveolar epithelial cells, GM-CSF is critical for AM development, surfactant catabolism, and the prevention of infection.36,37,38 In contrast to GM-CSF, the expression of M-CSF in the lungs and its ability to influence pulmonary macrophage function is understudied. In addition, we and others find both GM-CSF (CSF2) and M-CSF (CSF1) to be expressed in the lungs by cells in both the alveolar and interstitial spaces.39,40 Therefore, both GM-CSF and M-CSF have potential to influence the phenotype of AMs and other lung macrophages. Given the reported phenotypic differences between GM-CSF vs. M-CSF-elicited macrophages, we sought to use primary immune cells from individuals with latent Mtb infection (LTBI) to determine the effect of macrophage phenotype on autologous memory CD4+ T cells responses.
In this manuscript, we compare human CD4+ T cell responses to M1 (GM-CSF) and M2 (M-CSF) macrophages after infection with virulent Mtb. We find that memory (CD45RALo) CD4+ T cells become activated in response to both GM-CSF and M-CSF-elicited MDMs that were not infected but loaded with exogenous antigens, despite differences in macrophage phenotype. However, upon virulent Mtb infection GM-CSF but not M-CSF MDMs elicited the activation of autologous memory CD4+ T cells. Increased bacterial burden, IL-10 production, and PD-L1 expression were unique to Mtb-infected M-CSF MDMs. Administration of α-IL-10, but not α-PD-L1 mAb, significantly improved the frequency of activated CD4+ T cells. These data suggest that preferential infection of lung macrophages that express an M2-like phenotype, such as AMs, facilitates evasion of Mtb from T cell responses. Furthermore, our human ex vivo model system provides a framework to study how suboptimal T cell responses to human macrophages infected with Mtb could be improved, informing vaccine and therapeutics development.
Results
GM-CSF and M-CSF differentiate macrophages with distinct phenotypes
To examine the relevance of M-CSF signaling on macrophages at baseline in the lungs we analyzed recent transcriptomics data from 20 different tissue samples from the Genotype-Tissue Expression project (GTEx) database, comparing the mean normalized gene expression of CSF1 (which encodes M-CSF) and CSF2 (which encodes GM-CSF)39 (www.gtexportal.org). Among 578 individuals (183 female, 395 male), both GM-CSF and M-CSF were highly expressed in the lungs. Interestingly, the normalized transcriptional expression of M-CSF was 5.5-fold higher in the lungs compared to GM-CSF (1.819 vs. 0.334; Log10(transcripts per kilobase Million (TPM)+1)) (Figure 1A). The combination of high M-CSF and GM-CSF expression in lung tissue was a differentiating factor from other mucosal tissues, and from blood, as indicated by hierarchical clustering (Figure 1A). We next compared CSF1 and CSF2 expression across individual cell types in lung tissue using single-cell RNA sequencing (scRNA-seq) data for 16 individuals from the GTEx database.40 Twelve cell types in lung tissue, annotated using single-cell transcriptomics, were found to express M-CSF including alveolar epithelial cells, alveolar macrophages, other dendritic cells (DCs) and macrophages, vascular and lymphatic endothelial cells, fibroblasts, and pericytes (Figure 1B). GM-CSF expression was limited to 5 cell types, of which only type II alveolar epithelial cells were abundant (Figures 1C and 1D; Table S1). Among type II alveolar epithelial cells, both GM-CSF and M-CSF expression were robust and comparable (Figures 1B and 1C). Although assessed in healthy lung tissue, an environment different from the inflamed lung during active TB, a significant proportion of AMs produced M-CSF (but not GM-CSF) as well as both IL-10 and TNF, the dominant cytokines secreted by M-CSF and GM-CSF MDMs, respectively27,29,30,32 (Figure 1D). Therefore, the phenotype and function of AMs and other APCs at baseline are likely influenced by both GM-CSF and M-CSF exposure.
Figure 1.

Gene expression of CSF1 and CSF2 in the lungs
(A) Heatmaps comparing mean normalized (Log10(TPM+1)) gene expression of CSF1 (M-CSF; bottom) and CSF2 (GM-CSF; top) from 578 individuals by bulk RNA-seq across 20 tissues from the GTEx consortium. Dendrogram indicates tissue sample relatedness based on hierarchical clustering of CSF1 and CSF2 expression data.
(B and C) Violin plots and (C) bar graphs of cell counts for CSF1 and CSF2 expression for each annotated cell type by single cell transcriptomics of lung tissue from 16 individuals from GTEx.
(D) Dot plots comparing co-expression of mean normalized (ln(counts per 10K reads +1)) CSF1, CSF2, TNF, and IL10 across the 12 cell types annotated from GTEx. Type II alveolar epithelial cells (blue outline) and alveolar macrophages (red outline) are highlighted for comparison of CSF1 and CSF2 expression. Created using the GTEx portal. See also Table S1.
By generating subsets of pro- and anti-inflammatory macrophages ex vivo, we established a feasible co-culture system from which to study primary human T cell responses to polarized macrophages infected with virulent Mtb. We first characterized each macrophage subset at baseline and in response to IFNγ. CD14+ monocytes were isolated from PBMCs of healthy donors by positive immunomagnetic selection and were cultivated ex vivo for 6 days with media containing either GM-CSF or M-CSF. Differentiated MDMs were then incubated for 24h with or without IFNγ and immunophenotypic characterization of the macrophages by flow cytometry was performed (Figures 2A and 2B). Compared to M-CSF MDMs, those generated using GM-CSF expressed less CD163, CD16 (FcγRIII), and CD14, increased expression of CD11b and CD206 (mannose receptor), and similar CD86 (B7-2), CD274 (PD-L1), and HLA-DR expression (Figures 2A and 2B) consistent with previous reports.27,29,30,32,41 IFNγ treatment significantly augmented CD16, CD86, HLA-DR, and PD-L1 expression on GM-CSF but not M-CSF MDMs (Figures 2A and 2B), also consistent with previous reports.27,32 While baseline CD40 expression was higher for GM-CSF MDMs, the proportion expressing CD169, a marker of lung resident AMs41,42 was greater among M-CSF MDMs (Figure 2C). IL-10 and TNF-α were previously shown to be differentially expressed by GM-CSF and M-CSF MDMs.28,29,30,32 We similarly found less accumulation of IL-10 and greater accumulation of TNFα in the supernatants of GM-CSF vs. M-CSF MDMs during differentiation (Figure 2D). Together, these data indicate that GM-CSF MDMs at baseline recapitulate the classical inflammatory M1 macrophage phenotype, while M-CSF MDMs express the phenotype of M2 macrophages.
Figure 2.

GM-CSF and M-CSF differentiate monocytes into macrophages with two distinct phenotypes
(A and B) Representative histograms and (B) summary bar graphs of phenotypic surface marker expression of CD11b+ Live-DeadLo MDMs that were differentiated for 6 days with either GM-CSF or M-CSF, followed by 24h treatment with either IFNγ or control media, analyzed by flow cytometry (mean MFI ±SD). Statistical significance was determined by Welch one-way ANOVA and Dunnett’s T3 multiple comparisons test.
(C) Representative histograms of baseline CD169 and CD40 expression of GM-CSF (black) and M-CSF (blue) differentiated MDMs. Data from a representative experiment containing 2 replicates per condition from 2 to 5 separate donors in independent experiments.
(D) Bar graph of mean (±SEM) IL-10 and TNFα concentrations by ELISA from supernatants at days 3 and 6 during MDM differentiation pooled from 4 separate donors (different symbols), with 3–4 replicates per condition. Significance was determined using a Wilcoxon matched pairs signed rank test). ∗p < 0.05, ∗∗p < 0.01.
(E–G) Representative flow cytometry plots and (F, G) summary bar graphs of mean % surface marker expression (±SD) by adherent cells isolated from BAL samples pooled from 4 separate donors. BAL macrophages were divided in 2 groups: CD206Hi CD11bLo cells (red) and CD206Hi CD11bHi cells (blue).
(H) Representative histograms of phenotypic surface marker expression comparing CD206Hi CD11bLo (red) and CD206Hi CD11bHi (blue) populations from adherent BAL cells by flow cytometry, representing 4 separate donors.
The phenotypes of GM-CSF and M-CSF macrophages were next compared to adherent cells isolated from bronchoalveolar lavage (BAL) samples of healthy volunteers. After overnight incubation, the adherent cells were harvested, and flow cytometry was performed. Gating on viable (Live-DeadLo) CD3− CD45+ EpCAM− adherent cells revealed 2 distinct subsets based on CD206 and CD11b expression (Figures 2E and 2F). The CD206Hi CD11bLo population constituted ∼90% of adherent BAL cells, expressed a CD169Hi CD11cHi CD86Hi HLA-DRHi CD163Hi CD14Lo CD16variable phenotype (Figures 2G and 2H), representing AMs based on previous reports.41,42,43 The CD11bHi BAL cells contained variable expression of CD86, CD11c, CD169 and CD163, likely representing recruited monocyte-derived cells (Figures 2G and 2H). Together, these data demonstrate that AMs express some markers specific to GM-CSF MDMs (CD206Hi CD14Lo), but show greater overall phenotypic similarity to M-CSF MDMs (CD169Hi CD206Hi, CD163Hi CD11bLo/Int)41,42 in the lungs of healthy individuals. While immune modulation during infection with Mtb or other pathogens cannot be deduced from a noninfected tissue environment, these data serve to establish the baseline phenotypes of macrophages encountered by pathogens upon exposure.
GM-CSF and M-CSF MDMs have a similar capacity to activate CD4+ T cells in response to CMV antigens
Since GM-CSF and M-CSF MDM populations represent two distinct macrophage phenotypes, we next compared their ability to elicit pathogen-specific CD4+ T cell responses. Total CD4+ T cells from healthy, cytomegalovirus (CMV) seropositive individuals were cultured with autologous MDMs loaded with either β-propiolactone (BPL)-inactivated cytomegalovirus (iCMV) or an overlapping peptide pool of the CMV pp65 antigen for 16 h, a period that facilitates antigen-specific T cell activation, cytokine secretion, and upregulation of multiple activation markers, but not proliferation.44,45,46 T cell activation induced markers (AIMs) and IFNγ secretion were evaluated by flow cytometry, as previously described.44,45,46,47,48 Both GM-CSF and M-CSF MDMs loaded with CMV antigens elicited IFNγ secretion from CD4+ T cells compared to non-loaded controls (Figures 3A and 3B, upper panels). The IFNγ+ cells were entirely within the CD45RALo subset, consistent with a memory T cell response. While both types of antigen-laden macrophages elicited IFNγ production by T cells, M-CSF MDMs elicited IFNγ secretion from a greater proportion of memory CD4+ T cells than GM-CSF MDMs after loading with iCMV but not Pp65 peptides (Figures 3A and 3B). Combinations of AIMs, including CD69, CD40L, and CD25 showed comparable CD4+ T cell activation (Figures 3A and 3B). Similar proportions of CD4+ T cells expressed activation markers in response to antigen-laden GM-CSF and M-CSF MDMs. As expected, the magnitude of T cell activation was greater in response to macrophages loaded with iCMV, compared to pp65 peptides. Therefore, despite differences in their phenotype, GM-CSF and M-CSF MDMs activated similar proportions of CD4+ T cells in response to CMV antigens.
Figure 3.

GM-CSF and M-CSF MDMs have a similar capacity to activate CD4 T cells in response to CMV antigens
(A and B) Representative (A) flow cytometry plots and (B) summary bar graphs comparing the expression of IFNγ (top rows) or co-expression of activation markers (CD69 and CD40L or CD25) on CD3+ CD4+ T cells from CMV seropositive individuals after co-culture with either GM-CSF or M-CSF autologous MDMs loaded with either with BPL-inactivated whole CMV or a pp65 overlapping peptide library. Data are representative of 3 independent experiments and separate donors with 2–4 replicates per condition. Statistical significance was determined by Welch one-way ANOVA and Dunnett’s T3 multiple comparisons test. ∗p < 0.05, ∗∗p < 0.01, or not significant (ns).
Mtb infection affects macrophage phenotype in proportion to bacterial burden
Prior studies have demonstrated the lack of a T cell response during the first 1–2 weeks after aerosol Mtb infection in mice.4,17,18,19 Inconsistent recognition of Mtb-infected macrophages by antigen-specific T cells has also been shown.5,7,16 Therefore, we sought to optimize an ex vivo model to co-culture Mtb-infected macrophages with memory T cells to quantify the direct recognition of infected macrophages. To maximize the proportion of macrophages infected with Mtb, obtain a physiological multiplicity of infection (MOI), and maintain cell viability, we tested a range of MOIs. Using Mtb strain H37Rv expressing yellow fluorescent protein (YFP-Rv),16,49,50 we compared the proportion of infected (YFP+) macrophages, macrophage viability, and phenotype at an MOI range of 1–20. At MOI 1, approximately 80% of M-CSF MDMs were found to be infected 24h after a 4h incubation with YFP-Rv, and at MOI of 5 approximately 95% were infected (Figures 4A and 4B). Notably, fewer GM-CSF MDMs became infected under the same conditions with approximately 55% and 80% infected at MOIs 1 and 5, respectively (Figures 4B, S1A, and S1B). While the number of infected (YFP+) cells increased from MOI 1 to 5, viability was similar or modestly reduced (Figures 4C and 4D). Approximately 70–75% of total cells retained high forward and side scatter measurements at MOIs 1–5, of which approximately 95% and 75% were viable (Live-DeadLo) at MOIs 1 and 5, respectively (Figures 4C and 4D). At MOIs 10 and 20, nearly all macrophages were infected but viability was further reduced (Figures 4A and 4C). Taken together, infection of macrophages at MOI 5 struck the balance of maximizing the proportion of infected cells and preserving macrophage viability.
Figure 4.

Mtb infection affects macrophage phenotype in proportion to bacterial burden
(A) Representative histograms of YFP expression from YFP-Rv infected M-CSF MDMs at several MOIs.
(B) Summary bar graphs comparing the % YFP+ (±SD) of M-CSF vs. GM-CSF MDMs at MOI 0, 1, 5.
(C) Flow cytometry plots comparing FSC and SSC of M-CSF MDMs infected at different MOIs.
(D) Bar graph comparing the viability (mean ± SD Live-Dead expression) of YFP-Rv infected MDMs by flow cytometry.
(E and F) Representative histograms and (F) summary bar graphs comparing phenotypic surface marker expression (mean MFI ±SD) of YFP-Rv infected M-CSF MDMs at each MOI.
(G) Representative histograms of YFP expression from YFP-Rv infected adherent BAL macrophages at each MOI.
(H and I) Representative histograms and (I) summary bar graphs (mean ± SD) comparing phenotypic surface markers between Mtb-infected (YFP+) and non-infected adherent BAL cells.
Data represent independent experiments from 3 separate donors, with 2–3 replicates per condition. Significance was determined by Wilcoxon matched pairs signed rank test. ∗∗p < 0.01, ∗∗∗∗p < 0.0001, or not significant (ns). See also Figures S1 and S2.
To determine how macrophage phenotype varied with MOI, the expression of surface receptors 24 h post-infection was compared. CD38, DLL4, CD40, and PD-L1 were previously shown to be upregulated on Mtb-infected cells.25,27,50,51 Expression of these markers, together with CD86 and HLA-DR were similarly increased on Mtb-infected macrophages in our system (Figures 4E and 4F). Expression was sub-maximal at MOI 1, maximally increased at MOI 5, and did not increase further at MOIs 10–20 (Figure 4E). The expression of CD11c, CD16, and CD14 decreased in proportion to MOI (Figures 4E and 4F). Bacterial colony-forming units (CFU) plated 24h after infection of GM-CSF and M-CSF MDMs at an intended MOI (iMOI) of 5 resulted in an actual MOI (aMOI) between 1.5 and 2 (Figures S1C and S1D) for both GM-CSF and M-CSF MDMs (Figure S1E). In contrast to MDMs, approximately 90% of the adherent cells isolated from BAL expressed a CD206Hi CD11bLo phenotype (Figures 2E and 2F), representing AMs as previously described.41,52,53 While fewer AMs became infected after incubation with YFP-Rv (Figure 4G) compared to M-CSF MDMs (Figure 4A), the proportion of YFP-Rv-infected AMs was comparable to GM-CSF MDMs (Figure 4B). Similar to MDMs, minimal changes in phenotypic surface markers were observed 24h after infection at MOI 1 with Mtb strain H37-Rv (Figure S2). However, YFP-Rv infection allowed us to gate specifically on Mtb-infected macrophages where increases in PD-L1, CD86, HLA-DR, and CD40 were observed (Figures 4H and 4I). Although CD16 expression varied, surface receptor expression was otherwise similar to Mtb-infected M-CSF MDMs (Figures 4E and 4F). At MOI 4–5, the expression of CD40, HLA-DR, and PD-L1 further increased, while increases in CD86 and HLA-DR expression were modest (Figures 4H and 4I). Expression of CD11c and CD16 decreased between MOI 1 and MOIs 4–5. Overall, the effect of Mtb infection of AMs with an MOI of 4–5 was comparable to M-CSF MDMs.
After Mtb infection, GM-CSF and M-CSF MDMs differ in capacity to activate CD4+ T cells
Despite the phenotypic differences observed between GM-CSF and M-CSF MDMs, when loaded with exogenous antigen (iCMV, peptides), we found both macrophage subsets to activate a similar proportion of CD4+ T cells (Figure 3). We therefore tested the extent to which GM-CSF and M-CSF MDMs could activate CD4+ T cells after intracellular infection with virulent Mtb. One day after in vitro infection of GM-CSF and M-CSF MDMs with Mtb, autologous memory CD4+ T cells from healthy individuals with latent Mtb infection (LTBI) (see STAR methods) were isolated by immunomagnetic negative selection from PBMCs and co-cultured with infected macrophages for 16h. Aggregate data from 10 different donors demonstrated a 3- to 4-fold greater proportion of CD4+ T cells activated in response to Mtb-infected GM-CSF vs. M-CSF MDMs by co-expression of CD69 and IFNγ (0.307 ± 0.085% vs. 0.070 ± 0.022%; mean ± SEM) (Figure 5A), CD69 and CD40L (0.557 ± 0.065% vs. 0.168 ± 0.050%) (Figure 5B), and CD69 and CD25 (0.394 ± 0.044% vs. 0.106 ± 0.039%) (Figure 5C). T cell activation was reduced with α-MHC-II (HLA-DR/-DQ/-DP) mAb blockade (Figures 5A–5C and S3) indicating MHC-II dependent T cell activation. The T cell response to M-CSF MDMs infected with Mtb was similar to α-MHC-II blockade controls, indicating a general lack of specific activation by infected M-CSF MDMs (Figures 5A–5E, S4A, and S4B). In contrast to Mtb infection, but similar to the response to CMV antigens (Figure 3), both GM-CSF and M-CSF MDMs elicited robust CD4+ T cell activation under non-infectious conditions after treatment with a whole cell lysate preparation of Mtb (strain H37Rv), and T cell activation was similarly reduced with α-MHC-II mAb blockade (Figures 5D and 5E). Interestingly, the addition of Mtb lysate to Mtb-infected M-CSF MDMs only modestly increased memory CD4+ T cell activation, suggesting active inhibition of T cell responses to Mtb-infected M-CSF but not GM-CSF MDMs (Figures 5B and 5C). IFNγ secretion mirrored the AIM responses of CD4+ T cells to Mtb infected MDMs (Figures 4A and S4A), although responses to Mtb lysate were not assessed. Together, these findings demonstrate that M-CSF-elicited macrophages, which express an M2-like phenotype, can activate CD4+ T cells when left uninfected and loaded with exogenous antigen, but not after infection with virulent Mtb.
Figure 5.

Mtb-infected GM-CSF and M-CSF MDMs differ in capacity to activate CD4+ T cells
(A–C) Summary bar graphs of pooled data from 10 separate individuals of activation marker co-expression (mean ± SEM) of CD69 with (A) IFNγ, (B) CD40L, and (C) CD25 gated on CD45RALo CD4+ T cells after 16h co-culture with either Mtb-infected (MOI 5) or non-infected (Non-Inf) GM-CSF vs. M-CSF MDMs. Each symbol represents the mean of 2–3 replicates from independent experiments. Statistical significance for pooled data were determined by Wilcoxon matched pairs signed rank test.
(D and E) Summary bar graphs comparing mean % of CD45RALo CD4+ T cells (±SD) that co-express (D) CD69 and CD40L or (E) CD69 and CD25 after 16h in co-culture with Mtb-infected (MOI 5) or non-infected autologous GM-CSF vs. M-CSF MDMs in a representative experiment. Significance was determined by one-way ANOVA and Sidak’s multiple comparisons test.
(F) Bar graphs comparing YFP MFI (mean ± SD) of GM-CSF vs. M-CSF MDMs 24h and 48h after YFP-Rv infection at MOI 1. Significance was determined by student’s t-tests.
(G–J) Summary bar graphs comparing mean (±SD) co-expression of (G) CD69 and CD40L or (H) CD69 and IFNγ by CD45RALo CD4+ T cells after 16h in co-culture with Mtb-infected (MOI 1) or non-infected, Irrad Mtb-treated MDMs, and (I and J) representative FACS plots. Significance was determined by one-way ANOVA and Sidak’s multiple comparisons test.
Data are representative of 3 (lysate), 3 (Irrad-Mtb), 7 (IFNγ response), and 10 (activation markers) independent experiments using 10 separate donor samples with 2–3 replicates per condition. ∗p < 0.05, ∗∗p < 0.01, ∗∗∗p < 0.001, ∗∗∗∗p < 0.0001, or not significant (ns). See also Figures S3 and S4.
Although infected M-CSF MDMs elicited fewer activated CD4+ T cells, we also observed that more M-CSF than GM-CSF MDMs became infected after incubation with YFP-Rv (Figure 4B). Yet, increased bacterial burden is also associated with increased antigen load,5,15,50 which should augment T cell activation. Using the same YFP-expressing Mtb strain, Lee et al. demonstrated a direct correlation between YFP median fluorescence intensity (MFI) and the number of bacilli contained by infected cells in vivo.50 Using YFP MFI as a surrogate for Mtb burden at a non-saturating level of infection (MOI 1), we observed a higher bacterial burden for M-CSF vs. GM-CSF MDMs, which increased between 24h and 48h post-infection (Figure 5F). The lower rate of infection with Mtb (Figure 2B) and the lower YFP MFI (Figure 5F) indicate that GM-CSF MDMs are both less permissive for infection and show greater capacity to attenuate bacterial growth than M-CSF MDMs. Neither IFNγ treatment of Mtb-infected M-CSF MDMs (24h prior to adding T cells) (Figures 5D, 5E, and S4B), infection of M-CSF MDMs with a higher MOI of 20, nor the addition of T cells at later time points (48h or 72h) post-infection significantly improved T cell activation (Figures S4C and S4D). Therefore, despite being more permissive for Mtb infection, M-CSF MDMs containing an M2 phenotype less frequently activate CD4+ T cells.
Since M-CSF macrophages contain a higher bacterial burden, we next tested the hypothesis that M-CSF MDMs infected at a lower MOI would more efficiently elicit T cell activation due to reduced pathogenic effects on the macrophage. M-CSF MDMs infected at MOI 1 express a surface receptor phenotype that is less differentiated and closer to the noninfected baseline than infection at MOI 5 (Figures 4E and 4F). Yet, M-CSF MDMs infected at MOI 1 again did not efficiently activate memory CD4+ T cells compared to GM-CSF MDMs (Figures 5G–5J). These data indicate that the pathogenic effects of a higher infectious burden do not explain the hampered ability of M-CSF MDMs to activate memory CD4+ T cells. Finally, in addition to Mtb lysate (Figures 5E and 5F), we also evaluated the responses of memory CD4+ T cells to noninfected macrophages cultured with gamma-irradiated H37Rv (Irrad Mtb), which have structurally intact cell walls but are nonviable.54,55 Similar to Mtb lysate (and in contrast to infection), memory CD4+ T cell activation was robust in response to both noninfected GM-CSF and M-CSF MDMs loaded with Irrad Mtb (Figures 5G–5J). Interestingly, there was a modest reduction in memory CD4+ T cell IFNγ production but not AIM expression in response to M-CSF MDMs treated with Irrad Mtb (Figures 5I and 5J). Together, these indicate that impairment of T cell activation by M-CSF MDMs is specific to infection with virulent Mtb.
M-CSF macrophages express increased PD-L1 and IL-10 after Mtb infection
Reduced surface MHC-II expression has been reported >48h after infection of macrophages with Mtb in the mouse model.8,56 To test the hypothesis that a decreased surface expression of MHC-II or costimulatory receptors on Mtb-infected human M-CSF MDMs could account for their inability to stimulate Mtb-specific CD4+ T cells, we compared the surface receptor expression of GM-CSF vs. M-CSF MDMs infected with Mtb. We found that MHC-II (HLA-DR) expression did not decrease within 24-48h of Mtb infection, and remained higher on M-CSF MDMs at these early time points (Figures 4C and 6A). The expression of co-receptors CD86, PD-L1, and CD40 increased within 24h of Mtb infection (Figure 6A). While CD40 expression was similar between GM-CSF and M-CSF MDMs, the expression of CD86 and CD206 was greater on Mtb-infected GM-CSF MDMs, whereas PD-L1 and CD14 expression was greater on Mtb-infected M-CSF MDMs (Figure 6A). By comparison, treatment of non-infected MDMs with Mtb lysate led to similar increases in PD-L1 and CD40 expression, and reduced HLA-DR and CD86 expression (Figure 6B). CD86 and PD-L1 coreceptors are known to contribute to T cell activation and inhibition, respectively. However, both lysate treatment and Mtb infection of M-CSF MDMs elicited parallel changes in CD86 and PD-L1 surface expression, despite differences in their capacity to elicit memory CD4+ T cell activation (Figure 5). However, only intra-experimental conditions were compared given the variability in surface receptor MFI values observed between experiments (Figures 6A and 6B). Interestingly, CD14 expression on M-CSF MDMs increased with lysate treatment but not Mtb infection (Figures 6A and 6B). In response to Mtb infection or lysate treatment, CD206 and CD14 remained preferentially expressed on GM-CSF and M-CSF MDMs, respectively, consistent with the phenotypes of M1-like and M2-like macrophages (Figures 2A and 2B).
Figure 6.

M-CSF macrophages contain increased PD-L1 and IL-10 expression after Mtb infection
(A and B) Bar graphs comparing mean (±SD) MFI of (A) phenotypic surface markers of Mtb-infected (MOI 1) GM-CSF and M-CSF MDMs, harvested at 24 or 48hrs post-infection, or (B) 24h after treatment of non-infected MDMs with Mtb lysate. Data represent 2–3 replicates per condition in experiments with samples from 5 separate donors. Significance was determined by Welsh one-way ANOVA with a Dunnett’s T3 multiple comparisons test.
(C and D) Bar graphs comparing mean (±SEM) cytokine concentrations in supernatants 24h after Mtb-infected GM-CSF or M-CSF MDMs using the Mesoscale Discovery multiplex cytokine assay. Each symbol represents the mean of 2 replicates from each of 5–8 separate donors. Significance was determined by Wilcoxon matched pairs signed rank test. ∗p < 0.05, ∗∗p < 0.01, ∗∗∗p < 0.001, not significant (ns). See also Figure S5.
To determine the potential contributions of inflammatory or inhibitory cytokine and chemokine production by Mtb-infected GM-CSF vs. M-CSF MDMs, we performed multiplexed analyses from macrophage supernatants 24h after Mtb infection, comparing non-infected, MOI 1 and MOI 5. Of the 37 analytes measured among 6–8 individuals, differences between Mtb-infected GM-CSF vs. M-CSF MDMs were observed for 15 analytes. These were divided into those with higher concentrations among Mtb-infected M-CSF MDMs (IL-1β, IL-8, IL-10, IL-18, IL-27, MCP-1) vs. GM-CSF MDMs (TNFα, IL-4, IL-6, IL-12p70, IL-23, CXCL10, MIP-1β, MIP-3β, and M-CSF), (Figures 6C and S5). The majority were inflammatory cytokines produced by GM-CSF MDMs that differed only at the higher MOI of 5. Interestingly, M-CSF was secreted by GM-CSF MDMs, consistent with lung single-cell transcriptomics data (Figure 1). Despite preferential expression by GM-CSF MDMs, IL-4 concentrations were very low (generally <5 pg/mL) (Figure S5). Of note, cytokines usually associated with T cells (IL-2, IL-4, IL-13, IFNγ and IL-17A/F) were all detected at relatively low concentrations (Figure S5). Despite at least 90–95% purity reported after CD14 positive selection from PBMCs,57,58 6 days of macrophage differentiation, and wash steps to remove non-adherent cells following in vitro Mtb infection, we cannot rule out the possibility that small numbers lymphocytes contaminating our MDM cultures are responsible their production. IL-1 family cytokines (IL-1β and IL-18) are well described in the response to Mtb infection.49,59 However, little T cell activation was observed in response to Mtb-infected M-CSF MDMs (Figure 5), where IL-1β and IL-18 were present at increased concentrations. IL-8 and MCP-1 act as chemoattractants for neutrophils, monocytes, and lymphocytes.60 IL-10 and IL-27 act both on macrophages and T cells as regulators of inflammation, particularly in the context of TB.61,62,63 Despite serving as another key regulator of T cell function, concentrations of TGFβ were similar between Mtb-infected GM-CSF and M-CSF MDMs (Figure 6D). Therefore, we considered IL-10 to be a candidate regulator of T cell activation in our system, acting either directly or indirectly, given its preferential secretion by M-CSF MDMs and reported induction by IL-27.64
α-IL-10 mAb treatment increases the proportion of T cells activated in response to Mtb-infected M-CSF macrophages
To confirm the observed differences in IL-10 secretion in a single-analyte assay, ELISAs were performed on supernatants 24h after Mtb infection. IL-10 was preferentially secreted by M-CSF MDMs infected at MOI 1 and 5, while TNFα was preferentially secreted by infected GM-CSF MDMs at MOI 5 (Figure 7A), consistent with previous results.27 Treatment of non-infected macrophages with Mtb lysate for 24h also led to preferential TNFα secretion by GM-CSF MDMs (Figure 7B). While a trend toward greater TNFα secretion was observed after irradiated Mtb treatment of GM-CSF MDMs, levels were reduced compared to Mtb lysate treatment. IL-10 production trended higher for M-CSF MDMs, and was produced by both macrophage subsets upon treatment with Mtb lysate, but lower levels of IL-10 were observed after Irrad Mtb treatment (Figure 7B). Multiplexed analyses of 7–14 additional cytokines in response to MDMs treated with Irrad Mtb and/or lysate, showed IL-23, CCL17, and M-CSF to be preferentially secreted by GM-CSF MDMs, but cytokine responses were otherwise similar between GM-CSF and M-CSF MDMs (Figure S6). Interestingly, 5- to 10-fold greater concentrations of IL-10, IL-6 and IL-23 (but not IL-12) were observed among both macrophage subsets in response to Mtb lysate, compared to Mtb infection (Figures 7B, S6, and 6C). In contrast, secretion of IL-1β and IL-18 were greater after Mtb-infection. Since increased IL-10 secretion was associated with impaired T cell activation by Mtb infected but not uninfected, lysate-treated M-CSF MDMs, we reasoned that the contribution of IL-10 signaling to reduced T cell activation is specific to Mtb infection.
Figure 7.

α-IL-10 mAb treatment increases the proportion of T cells activated in response to Mtb-infected M-CSF macrophages
(A and B) Summary bar graphs of pooled data for mean (±SEM) IL-10 and TNFα concentrations (A) by ELISA in supernatants 24h after Mtb-infection of GM-CSF or M-CSF MDMs, and (B) 24h after treatment of non-infected MDMs with Mtb lysate or Irrad Mtb by Mesoscale Discovery multiplexed cytokine analysis from 5 to 8 separate donors. Each symbol represents the mean of 2 replicates from individual donors. Significance was determined by Wilcoxon matched-pairs signed-rank test.
(C–F) Summary (C) bar graphs and (D) flow plots of a representative experiment comparing mean (±SD) memory CD4+ T cell activation by co-expression of CD69 and IFNγ or (E,F) CD69 and CD40L after 16h co-culture with Mtb-infected MDMs ± α-IL-10 or α-PD-L1 mAb treatment added immediately after Mtb-infection. Data are representative of 3–10 independent experiments using 9 separate donor samples with 2–3 replicates per condition. Statistical significance was determined by one-way ANOVA and Sidak’s multiple comparisons test.
(G) Summary bar graphs of T cell activation pooled from 10 experiments containing 9 separate donors which compare mean (±SEM) %CD69+CD40L+ memory CD4+ T cells in response to Mtb-infected GM-CSF or M-CSF MDMs ± α-IL-10, α-PD-L1, or α-MHC-II mAbs. Closed symbols represent experiments using “early” α-IL-10 administration (upon washout of Mtb infection), open symbols represent “late” α-IL-10 (added with T cells). Statistical significance for pooled data was determined by a paired samples Friedman test with Dunn’s multiple comparisons test.
(H) IL-10 concentrations in cell culture supernatants 24h post-Mtb infection of M-CSF MDMs ± α-IL-10 mAb treatment from 7 independent experiments. Significance was determined by Wilcoxon matched pairs signed rank test. ∗p < 0.05, ∗∗p < 0.01, ∗∗∗p < 0.001, ∗∗∗∗p < 0.0001, not significant (ns). See also Figure S6.
Given the lack of T cell activation and preferential expression of both IL-10 and PD-L1 by Mtb-infected M-CSF MDMs, we tested the hypothesis that IL-10 neutralization or PD-L1 blockade would improve memory CD4+ T cell activation. Mtb-infected M-CSF MDMs were treated with either α-PD-L1 blocking mAb or α-IL-10 neutralizing mAb immediately after Mtb infection, and memory CD4+ T cell activation was assessed by IFNγ secretion or co-expression of CD69 and CD40L. While a trend toward increased T cell activation in some experiments was observed in response to Mtb-infected M-CSF MDMs treated with α-PD-L1 mAb blockade or IFNγ, IL-10 neutralization significantly improved T cell activation in response to M-CSF MDMs when added immediately post-infection (Figures 7C–7F). Combined data for 8–10 experiments demonstrate that IL-10 neutralization significantly increased the proportion of activated memory CD4+ T cells that responded to M-CSF MDMs when added immediately after infection of cells with Mtb (Figure 7G). Although increased, T cell responses to M-CSF MDMs treated with α-IL-10 mAb did not typically reach the proportion activated by Mtb-infected GM-CSF MDMs (Figures 5A–5C and 7C–7E). IL-10 was not detected in cell culture supernatant for M-CSF MDMs that received α-IL-10 mAb treatment, although steric interference between neutralization and detection antibodies could also explain these results (Figure 7H). Therefore, we conclude that IL-10 is a key contributor but does not solely explain the impaired T cell response to Mtb-infected M-CSF MDMs.
Discussion
Macrophages are the major population of lung resident phagocytes and serve as targets for infection by Mtb, providing an essential niche for bacterial survival and escape from host defense mechanisms. In this study we show that two phenotypically distinct human macrophage populations differ in their capacity to elicit CD4+ T cell activation after infection with Mtb. Using macrophages generated from CD14+ monocytes cultured with the differentiating cytokines GM-CSF or M-CSF, we found that Mtb-infected GM-CSF but not M-CSF MDMs were recognized by autologous memory CD4+ T cells. Yet, in the absence of infection both GM-CSF and M-CSF MDMs elicited robust CD4+ T cell activation after treatment with exogenous antigens or gamma-irradiated Mtb. While work in the mouse model of TB recently demonstrated that some Mtb-specific T cells do not recognize Mtb-infected cells,5,13,16 our study demonstrates that human CD4+ T cells also lack recognition of certain Mtb-infected macrophage populations. The ability of Mtb to avoid T cell recognition upon infection of macrophages with an M2-like phenotype has several fundamental implications. First, macrophages that contain a phenotype similar to M-CSF MDMs in vivo likely evade Mtb-specific CD4+ T cells, delaying adaptive immunity and providing an early survival niche which promotes bacterial spread. Second, since M-CSF MDMs do elicit CD4+ T cell activation when left uninfected and loaded with exogenous antigens or irradiated Mtb, an active virulence mechanism acts to shield infected M2-like but not M1-like macrophages from CD4+ T cell recognition. Furthermore, these results indicate that M2-like macrophages could act as decoys in the lung during TB, diverting protective Mtb-specific T cells away from infected cells even in the presence of IL-10 (Figure 7), as previously suggested in the mouse model of TB.5,16 AMs naturally limit early inflammation in response to many pathogens and allergens, preventing overwhelming inflammation in the lung to preserve alveolar gas exchange.65,66 Given the paucity of Mtb-specific T cells in the lungs during the initial 10 days after aerosol Mtb infection in mice,4,9,18 and the phenotypic characteristics shared between M-CSF MDMs and lung resident AMs41 (Figure 2), we speculate that populations of Mtb-infected AMs similarly evade T cell recognition in vivo.
Essential to the control of Mtb infection is the ability of CD4+ T cells to directly respond to macrophages harboring the bacteria. However, both recruited and lung-resident macrophage populations are diverse and vary in their inflammatory and antigen-presenting capacity in response to Mtb.22,23,67 AMs account for nearly all Mtb-infected cells during the first 10 days after aerosol infection in the mouse model of TB22,23 and memory CD4+ T cell activation is not observed in the lungs during this time.4,9 However, as infection progresses, the distribution and phenotype of APCs that harbor Mtb become more diverse.22,23,24,25,50 Human AMs are understudied in the context of Mtb infection as their isolation requires BAL or tissue biopsy. Since M-CSF is produced by lung epithelial cells, endothelial cells, and even AMs at baseline in the lung (Figure 1), the phenotype of pulmonary macrophages is likely influenced by M-CSF in addition to GM-CSF. Our results suggest that the exposure of lung resident macrophages and recruited monocytes at baseline can predispose them to an anti-inflammatory response upon subsequent infection with Mtb, preventing CD4+ T cell recognition. Exposure to a range of concentrations of both GM-CSF and M-CSF were shown to yield overlapping macrophage phenotypes that included inflammatory and anti-inflammatory cytokine secretion.28,34 Furthermore, IL-10 and CCL17 produced by M2-like macrophages was shown to inhibit the generation of conventional inflammatory macrophages.68 These data, together with the observed differences in MDM phenotypes at baseline (Figure 2) and upon Mtb infection or lysate treatment (Figure 6), reinforce the concept that macrophages in the lung are likely phenotypically heterogeneous as a result of differences in their exposure history to M-CSF and GM-CSF in particular. Therefore, the predisposition of individual pulmonary macrophages to a pro- or anti-inflammatory response to Mtb infection likely depends on the integration of multiple signaling pathways. We posit that the extent to which AMs are exposed to M-CSF will negatively correlate with their ability to activate CD4+ T cells. Since AMs constitute the majority of lung mononuclear phagocytes and are the exclusive population of APCs found to be infected early after aerosol Mtb inoculation in the mouse model,22,23 an impaired ability to activate Mtb-specific T cells by Mtb-infected AMs would promote exponential Mtb growth.
M-CSF MDMs were previously shown to preferentially express IL-10 within 24h of Mtb infection.27,61,69 Our data recapitulate the IL-10 production in response to Mtb infection of M-CSF MDMs and relate its effects to a concurrent lack of CD4+ T cell recognition of infected MDMs. Interestingly, we also find that IL-10 is produced in response to treatment of MDMs with gamma-irradiated Mtb and lysate, where T cell activation is successful. IL-10 could limit T cells either by direct inhibition of T cell activation70 or via indirect regulation of macrophages by impairing TLR or IFNγ signaling,71 induction of March1-dependent reduction of MHC-II expression,72,73 or impairment of phagosome maturation.63 In our system, prevention of T cell activation within 16h of co-culture with infected M-CSF MDMs is observed (Figure 5) and levels of surface MHC-II were not reduced upon Mtb infection or between macrophage subsets (Figure 6A). Since anti-IL-10 mAb added immediately post-infection (24h prior to T cells), but not later, improved T cell activation, it likely acts on the infected macrophages. The arrest of phagosome maturation by secretion of Mtb virulence factors has been previously demonstrated,74,75,76,77 but the link between these SecA2 ATPase-dependent bacterial proteins and IL-10R signaling has not been characterized. An impairment of phagolysosomal fusion would reduce the processing of Mtb antigens after phagocytosis of virulent Mtb but might not be required for Mtb lysate which contains degraded proteins and peptides. Since treatment of M-CSF MDMs with intact, irradiated Mtb also led to CD4+ T cell activation, we speculate that impairment of phagosome maturation by Mtb virulence factors optimally functions in the presence of IL-10R signaling. The amounts of processed antigens available between virulent Mtb infection, irradiated Mtb, and lysate could account for differences in T cell activation, considering the greater amounts of bacterial products (including pattern recognition receptor (PRR) ligands) readily available with Mtb lysate. Finally, direct loading of peptides onto MHC, or presentation of those that require minimal phagolysosomal processing, could circumvent immune suppressive mechanisms of virulent Mtb.
Serum cytokine assessments during active TB in humans, experiments using anti-IL-10 mAb treatment in NHPs, and the decreased survival observed for IL-10−/− mice challenged with aerosol Mtb infection support the notion that IL-10 responses during TB contribute to Mtb pathogenesis rather than host defense.61,69,78,79,80 Hyunh et al. recently demonstrated that conditional KO of the IL-10 regulatory transcription factor Bhlhe40 in CD4+ and CD11c+ (but not LysM+) cells, led to increased IL-10 and decreased survival in mice.31 These results indicate that IL-10 signaling in certain macrophage and DC populations, as well as CD4+ T cells, are detrimental during TB. Compared to T cells, a recent study indicated a lower threshold for IL-10 to signal on APCs like macrophages.81 Furthermore, IL-10 acts to regulate T cell responses indirectly both by reducing macrophage production of IL-12, IL-23, TNF and IL-6, and by impairing antigen processing and presentation through inhibition of phagolysosomal fusion.27,63,82,83,84 In our system, the early and dramatic prevention of T cell activation in response to Mtb-infected M-CSF MDMs occurs prior to changes in surface MHC-II levels and is not fully restored with IL-10 neutralization. This suggests that IL-10 signaling acts in concert with inhibitory mechanisms caused by Mtb infection of the macrophage, like impairment of phagosome maturation. This also highlights how antigen transfer to non-infected cells, also referred to as the decoy phenomenon for T cells, could occur in the presence of IL-10 in the lungs.5,15,26 While M-CSF MDMs preferentially secrete IL-10, T cell production of IFNγ and IL-2 have been shown to lower production of IL-10 by APCs.85,86 Therefore, the inability of T cells to recognize M2-like macrophage populations upon infection with Mtb could be multifactorial where early IL-10 exposure dampens the production of IL-12 and IL-23, and simultaneously reduces phagosome maturation, antigen processing and presentation. However, as Mtb infection progresses in the lungs, additional immune cells are recruited which diversifies the infected APC subsets.22,23,50
Although T cells do not always recognize macrophages infected with Mtb, T cell activation does occur in the infected host. The most well-recognized example is T cell priming in murine lung-draining MLNs.4,17,18,19,26 Both naive and memory Mtb-specific CD4+ T cells were shown to first become activated in MLNs, not the lungs, implying differences among the capacities of professional APCs to activate T cells once infected with Mtb.4,17,18,19 Lai et al. identified two different dendritic cell (DC) subsets that transport Mtb from the lungs to the MLNs in the mouse model of TB.87 However, CD103+ DCs became more heavily infected and produced IL-10, resulting in a reduction in IL-12 and an impairment of expansion and Th1-skewing of Ag85b-specific CD4+ T cells by Mtb-infected CD11b+ DCs. This dichotomy resembles the polarized human macrophage subsets in our system. Xu et al. recently showed how excess TNF produced in response to chronic co-infection with lymphocytic choriomeningitis virus (LCMV, clone 13) in mice led to an early attenuation of Mtb growth but delayed the trafficking of Mtb-infected CD11b+ DCs from lung to MLNs, which resulted in delayed priming.88 These data imply that the outcome of infection with Mtb could depend on the phenotype of the engulfing macrophage. At one extreme, if inflammatory, M1-like macrophages were exclusively infected they might rapidly attenuate Mtb growth but could delay T cell priming in lung-draining lymph nodes or might even sterilize the infecting bacteria. On the other hand, our data for M-CSF MDMs suggest that the Mtb-specific effector T cells that traffic to the lungs would not recognize Mtb-infected M2-like cells regardless of expedient transport to lymph nodes and T cell priming. Therefore, preferential infection of M2-like macrophages could lead to continued exponential bacterial growth until the majority of infected macrophages were those able to be recognized by T cells and a steady state is reached, representing active TB disease. In reality, there is likely a spectrum of lung resident macrophage phenotypes that become infected resulting in early control in some cases, and progression in other cases. The balance of such a heterogeneous response to infection could determine which individuals progress to active disease. Finally, while GM-CSF MDMs appear to attenuate bacterial growth more efficiently than M-CSF MDMs (Figure 5F), it is unclear whether this represents sequestration and restriction of Mtb growth restriction or killing.
We posit that vaccines and targeted host–directed therapies that promote antigen presentation and T cell activation by infected macrophages could be used to reduce the incidence of active disease among high-risk individuals with LTBI. While it seems plausible that Mtb infection of M2-like macrophages would facilitate progression to active disease, it is also possible they serve a protective role during active TB by limiting inflammation. For host survival, the lungs need to efficiently exchange gas. Therefore, an overwhelming inflammatory response to Mtb infection could be fatal, as previously observed with PD-1 blockade.89,90 In addition to their immune-activating role, the observation that the M1-like macrophages secrete M-CSF upon infection with Mtb (Figure 6C), could make them key players in limiting inflammation by ensuring that some newly recruited monocytes acquire an anti-inflammatory phenotype. As a result, the developing M2-like macrophages located at the periphery of the inflammatory infiltrates and granulomas might serve to limit inflammation. While neutralization of IL-10 early after inoculation could allow a greater proportion of CD4+ T cells to recognize infected macrophages and control infection, it also has the potential to exacerbate inflammation during active TB. Interestingly, Wong et al. recently showed that 4–8 weeks of IL-10 neutralization administered during infection in the NHP model of TB led to increased production of inflammatory cytokines in lung granulomas and MLNs without increasing the inflammatory pathology.80 These data demonstrate that the effects of IL-10 signaling are complex and targeted not systemic IL-10 modulation may be required to achieve a protective effect against Mtb. Our data add to the literature that associate IL-10 signaling with indirect impairment of T cell activation71 and highlight the importance of direct recognition of Mtb-infected cells by T cells previously demonstrated in animal models3,5,16 and humans.91 Furthermore, our work suggests that generation of memory T cells that directly recognize Mtb-infected AMs, and other M2-like macrophage populations, could serve as a benchmark in the development of vaccines that aim to prevent active TB.
Limitations of the study
Our study compares the response of primary human CD4+ T cells to two different phenotypes of Mtb-infected macrophages but has some limitations. Although the M-CSF MDMs in our study share several phenotypic markers with lung resident macrophages from BAL, their expression is not identical and the extent to which our MDMs recapitulate the response of lung macrophages that encounter Mtb in humans is not known. While the mouse model cannot fully address this limitation due to differences between humans and mice, including exposures to microbes and the environment, the NHP model of TB could be used for in vivo follow-up studies. An assessment of human memory CD4+ T cell responses to autologous lung resident macrophages from individuals with LTBI is technically challenging but would also provide context for our findings. Human immune cell responses are heterogeneous and diverse. Therefore donor-to-donor variability among T cells and macrophages is a limitation to our approach. Only intra-experimental differences in macrophage surface receptor phenotype were compared given the wide range of baseline MFI values observed between experiments, affected by differences in voltage settings and fluorescent compensation for each experiment. Although the magnitude of the responses varied, our discovery that T cells lacked activation in response to M-CSF macrophages infected with Mtb was consistent among >10 donors and to our knowledge has not been previously described. Our ex vivo assay focuses on the interactions of CD4+ T cells with macrophages infected with virulent Mtb under BSL-3 conditions. However, our assay does not account for additional cell-cell interactions that occur during natural infection in the lung which could further impact T cell activation. Despite these drawbacks, our ex vivo model provides a proof of principal that memory CD4+ T cells with specificity for Mtb antigens can lack recognition of infected macrophages that express an M2-like phenotype, providing a framework for studies that aim to improve T cell recognition.
STAR★Methods
Key resources table
| REAGENT or RESOURCE | SOURCE | IDENTIFIER |
|---|---|---|
| Antibodies | ||
| Ultra-LEAF purified anti-human IL-10 (clone JES3-19F1) | Biolegend | Cat# 506813; RRID: AB_2814433 |
| Ultra-Leaf Purified anti-human CD40 (W17212H) | Biolegend | Cat# 668104; RRID: AB_2814511 |
| Purified NA/LE Mouse Anti-Human HLA-DR (L243) | BD Pharmingen | Cat# 555809; RRID: AB_396143 |
| Purified NA/LE Mouse Anti-Human HLA-DR, DP, DQ (Tü39) | BD Pharmingen | Cat# 555556; RRID: AB_395938 |
| Ultra-LEAF purified anti-human PD-L1 (MIH3) | Biolegend | Cat# 374502; RRID: AB_2715967 |
| BUV395 Mouse Anti-Human CD69 (FN50) | BD Biosciences | Cat# 564364; RRID: AB_2738770 |
| BUV395 Mouse Anti-Human CD40 (5C3) | BD Biosciences | Cat# 565202; RRID: AB_2739110 |
| BUV737 Mouse Anti-Human CD3 (UCHT1) | BD Biosciences | Cat# 612750; RRID: AB_2870081 |
| BUV737 Mouse Anti-Human CD14 (M5E2) | BD Biosciences | Cat# 612763; RRID: AB_2870094 |
| BV421 Mouse Anti-Human CD206 (I5-2) | Biolegend | Cat# 321125; RRID: AB_2562673 |
| BV650 Mouse Anti-Human CD45RA (HI100) | Biolegend | Cat# 304136; RRID: AB_2562653 |
| BV711 Mouse Anti-Human PD-L1 (29E.2A3) | Biolegend | Cat# 329722; RRID: AB_2565764 |
| BV785 Mouse Anti-Human CD4 (RPA-T4) | Biolegend | Cat# 300554; RRID: AB_2564382 |
| BV785 Mouse Anti-Human CD11b (ICRF44)) | Biolegend | Cat# 301346; RRID: AB_2563794 |
| BB515 Mouse Anti-Human CD25 (M-A251) | BD Biosciences | Cat# 565096; RRID: AB_2739065 |
| PE-Dazzle-594 Mouse Anti-Human CD40L/CD154 (24–31) | Biolegend | Cat# 310840; RRID: AB_2566245 |
| PE-Cy7 Mouse Anti-Human OX40 (BER-ACT35) | Biolegend | Cat# 350012; RRID: AB_10901161 |
| AF700 Mouse anti-human CD45RO (UCHL1) | Biolegend | Cat# 304218; RRID: AB_493765 |
| BV650 Mouse Anti-Human CD16 (3G8) | Biolegend | Cat# 302042; RRID: AB_2563801 |
| PE-Dazzle-594 Mouse Anti-Human CD11c (Bu15) | Biolegend | Cat# 337227; RRID: AB_2564548 |
| PerCP-Cy5.5 Mouse Anti-Human CD45 (HI30) | Biolegend | Cat# 304028; RRID: AB_893338 |
| PE Mouse Anti-Human CD169 (3D6.112) | Biolegend | Cat# 142404; RRID: AB_10915697 |
| PE-Cy7 Mouse Anti-Human CD86 (IT2.2) | Biolegend | Cat# 305422; RRID: AB_2074981 |
| APC Mouse Anti-Human CD163 (GHI/61) | Biolegend | Cat# 333610; RRID: AB_2074533 |
| APC-Fire750 Mouse Anti-Human HLA-DR (L243) | Biolegend | Cat# 307658; RRID: AB_2572101 |
| APC Mouse Anti-Human DLL4 (MHD4-46) | Biolegend | Cat# 346507; RRID: AB_11204421 |
| BV650 Mouse Anti-Human CD38 (HB-7) | Biolegend | Cat# 356619; RRID: AB_2566232 |
| AF700 Mouse Anti-Human EpCAM (9C4) | Biolegend | Cat# 324244; RRID: AB_2750489 |
| Bacterial and virus strains | ||
| Mycobacterium tuberculosis H37RV | BEI Resources | Cat# NR-13648 |
| BPL-inactivated CMV (AD169 Strain) | Advanced Biotechnologies inc. | Cat# 100-275-500 |
| YFP Expressing M. tuberculosis strain H37RV | Dr. Chris Sassetti UMass Medical School | Ref. 49, 50 |
| Irradiated M. tuberculosis strain H37Rv | BEI Resources | Cat# NR-49098 |
| Biological samples | ||
| PBMCs isolated from freshly-collected whole blood from healthy volunteers with latent Mtb infection | University Hospitals IRB protocol | N/A |
| PBMCs from leukapheresis product collected from healthy, CMV seropositive volunteers | Purchased from AllCells, Inc. | N/A |
| Bronchoalveolar Lavage Samples isolated from healthy volunteers | Obtained by Dr. Richard Silver, CWRU School of Medicine |
Ref. 92 |
| Chemicals, peptides, and recombinant proteins | ||
| Mycobacterium tuberculosis H37RV Whole Cell Lysate | BEI Resources | Cat# NR-14822 |
| Human CMV pp65 Overlapping Peptide Library | AIDS Reagent Repository | Cat# ARP-11549 |
| Recombinant human GM-CSF Protein | Peprotech | Cat# 300-03-50ug |
| Recombinant Human M-CSF | Peprotech | Cat# 300-25-50ug |
| Human IFN-g1b, premium grade | Miltenyi Biotec | Cat# 130-096-484 |
| Critical commercial assays | ||
| Human Memory CD4+ T cell isolation kit | Miltenyi Biotec | Cat# 130-091-893 |
| Human IFNg Secretion Assay (PE) | Miltenyi Biotec | Cat# 130-090-762 |
| Human CD14 microbeads | Miltenyi Biotec | Cat# 130-050-201 |
| Human CD4 Microbeads | Miltenyi Biotec | Cat# 130-045-101 |
| Elisa MAX Standard Set Human IL-10 | Biolegend | Cat# 430601 |
| Elisa MAX Standard Set Human TNF-alpha | Biolegend | Cat# 430201 |
| V-plex and U-plex Multiplexed cytokine assays | Mesoscale Discovery | N/A |
| Live/Dead Fix Aqua-400 | Life Technologies | Cat# L34966 |
| QuantiFERON-TB Gold Plus | Qiagen | Cat# 622536 |
| Deposited data | ||
| Genotype-Tissue Expression (GTEx) Portal Analysis Release V8 | www.gtexportal.org | N/A |
| Software and algorithms | ||
| Flowjo V10 | BD Biosciences | Cat# 663335 |
| Prism V9 | GraphPad | N/A |
| Excel | Microsoft | N/A |
| Other | ||
| Ficoll Paque Plus | Sigma- Aldrich | Cat# 17-1440-03 |
| Accutase | Invitrogen | Cat# 25059CI |
| 7H9 Broth Dehydrated Culture Media | BD Diagnostics | Cat# 271310 |
| Middlebrook 7H10 Agar | BD Diagnostics | Cat# 262710 |
| Middlebrook OADC | BD Diagnostics | Cat# 212351 |
Resource availability
Lead contact
Further information and requests for resources and reagents should be directed to and will be fulfilled by the lead contact, Stephen Carpenter (stephen.carpenter@case.edu).
Materials availability
Further information and material requests should be addressed to Stephen Carpenter (stephen.carpenter@case.edu).
Experimental model and study participant details
Human participants
Ten healthy participants with a median age of 37 years (range 23–69; 5 male, 5 female) representing African, Asian, Caucasian, and Latinx ethnicities volunteered based on self-identified history of latent Mtb infection (LTBI). LTBI status was determined based on positive results of either a tuberculin skin test (TST) of at least 10mm or an IFNγ release assay (IGRA) or both. The LTBI status of participants was verified through QuantiFERON-TB Gold Plus (Qiagen, Hilden, Germany). No LTBI participants had a history of active TB disease or symptoms suggestive of current disease, such as cough, night sweats, fevers, or weight loss. Eight of 10 participants previously spent time in TB endemic areas, and 5 participants previously received isoniazid or rifampin antibiotic prophylaxis at least 3 years prior to participating. Five individuals had remote PPD conversion and had never received antibiotic prophylaxis. Five individuals previously received the BCG vaccine as infants (>30 years prior to participating). Six leukapheresesis products (leukopaks) from CMV seropositive, healthy male and female volunteers ages 26–53 were purchased from AllCells (Alameda, CA, USA) for the assessment of CMV-specific T cell responses. These participants were different from the 10 individuals with LTBI mentioned above. Five additional healthy individuals without a history of latent or active TB volunteered for BAL studies. Male and female participants were eligible for research bronchoscopy based on age (18–50), non-smoking status, and lack of other significant medical problems including asthma or other chronic respiratory disease, cardiac disease, or ongoing use of systemic immunosuppressive agents for any reason. All protocols involving human subjects were approved through the Institutional Review Board of University Hospitals Cleveland Medical Center, and informed consent was obtained for all participants. No influence of gender on the results was observed, although sample sizes were limited.
Microbe strains
A 1mL aliquot of Mycobacterium tuberculosis strain H37Rv (NR-13648, BEI Resources) or H37Rv-YFP (graciously contributed by Dr. Christopher Sassetti, UMass Chan Medical School, Worcester, MA, USA) were thawed and diluted in 9mL of media containing Difco Middlebrook 7H9 broth (BD Diagnostics) supplemented with 10% OADC, 0.2% glycerol, and 0.05% Tween-80 as previously described.5
Bacterial culture and infection
Briefly, cultures were incubated for 6 days at 37°C on a rotating shaker adding 7H9 broth every 2-3 days to a maximum volume of 75mL until the OD600 reached mid-log phase growth (0.4–0.9). Cultures were centrifuged at 2,000 x g, the pellet was washed once with cRPMI, resuspended in cRPMI, and filtered through a 5μm Millex syringe-driven filter unit (Millipore; Duluth, GA, USA) to generate a single-cell suspension. The bacterial count was estimated using the OD600 of the filtered bacteria in cRPMI and diluted further to target multiplicity of infection (MOI) of 1–5 (1-5x10⁶/mL). Diluted bacterial suspensions were added to each well (50μL/well in 96-well or 250μL/well in 24-well plates). After 4hrs, the macrophage cultures were washed of extracellular bacteria three times with cRPMI and incubated in fresh cRPMI overnight at 37°C and 5% CO2, (either alone, or with IFNγ, or anti-IL10, or anti-PDL1 mAbs (see below)), to allow intracellular Mtb grow within the macrophages. Twenty-four hours later, CD4+ T cells were added to infected (or non-infected control macrophages) (see below). To enumerate actual MOI, approximately 3–4 wells of Mtb-infected MDMs per experiment were lysed with a solution of 1% Triton X-100 in 1X PBS, and the lysate products were diluted 10-10,000-fold in 0.02% Tween-80 in PBS and 100uL aliquots of each dilution were spread over agarose plates containing Difco Middlebrook 7H10 agar (BD Diagnostics) supplemented with 10% OADC and 0.5% glycerol, as described.4 Colony-forming units (CFU) were assessed by counting the number of colonies on each plate 3 weeks later. Strain H37Rv and H37Rv-YFP were selected to study virulent Mtb under BSL-3 conditions since they were isogenic strains, and for comparability with the vast majority of studies infecting human phagocytes with H37Rv.
Method details
Collection and processing of BAL cells
All bronchoscopies were performed in the Dahms Clinical Research Unit (DCRU) at University Hospitals Cleveland Medical Center as previously described.92,93 BAL samples were obtained by instillation and subsequent withdrawal of up to eight 30 mL aliquots of pre-warmed buffered saline. Recovered BAL fluid was placed on ice for transport to the laboratory. Samples were aliquoted into 50 mL polypropylene tubes and immediately centrifuged at 2000 RPM (480 × g) for 10 min. BAL cells were stained and counted using a hemocytometer. BAL fluid from all subjects was stored at −80°C and ultimately sent for culture in the clinical microbiology laboratory of University Hospitals Cleveland Medical Center. BAL cells were cryopreserved in freezing media (10% Dimethyl sulfoxide (DMSO) (Millipore Sigma), 90% Fetal bovine serum (FBS) (Gibco)) from all subjects and stored in liquid nitrogen.
Generation of monocyte-derived macrophages
Following blood draw, Ficoll-Paque PLUS (GE Healthcare, Uppsala, Sweden) was used to underlay diluted whole blood using a Pasteur pipet. Following centrifugation, the peripheral blood mononuclear cell (PBMC) layer was aspirated using a transfer pipet. The PBMCs were then washed with Ca++ and Mg++ free and pyrogen-free sterile phosphate buffered saline (hereafter termed PBS; Corning; Glendale, AZ, USA) and counted using a hemocytometer after staining with trypan blue (Life Technologies, Grand Island, NY) to exclude dead cells. Once counted, CD14+ monocytes were separated from the rest of the PBMCs by positive immunomagnetic selection using anti-human CD14 microbeads (Miltenyi Biotec; Bergisch Gladbach, Germany), per manufacturer instructions. After CD14 selection, both the positive and negative fractions were counted and aliquots of each were separately cryopreserved in freezing media (10% DMSO, 90% FBS). Aliquots were slow frozen to −80°C in cryovials stored in isopropanol-filled Mr. Frosty (Thermo) slow-freeze containers, followed by transfer to liquid nitrogen storage.
For experiments, CD14+ monocytes were thawed and rested overnight in complete RPMI media with 10% FBS (hereafter termed cRPMI, containing 425mL of RPMI1640 media, 50mL FBS, 5mL of L-Glutamine, Na-Pyruvate, Non-essential amino acids, HEPES buffer, and 0.5mL of 2-mercaptoethanol and NaOH (Gibco). The next morning, CD14+ cells were plated in either a 96-well plate (50K cells/well) or a 24 well plate (250K cells/well) and differentiated to macrophages using 25 ng/mL of either GM-CSF or M-CSF cytokines (PeproTech, East Windsor, NJ). The media was changed at three days and after six days the macrophages were ready to be used.
Macrophage isolation for flow cytometry
Macrophages were harvested from experimental plates using Accutase cell detachment solution (Corning) according to the manufacturer instructions. After removing culture supernatants, 24-well plate wells were washed with PBS. 250μL of Accutase was added onto each empty well, then plates were incubated at 37°C, 5% CO2 for 5–10 min, followed by addition of 250μL of cRPMI to stop the reaction. Macrophages were pipetted for harvest in a volume of 500μL, then transferred into 1.5mL Eppendorf tubes, centrifuged at 350 x g and cell pellets were resuspended and used for the staining procedure applied for flow cytometry analysis.
Antigen stimulation of CD4+ T cells
For CMV-specific T cell response assessment, either whole inactivated CMV (iCMV) or a pool of 138 sequential 15-mer peptides (overlapping by 11 amino acids) comprising the human CMV pp65 antigen obtained as lyophilized pooled peptides from the NIH AIDS Reagent Repository (ARP-11549), reconstituted in DMSO, and diluted 1:1000 in cRPMI when used to load MDMs for subsequent co-culture with autologous CD4+ T cells. iCMV consisted of human CMV (AD169 strain) purified virus from human foreskin fibroblast (HFS) cells that was inactivated using β-propiolactone (BPL), sterile filtered, and aliquoted at a concentration of 384 μg/mL, produced and obtained from Advanced Biotechnologies, Inc., Eldersberg, MD, USA (cat# 100-275-500). iCMV was diluted in cRPMI at a final concentration of 10 μg/mL and added to MDMs for 24h, followed by washout and addition of CD4+ T cells (see below). For pp65 peptides, MDMs were incubated with a final concentration of 10 ng/mL recombinant human IFNγ (Peprotech) for 24h, followed by addition of the pp65 overlapping peptide pool at a final concentration of 100 μg/mL alone for 1 h. After washing with fresh cRPMI, autologous CD4+ T cells were added (see below) for an additional 16 h. IFNγ-treated macrophages without peptides/iCMV/Mtb Lysate served as a negative control. For evaluation of T cell responses to Mtb lysate, whole cell lysate from Mtb strain H37Rv was obtained from BEI Resources (NR-14822) containing gamma-irradiated and mechanically lysed Mtb bacteria at 10 mg/mL in 10mM ammonium bicarbonate. Mtb lysate was diluted 1:1000 in cRPMI to treat MDMs with a final concentration of 10 μg/mL for 24h, followed by washout with cRPMI and addition of CD4+ T cells (see below). For evaluation of T cell responses to whole inactivated Mtb, gamma-irradiated whole-cell H37Rv (Irrad Mtb) was obtained from BEI Resources (NR-49098). Irrad Mtb was incubated with macrophages at a final concentration of 10 μg/mL as described54,55 for 4 h, the same period of time used for virulent Mtb infection, followed by washout. Similar to Mtb infection, CD4+ T cells were added the following day (see below).
CD4 memory T cell co-culture assay
On the day macrophages were infected, aliquots of CD14-negative PBMCs were thawed and rested in cRPMI overnight. The next day, immunomagnetic selection was performed per manufacturer instructions using either Human CD4 Microbeads (Miltenyi Biotec) for positive selection of total CD4+ T cells (used in CMV T cell response experiments), or the Human Memory CD4 T cell isolation kit (Miltenyi Biotec) for negative selection of memory (CD45RALo) CD4+ T cells, used to evaluate antigen-specific CD4+ T cell responses to Mtb. AutoMACS Rinsing solution with 5% MACS BSA Stock Solution (Miltenyi Biotec) was used to wash cells, hereafter termed “Rinse Buffer”. After selection, CD4+ T cells were then added at approximately a 2:1 ratio to the infected macrophages (100K T cells with 50K macrophages/well in 96 well plates, or 500K T cells with 250K macrophages/well in 24 well plates). Anti-CD40 blocking antibody (clone W17212H) (Biolegend) at a final concentration of 0.5 μg/mL was included at the same time T cells were added to infected macrophages to facilitate detection of CD40L expression on T cells used in most experiments since Mtb infection upregulates CD40 and was previously shown to prevent detection of CD40L on T cells due to rapid internalization upon binding CD40. CD4+ T cells were co-cultured with the infected macrophages in cRPMI at 37°C and 5% CO2 overnight. After 16hrs, T cells were harvested by vigorous pipetting of each well, followed washing each well with Rinse Buffer. For most experiments, the Miltenyi IFNγ Secretion Assay (Miltenyi Biotec) was performed per manufacturer instructions, followed by viability dye and surface antibody staining, fixation with 1% PFA for 1 h, washing cells with autoMACS running buffer (Miltenyi Biotec) and flow cytometry analysis. Anti-PDL1 (clone MIH3) and anti-IL10 (clone JES3-19F1) mAbs were added (each at a final concentration of 10 μg/mL) to specified samples either “early” (immediately after washout of extracellular bacteria after 4-h Mtb infection), or “late” (24h after Mtb infection, at the time of co-culture with CD4+ T cells. In both cases antibodies remained in culture until the end of the experiment (T cell harvest). A cocktail of two anti-MHC-II blocking antibodies (anti-HLA-DR, clone L243, anti-HLA-DR,DP,DQ, clone Tü39) were added (25 μg/mL each) to some Mtb-infected samples prior to the addition of T cells. These, together with non-infected macrophages, were used as negative controls for CD4+ T cell activation. Positive controls included stimulation with prepared beads loaded with anti-CD3, anti-CD28, and anti-CD2 from the T cell Activation and Expansion Kit (Miltenyi Biotec) or staphylococcal enterotoxin B (SEB) (Toxin Technology, Inc., Sarasota, FL, USA) (1 μg/mL). Functional antibodies used in these experiments included anti-HLA-DR (clone L243), anti-HLA-DR,DP,DQ (Tü39), No Azide, Low Endotoxin (NA-LE) grade from BD Biosciences (Franklin Lakes, NJ, USA), and anti-CD40 (W17212H), PDL1 (MIH3), IL10 (JES3-19F1) ultra-LEAF (low endotoxin, azide-free) grade from Biolegend (San Diego, CA, USA).
Adherent bronchoalveolar lavage (BAL) cells
Cryopreserved BAL samples were thawed using cRPMI media containing Penicillin, streptomycin and 2.5ug/mL of Amphotericin B (Gibco) and plated at a concentration of one million cells per well. After resting overnight, the non-adherent cells were removed. The adherent cells were washed with cRPMI containing no antibotics and then infected with Mtb following the Mtb infection protocol at MOI 1 or 5. The following day, the adherent cells were harvested by incubating with accutase (Invitrogen) for 10 min at 37°C, and washed in complete media according to manufacture instructions. Cells were analyzed by flow cytometry.
Flow cytometry analysis
Memory CD4 T cells that became activated in response to Mtb-infected macrophages were identified by flow cytometry. The cells were first washed with PBS and stained with a fixable viability dye Live-Dead Aqua (Invitrogen) according to the manufacturer instructions. Immunostaining was performed with fluorescently-labeled antibodies and Fc-R block (Biolegend) diluted in AutoMACS running buffer. After staining for 20 min at 4°C, cells were washed twice and fixed in 1% PFA in PBS for 1 h per biosafety protocol, followed by removal from the BSL-3 facility. After washing once with AutoMACS running buffer. Samples were analyzed on a BD LSRFortessa X-20 Cell Analyzer flow cytometer (BD, Franklin Lakes, NJ).
ELISA and multiplexed cytokine analysis
Supernatants were removed from maturing macrophages at day three and six post-plating. ELISA assays were performed for both IL-10 and TNF on these supernatants (Biolegend ELISA Max kits) according to manufacturer instructions. Other culture supernatants were obtained from fully differentiated macrophages after infection with Mtb, treatment with Mtb lysate, or untreated controls, followed by washout and incubation for 24h in complete media. TNF ELISAs were performed on supernatants, diluted 1:20 in assay diluent, and IL-10 ELISAs were performed neat or at a 1:1 dilution. Standard curves for each cytokine were generated in duplicate. Samples were analyzed using the Synergy H1 microplate reader (BioTek, Winooski, VT). For multiplexed cytokine analysis, a total of 37 different cytokines were analyzed in batches of 6–10 analytes per assay from macrophage culture supernatants by use of both V-PLEX and U-PLEX assays (Mesoscale Discovery, Rockville, MD) per manufacturer’s instructions. Acid treatment of sample supernatants was performed for TGFβ assays. Plates were analyzed on the MESO QuickPlex SQ 120MM and visualized on MSD Discovery Workbench software (Mesoscale Discovery).
Gene expression analysis
Bulk RNAseq data were compared as Log10 (transcripts per kilobase-million (TPM reads) + 1) which normalizes data for differences in sequencing depth and transcript length. Non-zero values of transcripts from single-cell RNAseq data were compared normalized ln (counts per 10,000 reads (CP10K) + 1) among each annotated cell type.
Quantification and statistical analysis
Flow cytometry data was analyzed using Flowjo V10 (BD Biosciences, San Diego, CAs) and the proportion of cells in each sample expressing each marker, and/or median fluorescence intensity (MFI), was compared between groups. For MDMs, individual surface markers were compared after gating on LiveDeadLo CD11b+ single cells. For macrophage markers where MFI values fell below zero after compensation such as with CD14 or CD163, the data for all samples were uniformly transformed by adding lowest MFI value +1 to the MFI values of each sample for that marker solely for the purpose of displaying all results as non-zero in graphs while maintaining absolute differences in MFI values. Only raw data and absolute differences in MFI between conditions were compared statistically. For CD4+ T cells, the proportion co-expressing CD69 and either IFNγ, CD40L, or CD25 was determined after gating on LiveDeadLo CD4+ CD45RALo single cells. Graphs and statistical comparison were performed on Prism V9 (GraphPad, San Diego, CA, USA) using tests specified in figure legends. Statistical details of each experiment can be found in the accompanying figure legends. Grouped data containing fewer than 20 subjects were compared using non-parametric tests (Wilcoxon matched-pairs signed rank test, Kruskal-Wallis test, or Friedman test with Dunn’s multiple comparisons test). Representative data from individual experiments were tested for normality using the Shapiro-Wilk or Kolmogorov-Smirnov tests using Prism V9. If normally distributed, groups were compared using either a paired or unpaired t-test, Welsh ANOVA with Dunnett’s T3 multiple comparisons test (for samples with unequal variance), or ordinary one-way ANOVA with Sidak’s multiple comparisons test (for samples with equal variance). Two-tailed p values <0.05 were considered significant. Statistical significance in each figure is indicated as follows: ∗p < 0.05, ∗∗p < 0.01, ∗∗∗p < 0.001, ∗∗∗∗p < 0.0001, not significant (ns).
Acknowledgments
The following reagent was obtained through the NIH HIV Reagent Program, Division of AIDS, NIAID, NIH: Peptide Pool, Human Cytomegalovirus (HCMV) pp65 Protein, ARP-11549, contributed by DAIDS, NIAID. The following reagents were obtained through BEI Resources, NIAID, NIH: Mycobacterium tuberculosis, Strain H37Rv, whole cell lysate, NR-14822, Mycobacterium tuberculosis, Strain H37Rv, Gamma-Irradiated Whole Cells, NR-49098, and Mycobacterium tuberculosis strain H37Rv, NR-13648. This work was supported by National Institutes of Health (NIH) grants K08 AI163407 (to S.M.C.) and R21 AI167675 (to S.M.C and M.L.F), American Lung Association Catalyst Award 924107 (to S.M.C), and research funds from University Hospital Cleveland Medical Center (to S.M.C.). Research bronchoscopies were performed by R.F.S. in the Dahms Clinical Research Unit (DCRU), which is a clinical core of the Case Western Reserve University/University Hospitals Cleveland Medical Center Clinical and Translational Science Collaborative, supported by NIH UL1 RR024989 from the National Center for Research Resources. The use of core facilities was supported in part by NIH Grant P30 AI036219 to Case Western Reserve University and the University of Pittsburgh Rustbelt Center for AIDS Research (CFAR). Graduate student support was in part provided through the NIH Fogarty training grant D43TW010319. The Genotype-Tissue Expression (GTEx) Project was supported by the Common Fund of the Office of the Director of the National Institutes of Health, and by NCI, NHGRI, NHLBI, NIDA, NIMH, and NINDS. Graphical abstract was created with Biorender.com. We thank Drs. Christopher Sassetti and Kadamba Papavinasasundaram for contributing the YFP-Rv fluorescent Mtb strain and for thoughtful scientific discussion, and we thank Dr. Clifford Harding and Dr. Sam Behar for thoughtful discussion and scientific advice.
Author contributions
Conceptualization, D.P.G., V.G.S., I.M., M.L.F., D.H.C., W.H.B., R.F.S., and S.M.C.; Methodology, D.P.G., V.G.S., A.K.S., J.J., I.M., S.P., M.L.F., D.H.C., W.H.B., R.F.S., and S.M.C.; Investigation, D.P.G., V.G.S., W.D., A.K.S., M.N., J.J., I.M., S.P., D.H.C., and S.M.C.; Resources, J.J., D.H.C., W.H.B., R.F.S., and S.M.C.; Formal Analysis, D.P.G., V.G.S., W.D., A.K.S., M.N., R.F.S., and S.M.C.; Writing–original draft preparation, D.P.G., V.G.S., A.K.S., and S.M.C.; Writing–review and editing, D.P.G., V.G.S., A.K.S., I.M., S.P., M.L.F., D.H.C., W.H.B., R.F.S., and S.M.C.; Visualization, D.P.G., V.G.S., and S.M.C.; Supervision, M.L.F., W.H.B., R.F.S., and S.M.C.; and funding acquisition, M.L.F. and S.M.C.
Declaration of interests
The authors declare no competing interests.
Inclusion and diversity
We support inclusive, diverse, and equitable conduct of research.
Published: August 23, 2023
Footnotes
Supplemental information can be found online at https://doi.org/10.1016/j.isci.2023.107706.
Supplemental information
Data and code availability
-
•
This paper analyzes existing, publicly available data. The data used for the CSF1, CSF2, IL10, and TNF gene expression analyses described in this manuscript were obtained from GTEX Analysis Release V8 on the GTEx Portal: www.gtexportal.org on 12/22/2022, and is listed in the key resources table. Additional data reported in this paper will be shared by the lead contact upon request.
-
•
This paper does not report original code.
-
•
Any additional information required to reanalyze the data reported in this paper is available from the lead contact upon request.
References
- 1.Bagcchi S. WHO’s Global Tuberculosis Report 2022. Lancet. Microbe. 2023;4:e20. doi: 10.1016/s2666-5247(22)00359-7. [DOI] [PubMed] [Google Scholar]
- 2.Mogues T., Goodrich M.E., Ryan L., LaCourse R., North R.J. The Relative Importance of T Cell Subsets in Immunity and Immunopathology of Airborne Mycobacterium tuberculosis Infection in Mice. J. Exp. Med. 2001;193:271–280. doi: 10.1084/jem.193.3.271. [DOI] [PMC free article] [PubMed] [Google Scholar]
- 3.Srivastava S., Ernst J.D. Cutting Edge: Direct Recognition of Infected Cells by CD4 T Cells Is Required for Control of Intracellular Mycobacterium tuberculosis In Vivo. J. Immunol. 2013;191:1016–1020. doi: 10.4049/jimmunol.1301236. [DOI] [PMC free article] [PubMed] [Google Scholar]
- 4.Carpenter S.M., Yang J.D., Lee J., Barreira-Silva P., Behar S.M. Vaccine-elicited memory CD4+ T cell expansion is impaired in the lungs during tuberculosis. PLoS Pathog. 2017;13 doi: 10.1371/journal.ppat.1006704. [DOI] [PMC free article] [PubMed] [Google Scholar]
- 5.Yang J.D., Mott D., Sutiwisesak R., Lu Y.-J., Raso F., Stowell B., Babunovic G.H., Lee J., Carpenter S.M., Way S.S., et al. Mycobacterium tuberculosis-specific CD4+ and CD8+ T cells differ in their capacity to recognize infected macrophages. PLoS Pathog. 2018;14 doi: 10.1371/journal.ppat.1007060. [DOI] [PMC free article] [PubMed] [Google Scholar]
- 6.Gern B.H., Adams K.N., Plumlee C.R., Stoltzfus C.R., Shehata L., Moguche A.O., Busman-Sahay K., Hansen S.G., Axthelm M.K., Picker L.J., et al. TGFβ restricts expansion, survival, and function of T cells within the tuberculous granuloma. Cell Host Microbe. 2021;29:594–606.e6. doi: 10.1016/j.chom.2021.02.005. [DOI] [PMC free article] [PubMed] [Google Scholar]
- 7.Bold T.D., Banaei N., Wolf A.J., Ernst J.D. Suboptimal Activation of Antigen-Specific CD4+ Effector Cells Enables Persistence of M. tuberculosis In Vivo. PLoS Pathog. 2011;7 doi: 10.1371/journal.ppat.1002063. [DOI] [PMC free article] [PubMed] [Google Scholar]
- 8.Pai R.K., Convery M., Hamilton T.A., Boom W.H., Harding C.V. Inhibition of IFN-γ-Induced Class II Transactivator Expression by a 19-kDa Lipoprotein from Mycobacterium tuberculosis: A Potential Mechanism for Immune Evasion. J. Immunol. 2003;171:175–184. doi: 10.4049/jimmunol.171.1.175. [DOI] [PubMed] [Google Scholar]
- 9.Griffiths K.L., Ahmed M., Das S., Gopal R., Horne W., Connell T.D., Moynihan K.D., Kolls J.K., Irvine D.J., Artyomov M.N., et al. Targeting dendritic cells to accelerate T-cell activation overcomes a bottleneck in tuberculosis vaccine efficacy. Nat. Commun. 2016;7 doi: 10.1038/ncomms13894. [DOI] [PMC free article] [PubMed] [Google Scholar]
- 10.Nunes-Alves C., Booty M.G., Carpenter S.M., Jayaraman P., Rothchild A.C., Behar S.M. In search of a new paradigm for protective immunity to TB. Nat. Rev. Microbiol. 2014;12:289–299. doi: 10.1038/nrmicro3230. [DOI] [PMC free article] [PubMed] [Google Scholar]
- 11.Carpenter S.M., Nunes-Alves C., Booty M.G., Way S.S., Behar S.M. A Higher Activation Threshold of Memory CD8+ T Cells Has a Fitness Cost That Is Modified by TCR Affinity during Tuberculosis. PLoS Pathog. 2016;12 doi: 10.1371/journal.ppat.1005380. [DOI] [PMC free article] [PubMed] [Google Scholar]
- 12.Portal-Celhay C., Tufariello J.M., Srivastava S., Zahra A., Klevorn T., Grace P.S., Mehra A., Park H.S., Ernst J.D., Jacobs W.R., Philips J.A. Mycobacterium tuberculosis EsxH inhibits ESCRT-dependent CD4+ T-cell activation. Nat. Microbiol. 2016;2 doi: 10.1038/nmicrobiol.2016.232. [DOI] [PMC free article] [PubMed] [Google Scholar]
- 13.Grace P.S., Ernst J.D. Suboptimal Antigen Presentation Contributes to Virulence of Mycobacterium tuberculosis In Vivo. J. Immunol. 2016;196:357–364. doi: 10.4049/jimmunol.1501494. [DOI] [PMC free article] [PubMed] [Google Scholar]
- 14.Srivastava S., Grace P.S., Ernst J.D. Antigen Export Reduces Antigen Presentation and Limits T Cell Control of M. Cell Host Microbe. 2016;19:44–54. doi: 10.1016/j.chom.2015.12.003. [DOI] [PMC free article] [PubMed] [Google Scholar]
- 15.Sutiwisesak R., Hicks N.D., Boyce S., Murphy K.C., Papavinasasundaram K., Carpenter S.M., Boucau J., Joshi N., Le Gall S., Fortune S.M., et al. A natural polymorphism of Mycobacterium tuberculosis in the esxH gene disrupts immunodomination by the TB10.4-specific CD8 T cell response. PLoS Pathog. 2020;16 doi: 10.1371/journal.ppat.1009000. [DOI] [PMC free article] [PubMed] [Google Scholar]
- 16.Patankar Y.R., Sutiwisesak R., Boyce S., Lai R., Lindestam Arlehamn C.S., Sette A., Behar S.M. Limited recognition of Mycobacterium tuberculosis-infected macrophages by polyclonal CD4 and CD8 T cells from the lungs of infected mice. Mucosal Immunol. 2020;13:140–148. doi: 10.1038/s41385-019-0217-6. [DOI] [PMC free article] [PubMed] [Google Scholar]
- 17.Chackerian A.A., Alt J.M., Perera T.V., Dascher C.C., Behar S.M. Dissemination of Mycobacterium tuberculosis is influenced by host factors and precedes the initiation of T-cell immunity. Infect. Immun. 2002;70:4501–4509. doi: 10.1128/IAI.70.8.4501-4509.2002. [DOI] [PMC free article] [PubMed] [Google Scholar]
- 18.Wolf A.J., Desvignes L., Linas B., Banaiee N., Tamura T., Takatsu K., Ernst J.D. Initiation of the adaptive immune response to Mycobacterium tuberculosis depends on antigen production in the local lymph node, not the lungs. J. Exp. Med. 2008;205:105–115. doi: 10.1084/jem.20071367. [DOI] [PMC free article] [PubMed] [Google Scholar]
- 19.Reiley W.W., Calayag M.D., Wittmer S.T., Huntington J.L., Pearl J.E., Fountain J.J., Martino C.A., Roberts A.D., Cooper A.M., Winslow G.M., Woodland D.L. ESAT-6-specific CD4 T cell responses to aerosol Mycobacterium tuberculosis infection are initiated in the mediastinal lymph nodes. Proc. Natl. Acad. Sci. USA. 2008;105:10961–10966. doi: 10.1073/pnas.0801496105. [DOI] [PMC free article] [PubMed] [Google Scholar]
- 20.Jung Y.-J., Ryan L., LaCourse R., North R.J. Properties and protective value of the secondary versus primary T helper type 1 response to airborne Mycobacterium tuberculosis infection in mice. J. Exp. Med. 2005;201:1915–1924. doi: 10.1084/jem.20050265. [DOI] [PMC free article] [PubMed] [Google Scholar]
- 21.Kamath A.B., Behar S.M. Anamnestic Responses of Mice following Mycobacterium tuberculosis Infection. Infect. Immun. 2005;73:6110–6118. doi: 10.1128/iai.73.9.6110-6118.2005. [DOI] [PMC free article] [PubMed] [Google Scholar]
- 22.Cohen S.B., Gern B.H., Delahaye J.L., Adams K.N., Plumlee C.R., Winkler J.K., Sherman D.R., Gerner M.Y., Urdahl K.B. Alveolar Macrophages Provide an Early Mycobacterium tuberculosis Niche and Initiate Dissemination. Cell Host Microbe. 2018;24:439–446.e4. doi: 10.1016/j.chom.2018.08.001. [DOI] [PMC free article] [PubMed] [Google Scholar]
- 23.Rothchild A.C., Olson G.S., Nemeth J., Amon L.M., Mai D., Gold E.S., Diercks A.H., Aderem A. Alveolar macrophages generate a noncanonical NRF2-driven transcriptional response to Mycobacterium tuberculosis in vivo. Sci. Immunol. 2019;4 doi: 10.1126/sciimmunol.aaw6693. [DOI] [PMC free article] [PubMed] [Google Scholar]
- 24.Samstein M., Schreiber H.A., Leiner I.M., Sušac B., Glickman M.S., Pamer E.G. Essential yet limited role for CCR2+ inflammatory monocytes during Mycobacterium tuberculosis-specific T cell priming. Elife. 2013;2 doi: 10.7554/elife.01086. [DOI] [PMC free article] [PubMed] [Google Scholar]
- 25.Wolf A.J., Linas B., Trevejo-Nuñez G.J., Kincaid E., Tamura T., Takatsu K., Ernst J.D. Mycobacterium tuberculosis infects dendritic cells with high frequency and impairs their function in vivo. J. Immunol. 2007;179:2509–2519. doi: 10.4049/jimmunol.179.4.2509. [DOI] [PubMed] [Google Scholar]
- 26.Srivastava S., Ernst J.D. Cell-to-Cell Transfer of M. tuberculosis Antigens Optimizes CD4 T Cell Priming. Cell Host Microbe. 2014;15:741–752. doi: 10.1016/j.chom.2014.05.007. [DOI] [PMC free article] [PubMed] [Google Scholar]
- 27.Verreck F.A.W., de Boer T., Langenberg D.M.L., Hoeve M.A., Kramer M., Vaisberg E., Kastelein R., Kolk A., de Waal-Malefyt R., Ottenhoff T.H.M. Human IL-23-producing type 1 macrophages promote but IL-10-producing type 2 macrophages subvert immunity to (myco)bacteria. Proc. Natl. Acad. Sci. USA. 2004;101:4560–4565. doi: 10.1073/pnas.0400983101. [DOI] [PMC free article] [PubMed] [Google Scholar]
- 28.Lacey D.C., Achuthan A., Fleetwood A.J., Dinh H., Roiniotis J., Scholz G.M., Chang M.W., Beckman S.K., Cook A.D., Hamilton J.A. Defining GM-CSF– and Macrophage-CSF–Dependent Macrophage Responses by In Vitro Models. J. Immunol. 2012;188:5752–5765. doi: 10.4049/jimmunol.1103426. [DOI] [PubMed] [Google Scholar]
- 29.Fleetwood A.J., Lawrence T., Hamilton J.A., Cook A.D. Granulocyte-Macrophage Colony-Stimulating Factor (CSF) and Macrophage CSF-Dependent Macrophage Phenotypes Display Differences in Cytokine Profiles and Transcription Factor Activities: Implications for CSF Blockade in Inflammation. J. Immunol. 2007;178:5245–5252. doi: 10.4049/jimmunol.178.8.5245. [DOI] [PubMed] [Google Scholar]
- 30.Sander J., Schmidt S.V., Cirovic B., McGovern N., Papantonopoulou O., Hardt A.-L., Aschenbrenner A.C., Kreer C., Quast T., Xu A.M., et al. Cellular Differentiation of Human Monocytes Is Regulated by Time-Dependent Interleukin-4 Signaling and the Transcriptional Regulator NCOR2. Immunity. 2017;47:1051–1066.e12. doi: 10.1016/j.immuni.2017.11.024. [DOI] [PMC free article] [PubMed] [Google Scholar]
- 31.Huynh J.P., Lin C.-C., Kimmey J.M., Jarjour N.N., Schwarzkopf E.A., Bradstreet T.R., Shchukina I., Shpynov O., Weaver C.T., Taneja R., et al. Bhlhe40 is an essential repressor of IL-10 during Mycobacterium tuberculosis infection. J. Exp. Med. 2018;215:1823–1838. doi: 10.1084/jem.20171704. [DOI] [PMC free article] [PubMed] [Google Scholar]
- 32.Cuevas V.D., Simón-Fuentes M., Orta-Zavalza E., Samaniego R., Sánchez-Mateos P., Escribese M., Cimas F.J., Bustos M., Pérez-Diego M., Ocaña A., et al. The Gene Signature of Activated M-CSF-Primed Human Monocyte-Derived Macrophages Is IL-10-Dependent. J. Innate Immun. 2022;14:243–256. doi: 10.1159/000519305. [DOI] [PMC free article] [PubMed] [Google Scholar]
- 33.Xue J., Schmidt S.V., Sander J., Draffehn A., Krebs W., Quester I., De Nardo D., Gohel T.D., Emde M., Schmidleithner L., et al. Transcriptome-Based Network Analysis Reveals a Spectrum Model of Human Macrophage Activation. Immunity. 2014;40:274–288. doi: 10.1016/j.immuni.2014.01.006. [DOI] [PMC free article] [PubMed] [Google Scholar]
- 34.Brochériou I., Maouche S., Durand H., Braunersreuther V., Le Naour G., Gratchev A., Koskas F., Mach F., Kzhyshkowska J., Ninio E. Antagonistic regulation of macrophage phenotype by M-CSF and GM-CSF: Implication in atherosclerosis. Atherosclerosis. 2011;214:316–324. doi: 10.1016/j.atherosclerosis.2010.11.023. [DOI] [PubMed] [Google Scholar]
- 35.Lin H.S., Lokeshwar B.L., Hsu S. Both granulocyte-macrophage CSF and macrophage CSF control the proliferation and survival of the same subset of alveolar macrophages. J. Immunol. 1989;142:515–519. [PubMed] [Google Scholar]
- 36.Dranoff G., Crawford A.D., Sadelain M., Ream B., Rashid A., Bronson R.T., Dickersin G.R., Bachurski C.J., Mark E.L., Whitsett J.A., et al. Involvement of Granulocyte-Macrophage Colony-Stimulating Factor in Pulmonary Homeostasis. Science. 1994;264:713–716. doi: 10.1126/science.8171324. [DOI] [PubMed] [Google Scholar]
- 37.Stanley E., Lieschke G.J., Grail D., Metcalf D., Hodgson G., Gall J.A., Maher D.W., Cebon J., Sinickas V., Dunn A.R. Granulocyte/macrophage colony-stimulating factor-deficient mice show no major perturbation of hematopoiesis but develop a characteristic pulmonary pathology. Proc. Natl. Acad. Sci. USA. 1994;91:5592–5596. doi: 10.1073/pnas.91.12.5592. [DOI] [PMC free article] [PubMed] [Google Scholar]
- 38.Gschwend J., Sherman S.P.M., Ridder F., Feng X., Liang H.-E., Locksley R.M., Becher B., Schneider C. Alveolar macrophages rely on GM-CSF from alveolar epithelial type 2 cells before and after birth. J. Exp. Med. 2021;218 doi: 10.1084/jem.20210745. [DOI] [PMC free article] [PubMed] [Google Scholar]
- 39.Fagerberg L., Hallström B.M., Oksvold P., Kampf C., Djureinovic D., Odeberg J., Habuka M., Tahmasebpoor S., Danielsson A., Edlund K., et al. Analysis of the Human Tissue-specific Expression by Genome-wide Integration of Transcriptomics and Antibody-based Proteomics. Mol. Cell. Proteomics. 2014;13:397–406. doi: 10.1074/mcp.m113.035600. [DOI] [PMC free article] [PubMed] [Google Scholar]
- 40.Eraslan G., Drokhlyansky E., Anand S., Fiskin E., Subramanian A., Slyper M., Wang J., Van Wittenberghe N., Rouhana J.M., Waldman J., et al. Single-nucleus cross-tissue molecular reference maps toward understanding disease gene function. Science. 2022;376 doi: 10.1126/science.abl4290. [DOI] [PMC free article] [PubMed] [Google Scholar]
- 41.Lescoat A., Ballerie A., Augagneur Y., Morzadec C., Vernhet L., Fardel O., Jégo P., Jouneau S., Lecureur V. Distinct Properties of Human M-CSF and GM-CSF Monocyte-Derived Macrophages to Simulate Pathological Lung Conditions In Vitro: Application to Systemic and Inflammatory Disorders with Pulmonary Involvement. Int. J. Mol. Sci. 2018;19:894. doi: 10.3390/ijms19030894. [DOI] [PMC free article] [PubMed] [Google Scholar]
- 42.Yu Y.-R.A., Hotten D.F., Malakhau Y., Volker E., Ghio A.J., Noble P.W., Kraft M., Hollingsworth J.W., Gunn M.D., Tighe R.M. Flow Cytometric Analysis of Myeloid Cells in Human Blood, Bronchoalveolar Lavage, and Lung Tissues. Am J Resp Cell Mol. 2016;54:13–24. doi: 10.1165/rcmb.2015-0146oc. [DOI] [PMC free article] [PubMed] [Google Scholar]
- 43.Dodd C.E., Pyle C.J., Glowinski R., Rajaram M.V.S., Schlesinger L.S. CD36-Mediated Uptake of Surfactant Lipids by Human Macrophages Promotes Intracellular Growth of Mycobacterium tuberculosis. J. Immunol. 2016;197:4727–4735. doi: 10.4049/jimmunol.1600856. [DOI] [PMC free article] [PubMed] [Google Scholar]
- 44.Lindestam Arlehamn C.S., McKinney D.M., Carpenter C., Paul S., Rozot V., Makgotlho E., Gregg Y., van Rooyen M., Ernst J.D., Hatherill M., et al. A Quantitative Analysis of Complexity of Human Pathogen-Specific CD4 T Cell Responses in Healthy M. tuberculosis Infected South Africans. PLoS Pathog. 2016;12 doi: 10.1371/journal.ppat.1005760. [DOI] [PMC free article] [PubMed] [Google Scholar]
- 45.Chattopadhyay P.K., Yu J., Roederer M. A live-cell assay to detect antigen-specific CD4+ T cells with diverse cytokine profiles. Nat. Med. 2005;11:1113–1117. doi: 10.1038/nm1293. [DOI] [PubMed] [Google Scholar]
- 46.Reiss S., Baxter A.E., Cirelli K.M., Dan J.M., Morou A., Daigneault A., Brassard N., Silvestri G., Routy J.-P., Havenar-Daughton C., et al. Comparative analysis of activation induced marker (AIM) assays for sensitive identification of antigen-specific CD4 T cells. PLoS One. 2017;12 doi: 10.1371/journal.pone.0186998. [DOI] [PMC free article] [PubMed] [Google Scholar]
- 47.Huang H., Wang C., Rubelt F., Scriba T.J., Davis M.M. Analyzing the Mycobacterium tuberculosis immune response by T-cell receptor clustering with GLIPH2 and genome-wide antigen screening. Nat. Biotechnol. 2020;38:1194–1202. doi: 10.1038/s41587-020-0505-4. [DOI] [PMC free article] [PubMed] [Google Scholar]
- 48.Musvosvi M., Huang H., Wang C., Xia Q., Rozot V., Krishnan A., Acs P., Cheruku A., Obermoser G., Leslie A., et al. T cell receptor repertoires associated with control and disease progression following Mycobacterium tuberculosis infection. Nat. Med. 2023;29:258–269. doi: 10.1038/s41591-022-02110-9. [DOI] [PMC free article] [PubMed] [Google Scholar]
- 49.Mishra B.B., Rathinam V.A.K., Martens G.W., Martinot A.J., Kornfeld H., Fitzgerald K.A., Sassetti C.M. Nitric oxide controls the immunopathology of tuberculosis by inhibiting NLRP3 inflammasome–dependent processing of IL-1β. Nat. Immunol. 2013;14:52–60. doi: 10.1038/ni.2474. [DOI] [PMC free article] [PubMed] [Google Scholar]
- 50.Lee J., Boyce S., Powers J., Baer C., Sassetti C.M., Behar S.M. CD11cHi monocyte-derived macrophages are a major cellular compartment infected by Mycobacterium tuberculosis. PLoS Pathog. 2020;16 doi: 10.1371/journal.ppat.1008621. [DOI] [PMC free article] [PubMed] [Google Scholar]
- 51.Enriquez A.B., Sia J.K., Dkhar H.K., Goh S.L., Quezada M., Stallings K.L., Rengarajan J. Mycobacterium tuberculosis impedes CD40-dependent notch signaling to restrict Th17 polarization during infection. iScience. 2022;25 doi: 10.1016/j.isci.2022.104305. [DOI] [PMC free article] [PubMed] [Google Scholar]
- 52.Yu Y.-R.A., O’Koren E.G., Hotten D.F., Kan M.J., Kopin D., Nelson E.R., Que L., Gunn M.D. A Protocol for the Comprehensive Flow Cytometric Analysis of Immune Cells in Normal and Inflamed Murine Non-Lymphoid Tissues. PLoS One. 2016;11 doi: 10.1371/journal.pone.0150606. [DOI] [PMC free article] [PubMed] [Google Scholar]
- 53.Morrell E.D., Wiedeman A., Long S.A., Gharib S.A., West T.E., Skerrett S.J., Wurfel M.M., Mikacenic C. Cytometry TOF identifies alveolar macrophage subtypes in acute respiratory distress syndrome. JCI Insight. 2018;3 doi: 10.1172/jci.insight.99281. [DOI] [PMC free article] [PubMed] [Google Scholar]
- 54.Barreto-Duarte B., Sterling T.R., Fiske C.T., Almeida A., Nochowicz C.H., Smith R.M., Barnett L., Warren C., Blackman A., Lapa E Silva J.R., et al. Increased Frequency of Memory CD4+ T-Cell Responses in Individuals With Previously Treated Extrapulmonary Tuberculosis. Front. Immunol. 2020;11 doi: 10.3389/fimmu.2020.605338. [DOI] [PMC free article] [PubMed] [Google Scholar]
- 55.Kothari H., Rao L.V.M., Vankayalapati R., Pendurthi U.R. Mycobacterium tuberculosis Infection and Tissue Factor Expression in Macrophages. PLoS One. 2012;7 doi: 10.1371/journal.pone.0045700. [DOI] [PMC free article] [PubMed] [Google Scholar]
- 56.Kincaid E.Z., Ernst J.D. Mycobacterium tuberculosis Exerts Gene-Selective Inhibition of Transcriptional Responses to IFN-γ Without Inhibiting STAT1 Function. J. Immunol. 2003;171:2042–2049. doi: 10.4049/jimmunol.171.4.2042. [DOI] [PubMed] [Google Scholar]
- 57.Willasch A., Eing S., Weber G., Kuçi S., Schneider G., Soerensen J., Jarisch A., Rettinger E., Koehl U., Klingebiel T., et al. Enrichment of cell subpopulations applying automated MACS technique: purity, recovery and applicability for PCR-based chimerism analysis. Bone Marrow Transplant. 2010;45:181–189. doi: 10.1038/bmt.2009.89. [DOI] [PubMed] [Google Scholar]
- 58.Corkum C.P., Ings D.P., Burgess C., Karwowska S., Kroll W., Michalak T.I. Immune cell subsets and their gene expression profiles from human PBMC isolated by Vacutainer Cell Preparation Tube (CPTTM) and standard density gradient. BMC Immunol. 2015;16:48. doi: 10.1186/s12865-015-0113-0. [DOI] [PMC free article] [PubMed] [Google Scholar]
- 59.Jayaraman P., Sada-Ovalle I., Nishimura T., Anderson A.C., Kuchroo V.K., Remold H.G., Behar S.M. IL-1β Promotes Antimicrobial Immunity in Macrophages by Regulating TNFR Signaling and Caspase-3 Activation. J. Immunol. 2013;190:4196–4204. doi: 10.4049/jimmunol.1202688. [DOI] [PMC free article] [PubMed] [Google Scholar]
- 60.Gschwandtner M., Derler R., Midwood K.S. More Than Just Attractive: How CCL2 Influences Myeloid Cell Behavior Beyond Chemotaxis. Front. Immunol. 2019;10:2759. doi: 10.3389/fimmu.2019.02759. [DOI] [PMC free article] [PubMed] [Google Scholar]
- 61.Redford P.S., Boonstra A., Read S., Pitt J., Graham C., Stavropoulos E., Bancroft G.J., O’Garra A. Enhanced protection to Mycobacterium tuberculosis infection in IL-10-deficient mice is accompanied by early and enhanced Th1 responses in the lung. Eur. J. Immunol. 2010;40:2200–2210. doi: 10.1002/eji.201040433. [DOI] [PMC free article] [PubMed] [Google Scholar]
- 62.Torrado E., Fountain J.J., Liao M., Tighe M., Reiley W.W., Lai R.P., Meintjes G., Pearl J.E., Chen X., Zak D.E., et al. Interleukin 27R regulates CD4+ T cell phenotype and impacts protective immunity during Mycobacterium tuberculosis infectionIL-27R regulates T cell fitness in tuberculosis. J. Exp. Med. 2015;212:1449–1463. doi: 10.1084/jem.20141520. [DOI] [PMC free article] [PubMed] [Google Scholar]
- 63.O’Leary S., O’Sullivan M.P., Keane J. IL-10 Blocks Phagosome Maturation in Mycobacterium tuberculosis–Infected Human Macrophages. Am J Resp Cell Mol. 2011;45:172–180. doi: 10.1165/rcmb.2010-0319oc. [DOI] [PubMed] [Google Scholar]
- 64.Iyer S.S., Ghaffari A.A., Cheng G. Lipopolysaccharide-Mediated IL-10 Transcriptional Regulation Requires Sequential Induction of Type I IFNs and IL-27 in Macrophages. J. Immunol. 2010;185:6599–6607. doi: 10.4049/jimmunol.1002041. [DOI] [PMC free article] [PubMed] [Google Scholar]
- 65.Knapp S., Leemans J.C., Florquin S., Branger J., Maris N.A., Pater J., van Rooijen N., van der Poll T. Alveolar Macrophages Have a Protective Antiinflammatory Role during Murine Pneumococcal Pneumonia. Am J Resp Crit Care. 2003;167:171–179. doi: 10.1164/rccm.200207-698oc. [DOI] [PubMed] [Google Scholar]
- 66.Naessens T., Vander Beken S., Bogaert P., Van Rooijen N., Lienenklaus S., Weiss S., De Koker S., Grooten J. Innate Imprinting of Murine Resident Alveolar Macrophages by Allergic Bronchial Inflammation Causes a Switch from Hypoinflammatory to Hyperinflammatory Reactivity. Am. J. Pathol. 2012;181:174–184. doi: 10.1016/j.ajpath.2012.03.015. [DOI] [PubMed] [Google Scholar]
- 67.Bryson B.D., Rosebrock T.R., Tafesse F.G., Itoh C.Y., Nibasumba A., Babunovic G.H., Corleis B., Martin C., Keegan C., Andrade P., et al. Heterogeneous GM-CSF signaling in macrophages is associated with control of Mycobacterium tuberculosis. Nat. Commun. 2019;10:2329. doi: 10.1038/s41467-019-10065-8. [DOI] [PMC free article] [PubMed] [Google Scholar]
- 68.Katakura T., Miyazaki M., Kobayashi M., Herndon D.N., Suzuki F. CCL17 and IL-10 as Effectors That Enable Alternatively Activated Macrophages to Inhibit the Generation of Classically Activated Macrophages. J. Immunol. 2004;172:1407–1413. doi: 10.4049/jimmunol.172.3.1407. [DOI] [PubMed] [Google Scholar]
- 69.Park H.-S., Back Y.W., Jang I.-T., Lee K.-I., Son Y.-J., Choi H.-G., Dang T.B., Kim H.-J. Mycobacterium tuberculosis Rv2145c Promotes Intracellular Survival by STAT3 and IL-10 Receptor Signaling. Front. Immunol. 2021;12 doi: 10.3389/fimmu.2021.666293. [DOI] [PMC free article] [PubMed] [Google Scholar]
- 70.Brooks D.G., Walsh K.B., Elsaesser H., Oldstone M.B.A. IL-10 directly suppresses CD4 but not CD8 T cell effector and memory responses following acute viral infection. Proc. Natl. Acad. Sci. USA. 2010;107:3018–3023. doi: 10.1073/pnas.0914500107. [DOI] [PMC free article] [PubMed] [Google Scholar]
- 71.Mittal S.K., Roche P.A. Suppression of antigen presentation by IL-10. Curr. Opin. Immunol. 2015;34:22–27. doi: 10.1016/j.coi.2014.12.009. [DOI] [PMC free article] [PubMed] [Google Scholar]
- 72.Mittal S.K., Cho K.-J., Ishido S., Roche P.A. Interleukin 10 (IL-10)-mediated Immunosuppression MARCH-I INDUCTION REGULATES ANTIGEN PRESENTATION BY MACROPHAGES BUT NOT DENDRITIC CELLS. J. Biol. Chem. 2015;290:27158–27167. doi: 10.1074/jbc.m115.682708. [DOI] [PMC free article] [PubMed] [Google Scholar]
- 73.Koppelman B., Neefjes J.J., de Vries J.E., de Waal Malefyt R. Interleukin-10 Down-Regulates MHC Class II αβ Peptide Complexes at the Plasma Membrane of Monocytes by Affecting Arrival and Recycling. Immunity. 1997;7:861–871. doi: 10.1016/s1074-7613(00)80404-5. [DOI] [PubMed] [Google Scholar]
- 74.Walburger A., Koul A., Ferrari G., Nguyen L., Prescianotto-Baschong C., Huygen K., Klebl B., Thompson C., Bacher G., Pieters J. Protein Kinase G from Pathogenic Mycobacteria Promotes Survival Within Macrophages. Science. 2004;304:1800–1804. doi: 10.1126/science.1099384. [DOI] [PubMed] [Google Scholar]
- 75.Sturgill-Koszycki S., Schlesinger P.H., Chakraborty P., Haddix P.L., Collins H.L., Fok A.K., Allen R.D., Gluck S.L., Heuser J., Russell D.G. Lack of Acidification in Mycobacterium Phagosomes Produced by Exclusion of the Vesicular Proton-ATPase. Science. 1994;263:678–681. doi: 10.1126/science.8303277. [DOI] [PubMed] [Google Scholar]
- 76.Pradhan G., Shrivastva R., Mukhopadhyay S. Mycobacterial PknG Targets the Rab7l1 Signaling Pathway To Inhibit Phagosome–Lysosome Fusion. J. Immunol. 2018;201:1421–1433. doi: 10.4049/jimmunol.1800530. [DOI] [PubMed] [Google Scholar]
- 77.Zulauf K.E., Sullivan J.T., Braunstein M. The SecA2 pathway of Mycobacterium tuberculosis exports effectors that work in concert to arrest phagosome and autophagosome maturation. PLoS Pathog. 2018;14 doi: 10.1371/journal.ppat.1007011. [DOI] [PMC free article] [PubMed] [Google Scholar]
- 78.Verbon A., Juffermans N., Van Deventer S.J., Speelman P., Van Deutekom H., Van Der Poll T. Serum concentrations of cytokines in patients with active tuberculosis (TB) and after treatment. Clin. Exp. Immunol. 1999;115:110–113. doi: 10.1046/j.1365-2249.1999.00783.x. [DOI] [PMC free article] [PubMed] [Google Scholar]
- 79.Beamer G.L., Flaherty D.K., Assogba B.D., Stromberg P., Gonzalez-Juarrero M., de Waal Malefyt R., Vesosky B., Turner J. Interleukin-10 Promotes Mycobacterium tuberculosis Disease Progression in CBA/J Mice. J. Immunol. 2008;181:5545–5550. doi: 10.4049/jimmunol.181.8.5545. [DOI] [PMC free article] [PubMed] [Google Scholar]
- 80.Wong E.A., Evans S., Kraus C.R., Engelman K.D., Maiello P., Flores W.J., Cadena A.M., Klein E., Thomas K., White A.G., et al. IL-10 Impairs Local Immune Response in Lung Granulomas and Lymph Nodes during Early Mycobacterium tuberculosis Infection. J. Immunol. 2020;204:644–659. doi: 10.4049/jimmunol.1901211. [DOI] [PMC free article] [PubMed] [Google Scholar]
- 81.Saxton R.A., Tsutsumi N., Su L.L., Abhiraman G.C., Mohan K., Henneberg L.T., Aduri N.G., Gati C., Garcia K.C. Structure-based decoupling of the pro- and anti-inflammatory functions of interleukin-10. Science. 2021;371 doi: 10.1126/science.abc8433. [DOI] [PMC free article] [PubMed] [Google Scholar]
- 82.Fiorentino D.F., Zlotnik A., Mosmann T.R., Howard M., O’Garra A. IL-10 inhibits cytokine production by activated macrophages. J. Immunol. 1991;147:3815–3822. [PubMed] [Google Scholar]
- 83.de Waal Malefyt R., Haanen J., Spits H., Roncarolo M.G., te Velde A., Figdor C., Johnson K., Kastelein R., Yssel H., de Vries J.E. Interleukin 10 (IL-10) and viral IL-10 strongly reduce antigen-specific human T cell proliferation by diminishing the antigen-presenting capacity of monocytes via downregulation of class II major histocompatibility complex expression. J. Exp. Med. 1991;174:915–924. doi: 10.1084/jem.174.4.915. [DOI] [PMC free article] [PubMed] [Google Scholar]
- 84.Vergne I., Chua J., Deretic V. Tuberculosis Toxin Blocking Phagosome Maturation Inhibits a Novel Ca2+/Calmodulin-PI3K hVPS34 Cascade. J. Exp. Med. 2003;198:653–659. doi: 10.1084/jem.20030527. [DOI] [PMC free article] [PubMed] [Google Scholar]
- 85.Rojas R.E., Balaji K.N., Subramanian A., Boom W.H. Regulation of Human CD4 + αβ T-Cell-Receptor-Positive (TCR + ) and γδ TCR + T-Cell Responses to Mycobacterium tuberculosis by Interleukin-10 and Transforming Growth Factor β. Infect. Immun. 1999;67:6461–6472. doi: 10.1128/iai.67.12.6461-6472.1999. [DOI] [PMC free article] [PubMed] [Google Scholar]
- 86.Hu X., Paik P.K., Chen J., Yarilina A., Kockeritz L., Lu T.T., Woodgett J.R., Ivashkiv L.B. IFN-γ Suppresses IL-10 Production and Synergizes with TLR2 by Regulating GSK3 and CREB/AP-1 Proteins. Immunity. 2006;24:563–574. doi: 10.1016/j.immuni.2006.02.014. [DOI] [PubMed] [Google Scholar]
- 87.Lai R., Jeyanathan M., Afkhami S., Zganiacz A., Hammill J.A., Yao Y., Kaushic C., Xing Z. CD11b+ Dendritic Cell–Mediated Anti– Mycobacterium tuberculosis Th1 Activation Is Counterregulated by CD103+ Dendritic Cells via IL-10. J. Immunol. 2018;200:1746–1760. doi: 10.4049/jimmunol.1701109. [DOI] [PubMed] [Google Scholar]
- 88.Xu W., Snell L.M., Guo M., Boukhaled G., Macleod B.L., Li M., Tullius M.V., Guidos C.J., Tsao M.-S., Divangahi M., et al. Early innate and adaptive immune perturbations determine long-term severity of chronic virus and Mycobacterium tuberculosis coinfection. Immunity. 2021;54:526–541.e7. doi: 10.1016/j.immuni.2021.01.003. [DOI] [PMC free article] [PubMed] [Google Scholar]
- 89.Barber D.L., Mayer-Barber K.D., Feng C.G., Sharpe A.H., Sher A. CD4 T Cells Promote Rather than Control Tuberculosis in the Absence of PD-1–Mediated Inhibition. J. Immunol. 2011;186:1598–1607. doi: 10.4049/jimmunol.1003304. [DOI] [PMC free article] [PubMed] [Google Scholar]
- 90.Kauffman K.D., Sakai S., Lora N.E., Namasivayam S., Baker P.J., Kamenyeva O., Foreman T.W., Nelson C.E., Oliveira-de-Souza D., Vinhaes C.L., et al. PD-1 blockade exacerbates Mycobacterium tuberculosis infection in rhesus macaques. Sci. Immunol. 2021;6 doi: 10.1126/sciimmunol.abf3861. [DOI] [PMC free article] [PubMed] [Google Scholar]
- 91.Nyendak M., Swarbrick G.M., Duncan A., Cansler M., Huff E.W., Hokey D., Evans T., Barker L., Blatner G., Sadoff J., et al. Adenovirally-Induced Polyfunctional T Cells Do Not Necessarily Recognize the Infected Target: Lessons from a Phase I Trial of the AERAS-402 Vaccine. Sci. Rep. 2016;6 doi: 10.1038/srep36355. [DOI] [PMC free article] [PubMed] [Google Scholar]
- 92.Jarvela J.R., Tuscano L., Lee H., Silver R.F. Pulmonary responses to pathogen-specific antigens in latent Mycobacterium tuberculosis infection. Tuberculosis. 2016;96:158–164. doi: 10.1016/j.tube.2015.10.006. [DOI] [PMC free article] [PubMed] [Google Scholar]
- 93.Silver R.F., Zukowski L., Kotake S., Li Q., Pozuelo F., Krywiak A., Larkin R. Recruitment of Antigen-Specific Th1-Like Responses to the Human Lung following Bronchoscopic Segmental Challenge with Purified Protein Derivative of Mycobacterium tuberculosis. Am J Resp Cell Mol. 2003;29:117–123. doi: 10.1165/rcmb.4840. [DOI] [PubMed] [Google Scholar]
Associated Data
This section collects any data citations, data availability statements, or supplementary materials included in this article.
Supplementary Materials
Data Availability Statement
-
•
This paper analyzes existing, publicly available data. The data used for the CSF1, CSF2, IL10, and TNF gene expression analyses described in this manuscript were obtained from GTEX Analysis Release V8 on the GTEx Portal: www.gtexportal.org on 12/22/2022, and is listed in the key resources table. Additional data reported in this paper will be shared by the lead contact upon request.
-
•
This paper does not report original code.
-
•
Any additional information required to reanalyze the data reported in this paper is available from the lead contact upon request.