Abstract
Purpose:
The tablet-based Melbourne Rapid Fields (MRF) visual field (VF) test and the IMOvifa Smart Visual Function Analyzer (SVFA) are portable perimeters that may allow for at-home monitoring and more frequent testing. We compared tablet and SVFA results to outputs from the Humphrey Field Analyzer (HFA) 24–2 Swedish Interactive Threshold Algorithm (SITA) Standard program.
Design:
Observational cross-sectional study.
Subjects:
Adult participants with a diagnosis of glaucoma, suspected glaucoma, or ocular hypertension seen in the Massachusetts Eye and Ear glaucoma clinic were enrolled. All participants were reliable, experienced HFA testers.
Methods:
Participants were tested with the SVFA and HFA. Study staff also trained participants on the MRF tablet with instructions to take weekly tests at home for three months. VF results from the three devices were compared.
Main Outcome Measures:
Mean deviation (MD), pattern standard deviation (PSD), reliability parameters, point sensitivity.
Results:
79 participants (133 eyes) with a mean age of 61 ± 13 years (range 26–79) were included; 59% of the participants were female, and the mean HFA MD was −2.7 ± 3.9 decibels (dB). The global indices of MD and PSD did not significantly vary between HFA and the two novel devices, except that the tablet VF reported a 0.6 dB higher PSD compared to HFA (95% CI for difference between HFA and tablet = [0.27 dB to 1.02 dB], P < 0.001). However, tablet and SVFA sensitivities significantly differed from those of the HFA at 36 and 39 locations, respectively, out of 52 locations. Relative to HFA, the tablet overestimated light sensitivity in the nasal field while underestimating the temporal field. The SVFA generally underestimated light sensitivity, but its results were more similar to HFA results compared to the tablet.
Conclusions:
While average MD values from the two novel devices suggest that they provide similar results to the HFA, point-by-point comparisons highlight notable deviations. Differences in specific point sensitivity values were significant, especially between the tablet and the other two devices. These differences may in part be explained by differences in the normative databases of each device as well as how MD is calculated. However, the tablet had substantial differences based on location, indicating that the tablet design itself may be responsible for the differences in local sensitivities.
Keywords: perimetry, visual field, at-home monitoring, telemedicine, glaucoma
Précis:
Comparisons of perimetric outcomes from a tablet-based perimeter and smart visual function analyzer to standard clinic-based visual fields show systematic differences in the measurement of sensitivities across devices.
Serial visual field (VF) testing is essential for diagnosing and monitoring glaucoma, the leading cause of irreversible blindness in the world.1 At present, there is no gold-standard modality to evaluate VF progression in glaucoma.2–4 One of the most common perimetry procedures used in clinical practice is the Humphrey Field Analyzer (HFA; Carl Zeiss Meditec, Inc, Dublin, CA, USA) Swedish Interactive Threshold Algorithm (SITA) Standard.5,6
The HFA SITA Standard is effective for monitoring functional VF change over time, yet it places substantial strain on patients and the trained personnel who operate it, and testing is performed relatively infrequently.7,8 Despite well-established benefits of high initial and subsequent testing frequency, most patients perform only two to three VFs in the first two years after their glaucoma diagnosis due to logistic constraints, with some patients taking up to ten years to complete the guideline-recommended six VFs.9 As a result, detection of meaningful progression of glaucoma leading to visual field loss VF is likely to be delayed, resulting in untimely medical and surgical interventions and further vision loss.10
At-home VF testing is a potential alternative or supplement to HFA for glaucoma patients.9,11–17 Tablet-based devices and other automated perimeters may allow for increased assessment frequency compared to testing in a clinical setting only, enabling earlier detection of VF progression. Two devices that have shown potential as suitable user-friendly and portable VF testing alternatives are the Melbourne Rapid Fields (MRF) tablet-based perimeter (M&S Technologies, Niles, IL, USA) and the IMOvifa (IMO; CREWT Medical Systems Inc., Tokyo, Japan) smart visual function analyzer (SVFA). While these perimeters may provide cost-effective, accessible, and more frequent VF home monitoring, their performance has not been thoroughly studied at a point-to-point level; it remains unclear whether they are able to consistently identify VF defects.8,13,15–21 In this study, we sought to compare the outputs from the SVFA and tablet perimeters to HFA 24–2 SITA Standard in glaucoma patients, glaucoma suspects, and individuals with ocular hypertension.
Methods
An observational cross-sectional study was conducted at Massachusetts Eye and Ear (MEE; Boston, MA, USA) to compare the results of SVFA and tablet VF tests to those obtained using the HFA 24–2 SITA Standard program. The study protocol was approved by the Mass General Brigham institutional review board. The research adhered to the tenets of the Declaration of Helsinki, and all participants provided signed informed consent prior to their participation in the study.
Participants
Inclusion Criteria.
Patients with known glaucoma, suspected glaucoma, or ocular hypertension (OHTN), between 18 to 80 years of age, were recruited during a regularly scheduled visit at the MEE glaucoma clinic. Medical charts were reviewed by two fellowship-trained glaucoma specialists (ML and DF), and diagnoses were based on comprehensive eye exams, VF testing, and OCT imaging. To be included in the study, participants were required to have a best-corrected visual acuity (BCVA) of 20/40 or better and an HFA mean deviation (MD) of −15 decibels (dB) or better in at least one eye. In addition, participants had to be able to perform reliable HVF testing (defined as false-positive and false-negative rates of ≤20% on their last VF), understand English (written and voice over instructions for VF tests were all supplied in English), and score ≥7 on the Six-Item Cognitive Impairment Test.22 If a participant had two eyes that met the inclusion criteria, they were given the option to test both eyes throughout the study.
Exclusion Criteria.
Participants were excluded if they had any systemic or ocular disease other than glaucoma that could interfere with VF results, or if they had undergone intraocular surgery within 90 days of the study.
Procedures
Participants came into clinic for a study visit in which they performed the SVFA test and were trained on how to independently use the tablet perimeter at home. In addition, an HFA test was performed during the study visit if one had not been obtained as part of routine clinical care within the past 12 weeks. The order of HFA and SVFA testing was randomized, and when both eyes were included, testing was done on the eye with more severe glaucoma on HVF based on MD first for each device. At the end of the visit, participants were provided tablets with the VF test application for at-home testing. They were asked to complete one test every day of the first week and then one test per week for the following three months.
Devices
MRF Application.
The MRF application was instilled on Microsoft Surface Go tablets (Microsoft Redmond, WA, USA). Manufacturer tablet specifications included a 10.5” PixelSense™ display with a resolution of 1920 × 1280 (220 pixels per inch), a contrast ratio of 1500:1 and max luminance of 400 candelas per meter squared (cd/m2). The tablet perimeter uses a 24–2 test pattern that is centered at fixation and assesses 56 locations spanning roughly 24° of the VF in each direction from fixation. These points are measured 21° superiorly, inferiorly, temporally, and with an extra 2 points nasally at 27° beginning 3° from the central fixation in a grid pattern at 6° intervals. This allows for bracketing of the horizontal and vertical meridians, with an additional 4 points tested in the fovea at 0.7° from the central fixation. Because these four additional paracentral points are not captured by the HFA, they were not included in our analysis to maximize comparability. The software uses the Zippy Estimated Sequential Testing (ZEST) algorithm.23,24 The dynamic intensity range of the tablet procedure is 30 dB, which is smaller than for the HFA, which exceeds 40 dB.21 Consequently, the spot size increases in the periphery to maintain constant threshold across the central field for a normal eye and to account for the tangent effect of the flat screen.13,14 Tablet-generated voice commands guide the participant through the test, instructing the test-taker when to alter fixation toward each of the four corners of the tablet.13 The patient’s response to a stimulus is recorded by pressing the spacebar on a Logitech (Newark, CA, USA) Bluetooth keyboard. The application uses a false-positive check and a blind-spot monitor as reliability indices.13 Participants were asked to wear their normal reading glasses for the duration of the test, and study staff gave them the following instructions for the test: keep head position constant, occlude the fellow eye with the provided eye patch, leave on the 3M tablet screen anti-glare filter (Maplewood, MN, USA), and sit at a viewing distance of 33 centimeters (13 inches), as measured with a provided tape measure, in a dimly-lit environment (Figure 1).
Figure 1.
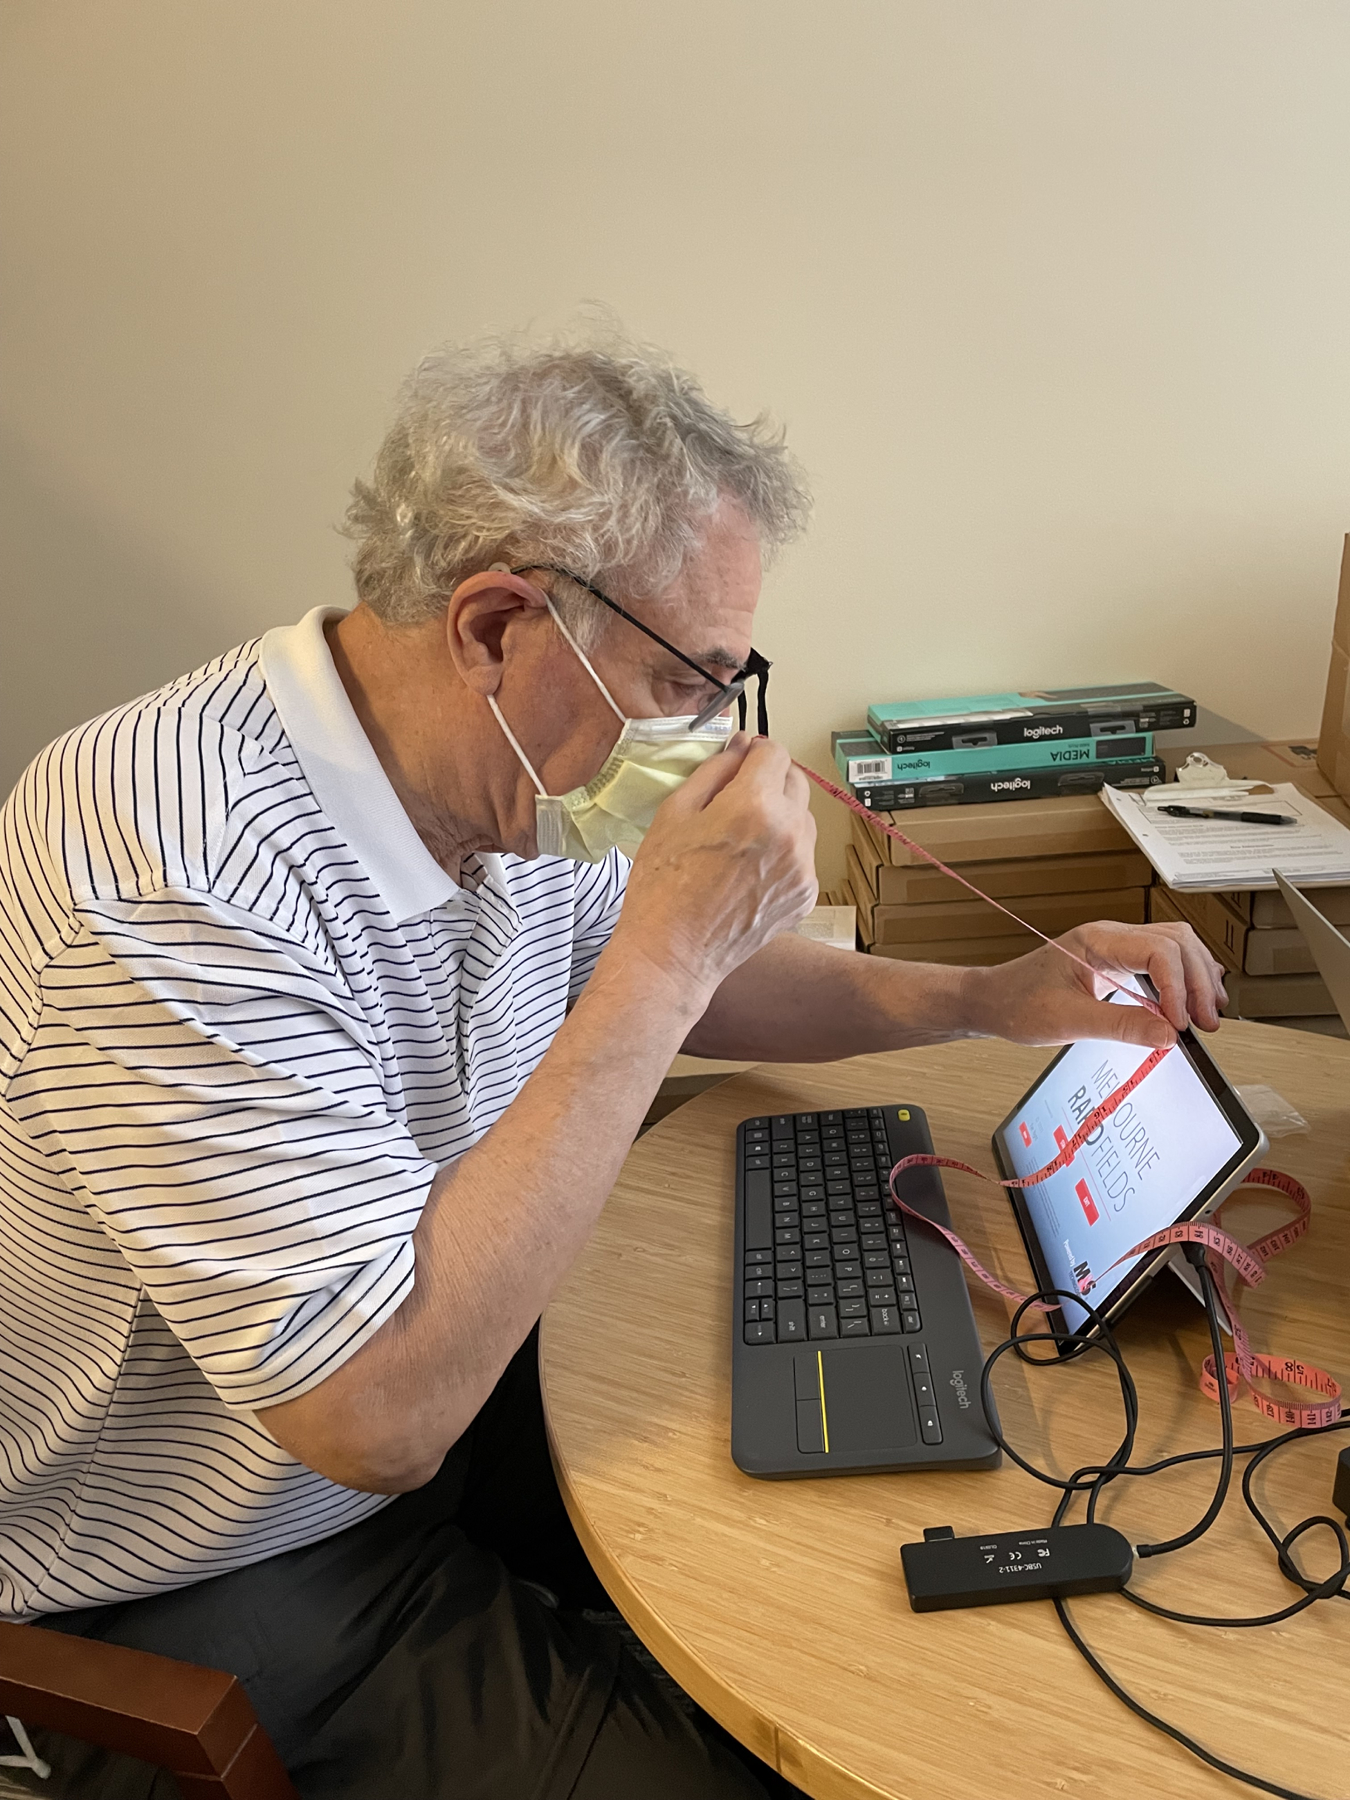
Participant measuring 33cm during his training on the tablet-based visual field. Photo release consent was obtained.
IMOvifa SVFA.
The specifications and features of the SVFA were extracted from the device’s manual,25 unless otherwise stated. The system consists of a headset (200 × 180 × 120 millimeters, 850 grams) fixed to a tabletop stand, a patient response button, a test controller laptop, and a cloud-based server (Figure 2a). The SVFA has spherical power adjustment dials and magnetized spherical and cylindrical corrective lenses capable of correcting –12 Diopters (D) to +6D of sphere and –3D to 0D of cylinder to adjust for a test-taker’s refractive error. The device utilizes completely isolated optical systems to conduct independent stimulus presentation and pupil monitoring for each eye.16 The optical system employs a wide-angle lens that can measure the VF within 30° from the fovea and allows for the test to be administered under non-occlusion conditions.16 The SVFA was performed with both eyes of the participants open throughout the entire examination, whereas one eye was occluded for both the HFA and the tablet VF. The software uses the Ambient Interactive Zippy Estimated Sequential Testing (AIZE) algorithm, a derivative of the adaptive Bayesian Zippy Estimated Sequential Testing (ZEST) algorithm.26 The 24–2 pattern of this AIZE algorithm was used in the study, which presents stimuli at 54 points spanning 24° from fixation at 6° intervals.15,16 Stimulus size is expressed in size I to V independently of the placement of the 24–2 magnitude points, and the general visual field test uses size III, which has a visual angle of 0.431° in diameter. This threshold procedure records retinal sensitivities in the range of 0 to 50 dB. Since the headset is mounted to a tabletop stand, participants were instructed to lean forward and place their face into the device, looking into its lenses to take the test (i.e., the device was not worn by the patient) (Figure 2b). Participants took the VF test in a moderately dim environment, as the SVFA allows for VF testing without a dark room, in contrast to standard automated perimetry.16
Figure 2.
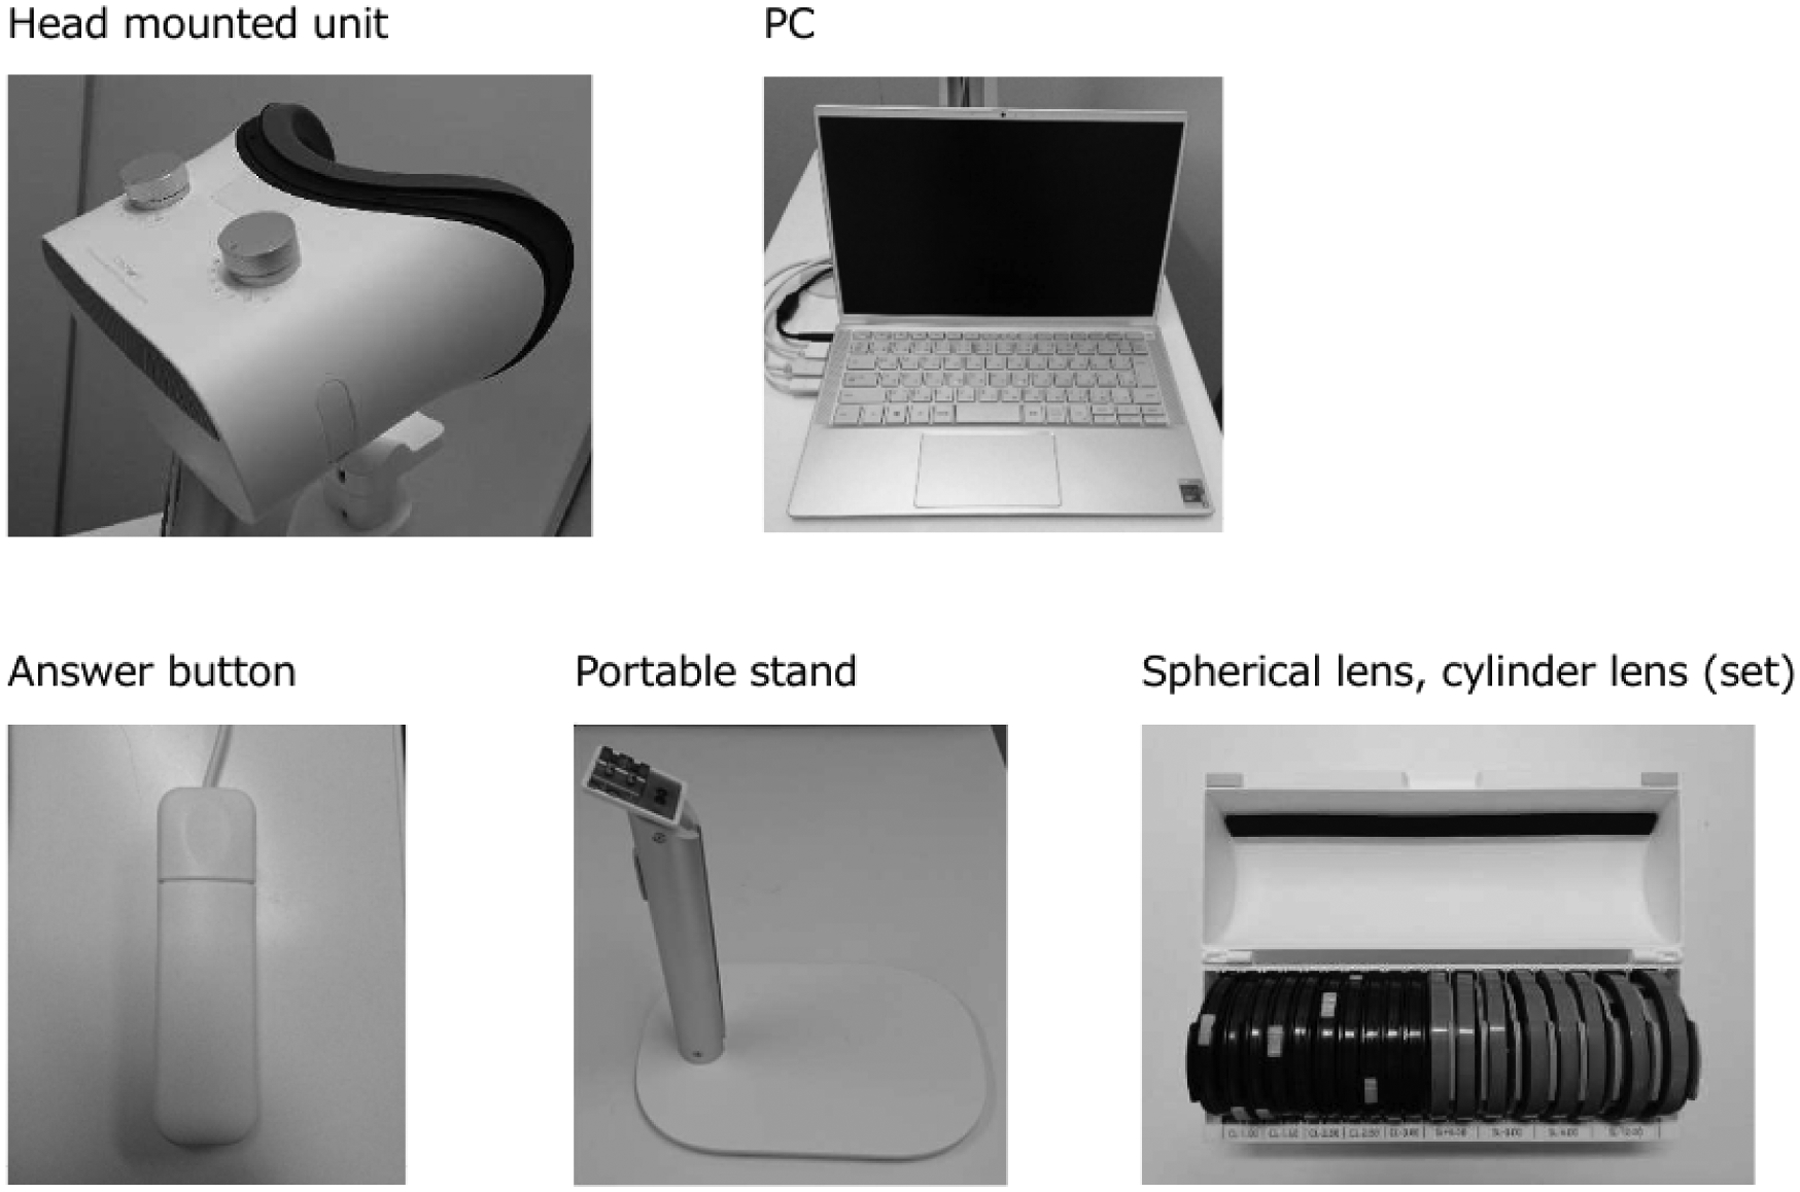
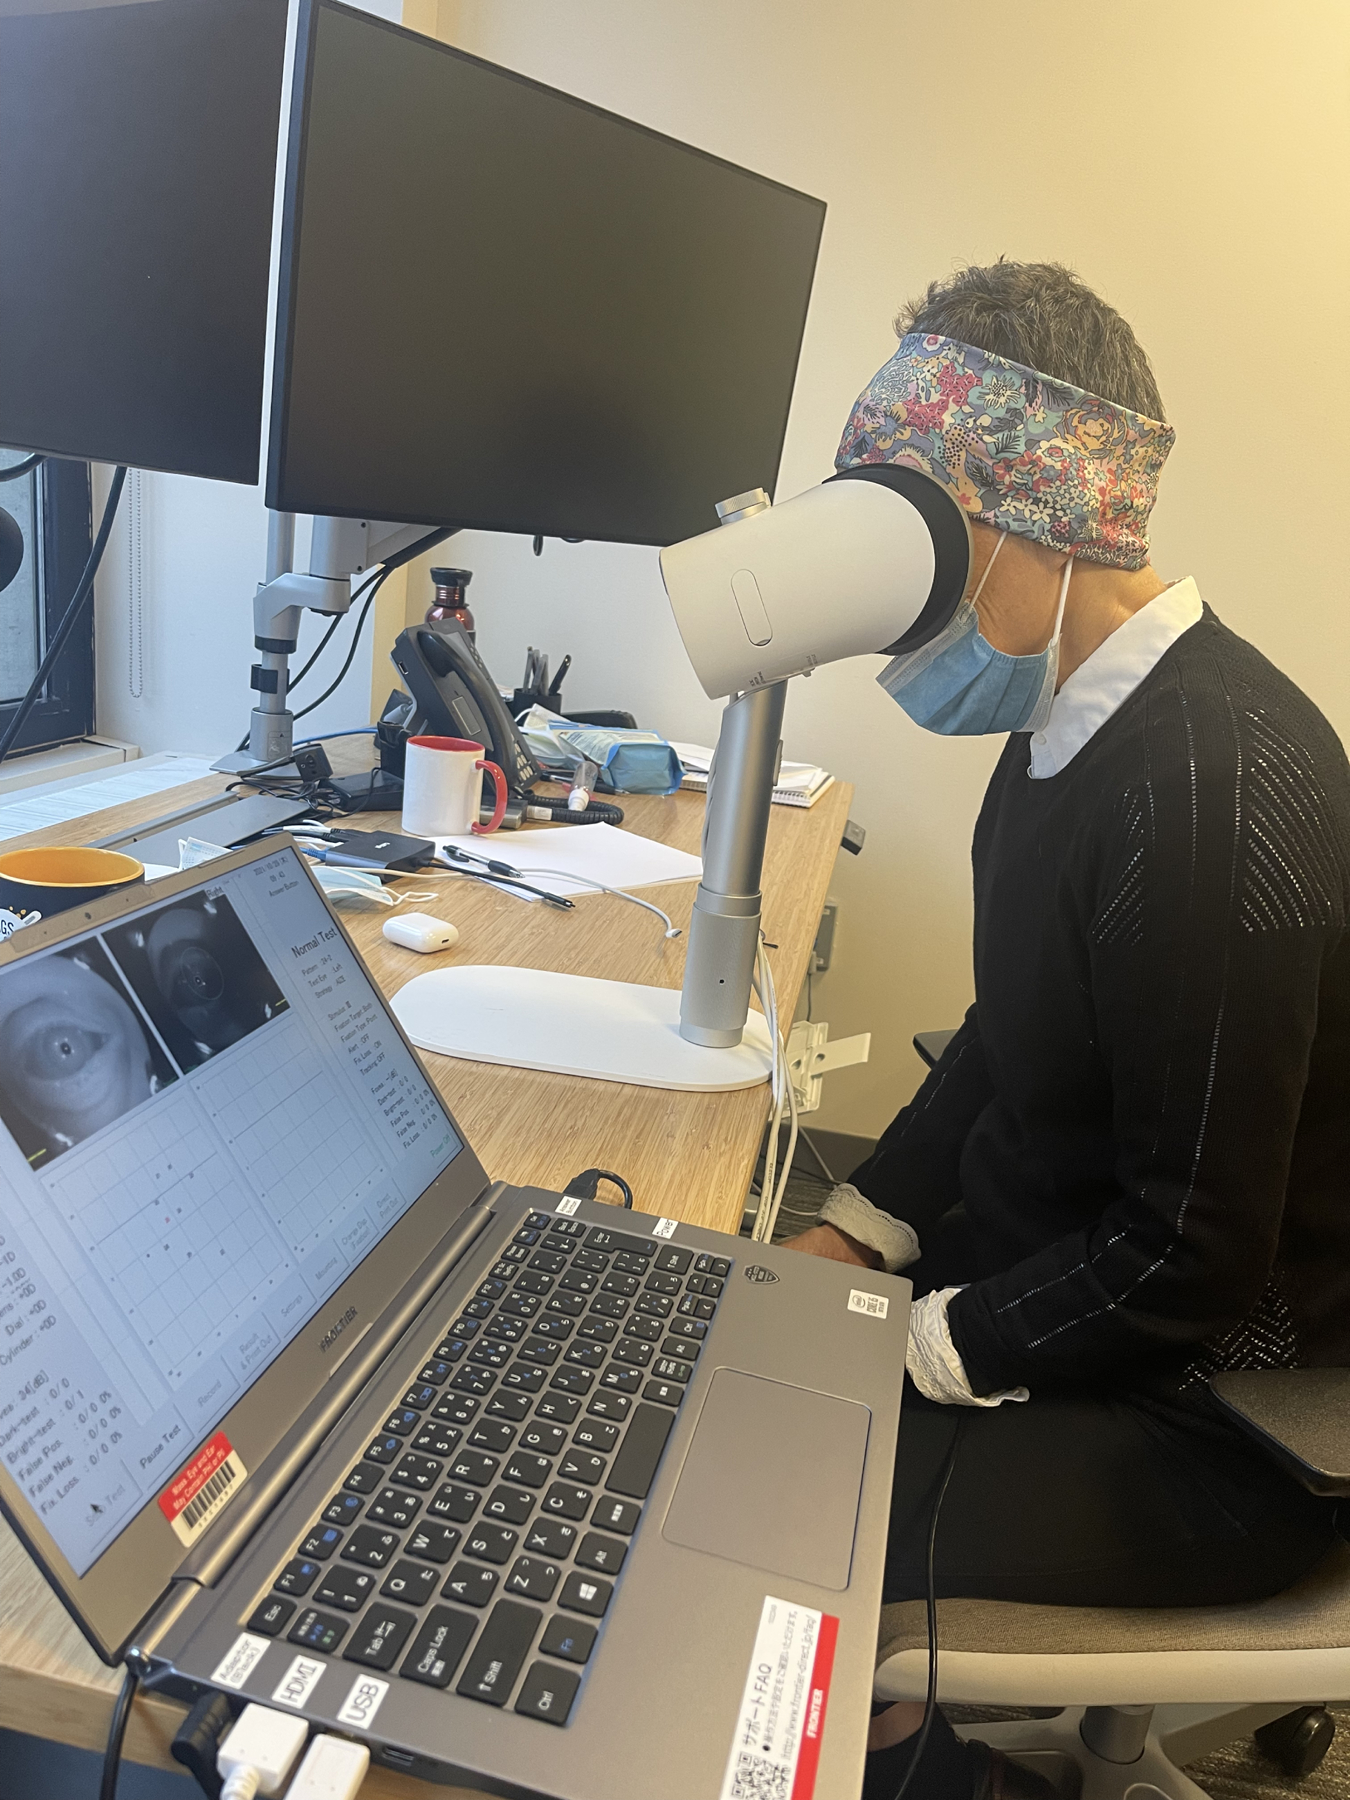
Smart Visual Function Analyzer (SVFA). (a) Components include: a headset (unit and portable stand), patient response button, test controller laptop, and set of spherical and cylinder lenses. (b) (c) Participant utilizing the SVFA. Photo release consent was obtained.
Data Analysis
We built density plots and boxplots of mean deviation (MD) and pattern standard deviation (PSD) and compared MD and PSD group means of each device to the HFA. We performed point-by-point analyses using paired t-tests to compare the sensitivity values of 52 corresponding locations between each of the three devices (HFA vs. SVFA, HFA vs. tablet, and SVFA vs. tablet). Preliminary sensitivity analysis using an asymptote model showed that there was a significant learning effect that happened on the first independent home-based test which made it unreliable for comparison. There was an additional slight improvement that happened on the second test, and an average of the data from the second and third tests was similar to subsequent ones.27 We present the average from the second and third at-home tests as the tablet’s VF test.
The P-values were adjusted for multiple comparisons using the false discovery rate (Benjamini-Hochberg method).28 In addition to the raw sensitivity points, we compared total deviation (TD) and pattern deviation (PD) values, which are derived from the raw dB sensitivities. TD is defined as the difference between the observed threshold and the age-corrected normal value at each tested location, and pattern deviation (PD) is defined as the deviation from age-corrected values adjusted for the general height of the VF; these values adjust for age and any diffuse changes in VF sensitivity, respectively, thereby adjusting for confounding factors and aiding in discerning glaucoma-specific VF disturbances.29 The point-by-point analysis comparing the TD and PD values was conducted between the HFA and SVFA only, as the tablet software did not report these values.
The HFA 24–2 Standard test algorithm consists of 54 test locations, but as the two locations closest to the blind spot do not have normative values, we excluded them and looked at a total of 52 locations.30 The 24–2 full threshold algorithm that was used on the SVFA tested the same 52 locations. We also examined the same 52 locations for the tablet, excluding the four additional points it tests in the fovea, as aforementioned, to maximize comparability. For naming conventions in the study, we used S1-S54, TD1-TD54, and PD1-PD54 to look at the 52 non-blind spot locations, excluding S/TD/PD locations 26 and 35 (Supplemental Figure 1). Left eye structures were flipped, and all eyes were plotted as right eye.
Results
Seventy-nine participants were included with a mean age of 61 ± 13 years (range 26–79), and 59% were female. Most (68%) participants tested both eyes which rendered a total of 133 observations on each of the three devices. The mean HFA MD was −2.7 ± 3.9 dB.
Comparison of MD and PSD
Density plots (Figure 3) and boxplots (Figure 4) compare the MD and PSD for all three devices. No significant differences were seen in nested multilevel data analysis comparing the pooled means of MD and PSD for all three devices except for the PSD value between the HFA and tablet. We found that both the SVFA and tablet perimeters reported similar mean MD compared to the HFA (mean HFA MD = −2.72 dB; mean difference between HFA and SVFA = 0.24 dB, 95% CI = [−0.16 dB to 0.63 dB], P = 0.237; mean difference between HFA and tablet = 0.03 dB, 95% CI = [−0.36 dB to 0.42 dB], P = 0.89). PSD was not significantly different when comparing SVFA to the HFA (mean PSD = 4.09 dB, 95% CI = [3.48 dB to 4.70 dB]; mean difference between HFA and SVFA = 0.36 dB, 95% CI = [−0.01 dB to 0.74 dB], P = 0.06). However, the tablet reported significantly higher PSD than the HFA, approximately 0.64 dB greater (95% CI for difference between HFA and tablet = [0.27 dB to 1.02 dB], P < 0.001). Strong correlation was seen between MD and PSD on all three devices (Table 1).
Figure 3:
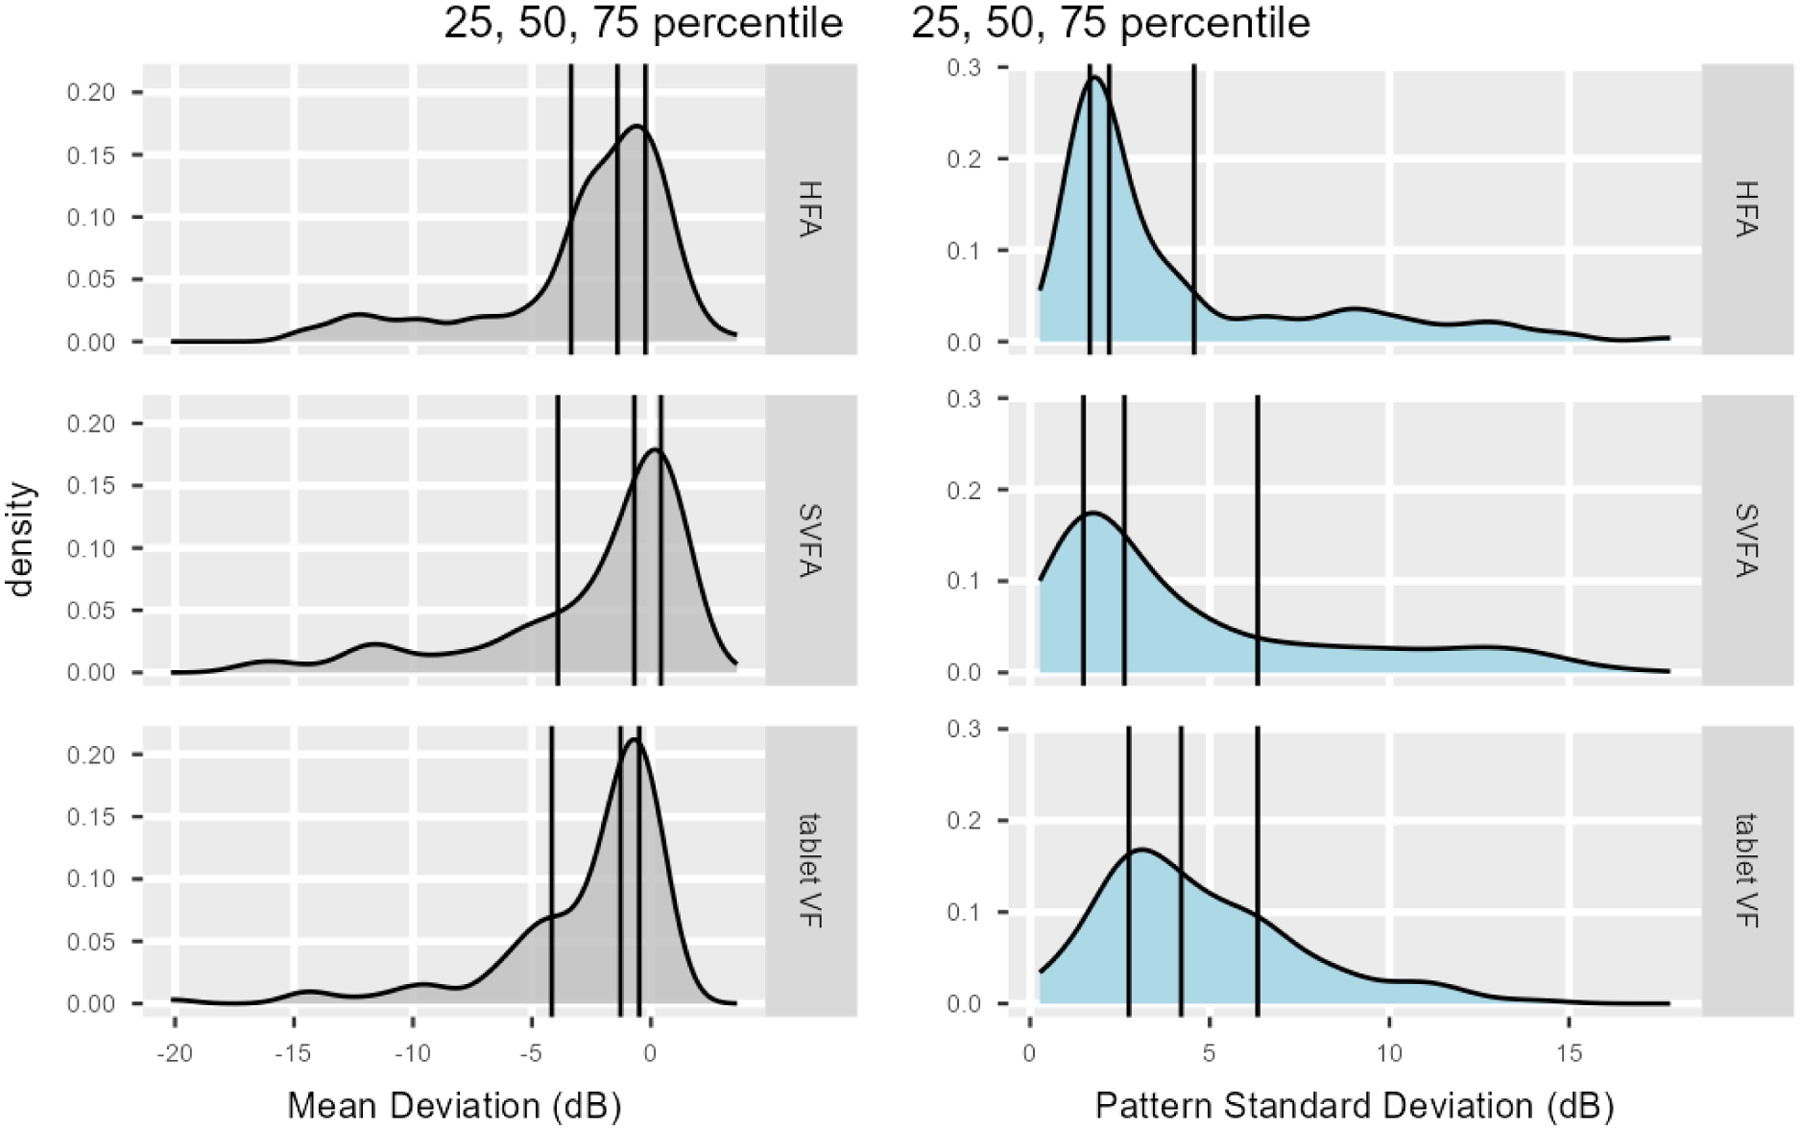
Density plots comparing the Humphrey Field Analyzer (HFA), Smart Visual Function Analyzer (SVFA), and tablet values for MD and PSD. Vertical lines denote interquartile range and median.
Figure 4:
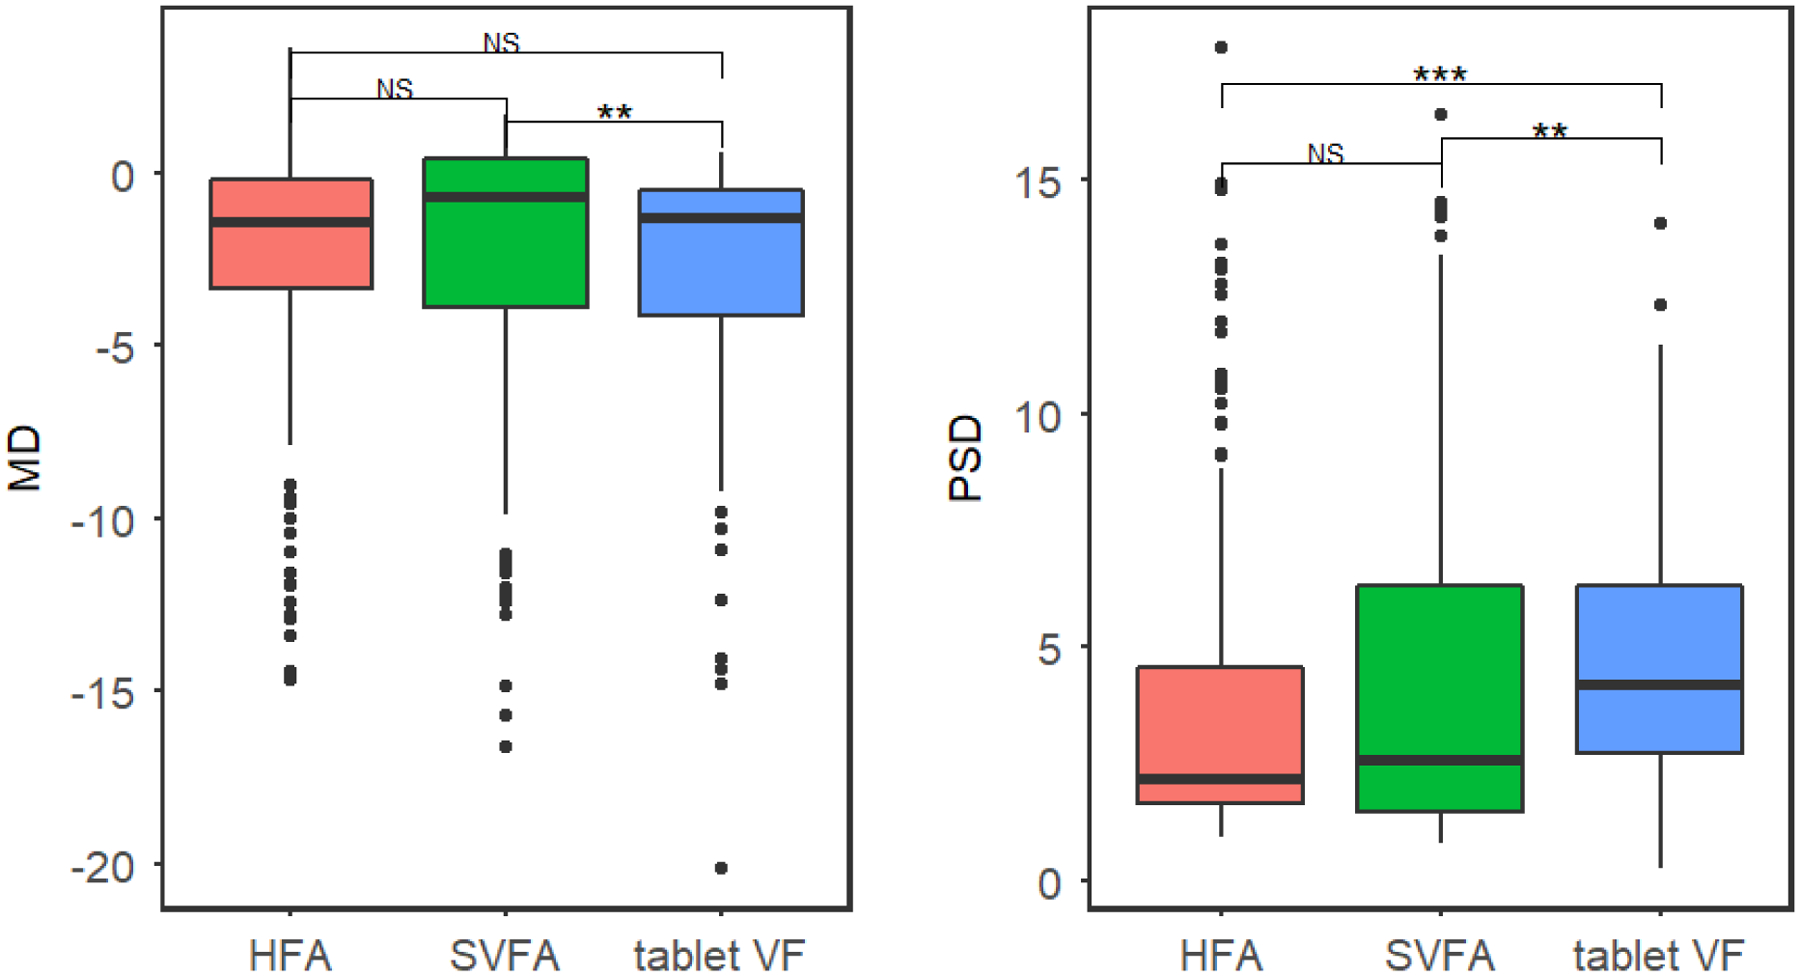
Boxplot comparing the MD and PSD for the Humphrey Field Analyzer (HFA), Smart Visual Function Analyzer (SVFA), and tablet, with pairwise significance shown.
Table 1:
Correlation table of MD and PSD between the Humphrey Field Analyzer (HFA), Smart Visual Function Analyzer (SVFA), and tablet.
| MD | r | CI | p |
|---|---|---|---|
| HFA vs SVFA | 0.88 | 0.84 – 0.92 | <0.001 |
| HFA vs tablet | 0.80 | 0.73 – 0.85 | <0.001 |
| SVFA vs tablet | 0.83 | 0.76 – 0.87 | <0.001 |
| PSD | r | CI | p |
| HFA vs SVFA | 0.91 | 0.88 – 0.94 | <0.001 |
| HFA vs tablet | 0.79 | 0.71 – 0.84 | <0.001 |
| SVFA vs tablet | 0.79 | 0.72 – 0.85 | <0.001 |
Comparison of sensitivities
A point-by-point analysis using paired T-tests compared the dB sensitivities of the 52 VF locations between the devices (Figure 5). Non-parametric statistical comparisons using the Wilcoxon signed-rank test showed similar results (Supplemental Figure 2). SVFA sensitivities differed from those obtained by HFA at 39 test locations (p-values of the pointwise differences shown in Supplemental Table 1). Lower sensitivity values were generally found for SVFA versus HFA at these discrepant locations, but the differences were not large. Most of these differing points were in the inferotemporal portion of the VF, where the HFA had slightly higher sensitivity values. On average, the sensitivity values of the HFA were 1.2 dB higher than sensitivity values of the SVFA throughout the overall field. For 34 of the 52 points (65.4%), the intraclass correlation coefficients (ICC) calculated on each location between HFA and SVFA ranged from 0.6 to 0.8 (Figure 6).
Figure 5:
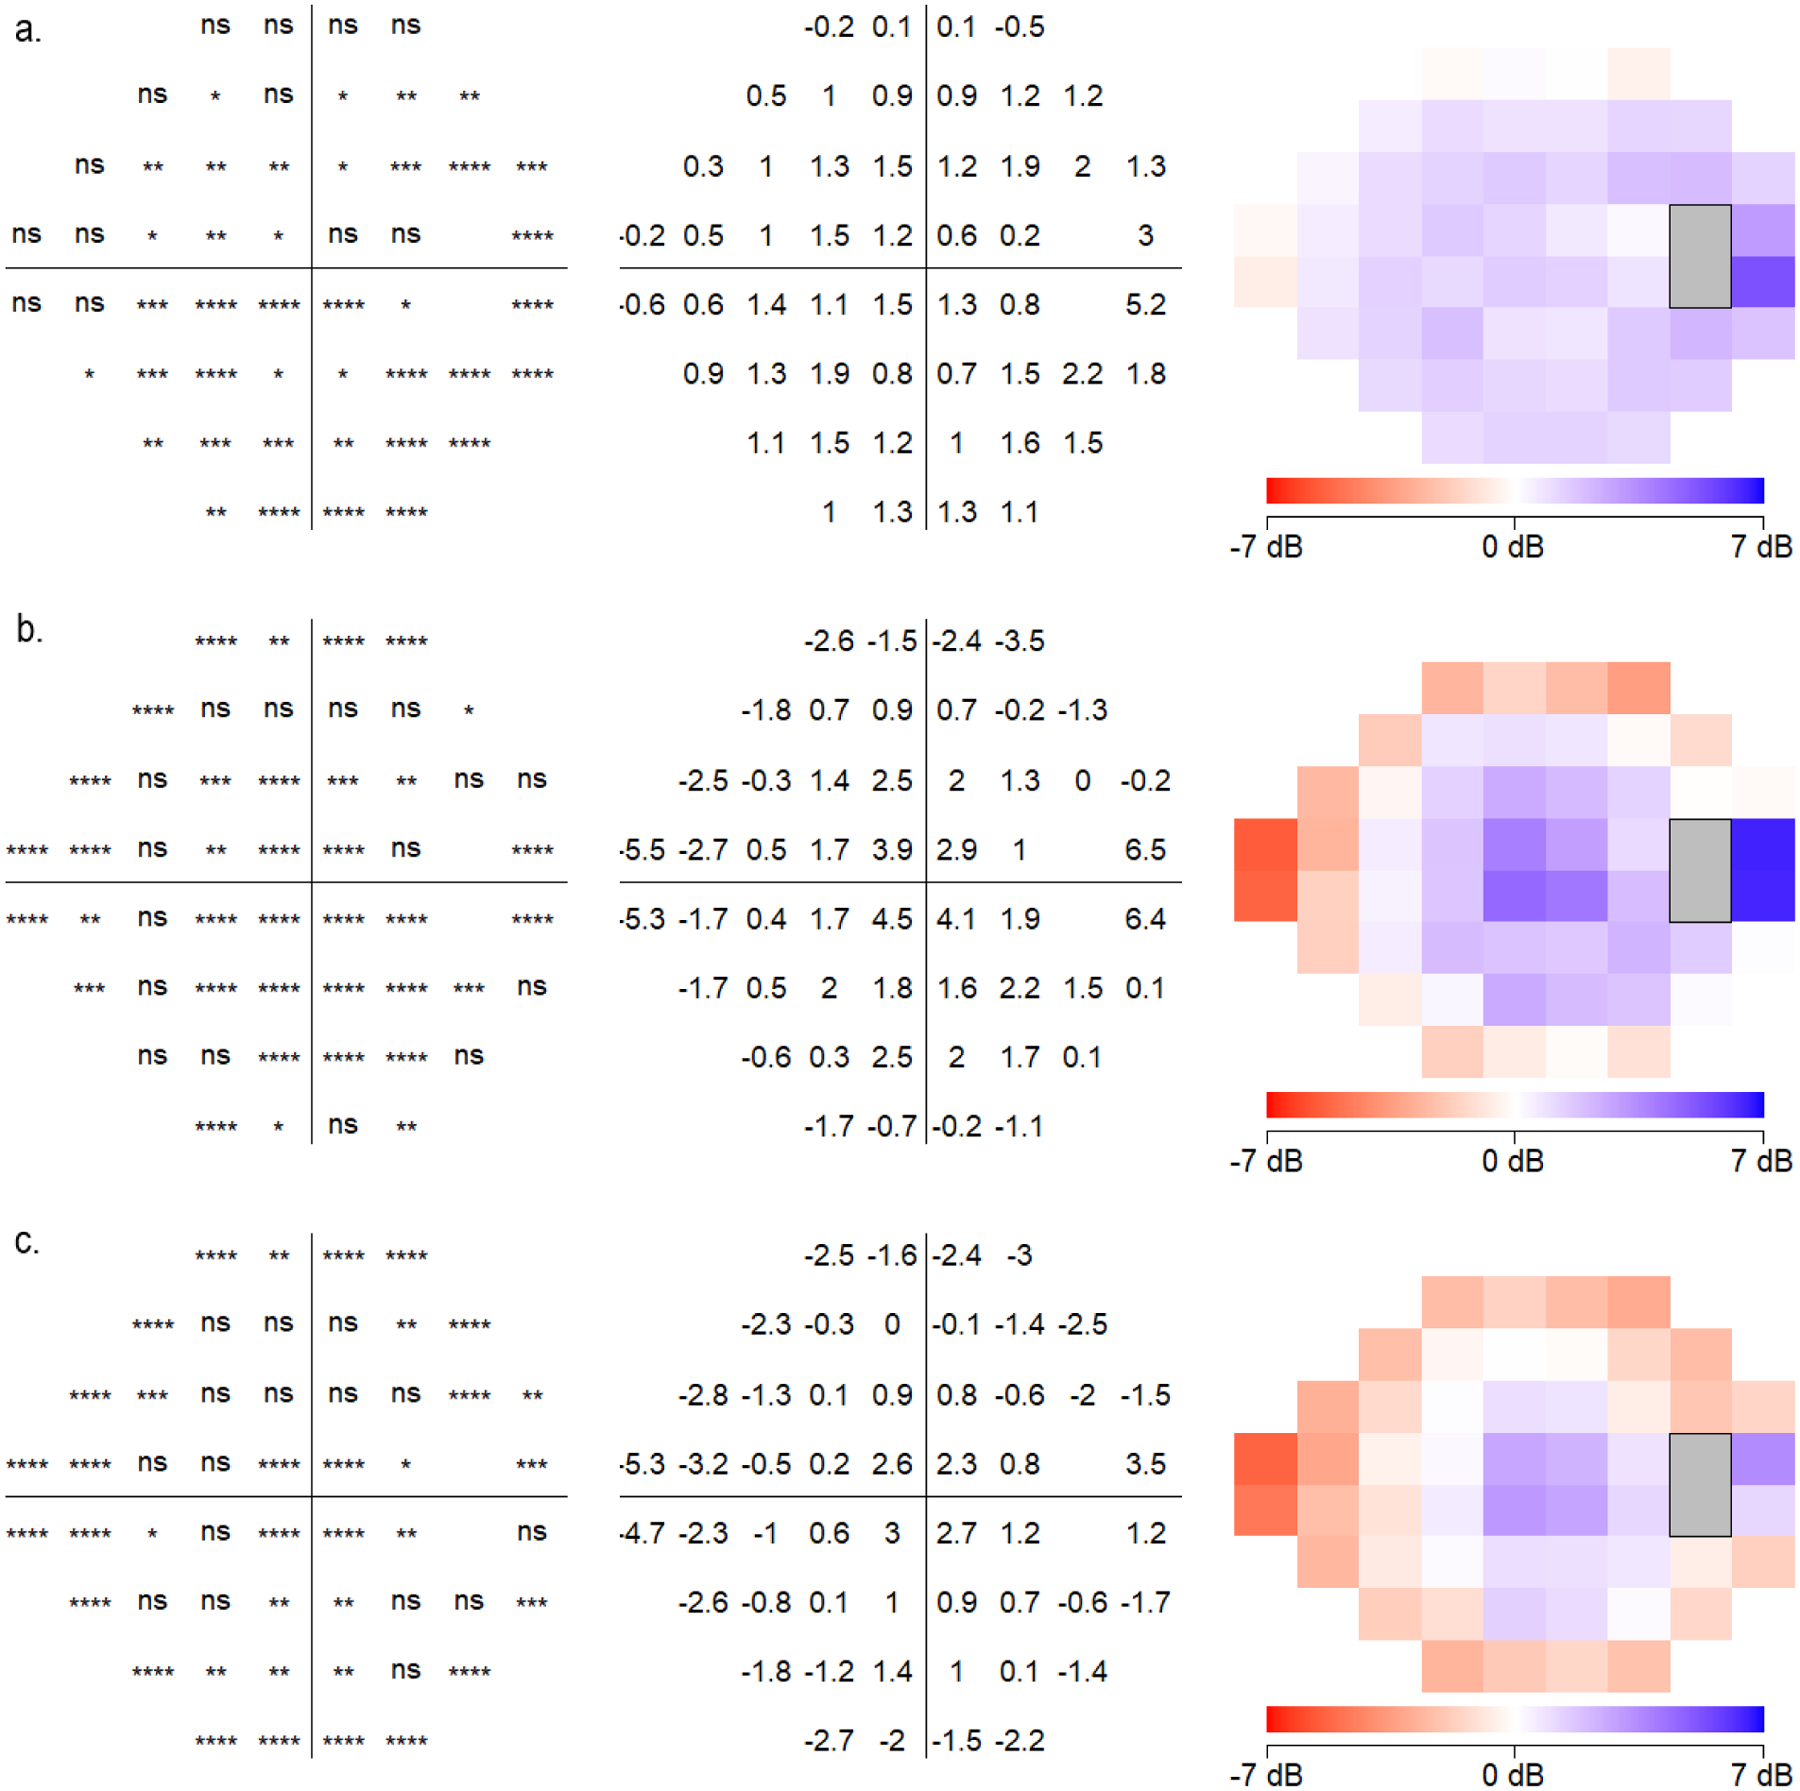
Point by point analysis of sensitivities at each testing location comparing (a) Humphrey Field Analyzer (HFA) and Smart Visual Function Analyzer (SVFA), (b) HFA and tablet, and (c) SVFA and tablet. Locations and degrees of significantly different values are shown (all eyes plotted as right eye).
Figure 6.
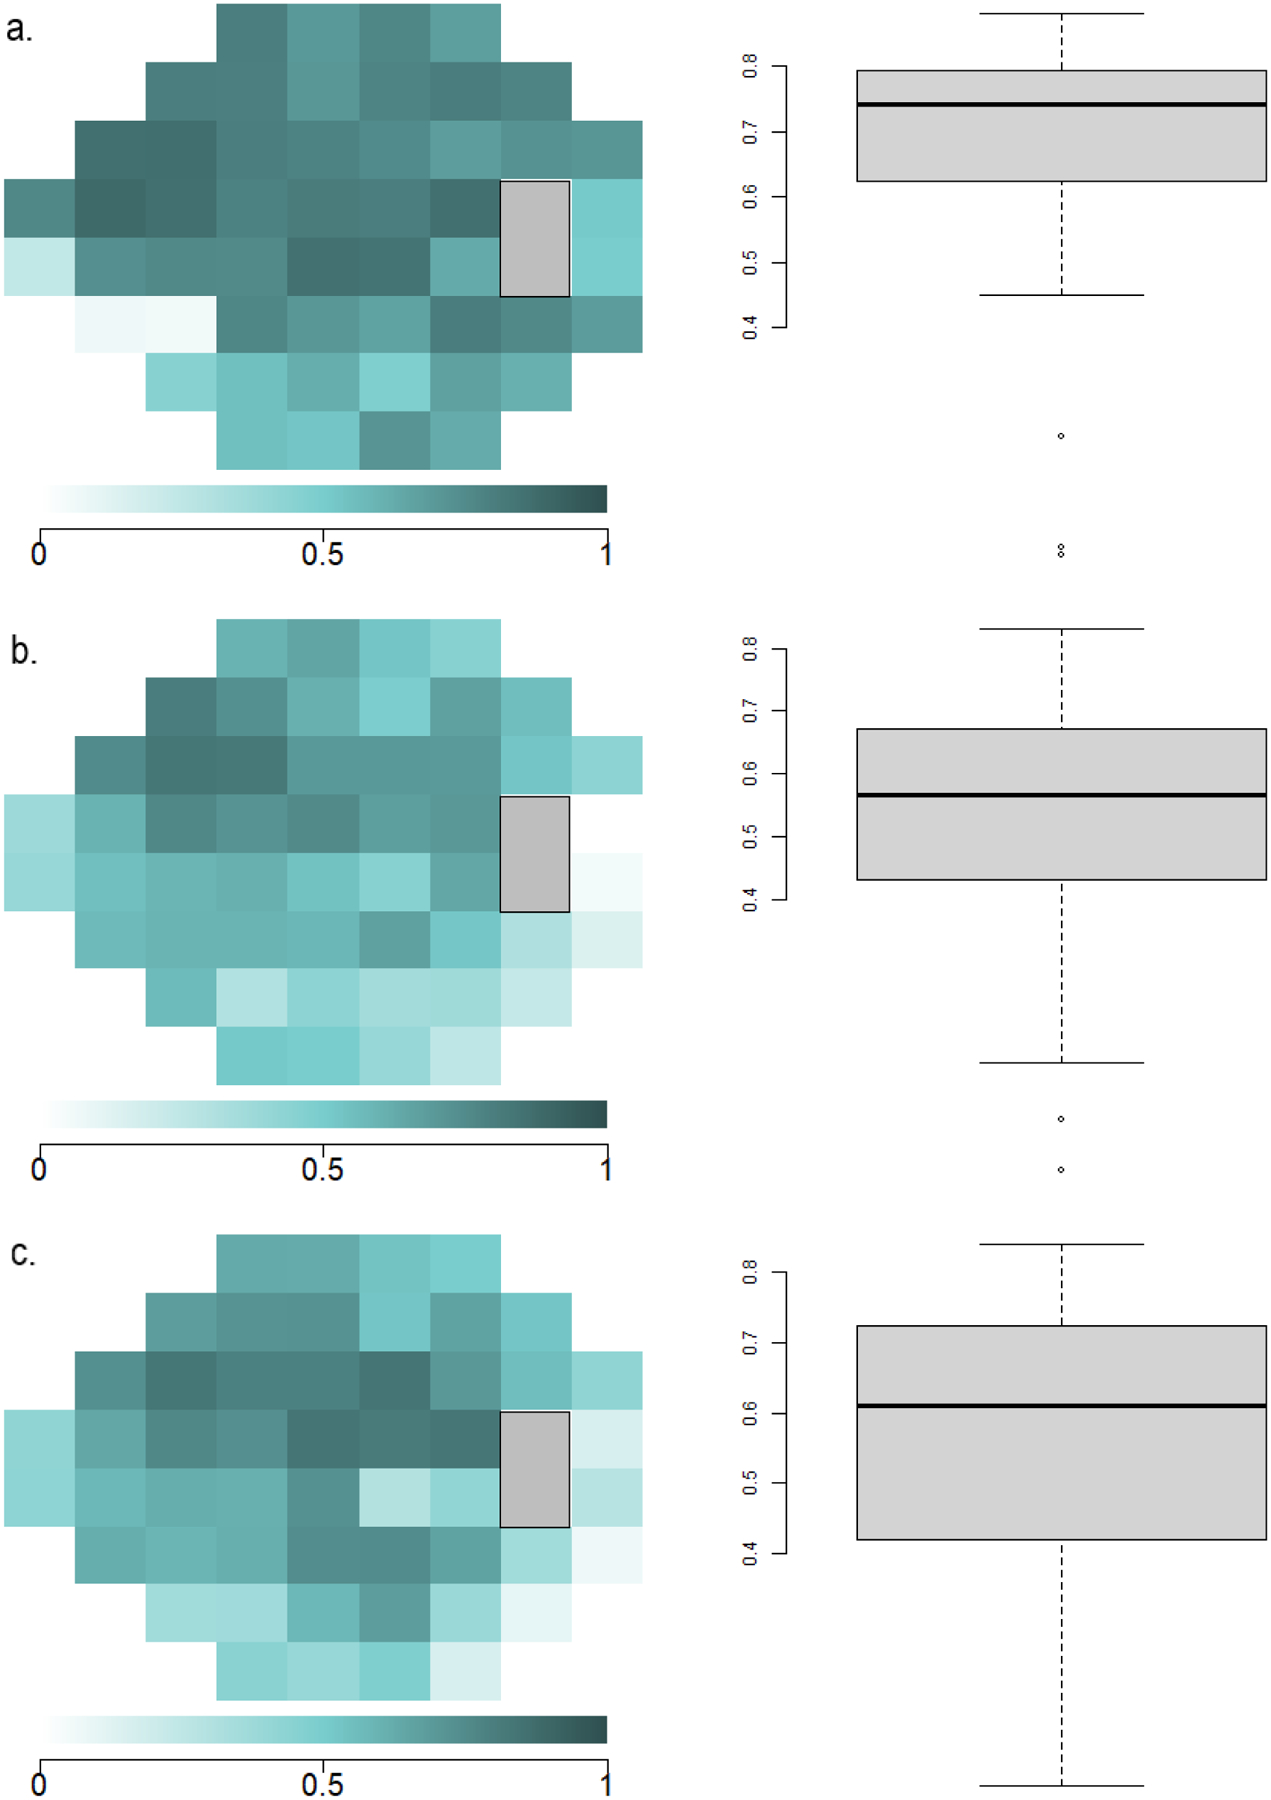
Point-wise correlation of sensitivities at each testing location between the Humphrey Field Analyzer (HFA), tablet, and Smart Visual Function Analyzer (SVFA). Highly correlated visual field locations are demonstrated in darker colors, and less correlated locations are demonstrated in decreasing color saturation. (a) ICC point-by-point plot and boxplot between HFA and SVFA. (b) ICC point-by-point plot and boxplot between HFA and tablet. (c) ICC point-by-point plot and boxplot between SVFA and tablet.
In comparison, the tablet sensitivities significantly differed from those of the HFA at 36 of the 52 locations (p-values of the pointwise differences shown in Supplemental Table 2). The tablet overestimated light sensitivity in the nasal field (reporting greater point sensitivity values in the nasal field versus HFA), while underestimating the temporal field (reporting lower sensitivity values, with large differences up to 6.5 dB in some locations). When comparing the HFA and tablet sensitivities, 19 of the 52 points (36.5%) had ICC values between 0.6 and 0.9. Sensitivities between the SVFA and the tablet also differed at 36 locations, with a similar center-surround effect as seen between HFA and the tablet (p-values of the pointwise differences shown in Supplemental Table 3). Comparing SVFA and the tablet, 42 of the 52 points (80.8%) had ICC values that between 0.6 and 0.9, but overall, they were higher than ICC values between HFA and the tablet.
Two locations demonstrated significant differences in TD and PD values between the HFA and SVFA, though the magnitude was small (Figure 7). The SVFA device generally translated the TD and PD sensitivities to higher values than the HFA. When comparing HFA and SVFA TD values, 45 out of the 52 points (86.5%) had ICC values between 0.6 and 0.9 (Figure 8). For PD values, 43 out of the 52 points (82.7%) had ICC values between 0.6 and 0.9 (Figure 8).
Figure 7:
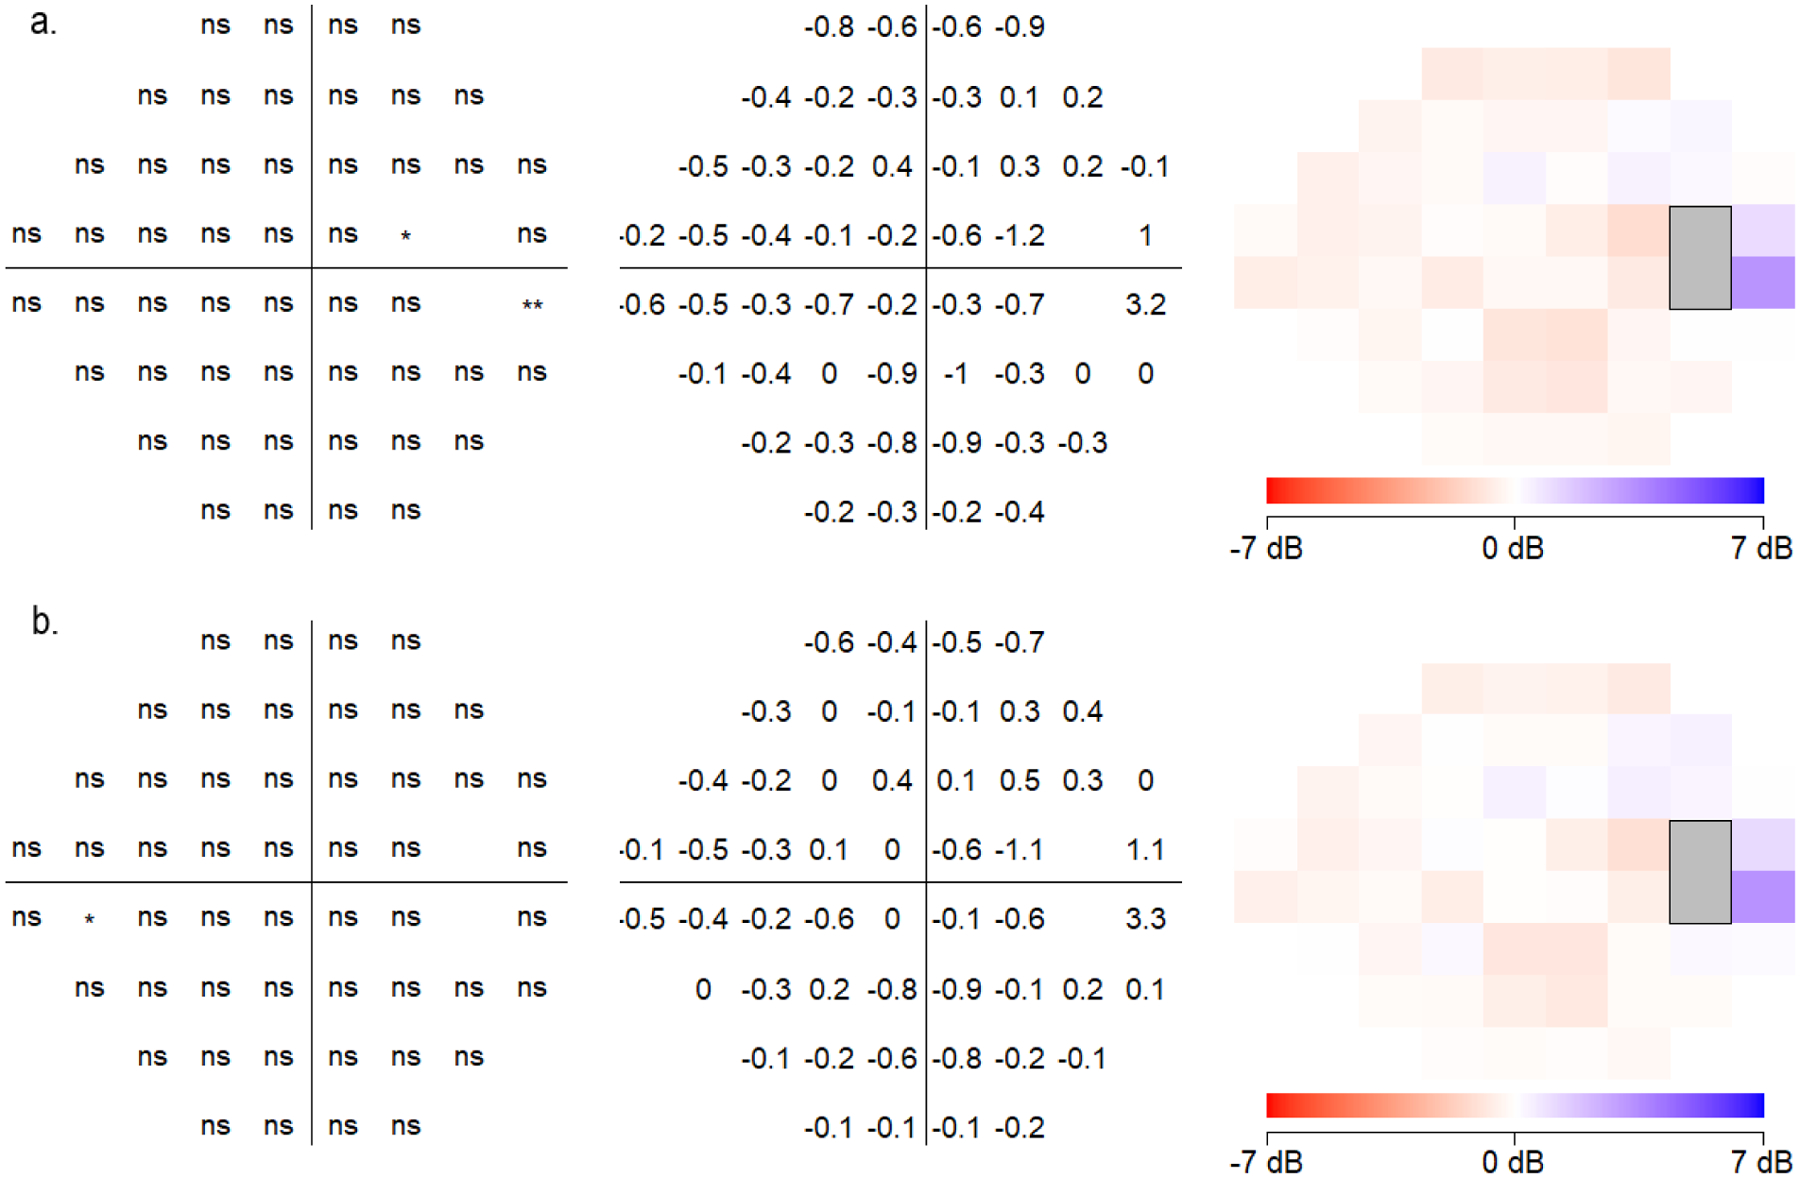
Point by point analysis of (a) total deviation (TD) and (b) pattern deviation (PD) sensitivities at each testing location comparing the Humphrey Field Analyzer (HFA) and Smart Visual Function Analyzer (SVFA). Locations and degrees of significantly different values are shown (all eyes plotted as right eye).
Figure 8.
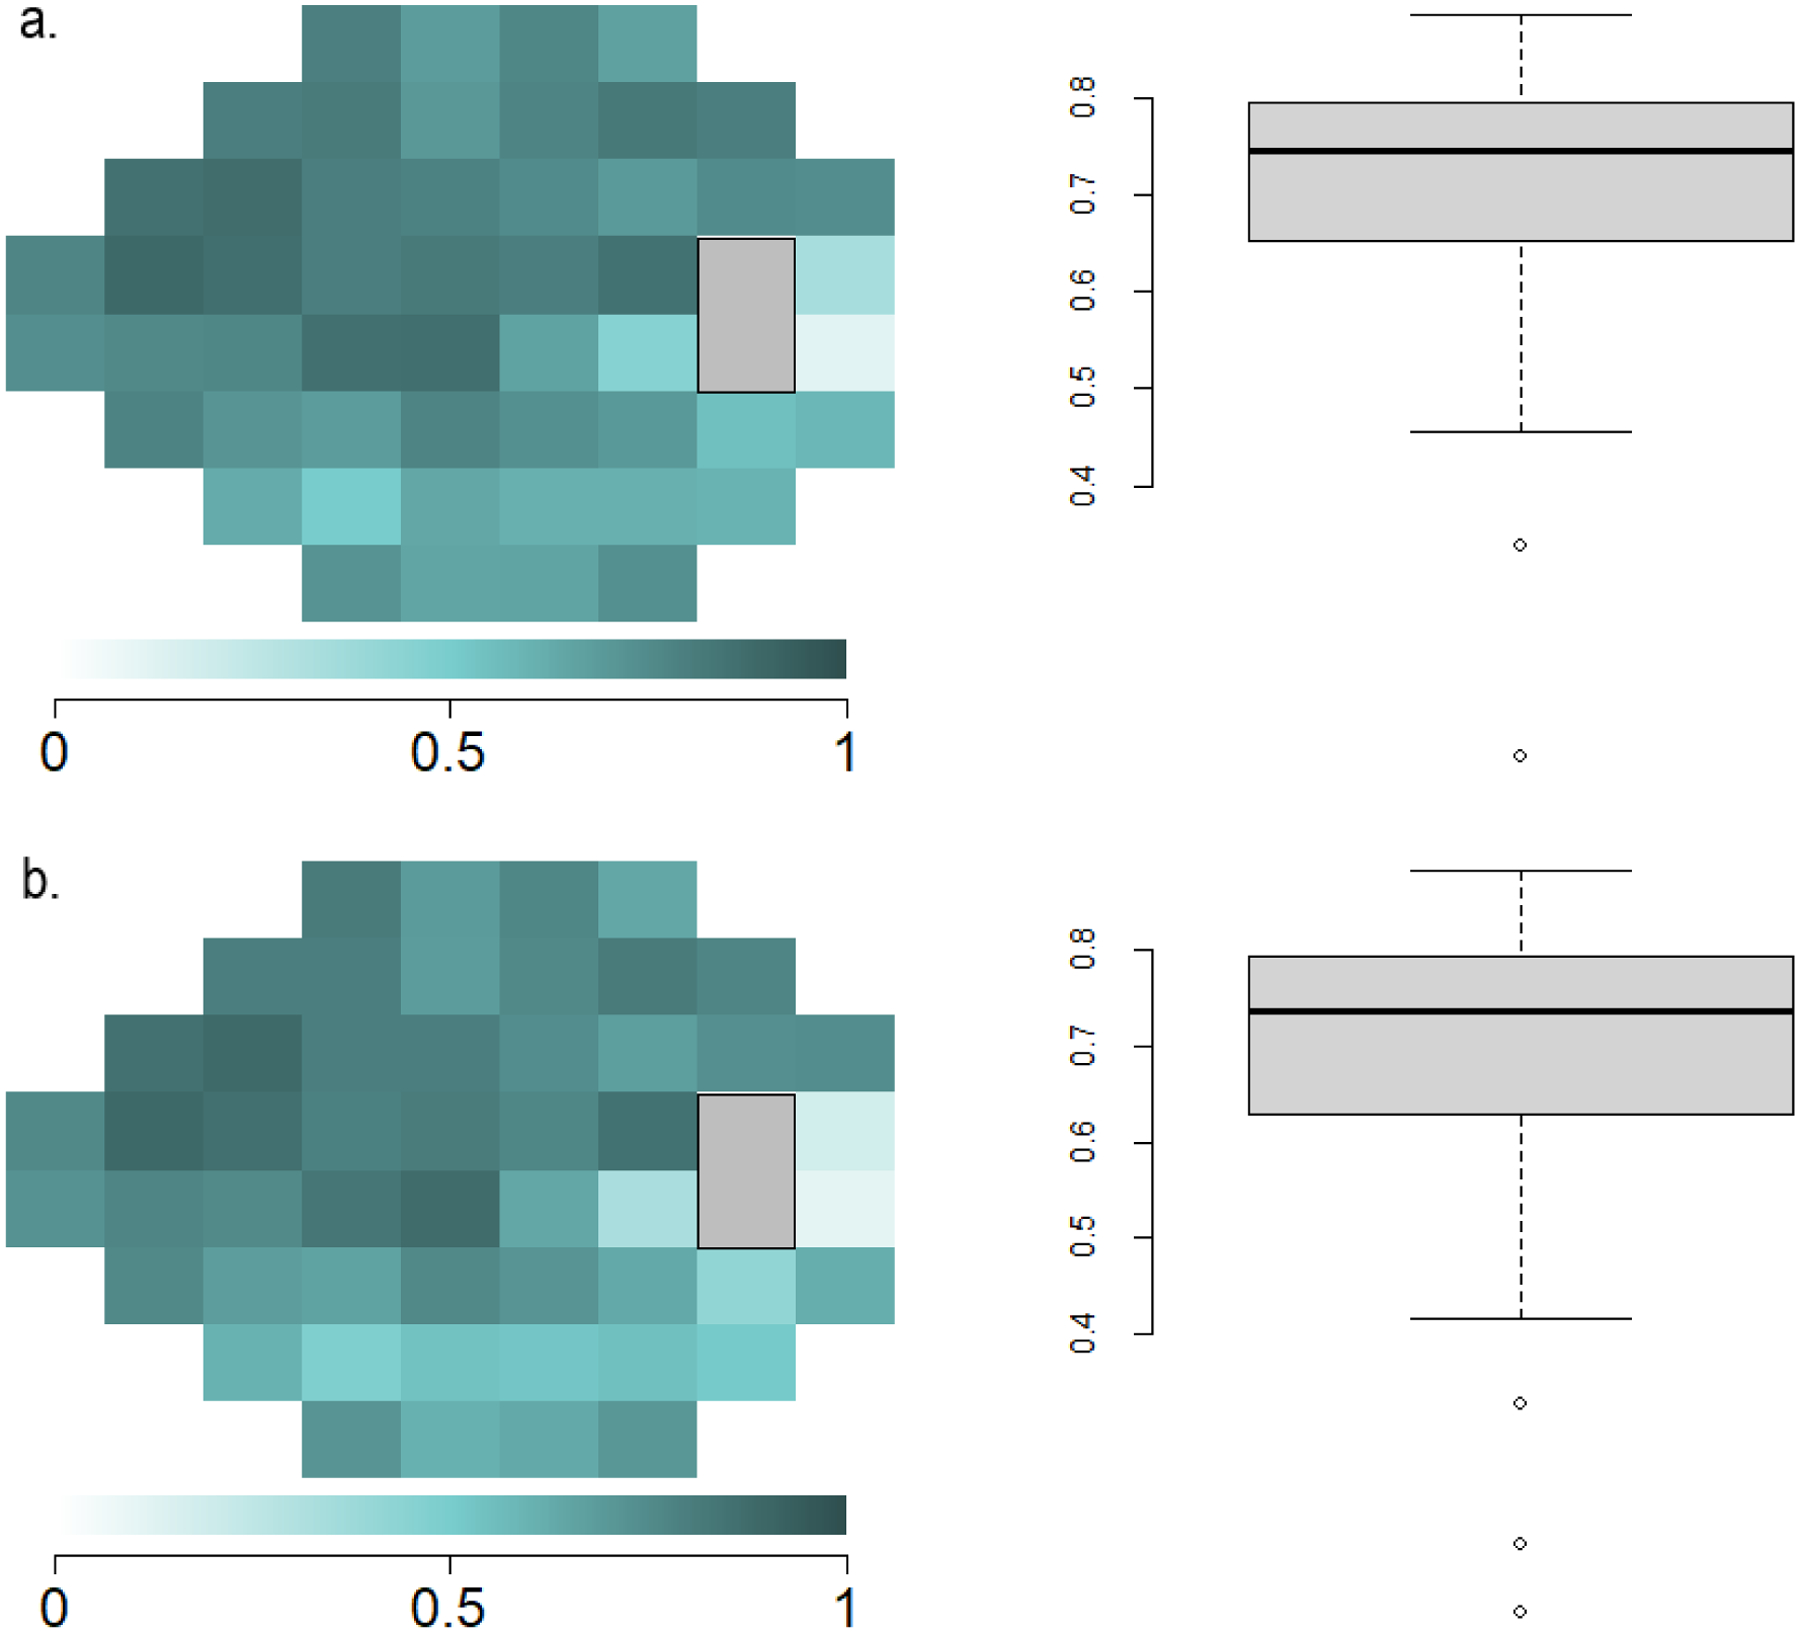
Point-wise correlation of total deviation (TD) and pattern deviation (PD) sensitivities at each testing location between the Humphrey Field Analyzer (HFA) and Smart Visual Function Analyzer (SVFA). Highly correlated visual field locations are demonstrated in darker colors and less correlated locations are demonstrated in decreasing color saturation. (a) ICC point-by-point plot and boxplot of TD between HFA and SVFA. (b) ICC point-by-point plot and boxplot of PD between HFA and SVFA.
Discussion
Measurement of VF progression is key to the diagnosis and management of glaucoma. With the potential to allow for more frequent at-home testing, and thereby the earlier detection of glaucomatous progression, novel portable perimeters may be attractive alternatives to standard automated perimetry that improve clinical practice. In this study, we report strong point-by-point similarity when comparing SVFA VFs to those obtained using the HFA in patients with glaucoma, suspected glaucoma, or OHTN with mild or moderate disease. We found greater deviations from HFA VFs when testing was performed using the tablet-based application in our sample. While overarching measurements using these two portable devices correlate well on average with those of traditional office-based perimetry, both devices differed regarding the measurements of specific point sensitivities. The SVFA registered slightly lower sensitivity values compared to the HFA, primarily in the temporal region, while the tablet reported substantially lower sensitivity values for central and temporal peripheral points and higher values for the other peripheral points. As indicated above, the dynamic range of the MRF tablet procedure is 30 dB, which is smaller than for the HFA and IMO. Therefore, for normal sensitivities above 30 dB, there may be larger differences between the MRF and the HFA for these locations. Overall, one can speculate that in practice, these findings suggest that large VF defects would be detected by these novel devices, whereas smaller defects may be detected differently or missed during VF testing.
The comparison of MD and PSD across the three devices showed no significant differences except for the PSD value between the HFA and tablet, which was approximately 0.64 dB greater for the tablet. One potential explanation is related to how the tablet procedure increases stimulus size with greater eccentricities from fixation, as mentioned above. This has a couple of advantages: the sensitivity, on average, is essentially equivalent for all visual field locations for a normal eye (i.e., the hill of vision becomes a plateau of vision), and the dynamic range of all visual field locations is essentially the same. In considering these advantages, however, it is important to note that spatial summation varies considerably from one individual to another and from one location to another.31 Additionally, Dubois-Poulson and colleagues introduced the term “photometric disharmony”, which indicates that damaged visual field areas should be more easily detected by a decrease in size as compared to a decrease in luminance.32 It is highly possible that these factors can account for the higher PSD for MRF compared to the HFA.
A notable difference between the devices is how they present points of equal luminance. While the HFA presents all points at the same distance from the pupil, this is not the case for the novel devices in our study. The tablet is flat, and the SVFA’s wide-angle lens system presents test takers with a distorted image that uses field curvature corrections to reduce blur. Therefore, a given peripheral test point of equal physical luminescence will be at a different distance and larger angle from the retina when compared to a central point. This variation may contribute to the center-surround pattern we see between the tablet and the standard perimeter, and the inferotemporal concentration of differences observed between the SVFA and HFA, respectively.
Glaucomatous vision loss typically begins peripherally and progresses towards central fixation, which makes reliable measurement of the peripheral VF critical.33 Therefore, these discrepancies are important to keep in mind when considering the adoption of novel perimeters for clinical practice.34,35 Studies have demonstrated localized loss in the inferotemporal area in glaucoma patients, some of whom showed little to no loss in the central VF.34,35
Overall, our results comparing the SVFA with the HFA agree with previously published work.18 Kimura et al. compared the MD outputs of imo 24–2plus (1–2) AIZE with HFA SITA Standard 30-2 for patients with glaucoma or suspected glaucoma and similarly reported strong correlations between these perimetry devices (r = 0.82, P < 0.001). That being said, it is important to note that they used different threshold patterns and their study cohort had more advanced cases of glaucoma than ours, with mean MD −6.1 ± 7.8 dB for HFA and −6.2 ± 7.1 dB for imo.18 In addition, they utilized a previous version of the SVFA (imo) which allowed VF testing to be performed both in head-mounted and fixed testing conditions, while the one we used (IMOvifa) is solely a fixed, tabletop device.
The ICC results we observed comparing the tablet to the other devices are similar to those of previous reports comparing the perimetric outcomes of the same tablet VF application (run on an Apple iPad (Cupertino, CA, USA) tablet) and the HFA.17 Kong et al. reported regional discrepancies, with the peripheral, nasal, and central fields having higher agreement as compared to the temporal area. Similarly, we found a stronger correlation in the peripheral, superior, nasal, and central areas compared to the temporal fields. The authors also reported a strong correlation between MD results from the tablet and HFA (ICC = 0.93), slightly higher than our observed correlation between the two (ICC = 0.88).17 While we likewise found that the tablet returned less negative MDs compared to the HFA, Kong et al. reported a bias of 1.4 dB, as compared with our measured bias of 0.03 dB. Interestingly, they found a lower level of agreement for patients with normal or mild HFA defects (MD > −6 dB, group ICC = 0.77), compared to those with moderate to severe defects, suggesting that correlations may vary depending on the severity of field defects.17
Large differences in VF measurements and low correlations between the two novel perimeters and the HFA were particularly seen at the peripheral locations (points 27 and 36) near the physiologic blind spot. Possible reasons to explain these discrepancies include the individually variable size and shape of patients’ natural blind spot and differences between the design and methodology of the perimeters. Although we excluded points 26 and 35 from our analyses to account for the blind spot, this physiologic scotoma is not perfectly identical between patients,36 and it has previously been reported that fluctuation in light thresholds is increased near the blind spot.37 Besides these anatomical considerations, certain novel testing methods utilized by the portable perimeters likely contributed to the variability seen at these locations. For instance, the SVFA has a special pupil tracking system that automatically corrects the position of presented stimuli to help ensure correct fixation throughout the examination, unlike the other two devices. Additionally, as mentioned earlier, patients must change fixation four times throughout the tablet test and complete the examination from a distance. Depending on the device, it is therefore possible that such fundamental differences either increased or decreased patients’ fixation instability throughout the test and resultingly affected their VF measurements obtained near the blind spot.
Our study is subject to limitations, the main ones being the relatively small sample size (n=79 participants, 133 eyes) and the lack of a control group tested with these devices. Moreover, there is limited available information regarding how the novel devices calculate MD, which makes validity of comparisons to the HFA’s weighted average towards the center of the VF uncertain. The latter may explain the lack of significant difference we saw in MD. Our patient cohort also had less severe cases of glaucoma than that of other studies, with mean MD −2.7 ± 3.9 dB, likely due in part to our inclusion criteria that participants needed to be reliable HFA test takers. Therefore, our results may not be widely applicable to the general glaucoma patient population. Conducting future studies with patients who have more severe glaucoma may show different returns in the observed indices. Lastly, as our study was cross-sectional, future studies looking at the longitudinal test-retest reliability and repeatability of these novel devices are crucial in developing a deeper understanding of their utility.
In terms of device-specific findings, the tablet-based VF test had significantly larger deviations from HFA and SVFA perimetry results, especially towards the more peripheral field. In the periphery, point-wise absolute differences between the tablet and HFA were as high as 6.5 dB, and even central points demonstrated large absolute differences up to 4.5 dB (Figure 5b). This may be related to the flat shape, small screen size, and smaller dynamic range of stimulus intensity of tablets. Although the tablet-based application developers have addressed some of these limitations by adjusting the position of the fixation point and increasing stimulus size according to eccentricity, some testing parameters are less easily controlled outside of the clinic setting, such as the viewing distance and ambient lighting conditions.
While the SVFA also had differences at points across the entire VF in comparison to HFA, these differences were smaller in magnitude compared to the tablet-based VF test. The SVFA generally agreed with the HFA with a small, relatively consistent bias throughout the field (approximately 1 dB) and low point-wise absolute differences, except for a single point near the physiological blind spot with a 5.2 dB difference (Figure 5a). Although stimulus presentation is independently performed for each eye in the SVFA device without the patient’s awareness of which eye is being tested at a particular time,15 it is important to note that this is a new testing environment for glaucoma patients. As Kimura et al. point out in their comparison of imo 24–2plus (1–2) AIZE with HFA SITA Standard 30–2, the impact of binocular open-eye VF testing without occlusion must therefore also be taken into consideration.18
In summary, while global VF indices of MD and PSD did not significantly vary between HFA and the two novel devices (except that the tablet reported higher PSD compared to HFA), specific point sensitivity value differences were significant and at times large. Future studies assessing VF performance should include this kind of analysis to better understand device performance and how portable perimeters may or may not benefit glaucoma management and treatment decision-making. In our study, we found that the tablet VF had larger differences based on stimulus location, indicating that the tablet design itself may be an inherent limitation of this technology. In order to identify progression of VF loss, test-retest reproducibility is likely the most important factor to consider when evaluating these devices. The consistent use within participants may overcome the difficulties for detection and improve the ability to detect progressive changes over time. Longitudinal studies of patients with a range of glaucoma severity are needed to help determine what role these newer perimeters can play in clinical care.
Supplementary Material
Supplemental Figure 1: Visual field plot of the observed 52 point locations, which exclude two blind spot locations corresponding to points 26 and 35. Left eye structures were flipped, and all eyes were plotted as right eye.
Supplemental Figure 2: Point by point analysis using the Wilcoxon signed-rank test to compare sensitivities at each of the 52 locations comparing (a) Humphrey Field Analyzer (HFA) and Smart Visual Function Analyzer (SVFA), (b) HFA and tablet, and (c) SVFA and tablet. Locations and degrees of significantly different values are shown (all eyes plotted as right eye).
Financial support:
This study was supported by Genentech, Inc. (South San Francisco, CA, USA), grant number: 2020A010888. The funding organization had no role in the design or conduct of the research. The study was also supported by the NIH R01 EY030575 and NIH P30 EY003790 grants.
Conflict of Interest:
Tobias Elze receives research support from Genentech Inc.
David S. Friedman receives research support from Genentech Inc and Zeiss Meditech, and serves as a consultant/contractor with Bausch and Lomb, W L Gore and Associates, Life Biosciences, and Thea Pharmaceuticals.
Dolly S. Chang is employed by Genentech Inc.
Julia A. Kim is employed by Genentech Inc.
No other authors have any conflicts of interests to disclose.
Abbreviations:
- VF
Visual Field
- HFA
Humphrey Field Analyzer
- MRF
Melbourne Rapid Fields
- SITA
Swedish Interactive Threshold Algorithm
- MEE
Massachusetts Eye and Ear
- MD
Mean deviation
- PSD
Pattern standard deviation
- SVFA
Smart Visual Function Analyzer
- OHTN
Ocular hypertension
- dB
Decibels
- BCVA
Best-corrected visual acuity
Footnotes
Publisher's Disclaimer: This is a PDF file of an unedited manuscript that has been accepted for publication. As a service to our customers we are providing this early version of the manuscript. The manuscript will undergo copyediting, typesetting, and review of the resulting proof before it is published in its final form. Please note that during the production process errors may be discovered which could affect the content, and all legal disclaimers that apply to the journal pertain.
This article contains additional online-only material. The following should appear online-only: Supplemental Figures 1 and 2, Supplemental Tables 1–3.
Meeting presentation: Preliminary results were presented at the Association for Research in Vision and Ophthalmology Annual Meeting on Monday, May 2nd in Denver, CO.
References
- 1.Tham YC, Li X, Wong TY, Quigley HA, Aung T, Cheng CY. Global prevalence of glaucoma and projections of glaucoma burden through 2040: A systematic review and meta-analysis. Ophthalmology. 2014;121(11). [DOI] [PubMed] [Google Scholar]
- 2.de Moraes CG, Liebmann JM, Levin LA. Detection and measurement of clinically meaningful visual field progression in clinical trials for glaucoma. Prog Retin Eye Res. 2017;56. [DOI] [PMC free article] [PubMed] [Google Scholar]
- 3.Kastner A, King AJ. Advanced glaucoma at diagnosis: current perspectives. Eye (Basingstoke). 2020;34(1). [DOI] [PMC free article] [PubMed] [Google Scholar]
- 4.Hu R, Racette L, Chen KS, Johnson CA. Functional assessment of glaucoma: Uncovering progression. Surv Ophthalmol. 2020;65(6). [DOI] [PMC free article] [PubMed] [Google Scholar]
- 5.Lavanya R, Riyazuddin M, Dasari S, et al. A Comparison of the Visual Field Parameters of SITA Faster and SITA Standard Strategies in Glaucoma. J Glaucoma. 2020;29(9). [DOI] [PubMed] [Google Scholar]
- 6.Nakanishi H, Akagi T, Suda K, et al. Clustering of combined 24–2 and 10–2 visual field grids and their relationship with circumpapillary retinal nerve fiber layer thickness. Invest Ophthalmol Vis Sci. 2016;57(7). [DOI] [PubMed] [Google Scholar]
- 7.Fremont AM, Lee PP, Mangione CM, et al. Patterns of care for open-angle glaucoma in managed care. Archives of Ophthalmology. 2003;121(6). [DOI] [PubMed] [Google Scholar]
- 8.Aboobakar IF, Friedman DS. Home Monitoring for Glaucoma: Current Applications and Future Directions. Semin Ophthalmol. 2021;36(4). [DOI] [PubMed] [Google Scholar]
- 9.Anderson AJ, Bedggood PA, George Kong YX, Martin KR, Vingrys AJ. Can Home Monitoring Allow Earlier Detection of Rapid Visual Field Progression in Glaucoma? Ophthalmology. 2017;124(12). [DOI] [PubMed] [Google Scholar]
- 10.Chauhan BC, Garway-Heath DF, Goñi FJ, et al. Practical recommendations for measuring rates of visual field change in glaucoma. British Journal of Ophthalmology. 2008;92(4). [DOI] [PMC free article] [PubMed] [Google Scholar]
- 11.Jones PR, Campbell P, Callaghan T, et al. Glaucoma Home Monitoring Using a Tablet-Based Visual Field Test (Eyecatcher): An Assessment of Accuracy and Adherence Over 6 Months. Am J Ophthalmol. 2021;223. [DOI] [PMC free article] [PubMed] [Google Scholar]
- 12.Jones PR, Smith ND, Bi W, Crabb DP. Portable perimetry using eye-tracking on a tablet computer—A feasibility assessment. Transl Vis Sci Technol. 2019;8(1). [DOI] [PMC free article] [PubMed] [Google Scholar]
- 13.Prea SM, Kong GYX, Guymer RH, Vingrys AJ. Uptake, Persistence, and Performance of Weekly Home Monitoring of Visual Field in a Large Cohort of Patients With Glaucoma. Am J Ophthalmol. 2021;223. [DOI] [PubMed] [Google Scholar]
- 14.Kumar H, Thulasidas M. Comparison of Perimetric Outcomes from Melbourne Rapid Fields Tablet Perimeter Software and Humphrey Field Analyzer in Glaucoma Patients. J Ophthalmol. 2020;2020. [DOI] [PMC free article] [PubMed] [Google Scholar]
- 15.Goukon H, Hirasawa K, Kasahara M, Matsumura K, Shoji N. Comparison of Humphrey Field Analyzer and imo visual field test results in patients with glaucoma and pseudo-fixation loss. PLoS One. 2019;14(11). [DOI] [PMC free article] [PubMed] [Google Scholar]
- 16.Matsumoto C, Yamao S, Nomoto H, et al. Visual field testing with head-mounted perimeter “imo.” PLoS One. 2016;11(8). [DOI] [PMC free article] [PubMed] [Google Scholar]
- 17.Kong YXG, He M, Crowston JG, Vingrys AJ. A comparison of perimetric results from a tablet perimeter and humphrey field analyzer in glaucoma patients. Transl Vis Sci Technol. 2016;5(6). [DOI] [PMC free article] [PubMed] [Google Scholar]
- 18.Kimura T, Matsumoto C, Nomoto H. Comparison of head-mounted perimeter (IMO®) and humphrey field analyzer. Clinical Ophthalmology. 2019;13. [DOI] [PMC free article] [PubMed] [Google Scholar]
- 19.Vingrys AJ, Healey JK, Liew S, et al. Validation of a tablet as a tangent perimeter. Transl Vis Sci Technol. 2016;5(4). [DOI] [PMC free article] [PubMed] [Google Scholar]
- 20.Prea SM, Kong YXG, Mehta A, et al. Six-month Longitudinal Comparison of a Portable Tablet Perimeter With the Humphrey Field Analyzer. Am J Ophthalmol. 2018;190. [DOI] [PubMed] [Google Scholar]
- 21.Harris PA, Johnson CA, Chen Y, et al. Evaluation of the Melbourne Rapid Fields Test Procedure. Optometry and Vision Science. 2022;99(4). [DOI] [PubMed] [Google Scholar]
- 22.Brooke P, Bullock R. Validation of a 6 item cognitive impairment test with a view to primary care usage. Int J Geriatr Psychiatry. 1999;14(11). [PubMed] [Google Scholar]
- 23.Turpin A, McKendrick AM, Johnson CA, Vingrys AJ. Performance of efficient test procedures for frequency-doubling technology perimetry in normal and glaucomatous eyes. Invest Ophthalmol Vis Sci. 2002;43(3). [PubMed] [Google Scholar]
- 24.Turpin A, McKendrick AM, Johnson CA, Vingrys AJ. Development of efficient threshold strategies for frequency doubling technology perimetry using computer simulation. Invest Ophthalmol Vis Sci. 2002;43(2). [PubMed] [Google Scholar]
- 25.Imovifa User’s Manual. Published online August 11, 2021.
- 26.Turpin A, McKendrick AM, Johnson CA, Vingrys AJ. Properties of Perimetric Threshold Estimates from Full Threshold, ZEST, and SITA-like Strategies, as Determined by Computer Simulation. Invest Ophthalmol Vis Sci. 2003;44(11). [DOI] [PubMed] [Google Scholar]
- 27.de Arrigunaga S, Kang J, Zhao Y, et al. Learning curve on tablet-based visual field tests during one week of daily testing. Invest Ophthalmol Vis Sci. 2022;63(7):3102. [Google Scholar]
- 28.Benjamini Y, Hochberg Y. Controlling the False Discovery Rate: A Practical and Powerful Approach to Multiple Testing. Journal of the Royal Statistical Society: Series B (Methodological). 1995;57(1). [Google Scholar]
- 29.Artes PH, Nicolela MT, LeBlanc RP, Chauhan BC. Visual field progression in glaucoma: Total versus pattern deviation analyses. Invest Ophthalmol Vis Sci. 2005;46(12). [DOI] [PubMed] [Google Scholar]
- 30.Choi EY, Li D, Fan Y, et al. Predicting Global Test–Retest Variability of Visual Fields in Glaucoma. Ophthalmol Glaucoma. 2021;4(4). [DOI] [PMC free article] [PubMed] [Google Scholar]
- 31.Sloan LL. Area and luminance of test object as variables in examination of the visual field by projection perimetry. Vision Res. 1961;1(1–2). [Google Scholar]
- 32.Sloan LL, Brown DJ. Area and luminance of test object as variables in projection perimetry. Clinical studies of photometric dysharmony. Vision Res. 1962;2(12). [Google Scholar]
- 33.Dietze J, Blair K, Havens SJ, Adams M. Glaucoma. StatPearls. Published online 2021. [Google Scholar]
- 34.Mönter VM, Crabb DP, Artes PH. Reclaiming the periphery: Automated kinetic perimetry for measuring peripheral visual fields in patients with glaucoma. Invest Ophthalmol Vis Sci. 2017;58(2). [DOI] [PubMed] [Google Scholar]
- 35.Seamone C, LeBlanc R, Rubillowicz M, Mann C, Orr A. The value of indices in the central and peripheral visual fields for the detection of glaucoma. Am J Ophthalmol. 1988;106(2). [DOI] [PubMed] [Google Scholar]
- 36.Wang M, Shen LQ, Boland M v., et al. Impact of Natural Blind Spot Location on Perimetry. Sci Rep. 2017;7(1). [DOI] [PMC free article] [PubMed] [Google Scholar]
- 37.Gardiner SK. Differences in the relation between perimetric sensitivity and variability between locations across the visual field. Invest Ophthalmol Vis Sci. 2018;59(8). [DOI] [PMC free article] [PubMed] [Google Scholar]
Associated Data
This section collects any data citations, data availability statements, or supplementary materials included in this article.
Supplementary Materials
Supplemental Figure 1: Visual field plot of the observed 52 point locations, which exclude two blind spot locations corresponding to points 26 and 35. Left eye structures were flipped, and all eyes were plotted as right eye.
Supplemental Figure 2: Point by point analysis using the Wilcoxon signed-rank test to compare sensitivities at each of the 52 locations comparing (a) Humphrey Field Analyzer (HFA) and Smart Visual Function Analyzer (SVFA), (b) HFA and tablet, and (c) SVFA and tablet. Locations and degrees of significantly different values are shown (all eyes plotted as right eye).


