

Abstract
Consensus of regulatory decisions on the same Marketing Authorization Application (MAA) are critical for stakeholders. In this context, regulatory decision patterns from the Swissmedic (SMC), the US Food and Drug Administration (FDA), and the European Medicines Agency (EMA) were analyzed for hemato‐oncology products (OP) and non‐oncology products (NOP). We compared 336 SMC regulatory decisions between 2009 and 2018 on new active substances with the EMA and the FDA for OP (n = 77) and NOP (n = 259) regarding approval rates, consensus, and divergent decisions. For OP MAA, we analyzed the underlying reasons for divergent decisions; for consensus decisions, the similarity and strictness of labeling. For OP, the approval rate for the SMC was 88.4%, the EMA 91.3%, and the FDA 95.7%. For NOP, the SMC had an approval rate of 86.2%, the EMA of 93.8%, and the FDA of 88.8%. The consensus decision rate among agencies was 88.4% for OP and 84.4% for NOP. The main clinical driver for divergent decisions for OP was nonrandomized trial design and low patient numbers. Comparing the approved indication wordings, the highest similarity was between the SMC and the EMA, and lowest for the FDA and the EMA. Investigating label strictness, the FDA numerically had the highest but not‐statistically significant number of strict labels. The approval rate stratified by disease area (OP and NOP) differed among the SMC, the EMA, and the FDA. High concordance in regulatory decisions was observed between agencies for OP as well as NOP. Reasons for divergent decisions regarding OP were mainly due to scientific uncertainties. Comparing strictness of indications, numerical but no statistically significant differences were observed between agencies.
Study Highlights.
WHAT IS THE CURRENT KNOWLEDGE ON THE TOPIC?
There is currently no solid knowledge regarding differences of approval and rejection rates as well as the reason for divergent decisions for oncology products versus non‐oncology products across major regulating agencies.
WHAT QUESTION DID THIS STUDY ADDRESS?
The study addresses the question if there are statistical differences in the approval patterns among three major health authority agencies over a recent 10‐year time frame stratified by disease area and the underlying scientific root cause for divergent decisions in oncology between agencies.
WHAT DOES THIS STUDY ADD TO OUR KNOWLEDGE?
The study confirms the adequate decision making of regulatory agencies which are highly consistent. Divergent decisions in the oncology disease area are investigated and scientifically explained. This counteracts criticism expressed by payers and healthcare providers that regulatory agencies come frequently to divergent decisions based on the same clinical data submitted.
HOW MIGHT THIS CHANGE CLINICAL PHARMACOLOGY OR TRANSLATIONAL SCIENCE?
The data indicate that scientific uncertainties due to non‐controlled trial design and inadequate patient numbers are the main driver for divergent decisions. Applicants must perform adequate clinical studies in terms of patient numbers and comparators in order to avoid or reduce the uncertainties leading to divergent decisions of regulating agencies.
INTRODUCTION
Drug Regulatory Agencies (DRAs) and their decisions are under particular scrutiny by many stakeholders. The pharmaceutical industry that has done significant investments expects an expedited review of the submitted dossier anticipating a swift regulatory approval and market entry. Patient advocacy groups and healthcare providers hope for novel treatments to increase the arsenal of drugs against life‐threatening diseases. Payers rely on health technology assessments that consider the drug evidence regarding clinical effectiveness, safety, and cost‐effectiveness once a drug has been approved. In this context, divergent decisions between health authorities remain a matter of debate. Regulatory agencies continuously work on existing and new regulatory standards and guidelines of the International Council for Harmonization of Technical Requirements for Pharmaceuticals for human use (https://www.ich.org/). Further, in recent years, numerous scientific and regulatory expert clusters have been established among the US Food and Drug Administration (FDA), the European Medicines Agency (EMA), and other DRAs with the aim to discuss and where possible harmonize their approaches to significant scientific and regulatory issues. 1 These expert clusters meet on a regular basis and comprise a broad variety of areas in drug development. Of particular relevance is the increased focus on specific disease area clusters, such as hemato‐oncology, cardiovascular, central nervous system related, or infectious diseases.
When historically looking at different decision patterns between DRAs no in‐depth distinction has so far been made with regard to different disease areas, 2 , 3 , 4 , 5 , 6 , 7 in particular, no comparison has been made between the anti‐cancer spectrum (hematological neoplasms as well as solid tumors) considered as oncology products (OPs) and all other disease areas (non‐oncology products [NOPs]). The latter is of relevance as OPs comprised nearly half of all approved new active substances (NAS) between 2016 and 2020. 8 OPs might follow a distinct and different approval pattern among DRAs compared to NOPs based on disease centered expert groups, different approval pathways, and different approval times, as well as potentially different decisions among agencies. OPs are frequently approved within an expedited (Swissmedic [SMC]: “fast track,” EMA: “accelerated assessment,” and FDA: “priority review”) regulatory pathway. With a proportion of 88%, an expedited approval path (priority review) was highest for OPs in the United States, and the median FDA approval time was only 226 days, which was lower as compared to all other disease areas with approval times between 243 and 360 days. 8 To enable an earlier market access of oncology drugs, decisions are frequently based on surrogate end points, and there has been criticism toward decisions based on expedited or time‐limited authorization (SMC: temporary approval, EMA: conditional approval, and FDA: accelerated approval) pathways particularly in oncology with requests to raise the bar for approval. 9 , 10 , 11 Surrogate end points in oncology might be interpreted and accepted differently at different DRAs, in particular, for time‐limited authorization pathways, if available. 12
In this report, we compared the decision patterns for NAS among the SMC, the EMA, and the FDA over a decade with a disease area specific focus comparing OPs and NOPs, including approvals and rejections. In particular, we focused on divergent decisions on OPs, underlying clinical reasons as well as label differences between DRAs.
METHODS
Analysis of regulatory decisions at DRAs
We compared the regulatory decisions on marketing authorization applications (MAAs) evaluated by the SMC with those evaluated by the FDA and the EMA (centralized procedure) as well as other EMA national DRAs (decentralized and national decisions). To this end, we conducted an analysis of 336 new active substance applications, including biologics that received a final decision by SMC between January 1, 2009, and December 31, 2018. This date was chosen based on the coming into effect on January 1, 2019, of a new Swiss ordinance on the Federal Act on Medicinal Products and Medical Devices introducing the possibility of temporary marketing authorizations. We excluded medicinal products for veterinary use, blood products, radiopharmaceuticals, vaccines, and complementary medicines from this study.
The SMC data were obtained from the SMC's internal database which is not in the public domain. For some medicinal products, multiple MAAs had been filed over the examined period. In order to avoid multiple counting of the same application (e.g., multiple negative decisions, followed by a final positive decision) only the last official SMC decisions were considered for analysis.
The EMA data were retrieved from the EMA Website, 13 entries past December, 31, 2018, were not considered. SMC applications were matched with EMA Centralized Procedure applications using the medicine name, the active pharmaceutical ingredient, and the company name. Of note, all OPs followed the centralized procedure based on Regulation (EC No726/2004). If SMC applications could not be matched to an EMA application, the Heads of Medicines Agencies website 14 was searched for products authorized through the decentralized and mutual recognition procedure and the EMA Community Register 15 was searched for nationally authorized medicinal products.
The FDA data were retrieved from the Drugs@FDA website 16 and the website of the “Center for Biologics Evaluation and Research.” 17
The FDA does not publish assessment reports in case of a negative outcome and it remains unknown to the public or regulators if a particular MAA has been submitted. Unless the sponsor withdraws the application, it remains in the application process. 18 For this reason, we were in some cases unable to determine if an MAA was “rejected” (complete response letter) by the FDA or whether it had never been filed. The SMC disposes of additional information regarding the FDA application status, as applicants are required to indicate their product's marketing authorization status/review status at foreign regulatory authorities when filing MAAs. For the purpose of this study, MAAs were considered to be rejected by the FDA if the medicinal product in question had not been approved by the FDA within 3 years after original filing of the dossier. Further, in the rare case a dossier was filed at the FDA after an SMC decision had already been issued, this MAA would not have been included in the data collection. This assumption is numerically supported by a recent study demonstrating that the median time between submission of an MAA to the FDA and the final decision is ~245 days 8 and the review of 90% of the MAAs is completed in less than 350 days (SMC internal Benchmarking study with the FDA data provided by applicants).
DRA decisions were classified as “positive” in case of approval of the MAA or as “negative” in case of rejection of the MAA or applicant withdrawal. At the EMA, final decisions were issued by the European Commission in case of centralized procedures, by the reference member state in case of decentralized procedures/mutual recognition procedures, or by a national drug regulatory authority in case of national procedures.
Analysis of divergent decisions for OPs
Public assessment reports from the EMA and the FDA were compared to the internal SMC assessment reports. The assessment reports were analyzed for the reasons of rejection or the reasons for approval across the three DRAs. In particular, disease setting, number of previous lines of treatment, number of patients of the pivotal study, study design including the statistical setup, and the safety and efficacy conclusions of the agencies were compared.
Label comparison
Similarity of label
In order to evaluate the similarity of authorized indications, we performed pairwise comparisons of the indication wordings as published in the Swiss information for healthcare professionals (“Fachinformation”), the EMA summary of product characteristics, and the US product information. This analysis was only performed for drugs authorized by all three DRAs.
Various aspects of the indication were analyzed as described below and differences categorized as similar, minor, or major. If the indication wording was identical between two agencies or only semantic differences were observed, labels were considered similar. If patient populations included in the indication differed between two agencies but were considered to result in a low numerical difference of concerned patients (e.g., BRAF mutation V600 vs. V600E, or metastatic vs. locally advanced), this was considered a minor difference. Differences were regarded as major if large patient populations were in or excluded for the approved labels, such as PDL1 independent approval in an indication versus a restriction to only patients with a defined PDL1 expression level.
The following aspects of the indication wordings were analyzed in particular:
restriction of the patient population based on molecular markers (e.g., PD‐L1 positive population),
restrictions by age (adult vs. all patients),
specific number or type of previous lines of treatment,
restriction to a specific combination (e.g., type of chemotherapy),
restriction to metastatic versus both metastatic and locally advanced patients,
restriction of the patient population based on the phase of the disease (e.g., acute vs. chronic).
Strictness of label
The strictness of labeling was evaluated comparing the indication wording of all three DRAs for each consensually approved OP. The same aspects described under label similarity above were evaluated and strictness with regard to the approved patient population was scored as one of three categories: wide, moderate, or strict. The comparison for strictness was performed across the three DRAs from the widest indication to the strictest. If two DRAs had similar labels, they were classified in the same label strictness category. In case of differences among the three DRAs, a ranking was performed from the widest to the strictest indication label. This ranking was based on the estimated number included by the specific aspects enumerated in the label, as illustrated above. The indication including the largest number of patients was considered wide, the label including the smallest number of patients was considered strict, and the intermediate label was considered moderate.
For all labeling, text analyses evaluating label similarity and strictness at least two independent rounds of assessments were performed, each round by a clinically experienced assessor. In case of divergent evaluations, the final decision was established through a review board.
Statistical analyses
To investigate the concordance of the approvals among the three DRAs, Kendall's coefficient of concordance W was used. Its corresponding 95% confidence interval (CI) was based on the 0.025 and 0.975 quantile of the estimated coefficient from 9999 bootstrapped samples with replacement. Within each DRA, Fisher's exact test was used to determine the association between approval status and disease area (OP vs. NOP) along with the corresponding odds ratio and its 95% CI.
To compare approval rates between two DRAs, the estimated approval rate difference with its 95% CI considering matched pair cases was provided. The corresponding p value was based on McNemar test. To investigate whether the relation between approval status and disease areas differs among DRAs, analysis of variance based on conditional logistic regression was used to test the interaction term between disease area and DRA. In order to compare the strictness of labeling between two DRAs within approved applications, exact Wilcoxon‐signed rank test in a permutation test framework was used. The ranking considered wide = 1, moderate = 2, and strict = 3. Significant test was performed at 5% level and nominal p value was presented. Correction of multiple testing was only applied when it was mentioned. All analyses were performed using R version 4.0.2.
RESULTS
Approval rates for OPs and NOPs
We compared the approval rates among the SMC, the EMA, and the FDA for NAS MAAs ranging from 2009 to 2018 submitted to all three DRAs.
In total, 336 NAS MAAs were assessed by all three DRAs. Of these 336 products, 23% (77/336) belonged to OPs, whereas 77% belonged to products of all other disease areas (NOPs, n = 259/336). Confirmed regulatory decisions were available in all three jurisdictions for 293 of the 336 NAS MAAs: 69 OPs and 224 NOPs. The regulatory decision was unknown for eight OPs and 35 NOPs (Figure 1).
FIGURE 1.

Overview of applications for OPs and NOPs; “+” indicates positive decision; “−” indicates negative decision by respective regulatory agency. EMA, European Medicines Agency; FDA, US Food and Drug Administration; NOP, non‐oncology products; OP, Oncology Products; SMC, Swissmedic.
Within agency comparison: OPs versus NOPs
Comparing OP and NOP approval rates within the same DRA, the largest difference between OPs and NOPs was observed for the FDA with +6.9%, whereas differences for SMC and EMA were small and similar with +2.2% and −2.5%, respectively (Table 1). The odds ratios of approval (OPs vs. NOPs) in SMC, EMA and FDA were 1.22 (95% CI = [0.52, 3.25], p = 0.8394), 0.70 (95% CI = [0.24, 2.32], p = 0.5843) and 2.75 (95% CI = [0.80, 14.72], p = 0.1050), respectively. In none of the DRAs the association between disease area and approval rate is significant.
TABLE 1.
Overview on approval rates in the SMC, the EMA, and the FDA and their pairwise approval rate separated by OP and NOP.
| OP (N = 69) | NOP (N = 224) | |||||
|---|---|---|---|---|---|---|
| SMC approval | EMA approval | FDA approval | SMC approval | EMA approval | FDA approval | |
| SMC approval | 61 a (88.4%) | 59 b (85.5%) | 61 (88.4%) | 193 (86.2%) | 193 (86.2%) | 181 (80.8%) |
| EMA approval | 63 (91.3%) | 62 (89.9%) | 210 (93.8%) | 193 (86.2%) | ||
| FDA approval | 66 (95.7%) | 199 (88.8%) | ||||
Note: All percentages based on the corresponding N for OP and NOP.
Reading example: Number of applications approved by SMC is 61 out of 69.
Reading example: Number of applications approved by both SMC and EMA is 59 out of 69.
Abbreviations: EMA, European Medicines Agency; FDA, US Food and Drug Administration; NOP, non‐oncology products; OP, Oncology Products; SMC, Swissmedic.
Across agency comparison: OPs and NOPs
Approval rates across DRAs were compared in a pairwise fashion for OPs and NOPs.
For OPs (n = 69), the approval rate for SMC was numerically lowest with 88.4%, followed by the EMA with 91.3% and highest at the FDA with 95.7%. The differences of approval rates between the FDA and the SMC, the EMA and the SMC, and the FDA and the EMA are 7.3% (95% CI = [1.1%, 13.4%], p = 0.0253), 2.9% (95% CI = [−4.0%, 9.8%], p = 0.4142), and 4.4% (95% CI = [−1.9%, 10.6%], p = 0.1797), respectively. After Bonferroni correction for multiple comparisons, none of the pairwise comparisons between the DRAs is significant (Figure 2a).
FIGURE 2.
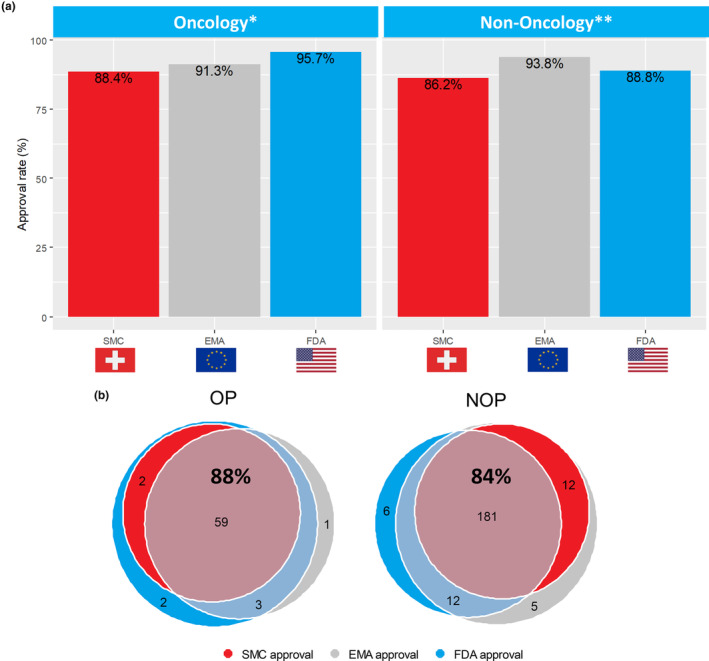
(a) Distinct approval pattern for OPs versus NOPs. *No significance for oncology approvals between agencies. ** Significance between SMC and EMA for NOPs. (b) Venn diagram on overlaps between concordant and divergent decisions at the SMC, the EMA, and the FDA separated for OPs and NOPs. Consensus decision in agencies indicated by percentage in bold (including negative decisions not shown in Venn diagram). DRA, Drug Regulatory Agencies; EMA, European Medicines Agency; FDA, US Food and Drug Administration; NOP, non‐oncology products; OP, Oncology Products; SMC, Swissmedic.
Within NOPs (n = 224), SMC had the lowest approval rate (86.2%), whereas the EMA had the highest approval rate (93.8%) and the FDA approval rate was 88.8% (Table 1). The differences of approval rates between the FDA and the SMC, the EMA and the SMC, and the FDA and the EMA are 2.7% (95% CI = [−2.1%, 7.5%], p = 0.2733), 7.6% (95% CI = [4.1%, 11.1%], p = 0.00004) and −4.9% (95% CI = [−9.1%, −0.8%], p = 0.0218), respectively. Using Bonferroni correction for multiple comparisons, the difference in approval rates for NOPs between the SMC and the EMA remains significant.
The association between approval rate and disease area (OPs vs. NOPs) differs among the three DRAs (p = 0.0470). The approval rates from highest to lowest were FDA‐EMA‐SMC for OPs but EMA‐FDA‐SMC for NOPs (Figure 2a).
Concordance of consensus decisions for OPs and NOPs
We defined consensus decisions as commonly known positive or known negative decisions in all three DRAs.
For OPs (n = 69), the consensus decision rate among all three DRAs was 88.4% (61/69). Out of the 61 consensus decisions, 59 were consensus positive decisions and two were consensus negative decisions. In total, for eight of 69 OP MAAs there was no consensus decision among the SMC, the EMA, and the FDA (11.6%; Figure 2b). The concordance coefficient among the three DRAs (Kendall's W) was 0.67 (95% CI = [0.43, 0.84], p < 0.0001) indicating substantial agreement. 19
For NOPs, the consensus decision rate was 84.4% among the three DRAs (189/224). Out of the 189 NOPs with consensus decision, 181 were consensus positive decisions and eight were consensus negative decisions in the three jurisdictions. The concordance coefficient for NOPs across the three DRAs was 0.64 indicating a substantial agreement 19 among agencies (95% CI = [0.53, 0.73], p < 0.0001).
In total, for 35 of 224 NOP MAAs there was no consensus decision (15.6%) among the SMC, the EMA, and the FDA. Regarding these 35 diverging decisions, approval rates were lowest for the SMC with 34.3% (12/35 products), highest for the EMA with 82.9% (29/35 products), and 51.4% (18/35 products) for the FDA, respectively (Figure 2b).
Divergent regulatory decisions for OPs among the SMC, the EMA, and the FDA
Divergent regulatory decisions for OPs were noted for eight of 69 (11.6%) MAAs. Of these products, the SMC approved two of eight (25.0%), the EMA approved four of eight (50.0%), and the FDA approved seven of eight (87.5%).
As the clinical data submitted to all three agencies were comparable as defined by the same pivotal studies, the diverging decisions were based on different interpretation of the results with regard to study design, dose finding, and assessment of the clinical data. We performed an analysis of the public assessment reports for the main reason(s) for rejection of the respective agency/agencies leading to the divergent decisions.
Of the eight MAAs, four were requested for hematological indications and four for solid tumor indications (Table 2). Two out of eight applications were for first‐line treatment, one of which was for first‐ and second‐line treatment. Of the remaining six MAAs, five were second‐line indications and one was requested for third‐line. For five of eight applications, only uncontrolled phase II clinical trial data were submitted with low patient numbers ranging from 74 to 310 enrolled patients. The resulting uncertainty regarding efficacy was the main reason for rejection by at least one of the respective agencies. For the other three OP MAAs with divergent decisions, randomized controlled data were submitted. However, in one out of these three applications, the patient number was low with 70 patients each in the control and experimental arms and the trial was closed due to slow recruitment. In addition to the trial design and conduct for this application, the toxicity was a significant concern for the rejecting agencies.
TABLE 2.
Overview of MAAs with divergent regulatory decisions among agencies for OPs.
| Cases | Tumor indication | Line of treatment | Drug class | Trial design | Patient number | SMC approval | EMA approval | FDA approval | Main uncertainties | Relevant differences |
|---|---|---|---|---|---|---|---|---|---|---|
| #1 | Non‐small cell lung cancer, metastatic | Second line | Tyrosine kinase inhibitor | Phase II, uncontrolled, 2 dose comparison | Arm A: N = 112, Arm B: N = 110 | No | Yes | Yes | Efficacy, Dose Finding | Dose finding, RR as endpoint with immature PFS/OS; Weighing of safety |
| #2 | T cell lymphoma, peripheral | Second line | Dihydrofolate reductase inhibitor | Phase II, uncontrolled | N = 111 | Yes | No | Yes | Efficacy | RR as end point and correlation to PFS/OS |
| #3 | T cell lymphoma, peripheral | Second line | Histone deacetylase inhibitor | Phase II, uncontrolled | N = 131 | No | No | Yes | Efficacy; Safety; Dose Finding | Treatment interruption/discontinuation, RR as end point, immature PFS and OS |
| #4 | Breast cancer, metastatic | Second line | Microtubule‐inhibiting drug | Phase III, randomized controlled | Exp. n = 375; control n = 377 | Yes | No | Yes | Efficacy | Minor clinical but statistically significant PFS benefit, no stat. OS benefit |
| #5 | Non‐Hodgkin's Lymphoma, relapsed refractory, aggressive | Third line | Topoisomerase II Inhibitor | Phase III, randomized controlled | Exp. N = 70; control N = 70 | No | Yes | No | Trial Conduct Safety | Premature trial closure, low numbers of randomized patients, toxicity |
| #6 | Non‐small cell lung cancer, squamous, metastatic | First line | EGFR targeted Monoclonal Antibody | Phase III, randomized, open label | Exp.:545; Control 548 | No | Yes | Yes | Efficacy | Minor clinical but stat. sig. OS benefit |
| #7 | Urothelial carcinoma | First line and second Line | Immune Checkpoint Inhibitor | Phase II, uncontrolled | Cohort 1 N = 119; Cohort 2 N = 310 | No | Yes | Yes | Efficacy | No RCT for first line, uncertainties on PDL1 expression and outcome, efficacy endpoints immature |
| #8 | T cell lymphoma, cutaneous | Third Line | Histone deacetylase inhibitor | Phase II, uncontrolled | N = 74 | No | No | Yes | Efficacy Pharmacology | Lack of comparator for efficacy, lack of pharmacokinetic data |
Abbreviations: EMA, European Medicines Agency; FDA, US Food and Drug Administration; MAA, Marketing Authorization Application; OP, Oncology Products; OS, overall survival; PFS, progression‐free survival; RR, response rate; SMC, Swissmedic.
For the remaining two applications with randomized controlled trial data, the study design and overall patient numbers were adequate with 752 and 1093 randomized patients, respectively. Although for both MAAs the primary end point was statistically met, the clinical meaningfulness of the outcome was evaluated differently by the regulatory agencies resulting in diverging decisions.
Comparison of the labeled indication for OPs among the SMC, the EMA, and the FDA on consensus decisions
Similarity of the label
In order to investigate potential differences of the labeled indication for OPs approved in all three jurisdictions, the wording of the indications was compared for 52 of 59 products (88.1%) which had been approved by all three agencies (consensus positive decision). For seven of 59 (11.9%) products, the data packages submitted to the three DRAs were different rendering them inadequate for a labeling comparison. These products were excluded from further labeling analyses.
Comparing the SMC with the EMA, 19 of 52 labels were similar (36.5%), minor differences were present in 20 of 52 cases (38.5%), and major differences were observed in 13 of 52 label indications (25.0%; Figure 3).
FIGURE 3.
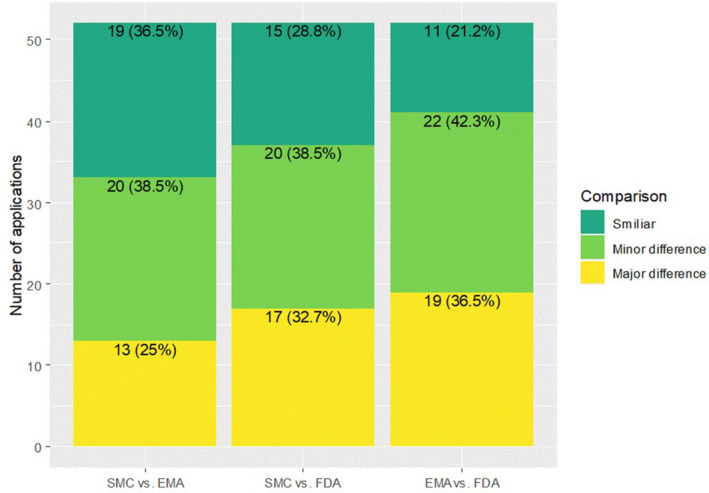
Similarity of labels among the SMC, the EMA, and the FDA with distribution of similar, minor differences and major differences based on the approved patient population. EMA, European Medicines Agency; FDA, US Food and Drug Administration; SMC, Swissmedic.
Comparing the SMC with the FDA, similar labels were present in 15 of 52 cases (28.8%), minor differences were seen in 20 of 52 cases (38.5%). The rate of major labeling differences was 32.7% (17/52 labels).
Last, comparing the EMA and the FDA labeling differences, similar labels were seen in 11 of 52 cases (21.2%), minor differences were present in 22 of 52 cases (42.3%), and major differences were observed in 19 of 52 cases (36.5%).
Based on the pairwise comparisons, the highest similarity of the labeling was observed between the SMC and the EMA (36.5%; 95% CI = [23.6%, 51.0%]).
Strictness of the label
Authorized labels were compared between DRAs and scored for comparative strictness of the indication wording defining the included patient population.
The SMC had 29 of 52 labels scored as wide, 16 of 52 scored moderate, and seven of 52 scored strict. The EMA had 22 of 52 labels scored as wide, 24 of 52 scored as moderate, and six of 52 scored as strict. Finally, the FDA had 31 of 52 labels scored wide, 13 of 52 scored moderate, and eight of 52 scored strict.
Overall, the majority of labels at the SMC and the FDA were scored wide (55.8% by the SMC, and 59.6% by the FDA). Only a minority of labels were scored as strict with 13.5% by the SMC, 11.5% by the EMA, and 15.4% by the FDA. The EMA was the only agency with an approximately similar proportion of moderate labels (46.2%) compared to wide labels. This could potentially indicate a more restrictive description of the patient population at the EMA compared to the FDA and the SMC. However, by pairwise comparison no statistically significant differences in strictness of labeling were observed for any of the DRAs (Figure 4).
FIGURE 4.
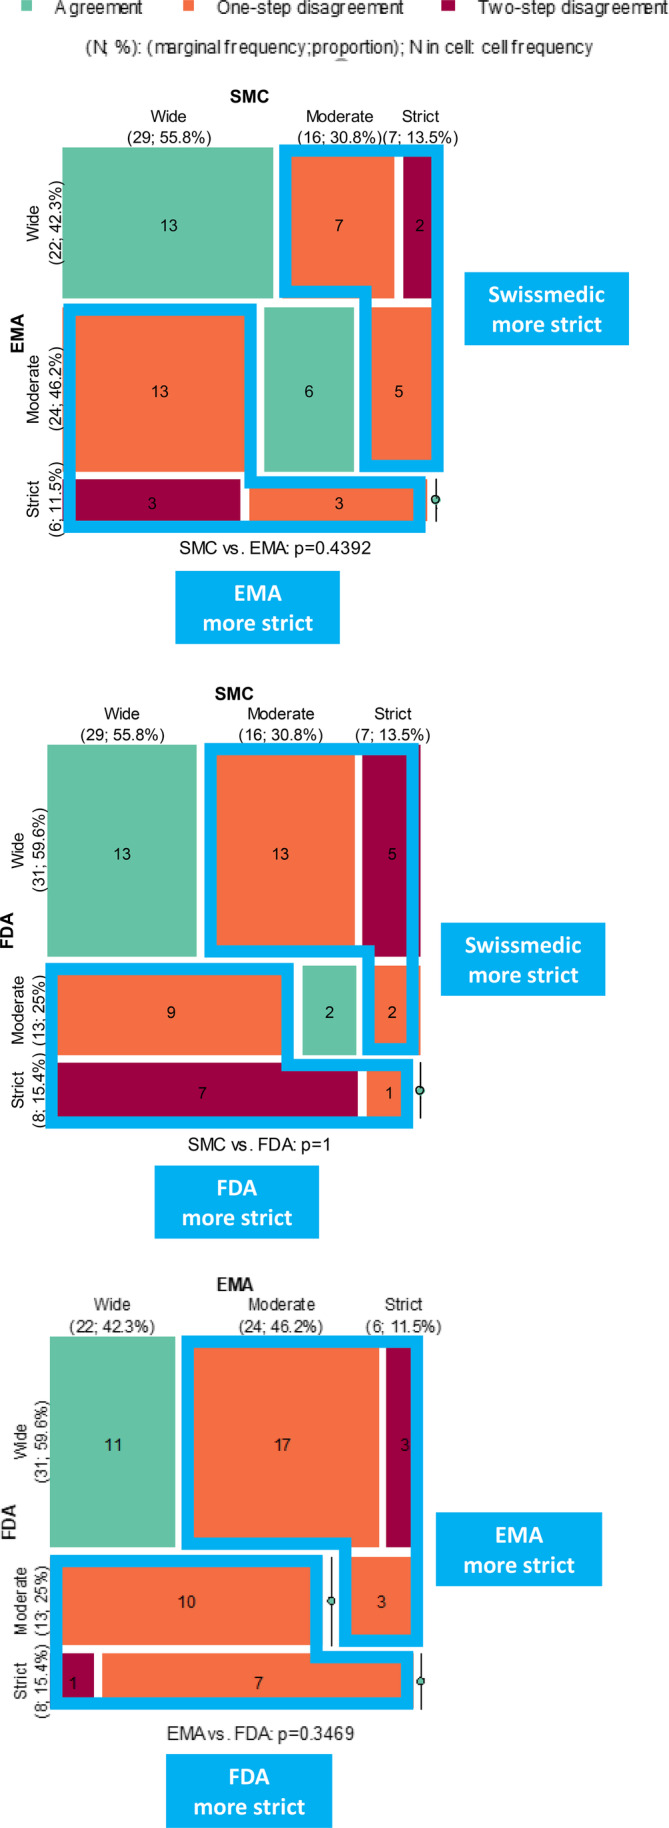
Mosaic plot of pairwise comparison between agencies regarding strictness of label. The cells on the diagonal (green) represent applications with identical label indication, while the off‐diagonal cells (orange and dark red) represent applications with different indication wording. It may happen that one agency consistently tends to have stricter indication than the other does, this can be visualized by examining the difference between the area of upper triangular and lower triangular no‐green cells. The larger the per‐area difference, the stronger is the likelihood that that one agency is stricter than the other is. Numerical differences are indicated but no statistical differences were observed. EMA, European Medicines Agency; FDA, US Food and Drug Administration; SMC, Swissmedic.
DISCUSSION
In this report, we investigated a decade of regulatory decision making by the SMC, the EMA, and the FDA. During this decade from 2009 to 2018 the SMC only had the option to approve or reject an MAA. As of January 2019, the Swiss legislation was adapted to introduce the additional option of a temporary marketing authorization. The availability of this new pathway might have influenced the SMC regulatory decisions after this date leading to the chosen data cutoff for our analysis. Our particular focus was on approval rates as well as on consensus versus divergent decisions comparing drugs in the oncology space including hematological neoplasms with all other disease areas. The aim was to determine if there are differences in regulatory decision‐making patterns between the agencies as well as between OPs and NOPs within each agency.
First, we looked at potential differences in approval rate patterns within each agency comparing OPs and NOPs. For the SMC and the EMA there were only marginal differences in approval rates between OPs and NOPs of ~2%. The largest difference in approval rates between OPs and NOPs was observed at the FDA with 7% difference in favor of OPs with 96% as compared to NOPs with 89%. There might be various reasons for this finding. One could be a high rate of time limited approvals (Accelerated Approval Pathway) for oncology drugs. The accelerated approvals in OPs at the FDA were in the range of 33%–36% as compared to 67% and 64% for traditional approvals in 2020 and 2021, respectively. 20 Another reason might be the severity of the disease area of oncology with a potential higher acceptance of drug associated toxicity as compared to other disease areas in light of a higher perceived benefit. Finally, there may be operational differences within the FDA setup as oncology drugs are assessed by a specific department, the Oncology Center of Excellence regulating only oncology products.
Next, we looked at potential differences in approval rate patterns across agencies comparing OPs and NOPs. Here, the approval pattern significantly differed depending on disease area (OPs vs. NOPs). Approval rates from highest to lowest were observed for OPs with the order of FDA‐EMA‐SMC, whereas for NOPs the order was different (EMA‐FDA‐SMC). Further, comparing the approval rates of NOPs among the three DRAs in a pairwise comparison, the highest approval rate was observed at the EMA with 94% and the lowest at the SMC with 86%. Although this difference was statistically significant, no other statistically significant differences for a pairwise comparison between agencies were observed for OPs and NOPs. This exemplifies the high concordance in decision making among the SMC, the EMA, and the FDA for OPs and NOPs.
To the best of our knowledge, this is the first time approval rates are compared specifically for different disease areas OPs versus NOPs. Previous reports looked either across all disease areas 2 , 3 , 4 , 5 , 6 , 7 or specifically at oncology drugs. 12 , 21 , 22 Dalla Torre di Sanguinetto et al. 2 compared the Marketing Authorization decisions for OPs as well as NOPs in the three DRAs for an earlier period between 2005 and 2014. There, the SMC average approval rate was 84%, the FDA was 87%, and the EMA was 91%. Kühler et al. 6 compared the review outcomes for NAS between 2014 and 2016 and reported an approval rate of 92% at the FDA and 79% at the EMA across all indications, 31% of the compounds belonged to the antineoplastic and immune‐modulating agents. Both authors concluded that there is generally a substantial degree of alignment between NAS approval status for the EMA and the FDA 6 as well as for the SMC. 2 Our data, including a recent time period, support these previous findings. Nevertheless, the data also suggest that there is a relevant difference in approval rate patterns for OPs and NOPs.
Next to the overall approval rate, which gives a perspective on the approval per DRA in a given disease area, we also examined the consensus and divergent decisions. This allows a more granular look on a “per application basis” in order to compare regulatory decisions among the different DRAs. The consensus decision rates of 88% and 84% were statistically significant for OPs as well as for NOPs indicating a substantial and reassuring agreement on decision making among DRAs in line with previous findings. 2 , 6
Looking at the divergent decisions, there is one common aspect that we observed, independent from the disease area. The SMC did not approve any drug that has been negatively decided on by both the EMA and the FDA. On the contrary, the SMC did not approve three OPs and 12 NOPs that were approved by both the EMA and the FDA. The approval rates at the SMC for divergent decisions at the DRA level was lowest for both OPs as well as NOPs. These few but divergent decisions have contributed to the observed differences in the overall approval rates. We believe that one possible explanation is the availability of certain time‐limited authorization approval pathways at DRAs, such as the conditional marketing authorization pathway and the accelerated approval pathway for the EMA and the FDA, respectively. For these regulatory pathways, the approval of a drug is usually limited to a certain duration and bound to the postmarketing obligation of providing additional clinical data. With the submission of the required confirmatory clinical data a conversion into a regular approval may later be granted. The EMA has introduced such a regulatory pathway as a “conditional marketing authorization” in 2006. At the FDA, the “accelerated approval pathway” was developed already in 1992 in response to the HIV/AIDS crisis. In contrast, in Switzerland, such a pathway of a “temporary authorization” was only adopted in 2019. Consequently, all SMC regulatory decisions before 2019 were either regular approvals or rejections as the only two options for decision making. The differences in the availability of a time‐limited pathway may have had an impact on the approval rates, consensus decisions, and divergent decisions comparing the SMC with the EMA or the FDA. 21
Second, we were interested in the reasons why the DRAs came to divergent decisions for OPs based on comparable sets of data. Of the few diverging decisions (n = 8), the SMC had the lowest approval rate (25%) followed by the EMA (50%) and the FDA (88%). From these eight drugs, only two were approved at the FDA via the accelerated approval pathway and only one at the EMA via the conditional marketing authorization pathway. Therefore, it appears unlikely that the availability of time‐limited approval pathways was the only reason for divergent decisions. Given that regulatory tools alone could not satisfactorily explain all divergent decisions, we looked at the scientific basis of the submitted clinical data. The common denominator of all eight divergent decisions was the high degree of uncertainty regarding the benefits and risks. Inadequate trial design was the most frequent reason for these uncertainties. Five MAAs were based on single arm studies leading to uncertainties about efficacy in the absence of an adequate comparator arm. Although a majority (6/8) of the MAAs requested second‐ or third‐line indications, these uncertainties were still relevant leading to a negative benefit–risk evaluation by at least one DRA. Although the remaining three MAAs were based on randomized trials, there was uncertainty about the clinical relevance of the results. Two of these randomized trials had statistically significant efficacy results; however, only a marginal clinical benefit was observed and considered insufficient by the respective DRAs rejecting these OPs. Finally, the third randomized trial was insufficient due to poor trial conduct and premature closure of the study again leading to significant uncertainties. In addition, inadequate dose finding was a reason for rejection in two of eight OPs. Overall, all eight MAAs with divergent decisions presented major uncertainties. These uncertainties were evaluated and interpreted differently by the three DRAs eventually resulting in divergent regulatory decisions. The fact, however, that, overall, the number of divergent decisions was small underlines the wide consensus among agencies.
Third, we evaluated similarities and strictness in indication wordings for OPs among the agencies. The highest similarity of labeling was observed between the SMC and the EMA (37%) and the lowest between the EMA and the FDA (21%). In addition, the largest difference between labels with 37% major label differences was found between the EMA and the FDA. Major label differences were observed in 25% of the OPs between the SMC and the EMA. These findings suggest a higher similarity in labels between the SMC and the EMA and greater differences between the EMA and the FDA. Nevertheless, and similar to us, Zeukeng et al. 23 had found in a comparison of new drug approvals by the FDA, the EMA, and the SMC between 2007 and 2016 significant differences in indications between the FDA and the SMC, and the FDA and the EMA, but not between the EMA and the SMC. At least in part, differences are based on different evaluation of end points, different interaction modalities with industry, and patients or cultural differences as patient advocacy is more embedded in the United States than in Europe, as suggested by Tafuri et al. 12 Next to label similarity, we also evaluated the strictness of labeling. No specific pattern was discernible and the numbers of lesser or higher degree of strictness were well balanced and nonsignificant among the three DRAs. The data are analyzed by each assessor team and the different agencies and assessors likely evaluate uncertainties somewhat differently. The observation that there is no difference in strictness of the label among the SMC, the EMA, and the FDA based on our scoring algorithm is in line with the findings from Dörr et al. who also found no evidence for an increased strictness by a certain agency by comparing the final labels. 3
CONCLUSIONS
This report provides insights into the patterns of regulatory decision making of a recent 10‐year period. The approval pattern differed depending on disease area and approval rates from highest to lowest per agency were different in OPs compared to NOPs. Nevertheless, concordance in decision making was high among the FDA, the EMA, and the SMC, independent of disease area. As a consequence, the rate of divergent decisions among agencies for OP drugs was low. The underlying reasons for the divergent decisions were mainly of scientific nature due to a lack of robust randomized controlled trials.
In the future, regulatory disease area specific cluster calls 1 or collaboration platforms, such as ORBIS, 24 between different agencies are expected to further enhance the transparency and common understanding of decision making among regulatory agencies in different regions.
AUTHOR CONTRIBUTIONS
U.P.R., S.D.T., and A.W. wrote the manuscript. U.P.R. and A.W. designed the research. U.P.R., M.I., L.R., S.J., A.G., C.B., A.W., S.D.T., and O.W. performed the research. Q.L., A.W., and U.P.R. analyzed the data. M.B. contributed new reagents/analytical tools.
FUNDING INFORMATION
No funding was received for this work.
CONFLICT OF INTEREST STATEMENT
The authors declared no competing interests for this work.
Rohr U‐P, Iovino M, Rudofsky L, et al. A decade comparison of regulatory decision patterns for oncology products to all other non‐oncology products among Swissmedic, European Medicines Agency, and US Food and Drug Administration. Clin Transl Sci. 2023;16:1569‐1581. doi: 10.1111/cts.13567
Ulrich‐P Rohr and Mario Iovino shared first authorship.
Simon Dalla Torre di Sanguinetto and Anita Wolfer shared last authorship.
Conference Presentation: This paper was presented at the ESMO Congress, September 12, 2022, Paris, as a Poster.
REFERENCES
- 1. Teixeira T, Kweder SL, Saint‐Raymond A. Are the European medicines agency, US Food and Drug Administration, and other international regulators talking to each other? Clin Pharmacol Ther. 2020;107:507‐513. [DOI] [PMC free article] [PubMed] [Google Scholar]
- 2. Dalla Torre Di Sanguinetto S, Heinonen E, Antonov J, Bolte C. A comparative review of marketing authorization decisions in Switzerland, the EU, and the USA. Ther Innov Regul Sci. 2019;53:86‐94. [DOI] [PubMed] [Google Scholar]
- 3. Dorr P, Wadworth A, Wang T, McAuslane N, Liberti L. An analysis of regulatory timing and outcomes for new drug applications submitted to Swissmedic: comparison with the US Food and Drug Administration and the European medicines agency. Ther Innov Regul Sci. 2016;50:734‐742. [DOI] [PubMed] [Google Scholar]
- 4. Hwang TJ, Ross JS, Vokinger KN, Kesselheim AS. Association between FDA and EMA expedited approval programs and therapeutic value of new medicines: retrospective cohort study. BMJ. 2020;371:m3434. [DOI] [PMC free article] [PubMed] [Google Scholar]
- 5. Kashoki M, Hanaizi Z, Yordanova S, et al. A comparison of EMA and FDA decisions for new drug marketing applications 2014‐2016: concordance, discordance, and why. Clin Pharmacol Ther. 2020;107:195‐202. [DOI] [PMC free article] [PubMed] [Google Scholar]
- 6. Kuhler TC, Bujar M, McAuslane N, Liberti L. To what degree are review outcomes aligned for new active substances (NASs) between the European medicines agency and the US Food and Drug Administration? A comparison based on publicly available information for NASs initially approved in the time period 2014 to 2016. BMJ Open. 2019;9:e028677. [DOI] [PMC free article] [PubMed] [Google Scholar]
- 7. Makuch RW, Shi R. Comparison of drug approvals in Europe versus the United States: an analysis of discrepancies between drug products reviewed by EMA and FDA. Ther Innov Regul Sci. 2014;48:362‐366. [DOI] [PubMed] [Google Scholar]
- 8. Bujar MM. New drug approvals in six major authorities 2011–2020: focus on facilitated regulatory pathways and worksharing. Centre for Innovation in Regulatory Science R&D Briefing 81 2021.
- 9. Gyawali B, Rome BN, Kesselheim AS. Regulatory and clinical consequences of negative confirmatory trials of accelerated approval cancer drugs: retrospective observational study. BMJ. 2021;374:n1959. [DOI] [PMC free article] [PubMed] [Google Scholar]
- 10. Powell K, Lythgoe MP, Prasad V. The oncologic drugs advisory committee votes of April 2021‐implications for the fate of accelerated approval. JAMA Oncol. 2021;7:1607‐1609. [DOI] [PubMed] [Google Scholar]
- 11. Schnog JB, Samson MJ, Gans ROB, Duits AJ. An urgent call to raise the bar in oncology. Br J Cancer. 2021;125:1477‐1485. [DOI] [PMC free article] [PubMed] [Google Scholar]
- 12. Tafuri G, Stolk P, Trotta F, et al. How do the EMA and FDA decide which anticancer drugs make it to the market? A comparative qualitative study on decision makers' views. Ann Oncol. 2014;25:265‐269. [DOI] [PubMed] [Google Scholar]
- 13. https://www.ema.europa.eu/en/medicines/download‐medicine‐data
- 14. https://mri.cts‐mrp.eu/portal/home?domain=h
- 15. https://ec.europa.eu/health/medicinal‐products/union‐register/member‐states‐registers‐nationally‐authorised‐medicinal‐products_en
- 16. https://www.fda.gov/drugs/drug‐approvals‐and‐databases/drugsfda‐data‐files. Drugs@FDA Data Files 2019.
- 17. https://www.fda.gov/vaccines‐blood‐biologics/development‐approval‐process‐cber/biological‐approvals‐year. Vaccines, blood, and Biologics>Blood & Blood Products>Approved Products>Licensed Products BLAs US Food and Drug Administration 2019.
- 18. https://www.fda.gov/drugs/laws‐acts‐and‐rules/complete‐response‐letter‐final‐rule. Home>Drugs>Laws, Acts, and Rules>Complete Response Letter Final Rule 2019.
- 19. Landis JR, Koch GG. The measurement of observer agreement for categorical data. Biometrics. 1977;33:159‐174. [PubMed] [Google Scholar]
- 20. Beakes‐Read G, Neisser M, Frey P, Guarducci M. Analysis of FDA's accelerated approval program performance December 1992‐December 2021. Ther Innov Regul Sci. 2022;56:698‐703. [DOI] [PMC free article] [PubMed] [Google Scholar]
- 21. Salcher‐Konrad M, Naci H, Davis C. Approval of cancer drugs with uncertain therapeutic value: a comparison of regulatory decisions in Europe and the United States. Milbank Q. 2020;98:1219‐1256. [DOI] [PMC free article] [PubMed] [Google Scholar]
- 22. Trotta F, Leufkens HG, Schellens JH, Laing R, Tafuri G. Evaluation of oncology drugs at the European medicines agency and US Food and Drug Administration: when differences have an impact on clinical practice. J Clin Oncol. 2011;29:2266‐2272. [DOI] [PubMed] [Google Scholar]
- 23. Zeukeng MJ, Seoane‐Vazquez E, Bonnabry P. A comparison of new drugs approved by the FDA, the EMA, and Swissmedic: an assessment of the international harmonization of drugs. Eur J Clin Pharmacol. 2018;74:811‐818. [DOI] [PubMed] [Google Scholar]
- 24. de Claro RA, Spillman D, Hotaki LT, et al. Project Orbis: global collaborative review program. Clin Cancer Res. 2020;26:6412‐6416. [DOI] [PubMed] [Google Scholar]