

Abstract
Animal and epidemiologic studies suggest that there may be adverse health effects from exposure to glyphosate, the most highly used pesticide in the world, and its metabolite aminomethylphosphonic acid (AMPA). Meanwhile, consumption of organic foods (presumably grown free of chemical pesticides) has increased in recent years. However, there have been limited biomonitoring studies assessing the levels of human glyphosate and AMPA exposure in the United States. We examined urinary levels of glyphosate and AMPA in the context of organic eating behavior in a cohort of healthy postmenopausal women residing in Southern California and evaluated associations with demographics, dietary intake, and other lifestyle factors. 338 women provided two first-morning urine samples and at least one paired 24-h dietary recall reporting the previous day’s dietary intake. Urinary glyphosate and AMPA were measured using LC-MS/MS. Participants reported on demographic and lifestyle factors via questionnaires. Potential associations were examined between these factors and urinary glyphosate and AMPA concentrations. Glyphosate was detected in 89.9% of urine samples and AMPA in 67.2%. 37.9% of study participants reported often or always eating organic food, 30.2% sometimes, and 32.0% seldom or never. Frequency of organic food consumption was associated with several demographic and lifestyle factors. Frequent organic eaters had significantly lower urinary glyphosate and AMPA levels, but not after adjustment for covariates. Grain consumption was significantly associated with higher urinary glyphosate levels, even among women who reported often or always eating organic grains. Soy protein and alcohol consumption as well as high frequency of eating fast food were associated with higher urinary AMPA levels. In conclusion, in the largest study to date examining paired dietary recall data and measurements of first-void urinary glyphosate and AMPA, the vast majority of subjects sampled had detectable levels, and significant dietary sources in the American diet were identified.
Keywords: Glyphosate, Aminomethylphosphonic acid (AMPA), Pesticides, Organic eating, Diet
1. Introduction
The broad-spectrum herbicide glyphosate is the most used pesticide in the world (Benbrook, 2016). Its agricultural applications include weed control, reduction of soil tillage, preparation of seed beds, and pre-harvest desiccation of grain crops and legumes (Benbrook, 2016; Duke, 2018), in addition to non-agricultural uses in residential areas, parks, forests, pastures, and lawns (Gaines, 2018). Use of glyphosate-based herbicides has increased dramatically since the introduction of glyphosate-resistant (GR) crop species in the late 1990s (Duke, 2018), and they are also commonly used in the production of non-GR crops (Benbrook, 2016; Gaines, 2018; Wiese et al., 2018). Glyphosate’s herbicidal properties are due to inhibition of the shikimate pathway enzyme 5-enolpyruvylshikimate-3-phosphate synthase (EPSPS), which is found in plants and also some fungi and bacteria but not in human cells (Bai and Ogbourne, 2016; Duke and Powles, 2008; Duke et al., 2012). Many plant species (both GR and non-GR) appear to have at least some ability to metabolize glyphosate, with the main metabolite being aminomethylphosphonic acid (AMPA), which is not harmful to plants, but most glyphosate degradation in the environment occurs via soil microbes (Nandula et al., 2019; Reddy et al., 2018; Bøhn et al., 2014; Duke, 2011; Cessna et al., 2011). To confer glyphosate resistance, some GR crops have been introduced with a bacterial glyphosate oxidoreductase gene, which breaks glyphosate down into AMPA and glyoxylate, thereby leaving the plant’s EPSPS function relatively intact (Bai and Ogbourne, 2016; Duke and Powles, 2008; Grandcoin et al., 2017; Borggaard and Gimsing, 2008).
Both glyphosate and AMPA have been detected in a large variety of foods. In 2017, the U.S. Food and Drug Administration found that 40% of soybean samples had detectable levels of glyphosate residues (Kolakowski et al., 2020; United States Food and Drug Administration, 2017). In the U.S. and other countries, glyphosate and/or AMPA are also frequently detected in wheat and cereal crops (Kolakowski et al., 2020; Zoller et al., 2018; Xu et al., 2019), lentils/beans (Kolakowski et al., 2020; Zoller et al., 2018; Medina-Pastor and Triacchini, 2020), honey (Medina-Pastor and Triacchini, 2020; Emily Guo et al., 2014), various fruits and vegetables (Kolakowski et al., 2020; Zoller et al., 2018; Emily Guo et al., 2014), tea (Medina-Pastor and Triacchini, 2020; John and Liu, 2018), wine (Zoller et al., 2018), infant foods (Kolakowski et al., 2020), and prepared foods such as cookies/crackers and frozen meals (Kolakowski et al., 2020).
From 1996 to 2014, the total volume of glyphosate applied in the U. S. increased more than 9-fold (Benbrook, 2016). During approximately the same time period (1993–2016), a longitudinal study of 100 adults in San Diego County, California showed that urinary levels of glyphosate and AMPA also increased, more than 13-fold (Mills et al., 2017). Since then, several studies conducted on individuals in the non-agricultural setting in various parts of the U.S., including a National Health and Nutrition Examination Study (NHANES) study on 2310 individuals, have detected glyphosate in 77–95% of participants (Lesseur et al., 2021; Schütze et al., 2021; Parvez et al., 2018; Ospina et al., 2022; Gerona et al., 2022). In our previous study of 392 postmenopausal women in southern California, urinary glyphosate and AMPA were detected in 95% and 82% of participants, respectively (Lucia et al., 2022). Human biomonitoring studies have also been done in Europe, Canada, Mexico, Columbia, and Sri Lanka, with the majority of studies showing at least 40% detection frequencies for both glyphosate and AMPA, and some studies with over 90% detection frequencies (Ashley-Martin et al., 2023; Buekers et al., 2022; Mesnage et al., 2022; Eaton et al., 2022; Cosemans et al., 2022; Rocha et al., 2022; Connolly et al., 2020). The discrepancies can be largely attributed to differences in the analytical methods used and LODs for those methods as well as duration of fasting before urine collection (Ospina et al., 2022; Connolly et al., 2020).
The potential health effects of glyphosate and AMPA on humans are widely debated. In 2015 the World Health Organization’s (WHO) International Agency for Research on Cancer (IARC) determined glyphosate to be a probable human carcinogen (IARC Monographs, 2015), while other agencies including the U.S. Environmental Protection Agency (EPA) disagree with this assessment (Environmental Protection Agency, 2020; Food and Agricultural Organization of the United Nations, 2016). Recently, a pilot study on 250 women in Hawaii found that higher urinary AMPA levels were associated with breast cancer risk (Franke et al., 1987). In agricultural workers, glyphosate has been associated with kidney toxicity (Jayasumana et al., 2014) and increased risk for non-Hodgkin’s lymphoma (Zhang et al., 2019). Glyphosate has also been shown to induce fatty liver disease (Mesnage, R., Renney et al., 2017), endocrine disruption (Ingaramo et al., 2020), and changes to the microbiome (Mao et al., 2018; Tang et al., 2020; Mesnage et al., 2021) in animal models, and the growth of breast cancer cells in vitro (Thongprakaisang et al., 2013). Thus, there is interest in monitoring and limiting exposure to glyphosate and AMPA in humans (Connolly et al., 2020; Myers et al., 2016; Gillezeau et al., 2019; Vandenberg et al., 2017).
The general population is most likely to be exposed to glyphosate and/or AMPA through residues in food; a recent organic diet intervention study done in the U.S. found that urinary glyphosate and AMPA concentrations decreased more than 70% after just 2 days of switching from a conventional diet to a completely organic one (Fagan et al., 2020). The desire to reduce pesticide exposure is often the primary reason why consumers buy organic foods (Dickson-Spillmann et al., 2011; Grunert, 2005). However, outside of the intervention setting, most people who eat organic food do not eat exclusively organic food; thus, organic food consumers are most likely still exposed to pesticides to different extents (Grau et al., 2022; Baudry et al., 2015).
Despite the evidence for widespread presence of glyphosate and AMPA in the food supply and in human urine samples, few studies have examined the relationship between dietary factors and urinary glyphosate and AMPA exposure within individuals, and there have been no studies examining organic eating frequency and dietary recall data with paired urinary glyphosate and AMPA levels. The goals of this study were to examine the relationships between organic eating frequency, dietary intake, and urinary glyphosate and AMPA levels in a cohort of postmenopausal women in southern California.
2. Methods
2.1. Population and data collection
The participants in this study were a subset of the Markers for Environmental Exposures (MEE) Study cohort, which has been previously described (Lucia et al., 2020). Briefly, postmenopausal women between ages 45 and 66 years without a personal history of breast cancer or mastectomy were eligible to enroll in the study. MEE Study participants were asked to complete up to three 24-h dietary recalls, questionnaires about their demographic and lifestyle information, including usual dietary habits, and they provided two first-morning urine samples for analysis. All participants provided informed consent to join the study, and the study protocol was approved by the University of California, Irvine Institutional Review Board, HS #2016–3127. The subset of MEE Study participants who were included in the current analysis had at least one valid 24-h dietary recall/first-void urine pair (described below) (Fig. 1).
Fig. 1.
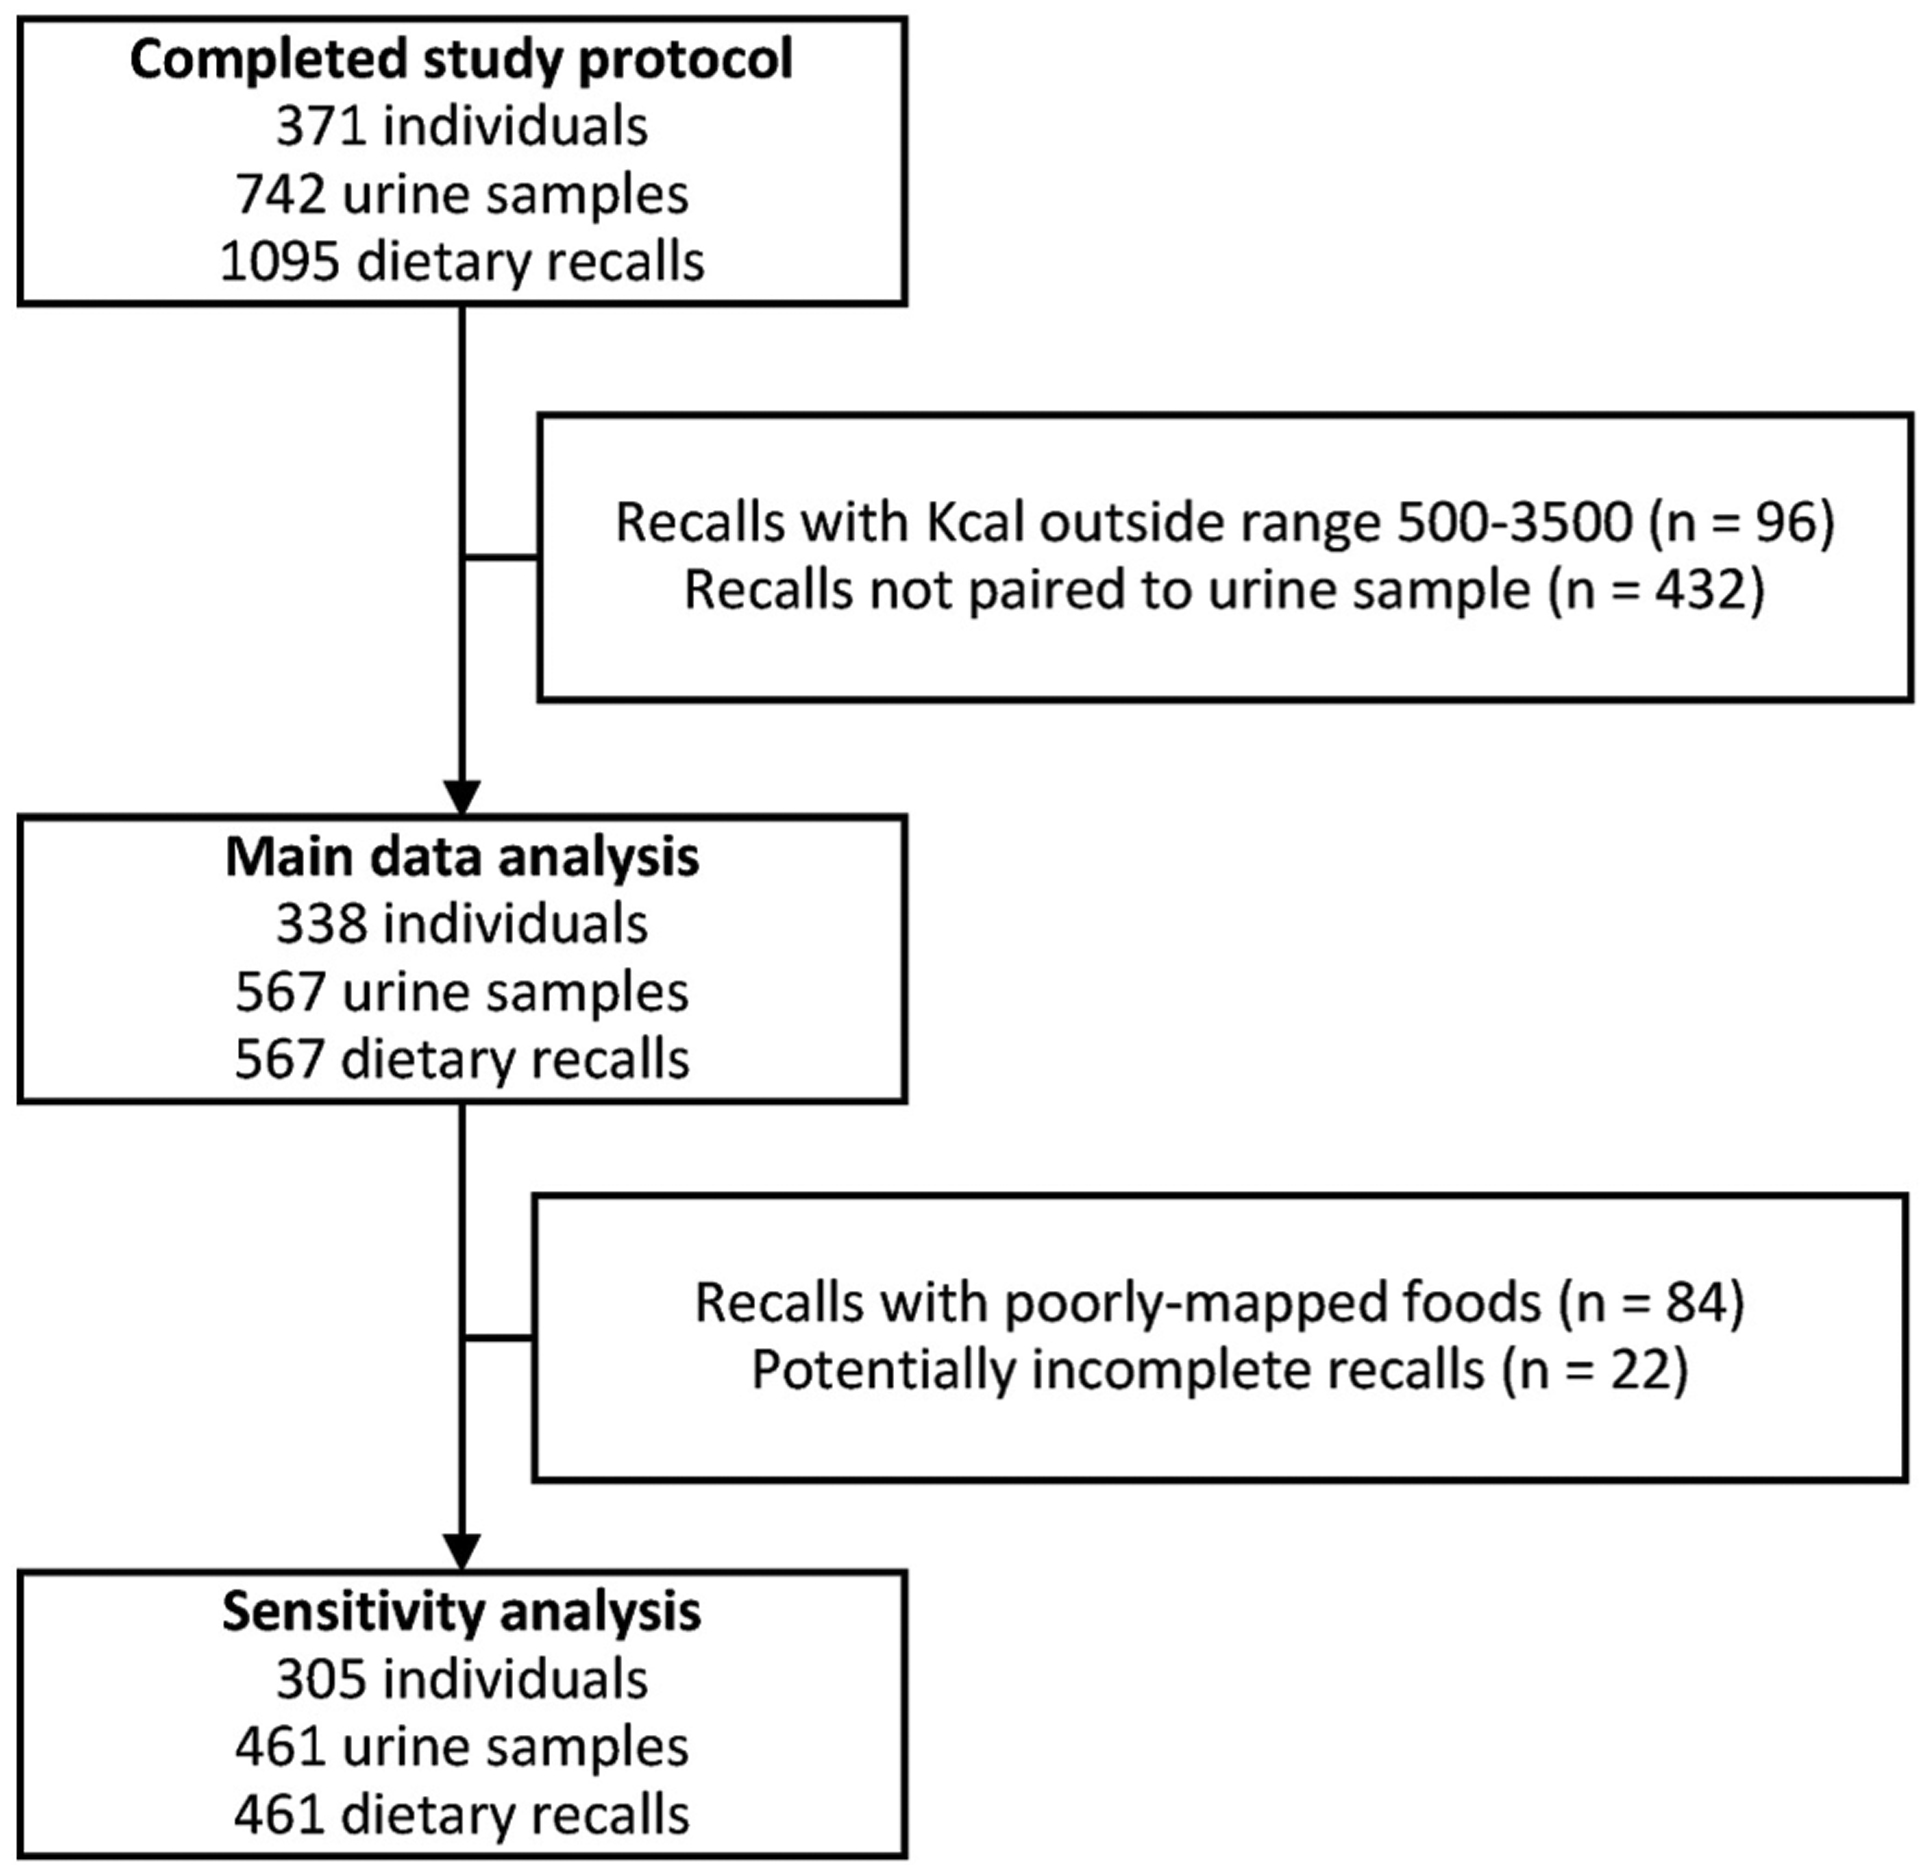
Study flow chart.
2.2. Glyphosate/AMPA measurements
Study participants provided two first-morning urine samples on two days within a 10-day period not known to them in advance. The urine samples were stored at −20 °C until they could be transported to the laboratory, where they were thawed overnight at 4 °C, then aliquoted and stored at −80 °C for later analysis.
Quantitation of glyphosate and AMPA in the urine was performed over a linear range of 0–5 ng/mL using Thermo Scientific Vanquish UPLC and TSQ-Altis mass spectrometer as described previously (Lesseur et al., 2021). The linearity, accuracy, precision, and assay limits were described previously (Lesseur et al., 2021). Briefly, the limit of detection (LOD) and limit of quantitation (LOQ) for glyphosate were 0.014 and 0.041 ng/mL, respectively. The LOD and LOQ for AMPA were 0.013 and 0.040 ng/mL, respectively. The DetectX kit-based assay was used for urinary creatinine measurements (Arbor Assays, Ann Arbor, MI, K002–H5). Samples were analyzed over several batches. The batch effects were determine using Kruskal-Wallis test and batch effects were corrected using removeBatchEffects function in Limma (Ritchie et al., 2015). For data analysis, measurements below limit of detection (LOD) were replaced with LOD/√2 (Hornung and Reed, 1990).
2.3. Dietary and demographic/behavioral measurements
Study participants were asked to complete three 24-h dietary recalls using the Automated Self-Administered 24-h (ASA24) Dietary Assessment Tool, version 2016, developed by the National Cancer Institute, Bethesda, MD (https://epi.grants.cancer.gov/asa24), which captures the type and amount of all food and drink consumed within a 24-h period. Requests for recalls were not announced in advance in order to capture typical dietary habits. A recall was requested for the day preceding each urine sample collection; if successfully completed, the recall and urine sample were considered “paired.” Because the half-life of glyphosate in urine is approximately 5.5–10 h (Faniband et al., 2021; Connolly et al., 2019), foods and drinks consumed in the 24 h prior to specimen collection are likely to have the strongest influence on glyphosate levels.
Using the paired dietary recalls and urine samples, we examined associations between urinary glyphosate and AMPA and consumption of the 5 major food groups according to the Dietary Guidelines for Americans: fruit, vegetables, grains, protein foods, and dairy, all derived from standard ASA24 output. Selected subgroups of interest included foods and beverages previously reported or suspected to have elevated glyphosate levels or crops with glyphosate-resistant varieties. Among these subgroups, consumption of legumes, whole grains, refined grains, meat/poultry (combination of beef, poultry, pork, veal, lamb, and cured/organ meats), eggs, soy protein (soy products, excluding calcium fortified soy milk and immature soybean), and nuts and seeds were calculated from ASA24 output. For corn, oats, other soy products, coffee, tea, and alcoholic drinks (total and wine, beer, and spirits separately), the individual food and beverage items reported on each recall were reviewed to identify those that contained the food/beverage of interest (see Supplemental Material, List of food and beverage items included in additional categories, for a full list of all participant-reported items included in each category). Recalls reporting a total kilocalorie (Kcal) intake of <500 or >3500 Kcal (N = 96) were excluded from the analysis (Rhee et al., 2015).
Other demographic and behavioral variables of interest, assessed by questionnaire, were examined for associations with urinary glyphosate and AMPA. These included age, self-reported race/ethnicity, body mass index (BMI) (calculated from self-reported height and weight), smoking status (current, former, or never), education (college graduate or higher, some college, high school graduate, some high school or less), ZIP code or city of residence, physical activity (≥150 min of moderate-intensity aerobic exercise per week or an equivalent combination of moderate- and vigorous-intensity exercise), frequency of dining at fast food restaurants, and usual drinking water source (bottled, filtered tap, or unfiltered tap). Estimated household income was approximated using the median household income in the participant’s ZIP code or city of residence (where ZIP code missing, N = 10) for householders aged 45–64 from the American Community Survey 2019 5-Year Estimates (data.census.gov). Overall dietary pattern was characterized according to the Healthy Eating Index 2015 (HEI), a score of adherence to the 2015–2020 Dietary Guidelines for Americans (Krebs-Smith et al., 2018). The HEI was calculated 1) for individual recalls to characterize dietary pattern on a specific day and 2) for all available (paired and unpaired) recalls as a more comprehensive representation of usual eating habits. Study participants were asked how often they ate organic food, both in general and for six specific food groups (fruit, vegetables, grains, meat, eggs, and dairy), with the response choices “often or always,” “sometimes,” “seldom or never” (Curl et al., 2015) and “I do not eat the food” (for specific food groups only). Participants were provided the following definition of organic food: “food that is either labeled USDA Organic, purchased locally from an organic farm, grown without pesticides in a home garden, or raised on organic feed without hormones and without antibiotics.” (Lucia et al., 2020; Curl et al., 2015).
2.4. Statistical analysis
A p-value of <0.05 was considered statistically significant and all statistical tests were two-sided. All statistical analyses were conducted in R, version 3.5.0 (R Core Team, 2018).
We examined relationships between dietary, demographic and behavioral factors and self-reported overall organic eating frequency using Fisher’s exact test (categorical variables) and the Kruskal-Wallis test (continuous variables). Correlation between urinary glyphosate and AMPA levels within samples was characterized by Pearson’s correlation.
Relationships between dietary, demographic, and behavioral factors and urinary glyphosate and AMPA were assessed using linear mixed-effects models. Major food groups (fruit, vegetables, grains, protein foods, and dairy) were evaluated as quartiles of consumption, while other foods and beverages were evaluated as binary (consumed/not consumed). Less than 5% of participants had any missing data (n = 5 participants for race/ethnicity, 1 for education, 12 for physical activity, 1 for smoking status). In the mixed-effects model, these missing data points were imputed with predictive mean matching using the mice R package. The base model used the natural logarithm of urinary glyphosate or AMPA as the outcome and a fixed effect for the predictor of interest, with a fixed effect for creatinine to account for urine concentration and a random effect for individual. The adjusted model included additional fixed effects for total Kcal, dietary pattern (as HEI for the individual recall), and the non-diet-related variables that were nominally significant (p < 0.10) in the base model: race/ethnicity and physical activity level. Coefficients from linear mixed-effects models were used to calculate relative differences in glyphosate and AMPA. Because glyphosate and AMPA were log-transformed in the linear models, the exponentiated coefficients can be interpreted as the percent difference in geometric mean for the variable of interest. For example, a relative difference of 1.2 indicates a 20% increase in glyphosate or AMPA concentration per unit increase in the variable of interest, while a relative difference of 0.7 indicates a 30 decrease in glyphosate or AMPA concentration per unit increase in the variable of interest (Weisberg and Fox, 2011). For food groups with data about organic eating consumption (fruit, vegetables, grains, meat, eggs, and dairy), we repeated the adjusted model after stratifying by self-reported organic eating frequency for that food group.
A sensitivity analysis was conducted after excluding potentially problematic recalls. These included potentially incomplete recalls (e.g., study participant closed the browser window rather than clicking “finish”) and recalls which included one or more poorly-mapped foods. ASA24 maps foods and beverages to the USDA Food and Nutrient Database for Dietary Studies (FNDDS) to obtain the nutritional content of the item. If a respondent-provided item was not recognized by the FNDDS, a best-guess attempt to map it to a known item was made. The list of these “unfound foods” was reviewed by two authors (RML and HLP) and classified as poorly-mapped (having a markedly different macronutrient profile and/or affecting the measurement of one of the foods of interest) or acceptable (Kirkpatrick et al., 2014). For example, a user’s entry of “organic shade grown coffee” which was mapped to “soft drink” was considered poorly-mapped, while a user’s entry of “sun-dried tomato” being mapped to “tomatoes, raw” was considered incorrect but acceptable.
3. Results
After exclusions, 338 individuals completed 567 paired recalls/urine samples and formed the main study cohort (Fig. 1). 229 participants (67.8%) completed two paired dietary recalls, while the remaining 109 participants (32.2%) completed only one.
Most study participants were non-Hispanic whites who were college graduates and reported never smoking (Table 1). The three categories of self-reported overall organic eating frequency were approximately evenly distributed, with 37.9% reporting often or always eating organic food, 30.2% sometimes, and 32.0% seldom or never. About a third of women reported often or always eating organic fruit, vegetables, and eggs, while less than 20% often or always ate organic grains, meat, and dairy (Supplemental Table 1).
Table 1.
Subject characteristics, overall and stratified by self-reported overall organic eating.
| Overall N = 338 | Self-Reported Organic Eating | p | |||
|---|---|---|---|---|---|
| Seldom/Never N = 108 (32.0%) | Sometimes N = 102 (30.2%) | Often/Always N = 128 (37.9%) | |||
| Median (Q1, Q3) or N (%) | Median (Q1, Q3) or N (%) | Median (Q1, Q3) or N (%) | Median (Q1, Q3) or N (%) | ||
| Age | 57 (54, 60) | 57 (53, 60) | 57 (54, 60) | 58 (55, 61) | 0.20 |
| Race/Ethnicity | 0.19 | ||||
| Non-Hispanic White | 225 (67.6%) | 67 (63.8%) | 62 (62.0%) | 96 (75.0%) | |
| Asian | 34 (10.2%) | 13 (12.4%) | 13 (13.0%) | 8 (6.3%) | |
| Hispanic | 58 (17.4%) | 22 (21.0%) | 19 (19.0%) | 17 (13.3%) | |
| Other Race | 16 (4.8%) | 3 (2.9%) | 6 (6.0%) | 7 (5.5%) | |
| Education | 0.002 | ||||
| College Graduate | 241 (71.5%) | 71 (65.7%) | 72 (70.6%) | 98 (77.2%) | |
| Some College | 68 (20.2%) | 18 (16.7%) | 26 (25.5%) | 24 (18.9%) | |
| High School Graduate | 21 (6.2%) | 14 (13.0%) | 2 (2.0%) | 5 (3.9%) | |
| Some High School | 7 (2.1%) | 5 (4.6%) | 2 (2.0%) | 0 (0.0%) | |
| Median Estimated Annual Household Income | 0.11 | ||||
| Less than $100,000 | 99 (29.3%) | 40 (37.0%) | 27 (26.4%) | 32 (25.0%) | |
| $100,000 – $149,999 | 164 (48.5%) | 48 (44.4%) | 56 (54.9%) | 60 (46.9%) | |
| $150,000 or more | 75 (22.2%) | 20 (18.5%) | 19 (18.6%) | 36 (28.1%) | |
| BMI (kg/m2) | 25.0 (22.1, 29.3) | 26.5 (23.3, 31.4) | 24.4 (22.1, 29.5) | 24.0 (21.4, 28.1) | 0.002 |
| Physical Activity | 0.24 | ||||
| <150 min/week | 188 (57.7%) | 65 (61.9%) | 60 (60.6%) | 63 (51.6%) | |
| ≥150 min/week | 138 (42.3%) | 40 (38.1%) | 39 (39.4%) | 59 (48.4%) | |
| Smoking Status | 0.74 | ||||
| Never | 243 (72.1%) | 81 (75.0%) | 72 (71.3%) | 90 (70.3%) | |
| Former | 80 (23.7%) | 23 (21.3%) | 23 (22.8%) | 34 (26.6%) | |
| Current | 14 (4.2%) | 4 (3.7%) | 6 (5.9%) | 4 (3.1%) | |
| Average HEI (all available recalls) | 64.0 (55.1, 73.0) | 58.9 (51.7, 69.3) | 64.3 (55.2, 73.3) | 67.0 (59.0, 74.5) | <0.001 |
| Fast Food Meals | 0.007 | ||||
| Less than 1 time/month | 173 (51.2%) | 43 (39.8%) | 50 (49.0%) | 80 (62.5%) | |
| 1–3 times/month | 93 (27.5%) | 30 (27.8%) | 33 (32.4%) | 30 (23.4%) | |
| 1–3 times/week | 65 (19.2%) | 30 (27.8%) | 18 (17.6%) | 17 (13.3%) | |
| 4 or more times/week | 7 (2.1%) | 5 (4.6%) | 1 (1.0%) | 1 (0.8%) | |
| Primary Drinking Water Source | 0.09 | ||||
| Bottled | 128 (37.9%) | 48 (44.4%) | 33 (32.4%) | 47 (36.7%) | |
| Tap (Filtered) | 179 (53.0%) | 47 (43.5%) | 58 (56.9%) | 74 (57.8%) | |
| Tap (Unfiltered) | 31 (9.2%) | 13 (12.0%) | 11 (10.8%) | 7 (5.5%) | |
| Number of Paired Dietary Recalls | 0.30 | ||||
| 1 | 109 (32.2%) | 36 (33.3%) | 27 (26.5%) | 46 (35.9%) | |
| 2 | 229 (67.8%) | 72 (66.7%) | 75 (73.5%) | 82 (64.1%) | |
P-values for differences between organic eating categories from Fisher’s exact test (categorical variables) or Kruskal-Wallis test (continuous variables). Missing data: 5 for race/ethnicity, 1 for education, 12 for physical activity, 1 for smoking status. BMI: body mass index, HEI: Healthy Eating Index.
Education was significantly associated with overall organic eating habits (p = 0.002), with 77.2% of women who often or always ate organic food having graduated from college compared to 65.7% of seldom or never organic eaters (Table 1). Often/always organic eaters had a lower BMI compared to seldom/never (24.0 vs. 26.5 kg/m2, p = 0.002). Often/always organic eaters also had a higher median HEI (calculated for all available recalls) of 67.0 compared to 58.9 in those who seldom or never ate organic food (p < 0.001) and ate at fast food restaurants less often (37.5% vs. 60.2% had fast food once or more per month, p = 0.007). Other characteristics (age, race/ethnicity, estimated household income, physical activity level, smoking status, and drinking water source) were not significantly associated with organic eating habits.
Of the major food groups, seldom/never organic eaters consumed less fruit, more grains (particularly refined grains), and more meat and poultry compared to often/always organic eaters (Table 2). Most of the specific foods and beverages examined were consumed relatively infrequently, with the exception of eggs, nuts and seeds, and coffee, which were each reported on more than half of the dietary recalls (Table 2). Legumes were consumed on 29.0% of recalls completed by those who often or always ate organic food compared to 16.7% completed by those who seldom or never did (p = 0.01). However, seldom/never organic eaters reported consuming significantly less alcohol, particularly wine, compared to the other two categories of organic eating. Overall, 31.0% of recalls reported drinking alcoholic beverages, with 22.4% consuming wine, but only 24.4% of recalls completed by seldom/never organic eaters reported drinking any alcohol and 15.0% drank wine.
Table 2.
Dietary recall characteristics, overall and stratified by self-reported overall organic eating frequency.
| Overall N = 567 | Self-Reported Organic Eating Frequency | p | |||
|---|---|---|---|---|---|
| Seldom/Never N = 180 (31.7%) | Sometimes N = 177 (31.2%) | Often/Always N = 210 (37.0%) | |||
| Median (Q1, Q3) | Median (Q1, Q3) | Median (Q1, Q3) | Median (Q1, Q3) | ||
| Kcal | 1653 (1301, 2100) | 1699 (1360, 2133) | 1644 (1252, 2152) | 1631 (1293, 2010) | 0.18 |
| Major Food Groups | |||||
| Fruit (cup equivalents) | 0.7 (0.0, 1.7) | 0.5 (0.0, 1.2) | 0.8 (0.1, 1.7) | 0.8 (0.1, 1.7) | 0.005 |
| Vegetables (cup equivalents) | 1.6 (0.8, 2.8) | 1.4 (0.7, 2.8) | 1.6 (0.7, 2.7) | 1.8 (1.0, 2.8) | 0.08 |
| Grains (ounce equivalents) | 4.1 (2.4, 6.0) | 4.6 (2.9, 6.9) | 4.0 (2.3, 5.9) | 3.8 (2.0, 5.5) | 0.003 |
| Whole Grains (ounce equivalents) | 0.5 (0.0, 1.6) | 0.5 (0.0, 1.7) | 0.4 (0.0, 1.4) | 0.5 (0.0, 1.6) | 0.26 |
| Refined Grains (ounce equivalents) | 3.0 (1.5, 5.0) | 3.6 (1.9, 5.7) | 3.1 (1.6, 5.0) | 2.5 (1.1, 4.3) | 0.002 |
| Protein Foods (ounce equivalents) | 5.3 (2.9, 8.0) | 5.8 (3.0, 8.9) | 5.2 (3.1, 7.6) | 5.0 (2.5, 7.8) | 0.10 |
| Meat and Poultry (ounce equivalents) | 2.3 (0.1, 4.7) | 2.8 (1.0, 5.5) | 2.0 (0.0, 4.3) | 1.9 (0.0, 4.1) | 0.002 |
| Dairy (cup equivalents) | 1.0 (0.4, 1.8) | 1.1 (0.4, 2.0) | 1.0 (0.4, 1.6) | 1.1 (0.4, 1.8) | 0.27 |
| Selected Foods and Beverages (Yes/No) | N (%) | N (%) | N (%) | N (%) | |
| Legumes | 136 (24.0%) | 30 (16.7%) | 45 (25.4%) | 61 (29.0%) | 0.01 |
| Corn | 165 (29.1%) | 49 (27.2%) | 52 (29.4%) | 64 (30.5%) | 0.78 |
| Oats | 119 (21.0%) | 44 (24.4%) | 35 (19.8%) | 40 (19.0%) | 0.39 |
| Eggs | 410 (72.3%) | 133 (73.9%) | 127 (71.8%) | 150 (71.4%) | 0.85 |
| Soy Protein | 100 (17.6%) | 36 (20.0%) | 27 (15.3%) | 37 (17.6%) | 0.51 |
| Soy Protein, Soy Milk, and Other Soy Foods | 171 (30.2%) | 54 (30.0%) | 56 (31.6%) | 61 (29.0%) | 0.86 |
| Nuts and Seeds | 331 (58.4%) | 100 (55.6%) | 101 (57.1%) | 130 (61.9%) | 0.40 |
| Coffee | 372 (65.6%) | 112 (62.2%) | 116 (65.5%) | 144 (68.6%) | 0.43 |
| Tea | 179 (31.6%) | 52 (28.9%) | 60 (33.9%) | 67 (31.9%) | 0.60 |
| Alcohol | 176 (31.0%) | 44 (24.4%) | 66 (37.3%) | 66 (31.4%) | 0.03 |
| Wine | 127 (22.4%) | 27 (15.0%) | 48 (27.1%) | 52 (24.8%) | 0.006 |
| Spirits | 37 (6.5%) | 13 (7.2%) | 14 (7.9%) | 10 (4.8%) | 0.39 |
| Beer | 32 (5.6%) | 8 (4.4%) | 12 (6.8%) | 12 (5.7%) | 0.62 |
P-values for differences between organic eating categories from Fisher’s exact test (categorical variables) or Kruskal-Wallis test (continuous variables). Kcal: kilocalories.
Nearly all urine samples (89.9%) had detectable glyphosate, and 67.2% had detectable AMPA (Table 3). Most samples had values above the LOQ for both analytes (76.4% for glyphosate and 50.4% for AMPA). The median concentrations were 0.10 and 0.04 ng/mL for glyphosate and AMPA, respectively, with a maximum of 3.01 ng/mL for glyphosate and 1.51 ng/mL for AMPA. For both glyphosate and AMPA, the median concentration in ng/mL was slightly but significantly greater in seldom/never organic eaters (p = 0.04 for glyphosate, p = 0.01 for AMPA) (Table 3, Fig. 2). The within-sample correlation between glyphosate and AMPA measurements was r = 0.45 (95% CI 0.38 to 0.51, p < 0.0001).
Table 3.
Urinary glyphosate and AMPA measurements (unadjusted for creatinine), overall and stratified by self-reported organic eating frequency.
| Overall N = 567 | Self-Reported Organic Eating Frequency | p | |||||
|---|---|---|---|---|---|---|---|
| Seldom/Never N = 180 (31.7%) | Sometimes N = 177 (31.2%) | Often/Always N = 210 (37.0%) | |||||
| Value (ng/mL) Median (Q1, Q3) | ≥LOD N (%) | ≥LOQ N (%) | Value (ng/mL) Median (Q1, Q3) | Value (ng/mL) Median (Q1, Q3) | Value (ng/mL) Median (Q1, Q3) | ||
| Glyphosate | 0.10 (0.04, 0.25) | 510 (89.9%) | 433 (76.4%) | 0.13 (0.06, 0.27) | 0.10 (0.04, 0.27) | 0.09 (0.04, 0.22) | 0.04 |
| AMPA | 0.04 (<LOD, 0.11) | 381 (67.2%) | 286 (50.4%) | 0.05 (<LOD, 0.14) | 0.04 (<LOD, 0.12) | 0.03 (<LOD, 0.08) | 0.01 |
P-values from Kruskal-Wallis test between organic eating categories. AMPA: aminomethylphosphonic acid.
Fig. 2.
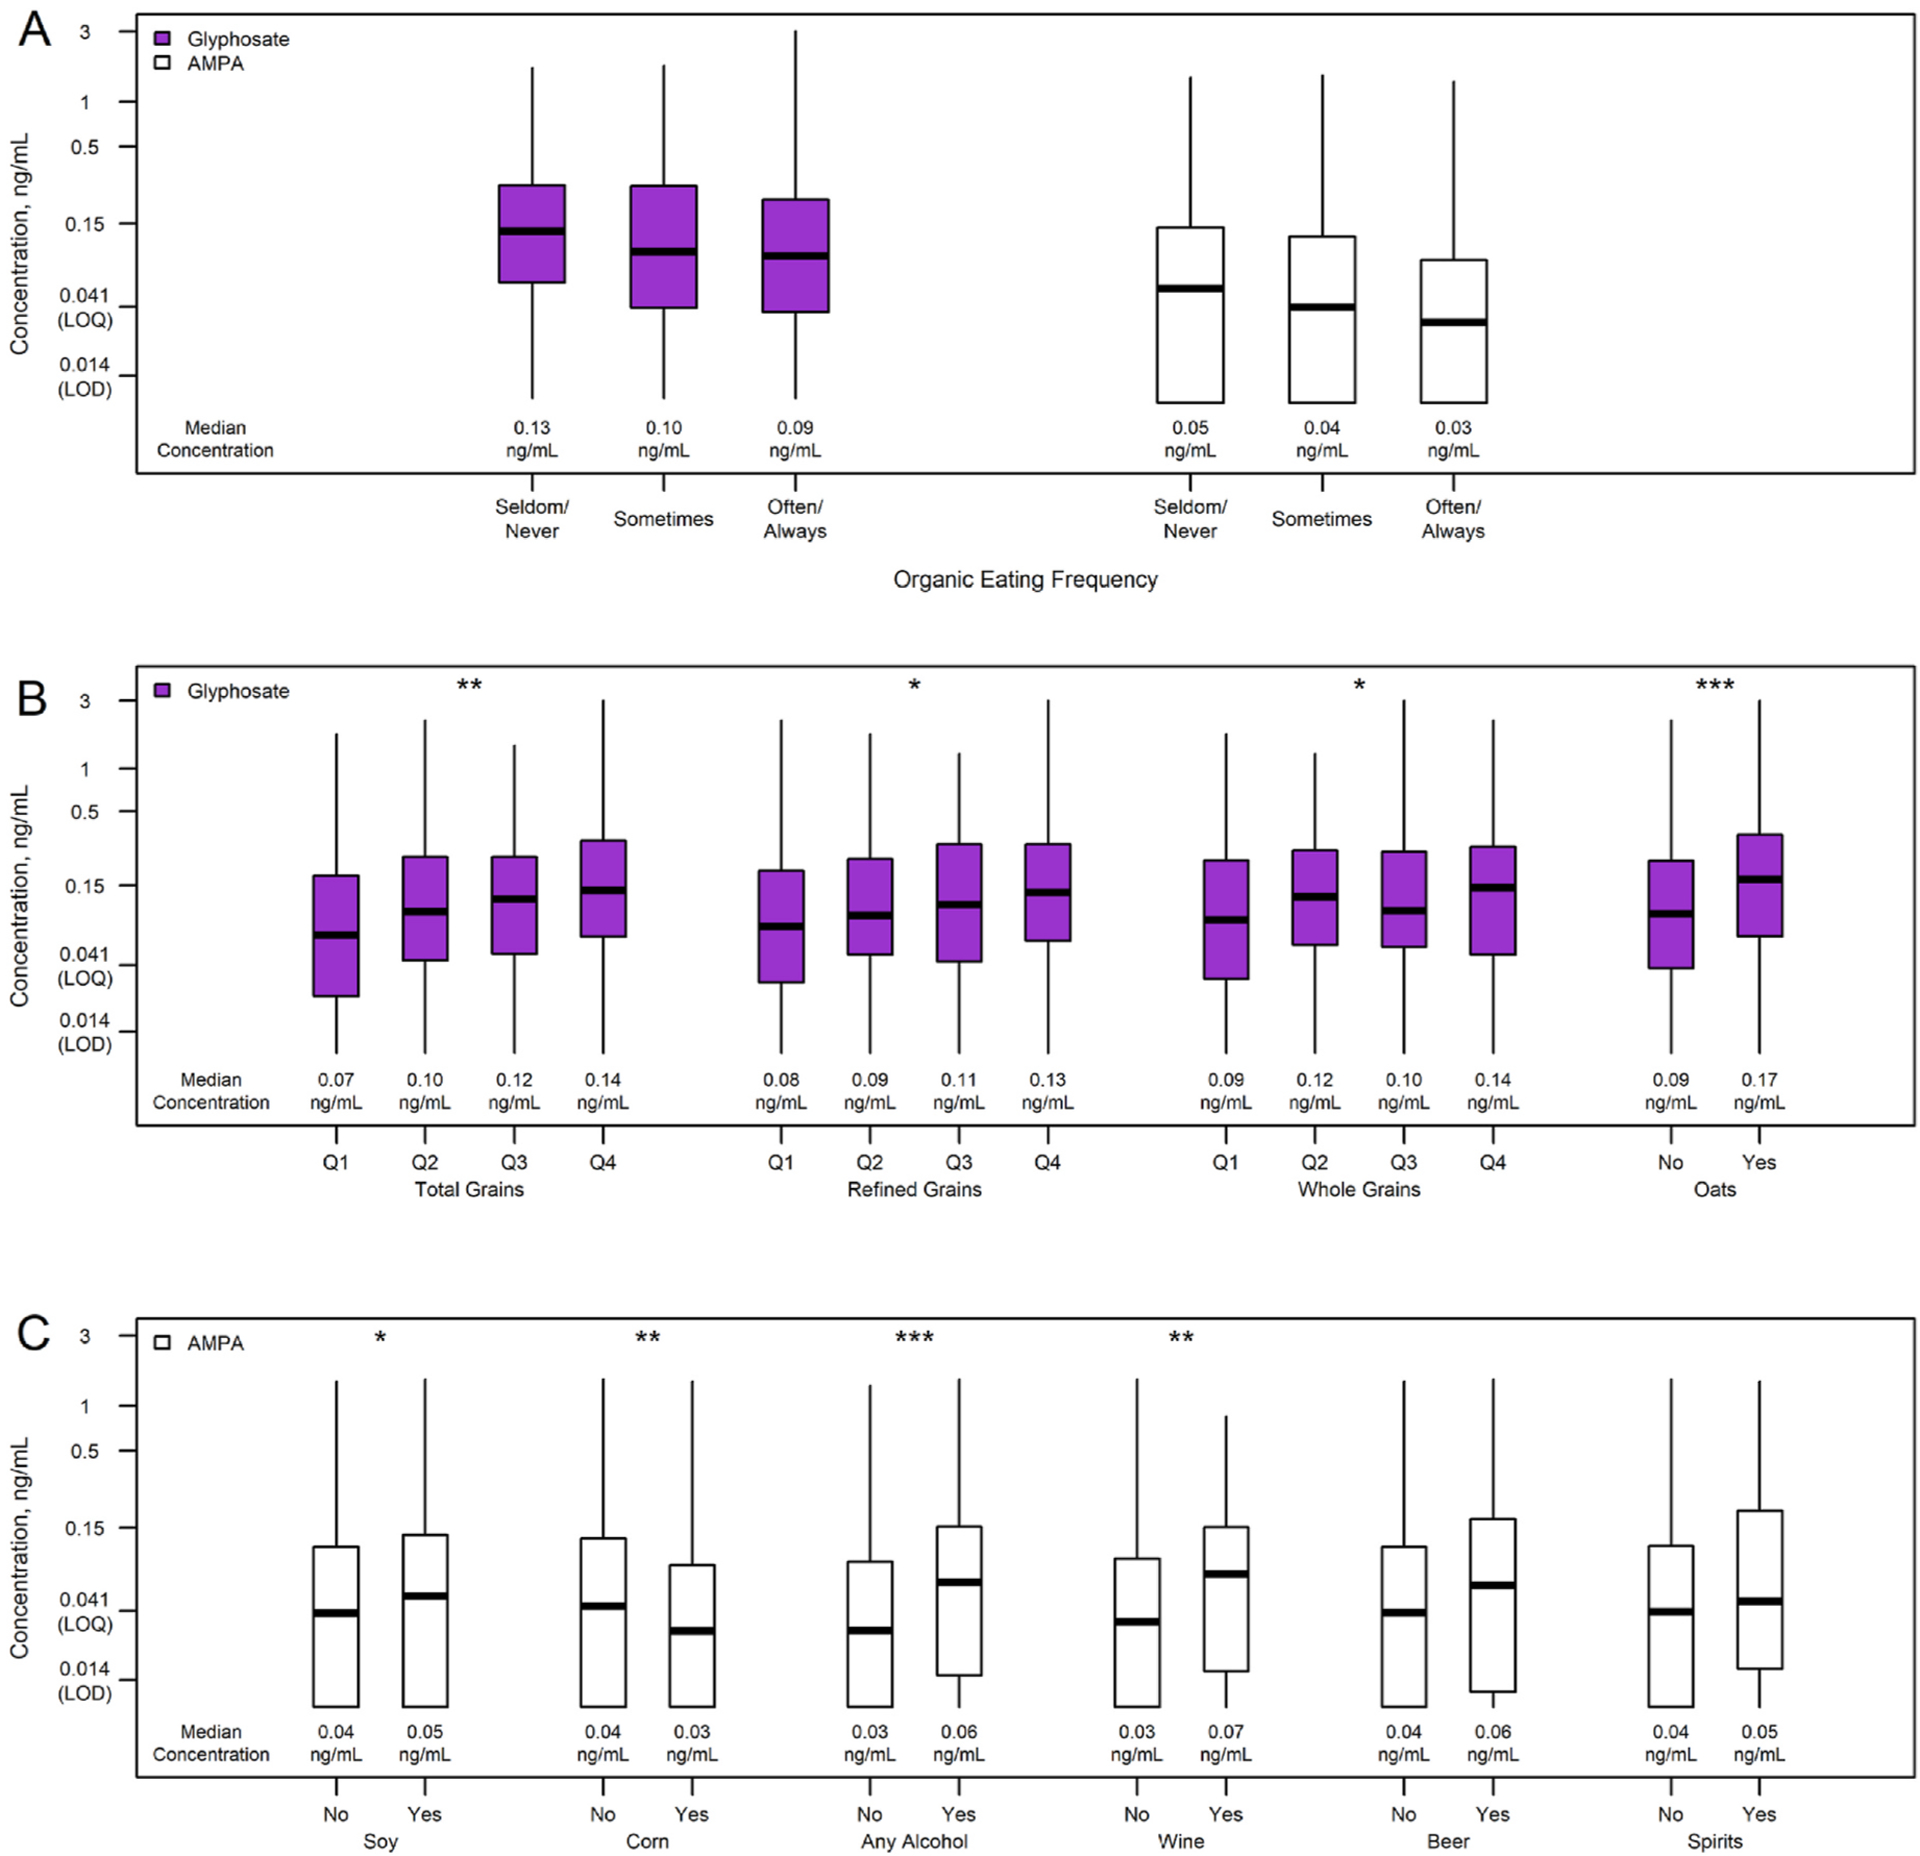
Urinary glyphosate and/or AMPA concentrations for selected categories
A) Self-reported organic eating frequency, B) grain consumption, C) soy, corn, and alcohol consumption. Asterisks indicate statistical significance when adjusted for urinary creatinine, total Kcal, recall-specific Healthy Eating Index (HEI), race/ethnicity, and physical activity level: *p < 0.05, **p < 0.01, ***p < 0.001. AMPA: aminomethylphosphonic acid. The 25th percentile for some categories was the LOD (no lower tails).
Results were generally consistent between the base and adjusted models (Table 4 for dietary recall-level characteristics, Supplemental Table 2 for individual-level characteristics). A model adjusted for just creatinine and dietary pattern also showed similar results (data not shown). Grain, particularly refined grains, and specifically oat consumption were associated with higher urinary glyphosate levels (Table 4, Fig. 2). Urinary glyphosate levels were 14% higher for every quartile increase in grain consumption (adjusted p = 0.004) and 55% higher for every quartile increase in oat consumption (adjusted p < 0.001). Meat/poultry consumption was negatively associated with glyphosate levels (adjusted p = 0.01, Table 4). Women who reported doing 150 min or more of moderate-intensity exercise per week had lower urinary glyphosate (adjusted p = 0.04, Supplemental Table 2). No other dietary, demographic, or behavioral factors were significantly associated with urinary glyphosate. When stratified by food-group-specific organic eating frequencies, total grain consumption remained associated with elevated glyphosate in both often/always and seldom/never organic grain eaters (Supplemental Table 3).
Table 4.
Association of dietary characteristics with urinary glyphosate and AMPA levels.
| Glyphosate | AMPA | |||||||
|---|---|---|---|---|---|---|---|---|
| Base model | Adjusted model | Base model | Adjusted model | |||||
| Relative difference (95% CI) | p | Relative difference (95% CI) | p | Relative difference (95% CI) | p | Relative difference (95% CI) | p | |
| Major Food Groups (Quartile) | ||||||||
| Fruit | 0.94 (0.86, 1.02) | 0.14 | 0.93 (0.85, 1.02) | 0.14 | 0.89 (0.81, 0.98) | 0.02 | 0.89 (0.80, 0.99) | 0.03 |
| Vegetables | 0.95 (0.87, 1.03) | 0.23 | 0.94 (0.86, 1.03) | 0.21 | 0.98 (0.89, 1.08) | 0.71 | 0.97 (0.88, 1.07) | 0.54 |
| Grains | 1.14 (1.05, 1.24) | 0.002 | 1.15 (1.05, 1.26) | 0.004 | 1.13 (1.03, 1.24) | 0.01 | 1.07 (0.96, 1.18) | 0.24 |
| Whole Grains | 1.08 (1.00, 1.17) | 0.06 | 1.11 (1.01, 1.21) | 0.02 | 0.98 (0.90, 1.07) | 0.62 | 0.99 (0.89, 1.09) | 0.78 |
| Refined Grains | 1.11 (1.03, 1.21) | 0.01 | 1.12 (1.02, 1.24) | 0.02 | 1.17 (1.06, 1.28) | 0.001 | 1.11 (1.00, 1.24) | 0.06 |
| Protein Foods | 0.95 (0.87, 1.03) | 0.18 | 0.91 (0.84, 1.00) | 0.04 | 1.08 (0.99, 1.19) | 0.10 | 1.05 (0.95, 1.16) | 0.36 |
| Meat and Poultry | 0.92 (0.85, 1.01) | 0.07 | 0.89 (0.82, 0.97) | 0.01 | 1.03 (0.94, 1.13) | 0.51 | 0.98 (0.88, 1.08) | 0.65 |
| Dairy | 0.98 (0.90, 1.07) | 0.70 | 0.96 (0.88, 1.05) | 0.37 | 0.96 (0.88, 1.06) | 0.42 | 0.92 (0.83, 1.02) | 0.11 |
| Other Foods and Beverages (Yes/No) | ||||||||
| Legumes | 1.20 (0.97, 1.47) | 0.09 | 1.23 (0.99, 1.52) | 0.06 | 0.94 (0.74, 1.20) | 0.63 | 0.95 (0.74, 1.21) | 0.65 |
| Corn | 0.99 (0.81, 1.20) | 0.88 | 0.95 (0.78, 1.16) | 0.63 | 0.77 (0.61, 0.96) | 0.02 | 0.73 (0.58, 0.92) | 0.008 |
| Oats | 1.44 (1.14, 1.83) | 0.003 | 1.55 (1.21, 1.97) | <0.001 | 1.05 (0.81, 1.37) | 0.70 | 1.11 (0.85, 1.46) | 0.44 |
| Eggs | 1.00 (0.83, 1.22) | 0.97 | 0.98 (0.80, 1.19) | 0.81 | 1.04 (0.83, 1.31) | 0.72 | 0.98 (0.78, 1.23) | 0.86 |
| Soy Protein | 1.02 (0.80, 1.30) | 0.88 | 1.02 (0.80, 1.30) | 0.85 | 1.34 (1.02, 1.76) | 0.04 | 1.37 (1.05, 1.80) | 0.02 |
| Soy Protein, Milk, Other Soy Foods | 0.94 (0.77, 1.15) | 0.56 | 0.96 (0.79, 1.17) | 0.67 | 1.11 (0.89, 1.39) | 0.36 | 1.12 (0.89, 1.41) | 0.32 |
| Nuts and Seeds | 1.17 (0.97, 1.40) | 0.10 | 1.19 (0.98, 1.44) | 0.08 | 1.02 (0.83, 1.26) | 0.85 | 1.04 (0.83, 1.30) | 0.75 |
| Coffee | 1.04 (0.83, 1.29) | 0.73 | 1.00 (0.80, 1.25) | 0.99 | 0.99 (0.79, 1.26) | 0.95 | 0.97 (0.77, 1.23) | 0.80 |
| Tea | 0.94 (0.77, 1.17) | 0.60 | 0.95 (0.77, 1.18) | 0.65 | 1.06 (0.84, 1.34) | 0.61 | 1.07 (0.85, 1.35) | 0.56 |
| Alcohol | 0.99 (0.80, 1.23) | 0.92 | 0.97 (0.77, 1.21) | 0.76 | 1.56 (1.23, 1.97) | <0.001 | 1.59 (1.25, 2.02) | <0.001 |
| Wine | 1.00 (0.79, 1.27) | 0.97 | 0.99 (0.78, 1.26) | 0.95 | 1.51 (1.17, 1.95) | 0.002 | 1.55 (1.20, 2.01) | 0.001 |
| Beer | 0.87 (0.58, 1.29) | 0.48 | 0.82 (0.55, 1.23) | 0.34 | 1.35 (0.86, 2.12) | 0.19 | 1.29 (0.83, 2.03) | 0.26 |
| Spirits | 1.00 (0.68, 1.45) | 0.99 | 0.98 (0.67, 1.43) | 0.91 | 1.21 (0.79, 1.85) | 0.38 | 1.18 (0.77, 1.81) | 0.45 |
| Dietary Pattern | ||||||||
| HEI (for individual dietary recall) | 1.00 (0.99, 1.01) | 0.58 | 1.00 (0.99, 1.01) | 0.75 | 0.99 (0.99, 1.00) | 0.15 | 0.99 (0.99, 1.00) | 0.15 |
Base model adjusted for urinary creatinine with a random effect for individual; adjusted model additionally adjusted for total kilocalories, recall-specific Healthy Eating Index (HEI), race/ethnicity, and physical activity level. AMPA: aminomethylphosphonic acid.
Fruit and corn consumption were associated with lower AMPA levels (Table 4, Fig. 2). Urinary AMPA levels were 11% lower for every quartile increase in fruit consumption (adjusted p = 0.03) and 27% lower for every quartile increase in corn consumption (adjusted p = 0.008). Total grains and refined grains were positively associated with AMPA, but not after adjustment for race/ethnicity, physical activity, and dietary pattern. Consumption of soy protein was significantly associated with elevated AMPA, with 37% higher levels for every quartile increase in soy protein consumption (adjusted p = 0.02, Table 4, Fig. 2), but this relationship was attenuated when other forms of soy (such as soy milk and soy sauce) were included (adjusted p = 0.32). Women who reported consuming alcohol on the day of the dietary recall had higher AMPA levels even after adjusting for dietary pattern, race/ethnicity, and physical activity (adjusted p < 0.001, Table 4, Fig. 2). In particular, urinary AMPA levels were 56% higher for every quartile increase in wine consumption (p = 0.001). Women who were not of white, Asian, or Hispanic race/ethnicity had significantly lower AMPA levels (adjusted p = 0.02, Supplemental Table 2), although there were only 16 women in this group. Dining at fast food restaurants 4 or more times per week was associated with elevated AMPA (adjusted p = 0.006, Supplemental Table 2). No major food groups were significantly associated with AMPA levels in the organic-eating-stratified analysis (Supplemental Table 3).
After adjusting for creatinine, dietary pattern, race/ethnicity, and physical activity, self-reported organic eating was no longer significantly associated with either glyphosate or AMPA, although concentrations of both analytes were non-significantly higher in those who reported seldom or never eating organic food (Supplemental Table 2).
The sensitivity analysis excluding potentially problematic recalls was generally consistent with the main results (Supplemental Table 4). The relationships between glyphosate concentration and physical activity and between AMPA concentration and fruit and soy protein consumption were suggestive but no longer statistically significant (p > 0.05 but <0.1 for all 3 relationships). All other variables that were significantly associated with glyphosate or AMPA in the main results remained statistically significant in the sensitivity analysis. Additionally, adjusting for self-reported organic food consumption frequency did not materially change the results (data not shown).
4. Discussion
This is the first study to relate organic eating behavior, dietary recall data, and measurement of urinary glyphosate and AMPA in humans. We found that more than half of our study participants ate organic food at least sometimes and that the frequency of organic food consumption was higher for fruit, vegetables, and eggs compared to grains, meat, and dairy. In light of our finding that urinary glyphosate levels were associated with grain consumption, even among those who reported often/always eating organic grains, our data suggest that individuals who eat high levels of grains and wish to minimize their glyphosate exposure may need to limit their grain consumption to exclusively organic grains. We also observed that consuming alcohol (particularly wine) and soy protein were associated with higher AMPA concentrations, while fruit and corn consumption were associated with lower AMPA. These findings were robust to adjustment for dietary pattern and other factors associated with glyphosate and AMPA concentrations.
These results suggest the most likely sources of glyphosate and AMPA in the American diet and broadly agree with the few previous analogous studies done in other countries. Studies in Germany (Soukup et al., 2020) and Slovenia (Stajnko et al., 2020) showed positive relationships between glyphosate levels and the consumption of pulses, nuts, and brown rice. In our study, glyphosate levels were higher among those who had consumed legumes and nuts/seeds on the day before providing their urine sample, although this association was just over the statistical significance threshold (p = 0.06 for legumes and 0.08 for nuts/seeds). We did not examine rice separate from other grains due to limitations of the study instrument, but our finding of elevated glyphosate in those who consumed more grains is consistent with these results and results from a recent study done in Canada, which found a dose-response relationship between consumption of whole grain bread and higher urinary glyphosate concentrations (Ashley-Martin et al., 2023). Compared to these studies, a larger proportion of our study cohort had quantifiable levels of both analytes, likely due to several factors. First, our assay was more sensitive (LOD of 0.014 ng/mL for glyphosate and 0.013 ng/mL for AMPA compared to >0.05 ng/mL in the other studies). Also, dietary habits and the presence of glyphosate and/or AMPA in the food supply likely differ between European, Canadian, and American populations. The only studies to examine dietary factors associated with urinary glyphosate or AMPA in the U.S. found associations between urinary glyphosate and consumption of tea (John and Liu, 2018), caffeinated beverages (Parvez et al., 2018), and cereal (Ospina et al., 2022), the last of which was done in NHANES, a large representative cohort (N = 2310) and is consistent with our finding that urinary glyphosate is associated with grain intake. The sample sizes for the other two studies were small (N = 36 and N = 77, respectively), and the study populations (undergraduate students and pregnant women) were markedly different from our cohort of postmenopausal women.
The glyphosate levels observed in our cohort [median 0.10 ng/mL (IQRs 0.04, 0.25)] were higher than those observed in a multi-site biomonitoring study in the European Union (EU) on 913 individuals (median values were below their LOQs of 0.05–0.1 ng/mL) (Rocha et al., 2022) but lower than those in the NHANES study [median for women was 0.379 ng/mL (95% CI 0.347–0.418)] (Ospina et al., 2022). The AMPA levels observed in our cohort [median 0.04 ng/mL (IQRs < LOD, 0.11)] were comparable to levels observed in the EU study since the median values for three of the EU sites were below their LOQs of 0.1 ng/mL and was 0.1 ng/mL their remaining site, which had an LOQ of 0.05 ng/mL. AMPA was not measured in the NHANES study. While our measurements were averaged from two first-morning void urine collections, measurements from the NHANES study were from one spot urine sample which was not necessarily a first-morning void, and measurements from the EU study were from either a spot urine or first-morning void urine.
Those who reported to be frequent organic food consumers had a higher level of educational attainment, lower BMI, and consumed less fast food compared to those who infrequently ate organic food. Frequent organic eaters also adhered more closely to U.S. nutritional guidelines, consuming more fruit and legumes and less grains and meat, although they were also more likely to drink alcohol. These results complement previous research describing characteristics associated with more frequent organic eating (Sun et al., 2018; Curl et al., 2013; Petersen et al., 2013; Baudry et al., 2017; Eisinger-Watzl et al., 2015). Our results did not show a statistically significant correlation between organic eating frequency and estimated household income; however, a trend suggestive of a positive correlation was present (p = 0.11), which is consistent with findings observed in a large multi-site U.S. study (Curl et al., 2013). It is possible that, with a more accurate measure of household income or with a larger sample size, the correlation observed in our study may have achieved statistical significance.
Previous data is mixed regarding the relationship between organic food consumption and glyphosate concentrations, with some observational studies showing no statistically significant relationship between self-reported organic eating behaviors and glyphosate levels (Parvez et al., 2018; Mcguire et al., 2016). However, a small dietary intervention study showed a decrease in median urinary glyphosate from 0.51 to 0.12 ng/mL after 5 days of a completely organic diet (Fagan et al., 2020). In our study, we saw a more modest, but statistically significant, difference between those who reported often/always eating organic food compared to seldom/never (median glyphosate of 0.09 ng/mL vs. 0.13 ng/mL, respectively, p = 0.04). However, this relationship was no longer statistically significant after adjusting for dietary pattern and demographic/behavioral variables, suggesting that characteristics of individuals who frequently consume organic food may be a source of the inconsistency between observational and experimental data. Given the strong relationship between grain consumption and glyphosate levels that we observed, at least some of the elevated glyphosate levels in seldom/never organic consumers may be explained by increased consumption of glyphosate-rich grains. Additionally, typical dietary habits and purchasing behaviors will likely differ in the real world compared to a controlled experimental setting, likely attenuating relationships between organic eating and glyphosate levels. Our finding that glyphosate levels were associated with grain consumption even among those who reported often/always for organic grain consumption strengthen the concept of grains as a significant source of glyphosate exposure considering a real-world situation in which most individuals who self-report often/always consuming organic grains do still consume some non-organic grains. Another explanation for this observation is that some crops that are grown using organic practices and thus labeled as “USDA Organic” may still contain glyphosate from neighboring (non-organic) farms due to agricultural drift (Kolakowski et al., 2020; Cederlund, 2017; Strandberg et al., 1987; Zaller et al., 2022).
Different dietary factors were associated with glyphosate vs. AMPA in our study, suggesting distinct sources of exposure. Humans are not known to possess the necessary enzymes to metabolize glyphosate, so AMPA excreted by humans is thought to derive primarily from direct consumption of food contaminated with AMPA. There is also evidence that species of the gut microbiome could convert glyphosate to AMPA (Van Eerd et al., 2003; Zhan et al., 2018), which has been observed in rats (Anadón et al., 2009; Nielsen et al., 2018). One study in humans measured low levels of AMPA in urine after oral exposure to glyphosate, but it was unclear whether this was from glyphosate metabolism in the gut or background exposure levels (Faniband et al., 2021). Most glyphosate used in the U.S. is applied to glyphosate-resistant (GR) crops (Benbrook, 2016), which can withstand treatment with glyphosate long enough for breakdown to AMPA to occur (Duke, 2011), so these crops are expected to have higher concentrations of AMPA. In 2016, over 80% of soybeans and corn grown in the U.S. were GR varieties (Duke, 2018). The widespread adoption of glyphosate-resistant soybeans is consistent with our finding that soy protein consumption was associated with higher AMPA concentrations. Previous studies (Nandula et al., 2019; Bøhn et al., 2014; Duke, 2011; Reddy et al., 2008) as well as monitoring by the USDA and FDA (United States Food and Drug Administration, 2017; United States Department of Agriculture Agricultural Marketing Service, 2013) have identified glyphosate and AMPA residues in soybean crops. However, the opposite of the expected effect was seen for corn: those who consumed corn had significantly lower AMPA levels. The cause of this inverse relationship is unclear; however, studies found that, while glyphosate and AMPA were found on the leaves of glyphosate-treated corn plants, little or no glyphosate and no AMPA was found in the seeds, which is the part of the corn that humans usually consume (Reddy et al., 2008, 2018). Another possible explanation for our finding is that consumption of corn displaced consumption of more AMPA-rich foods, such as wheat and other cereals.
Glyphosate is widely used as a pre-harvest desiccant on non-corn grain crops, including wheat and oats (Benbrook, 2016), which likely explains the higher glyphosate concentrations in women who ate more grains. AMPA was also elevated in frequent grain consumers in our study, but this relationship was attenuated after adjustment for dietary, demographic, and behavioral factors. In addition to the frequent detection of glyphosate in samples of cereal crops, AMPA has also been detected, although levels of both were almost always below maximum residue levels (MRLs) permitted by regulatory agencies (Kolakowski et al., 2020; Zoller et al., 2018; Xu et al., 2019). A Canadian study detected glyphosate, but not AMPA, in wheat samples and determined that it survives the milling and baking process; concentrations were higher in whole-grain flour (Tittlemier et al., 2021). Although the use of glyphosate is prohibited on organic crops, participants who consumed more grains and reported often or always eating organic grains still had elevated glyphosate concentrations, suggesting either incomplete avoidance of conventional grains or the presence of glyphosate in organic grains. One study detected glyphosate in 25% of organic food products compared to 49% of conventional products in Canada, mostly at low concentrations consistent with drift from nearby conventional fields (Kolakowski et al., 2020; Cederlund, 2017; Strandberg et al., 1987; Zaller et al., 2022).
Despite consumer concerns over pesticide contamination in produce, we did not observe an elevated level of glyphosate or AMPA associated with fruit or vegetable consumption. In fact, there was an inverse relationship between total fruit consumption and AMPA levels. Given that less than 2% of the glyphosate applied to U.S. crops is used on fruit and vegetable acreage (Benbrook, 2016), this relationship may be due to fruit replacing foods higher in AMPA in the diet. A similar cause could explain the inverse relationship between glyphosate levels and meat consumption; glyphosate is infrequently detected in meat (United States Food and Drug Administration, 2017; Zoller et al., 2018). Another possible explanation may involve the gut microbiome. One study found that some species of gut bacteria possess C–P lyase, which is responsible for the degradation of AMPA (Mesnage and Antoniou, 2020), and fruit consumption can influence the makeup of the gut microbiome (Klinder et al., 2016). Additionally, those who reported often or always eating organic food consumed more fruit in our cohort, although analyses adjusted for organic eating habits showed the same results.
There was a strong relationship between alcohol consumption, particularly wine, and AMPA levels, which is especially interesting given the observation that those who reported seldom or never eating organic food also consumed less alcohol. Glyphosate is used in grape cultivation for weed management; in 2012, 43% of grape acres in the U.S. were treated with glyphosate (Benbrook, 2016). Few studies have examined wine for glyphosate or AMPA residues. One Swiss study detected glyphosate in 100% and AMPA in 19% of wine samples tested, but at very low concentrations (Zoller et al., 2018). Testing by the U.S. Public Interest Research Group (PIRG) detected glyphosate in all 5 samples of wines tested (Cook, 2019). If glyphosate is present in wine, the microbial activity which drives the fermentation process could metabolize some into AMPA, but evidence for this is limited. One study observed degradation of glyphosate by brewer’s yeast (S. cerevisiae) but did not confirm that AMPA was the product (Low et al., 2005). Further research is needed to determine the presence of AMPA in wine and other alcoholic beverages in the U.S. market.
This study has several notable strengths. First, the 24-h dietary recalls were paired to first-morning void urine samples provided the following morning, which allowed for a relatively accurate assessment of dietary exposures most likely to influence glyphosate/AMPA levels given their short half-lives. With that said, first-morning void collections were likely more reflective of dietary exposures from the later part of the previous day versus the earlier part of the day. In addition, most participants provided two paired urine samples/dietary recalls, which provides a more accurate representation of typical diet habits compared to a single sample. We also asked detailed questions about usual organic eating behaviors, including for specific food groups. Our study is the first to report on urinary AMPA levels and the diet in the U.S.
Limitations include that participants did not report the organic status of the specific food items that they reported on the dietary recalls, so it is impossible to know whether the two 24-h dietary intakes were reflective of their self-reported usual organic eating behaviors. Additionally, our study cohort was relatively homogeneous with respect to age, sex, and place of residence, which may limit generalizability of the results to other populations.
In conclusion, in the largest study to date linking individuals’ dietary recall data with urinary glyphosate and AMPA, our data suggest that the most significant dietary sources of glyphosate in the American diet are grains, whereas the most significant sources of AMPA are soy, wine, and fast food. Individuals who wish to minimize glyphosate and AMPA exposure may be able to do so by avoiding non-organic versions of these foods or avoiding these foods entirely, since organic foods may still contain (albeit likely lower levels of) glyphosate and AMPA.
Supplementary Material
Acknowledgements
The authors would like to thank our patient advocates (Vivian Lee, Diane Heditsian, and Susie Brain) as well as our undergraduate students (Kailynn Yang, Daphne Thampy, Amanda Hidajat, and Melodie Elyasian) for supporting this study. We also thank our study participants and the Athena Breast Health Network for support of this study.
Funding
This work was supported by funds from the California Breast Cancer Research Grants Program Office of the University of California, Grant Number 22UB-2311. Support of the Athena Breast Health Network was provided by the Safeway Foundation, University of California Office of the President (UCOP), and Salesforce. This reported research includes work performed in the Integrated Mass Spectrometry Shared Resource core supported by the National Cancer Institute (NCI) of the National Institutes of Health (NIH) under grant number P30CA033572 and in the Chao Family Comprehensive Cancer Center Biorepository Shared Resource supported by the NCI under grant number P30CA062203 (Cancer Center Support Grant). The content is solely the responsibility of the authors and does not necessarily represent the official views of the National Institutes of Health. The study funders had no role in the study design, analysis, or interpretation of the data, or the writing of the manuscript.
Abbreviations:
- AMPA
aminomethylphosphonic acid
- BMI
body mass index
- HEI
Healthy Eating Index
- Kcal
kilocalorie
- LOD
limit of detection
- LOQ
limit of quantification
Footnotes
Ethics approval and consent to participate
All participants provided informed consent to participate in the study and the study protocol was approved by the University of California, Irvine Institutional Review Board, HS #2016–3127.
Declaration of competing interest
The authors declare that they have no competing interests.
Appendix A. Supplementary data
Supplementary data to this article can be found online at https://doi.org/10.1016/j.ijheh.2023.114211.
Availability of data and materials
The datasets analyzed in this study are available from the corresponding author upon reasonable request.
References
- Anadón A, Martínez-Larrañaga MR, Martínez MA, et al. , 2009. Toxicokinetics of glyphosate and its metabolite aminomethyl phosphonic acid in rats. Toxicol. Lett 190 (1), 91–95. 10.1016/j.toxlet.2009.07.008. [DOI] [PubMed] [Google Scholar]
- Ashley-Martin J, Huang R, MacPherson S, et al. , 2023. Urinary concentrations and determinants of glyphosate and glufosinate in pregnant Canadian participants in the MIREC study. Environ. Res 217. 10.1016/J.ENVRES.2022.114842. [DOI] [PubMed] [Google Scholar]
- Bai SH, Ogbourne SM, 2016. Glyphosate: environmental contamination, toxicity and potential risks to human health via food contamination. Environ. Sci. Pollut. Res 23 (19), 18988–19001. 10.1007/s11356-016-7425-3. [DOI] [PubMed] [Google Scholar]
- Baudry J, Méjean C, Allès B, et al. , 2015. Contribution of organic food to the diet in a large sample of French adults (the NutriNet-santé cohort study). Nutrients 7 (10), 8615. 10.3390/NU7105417. [DOI] [PMC free article] [PubMed] [Google Scholar]
- Baudry J, Allès B, Péneau S, et al. , 2017. Dietary intakes and diet quality according to levels of organic food consumption by French adults: cross-sectional findings from the NutriNet-Santé Cohort Study. Publ. Health Nutr 20 (4), 638–648. 10.1017/S1368980016002718. [DOI] [PMC free article] [PubMed] [Google Scholar]
- Benbrook CM, 2016. Trends in glyphosate herbicide use in the United States and globally. Environ. Sci. Eur 28 (1), 1–15. 10.1186/S12302-016-0070-0. [DOI] [PMC free article] [PubMed] [Google Scholar]
- Bøhn T, Cuhra M, Traavik T, Sanden M, Fagan J, Primicerio R, 2014. Compositional differences in soybeans on the market: glyphosate accumulates in Roundup Ready GM soybeans. Food Chem. 153, 207–215. 10.1016/J.FOODCHEM.2013.12.054. [DOI] [PubMed] [Google Scholar]
- Borggaard OK, Gimsing AL, 2008. Fate of glyphosate in soil and the possibility of leaching to ground and surface waters: a review. Pest Manag. Sci 64 (4), 441–456. 10.1002/PS.1512. [DOI] [PubMed] [Google Scholar]
- Buekers J, Remy S, Bessems J, et al. , 2022. Glyphosate and AMPA in human urine of HBM4EU aligned studies: Part A children. Toxics 10 (8). 10.3390/TOXICS10080470. [DOI] [PMC free article] [PubMed] [Google Scholar]
- Cederlund H, 2017. Effects of spray drift of glyphosate on nontarget terrestrial plants—a critical review. Environ. Toxicol. Chem 36 (11), 2879–2886. 10.1002/etc.3925. [DOI] [PubMed] [Google Scholar]
- Cessna AJ, Darwent AL, Kirkland KJ, Townley-Smith L, Harker KN, Lefkovitch LP, 2011. Residues of glyphosate and its metabolite AMPA in wheat seed and foliage following preharvest applications. Can. J. Plant Sci 74 (3), 653–661. 10.4141/CJPS94-117. [DOI] [Google Scholar]
- Connolly A, Jones K, Basinas I, et al. , 2019. Exploring the half-life of glyphosate in human urine samples. Int. J. Hyg Environ. Health 222 (2), 205–210. 10.1016/j.ijheh.2018.09.004. [DOI] [PubMed] [Google Scholar]
- Connolly A, Coggins MA, Koch HM, 2020. Human biomonitoring of glyphosate exposures: state-of-the-art and future research challenges. Toxics 8 (3). 10.3390/TOXICS8030060. [DOI] [PMC free article] [PubMed] [Google Scholar]
- Cook K. Glyphosate Pesticide in Beer and Wine: Test results and future solutions. Last modified February 21, 2019. https://pirg.org/edfund/resources/glyphosate-pesticide-in-beer-and-wine/.
- Cosemans C, Van Larebeke N, Janssen BG, et al. , 2022. Glyphosate and AMPA exposure in relation to markers of biological aging in an adult population-based study. Int. J. Hyg Environ. Health 240. 10.1016/J.IJHEH.2021.113895. [DOI] [PubMed] [Google Scholar]
- Curl CL, Beresford SAA, Hajat A, et al. , 2013. Associations of organic produce consumption with socioeconomic status and the local food environment: multi-Ethnic Study of Atherosclerosis (MESA). PLoS One 8 (7), e69778. 10.1371/journal.pone.0069778. [DOI] [PMC free article] [PubMed] [Google Scholar]
- Curl CL, Beresford SAA, Fenske RA, et al. , 2015. Estimating pesticide exposure from dietary intake and organic food choices: the Multi-Ethnic Study of Atherosclerosis (MESA). Environ. Health Perspect 123 (5), 475–483. 10.1289/ehp.1408197. [DOI] [PMC free article] [PubMed] [Google Scholar]
- Dickson-Spillmann M, Siegrist M, Keller C, 2011. Attitudes toward chemicals are associated with preference for natural food. Food Qual. Prefer 22 (1), 149–156. 10.1016/J.FOODQUAL.2010.09.001. [DOI] [Google Scholar]
- Duke SO, 2011. Glyphosate degradation in glyphosate-resistant and -susceptible crops and weeds. J. Agric. Food Chem 59 (11), 5835–5841. 10.1021/JF102704X. [DOI] [PubMed] [Google Scholar]
- Duke SO, 2018. The history and current status of glyphosate. Pest Manag. Sci 74 (5), 1027–1034. 10.1002/PS.4652. [DOI] [PubMed] [Google Scholar]
- Duke SO, Powles SB, 2008. Glyphosate: a once-in-a-century herbicide. Pest Manag. Sci 64 (4), 319–325. 10.1002/PS.1518. [DOI] [PubMed] [Google Scholar]
- Duke SO, Lydon J, Koskinen WC, Moorman TB, Chaney RL, Hammerschmidt R, 2012. Glyphosate effects on plant mineral nutrition, crop rhizosphere microbiota, and plant disease in glyphosate-resistant crops. J. Agric. Food Chem 60 (42), 10375–10397. 10.1021/JF302436U. [DOI] [PMC free article] [PubMed] [Google Scholar]
- Eaton JL, Cathey AL, Fernandez JA, et al. , 2022. The association between urinary glyphosate and aminomethyl phosphonic acid with biomarkers of oxidative stress among pregnant women in the PROTECT birth cohort study. Ecotoxicol. Environ. Saf 233, 113300 10.1016/J.ECOENV.2022.113300. [DOI] [PMC free article] [PubMed] [Google Scholar]
- Eisinger-Watzl M, Wittig F, Heuer T, Hoffmann I, 2015. Customers purchasing organic food - do they live healthier? Results of the German National Nutrition Survey II. Eur J Nutr Food Saf 5 (1), 59–71. 10.9734/EJNFS/2015/12734. [DOI] [Google Scholar]
- Emily Guo FR, Guo E, kamp L, 2014. Survey of glyphosate residues in honey, corn and soy products. J. Environ. Anal. Toxicol 5 (1), 1–8. 10.4172/2161-0525.1000249. [DOI] [Google Scholar]
- Environmental Protection Agency, 2020. Glyphosate. Interim Registration Review Decision Case Number 0178. https://www.regulations.gov/document/EPA-HQ-OPP-2009-0361-14442. [Google Scholar]
- Fagan J, Bohlen L, Patton S, Klein K, 2020. Organic diet intervention significantly reduces urinary glyphosate levels in U.S. children and adults. Environ. Res 189, 109898 10.1016/j.envres.2020.109898. [DOI] [PubMed] [Google Scholar]
- Faniband MH, Norén E, Littorin M, Lindh CH, 2021. Human experimental exposure to glyphosate and biomonitoring of young Swedish adults. Int. J. Hyg Environ. Health 231, 113657. 10.1016/j.ijheh.2020.113657. [DOI] [PubMed] [Google Scholar]
- Food and Agricultural Organization of the United Nations, 2016. Pesticide Residues in Food 2016: Joint FAO/WHO Meeting on Pesticides Residues - Report 2016. World Health Organization. https://www.fao.org/3/I6926EN/bookmarks-i6926en.pdf. [Google Scholar]
- Franke AA, Li X, Shvetsov YB, Lai JF, 1987. Pilot study on the urinary excretion of the glyphosate metabolite aminomethylphosphonic acid and breast cancer risk: the Multiethnic Cohort study. Environ Pollut Barking Essex 2021, 277. 10.1016/J.ENVPOL.2021.116848. [DOI] [PMC free article] [PubMed] [Google Scholar]
- Gaines TA, 2018. The importance of glyphosate in non-GM settings. Outlooks Pest Manag. 29 (6), 255–257. 10.1564/V29_DEC_05. [DOI] [Google Scholar]
- Gerona RR, Reiter JL, Zakharevich I, et al. , 2022. Glyphosate exposure in early pregnancy and reduced fetal growth: a prospective observational study of high-risk pregnancies. Environ Health Glob Access Sci Source 21 (1). 10.1186/S12940-022-00906-3. [DOI] [PMC free article] [PubMed] [Google Scholar]
- Gillezeau C, van Gerwen M, Shaffer RM, et al. , 2019. The evidence of human exposure to glyphosate: a review. Environ. Health 18 (1), 2. 10.1186/s12940-018-0435-5. [DOI] [PMC free article] [PubMed] [Google Scholar]
- Grandcoin A, Piel S, Baurès E, 2017. AminoMethylPhosphonic acid (AMPA) in natural waters: its sources, behavior and environmental fate. Water Res. 117, 187–197. 10.1016/J.WATRES.2017.03.055. [DOI] [PubMed] [Google Scholar]
- Grau D, Grau N, Gascuel Q, et al. , 2022. Quantifiable urine glyphosate levels detected in 99% of the French population, with higher values in men, in younger people, and in farmers. Environ. Sci. Pollut. Res. Int 29 (22), 32882–32893. 10.1007/S11356-021-18110-0. [DOI] [PMC free article] [PubMed] [Google Scholar]
- Grunert KG, 2005. Food quality and safety: consumer perception and demand. Eur. Rev. Agric. Econ 32 (3), 369–391. 10.1093/EURRAG/JBI011. [DOI] [Google Scholar]
- Hornung RW, Reed LD, 1990. Estimation of average concentration in the presence of nondetectable values. Appl. Occup. Environ. Hyg 5 (1), 46–51. 10.1080/1047322X.1990.10389587. [DOI] [Google Scholar]
- IARC Monographs, 2015. Evaluation of Five Organophosphate Insecticides and Herbicides, 112. https://www.iarc.who.int/wp-content/uploads/2018/07/MonographVolume112-1.pdf. [Google Scholar]
- Ingaramo P, Alarcón R, Muñoz-de-Toro M, Luque EH, 2020. Are glyphosate and glyphosate-based herbicides endocrine disruptors that alter female fertility? Mol. Cell. Endocrinol, 110934. 10.1016/j.mce.2020.110934. [DOI] [PubMed] [Google Scholar]
- Jayasumana C, Gunatilake S, Senanayake P, 2014. Glyphosate, hard water and nephrotoxic metals: are they the culprits behind the epidemic of chronic kidney disease of unknown etiology in Sri Lanka? Int. J. Environ. Res. Publ. Health 11 (2), 2125–2147. 10.3390/ijerph110202125. [DOI] [PMC free article] [PubMed] [Google Scholar]
- John J, Liu H, 2018. Glyphosate monitoring in water, foods, and urine reveals an association between urinary glyphosate and tea drinking: a pilot study. Int. J. Environ. Health Eng 7 (1), 2. 10.4103/IJEHE.IJEHE_5_17. [DOI] [Google Scholar]
- Kirkpatrick SI, Subar AF, Douglass D, et al. , 2014. Performance of the Automated Self-Administered 24-hour Recall relative to a measure of true intakes and to an interviewer-administered 24-h recall. Am. J. Clin. Nutr 100 (1), 233–240. 10.3945/ajcn.114.083238. [DOI] [PMC free article] [PubMed] [Google Scholar]
- Klinder A, Shen Q, Heppel S, Lovegrove J, Rowland I, Tuohy K, 2016. Impact of increasing fruit and vegetables and flavonoid intake on the human gut microbiota. Food Funct. 7 (4), 1788–1796. 10.1039/C5FO01096A. [DOI] [PubMed] [Google Scholar]
- Kolakowski BM, Miller L, Murray A, Leclair A, Bietlot H, Van De Riet JM, 2020. Analysis of glyphosate residues in foods from the Canadian retail markets between 2015 and 2017. J. Agric. Food Chem 68 (18), 5201–5211. 10.1021/acs.jafc.9b07819. [DOI] [PubMed] [Google Scholar]
- Krebs-Smith SM, Pannucci TRE, Subar AF, et al. , 2018. Update of the healthy eating index: HEI-2015. J. Acad. Nutr. Diet 118 (9), 1591–1602. 10.1016/j.jand.2018.05.021. [DOI] [PMC free article] [PubMed] [Google Scholar]
- Lesseur C, Pirrotte P, Pathak KV, et al. , 2021. Maternal urinary levels of glyphosate during pregnancy and anogenital distance in newborns in a US multicenter pregnancy cohort. Environ. Pollut 280, 117002 10.1016/J.ENVPOL.2021.117002. [DOI] [PMC free article] [PubMed] [Google Scholar]
- Low FL, Shaw IC, Gerrard JA, 2005. The effect of Saccharomyces cerevisiae on the stability of the herbicide glyphosate during bread leavening. Lett. Appl. Microbiol 40 (2), 133–137. 10.1111/J.1472-765X.2004.01633.X. [DOI] [PubMed] [Google Scholar]
- Lucia RM, Huang WL, Alvarez A, et al. , 2020. Rationale, study design, and cohort characteristics for the markers for environmental exposures (MEE) study. Int. J. Environ. Res. Publ. Health 17 (5), 1774. 10.3390/ijerph17051774. [DOI] [PMC free article] [PubMed] [Google Scholar]
- Lucia R, Huang WL, Pathak K, et al. , 2022. Association of glyphosate exposure with blood DNA methylation in a cross-sectional study of postmenopausal women. Environ. Health Perspect 130 (4), 47001. 10.1289/EHP10174. [DOI] [PMC free article] [PubMed] [Google Scholar]
- Mao Q, Manservisi F, Panzacchi S, et al. , 2018. The Ramazzini Institute 13-week pilot study on glyphosate and Roundup administered at human-equivalent dose to Sprague Dawley rats: effects on the microbiome. Environ Health Glob Access Sci Source 17 (1). 10.1186/S12940-018-0394-X. [DOI] [PMC free article] [PubMed] [Google Scholar]
- Mcguire MK, Mcguire MA, Price WJ, et al. , 2016. Glyphosate and aminomethylphosphonic acid are not detectable in human milk. Am. J. Clin. Nutr 103 (5), 1285–1290. 10.3945/ajcn.115.126854, 2016 May. [DOI] [PubMed] [Google Scholar]
- Medina-Pastor P, Triacchini G, 2020. The 2018 European Union report on pesticide residues in food. EFSA J 18 (4), 1–103. 10.2903/J.EFSA.2020.6057. [DOI] [PMC free article] [PubMed] [Google Scholar]
- Mesnage R, Antoniou M, 2020. Computational modelling provides insight into the effects of glyphosate on the shikimate pathway in the human gut microbiome. Curr Res Toxicol 1, 25–33. 10.1016/J.CRTOX.2020.04.001. [DOI] [PMC free article] [PubMed] [Google Scholar]
- Mesnage R, Renney G, Séralini GE, Ward M, Antoniou MN, 2017. Multiomics reveal non-alcoholic fatty liver disease in rats following chronic exposure to an ultra-low dose of Roundup herbicide. Sci. Rep 7, 39328. 10.1038/srep39328. [DOI] [PMC free article] [PubMed] [Google Scholar]
- Mesnage R, Teixeira M, Mandrioli D, et al. , 2021. Use of shotgun metagenomics and metabolomics to evaluate the impact of glyphosate or roundup mon 52276 on the gut microbiota and serum metabolome of sprague-dawley rats. Environ. Health Perspect 129 (1), 1–15. 10.1289/EHP6990. [DOI] [PMC free article] [PubMed] [Google Scholar]
- Mesnage R, Bowyer RCE, El Balkhi S, et al. , 2022. Impacts of dietary exposure to pesticides on faecal microbiome metabolism in adult twins. Environ Health Glob Access Sci Source 21 (1). 10.1186/S12940-022-00860-0. [DOI] [PMC free article] [PubMed] [Google Scholar]
- Mills PJ, Kania-Korwel I, Fagan J, McEvoy LK, Laughlin GA, Barrett-Connor E, 2017. Excretion of the herbicide glyphosate in older adults between 1993 and 2016. JAMA 318 (16), 1610. 10.1001/jama.2017.11726. [DOI] [PMC free article] [PubMed] [Google Scholar]
- Myers JP, Antoniou MN, Blumberg B, et al. , 2016. Concerns over use of glyphosate-based herbicides and risks associated with exposures: a consensus statement. Environ. Health 15 (1), 19. 10.1186/s12940-016-0117-0. [DOI] [PMC free article] [PubMed] [Google Scholar]
- Nandula VK, Riechers DE, Ferhatoglu Y, et al. , 2019. Herbicide metabolism: crop selectivity, bioactivation, weed resistance, and regulation. Weed Sci. 67 (2), 149–175. 10.1017/WSC.2018.88. [DOI] [Google Scholar]
- Nielsen L, Roager H, Casas M, et al. , 2018. Glyphosate has limited short-term effects on commensal bacterial community composition in the gut environment due to sufficient aromatic amino acid levels. Environ. Pollut 233, 364–376. 10.1016/J.ENVPOL.2017.10.016. [DOI] [PubMed] [Google Scholar]
- Ospina M, Schütze A, Morales-Agudelo P, Vidal M, Wong LY, Calafat AM, 2022. Exposure to glyphosate in the United States: data from the 2013–2014 national health and nutrition examination Survey. Environ. Int 170, 107620 10.1016/J.ENVINT.2022.107620. [DOI] [PMC free article] [PubMed] [Google Scholar]
- Parvez S, Gerona RR, Proctor C, et al. , 2018. Glyphosate exposure in pregnancy and shortened gestational length: a prospective Indiana birth cohort study. Environ Health Glob Access Sci Source 17 (1), 23. 10.1186/S12940-018-0367-0. [DOI] [PMC free article] [PubMed] [Google Scholar]
- Petersen SB, Rasmussen MA, Strøm M, Halldorsson TI, Olsen SF, 2013. Sociodemographic characteristics and food habits of organic consumers – a study from the Danish National Birth Cohort. Publ. Health Nutr 16 (10), 1810–1819. 10.1017/S1368980012004119. [DOI] [PMC free article] [PubMed] [Google Scholar]
- R Core Team, 2018. R: A Language and Environment for Statistical Computing. R Foundation for Statistical Computing, Vienna. https://www.R-project.org. [Google Scholar]
- Reddy KN, Rimando AM, Duke SO, Nandula VK, 2008. Aminomethylphosphonic acid accumulation in plant species treated with glyphosate. J. Agric. Food Chem 56 (6), 2125–2130. 10.1021/jf072954f. [DOI] [PubMed] [Google Scholar]
- Reddy KN, Cizdziel JV, Martin M, Williams I, Maul JE, Rimando AM, Duke SO, 2018. Glyphosate resistance technology has minimal or no effect on maize mineral content and yield. J. Agric. Food Chem 66 (39), 10139–10146. 10.1021/ACS.JAFC.8B01655. [DOI] [PubMed] [Google Scholar]
- Rhee J, Sampson L, Cho E, Hughes M, Hu F, Willett W, 2015. Comparison of methods to account for implausible reporting of energy intake in epidemiologic studies. Am. J. Epidemiol 181 (4), 225–233. 10.1093/AJE/KWU308. [DOI] [PMC free article] [PubMed] [Google Scholar]
- Ritchie ME, Phipson B, Wu D, et al. , 2015. Limma powers differential expression analyses for RNA-sequencing and microarray studies. Nucleic Acids Res. 43 (7), e47. 10.1093/nar/gkv007. [DOI] [PMC free article] [PubMed] [Google Scholar]
- Rocha MJ, Andersen HR, Rambaud L, et al. , 2022. Exposure levels of pyrethroids, chlorpyrifos and glyphosate in EU—an overview of human biomonitoring studies published since 2000. Toxics 10 (12), 789. 10.3390/TOXICS10120789. [DOI] [PMC free article] [PubMed] [Google Scholar]
- Schütze A, Morales-Agudelo P, Vidal M, Calafat AM, Ospina M, 2021. Quantification of glyphosate and other organophosphorus compounds in human urine via ion chromatography isotope dilution tandem mass spectrometry. Chemosphere 274, 129427. 10.1016/j.chemosphere.2020.129427. [DOI] [PMC free article] [PubMed] [Google Scholar]
- Soukup ST, Merz B, Bub A, et al. , 2020. Glyphosate and AMPA levels in human urine samples and their correlation with food consumption: results of the cross-sectional KarMeN study in Germany. Arch. Toxicol 94 (5) 10.1007/s00204-020-02704-7. [DOI] [PMC free article] [PubMed] [Google Scholar]
- Stajnko A, Snoj Tratnik J, Kosjek T, et al. , 2020. Seasonal glyphosate and AMPA levels in urine of children and adolescents living in rural regions of Northeastern Slovenia. Environ. Int 143 10.1016/j.envint.2020.105985. [DOI] [PubMed] [Google Scholar]
- Strandberg B, Sørensen PB, Bruus M, et al. , 1987. Effects of glyphosate spray-drift on plant flowering. Environ Pollut Barking Essex 2021 (280), 116953. 10.1016/j.envpol.2021.116953. [DOI] [PubMed] [Google Scholar]
- Sun Y, Liu B, Du Y, et al. , 2018. Inverse association between organic food purchase and diabetes mellitus in US adults. Nutrients 10 (12), 1877. 10.3390/nu10121877. [DOI] [PMC free article] [PubMed] [Google Scholar]
- Tang Q, Tang J, Ren X, Li C, 2020. Glyphosate exposure induces inflammatory responses in the small intestine and alters gut microbial composition in rats. Environ. Pollut 261. 10.1016/j.envpol.2020.114129. [DOI] [PubMed] [Google Scholar]
- Thongprakaisang S, Thiantanawat A, Rangkadilok N, Suriyo T, Satayavivad J, 2013. Glyphosate induces human breast cancer cells growth via estrogen receptors. Food Chem. Toxicol 59, 129–136. 10.1016/j.fct.2013.05.057. [DOI] [PubMed] [Google Scholar]
- Tittlemier SA, Bestvater L, Carlson J, Kletke J, Izydorczyk M, Fu BX, 2021. Fate of glyphosate in wheat during milling and bread production. Cereal Chem. 98 (1), 100–108. 10.1002/CCHE.10369. [DOI] [Google Scholar]
- Van Eerd LL, Hoagland RE, Zablotowicz RM, Hall JC, 2003. Pesticide metabolism in plants and microorganisms. Weed Sci. 51 (4), 472–495. 10.1614/0043-1745(2003)051. [DOI] [Google Scholar]
- United States Department of Agriculture Agricultural Marketing Service, 2013. Pesticide Data Program Annual Summary, Program Year 2011. https://www.ams.usda.gov/reports/pdp-annual-summary-reports.
- United States Food and Drug Administration, 2017. Pesticide Residue Monitoring Program Fiscal Year 2017 Pesticide Report. https://www.fda.gov/food/pesticides/pesticide-residue-monitoring-2017-report-and-data.
- Vandenberg LN, Blumberg B, Antoniou MN, et al. , 2017. Is it time to reassess current safety standards for glyphosate-based herbicides? J. Epidemiol. Community Health 71 (6), 613–618. 10.1136/jech-2016-208463. [DOI] [PMC free article] [PubMed] [Google Scholar]
- Weisberg S, Fox J, 2011. An R Companion to Applied Regression. Sage, Thousand Oaks. http://socserv.mcmaster.ca/jfox/books/Companion/index.html. [Google Scholar]
- Wiese A, Schulte M, Theuvsen L, Steinmann HH, 2018. Interactions of glyphosate use with farm characteristics and cropping patterns in Central Europe. Pest Manag. Sci 74 (5), 1155–1165. 10.1002/PS.4542. [DOI] [PubMed] [Google Scholar]
- Xu J, Smith S, Smith G, Wang W, Li Y, 2019. Glyphosate contamination in grains and foods: an overview. Food Control 106, 106710. 10.1016/J.FOODCONT.2019.106710. [DOI] [Google Scholar]
- Zaller JG, Kruse-Plaß M, Schlechtriemen U, et al. , 2022. Pesticides in ambient air, influenced by surrounding land use and weather, pose a potential threat to biodiversity and humans. Sci. Total Environ 838, 156012 10.1016/j.scitotenv.2022.156012. [DOI] [PMC free article] [PubMed] [Google Scholar]
- Zhan H, Feng Y, Fan X, Chen S, 2018. Recent advances in glyphosate biodegradation. Appl. Microbiol. Biotechnol 102 (12), 5033–5043. 10.1007/S00253-018-9035-0. [DOI] [PubMed] [Google Scholar]
- Zhang L, Rana I, Shaffer RM, Taioli E, Sheppard L, 2019. Exposure to glyphosate-based herbicides and risk for non-Hodgkin lymphoma: a meta-analysis and supporting evidence. Mutat. Res., Rev. Mutat. Res 781, 186–206. 10.1016/j.mrrev.2019.02.001. [DOI] [PMC free article] [PubMed] [Google Scholar]
- Zoller O, Rhyn P, Rupp H, Zarn JA, Geiser C, 2018. Glyphosate residues in Swiss market foods: monitoring and risk evaluation. Food Addit. Contam. Part B Surveill 11 (2), 83–91. 10.1080/19393210.2017.1419509. [DOI] [PubMed] [Google Scholar]
Associated Data
This section collects any data citations, data availability statements, or supplementary materials included in this article.
Supplementary Materials
Data Availability Statement
The datasets analyzed in this study are available from the corresponding author upon reasonable request.