

Summary
Genetic variants affecting gene expression levels in humans have been mapped in the Genotype-Tissue Expression (GTEx) project. Trans-acting variants impacting many genes simultaneously through a shared transcription factor (TF) are of particular interest. Here, we developed a generalized linear model (GLM) to estimate protein-level TF activity levels in an individual-specific manner from GTEx RNA sequencing (RNA-seq) profiles. It uses observed differential gene expression after TF perturbation as a predictor and, by analyzing differential expression within pairs of neighboring genes, controls for the confounding effect of variation in chromatin state along the genome. We inferred genotype-specific activities for 55 TFs across 49 tissues. Subsequently performing genome-wide association analysis on this virtual trait revealed TF activity quantitative trait loci (aQTLs) that, as a set, are enriched for functional features. Altogether, the set of tools we introduce here highlights the potential of genetic association studies for cellular endophenotypes based on a network-based multi-omics approach. The transparent peer review record is available.
Keywords: transcription factor activity, genetic variation, genome-wide association, gene regulation, trans-acting genetic variation, quantitative trait locus, aQTL, RNA-seq data, transcription factor perturbation signatures, generalized linear model, beta-binomial distribution
Graphical abstract
Highlights
-
•
A novel statistical model estimates transcription factor regulatory activity
-
•
Genetic variants predictive of this inferred TF activity are identified as “aQTLs”
-
•
These variants are enriched for functional features associated with gene regulation
Li et al. develop a new approach to estimate protein-level regulatory activity of 55 different transcription factors (TFs) from RNA-seq profiles in an individual-specific manner across 49 tissues. Genetic determinants of these TF activities are genetically mapped as “aQTLs.” These variants are enriched for genomic features associated with gene regulation.
Introduction
In recent years, there has been a large effort to understand the phenotypic impact of genetic variation through genome-wide association studies (GWASs).1,2 The majority of variants detected by GWAS are non-coding, which makes it difficult to uncover the underlying molecular mechanisms.3,4 Genetic variation often modulates cellular phenotypes via changes in gene expression.5,6,7 Genetic variants that influence the expression level of a gene are known as expression quantitative trait loci (eQTLs).8 They can impact gene expression via either cis-acting (proximal) or trans-acting (distal) mechanisms.9,10,11,12,13
To date, most studies have focused on identifying cis-acting regulatory variants using eQTL analysis. Mapping of trans-acting genetic variants to specific downstream genes is limited by statistical power because genome-wide tests come with a burden of multiple testing, and trans-eQTLs tend to have a smaller effect size.10,14 Trans-acting variants, in principle, can affect a large set of genes by altering the activity of gene regulatory pathways.15,16 Indeed, mapping the genetic determinants of (inferred) transcription factor (TF) activity as so-called activity QTLs (aQTLs) was previously shown to be a viable strategy for mapping trans-acting loci in model organisms.17 In the regulatory network of the cell, the aQTL can be connected to the TF through a variety of mechanistic paths. For instance, a causal gene near the aQTL could encode a co-factor of the trait TF, a kinase that controls the post-translational modification status of the TF, or even an enzyme whose modulation leads to a change in a metabolic state that gets sensed by a signaling pathway upstream of the TF.
The recent emergence of large collections of parallel genotype and RNA sequencing (RNA-seq) expression data10 has put human aQTL analysis using a similar discovery approach within reach, and some initial studies have been performed.18,19,20 Identifying aQTLs could be important for understanding how genetic variants affect cellular regulatory state as an intermediate phenotype. The protein-level regulatory activity of a TF quantifies to what extent the TF can impact the expression of target genes in a given cell. Most of the current experimental methods for protein quantification only measure the total protein abundance for a TF.21 However, the activity of a TF protein is greatly influenced by its post-translational modification status and consequent subcellular distribution. Linear regression models have long been used to estimate protein-level TF activity from genome-wide mRNA expression levels in a sample-specific manner.22,23,24 In such analysis, mRNA expression levels serve as the response variable, and the regulatory influence of a given TF on each gene is used as the predictor; the regression coefficient, therefore, reflects the (inferred) activity of the TF under a certain condition. A common way to define a TF’s regulatory influence is through the prediction of binding strength from a promoter sequence using TF-binding motifs,25,26,27,28 or a gene set approach based on so-called TF regulons.29 Other computational methods have also been proposed to infer TF activity from the mRNA expression levels of TF target genes.25,26,28,30,31,32,33,34,35,36,37,38,39
One of our goals in this study was to update the linear regression framework to allow for optimal analysis of human RNA-seq data such as that generated by the Genotype-Tissue Expression (GTEx) project. First, it is more challenging to predict cis-regulatory logic from non-coding sequences in humans than in model organisms. We used the observed response of each gene after perturbation of a TF in a cell line as the predictor variable, as it captures the effect of TF regulation on gene expression more accurately than binding affinity predicted from a sequence or boolean TF regulon (the set of target genes) membership. A second issue is that, especially in human cells, local chromatin context shows great variation along the genome and has a large influence on gene expression levels.40 While some algorithms28,34 include multi-omics data as input to remove the confounding effect of chromatin context, such matched datasets are not readily available when analyzing genetic variation in gene expression. The solution we settled on is to analyze gene expression data at the level of pairs of neighboring genes, which are more likely to be embedded in the same local chromatin type. More generally, our gene-pair approach allows us to control for confounders that affect inter-individual variation in gene expression in complex tissue data. To make optimal use of the discrete RNA-seq counts as a dependent variable, and to properly account for the over-dispersion that the distribution of these counts is known to exhibit,41 we fit a generalized linear model (GLM) based on the beta-binomial distribution with an independent over-dispersion parameter for each gene pair.
By combining all these ingredients, our approach provides insight into how TFs regulate differential gene expression across tissues and individuals. To understand how genetic variation affects gene expression via trans-acting mechanisms by impacting related TF activities, we then performed genome-wide association analysis with the inferred TF activity as a quantitative trait to identify genetic variants (aQTLs) that are significantly associated with TF activity levels in each tissue.
Results
Inferring individual-specific TF activity
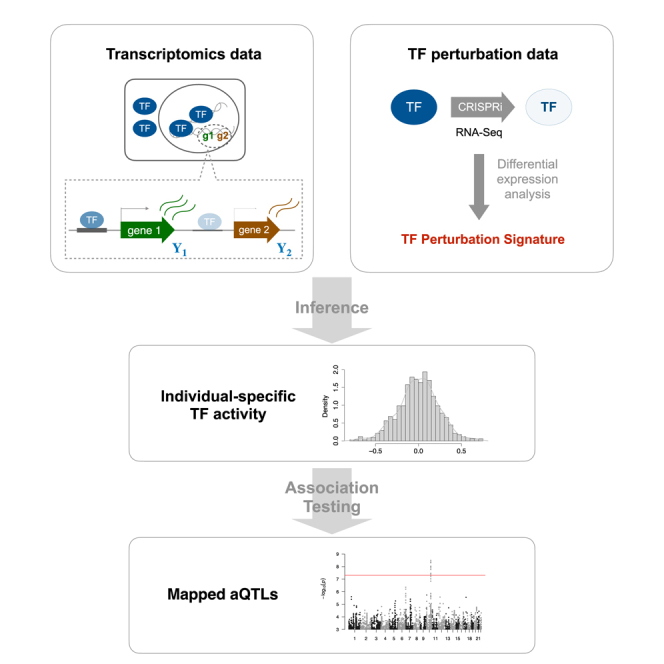
Figure 1A shows an overview of our approach to mapping trans-acting loci. One of the inputs is gene expression data in the form of raw RNA-seq counts for each sample as profiled in the GTEx project v.8 release.10 These data play the role of a dependent variable (response) in the GLM that we fit to infer sample-specific, protein-level TF activities. The other input is a genome-wide signature, consisting of the log fold change in expression for all genes after the CRISPRi knockdown of a particular TF (Figure 1B) derived from RNA-seq data from the ENCODE portal,42 which serves as the independent variable (predictor) in the model. Of the 74 TFs for which such experiments were performed, 55 passed our quality control criterion (see STAR Methods).
Figure 1.

Inferring individual-specific TF activity levels
(A) Overview of the aQTL mapping pipeline.
(B) Details of our TF activity inference method. Briefly, we performed differential analysis of RNA-seq assays in which a single TF was knocked down using CRISPRi and used the shrinkage-based log2 fold change to define a genome-wide TF perturbation response signature.
(C) TF perturbation response signature is used as the TF regulatory strength.
(D) Diagram of the pair-level model.
(E) Schematic diagram showing how the predictor was permuted across gene pairs, for each sample independently. The same model fit was then used to construct a null distribution for the inferred TF activities.
In existing regression models used for inferring TF activity from expression data,23,26,27,28,34 each observation is an absolute or differential expression value for an individual gene. The regression coefficient of the model in this setup would quantify to what extent the sensitivity of genes to CRISPRi perturbation of the TF is predictive of differential mRNA expression in an unrelated sample. To account for the confounding effect of variation in local chromatin context along the genome without the need to explicitly add covariates related to chromatin context to our model, we developed a “pair-level” model in which each observation is a pair of expression values for two neighboring genes (Figure 1C; STAR Methods). The rationale is that since chromatin is organized into domains along the genome,43 neighboring genes are more likely to share a similar chromatin environment. Our model is only trying to explain how sample-specific variation in the expression ratio between the two genes in the pair can be explained in terms of differences in responsiveness to TF knockdown between the two genes in the pair. This model definition implicitly accounts for, and therefore is insensitive to, any increase or decrease in expression resulting from local chromatin context that would be shared among the two genes in the pair, including technical and biological nuisance variation that is inherent to tissue RNA-seq data. Pairs of neighboring protein-coding genes were selected for inclusion in the model based on the distance between their respective transcription start sites (Figure S1A). We imposed both a minimum distance (10 kb) to avoid sharing of promoter or proximal enhancer regions and a maximum distance (200 kb) to increase the odds of similarity in local chromatin context.
To properly account for the biological and technological components of the variation in RNA-seq count, we use a GLM based on the beta-binomial distribution and likelihood maximization across hundreds of samples for a given tissue to estimate the dispersion parameter for each observation directly from the data. Simultaneous estimation of the regression coefficient associated with the TF perturbation signature yields an estimate of (differential) TF activity for each sample (see Figure 1D and STAR Methods for details).
To assess the robustness of our approach, we compared the consistency in inferred TF activity between fits based on odd and even pairs of genes, respectively (Figure S1B). For a representative set of ten TFs and ten tissues, the Pearson correlation across samples between TF activities based on odd pairs and even pairs was greater than 0.9 (Figures S1C and S1D). Consistent with our expectation, when we performed fits in which the pairs are non-nearest neighbors at a larger distance from each other on average, the inferred TF activities were less similar to those based on nearest-neighbor pairs and more similar to those inferred using individual-gene observations (see STAR Methods for definition of the gene-level model; Figure S2).
We also explored the relationship between inferred TF activity and the mRNA expression level of the gene encoding the TF. Computing the correlation between these quantities across individuals for all TF/tissue combinations, we found that the degree of correlation varies a lot among TFs (Figure S3A), which should not be surprising since mRNA is only one of the many determinants of the regulatory activity of the TF protein in the nucleus. However, the correlation is generally consistent across tissues for a given TF, and closely related tissues tend to have similar patterns across TFs. There is also a clear enrichment for statistically significant correlation (Figure S3B). We also compared (see STAR Methods for details) with an existing TF activity inference method44 that has been previously used for aQTL discovery.20 There is a strong trend for the TF activities as inferred by the two approaches to be correlated across all samples for a given TF/tissue combination, although the degree of correlation varies (Figure S4). The significant negative correlations that some of our inferred TF activities have may indicate that, sometimes, the activity can reflect a broader variation in pathway activity with involvement from multiple TFs with shared regulons but opposite directions of effect.
To assess to what extent the variation in inferred TF activities reflects true differences between samples as opposed to statistical fluctuations or biological noise unrelated to the TF in question, we randomly permuted the TF perturbation response signature used as the predictor and then refit the model (Figure 1E; STAR Methods). Comparing the null distribution of TF activities resulting from many independent such permutations with the distribution across samples for the unpermuted fits, we found that the variance of the latter tended to be much larger (a representative example is shown in Figure 2A). The variance ratio between (1) the difference between the variance of inferred activities and that of permuted activities and (2) the variance of inferred activities is greater than 0.9 for most TF/tissue combinations (Figure 2B). This suggests that our modeling approach is sensitive to true variation in TF activity across samples, which can arise from many sources, including inter-individual variation due to donor characteristics.
Figure 2.

Permutation analysis
(A) An example of distributions of activity based on actual data and permuted data, respectively.
(B) Distribution of the variance ratios computed for 10 representative TFs in 10 representative tissues. The variance ratio is defined as the difference between the variance of the activity inferred from the actual data and that inferred from the permuted data as a fraction of the former.
Age-dependent inter-individual variation in HMGB2 activity
Our model was designed to analyze variation in TF activity across individuals for a given TF and tissue. To validate its biological usefulness in a robust manner, we tested whether the TF activity estimated from the GTEx data showed any biologically meaningful relationship with age. The most statistically significant association from this analysis was that the activity of high-mobility group box protein 2 (HMGB2) in skeletal muscle significantly declines with aging (Spearman correlation r = −0.337, p = 3.7 × 10⁻²⁰) (Figure 3A). Consistently, it has been previously reported that aging is associated with a loss of HMGB2, which contributes to the development of osteoarthritis (OA),45 one of the most common musculoskeletal disorders, which is strongly linked to aging.46 Other tissues also showed age-dependent HMGB2 activity, including two adipose tissues (Figure 3B). Indeed, HMGB2 is known to play an important role in adipogenesis.47 Several other TFs also showed a significant dependence on age in these tissues (Figure S5A). In a more comprehensive analysis across all combinations of TF and tissue, we extended this age correlation analysis to (1) the TF activity as inferred using the approach of Hoskins et al.20 and (2) the mRNA expression level of the TF gene (Figure S5). We found that our gene-pair model (Figure S5A) yields a more coherent pattern of correlation with age across tissues than these alternatives, both in terms of a clustered heatmap representation (Figures S5B and S5C) and the eigenvalue spectrum of a singular value decomposition of the age correlation matrix (Figure S5D).
Figure 3.

Inter-individual variation in TF activity
(A) Age-related HMGB2 activity across skeletal muscle samples in GTEx (Spearman correlation test; ρ = −0.337, p = 3.72 × 10⁻²⁰).
(B) The ten tissues showing the strongest age dependence of HMGB2 activity according to our method. All p values were based on Spearman correlation test.
Mapping genetic determinants of TF activity (aQTLs)
Our ability to estimate individual-specific TF activity, which can be viewed as a quantitative trait with a potential genetic component, provides an opportunity to use a standard GWAS approach to mapping aQTLs, defined as genetic modulators of the degree to which the TF as a protein-level trait contributes to the expression level of its target genes in each individual in the GTEx cohort. To map aQTLs, we used a linear regression model in which major technical and biological covariates are included (see STAR Methods).
The most significant aQTL association in our analysis was seen for rs146434626 and HMGN3 activity in the frontal cortex (see Figure S6 for genome-wide profile), at a level of significance (p = 6.5 × 10⁻¹⁶) far exceeding the standard criterion for genome-wide significance (p < 5 × 10⁻⁸). Figure 4A shows an overview of the aQTLs our method identified across all TFs and tissues, in which all variants with a p value below the genome-wide significance threshold (p < 5 × 10⁻⁸) have been marked. The standard significance threshold does not take into account the large number of TF/tissue combinations (total 55 × 49 = 2,695) that are being analyzed in parallel. However, many TFs have highly correlated inferred activities across individuals (Figure S7). Thus, the effective number of independent traits tested is not merely the number of TF/tissue combinations, and care must be taken to not correct too harshly for multiple testing of traits and tissues in addition to genetic variants. We resorted to a permutation strategy to empirically estimate the false discovery rate (FDR) associated with a particular p value cutoff (see STAR Methods). At the standard cutoff for a single trait (p < 5 × 10⁻⁸), the FDR is rather high (∼70%), but it starts to drop as more stringent p value thresholds are applied (Figure 4B). At the much more stringent cutoff of p < 10−11, corresponding to an estimated FDR of around 25%, we discover 111 aQTLs (Table S1). While we did not observe any tissue sharing for these aQTLs, we did observe a high correlation in the genetic effect on TF activity between similar tissues across variants that pass a lenient significance criterion (p < 10−6) in one of the tissues (Figure S8). Thus, we would expect to observe more tissue sharing at larger population sizes with increased statistical power.
Figure 4.

False discovery rate and functional enrichment for aQTLs discovered at different p value cutoffs
(A) A heatmap showing the most significant p value for each combination of trait TF and tissue. Only variants with p values below 5 × 10⁻⁸ are indicated.
(B) Plot showing the mean and SEM (standard error of the mean) of FDRs estimated based on 100 random permutations.
(C) Functional annotation enrichment of fine-mapped variants at various p value cutoffs. Odds ratios and p values were computed using Fisher’s exact test. Significance levels: ∗p ≤ 0.05, ∗∗p ≤ 0.01, ∗∗∗p ≤ 0.001. NC, non-coding; NMD, nonsense-mediated decay.
We also analyzed the larger set of aQTLs identified at p < 5 × 10⁻⁸ in terms of evidence of functionality. To assess whether the identified aQTLs in aggregate have features indicative of gene regulation, we first fine mapped aQTLs discovered by using a less stringent criterion (see STAR Methods). At various p value cutoffs, we then computed enrichment ratios associated with different functional categories, according to a genome-wide functional annotation based on a widely used human cell line (see STAR Methods). At more stringent p value cutoffs, the identified variants become significantly enriched for open chromatin as well as for TF-binding sites (Figure 4C). This suggests that, to a significant extent, the cascade of effects that ultimately lead to modulation of the target genes of the trait TF involve cis-regulatory changes at the aQTL locus, which presumably affect the expression level of a nearby causal gene.
A direct protein-protein interaction between the protein encoded by a gene at the aQTL locus and by a transcriptional co-factor of the trait TF may point to a mechanism for modulating the protein-level TF activity. An example of this is an aQTL on chromosome 18 (rs10775496 as the lead variant, p = 7.6 × 10⁻¹⁰), which our method identifies as a putative genetic determinant of the regulatory activity of the transcription factor RELA in cerebellar hemisphere tissue (Figures 5A and 5B). The nearest gene is SMAD4, and one of the most plausible causal variants (rs12456284; p = 7.8 × 10⁻¹⁰), which has also been reported as an eQTL of SMAD4 in various tissues (see https://www.gtexportal.org/), resides in its 3′ UTR (Figure 5C). RELA, also known as p65, encodes a main subunit of nuclear factor κB (NF-κB), and it has been reported that RELA physically interacts with SMAD4.48
Figure 5.

aQTL mapping results for transcription factor RELA in brain cerebellar hemisphere tissue
(A) Overview of genome-wide association analysis, using RELA activity as inferred by our GLM method as a quantitative trait. The red line indicates the p = 5 × 10⁻⁸ significance level.
(B) Quantile plot corresponding to (A), showing enrichment of small p values.
(C) Detailed view of one of the aQTL loci on chromosome 18. The dark blue points represent fine-mapped loci. The black point shows a 3′ UTR variant of SMAD4, the transcript of which is on the forward strand and is highlighted by the red box.
As further validation of our aQTL mapping strategy, we asked whether there is a trend for the trait TF protein to have a known functional association with the protein product of the putative causal gene. There was insufficient coverage to meaningfully apply empirical approaches to mapping the causal gene such as that of Fulco et al.49 Therefore, for each fine-mapped aQTL that passed the standard significance threshold, we determined which protein-coding gene had a transcription start site closest to the locus and searched for known associations with the trait TF based on any type of evidence included in the STRING database.50 We found that such prior associations (Table S2) are more prevalent than expected by random chance (Fisher’s exact test, odds ratio = 1.83, p = 2.5 × 10⁻⁶). When the evidence is limited to co-expression, the association is less significant (odds ratio = 1.73; p = 0.002), whereas for protein interactions supported by experimental data, it is slightly more significant (odds ratio = 2.42; p = 5 × 10⁻⁷). Some aQTLs co-localize with cis-eQTLs in the same tissue, which suggests that the causal gene for the aQTL may be the same as the “eGene” (the gene whose expression level plays the role of a quantitative trait in a given eQTL association) that was the trait for the eQTL association. For example, an aQTL (rs11547207) of HDAC8 in the adrenal gland is co-localized with a cis-eQTL in the 5′ UTR of the CIB2 gene discovered in the GTEx project (see STAR Methods and Figure S9). Although in most cases the underlying mechanisms between mapped cis-target genes and the TFs are not obvious, such analysis can provide a starting point for the dissection of the mechanisms underlying trans-acting genetic effects.
Discussion
In this article, we started by developing a robust general method for estimating protein-level TF activity levels from RNA-seq count data in a sample-specific manner. Our modeling is innovative in that we only focus on variation in the gene expression ratio between neighboring genes. This elegantly circumvents the confounding effect of sample-to-sample variation in chromatin structure on gene expression. We can attribute variation in genome-wide expression among GTEx samples to a particular TF by leveraging CRISPRi perturbation data obtained in K562 cells. Using such an empirical signature as a predictor in our model has the advantage that context-dependent effects of functional versus non-functional TF binding, as well as indirect effects due to transcriptional cascades, are implicitly accounted for. In the future, using TF response signatures derived from large-scale multiplexed TF perturbation experiments coupled with single-cell expression profiling in other cell types51,52 might be used to refine our approach.
While in our pioneering aQTL study in yeast, we successfully used DNA-binding-specific models to simply predict TF responsiveness from upstream promoter sequence as a sliding-window sum of affinities,17 this sequence-based strategy remains much more challenging in mammals, where cis-regulatory regions can be much farther away from a gene’s transcription start site (TSS) and where the combinatorial logic of TF binding is more complex.
Trans-acting variants that influence distal gene expression (i.e., trans-eQTLs) have been extensively studied and have been shown to be highly tissue specific.9,13,15 These variants can influence multiple genes by acting on regulatory circuits, mapping them, and relating them explicitly to regulation by TFs, which can help to clarify underlying mechanisms.13,15 With the TF activity inferred by our model and the parallel genotype data available, we were able to systematically identify genetic effects on TF activity in human tissues, regardless of whether the mRNA expression level of the gene encoding the TF has a genetic component or not.
A recent study inferred adipose-specific TF activities using a regulon-based approach and associated them with genetic variants at cardiometabolic trait GWAS loci, suggesting that aQTLs can help reveal molecular mechanisms mediating GWAS signals.20 However, a systematic survey of aQTLs in other human tissues has not yet been conducted. Moreover, our gene-pair-based GLM approach to inferring TF activity from transcriptome data is conceptually and technically very different from the regulon-based approach of Hoskins et al.20
Our model for inferring sample-specific TF activities has many potential applications in addition to identifying aQTLs. For instance, compared with healthy human tissues, differential expression between cancer samples can be challenging to interpret due to the presence of genomic instabilities. Our gene-pair approach to inferred TF activity might be robust in the face of such instabilities since a duplication in a region that includes both genes in a pair should not affect the ratio between their expression values. Another application would be to analyze individual-specific drug responsiveness by fitting the model on GTEx samples using an empirical drug-response signature as a predictor in the model. Genetic variants associated with differential drug responsiveness across individuals could thus be identified using our approach. This would provide insight into genetic effects on individual-specific responsiveness to drugs and could have potential in the context of precision medicine.
Limitations of the study
We note that the set of TFs used in the study was limited by the availability of CRISPRi RNA-seq data. Moreover, any TF perturbation signature is dependent on the cell line in which it was profiled, so our approach implicitly assumes that the effect of TF activity modulation is similar enough between that cell line and the GTEx samples that we analyze using our GLM. Specifically, the perturbation experiments were performed in K562 cells, whose cell state is perhaps most closely related to that of whole blood in GTEx. We are thus making an implicit assumption that we can ignore this cell-type dependence of the independent variable in our model, which may negatively impact statistical power to infer changes in TF activity.
Our identification of aQTLs based on genome-wide association analysis on TF activity traits inferred from GTEx data is also limited by statistical power due to the relatively small sample sizes compared with those in traditional GWAS studies. Furthermore, it can be confounded by inter-individual variation in cell-type composition.
Key changes prompted by reviewer comments
As suggested by our reviewers, we further validated our TF activity inference approach by comparing it with an established approach,44 as well as by considering the correlation between inferred TF activity and the mRNA expression level of the TF-encoding gene. These additional results are shown in Figures S3–S5. We also added more detail in Tables S3 and S4 and made various edits to the text to improve clarity.
STAR★Methods
Key resources table
Resource availability
Lead contact
Further information and requests for resources should be directed to and will be fulfilled by the lead contact, Harmen J. Bussemaker (hjb2004@columbia.edu).
Materials availability
This study did not generate new unique reagents.
Method details
Collection of RNA-seq data from the GTEx project
To obtain the data to be used as the dependent variable in our model, we used gene counts from RNA-seq data from GTEx release v8, which encompasses over 15,000 samples across 54 tissues and over 800 individuals. We used data from 49 tissues (Table S4) that have adequate sample sizes. For each tissue, RNA-seq counts were down-sampled to the minimum number of reads across all pertinent samples to make the library size equal across individuals. That being said, down-sampling has little effect on the values of the inferred activity in GTEx samples, compared to the original RNA-seq count data (Pearson correlation r > 0.95 across a representative set of TFs and tissues).
Construction of TF perturbation signatures
To construct the TF perturbation signatures used as the independent variable in our model, we obtained RNA-seq data reporting on the effect of CRISPRi knockdown of each of 66 TFs in K562 cell lines from the ENCODE data portal.42 Starting from the alignment files for control and treatment samples in BAM format, we used featureCounts v2.0.054 and the gene annotation of the genome assembly GRCh38.p12 from GENCODE release 2963 to generate count matrices for each sample. Then we used R (version 4.0.2) package DESeq2 v1.28.155 to perform differential gene expression analysis for each CRISPRi RNA-seq experiment. After performing gene-level and sample-level quality control, we retained signatures for 55 TFs (Table S3). The shrinkage log2 fold changes64 for each gene were used to define the perturbation signature for a given TF.
Inference of TF activity based on gene-pair model
This model was the default used in our study. It is designed to account for variation in chromatin context along the genome in a novel way. To estimate sample-specific (differential) TF activities, we used a generalized linear model based on the beta-binomial distribution:
Here denotes a gene pair. denotes the pair of RNA-seq counts for gene pair in sample , with and defined as pair-to-gene mappings for the first and second gene in the pair, respectively. In the beta-binomial distribution, plays the role of the sample size, and is the over-dispersion parameter. The binomial success rate was modeled as a function of the TF perturbation signature (defined as the log2-ratio of the response of gene each to perturbation of transcription factor ) as follows:
Here, the intercept models the mean expression ratio across samples between the two genes in each pair (which is not of interest by itself). is the predictor based the TF perturbation signature for transcription factor , and the corresponding regression coefficient, which will be interpreted as an inferred, sample-specific, protein-level TF activity. A separate fit was performed for each TF for which a signature was available. The parameters , and were estimated by likelihood maximization, implemented in TensorFlow v2.9.156 and Python v3. For each tissue, a single joint fit to all individual samples for a given tissue was performed, allowing the over-dispersion parameter for each gene pair to be estimated without making any further assumptions. RNA-seq counts were down-sampled to make total counts the same as the smallest library size across all samples. Since the coefficients are defined up to an overall additive constant, we centered them at zero. To obtain a null distribution for the inferred TF activity , the predictor was permuted randomly and independently among all gene pairs for each sample. The pair-level model was then fit to unpermuted expression counts .
Selection of gene pairs
To set up the design matrix for our model, we selected pairs of neighboring genes based on their location on the chromosome in GENCODE release 29. For each chromosome, we indexed all protein-coding genes according to their order along each chromosome, without regard for their transcription direction, and for each gene selected the next nearest gene as its paired gene. The resulting pairs were then filtered based on the distance between their respective annotated transcription start sites, which we required to be within the range of 10kb–200 kb (Figure S2A). For each tissue, we also left out pairs for which both genes had zero counts in all individuals. To assess the robustness of our model, we used an alternative way to generate two separate design matrices based on non-overlapping pairs of genes alone. Here, the first gene in a pair was required to have either an odd or an even index (“odd pairs” or “even pairs”). To analyze the ability of our nearest-neighbor design to account for variation in chromatin context along the genome, we also used sets of 5th or 10th nearest-neighbor gene pairs to define the design matrix. In these cases, the TSS distance for each pair was typically greater than 200kb, and we did not impose a maximum distance cutoff. As a further control, we also selected pairs in which each gene was randomly selected from different chromosomes.
Inference of TF activity based on individual-gene model
This simpler model, which is more similar to existing regression-based TF inference models, was used as a comparison that was as similar as possible to the model defined above, except for the use of gene pairs. To model the count of individual genes across samples, we fit a generalized linear model with negative binomial distribution:
Here, denotes the RNA-seq count for gene in sample . The probability parameter is given by
in terms of the gene-specific over-dispersion parameter and the expected value of , which in turns is parameterized as
Here, is a gene-specific intercept that absorbs the variation in mean expression across samples, and is a sample-specific regression coefficient associated with the same perturbation-signature based predictor as above (but now used at the individual-gene level), which we again interpret as an inferred sample-specific TF activity. The parameters , and were estimated by likelihood maximization as above. For computational efficiency, we optionally set to the actual mean
rather than treating it as a fit parameter.
Validation of TF activity inference by comparing with the approach of Hoskins et al. (2021)
First, to define a regulon for a given TF in a given tissue, the tool ARACNe-AP57 was run on the GTEx gene expression data in log2(TPM+0.0001) representation, using 100 bootstrapping steps. The tool VIPER44 was subsequently applied to z-transformed mRNA expression values to compute sample-specific TF activity scores.
Mapping aQTLs using genome-wide association analysis of inferred TF activity
Treating the inferred activity level for a given transcription factor in sample s as a sample-specific quantitative trait, we computed their association with genetic variants using a standard genome-wide association (GWA) analysis based on univariate linear regression using the fastGWA tool from GCTA v1.93.1.58 We used genotyping data from the GTEx project and mapped on all common genetic variants with an MAF ≥ 0.05. To account for non-genetic sources of variation, we included as covariates unobserved confounding variables also used in the standard eQTL analysis in the GTEx project,10 including five genotype-based principal components that account for population structure; the genotyping platform; the biospecimen source site; the cohort to which the sample belonged (organ donor or postmortem); sex; and age. The association study of TF activity traits was done for all TF and tissue combinations.
Statistical fine-mapping
We uniformly processed the summary statistics of association tests for each TF activity in a given tissue for statistical fine-mapping. We first used GCTA-COJO v1.93.158,65 to identify conditionally independent lead variants (pJ < 5 x 10⁻⁶) for each trait. We then analyzed all variants within the 1Mb region of independent variants with FINEMAP v1.3.1, a Bayesian fine-mapping method.59 The covariance matrices required by FINEMAP were generated by PLINK v2.066 and LDstore v1.1.67 The variants with a high Bayes factor (log10(BF) ≥ 2) were then retained for a set of plausibly causal variants. The total number of variants retained after fine-mapping equals 39,600.
Empirical false discovery rates
We adopted a permutation strategy to estimate the false discovery rate (FDRs) at a given p value cutoff. In each permutation, the association between the genotype and the TF activity traits across individuals was randomized, while preserving both the correlation structure among different TFs and that among genetic variants, as well as the covariates. We repeated the GWA analysis after each of 100 random permutations, for each tissue separately. For any given p value cutoff, this allowed us to estimate the mean expected number of false discoveries across all combinations of genetics variants, TFs, and tissues. The FDR was then computed as the ratio of this expected mean and the actual number of discoveries at the same p value cutoff. The actual numbers of variants discovered are as follows: 111 (p<=10−11), 152 (p<=5x10⁻¹¹), 188 (p<=10−10), 474 (p<=5x10⁻¹⁰), 623 (p<=10−9), 2376 (p<=5x10⁻⁹), 3589 (p<=10−8), 7939 (p<=5x10⁻⁸), 10883 (p<=10−7), 26083 (p<=5x10⁻⁷), 42374 (p<=10−6).
Enrichment of aQTLs for specific genomic annotations
We first performed functional annotation of all fine-mapped genetic variants as described above using the ENSEMBL Variant Effect Predictor (VEP) tool.60 To test for functional enrichment among the set of fine-mapped aQTLs discovered across TFs and tissues at a given p value cutoff, we used Fisher’s exact test.
Enrichment of protein association annotations between the TF and the nearest genes to the aQTL
We downloaded functional protein associations from the STRING v11.5 database,50 whose evidence types encompass “conserved neighborhood”, “co-occurrence”, “fusion”, “coexpression”, “experiments”, “curated databases”, and “text mining”. For each fine-mapped aQTL above the standard significance threshold (5x10⁻⁸), we posited that the protein-coding gene with a transcription start site closest to the locus was the causal gene. We collected all unique TF/causal gene combinations, and then used Fisher’s exact test to determine whether they were enriched for prior evidence of protein association, either in aggregate or in each separate category. The total number of protein-coding genes in our analysis equals 19,291, so the number of random protein pairs equals 186,061,695.
Colocalization of aQTLs and cis-eQTLs
We obtained the fine-mapped GTEx cis-eQTLs and summary statistics from the eQTL Catalogue.53 For each candidate variant in the intersection of the set of fine-mapped aQTLs and the set of eQTLs mapped in the same tissue, we performed colocalization analysis with the R package coloc61 using a 1Mb window around the corresponding variant, and computed a posterior probability of colocalization (PP4). We then used the R package LocusCompareR62 to visualize aQTL-eQTL colocalization events.
Acknowledgments
We thank Dr. Chaitanya Rastogi and Dr. H. Tomas Rube for critical advice on algorithm development, Dr. Júlia Domingo and Dr. John Morris for valuable suggestions on analysis of genetic variants, and Dr. Pejman Mohammadi as well as members of Bussemaker and Lappalainen labs for helpful discussions. This research was supported by NIH award R01MH106842 (to H.J.B. and T.L.) and a PhRMA Foundation pre-doctoral fellowship in informatics to X.L.
Author contributions
H.J.B. and X.L. developed the methodology; X.L. wrote all the software and performed all analyses under the supervision of H.J.B. and T.L.; X.L. and H.J.B. wrote the manuscript; and all authors edited and approved the manuscript.
Declaration of interests
H.J.B. is a co-founder and shareholder of Metric Biotechnologies, Inc. T.L. is a paid advisor to GSK, Pfizer, Goldfinch Bio, and Variant Bio and has equity in Variant Bio.
Published: August 18, 2023
Footnotes
Supplemental information can be found online at https://doi.org/10.1016/j.xgen.2023.100382.
Supplemental information
Data and code availability
All original code has been deposited at GitHub (http://github.com/BussemakerLab/Li-aQTL/) and Zenodo (https://zenodo.org/record/8118317) and is publicly available as of the date of publication. Summary statistics and fine-mapping results of all aQTL analyses are available at http://bussemakerlab.org/papers/Li-aQTL/. This paper analyzes existing, publicly available data. These datasets and accession numbers are listed in the Key Resources Table and Table S3. Any additional information required to reanalyze the data reported in this paper is available from the lead contact upon request.
References
- 1.Claussnitzer M., Cho J.H., Collins R., Cox N.J., Dermitzakis E.T., Hurles M.E., Kathiresan S., Kenny E.E., Lindgren C.M., MacArthur D.G., et al. A brief history of human disease genetics. Nature. 2020;577:179–189. doi: 10.1038/s41586-019-1879-7. [DOI] [PMC free article] [PubMed] [Google Scholar]
- 2.Welter D., MacArthur J., Morales J., Burdett T., Hall P., Junkins H., Klemm A., Flicek P., Manolio T., Hindorff L., Parkinson H. The NHGRI GWAS Catalog, a curated resource of SNP-trait associations. Nucleic Acids Res. 2014;42:D1001–D1006. doi: 10.1093/nar/gkt1229. [DOI] [PMC free article] [PubMed] [Google Scholar]
- 3.Ward L.D., Kellis M. Interpreting noncoding genetic variation in complex traits and human disease. Nat. Biotechnol. 2012;30:1095–1106. doi: 10.1038/nbt.2422. [DOI] [PMC free article] [PubMed] [Google Scholar]
- 4.Maurano M.T., Humbert R., Rynes E., Thurman R.E., Haugen E., Wang H., Reynolds A.P., Sandstrom R., Qu H., Brody J., et al. Systematic localization of common disease-associated variation in regulatory DNA. Science. 2012;337:1190–1195. doi: 10.1126/science.1222794. [DOI] [PMC free article] [PubMed] [Google Scholar]
- 5.Cookson W., Liang L., Abecasis G., Moffatt M., Lathrop M. Mapping complex disease traits with global gene expression. Nat. Rev. Genet. 2009;10:184–194. doi: 10.1038/nrg2537. [DOI] [PMC free article] [PubMed] [Google Scholar]
- 6.Nicolae D.L., Gamazon E., Zhang W., Duan S., Dolan M.E., Cox N.J. Trait-Associated SNPs Are More Likely to Be eQTLs: Annotation to Enhance Discovery from GWAS. PLoS Genet. 2010;6 doi: 10.1371/journal.pgen.1000888. [DOI] [PMC free article] [PubMed] [Google Scholar]
- 7.Pickrell J.K., Marioni J.C., Pai A.A., Degner J.F., Engelhardt B.E., Nkadori E., Veyrieras J.-B., Stephens M., Gilad Y., Pritchard J.K. Understanding mechanisms underlying human gene expression variation with RNA sequencing. Nature. 2010;464:768–772. doi: 10.1038/nature08872. [DOI] [PMC free article] [PubMed] [Google Scholar]
- 8.Brem R.B., Yvert G., Clinton R., Kruglyak L. Genetic Dissection of Transcriptional Regulation in Budding Yeast. Science. 2002;296:752–755. doi: 10.1126/science.1069516. [DOI] [PubMed] [Google Scholar]
- 9.Grundberg E., Small K.S., Hedman Å.K., Nica A.C., Buil A., Keildson S., Bell J.T., Yang T.-P., Meduri E., Barrett A., et al. Mapping cis- and trans-regulatory effects across multiple tissues in twins. Nat. Genet. 2012;44:1084–1089. doi: 10.1038/ng.2394. [DOI] [PMC free article] [PubMed] [Google Scholar]
- 10.GTEx Consortium The GTEx Consortium atlas of genetic regulatory effects across human tissues. Science. 2020;369:1318–1330. doi: 10.1126/science.aaz1776. [DOI] [PMC free article] [PubMed] [Google Scholar]
- 11.Morley M., Molony C.M., Weber T.M., Devlin J.L., Ewens K.G., Spielman R.S., Cheung V.G. Genetic analysis of genome-wide variation in human gene expression. Nature. 2004;430:743–747. doi: 10.1038/nature02797. [DOI] [PMC free article] [PubMed] [Google Scholar]
- 12.Westra H.-J., Peters M.J., Esko T., Yaghootkar H., Schurmann C., Kettunen J., Christiansen M.W., Fairfax B.P., Schramm K., Powell J.E., et al. Systematic identification of trans eQTLs as putative drivers of known disease associations. Nat. Genet. 2013;45:1238–1243. doi: 10.1038/ng.2756. [DOI] [PMC free article] [PubMed] [Google Scholar]
- 13.Võsa U., Claringbould A., Westra H.-J., Bonder M.J., Deelen P., Zeng B., Kirsten H., Saha A., Kreuzhuber R., Yazar S., et al. Large-scale cis- and trans-eQTL analyses identify thousands of genetic loci and polygenic scores that regulate blood gene expression. Nat. Genet. 2021;53:1300–1310. doi: 10.1038/s41588-021-00913-z. [DOI] [PMC free article] [PubMed] [Google Scholar]
- 14.Yvert G., Brem R.B., Whittle J., Akey J.M., Foss E., Smith E.N., Mackelprang R., Kruglyak L. Trans-acting regulatory variation in Saccharomyces cerevisiae and the role of transcription factors. Nat. Genet. 2003;35:57–64. doi: 10.1038/ng1222. [DOI] [PubMed] [Google Scholar]
- 15.Brynedal B., Choi J., Raj T., Bjornson R., Stranger B.E., Neale B.M., Voight B.F., Cotsapas C. Large-Scale trans-eQTLs Affect Hundreds of Transcripts and Mediate Patterns of Transcriptional Co-regulation. Am. J. Hum. Genet. 2017;100:581–591. doi: 10.1016/j.ajhg.2017.02.004. [DOI] [PMC free article] [PubMed] [Google Scholar]
- 16.Hansen B.G., Halkier B.A., Kliebenstein D.J. Identifying the molecular basis of QTLs: eQTLs add a new dimension. Trends Plant Sci. 2008;13:72–77. doi: 10.1016/j.tplants.2007.11.008. [DOI] [PubMed] [Google Scholar]
- 17.Lee E., Bussemaker H.J. Identifying the genetic determinants of transcription factor activity. Mol. Syst. Biol. 2010;6:412. doi: 10.1038/msb.2010.64. [DOI] [PMC free article] [PubMed] [Google Scholar]
- 18.Paull E.O., Aytes A., Jones S.J., Subramaniam P.S., Giorgi F.M., Douglass E.F., Tagore S., Chu B., Vasciaveo A., Zheng S., et al. A modular master regulator landscape controls cancer transcriptional identity. Cell. 2021;184:334–351.e20. doi: 10.1016/j.cell.2020.11.045. [DOI] [PMC free article] [PubMed] [Google Scholar]
- 19.Chen J.C., Alvarez M.J., Talos F., Dhruv H., Rieckhof G.E., Iyer A., Diefes K.L., Aldape K., Berens M., Shen M.M., Califano A. Identification of Causal Genetic Drivers of Human Disease through Systems-Level Analysis of Regulatory Networks. Cell. 2014;159:402–414. doi: 10.1016/j.cell.2014.09.021. [DOI] [PMC free article] [PubMed] [Google Scholar]
- 20.Hoskins J.W., Chung C.C., O’Brien A., Zhong J., Connelly K., Collins I., Shi J., Amundadottir L.T. Inferred expression regulator activities suggest genes mediating cardiometabolic genetic signals. PLoS Comput. Biol. 2021;17 doi: 10.1371/journal.pcbi.1009563. [DOI] [PMC free article] [PubMed] [Google Scholar]
- 21.Uhlén M., Fagerberg L., Hallström B.M., Lindskog C., Oksvold P., Mardinoglu A., Sivertsson Å., Kampf C., Sjöstedt E., Asplund A., et al. Tissue-based map of the human proteome. Science. 2015;347 doi: 10.1126/science.1260419. [DOI] [PubMed] [Google Scholar]
- 22.Bussemaker H.J., Li H., Siggia E.D. Regulatory element detection using correlation with expression. Nat. Genet. 2001;27:167–171. doi: 10.1038/84792. [DOI] [PubMed] [Google Scholar]
- 23.Gao F., Foat B.C., Bussemaker H.J. Defining transcriptional networks through integrative modeling of mRNA expression and transcription factor binding data. BMC Bioinf. 2004;5:31. doi: 10.1186/1471-2105-5-31. [DOI] [PMC free article] [PubMed] [Google Scholar]
- 24.Foat B.C., Morozov A.V., Bussemaker H.J. Statistical mechanical modeling of genome-wide transcription factor occupancy data by MatrixREDUCE. Bioinforma. Oxf. Engl. 2006;22:e141–e149. doi: 10.1093/bioinformatics/btl223. [DOI] [PubMed] [Google Scholar]
- 25.Conlon E.M., Liu X.S., Lieb J.D., Liu J.S. Integrating regulatory motif discovery and genome-wide expression analysis. Proc. Natl. Acad. Sci. USA. 2003;100:3339–3344. doi: 10.1073/pnas.0630591100. [DOI] [PMC free article] [PubMed] [Google Scholar]
- 26.Schaid D.J., Chen W., Larson N.B. From genome-wide associations to candidate causal variants by statistical fine-mapping. Nat. Rev. Genet. 2018;19:491–504. doi: 10.1038/s41576-018-0016-z. [DOI] [PMC free article] [PubMed] [Google Scholar]
- 27.Balwierz P.J., Pachkov M., Arnold P., Gruber A.J., Zavolan M., van Nimwegen E. ISMARA: automated modeling of genomic signals as a democracy of regulatory motifs. Genome Res. 2014;24:869–884. doi: 10.1101/gr.169508.113. [DOI] [PMC free article] [PubMed] [Google Scholar]
- 28.Li Y., Liang M., Zhang Z. Regression Analysis of Combined Gene Expression Regulation in Acute Myeloid Leukemia. PLoS Comput. Biol. 2014;10 doi: 10.1371/journal.pcbi.1003908. [DOI] [PMC free article] [PubMed] [Google Scholar]
- 29.Schubert M., Klinger B., Klünemann M., Sieber A., Uhlitz F., Sauer S., Garnett M.J., Blüthgen N., Saez-Rodriguez J. Perturbation-response genes reveal signaling footprints in cancer gene expression. Nat. Commun. 2018;9:20. doi: 10.1038/s41467-017-02391-6. [DOI] [PMC free article] [PubMed] [Google Scholar]
- 30.Barenco M., Papouli E., Shah S., Brewer D., Miller C.J., Hubank M. rHVDM: an R package to predict the activity and targets of a transcription factor. Bioinformatics. 2009;25:419–420. doi: 10.1093/bioinformatics/btn639. [DOI] [PubMed] [Google Scholar]
- 31.Chen Y., Widschwendter M., Teschendorff A.E. Systems-epigenomics inference of transcription factor activity implicates aryl-hydrocarbon-receptor inactivation as a key event in lung cancer development. Genome Biol. 2017;18:236. doi: 10.1186/s13059-017-1366-0. [DOI] [PMC free article] [PubMed] [Google Scholar]
- 32.Fröhlich H. biRte: Bayesian inference of context-specific regulator activities and transcriptional networks. Bioinformatics. 2015;31:3290–3298. doi: 10.1093/bioinformatics/btv379. [DOI] [PubMed] [Google Scholar]
- 33.Fu Y., Jarboe L.R., Dickerson J.A. Reconstructing genome-wide regulatory network of E. coli using transcriptome data and predicted transcription factor activities. BMC Bioinf. 2011;12:233. doi: 10.1186/1471-2105-12-233. [DOI] [PMC free article] [PubMed] [Google Scholar]
- 34.Jiang P., Freedman M.L., Liu J.S., Liu X.S. Inference of transcriptional regulation in cancers. Proc. Natl. Acad. Sci. USA. 2015;112:7731–7736. doi: 10.1073/pnas.1424272112. [DOI] [PMC free article] [PubMed] [Google Scholar]
- 35.Khanin R., Vinciotti V., Mersinias V., Smith C.P., Wit E. Statistical reconstruction of transcription factor activity using Michaelis-Menten kinetics. Biometrics. 2007;63:816–823. doi: 10.1111/j.1541-0420.2007.00757.x. [DOI] [PubMed] [Google Scholar]
- 36.Nachman I., Regev A., Friedman N. Inferring quantitative models of regulatory networks from expression data. Bioinforma. Oxf. Engl. 2004;20(Suppl 1):i248–i256. doi: 10.1093/bioinformatics/bth941. [DOI] [PubMed] [Google Scholar]
- 37.Sanguinetti G., Lawrence N.D., Rattray M. Probabilistic inference of transcription factor concentrations and gene-specific regulatory activities. Bioinformatics. 2006;22:2775–2781. doi: 10.1093/bioinformatics/btl473. [DOI] [PubMed] [Google Scholar]
- 38.Schacht T., Oswald M., Eils R., Eichmüller S.B., König R. Estimating the activity of transcription factors by the effect on their target genes. Bioinforma. Oxf. Engl. 2014;30:i401–i407. doi: 10.1093/bioinformatics/btu446. [DOI] [PMC free article] [PubMed] [Google Scholar]
- 39.Boulesteix A.-L., Strimmer K. Predicting transcription factor activities from combined analysis of microarray and ChIP data: a partial least squares approach. Theor. Biol. Med. Model. 2005;2:23. doi: 10.1186/1742-4682-2-23. [DOI] [PMC free article] [PubMed] [Google Scholar]
- 40.Trescher S., Münchmeyer J., Leser U. Estimating genome-wide regulatory activity from multi-omics data sets using mathematical optimization. BMC Syst. Biol. 2017;11:41. doi: 10.1186/s12918-017-0419-z. [DOI] [PMC free article] [PubMed] [Google Scholar]
- 41.Robinson M.D., McCarthy D.J., Smyth G.K. edgeR: a Bioconductor package for differential expression analysis of digital gene expression data. Bioinforma. Oxf. Engl. 2010;26:139–140. doi: 10.1093/bioinformatics/btp616. [DOI] [PMC free article] [PubMed] [Google Scholar]
- 42.ENCODE Project Consortium. Kundaje A., Aldred S.F., Collins P.J., Davis C.A., Doyle F., Epstein C.B., Frietze S., Harrow J., Kaul R., et al. An integrated encyclopedia of DNA elements in the human genome. Nature. 2012;489:57–74. doi: 10.1038/nature11247. [DOI] [PMC free article] [PubMed] [Google Scholar]
- 43.Dixon J.R., Gorkin D.U., Ren B. Chromatin Domains: the Unit of Chromosome Organization. Mol. Cell. 2016;62:668–680. doi: 10.1016/j.molcel.2016.05.018. [DOI] [PMC free article] [PubMed] [Google Scholar]
- 44.Alvarez M.J., Shen Y., Giorgi F.M., Lachmann A., Ding B.B., Ye B.H., Califano A. Functional characterization of somatic mutations in cancer using network-based inference of protein activity. Nat. Genet. 2016;48:838–847. doi: 10.1038/ng.3593. [DOI] [PMC free article] [PubMed] [Google Scholar]
- 45.Taniguchi N., Caramés B., Ronfani L., Ulmer U., Komiya S., Bianchi M.E., Lotz M. Aging-related loss of the chromatin protein HMGB2 in articular cartilage is linked to reduced cellularity and osteoarthritis. Proc. Natl. Acad. Sci. USA. 2009;106:1181–1186. doi: 10.1073/pnas.0806062106. [DOI] [PMC free article] [PubMed] [Google Scholar]
- 46.Loeser R.F., Collins J.A., Diekman B.O. Ageing and the pathogenesis of osteoarthritis. Nat. Rev. Rheumatol. 2016;12:412–420. doi: 10.1038/nrrheum.2016.65. [DOI] [PMC free article] [PubMed] [Google Scholar]
- 47.Chen K., Zhang J., Liang F., Zhu Q., Cai S., Tong X., He Z., Liu X., Chen Y., Mo D. HMGB2 orchestrates mitotic clonal expansion by binding to the promoter of C/EBPβ to facilitate adipogenesis. Cell Death Dis. 2021;12:666–712. doi: 10.1038/s41419-021-03959-3. [DOI] [PMC free article] [PubMed] [Google Scholar]
- 48.Hirata-Tsuchiya S., Fukushima H., Katagiri T., Ohte S., Shin M., Nagano K., Aoki K., Morotomi T., Sugiyama G., Nakatomi C., et al. Inhibition of BMP2-Induced Bone Formation by the p65 Subunit of NF-κB via an Interaction With Smad4. Mol. Endocrinol. 2014;28:1460–1470. doi: 10.1210/me.2014-1094. [DOI] [PMC free article] [PubMed] [Google Scholar]
- 49.Fulco C.P., Nasser J., Jones T.R., Munson G., Bergman D.T., Subramanian V., Grossman S.R., Anyoha R., Doughty B.R., Patwardhan T.A., et al. Activity-by-contact model of enhancer–promoter regulation from thousands of CRISPR perturbations. Nat. Genet. 2019;51:1664–1669. doi: 10.1038/s41588-019-0538-0. [DOI] [PMC free article] [PubMed] [Google Scholar]
- 50.Szklarczyk D., Gable A.L., Lyon D., Junge A., Wyder S., Huerta-Cepas J., Simonovic M., Doncheva N.T., Morris J.H., Bork P., et al. STRING v11: protein-protein association networks with increased coverage, supporting functional discovery in genome-wide experimental datasets. Nucleic Acids Res. 2019;47:D607–D613. doi: 10.1093/nar/gky1131. [DOI] [PMC free article] [PubMed] [Google Scholar]
- 51.Schraivogel D., Gschwind A.R., Milbank J.H., Leonce D.R., Jakob P., Mathur L., Korbel J.O., Merten C.A., Velten L., Steinmetz L.M. Targeted Perturb-seq enables genome-scale genetic screens in single cells. Nat. Methods. 2020;17:629–635. doi: 10.1038/s41592-020-0837-5. [DOI] [PMC free article] [PubMed] [Google Scholar]
- 52.Replogle J.M., Saunders R.A., Pogson A.N., Hussmann J.A., Lenail A., Guna A., Mascibroda L., Wagner E.J., Adelman K., Bonnar J.L., et al. 2021. Mapping Information-Rich Genotype-Phenotype Landscapes with Genome-Scale Perturb-Seq. [DOI] [PMC free article] [PubMed] [Google Scholar]
- 53.Kerimov N., Hayhurst J.D., Peikova K., Manning J.R., Walter P., Kolberg L., Samoviča M., Sakthivel M.P., Kuzmin I., Trevanion S.J., et al. A compendium of uniformly processed human gene expression and splicing quantitative trait loci. Nat. Genet. 2021;53:1290–1299. doi: 10.1038/s41588-021-00924-w. [DOI] [PMC free article] [PubMed] [Google Scholar]
- 54.Liao Y., Smyth G.K., Shi W. featureCounts: an efficient general purpose program for assigning sequence reads to genomic features. Bioinforma. Oxf. Engl. 2014;30:923–930. doi: 10.1093/bioinformatics/btt656. [DOI] [PubMed] [Google Scholar]
- 55.Love M.I., Huber W., Anders S. Moderated estimation of fold change and dispersion for RNA-seq data with DESeq2. Genome Biol. 2014;15:550. doi: 10.1186/s13059-014-0550-8. [DOI] [PMC free article] [PubMed] [Google Scholar]
- 56.Abadi M., Barham P., Chen J., Chen Z., Davis A., Dean J., Devin M., Ghemawat S., Irving G., Isard M., et al. 2016. {TensorFlow}: A System for {Large-Scale} Machine Learning; pp. 265–283. [Google Scholar]
- 57.Lachmann A., Giorgi F.M., Lopez G., Califano A. ARACNe-AP: gene network reverse engineering through adaptive partitioning inference of mutual information. Bioinforma. Oxf. Engl. 2016;32:2233–2235. doi: 10.1093/bioinformatics/btw216. [DOI] [PMC free article] [PubMed] [Google Scholar]
- 58.Yang J., Lee S.H., Goddard M.E., Visscher P.M. GCTA: a tool for genome-wide complex trait analysis. Am. J. Hum. Genet. 2011;88:76–82. doi: 10.1016/j.ajhg.2010.11.011. [DOI] [PMC free article] [PubMed] [Google Scholar]
- 59.Benner C., Spencer C.C.A., Havulinna A.S., Salomaa V., Ripatti S., Pirinen M. FINEMAP: efficient variable selection using summary data from genome-wide association studies. Bioinformatics. 2016;32:1493–1501. doi: 10.1093/bioinformatics/btw018. [DOI] [PMC free article] [PubMed] [Google Scholar]
- 60.McLaren W., Gil L., Hunt S.E., Riat H.S., Ritchie G.R.S., Thormann A., Flicek P., Cunningham F. The Ensembl Variant Effect Predictor. Genome Biol. 2016;17:122. doi: 10.1186/s13059-016-0974-4. [DOI] [PMC free article] [PubMed] [Google Scholar]
- 61.Giambartolomei C., Vukcevic D., Schadt E.E., Franke L., Hingorani A.D., Wallace C., Plagnol V. Bayesian Test for Colocalisation between Pairs of Genetic Association Studies Using Summary Statistics. PLoS Genet. 2014;10 doi: 10.1371/journal.pgen.1004383. [DOI] [PMC free article] [PubMed] [Google Scholar]
- 62.Liu B., Gloudemans M.J., Rao A.S., Ingelsson E., Montgomery S.B. Abundant associations with gene expression complicate GWAS follow-up. Nat. Genet. 2019;51:768–769. doi: 10.1038/s41588-019-0404-0. [DOI] [PMC free article] [PubMed] [Google Scholar]
- 63.Frankish A., Diekhans M., Jungreis I., Lagarde J., Loveland J.E., Mudge J.M., Sisu C., Wright J.C., Armstrong J., Barnes I., et al. GENCODE 2021. Nucleic Acids Res. 2021;49:D916–D923. doi: 10.1093/nar/gkaa1087. [DOI] [PMC free article] [PubMed] [Google Scholar]
- 64.Zhu A., Ibrahim J.G., Love M.I. Heavy-tailed prior distributions for sequence count data: removing the noise and preserving large differences. Bioinforma. Oxf. Engl. 2019;35:2084–2092. doi: 10.1093/bioinformatics/bty895. [DOI] [PMC free article] [PubMed] [Google Scholar]
- 65.Yang J., Ferreira T., Morris A.P., Medland S.E., Genetic Investigation of ANthropometric Traits GIANT Consortium. DIAbetes Genetics Replication And Meta-analysis DIAGRAM Consortium. Madden P.A.F., Heath A.C., Martin N.G., Montgomery G.W., et al. Conditional and joint multiple-SNP analysis of GWAS summary statistics identifies additional variants influencing complex traits. Nat. Genet. 2012;44:369–375. doi: 10.1038/ng.2213. [DOI] [PMC free article] [PubMed] [Google Scholar]
- 66.Purcell S., Neale B., Todd-Brown K., Thomas L., Ferreira M.A.R., Bender D., Maller J., Sklar P., de Bakker P.I.W., Daly M.J., Sham P.C. PLINK: a tool set for whole-genome association and population-based linkage analyses. Am. J. Hum. Genet. 2007;81:559–575. doi: 10.1086/519795. [DOI] [PMC free article] [PubMed] [Google Scholar]
- 67.Benner C., Havulinna A.S., Järvelin M.R., Salomaa V., Ripatti S., Pirinen M. Prospects of Fine-Mapping Trait-Associated Genomic Regions by Using Summary Statistics from Genome-wide Association Studies. Am. J. Hum. Genet. 2017;101:539–551. doi: 10.1016/j.ajhg.2017.08.012. [DOI] [PMC free article] [PubMed] [Google Scholar]
Associated Data
This section collects any data citations, data availability statements, or supplementary materials included in this article.
Supplementary Materials
Data Availability Statement
All original code has been deposited at GitHub (http://github.com/BussemakerLab/Li-aQTL/) and Zenodo (https://zenodo.org/record/8118317) and is publicly available as of the date of publication. Summary statistics and fine-mapping results of all aQTL analyses are available at http://bussemakerlab.org/papers/Li-aQTL/. This paper analyzes existing, publicly available data. These datasets and accession numbers are listed in the Key Resources Table and Table S3. Any additional information required to reanalyze the data reported in this paper is available from the lead contact upon request.