

Abstract
Background:
Studies of the immune landscape led to breakthrough trials of programmed death-1 (PD-1) inhibitors for recurrent/metastatic head and neck squamous cell carcinoma (HNSC) therapy. We investigated the timing, influence of somatic copy-number alterations (SCNAs) and clinical implications of PD-L1 and immune-cell patterns in oral precancer (OPC).
Methods:
We evaluated spatial CD3, CD3/8 and CD68 density (cells/mm2) and PD-L1 (membranous expression in cytokeratin-positive intraepithelial neoplastic cells and CD68) patterns by multiplex immunofluorescence in a 188-patient prospective OPC cohort, characterized by clinical, histologic and SCNA risk factors and protocol-specified primary endpoint of invasive cancer. We used Wilcoxon rank-sum and Fisher’s exact tests, linear mixed effect models, mediation, and Cox regression and recursive-partitioning analyses.
Results:
Epithelial, but not CD68 immune-cell, PD-L1 expression was detected in 28% of OPCs, correlated with immune-cell infiltration, 9p21.3 LOH, and inferior OCFS, notably in OPCs with low CD3/8 cell density, dysplasia, and/or 9p21.3 LOH. High CD3/8 cell density in dysplastic lesions predicted better OCFS, and eliminated the excess risk associated with prior oral cancer and dysplasia. PD-L1 and CD3/8 patterns revealed inferior OCFS in PD-L1 high intrinsic induction and dysplastic immune-cold subgroups.
Conclusion:
This report provides spatial insight into the immune landscape and drivers of OPCs, and a publicly available immunogenomic dataset for future precancer interrogation. The data suggest that 9p21.3 LOH triggers an immune-hot inflammatory phenotype; while increased 9p deletion size encompassing CD274 at 9p24.1 may contribute to CD3/8 and PD-L1 depletion during invasive transition. The inferior OCFS in PD-L1-high, immune-cold OPCs support the development of T-cell recruitment strategies.
Keywords: Immune profiling, PD-L1, genomics, copy-number alterations, tumor microenvironment, T-cells, precancer, head and neck cancer, HPV
INTRODUCTION
Cancers of the oral cavity are the most common head and neck squamous-cell carcinomas (HNSC) in the United States (US) and globally, causing substantial morbidity and mortality with approximately 300,000 annual incident cases worldwide and anticipated to increase by 60% through 2035 1, 2. Importantly, unlike HPV-associated oropharyngeal cancers, 5-year survival figures following oral cancers are low and unchanged in the US since the 1970s 3. Oral cavity cancers may be preceded by pre-malignant lesions, or oral precancers (OPCs), histologically characterized as hyperkeratosis, hyperplasia or dysplasia, and often clinically manifested as leukoplakia and/or erythroplakia. Innovative strategies based on deep interrogation of preinvasive biology and malignant transformation, may identify high-risk OPCs and actionable pathways for oral cancer interception 4, 5.
Studies of the immune landscape in HNSC have led to breakthrough trials of programmed death-1 (PD-1) inhibitors for recurrent/metastatic disease 6 7–9. This underscores the importance of immune modulation in these tumors, despite a still suboptimal durable response rate of ~15% in advanced cancers. Although far from proven, it is tempting to speculate that the immune response may be strongest at the earliest neoplastic stages 10, 11. As such, new, immune-based strategies could be developed to reduce the high global burden of HNSC, by intercepting OPC, the most common precursor of the most common US and global HNSC presentation: HPV− oral squamous cell carcinomas. Studies of OPC patient samples have been limited to preclinical and retrospective, small and/or cross-sectional clinical studies, suggesting features of immune evasion 10–14, including PD-ligand-1 (PD-L1) expression, albeit less frequent and/or intense than in HNSC 15, 16. Furthermore, it is unclear when, in the tumorigenic process, this immune inhibitory mechanism evolves, its biologic drivers and influence on malignant transformation. Meaningful advances in this field have been limited by lack of robust cohorts followed long term, available specimens, and other technical issues, including ample multiplex analysis of minute tissue biopsies. SCNA profiles (loss of heterozygosity, LOH, at 3p14 and/or 9p21.3) identified high-risk OPCs in retrospective analyses and prospective studies, initially reported by our group 17, and confirmed and extended subsequently by other groups 18–21. Although LOH is validated as a molecular marker of oral cancer risk, it is not targetable. In contrast, immune pathways, notably PD-1/-L1, in OPCs could represent pharmacological targets to reduce cancer risk in the appropriate high-risk context 10.
The aim of the present study was to investigate the influence of the immune milieu, and PD-L1 pathway in oral cancer risk in patients with precancers. Our primary hypothesis is that PD-L1-mediated immune evasion in OPCs contributes to the invasive-cancer transition (especially in SCNA defined high-risk lesions), and may represent opportunities for immune interception as a strategy for cancer prevention. To test this hypothesis, we developed a multiplex immunofluorescence platform to maximize immune profiling of scarce OPC specimens in a unique prospective and rigorously annotated immunogenetic cohort to protocol-mandated invasive cancer primary endpoint, and to correlate these findings with established clinical and pathologic risk factors (i.e., prior oral cancer and dysplasia), and oral cancer-free survival (OCFS). OPCs were classified into prespecified biologically-driven immune and risk subgroups based on frameworks of T-cell infiltration and PD-L1 expression patterns reported in cancers that could help describe their interactions with the immune system 22–24, and provide further spatial insight into the influence and drivers of OPC microenvironment and prospects for immune interception.
METHODS
Tissue specimens, clinical and genomic copy-number data
The prospective oral precancer patient cohort included 188 patients with baseline formalin-fixed, paraffin-embedded, LOH profiled oral precancer (OPC) samples collected prior to any intervention, from patients enrolled in the erlotinib prevention of oral cancer (EPOC) trial. As in the trial’s primary report25, erlotinib had no impact on oral cancer-free survival, and the number of patients (N=40) who received erlotinib and had immune profiling performed was too low to formally investigate immune-marker-by-treatment interactions. Patients were stratified by prior history of oral cancer and prospectively followed, as previously described 25. Clinical data have been updated since the primary EPOC publication. Invasive oral cancer developed in 74 (39%) of the 188 patients included in this analysis. The 5-y oral cancer-free survival (OCFS) for the population was 71.8%, with a median follow-up time for censored observations of 90.8 months. LOH profiles and chr7 polysomy in EPOC were determined as previously described 25. The study was registered in ClinicalTrials.gov (NCT00402779) and approved by the Institutional Review Board, including clinical interventions and analysis of correlative biomarkers.
Multiplex immune profiling
We performed multiplex immune profiling utilizing the Opal chemistry and multispectral microscopy Vectra™ system (Perkin-Elmer) / Nuance software. The multiplex system panel included five antibodies that were stained on the same slide and labeled using a tyramide-signal amplification-based kit (Opal™, PerkinElmer): anti-CD3 (Dako, T lymphocyte marker), anti-CD8 (clone C8/144B, Thermo Scientific, present on cytotoxic T cells), anti-PD-L1 (clone E1L3N, Cell Signal), anti-CD68 (clone PG-M1, Dako, macrophage lineage marker), anti-cytokeratin (clone AE1/AE3, Dako), and DAPI (nuclear staining). Each antibody was labeled with a specific fluorophore. All antibodies had been optimized for immunofluorescence by examination of positive and negative controls and testing of the antibodies by Western blotting. The scanning and image capture was performed with a multispectral microscope (Vectra™, PerkinElmer), and analysis was performed with a specialized image analysis software (InForm™, PerkinElmer) capable of counting the number of cells with positive staining for each marker in a specified area. Representative areas from each sample (range 1–10, median 6) measuring 1 mm2 each, localized either in the epithelial or subepithelial (or stromal) layers, were randomly selected for quantification of the markers. The scoring of PD-L1 was expressed as percentage of positive (membrane) epithelial cells (AE1/AE3 positive) in the epithelial layer. CD68-immune cell/PD-L1 positive cells were evaluated as cell density (i.e., cells/mm2) in the epithelial and stromal layers.
SCNA events
The overall SCNA level was calculated based on available information on the SCNA level at different genomic loci, as described in detail by William et al 2021 26.
Statistical analysis
Analyses were performed using SAS software (version 9.4; SAS Institute, Cary, NC). We used Wilcoxon rank-sum test to compare the distribution of a continuous variable between two groups defining by a binary variable, and Fisher’s exact tests to evaluate the association between binary markers and categorical factors. Pair-wise correlations between two markers in a continuous scale were evaluated by Spearman correlation coefficients. For biomarkers assessed in a continuous scale, we transformed values from multiple areas into logarithm scale, fitted with linear mixed effect models to account for within-patient variation 27. OCFS was estimated by the Kaplan-Meier method considering invasive-cancer development or death as events. We tested the difference in survival between groups using log-rank test. Cox regression model was used to evaluate the association between the markers and OCFS.
For the Cox proportional-hazards model for PD-L1, all patients were split into PD-L1 positive and PD-L1 negative based on the percentile of PD-L1 expression percentage. For each percentile, patients with PD-L1 more than the percentile were considered PD-L1 positive and patients with PD-L1 less than the percentile were considered PD-L1 negative. A univariate regression was applied based on each percentile, hazard ratio and Z-score. In order to understand the spatial associations between immune marker and PD-L1, we applied a multivariable logistic regression by using PD-L1 positive (binary), histology (dysplasia or not), 9p LOH and polysomy chr7 as covariates to predict CD3, CD3/8 and CD68 expression. A similar logistic model containing 9p21.3 LOH, 3p14 LOH, 17p13.1 LOH, SCNA level and PD-L1 expression levels was also applied for the prediction of CD3, CD3/8 and CD68 spatial density level as well. Mediation analysis was applied to further examine whether or not the effect of markers on OCSF was mediated by PD-L1 28. Recursive-partitioning analysis (for censored survival data) using a classification and regression trees algorithm was performed using rpart package in R to identify biomarker-defined subgroups that were the most different in their OCFS.
RESULTS
PD-L1 expression in oral precancers
Distribution of membranous PD-L1 expression in cytokeratin-positive intraepithelial neoplastic cells for each patient is shown in Fig. 1A. After computing the mean PD-L1 expression for each patient, 82 samples (44%) did not exhibit any detectable PD-L1 expression in epithelial cells (i.e., all precancerous epithelial cells in all areas analyzed were AE1/AE3 positive/PD-L1 negative). Of the remaining 106 (56%) lesion samples, low levels of membranous PD-L1 expression in precancerous AE1/AE3 positive cells (as defined by >0 to <1% average percentage of all epithelial areas analyzed in each patient) were detected in 53 samples (28%). Mean PD-L1 expression in AE1/AE3 positive precancerous cells of 1% to <5%, 5% to <10%, 10% to <50%, and ≥50% was observed in 13 (7%), 13 (7%), 21 (11%), and 6 (3%) samples, respectively. PD-L1 expression in epithelial and stromal CD68 macrophages (i.e., CD68-positive/PD-L1 positive cells) were detected in 54% and 72% of the samples, respectively. Of the 82 samples with no PD-L1 expression in epithelial cells, 23 (28%) had CD68-positive/PD-L1 positive cells in the epithelial layer and 42 (51%) had CD68-positive/PD-L1 positive cells in the stromal layer.
Figure 1. PD-L1 patterns and influence on oral cancer-free survival.
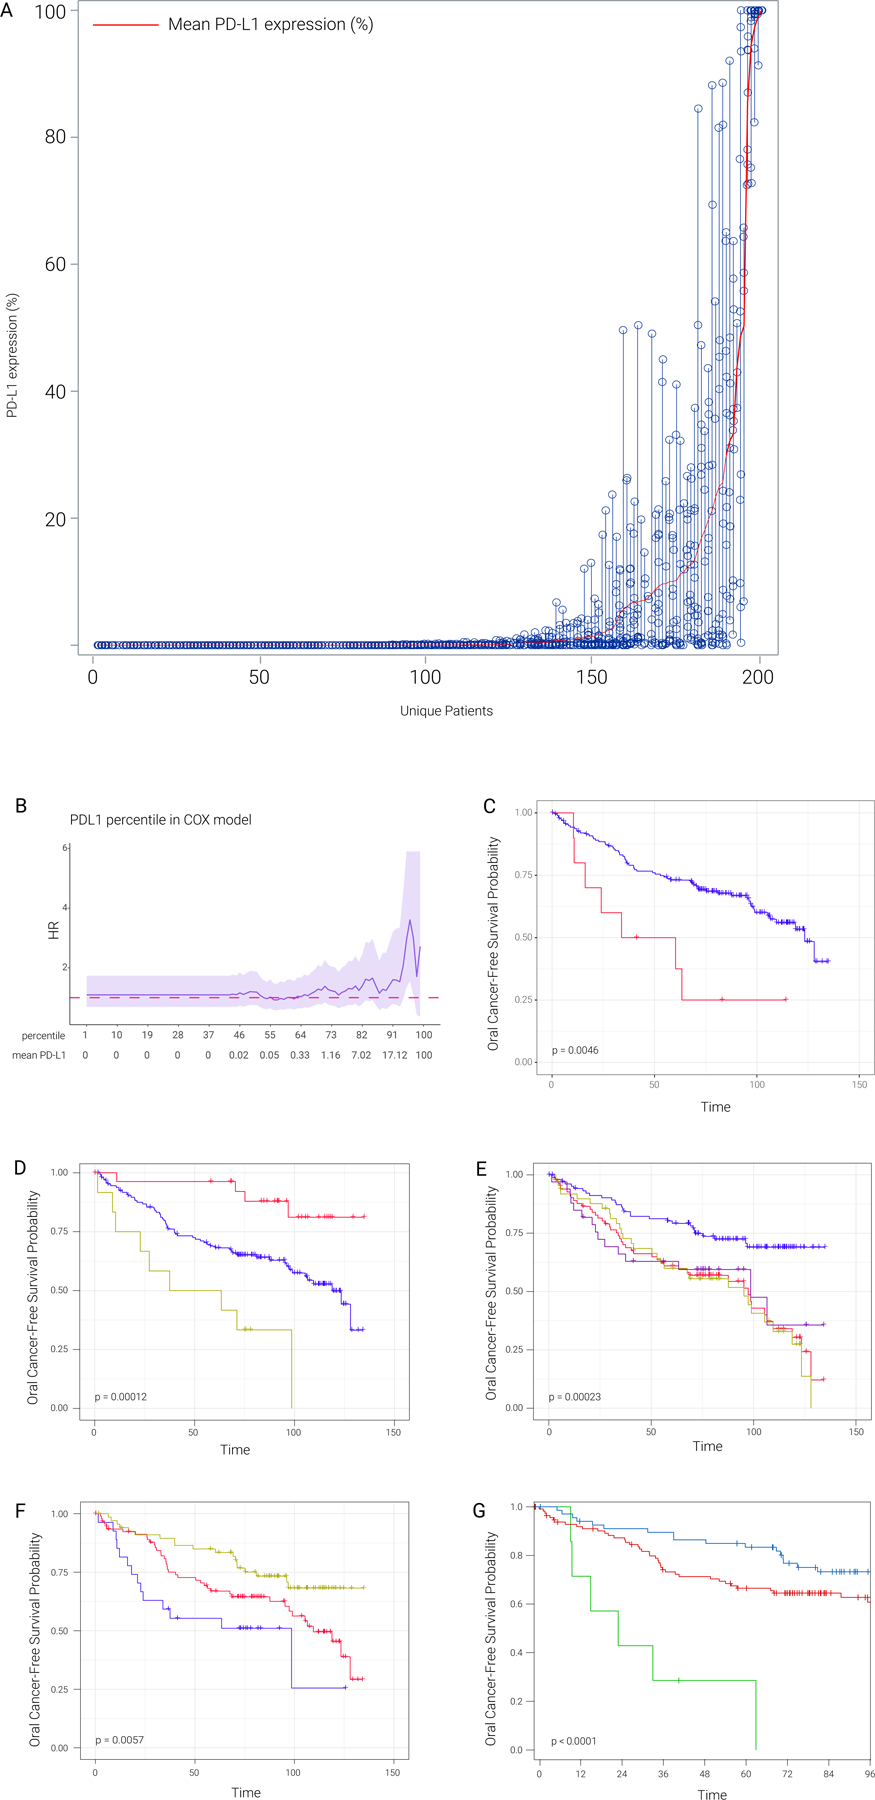
A) Distribution of PD-L1 mean expression level (PD-L1 percentage) across patients; open circles indicate the percentage of PD-L1 expressing cells in each area analyzed per sample. Each column shows the PD-L1 readings from all areas of each patient, ordered from lowest to highest by the mean PD-L1 expression levels.
B) Hazard ratio (HR) values across different percentiles of PD-L1 mean percentage. In this analysis, any PD-L1 mean percentage larger than the percentile represents PD-L1 positive, any PD-L1 mean percentage smaller than percentile represents PD-L1 negative. HR is evaluated based on PD-L1 positive versus PD-L1 negative. Dark pink dashed line represents neutral HR (HR=1), 95% CI was shaded in light purple. The mean PD-L1 expression from immunohistochemistry is also listed in the second row. The plot shows that at a very high cutoff to define PD-L1 positive, PD-L1 positive was associated with poor OCFS (Fig 1C), this OCFS pattern was not observed at lower PD-L1 cutoffs.
C) Kaplan-Meier plot between PD-L1 positive (red, patients with more than 95th percentile of PD-L1 mean percentage) and PD-L1 negative (blue, patients with less than 95th percentile of PD-L1 mean percentage).
D) Kaplan-Meier plots for epithelial CD3/8 level, 9p LOH and PDL1. Red line represents patients with high epithelial CD3/8 level, no LOH in 9p and PDL1 negative (<1% PD-L1 mean percentage). Yellow line represents patients with low epithelial CD/CD8 level, 9p LOH and PDL1 positive (>1% PD-L1 mean percentage). Blue line represents other patients in the cohort.
E) Kaplan-Meier plots for 9p21.3 LOH, dysplasia and PDL1. The survival analysis is based on our previously reported LOH plus dysplasia risk groups, in which PD-L1 positive and negative survival curves are shown with gold and purple color, showing no PD-L1 impact on the inferior survival driven by 9p21.3 LOH and dysplasia.
F) Kaplan-Meier plots (months) for dysplasia and PD-L1 level based on RPA analysis. Blue line represents patients with both dysplasia and PDL1 percentage >7.8%. Red line represents patients with both dysplasia and PDL1 percentage <7.8%. Yellow line represents patients with no dysplasia.
G) Kaplan-Meier plots for dysplasia and PD-L1 percentage cut off based on RPA analysis. Green line represents patients with both dysplasia and PD-L1 percentage >=32.73%. Red line represents patients with both dysplasia and PD-L1 percentage <32.73%. Blue line represents patients with no dysplasia.
PD-L1 expression and OCFS
On univariate analysis, higher PD-L1 expression in epithelial cells evaluated as a continuous variable was associated with inferior OCFS, with a hazard ratio (HR) of 1.011 (95% confidence interval [CI] 1.000 – 1.022, P=0.048), indicating a 1.1% increase in the hazard for oral cancer or death for every 1% increase in the PD-L1 expression level (Table 1). Immune-cell PD-L1 expression on CD68-positive cells, however, in the epithelial (p=0.12) or stromal (p=0.36) layers had no significant impact on OCFS (Table 1). We therefore focused all related subsequent survival analyses on epithelial PD-L1 expression (e.g., Fig. 1B–E, tables S1–4). Cox regression (proportional hazards regression) across different PD-L1 percentiles revealed inferior OCFS at a high PD-L1 cut off at the top 5% (p=0.046; Fig. 1B, C). Next, we assessed the influence of PD-L1 on OCFS in subgroups defined by immune cell infiltration (an established prognostic marker in invasive HNSC), histology, prior oral cancer and/or 9pLOH. The lowest OCFS was observed in patients with low epithelial CD3/8, 9p21.3 LOH and high PD-L1 (>=1%) in striking contrast to the favorable OCFS in patients with high CD3/8, low PD-L1 and 9p21 wild type (Fig. 1D). PD-L1 did not influence OCFS of patients with dysplasia plus 9p21 LOH (Fig. 1E). To further assess the influence of PD-L1 on OCFS, we performed recursive partitioning analyses (RPA), based on multiple model factors, including dysplasia and LOH (Figs. 1F–G and Figs. S1C, D show OCFS for PD-L1 cut offs 7.8% and 32.7%, respectively, determined based on RPA). The first split occurred at histology (no dysplasia versus dysplasia), followed by optimal cut-off PD-L1 expression levels within the dysplasia subgroup. The 5-year OCFS for subgroups defined by hyperplasia (N=67, Node 1), dysplasia and PD-L1 < 32.7% (N=112, Node 2), and dysplasia and PD-L1 ≥ 32.7% (N=7, Node 3) were 84.9, 66.5, and 28.6%, respectively (P<0.0001).
Table 1.
Univariate analysis for oral cancer-free survival according to clinical/demographic characteristics or biomarker.
| Variable | Comparison | HR | 95% CI | p-value | p-value (overall) |
|---|---|---|---|---|---|
| Age | per year increase | 0.994 | 0.975–1.014 | 0.57 | |
| Sex | male vs female | 0.95 | 0.602–1.500 | 0.83 | |
| Smoking status | current vs never | 0.601 | 0.264–1.367 | 0.22 | 0.17 |
| former vs never | 0.631 | 0.374–1.064 | 0.084 | ||
| Alcohol use | yes vs no | 0.561 | 0.263–1.196 | 0.13 | |
| Prior oral cancers | yes vs no | 1.232 | 0.747–2.032 | 0.41 | |
| Time from last oral cancer | 1–3 vs > 3 years | 0.767 | 0.292–2.018 | 0.59 | 0.4 |
| ≤ 1 vs > 3 years | 0.619 | 0.306–1.252 | 0.18 | ||
| Histology | mild, mod. dysplasia vs no dysplasia | 1.865 | 1.093–3.182 | 0.022 | 0.0071 |
| Severe dysplasia vs no dysplasia | 3.521 | 1.533–8.084 | 0.003 | ||
| LOH status* | positive vs negative | 1.63 | 0.967–2.748 | 0.07 | |
| Chr 7 copy number | gain vs diploid | 1.824 | 1.151–2.889 | 0.01 | |
| PD-L1, epithelial | > 1 vs ≤ 1% | 1.272 | 0.77–2.099 | 0.35 | |
| PD-L1, epithelial | ≥ 32.7 vs < 32.7% | 3.565 | 1.623–7.831 | 0.0015 | |
| PD-L1, epithelial | Per 1% increase | 1.011 | 1.000–1.022 | 0.048 | |
| CD3, epithelial | per 1 fold increase | 0.981 | 0.857–1.123 | 0.78 | |
| CD3/CD8, epithelial | per 1 fold increase | 0.964 | 0.898–1.035 | 0.31 | |
| CD68, epithelial | per 1 fold increase | 1.023 | 0.966–1.083 | 0.43 | |
| CD68/PD-L1, epithelial | > 0 vs 0 | 1.224 | 0.772–1.94 | 0.39 | |
| CD3, stromal | per 1 fold increase | 1.116 | 0.959–1.299 | 0.16 | |
| CD3/CD8, stromal | per 1 fold increase | 1.009 | 0.922–1.105 | 0.85 | |
| CD68, stromal | per 1 fold increase | 1.01 | 0.949–1.076 | 0.75 | |
| CD68/PD-L1, stromal | > 0 vs 0 | 1.32 | 0.767–2.271 | 0.32 |
Abbreviations: CI (confidence interval), HR (hazard ratio)
See methods for definitions
To study the complex interplay between PD-L1, and well-established genomic copy-number (i.e., LOH and polysomy) and histologic (i.e., dysplasia) markers of cancer risk, we utilized a regression tree model which included histology, LOH and epithelial PD-L1 expression (dichotomized at the 1% cut-off, as used in some HNSC clinical trials 7. PD-L1 negative precancers without dysplasia had the lowest risk of malignant transformation, followed by PD-L1 positive precancers without dysplasia or precancers with dysplasia but without LOH. The highest risk patients had dysplastic precancers with LOH. The OCFS differences among the three groups were statistically significant (p=0.0076). Using mediation analysis, we investigated whether the inferior OCFS associated with either histology, LOH or polysomy was mediated through increased PD-L1 expression. The analysis indicated that the average effects of histology, LOH, and polysomy on OCFS did not arise exclusively from their associations with PD-L1 expression.
Immune-cell and PD-L1 spatial distribution and genomic copy-number correlations
Multiplex immunofluorescence was used to evaluate immune-cell spatial density, distribution and PD-L1 (Table S3) within the epithelial and subepithelial, or stromal, compartments. CD3-positive T-cells were identified in all 188 OPC samples either in the epithelial or stromal layer. A minority of samples did not exhibit any infiltration of CD3/8-positive cells in the epithelial (12%), or stromal (6%) layers. CD68-positive cells were not detected in 23 (12%) and 14 (7%) samples in the epithelial and stromal layers, respectively. We next assessed clinical and SCNA factor associations with spatial immune cell densities and PD-L1 expression in epithelial cells, and did not find any correlation with any clinical factor we analyzed, including dysplasia (Fig. 2; Tables S4, 5). Importantly, history of prior oral cancer was associated with CD3/8 density (Fig. 2), but not with epithelial PD-L1 levels (Table S3) except in patients who developed OPC within 1 year of oral cancer diagnosis (see Discussion). We found evidence of a concerted immune response in OPCs (and PD-L1-mediated adaptive immune resistance), as shown in Fig. 2B (further supported by Fig. S2) by strong correlations between epithelial or stromal infiltration by CD3-positive, CD3-positive/CD8-positive, CD68-positive, and CD68-positive/PD-L1-positive immune cells, and epithelial PD-L1 expression (Spearman= 0.455, p<0.001 for PD-L1 vs CD3/8). PD-L1 was positively associated with CD3, CD8 and CD68 in every analysis here, including in 9 logistic regression models (Fig 2A, Table S6B).
Figure 2. Association of PD-L1 expression with clinical, immunological and genomic SCNA parameters.
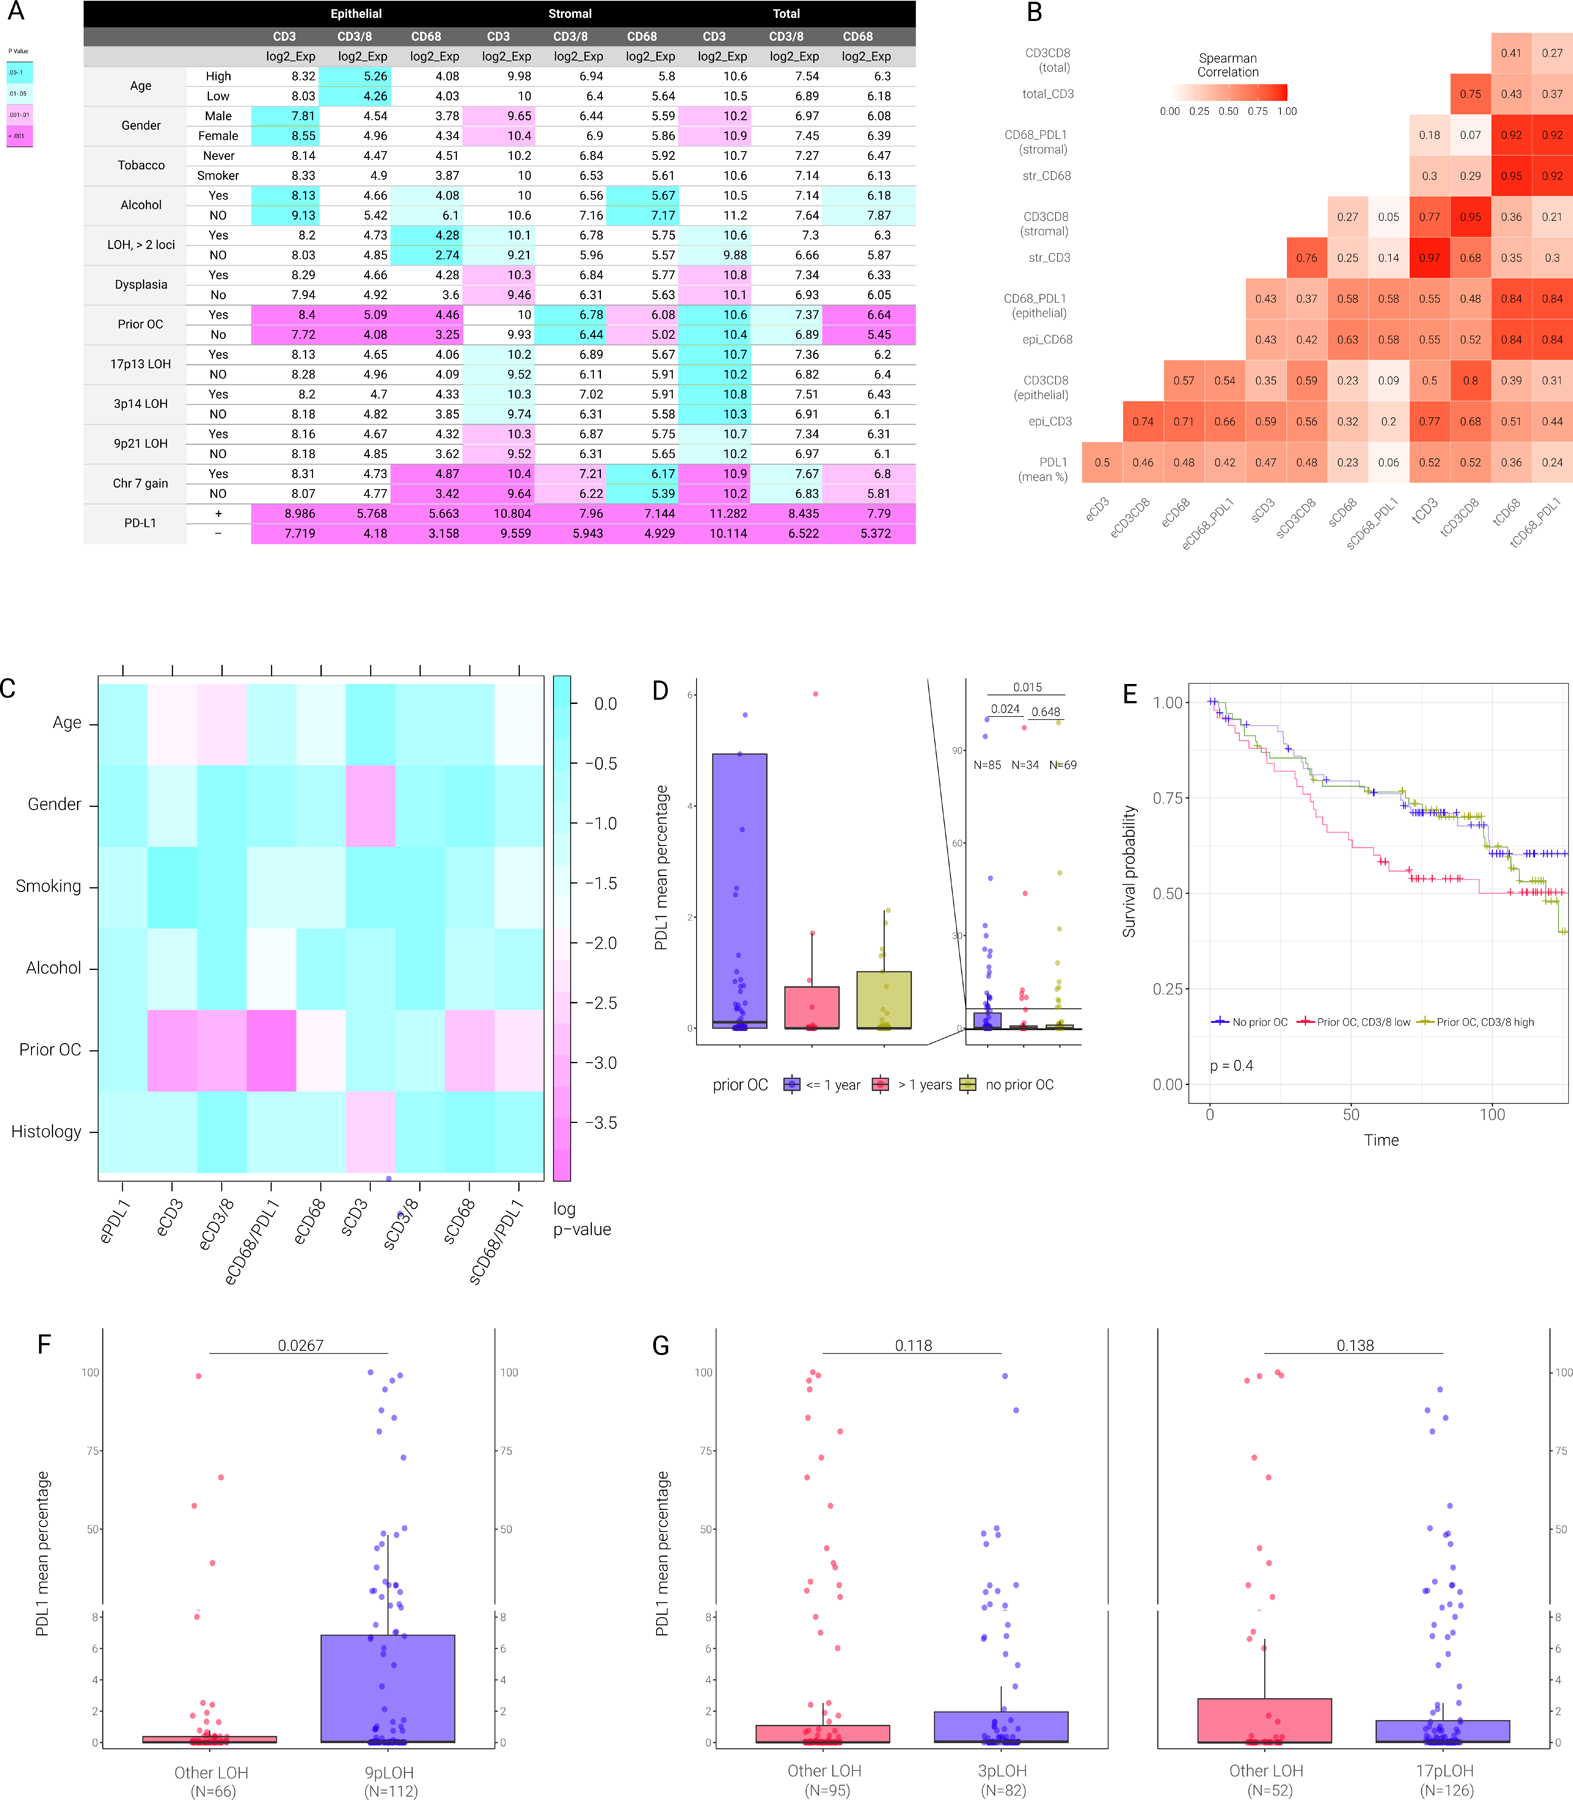
A) Association between CD3, CD3/8 and CD68 level (epithelial, stromal and total) and the indicated parameters. The number in each box represents the median of each parameter. P-values comparing the two indicated classes for each parameter (e.g., high vs low, YES vs NO) was evaluated with the linear mixed effect models on log2-transformed data. Turquoise color represents p-value between 0.05 to 0.1, light turquoise color represents p-value between 0.01 to 0.05, light magenta represents p-value between 0.001 to 0.1 and magenta represents p-value <0.001.
B) Heatmap shows the Spearman correlation coefficient (rho) between different immune markers. Color represents the rho level between any paired correlation. eCD3 or epi CD3 refers to epithelial CD3; sCD3 or strCD3 refers to stromal CD3; tCD3 or total CD3 refers to total CD3 level.
C) Pairwise p-values of the associations between clinical, histological, and immune markers.
D) Boxplot of PD-L1 mean percentage in patients having (or not) prior oral cancer (OC) at different year intervals prior to precancer diagnosis.
E) Kaplan-Meier plots for patients stratified as indicated based on prior oral cancer and epithelial CD3/8 level. Yellow line represents patients with prior oral cancer and high epithelial CD3/8. Red line represents patients with prior oral cancer and low epithelial CD3/8. Blue line represents patients with no prior oral cancer.
F) Box plot of PD-L1 mean percentage between patients with 9p21.3 LOH and other LOH.
G) Box plot of PD-L1 mean percentage between patients with 3p14 LOH (left panel) or 17p13 LOH and other LOH (right panel).
LOH profiles and chr7 polysomy, previously characterized as molecular markers of oral cancer risk in patients with OPCs 18–21, 25, 29, were investigated for their correlations with PD-L1 expression (Fig. S1A, B). LOH and polysomy were associated with increased expression of PD-L1 (p=0.007 and p=0.008, respectively). After classifying PD-L1 expression in neoplastic epithelial cells into a binary category by applying a 1% cutoff, there were 41 (33.3%) precancers with ≥1% PD-L1 expression in the LOH positive group versus 12 (18.5%) in the LOH negative group (p = 0.04, Fisher’s exact test). Similarly, there were 29 (40.3%) precancers with ≥1% PD-L1 expression in the polysomy group versus 24 (21.1%) in the normal, diploid group (p = 0.007, Fisher’s exact test). When considered individually (in univariate analysis), 9p21.3 loss was associated with epithelial PD-L1 levels (P = 0.027; Fig. 2F); 3p14, 17p13.1 and most minor LOH-risk sites were not associated with PD-L1 expression levels (Fig. 2G, Fig. S3).
Immune-cell infiltration, prior oral cancer, immune memory, and OCFS
We assessed the associations between immune-cell infiltration in OPCs and subsequent oral cancer risk, and did not find any associations between T cell or macrophage infiltration and OCFS in the population as a whole (Table 1, Fig. 3). However, we found that CD3/8 epithelial cell density in dysplastic lesions was the only immune-cell parameter that statistically significantly predicted OCFS (Fig. 3; Table S6). We also evaluated immune-cell infiltration and OCFS, based on the assumption that effector memory T cells may comprise part of the precancer immune microenvironment. Patients with a prior oral cancer history had higher epithelial immune cell infiltration (as previously noted, Fig. 2), suggesting immune memory priming. A prior history of oral cancer and dysplasia are established precancer risk factors for subsequent oral cancer 25,30. Epithelial CD3/CD8-positive T-cell infiltration in oral precancers in patients with a prior history of oral cancer was higher than in patients without prior oral cancer (median = 69.3 vs 22.6, respectively, P = 0.0005). Among patients with prior oral cancer, those who had the prior cancer within 1 year of OPC diagnosis had highest CD3/8 in epithelium (p = 0.0466 for comparison among the 3 groups). Stratification by median epithelial CD3/8 T-cell level in these precancers found that high cytotoxic CD3/8 T-cell infiltrate (Fig. 2E) eliminated the excess cancer risk in these patients. The OCFS of the patients who had prior oral cancer and higher CD3/8 density (>median) and those who had no prior cancer were similar (HR [95% CI] = 1.09 [0.623, 1.908], P = 0.76) and significantly better than patients with a prior history of oral cancer and low CD3/CD8 infiltration (Fig. 2E)
Figure 3. Associations of total, epithelial or stromal CD3/8 cytotoxic T-cell levels with oral cancer-free survival analysis across all patients or those with dysplasia.
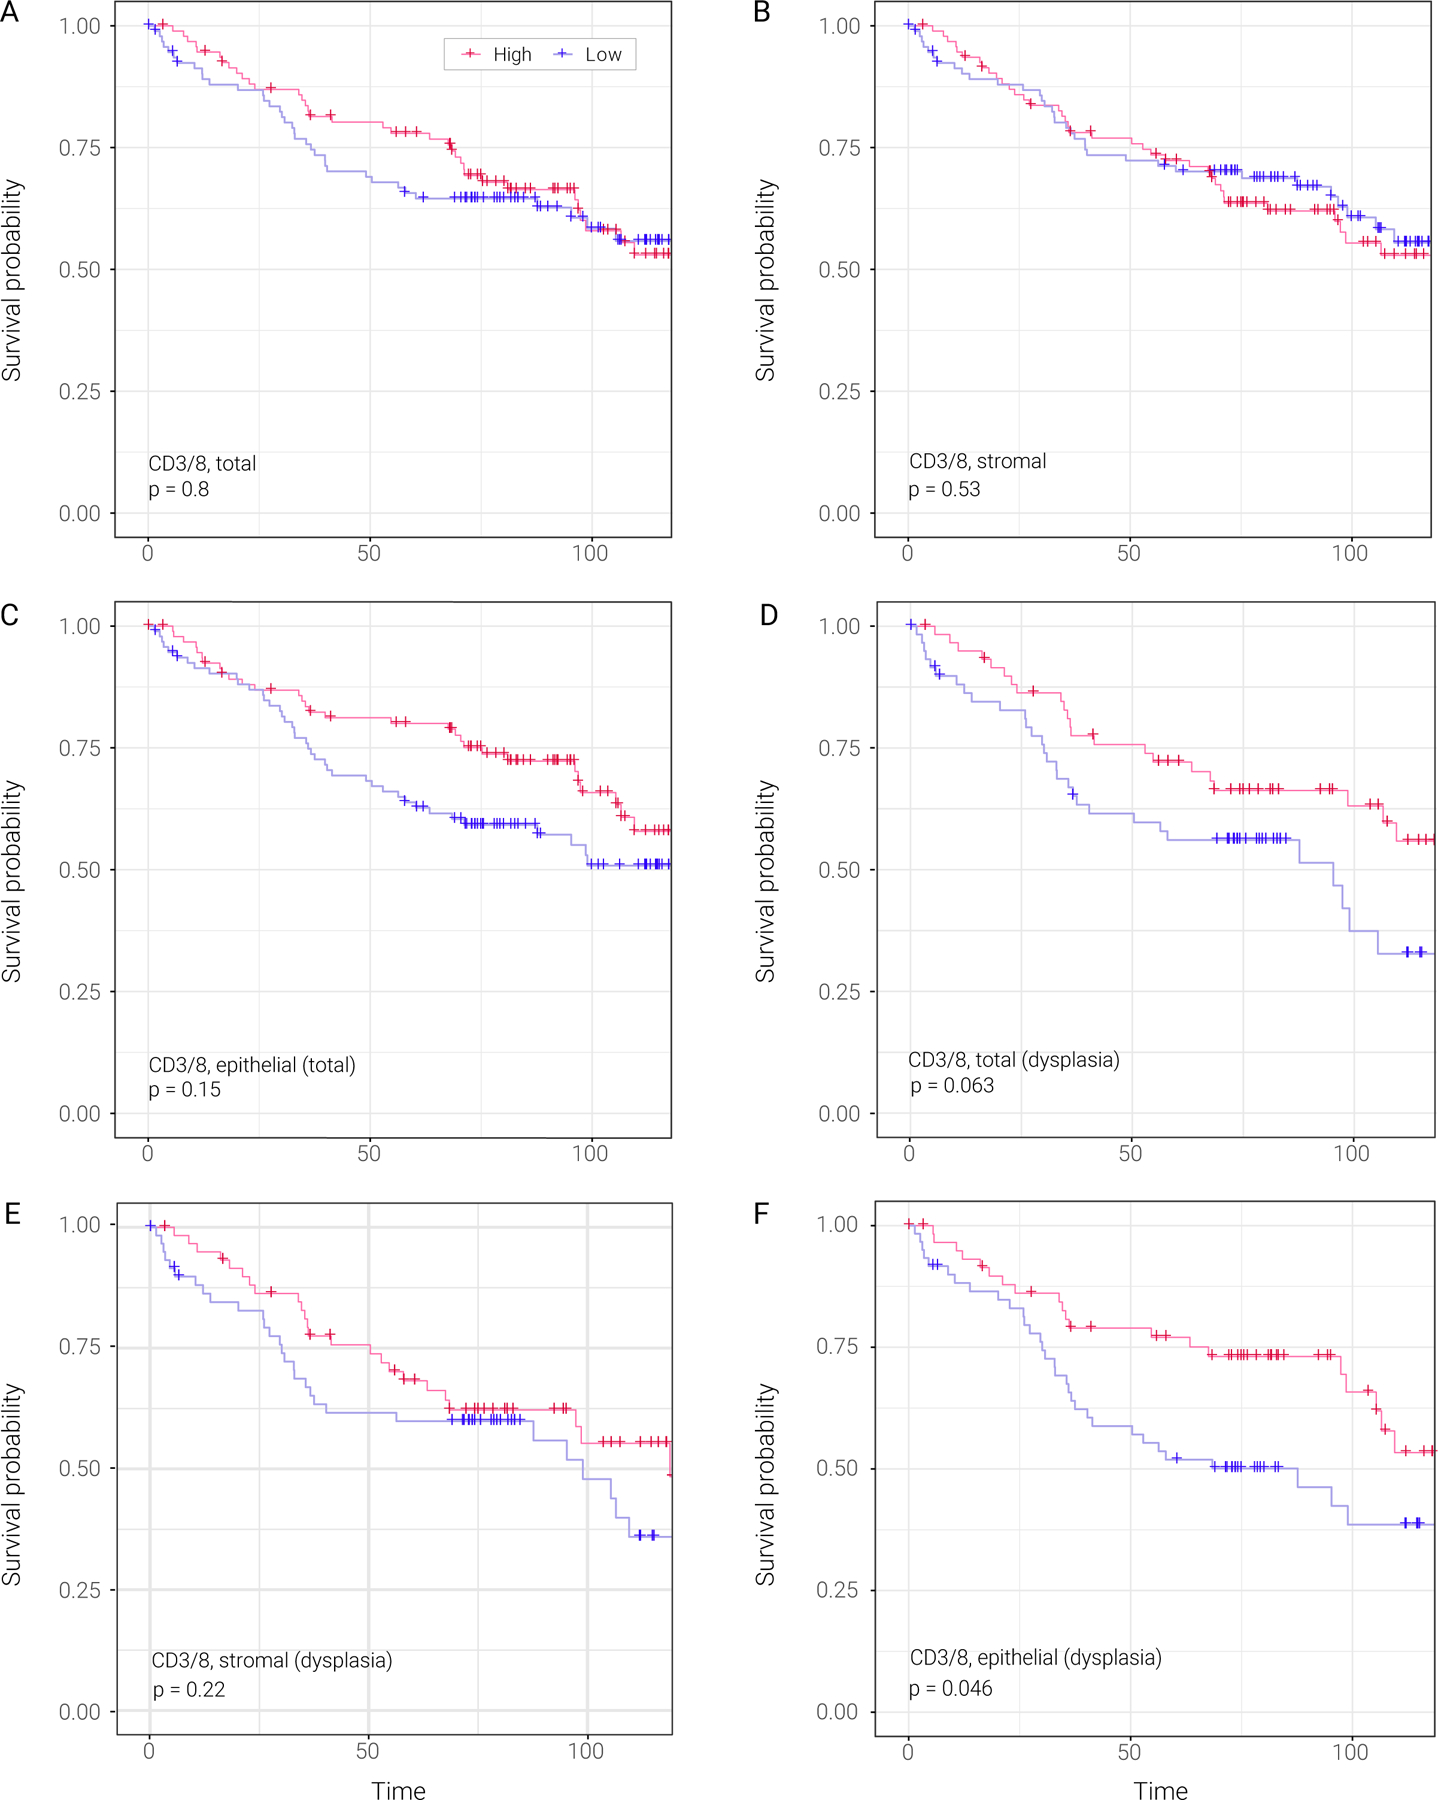
A) Kaplan-Meier plots stratifying patients based on total CD3/8 level. Red line represents patients with high total CD3/8 level. Blue line represents patients with low total CD3/8 level.
B) Kaplan-Meier plots stratifying patients based on stromal CD3/8 level. Red line represents patients with high stromal CD3/8 level. Blue line represents patients with low stromal CD3/8 level.
C) Kaplan-Meier plots stratifying patients based on epithelial CD3/8 level. Red line represents patients with high epithelial CD3/8 level. Blue line represents patients with low epithelial CD3/8 level.
D) Kaplan-Meier plots stratifying patients based on total CD3/8 level in patients with dysplasia. Red line represents patients with high total CD3/8 level. Blue line represents patients with low total CD3/8 level.
E) Kaplan-Meier plots stratifying patients based on stromal CD3/8 level in patients with dysplasia. Red line represents patients with high stromal CD3/8 level. Blue line represents patients with low stromal CD3/8 level.
F) Kaplan-Meier plots stratifying patients based on epithelial CD3/8 level in patients with dysplasia. Red line represents patients with high epithelial CD3/8 level. Blue line represents patients with low epithelial CD3/8 level.
Immune subgroups
Lastly, to perform an integrated assessment of the combined influence of PD-L1 expression and immune infiltration on oral cancer risk, we classified precancers by epithelial PD-L1 and CD3/8 T-cell patterns into four profiles that could describe their interactions with the immune system 22–24: adaptive resistance (CD3/8 > median, PD-L1 ≥1%), immune tolerance (CD3/8 > median, PD-L1 <1%), immune ignorance (CD3/8 < median and PD-L1 <1%), and intrinsic induction (CD3/8 < median, PD-L1 ≥1%) [Figure 4]. Examples of multiplex immune imaging in two of these four subgroups--PD-L1-positive and PD-L1-negative precancers are shown in Fig. 4B. Dysplasia (Fig. 4A) was detected in 64% of patients overall and the distribution by immune subgroup was not significant (Fisher’s exact test, P=0.094). According to this classification 22, 30%, 20%, 41%, and 9% of the OPCs fell into the groups characterized as immune tolerance, adaptive resistance, , immune ignorance, and intrinsic induction, respectively. Their respective 5-year OCFS rates (95% CI) were 83.3% (73.9%, 93.9%), 75.3% (62.5%, 90.7%), 65.4% (55.5%, 77.1%) and 56.3% (36.5%, 86.7%) (p=0.022, Fig. 4C).
Figure 4. The 4 immune subgroups classified by the combination of epithelial PD-L1 and CD3/8.
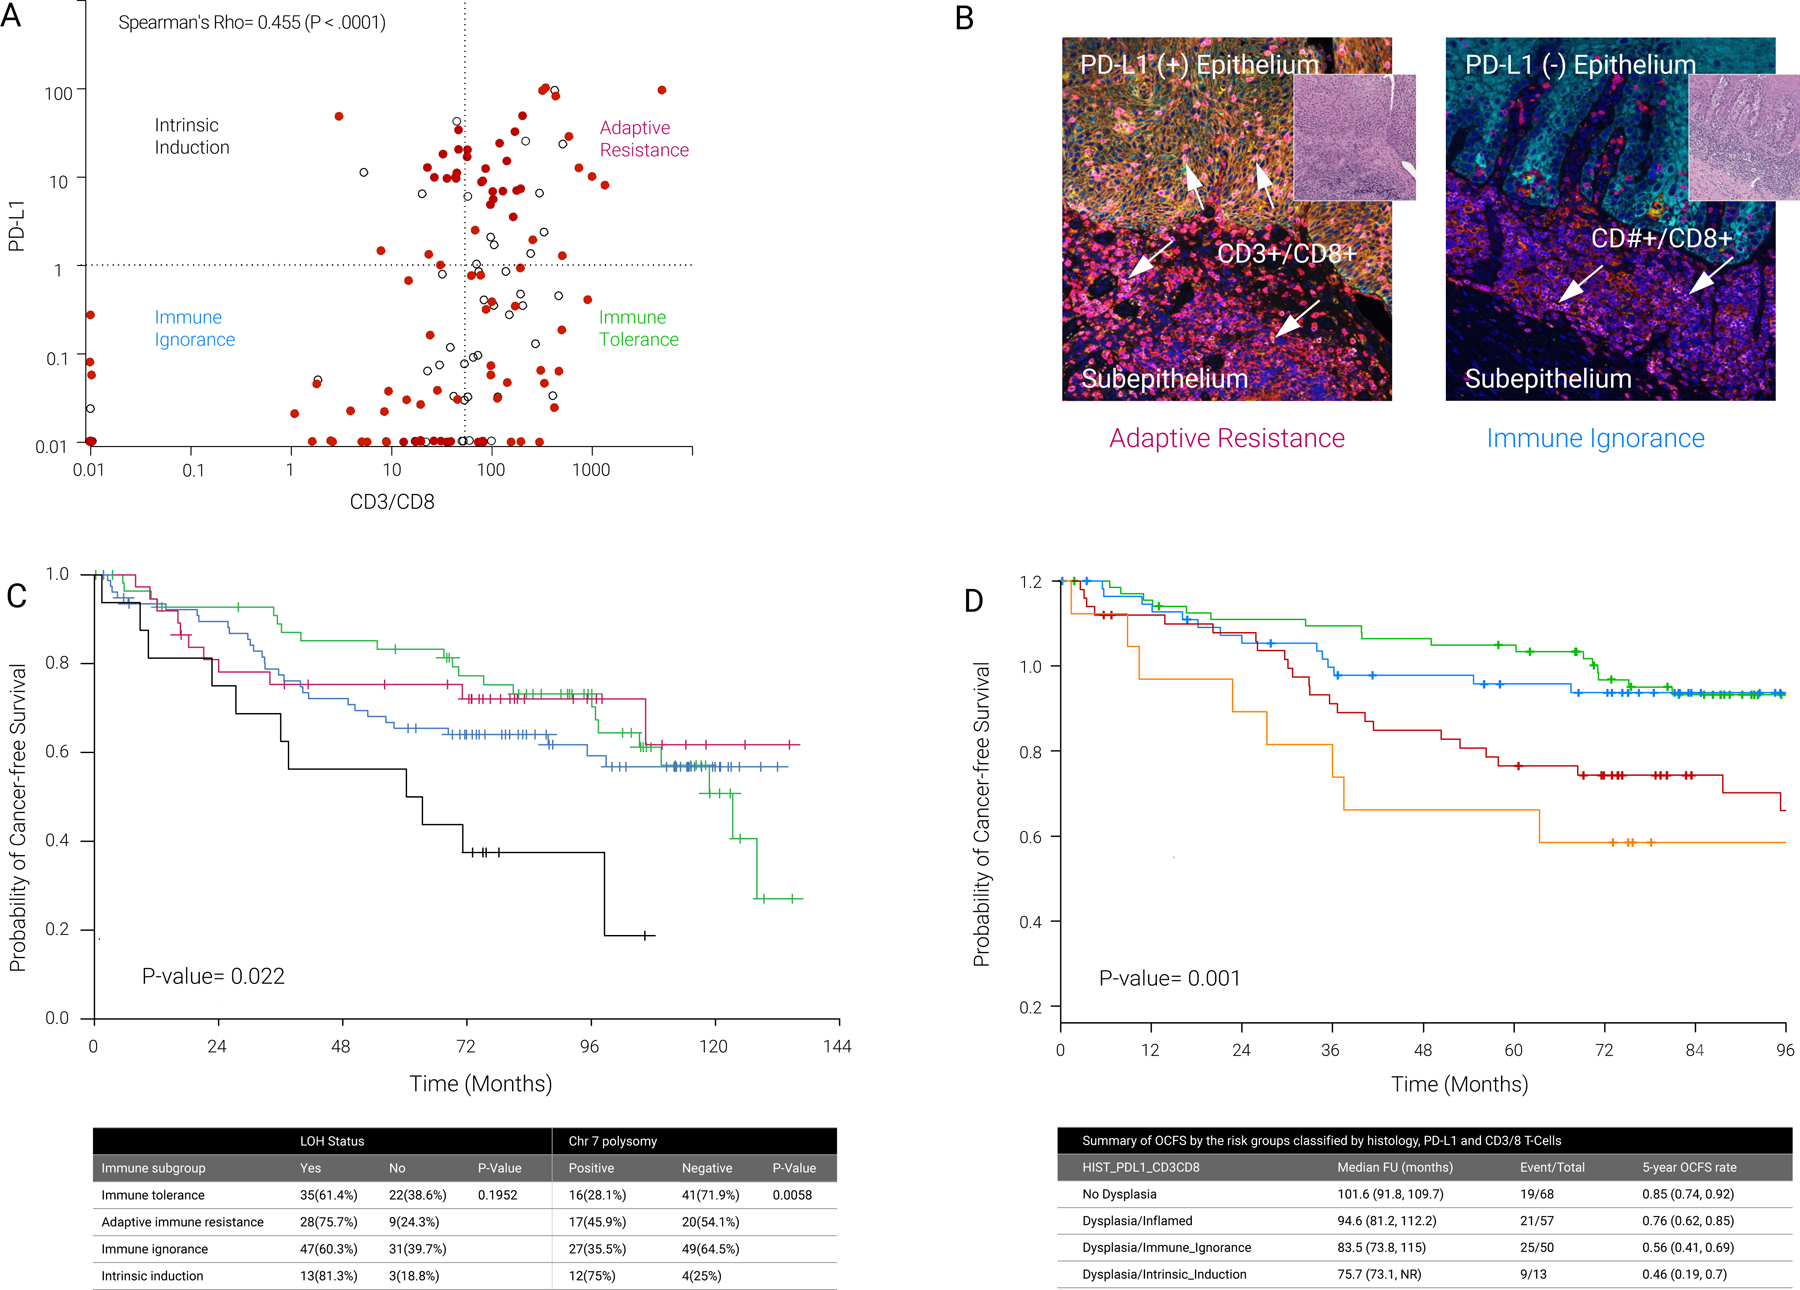
A) Dot plot shows the correlation between PD-L1 mean percentage and CD3/8. Four immune subgroups were divided based on PD-L1 mean percentage and CD3/8: Intrinsic Induction (PD-L1 high and CD3/8 low; Immune Ignorance (PD-L1 low and CD3/8 low); Adaptive Resistance (PD-L1 high and CD3/8 low) and Immune Tolerance (PD-L1 low and CD3/8 high). In these analyses, the high/low cutoffs for PD-L1 and CD3/8 were >=1% vs <1% and >53.6 vs <= 53.6 (median), respectively.
B) Examples of multiplex immunofluorescence staining of the two most common oral precancer immune subtypes. The lesion on the left depicts a sample with adaptive immune resistance (intense PD-L1 epithelial expression and dense infiltration of CD3-positive/CD8-positive cells in the epithelial and stromal, or subepithelial, layers). The lesion on the right exhibits immune ignorance (PD-L1 expression absent in epithelial cells, CD3/CD8 infiltration low/absent in epithelial layer, but high in subepithelial layer).
C) Kaplan-Meier plots (and corresponding data table below this plot) for 4 individual groups split by PD-L1 mean percentage and CD3/8. Black line represents the patients in intrinsic induction group. Red line represents the patients in adaptive resistance group. Blue line represents the patients in Immune Ignorance group. Green line represents the patients in immune tolerance group.
D) Kaplan-Meier plots (and corresponding data table below this plot) for 4 individual groups split by CD3/8. The orange and red curves represent OCFSs for low CD3/8 OPCs in low and high PD-L1 expressions, respectively.
We built a survival regression tree model to identify prognostic groups with histology and the variable representing 4 risk groups classified by the combination of PD-L1 and CD3/8 in the model. The first split occurred at the level of histology (hyperplasia versus dysplasia), followed by 3 groups (inflamed – which encompasses the immune tolerance and adaptive resistance groups –, immune ignorance, and intrinsic induction) based on the combination of PD-L1 and CD3/8 within the dysplasia subgroup. Fig. 4D shows that the distributions of OCFS of the 4 risk groups identified by the regression tree were significantly different (p = 0.001, log-rank test). Their respective 5-year OCFS rates (95% CI) were 84.9% (76.7%, 94%), 75.8% (65.1%, 88.2%), 56.6% (44%, 72.4%) and 46.2% (25.7%, 83%) for the patients who had no dysplasia, those with dysplasia and inflamed immune microenvironment, those with dysplasia and immune ignorance, and those with dysplasia and immune intrinsic induction (Fig. 4D).
DISCUSSION
This study provides early insight of PD-L1- and cytotoxic T cell-centered immune profiles in preinvasive lesions and invasive-disease transition. Strengths of this study are the use of a multiplex platform31, elucidating PD-L1 and immune-cell spatial patterns and densities, in different tissue compartments and immune subgroups, of a prospective, clinically annotated cohort to a primary endpoint of invasive cancer and characterized by established oral cancer risk genomic SCNAs. In cross-sectional comparisons with cancer, oral precancers have lower PD-L1 and higher T-cell levels. In precancer, this approach provides insight into spatial resolution, showing T-cells at the epithelial-stromal invasive margin interface. Intraepithelial neoplastic PD-L1, which limits T cell activity in inflammatory responses, was detected in 28% of OPCs, and was an independent prognostic marker of inferior OCFS (especially when expressed at high levels), suggesting that immunoediting has started before invasion.
Our data point to the existence of immune surveillance and editing involving both epithelial and subepithelial compartments: 88% of OPCs exhibited intra-epithelial CD3/8 T-cell infiltration; and there was a strong correlation between PD-L1 expression and CD3/8-positive lymphocyte density in every analysis here, including all immune cells in all lesion spatial compartments in all nine regression models (P<0.001, Fig. 2A, B; Table S7). Furthermore, CD3/8 T-cell infiltration partially reversed the increased cancer risk conferred by dysplasia. These data suggest that OPCs could exist in an equilibrium state via induction of an inflammatory immune response which may intercept and prevent progression of intraepithelial neoplasia. Studies of lung squamous precancers using bulk RNA sequencing found evidence of immune suppression in precancers that progressed; compared with regressive lesions, highlighting the potential to reduce the risk of progression by augmenting the immune response associated with regression 14, 32.
In contrast to recurrent/metastatic HNSC, there are no established, recommended, reported or even suggested PD-L1 ‘tumor’, immune or combined PD-L1 expression metrics or cut offs in precancer, which led to the unbiased exploratory analyses of PD-L1 spatial expression patterns and cut offs reported here. An important finding in this prospective study was that epithelial (and not total, mean, stromal or CD68) PD-L1 expression was associated with statistically significantly inferior OCFS (Table 1). This effect is modest at low PD-L1 expression levels, but becomes more relevant at higher PD-L1 expression levels (Figure 1B), and especially pronounced in specific groups (Figures 1C–G). Our results are consistent with two recent small retrospective reports of higher cancer risk in oral precancers: in a study of 8 patients (out of 120) with cancer, PD-L1 expression (scored qualitatively, intensity = 2 vs 0, 1) was found to be a predictor of OPC OCFS 16, and a recent cross-sectional, case-control study of 39 total patients, of which 19 were cases with cancer 33. A recent spatial immune analysis in patients with a clinically distinct, extremely high-risk oral proliferative leukoplakia also observed a strong correlation of high PD-L1 scores predicting worse OCFS 34. Although not the central driver in mediation analysis of LOH and dysplasia (tables S1 and 2), our data suggest that PD-1/PD-L1-mediated immune evasion contributes, to some extent, to the invasive-disease transition in progression of oral oncogenesis, and therefore, provides strong rationale for PD-1/PD-L1 axis blockade in high-risk PD-L1-positive patient subgroups.
In addition to determining the effects of PD-L1 expression on OCFS, our study expands on these findings to include a comprehensive assessment of spatial patterns of immune infiltration in OPCs and its relationship to genomic alterations, thus allowing for inferences regarding the biology of oral epithelium malignant transformation. We found that tobacco and alcohol exposure were not associated with increased or decreased cytotoxic T-cell infiltration (Fig. 2A, tables S4–5), indicating that immune response to genomically high-risk OPCs may occur independently of lesion etiology. Likewise, dysplasia was not necessary for recruitment of CD3/8-positive T cells to the epithelium or stroma, pointing to OPC recognition by the immune system (and immune editing) even at early, non-dysplastic stages of tumorigenesis. CD8 T-cell level is the only immune-cell type in HNSC, notably HPV-negative oral cavity cancer, consistently shown to correlate with overall and disease-specific survival in multivariate analyses including other prognostic factors and validation cohorts 35 36. In our OPC cohort, however, only CD3/8 cytotoxic T-cell density in dysplastic epithelium was prognostic, associated with OCFS (Fig. 3A–F).
We analyzed immune subgroups reported in cancer, based on tumor PD-L1 expression and CD8 T-cell levels, in our precancer cohort 22. The presence of dysplasia in OPC, a well-established cancer risk factor, 25, 26, 30 harbored more SCNAs overall, 9p21.3 LOH and immune-cold phenotypes (Fig. 4). OCFS rates were inferior among immune subgroups with low epithelial CD3/8 T-cell densities. Intrinsic induction phenotype (low CD3/8, high PD-L1) subgroup was enriched in SCNAs and dysplasia (Fig. 4A). Moreover, within patients with dysplasia, OCFS was better in the context of an inflamed immune microenvironment, followed by low CD3/8 plus high or low PD-L1, respectively, in immune ignorance, followed by immune intrinsic induction (Fig. 1D). These and other studies of OPC patient samples and mouse models suggest that ongoing T-cell surveillance of OPCs can detect and intercept neoplastic invasion 11, possibly pointing to a more preserved cancer-related immunity in pre- versus invasive disease. This T-cell infiltration pattern also has been observed in lung squamous cancer and adenocarcinoma 37 and their respective precursors 14, 37. In support of this hypothesis, we found that the immune subgroup of immune tolerance had the best prognosis (Fig. 4B), suggesting that the T-cells infiltrating the epithelium were not generally anergic/exhausted; instead, that recognition by the immune system of preinvasive neoplastic cells that do not have the ability to upregulate PD-L1 in this early phase of tumorigenesis, may possibly keep OPCs in check to avoid or delay neoplastic cell invasion through the epithelial basement membrane. Prior oral cancer did not correlate with epithelial PD-L1 expression levels overall, but when analyzed by time, the < 1-year subgroup showed a significant association with epithelial PD-L1 levels (Fig. 2D). Samples collected within one year of diagnosis of the primary oral cancer were obtained mostly at the time of the primary cancer resection, represent areas of precancer within the resected specimen, and, therefore, the positive associations between PD-L1 expression levels and shorter time from prior oral cancers may reflect an interferon-γ-mediated immune response triggered by the invasive cancer component leading to PD-L1 upregulation in the nearby pre-malignant, non-invasive epithelium.
The timing, biology and clinical implications of SCNA-induced immune suppression in preinvasive neoplasia are unclear. The finding here that PD-L1 expression was associated with LOH, which was associated with an inflamed phenotype, malignant transformation and identified PD-L1 and intrinsic induction lesions plus dysplasia as having the lowest OCFs, provide a viable high-risk molecular target for immune interception, and highlights the need to develop strategies to increase epithelial T-cell infiltration with (intrinsic induction) or without (immune ignorant) PD-1 blockade. In HNSC, metformin and mTOR inhibition 38, 39 have been shown to increase interferon-γ signaling, CD8-T-cell infiltration, and enhance PD-L1 blockade in experimental oral tumorigenic models and a recent clinical trial 40. The upregulation of PD-L1 expression in 9p21.3 LOH-positive lesions could represent an additional mechanism that contributes to oral precancer transformation through immune evasion. It is possible that specific loss of CDKN2A (located at 9p21.3) may be involved 26, or that genomic instability results in increased dsDNA in the cytosol and activation of cGAS-STING to drive interferon expression and PD-L1 26, 41.
The positive association between PD-L1 and LOH (Table S3), driven by 9p21.3 LOH (Fig. 2F) provide insights into how SCNAs in OPCs may shape the microenvironment. Of the 3 major LOH sites established in HPV-negative HNSC/oral cancer, only 9p21.3 LOH was associated with PD-L1 expression (Fig. 2F, G). Comprehensive evaluation of chromosome 9p copy number changes was not performed due to limited tissue availability from tiny precancer biopsies requiring PCR assessment of the 9p21.3 band 25. However, the findings in this study that 9p21.3 deletion was associated with increased PD-L1 expression supports our earlier hypothesis that 9p21.3 loss in precancer was a focal (rather than arm-level) event 26, 42, sparing the 9p24.1 region where the CD274 gene encoding PD-L1 is located 26, 42 which triggers an immune-hot phenotype that may drive PD-L1 mediated adaptive resistance; as these lesions progress, however, 9p deletion size may increase to encompass the 9p24.1 region, thus contributing to immune-cell depletion and low PD-L1 expression in invasive cancers.
Lastly, we noted a strong correlation between prior oral cancer history and epithelial (not stromal) immune-cell infiltration (P<0.001) (Fig. 2A, C; Table S4), suggesting that development of invasive cancer may trigger a more robust immune response in subsequent OPCs. High CD3/8 cell levels in OPCs that developed in patients with prior cancer, eliminated the excess risk in patients with prior oral cancer (P=0.4; Fig. 2E). This exploratory finding could indicate the existence of shared antigens between invasive cancers and precancers that continue to be recognized by the immune system. While more study is required to interrogate immune mechanisms, experimental studies in the 4NQO-mouse oral tongue cancer model, which is 93.9% homologous with the human oral cancer mutanome 43, produced consistent T-cell memory findings, which is especially notable given the radically different T-cell priming methods using an irradiation, vaccination, rechallenge design provide insight into this phenomenon 43–45.
In summary, we report, within the unique context of a prospective study designed with a primary endpoint of invasive cancer, that the onset of a PD-L1-mediated immune-suppressive microenvironment can occur in premalignancy, a positive association between PD-L1 expression in oral pre-malignant epithelium, high risk molecular features (i.e., 9p21.3 LOH status and polysomy), and inferior OCFS, even though PD-L1 expression does not seem to mediate the inferior OCFS conferred by dysplasia and LOH. We have also shown that oral precancers can exhibit features of an inflamed phenotype with adaptive immune resistance, suggesting a possible role for PD-L1-mediated mechanisms of immune evasion contributing to oral tumorigenesis and an opportunity for PD-1/PD-L1-targeting for immune interception in high risk OPC subgroups. The clinical relevance of our findings can be further highlighted by the recently reported results of a phase 2 study demonstrating activity of the PD-1 inhibitor nivolumab in patients with the high-risk oral proliferative verrucous leukoplakia precancer 46, thus supporting further evaluation of this strategy in larger cohorts. The inferior OCFS in PD-L1-high, immune-cold OPCs observed here also support the development of (added) T-cell recruitment strategies for cancer prevention. This unique (in the precancer space) prospective oral precancer cohort with invasive cancer primary endpoint is the largest collection of oral precancers with immune profiling, somatic copy number alterations, clinical, histologic and invasive-disease primary outcomes data, as there is no TCGA equivalent for precancer, although NIH-sponsored global efforts are underway. We have previously reported on somatic mutations and transcriptomic alterations in these samples as well 47. The raw annotated dataset in Table S3 is a comprehensive, NCI-funded precancer dataset in this context, making this the first publicly available, clinically annotated, genomics data set of oral pre-cancers reported to date that can be leveraged by investigators in the precancer (and HNSC) field for future studies.
Supplementary Material
Supplemental Figure 1
A) PD-L1 expression for LOH negative patients and LOH positive patients.
B) PD-L1 expression for chr7 polysomy negative and positive patients.
C) Kaplan-Meier plots (months) for dysplasia, 9pLOH and PDL1 level based on RPA analysis. Blue line represents patients with no dysplasia, no 9pLOH and PDL1 percentage >1%. Yellow line represents patients with dysplasia, 9pLOH and PDL1 percentage >1%. Red line represents other patients.
D) Kaplan-Meier plots (months) for dysplasia, 9pLOH and PDL1 level based on RPA analysis. Red line represents patients with dysplasia, 9pLOH and PDL1 percentage >1%. Blue line represents other patients.
Supplemental Figure 2. Spearman correlation between different immune markers. epi CD3, epithelial CD3; str CD3, stromal CD3; total CD3, total CD3 level.
Supplemental Figure 3. Box plot of PD-L1 level between different parameters.
First row: Box plot of PD-L1 mean percentage between patients with 8pLOH and Other LOH, 11qLOH and Other LOH, 13qLOH and Other LOH, 4qLOH and Other LOH.
Second row: Box plot of PD-L1 mean percentage between patients with High SCNA and low SCNA, Any LOH and Others, Any 2 LOH and others, polysomy 7 and no polysomy 7.
Third row: Box plot of PD-L1 mean percentage between patients with dysplasia and no dysplasia, prior oral cancer and no prior oral cancer, female and male.
Fourth row: Box plot of PD-L1 mean percentage between patients with alcohol history and no alcohol history, smoking history and no smoking history.
Funding
This research was supported by several grants, including Cancer Prevention and Research Institute of Texas grant RP140464, and by Conquer Cancer Foundation Career Development Award (W.N.W.); P30 CA016672; Stand Up To Cancer–Lustgarten Foundation Pancreatic Cancer Interception Dream Team Translational Cancer Research Grant SU2C-AACR-DT-25-17, NIH Grants P01 CA106451, P50 CA097007, and P30 CA023100 (to S.M.L.). S.M.L. is Distinguished Chugai Professor and Director of Moores Cancer Center at University of California San Diego.
Footnotes
Disclosures
Dr. William has received honoraria / speaker’s fee and/or participated in advisory boards from Roche/Genentech, BMS, Eli Lilly, Merck, AstraZeneca, Bayer, Boeringher Ingelheim, Novartis, Janssen, Sanofi, Pfizer, and is on the Clinical Advisory Board of io9.
Dr. Adel El-Naggar has received personal fees from AstraZeneca.
Dr. Ignacio Wistuba has received research support from Genentech, Merck, OncoPlex Diagnostics, Myriad Genetics, Bayer, Jounce Therapeutics, and personal fees from Roche/Genentch, GlaxoSmithKline, GE Heathcare, Lilly, Clovis Oncology, BMS, Celgene, Ariad, Syta, HTG Molecular Diagnostics, AstraZeneca, Asuragen, Pfizer, Boehringer Ingelheim, Medscape.
Dr. Kathryn A. Gold has received research support from Pharmacyclics, BMS, AstraZeneca, Ariad, Roche/Genentech, and Astellas Pharma, and personal fees from Roche/Genentech, Ariad, AstraZeneca.
Dr. Patrick Hwu has received research support from Genentech, personal fees from Lion Biotechnologies, and has stock ownership in Lion Biotechnologies and Immatics; he is on the Immatics Scientific Advisory Board, and the Dragonfly Scientific Advisory Board.
Dr. Teresa Davoli is on the Scientific Advisory Board of io9.
Dr. John Heymach has received research support from AstraZeneca, has received personal fees from AstraZeneca, Abbvie, Boehringer Ingelheim, Bristol-Myers Squibb, Medivation, ARIAD Pharmaceuticals, Synta, Oncomed, Novartis, Genentech, Calithera Biosciences, and has stock ownership in Cardinal Spine, and Bio-Tree.
Dr. Vassilliki Papadimirakopoulou has received research support from Merck, Novartis, Celgene, Clovis Oncology, Bayer, BMS, AstraZeneca, Pfizer, Janssen Oncology, ACEA, and personal fees from Clovis Oncology, Genentech, Merck, Biothera, Lilly, Janssen, Genentech, Gensignia Life Sciences, AstraZeneca, and Ariad; she is now an employee of Pfizer.
Dr. Scott Lippman is co-founder of io9, and is on the Biological Dynamics Scientific Advisory Board.
REFERENCES
- 1.Shield KD, Ferlay J, Jemal A, et al. The global incidence of lip, oral cavity, and pharyngeal cancers by subsite in 2012. CA Cancer J Clin Jan 2017;67(1):51–64. doi: 10.3322/caac.21384 [DOI] [PubMed] [Google Scholar]
- 2.Farhood Z, Simpson M, Ward GM, Walker RJ, Osazuwa-Peters N. Does anatomic subsite influence oral cavity cancer mortality? A SEER database analysis. Laryngoscope Jun 2019;129(6):1400–1406. doi: 10.1002/lary.27490 [DOI] [PubMed] [Google Scholar]
- 3.Howlader N, Krapcho M, Miller D, et al. SEER Cancer Statistics Review, 1975–2016, National Cancer Institute. Bethesda, MD, https://seer.cancer.gov/csr/1975_2016/, based on November 2018 SEER data submission, posted to the SEER web site, April 2019. National Cancer Institute; 2019. April 2019. https://seer.cancer.gov/csr/1975_2016/ [Google Scholar]
- 4.Beane J, Campbell JD, Lel J, Vick J, Spira A. Genomic approaches to accelerate cancer interception. Lancet Oncol Aug 2017;18(8):e494–e502. doi: 10.1016/S1470-2045(17)30373-X [DOI] [PMC free article] [PubMed] [Google Scholar]
- 5.Spira A, Yurgelun MB, Alexandrov L, et al. Precancer Atlas to Drive Precision Prevention Trials. Cancer Res Apr 1 2017;77(7):1510–1541. doi: 10.1158/0008-5472.Can-16-2346 [DOI] [PMC free article] [PubMed] [Google Scholar]
- 6.Mandal R, Senbabaoglu Y, Desrichard A, et al. The head and neck cancer immune landscape and its immunotherapeutic implications. JCI Insight Oct 20 2016;1(17):e89829. doi: 10.1172/jci.insight.89829 [DOI] [PMC free article] [PubMed] [Google Scholar]
- 7.Ferris RL, Blumenschein G, Jr., Fayette J, et al. Nivolumab for Recurrent Squamous-Cell Carcinoma of the Head and Neck. N Engl J Med Nov 10 2016;375(19):1856–1867. doi: 10.1056/NEJMoa1602252 [DOI] [PMC free article] [PubMed] [Google Scholar]
- 8.Cohen EEW, Soulieres D, Le Tourneau C, et al. Pembrolizumab versus methotrexate, docetaxel, or cetuximab for recurrent or metastatic head-and-neck squamous cell carcinoma (KEYNOTE-040): a randomised, open-label, phase 3 study. Lancet Jan 12 2019;393(10167):156–167. doi: 10.1016/S0140-6736(18)31999-8 [DOI] [PubMed] [Google Scholar]
- 9.Burtness B, Harrington KJ, Greil R, et al. Pembrolizumab alone or with chemotherapy versus cetuximab with chemotherapy for recurrent or metastatic squamous cell carcinoma of the head and neck (KEYNOTE-048): a randomised, open-label, phase 3 study. Lancet Nov 23 2019;394(10212):1915–1928. doi: 10.1016/s0140-6736(19)32591-7 [DOI] [PubMed] [Google Scholar]
- 10.Spira A, Disis ML, Schiller JT, et al. Leveraging premalignant biology for immune-based cancer prevention. Proc Natl Acad Sci U S A Sep 27 2016;113(39):10750–8. doi: 10.1073/pnas.1608077113 [DOI] [PMC free article] [PubMed] [Google Scholar]
- 11.Young MRI. Redirecting the focus of cancer immunotherapy to premalignant conditions. Cancer Lett Apr 10 2017;391:83–88. doi: 10.1016/j.canlet.2017.01.022 [DOI] [PMC free article] [PubMed] [Google Scholar]
- 12.Sivakumar S, Lucas FAS, McDowell TL, et al. Genomic Landscape of Atypical Adenomatous Hyperplasia Reveals Divergent Modes to Lung Adenocarcinoma. Cancer Res Nov 15 2017;77(22):6119–6130. doi: 10.1158/0008-5472.CAN-17-1605 [DOI] [PMC free article] [PubMed] [Google Scholar]
- 13.Chang K, Taggart MW, Reyes-Uribe L, et al. Immune Profiling of Premalignant Lesions in Patients With Lynch Syndrome. JAMA Oncol Aug 1 2018;4(8):1085–1092. doi: 10.1001/jamaoncol.2018.1482 [DOI] [PMC free article] [PubMed] [Google Scholar]
- 14.Beane JE, Mazzilli SA, Campbell JD, et al. Molecular subtyping reveals immune alterations associated with progression of bronchial premalignant lesions. Nat Commun Apr 23 2019;10(1):1856. doi: 10.1038/s41467-019-09834-2 [DOI] [PMC free article] [PubMed] [Google Scholar]
- 15.Yu GT, Bu LL, Huang CF, et al. PD-1 blockade attenuates immunosuppressive myeloid cells due to inhibition of CD47/SIRPalpha axis in HPV negative head and neck squamous cell carcinoma. Oncotarget Dec 08 2015;6(39):42067–80. doi: 10.18632/oncotarget.5955 [DOI] [PMC free article] [PubMed] [Google Scholar]
- 16.Yagyuu T, Hatakeyama K, Imada M, et al. Programmed death ligand 1 (PD-L1) expression and tumor microenvironment: Implications for patients with oral precancerous lesions. Oral Oncol May 2017;68:36–43. doi: 10.1016/j.oraloncology.2017.03.006 [DOI] [PubMed] [Google Scholar]
- 17.Mao L, Lee JS, Fan YH, et al. Frequent microsatellite alterations at chromosomes 9p21 and 3p14 in oral premalignant lesions and their value in cancer risk assessment. Nat Med Jun 1996;2(6):682–5. [DOI] [PubMed] [Google Scholar]
- 18.Lippman SM, Hong WK. Molecular markers of the risk of oral cancer. N Engl J Med Apr 26 2001;344(17):1323–6. doi: 10.1056/nejm200104263441710 [DOI] [PubMed] [Google Scholar]
- 19.Rosin MP, Cheng X, Poh C, et al. Use of allelic loss to predict malignant risk for low-grade oral epithelial dysplasia. Clin Cancer Res Feb 2000;6(2):357–62. [PubMed] [Google Scholar]
- 20.Lee JJ, Hong WK, Hittelman WN, et al. Predicting cancer development in oral leukoplakia: ten years of translational research. Clin Cancer Res May 2000;6(5):1702–10. [PubMed] [Google Scholar]
- 21.Zhang L, Poh CF, Williams M, et al. Loss of heterozygosity (LOH) profiles--validated risk predictors for progression to oral cancer. Cancer Prev Res (Phila) Sep 2012;5(9):1081–9. doi: 10.1158/1940-6207.CAPR-12-0173 [DOI] [PMC free article] [PubMed] [Google Scholar]
- 22.Teng MW, Ngiow SF, Ribas A, Smyth MJ. Classifying Cancers Based on T-cell Infiltration and PD-L1. Cancer Res Jun 01 2015;75(11):2139–45. doi: 10.1158/0008-5472.CAN-15-0255 [DOI] [PMC free article] [PubMed] [Google Scholar]
- 23.Chen DS, Mellman I. Elements of cancer immunity and the cancer-immune set point. Nature Jan 18 2017;541(7637):321–330. doi: 10.1038/nature21349 [DOI] [PubMed] [Google Scholar]
- 24.Cottrell TR, Taube JM. PD-L1 and Emerging Biomarkers in Immune Checkpoint Blockade Therapy. Cancer J Jan/Feb 2018;24(1):41–46. doi: 10.1097/PPO.0000000000000301 [DOI] [PMC free article] [PubMed] [Google Scholar]
- 25.William WN Jr., Papadimitrakopoulou V, Lee JJ, et al. Erlotinib and the Risk of Oral Cancer: The Erlotinib Prevention of Oral Cancer (EPOC) Randomized Clinical Trial. JAMA Oncol Feb 2016;2(2):209–16. doi: 10.1001/jamaoncol.2015.4364 [DOI] [PMC free article] [PubMed] [Google Scholar]
- 26.William WN Jr., Zhao X, Bianchi JJ, et al. Immune evasion in HPV(−) head and neck precancer-cancer transition is driven by an aneuploid switch involving chromosome 9p loss. Proc Natl Acad Sci U S A May 11 2021;118(19)doi: 10.1073/pnas.2022655118 [DOI] [PMC free article] [PubMed] [Google Scholar]
- 27.Linear Jian J. and Generalized Linear Mixed Models and Their Applications 1 ed. Springer-Verlag; New York; 2007. [Google Scholar]
- 28.VanderWeele TJ. Mediation Analysis: A Practitioner’s Guide. Annu Rev Public Health 2016;37:17–32. doi: 10.1146/annurev-publhealth-032315-021402 [DOI] [PubMed] [Google Scholar]
- 29.Hittelman WN. Genetic instability in epithelial tissues at risk for cancer. Ann N Y Acad Sci Dec 2001;952:1–12. doi: 10.1111/j.1749-6632.2001.tb02723.x [DOI] [PubMed] [Google Scholar]
- 30.Chaturvedi AK, Udaltsova N, Engels EA, et al. Oral Leukoplakia and Risk of Progression to Oral Cancer: A Population-Based Cohort Study. J Natl Cancer Inst Oct 1 2020;112(10):1047–1054. doi: 10.1093/jnci/djz238 [DOI] [PMC free article] [PubMed] [Google Scholar]
- 31.Lu S, Stein JE, Rimm DL, et al. Comparison of Biomarker Modalities for Predicting Response to PD-1/PD-L1 Checkpoint Blockade: A Systematic Review and Meta-analysis. JAMA Oncol Jul 18 2019;doi: 10.1001/jamaoncol.2019.1549 [DOI] [PMC free article] [PubMed]
- 32.Mascaux C, Angelova M, Vasaturo A, et al. Immune evasion before tumour invasion in early lung squamous carcinogenesis. Nature Jun 26 2019;doi: 10.1038/s41586-019-1330-0 [DOI] [PubMed]
- 33.Dave K, Ali A, Magalhaes M. Increased expression of PD-1 and PD-L1 in oral lesions progressing to oral squamous cell carcinoma: a pilot study. Scientific Reports 2020/06/16 2020;10(1):9705. doi: 10.1038/s41598-020-66257-6 [DOI] [PMC free article] [PubMed] [Google Scholar]
- 34.Hanna GJ, Villa A, Mistry N, et al. Comprehensive Immunoprofiling of High-Risk Oral Proliferative and Localized Leukoplakia. Cancer Research Communications 2021;1(1):30–40. doi: 10.1158/2767-9764.Crc-21-0060 [DOI] [PMC free article] [PubMed] [Google Scholar]
- 35.Oliva M, Spreafico A, Taberna M, et al. Immune biomarkers of response to immune-checkpoint inhibitors in head and neck squamous cell carcinoma. Ann Oncol Jan 1 2019;30(1):57–67. doi: 10.1093/annonc/mdy507 [DOI] [PMC free article] [PubMed] [Google Scholar]
- 36.Yang WF, Wong MCM, Thomson PJ, Li KY, Su YX. The prognostic role of PD-L1 expression for survival in head and neck squamous cell carcinoma: A systematic review and meta-analysis. Oral Oncol Nov 2018;86:81–90. doi: 10.1016/j.oraloncology.2018.09.016 [DOI] [PubMed] [Google Scholar]
- 37.Krysan K, Tran LM, Grimes BS, et al. The immune contexture associates with the genomic landscape in lung adenomatous premalignancy. Cancer Res May 29 2019;doi: 10.1158/0008-5472.CAN-19-0153 [DOI] [PMC free article] [PubMed]
- 38.Curry JM, Johnson J, Mollaee M, et al. Metformin Clinical Trial in HPV+ and HPV− Head and Neck Squamous Cell Carcinoma: Impact on Cancer Cell Apoptosis and Immune Infiltrate. Front Oncol 2018;8:436. doi: 10.3389/fonc.2018.00436 [DOI] [PMC free article] [PubMed] [Google Scholar]
- 39.Wu X, Yeerna H, Goto Y, et al. Metformin Inhibits Progression of Head and Neck Squamous Cell Carcinoma by Acting Directly on Carcinoma-Initiating Cells. Cancer Res Sep 1 2019;79(17):4360–4370. doi: 10.1158/0008-5472.Can-18-3525 [DOI] [PMC free article] [PubMed] [Google Scholar]
- 40.Gutkind JS, Molinolo AA, Wu X, et al. Inhibition of mTOR signaling and clinical activity of metformin in oral premalignant lesions. JCI Insight 09/August/2021;6(17)doi: 10.1172/jci.insight.147096 [DOI] [PMC free article] [PubMed] [Google Scholar]
- 41.Tripathi R, Modur V, Senovilla L, Kroemer G, Komurov K. Suppression of tumor antigen presentation during aneuploid tumor evolution contributes to immune evasion. Oncoimmunology 2019;8(11):1657374. doi: 10.1080/2162402x.2019.1657374 [DOI] [PMC free article] [PubMed] [Google Scholar]
- 42.Zhao X, Cohen EEW, William WN, et al. Somatic 9p24.1 alterations in HPV— head and neck squamous cancer dictate immune microenvironment and anti-PD-1 checkpoint-inhibitor activity. PNAS. in press; [DOI] [PMC free article] [PubMed]
- 43.Wang Z, Wu VH, Allevato MM, et al. Syngeneic animal models of tobacco-associated oral cancer reveal the activity of in situ anti-CTLA-4. Nature Communications 2019/December/05 2019;10(1):5546. doi: 10.1038/s41467-019-13471-0 [DOI] [PMC free article] [PubMed] [Google Scholar]
- 44.Moore EC, Cash HA, Caruso AM, et al. Enhanced Tumor Control with Combination mTOR and PD-L1 Inhibition in Syngeneic Oral Cavity Cancers. Cancer Immunol Res Jul 2016;4(7):611–20. doi: 10.1158/2326-6066.Cir-15-0252 [DOI] [PMC free article] [PubMed] [Google Scholar]
- 45.Young MR. Use of carcinogen-induced premalignant oral lesions in a dendritic cell-based vaccine to stimulate immune reactivity against both premalignant oral lesions and oral cancer. J Immunother Feb-Mar 2008;31(2):148–56. doi: 10.1097/CJI.0b013e31815bdbf5 [DOI] [PMC free article] [PubMed] [Google Scholar]
- 46.Hanna GJ, Villa A, Shi R, et al. A phase II study of nivolumab for high-risk oral leukoplakia. Abstract. Annals of Oncology 2022;33(suppl 7: S295–S322. 10.1016/annonc/annonc1056.) [DOI] [Google Scholar]
- 47.William WN, Lee W-C, Lee JJ, et al. Genomic and transcriptomic landscape of oral pre-cancers (OPCs) and risk of oral cancer (OC). Journal of Clinical Oncology 2019;37(15_suppl):6009–6009. doi: 10.1200/JCO.2019.37.15_suppl.6009 [DOI] [Google Scholar]
Associated Data
This section collects any data citations, data availability statements, or supplementary materials included in this article.
Supplementary Materials
Supplemental Figure 1
A) PD-L1 expression for LOH negative patients and LOH positive patients.
B) PD-L1 expression for chr7 polysomy negative and positive patients.
C) Kaplan-Meier plots (months) for dysplasia, 9pLOH and PDL1 level based on RPA analysis. Blue line represents patients with no dysplasia, no 9pLOH and PDL1 percentage >1%. Yellow line represents patients with dysplasia, 9pLOH and PDL1 percentage >1%. Red line represents other patients.
D) Kaplan-Meier plots (months) for dysplasia, 9pLOH and PDL1 level based on RPA analysis. Red line represents patients with dysplasia, 9pLOH and PDL1 percentage >1%. Blue line represents other patients.
Supplemental Figure 2. Spearman correlation between different immune markers. epi CD3, epithelial CD3; str CD3, stromal CD3; total CD3, total CD3 level.
Supplemental Figure 3. Box plot of PD-L1 level between different parameters.
First row: Box plot of PD-L1 mean percentage between patients with 8pLOH and Other LOH, 11qLOH and Other LOH, 13qLOH and Other LOH, 4qLOH and Other LOH.
Second row: Box plot of PD-L1 mean percentage between patients with High SCNA and low SCNA, Any LOH and Others, Any 2 LOH and others, polysomy 7 and no polysomy 7.
Third row: Box plot of PD-L1 mean percentage between patients with dysplasia and no dysplasia, prior oral cancer and no prior oral cancer, female and male.
Fourth row: Box plot of PD-L1 mean percentage between patients with alcohol history and no alcohol history, smoking history and no smoking history.