

Abstract
Background:
Little systematic information has been collected about the nature and types of articles published in 2 journals by identifying the latent topics and analyzing the extracted research themes and sentiments using text mining and machine learning within the 2020 time frame. The goals of this study were to conduct a content analysis of articles published in 2 journals, describe the research type, identify possible gaps, and propose future agendas for readers.
Methods:
We downloaded 5610 abstracts in the journals of Medicine (Baltimore) and the Journal of the Formosan Medical Association (JFMA) from the PubMed library in 2020. Sentiment analysis (ie, opinion mining using a natural language processing technique) was performed to determine whether the article abstract was positive or negative toward sentiment to help readers capture article characteristics from journals. Cluster analysis was used to identify article topics based on medical subject headings (MeSH terms) using social network analysis (SNA). Forest plots were applied to distinguish the similarities and differences in article mood and MeSH terms between these 2 journals. The Q statistic and I2 index were used to evaluate the difference in proportions of MeSH terms in journals.
Results:
The comparison of research topics between the 2 journals using the 737 cited articles was made and found that most authors are from mainland China and Taiwan in Medicine and JFMA, respectively, similarity is supported by observing the abstract mood (Q = 8.3, I2 = 0, P = .68; Z = 0.46, P = .65), 2 journals are in a common cluster (named latent topic of patient and treatment) using SNA, and difference in overall effect was found by the odds ratios of MeSH terms (Q = 185.5 I2 = 89.8, P < .001; Z = 5.93, P < .001) and a greater proportion of COVID-19 articles in JFMA.
Conclusions:
SNA and forest plots were provided to readers with deep insight into the relationships between journals in research topics using MeSH terms. The results of this research provide readers with a concept diagram for future submissions to a given journal.
Highlights
The main approaches frequently used in Meta-analysis for drawing forest plots contributed to the following:
Comparing abstract mood in 2 journals, which is modern and innovative in the literature.
Extracting article topics from MeSH terms using SNA,
drawing visual representations by using SNA, choropleth map, and forest plots that can inspire other relevant research to replicate the approaches for the other 2 paired journals in comparison of differences in research topics in the future.
Keywords: cluster analysis, forest plot, latent topic, MeSH term, sentiment analysis, social network analysis
1. Introduction
Much more knowledge in publications has been explored[1] for readers interested in understanding journals in similarity and differences.[2-4] Traditionally, using structured data (eg, publications, citations, and time for submission to publication, and so on[2,5,6]) is easy and ordinary but impractical. This is because content analysis on textual data has prevailed and is famous for analyzing article abstracts and topics in recent years.[7] Meanwhile, most of those studies[3,7-9] just displayed research results using traditional line plots and bar charts instead of the forest plot[10-12] (often applied in meta-analysis), which is a graphical display of estimated results for 2 entities in 2 panels from studies to address the same questions (eg, on identical keywords or phrases).[13] As such, it is necessary to identify similarities and differences in research topics between the 2 journals.
A study on the top ten journals most associated with Taiwan authors in 2020[14] was Sci Rep, J Formos Med Assoc, Int J Environ Res Public Health, Int J Mol Sci, PLoS One, Sensors (Basel), J Chin Med Assoc, Medicine (Baltimore), J Microbiol Immunol, Infect, and Polymers (Basel). Medicine (Baltimore) and the Journal of the Formosan Medical Association (JFMA)[15,16] are similar to publishing articles related to clinical practice and research in all fields of medicine and related disciplines. Both are open access international general medical journals, providing authors with continuous publication of original research across a broad spectrum of medical, scientific disciplines, and subspecialties. We are thus interested in selecting articles published in the 2 journals to examine their similarities and differences in article topics and research themes.
This study aims to investigate the most productive countries/regions in these 2 journals; analyze the sentiments in abstracts; describe the type of research; and identify the effect of the similarity odds ratio (OR) when comparing medical subject headings (MeSH terms) using forest plots.
2. Methods
2.1. Data sources
We programmed Visual Basic for Applications modules in Microsoft Excel to arrange the downloaded abstracts in journals of Medicine and JFMA in 2020 from the PubMed library. Only those articles labeled as journal Articles, Reviews, Case Reports, Comparative Study, Clinical Trial Protocol, Evaluation Study, and Clinical Trial were included. Others, such as those marked as “Published Erratum, Editorial, or letter to editor,” were excluded. A total of 5610 eligible publications were obtained and matched to the corresponding citations (Supplemental Digital Content 1, http://links.lww.com/MD2/A954). Only cited articles were analyzed in this study.[17]
2.2. Task 1: descriptive statistics in the 2 journals
The distribution of publications in the 2 journals was tabulated across months in 2020, including 2 forms without any citation and with at least 1 citing article.
We then performed descriptive analyses on the cited articles to investigate publication trends in the examined data sources as well as extracting affiliated countries/regions in the publications from the 2 journals. Ch choropleth maps[18] were drawn to highlight the dominant countries/regions in the 2 journals.
The absolute advantage coefficient (AAC),[19] or the dimension coefficient,[27-29] was used to measure the strength of the top-one affiliated country/region against the next 2 in Eqs. 1 and 2.
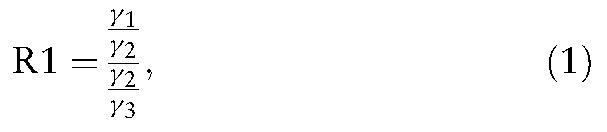 |
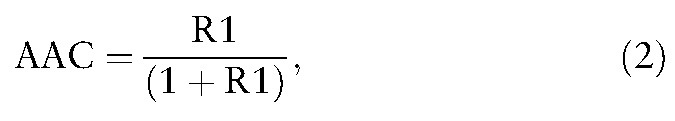 |
where AAC in Eq. 1 is determined by the 3 consecutive citations (i) (denoted by γ1, γ2, and γ3 in Eq. 1). The AAC is in a range between 0 and 1.[20-22]
2.3. Task 2: sentiment analysis using the forest plot
2.3.1. Text preprocessing. We merged the titles and abstracts of the collected articles and then applied several preprocessing steps (eg, converting the text to lowercase, correcting special characters, removing stop wordsusing a customized English stop words list, and punctuation in Microsoft Excel) with sentiment analysis. This is because both titles and abstracts have a condensed representation of the articles and contain essential informative keywords/keyphrases in the article. As such, integrating both titles and abstracts to provide more information to build a better understanding of the research landscape is involved in this study. The processed textual data were tokenized, and a document-term frequency matrix was generated (Supplemental Digital Content 2, http://links.lww.com/MD2/A955).
2.3.2. Descriptive and temporal text analyses. We performed temporal text analyses to investigate key-phrase patterns, publication sentiments, and research similarities over time. Text sentiment analysis (Excel add-in sample) with Azure machine learning in Excel 2019 was performed to extract sentiment from the publications. The sentiment score is from 0 to 1.0, where 0 indicates very negative sentiment, 1 as very positive sentiment, and those near 0.5 as neutral instead. In this study, only binary classifications of positive and negative sentiments were obtained by using the cutting point at 0.5. We would like to highlight the standardized mean differences (SMDs) of positive/negative sentiment scores for examining whether different sentiment patterns across months in 2020 exist in the forest plot. A comparison was made by inspecting the overall effect (ie, aggregated by the weighted variances across months; see the next section) based on the Q statistic and I2 index to evaluate the difference in measures between journals.
2.3.3. The overall effect in a forest plot. The forest plot[10-12] (often applied in meta-analysis) was used to display the estimated results from numerous paired observations and events (or using the SMD by month in this study), addressing the same similarity and difference of sentiment in articles between the 2 journals. The area of each square in the forest plot is proportional to the weight (ie, 1/variance for a month effect). The overall measure of effect is represented by a diamond on the plot. The lateral points of the diamond indicate the confidence intervals (CIs) of the overall estimate (denoted by a diamond).[13]
In the forest plot, the measure (>0) on the right-hand column denotes the effect in favor of one journal (ie, Medicine). Otherwise, the measure (<0) favors another journal (ie, JFMA).
A vertical line representing no effect (eg, SMD = 0) is plotted if the CIs for individual studies overlapped with this line, indicating that the effect sizes do not differ from the no-effect scenario for the individual case (or a study in meta-analysis) at a given level of confidence (eg, P < .05).
The same situation can be applied to the overall effect if the lateral points of the diamond touch the line of the no-effect scenario (ie, in the middle of the forest plot), indicating that the overall result cannot differ from the no-effect scenario at a given level of confidence.[13] We particularly drew the forest plot on a dashboard for a better understanding of the effect on each observed study through the functions zoom in and zoom out on Google Maps.
2.3.4. The calculation of 95% CIs for individual effects. The meaningfulness of the sentiments for the individual effect is denoted by the weight (size) of the box. The greater variance generates a smaller CI, which contributes to the pooled result (ie, the overall effect). The 95% CIs can be yielded by an example with sample sizes (eg, n1 = 100, n2 = 200), means (eg, mean1 = 0.5, mean2 = -0.2), and standard deviations (eg, SD1 = 0.5, SD2 = 0.3) below:
Var = (n1 - 1) × SD1 ˆ 2 + (n2 - 1) × SD2ˆ 2 = 99 × 0.5 × 0.5 + 199 × 0.3 × 0.3 = 203.85
Pooled Var = Var/(n1 + n2 - 2) = 203.85/(100 + 200 - 2) = 0.68
SD = (Pooled Var)ˆ0.5 = (0.68)ˆ0.5 = 0.82
Cohen = (mean1 - mean2)/SD = (0.5 - (0.2))/0.82 = 0.37
Var_adjust = (n1 + n2)/(n1 × n2) + Cohen × Cohen/(2 × (n1 + n2)) = (100 + 200)/(100 × 200) + 0.37 × 0.37/(2 + (100 + 200)) = 0.015
Jcorrect = 1 - 3/(4 × (n1 + n2 - 2)- 1) = 1-3(4 × [100 + 200-2] - 1) = 0.997
Hedgesg = log(risk ratio) = Cohend × Jcorrect = 0.37 × 0.997 = 0.369
Var_g = Var_adjust × Jcorrect × Jcorrect + Vartau = 0.015 × 0.997 × 0.997 + 0 = 0.015
where Varau is the variance used for use in the randomeffect model. Otherwise, Varau equals zero in the mixed-effect model.
 |
Z score= log(risk ratio)/SE=0.369/0.122=3.02
P value=”=(1 - NORMSDIST (ABS(“ & Z score & ”))) × 2” = 0.0025
Lower limit = log(risk ratio) - SE × 1.96 = 0.128
Upper limit = log(risk ratio) + SE × 1.96 = 0.606
Weight = variance/total variance
To understand the similarities and differences in sentiment between the 2 journals, forest plots were drawn.
2.4. Task 3: cluster analysis of MeSH terms using social network analysis
Before visualizing our results using social network analysis (SNA), we organized the data of MeSH terms in the cited articles in compliance with the format and guidelines defined by Pajek software.[23] Microsoft Excel’s VBA routines were used to perform data fitting to SNA requirements (see Supplemental Digital Content 3, http://links.lww.com/MD2/A956).
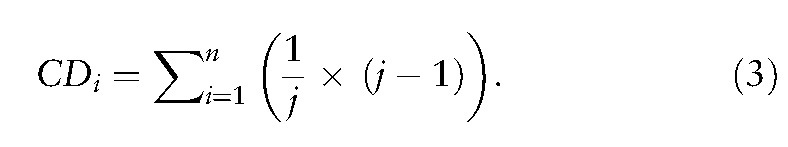
In SNA, each MeSH term (along with the journal name) defined as an actor (or a vertex or node in SNA) earns the centrality degree (CD) computed by Eq. 3, where n denotes the number of articles and j is the number of MeSH terms in an article (ie, the corresponding journal). For instance, if 5 MeSH terms are in an article, CD equals 0.83 (=1/6*[6-1]) when J (= total number of actors including the journal name) is 6. Similarly, the CD equals 0.5 when only 1 MeSH term exists; the CD equals 0.9 when 9 MeSH terms exist. The more cooccurrences that interact, the higher the CD will be in a network.
 |
Accordingly, cluster analysis was performed using SNA to observe the journal’s topics referring to the journal names and the corresponding MeSH terms. Clusters were separated by the SNA community algorithm and plotted on Google Maps. The largest bubble represents the node that is representative of MeSH terms in the cluster. Any cluster with a closer relationship is filled with identical colors in the respective bubble. Similarly, MeSH terms to represent article topics were applied to represent the features of the given article.
2.5. Task 4: identifying the odds ratio on MeSH terms between journals
The odds ratio (OR for short) was applied to identify the similarity and differences in research topics using MeSH terms in proportions observed in journals, different from the SMD used in sentiment comparison in Task 2.
The forest plot was also applied to display the estimates from the paired observations and events (ie, the counts of a specific MeSH term for a given journal) addressing the same research topic and feature, along with the overall effects[13] (ie, the average measure referred to variances across all MeSH terms). The righthand column is a plot of the measure of effect (eg, OR = odd ratio) for each observed MeSH term that is denoted by a square incorporating CIs, which are represented by horizontal lines.
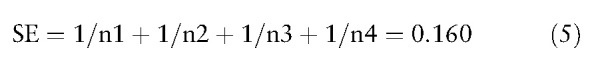
The 95% CIs can be yielded by the following Eqs. 4, 5, 6, 7, 8, 9, 10 if counts in a confusion matrix are known (eg, n1 = 85, n2 = 515, n3 = 100, and n4 = 500) in another example shown below:.
 |
 |
 |
 |
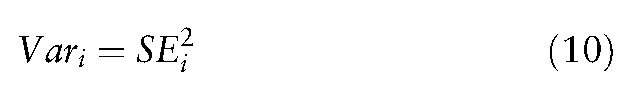 |
where SEi = 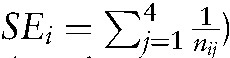 , (11) as the example in Eq. 5.
To identify the similarities and differences in research topics between the 2 journals, another forest plot was drawn when the proportions of all MeSH terms were taken into account in the 2 journals.
2.6. Task 5: creating dashboards on google maps
We applied the author-made modules in Microsoft Excel and the SNA in Pajek[23] to obtain the CD of each actor and to verify the differences in proportions of counts in MeSH terms between the 2 journals using forest plots. The pages of Hypertext Markup Language used for Google Maps were created. All relevant information was linked to the dashboards laid on Google Maps.
3. Results
3.1. Task 1: distribution of the study sample
In Table 1, we can see that JEMA has a higher impact factor (= 3.72) than Medicine ( = 1.52) using the number of citations and publications indexed in PubMed in 2020. The number of articles in Medicine was 5,115, substantially more than JFMA (= 495) in 2020. A total of 737 articles cited at least one time were involved in the following analyses.
Table 1 .
Distribution of the study sample.
|
Journal |
Jan |
Feb |
Mar |
Apr |
May |
Jun |
Jul |
Aug |
Sep |
Oct |
Nov |
Dec |
n |
% |
Ci |
IF |
||
|---|---|---|---|---|---|---|---|---|---|---|---|---|---|---|---|---|---|---|
|
Without citations |
427 |
246 |
217 |
276 |
456 |
340 |
621 |
414 |
434 |
553 |
400 |
489 |
4873 |
86.86 |
||||
|
JEMA |
132 |
23 |
21 |
21 |
18 |
25 |
15 |
20 |
33 |
17 |
25 |
29 |
379 |
6.76 |
||||
|
Medicine |
295 |
223 |
196 |
255 |
438 |
315 |
606 |
394 |
401 |
536 |
375 |
460 |
4494 |
80.11 |
||||
|
With citations |
199 |
120 |
68 |
82 |
80 |
50 |
59 |
39 |
24 |
11 |
3 |
2 |
737 |
13.14 |
1373 |
1.86 |
||
|
JEMA |
49 |
8 |
9 |
21 |
11 |
4 |
5 |
3 |
4 |
2 |
116 |
2.07 |
431 |
3.72 |
||||
|
Medicine |
150 |
112 |
59 |
61 |
69 |
46 |
54 |
36 |
20 |
9 |
3 |
2 |
621 |
11.07 |
942 |
1.52 |
||
|
N |
626 |
366 |
285 |
358 |
536 |
390 |
680 |
453 |
458 |
564 |
403 |
491 |
5610 |
100 |
1373 |
0.24 |
||
|
Sentimental analysis |
199 |
120 |
68 |
82 |
80 |
50 |
59 |
39 |
24 |
11 |
3 |
2 |
||||||
|
JEMA (positive) |
16 |
8 |
5 |
12 |
8 |
2 |
3 |
1 |
2 |
2 |
0 |
0 |
||||||
|
(Negative) |
32 |
0 |
4 |
9 |
3 |
2 |
2 |
2 |
2 |
0 |
0 |
0 |
||||||
|
Medicine (positive) |
68 |
40 |
28 |
20 |
36 |
21 |
32 |
14 |
6 |
8 |
0 |
1 |
||||||
|
(Negative) |
83 |
72 |
31 |
41 |
33 |
25 |
22 |
22 |
14 |
1 |
3 |
1 |
||||||
|
* IF = Ci/n. | ||||||||||||||||||
Most authors are from mainland China and Taiwan in Medicine and JFMA, respectively, based on the first authors’ affiliations in these 737 cited articles. The second and third counties are South Korea and Japan in Medicine and mainland China and the United States in JFMA. The top three are linked by three blue lines in Figure 1.

Figure 1. Distribution of first-author-affiliated countries in 2 journals.
The AACs are 0.85 and 0.82 (> 0.70)[19-22]) for Medicine and JFMA, respectively, indicating mainland China and Taiwan have a strong dominance in the 2 journals.
3.2. Task 2: sentiment analysis
A comparison of sentiment between the 2 journals was made and is shown in the bottom panel of Table 1 and Figure 2. The similarity is supported by the overall effect of abstract mood (Q = 8.3, I2 = 0, P = .68; Z = 0.46, P = .65).

Figure 2. Comparison of sentiment between the 2 journals.
3.3. Task 3: cluster analysis of MeSH terms
A total of 848 actors were involved in the network. Cluster analysis of MeSH terms was performed using SNA, as shown in Figure 3. We can see that the two journals have a common cluster (ie, named latent topic of patient and treatment). The other 2 clusters are represented by MeSH terms of analysis and anemia.

Figure 3. Cluster analyses of keywords in all 737 cited abstracts of these 2 journals.
3.4. Task 4: differences in MeSH terms using the forest plot
In Figure 4, the difference in the overall effect denoted by MeSH terms exists between the 2 journals (ie, Q = 185.5, I2 = 89.8, P < .001; Z = 5.93, P < .001) albeit a greater proportion of COVDI-19 articles in JFMA. Many cited articles in JFMA are related to COVID-19. In contrast, more articles related to drug therapy and therapeutic use were published in Medicine.

Figure 4. Comparison of occurrence proportions for MeSH terms in 2 journals.
3.5. Task 4: creating dashboards on google maps
Figures 2-4 are provided with links to the references.[24-28] Readers are invited to see the detailed information on the dashboard laid on Google Maps.
4. Discussion
4.1. Principle findings
We applied sentiment analysis, SNA, and forest plot techniques to explore the differences in research topics between the 2 journals based on the 737 cited articles. In this observational study pertaining to the 2 journals, most authors are from mainland China and Taiwan in Medicine and JFMA, respectively; similarity is supported by observing the abstract mood (Q = 8.3, I2 = 0, P = .68; Z = 0.46, P = .65); 2 journals are in a common cluster (named latent topic of patient and treatment) using SNA; and a difference in overall was found in MeSH terms (Q = 185.5, I2 = 89.8, P < .001; Z = 5.93, P < .001) using ORs. A greater proportion of COVID-19-related articles was observed in JFMA.
4.2. Review of research findings
With the recent popularity of big data- and knowledge discoveryrelated developments, we sought to retrieve the 737 cited articles published in both the journals of Medicine and JFMA to understand the similarities and differences in abstract moods and research topics by using sentiment analysis and SNA. With visualized dashboards, authors are able to know the journal’s characteristics with a quick glance. The forest plot was applied to monthly sentiments and MeSH terms in abstracts and articles, respectively.
The publications provide valuable insight into the characteristics of the 2 target journals. The main approaches were used in this study, including: the most author-affiliated countries/regions related to the target journal using choropleth maps[25]; comparison of sentiments in abstract and the article title made to the 2 scholarly journals; and difference in research topics between the 2 journals using the forest plot. The results guide researchers who submit articles to a given journal and examine the target journal’s characteristics via a visual display, which is novel and never seen before in the literature.
Through visual representations (Figs. 2 and 3), authors can easily submit their manuscripts to an appropriate journal soon when journal characteristics are known. This study applied SMD on Google Maps with forest plots to display all elements and entities on a dashboard that provided us with a breakthrough for future studies on other journals of interest. Readers are invited to click on the link at the references.[24-28] Such networks and comparisons in Figures 1 to 4 can be mimicked and applied to future studies using bibliometric analyses.
Sentiment analysis (also known as opinion mining or emotion artificial intelligence) refers to the use of natural language processing, text analysis, computational linguistics, and biometrics to systematically identify, extract, quantify, study affective states and subjective information.[29] Sentiment analysis has been widely applied to bioinformatics. Over 167 articles have been published in PubMed,[30] such as understanding the temporal evolution of COVID-19 research,[3] tracking COVID-19 discourse on Twitter,[31] and public perception of the COVID-19 pandemic on Twitter.[32] The implementation of sentiment analysis in Microsoft Excel is referred to in Supplemental Digital Content 2, http://links.lww.com/MD2/A955.
4.3. Implications and applications of the study
A novel approach for plotting the forest plots is provided in Supplemental Digital Content 3, http://links.lww.com/MD2/A956 which is easily and clearly produced in MS Excel and displayed on dashboards with Google Maps. The online forest plot can be applied to any 2-pair comparison with SMD or observed by events and nonevent counts (eg, in Figs. 2 and 4). The method of drawing forest plots has been frequently used in metaanalyses in the literature.[33] Nonetheless, none were demonstrated in MS Excel as we did in this study.
This study conducted a bibliometric analysis of the 737 cited articles in both the journals of Medicine and JFMA. In addition to the methods and instrumentality advantages used in this study, we provided distinct content-analysis tools (eg, sentiment analysis and SNA of MeSH terms) for researchers to have a systematic and comprehensive understanding of the research topics, such as the similarity and differences in MeSH terms between 2 journals.
The research community was actively responding and aiming to contribute their research to society as well as patient outcomes. The volume of research publications (particularly related to COVID-19) was tremendously produced in 2020.[3] For instance, >0.2 million articles have increased between 2 recent years (eg, 1,297,365 and 1,280,654 in 2019 and 2020, respectively).[34] The proportions of article types and topics[35] on COVID-19 in journals must have changed substantially in 2020. In this study, we compared differences in 2 scholarly journals using machine learning and natural language processing techniques to better understand the landscape of research in 2020.
Scientific paper writing for science journals is a highly adroit, competitive, and laborious process.[36] The study strengths include the following:comparing abstract mood in the 2 journals; extracting article topics from MeSH terms using SNA; drawing visual representations through SNA, choropleth map, and forest plots that can inspire other relevant research to replicate the approaches for other 2-paired journals in comparison in the future; and providing readers with an easy copy-paste method to draw forest plots online.[37]
Importantly, numerous meta-analysis studies have applied Review Manager (RevMan) software in publications.[38] The major drawback of RevMan does not consider using Hedges’ g adjustment in SMD comparison on the log(risk ratio)[39]: It turns out that Cohen effect(d) has a slight bias, tending to overestimate the absolute value in small samples. This bias can be removed by a simple correction that yields an unbiased estimate (ie, called Hedges’g) using a conversion formula of Jcorrect(J), interpreted Task 2(iv) in Methods of the present study (or referred to page 27 in the book of Introduction to Meta-Analysis).[39]
4.4. Limitations and suggestions
Although comparisons of similarities and differences in research topics and characteristics between journals were made in this study, several limitations should be noted to readers in future research.
First, we used SNA to analyze clusters of journals using MeSH terms to display the characteristics of journals. This might present somewhat different features from other SNA software, such as Usenet[40] and Gephi.[41] We provided Supplemental Digital Content 4, http://links.lww.com/MD2/A957 for readers who can understand how we transform the coordinates from the Pajek software[24] into Google Maps. The clusters can be gathered in colors and sizes on Google Maps with a hyperlink. It is worth developing newly constructed concepts (eg, journals and MeSH terms demonstrated in this study) that can be clustered for other disciplines or topics in future studies.
Many innovations have been introduced with advances in science and technology, such as the visual dashboard on Google Maps using the coordinates to display clusters of journals and MeSH terms, as shown in Figure 3. However, these achievements are not free of charge. For example, the Google Maps application-programing interface (API) requires a paid project key for use on the cloud platform. Thus, the second limitation to the study is that it is not publicly accessible and is difficult to mimic by other authors or programmers for use in a short period of time.
Third, the interpretation and generalization of the visual display should be done with caution because the data were merely extracted from PubMed. Note that any generalization should be made in similar article contents (eg, MeSH terms), target journals (eg, Medicine and JFMA), and identical databases, such as Scopus, Google Scholar, and Web of Science.[42]
Fourth, the data were extracted from 737 cited articles. This is a weak inclusion of articles in this study. More articles (eg, using a total of 5610 articles, including uncited articles) are suggested for future studies for making more precise inferences to the study.
Fifth, the journal impact factors shown in Table 1 were computed by citations and publications in 2020. We found differences in impact factors across years for each journal, which cannot be generalized to the future because journal impact factors of each year are not always similar based on the Clarivate Analytics.[43]
Sixth, although both journals of Medicine and JFMA[15,16] were selected for evaluating similarities and differences in research topics, the bias might be due to other journals (eg, Sci Rep, or PLoS One[14]) also worthy of being involved in investigating their similarities and differences in research topics using sentiment analysis. Future studies are encouraged to choose any 2 journals to verify the research topics similar to or different from the present study.
Finally, although sentiment analysis was performed in this study, future studies are encouraged to conduct latent class analysis and compare the difference in research topics based on latent class analysis using text mining techniques on abstracts in target journals, as those 1333 studies[44] did in the past.
5. Conclusions
This study exhibited a detailed overview of the characteristics of similarities and differences between the 2 journals of Medicine and JFMA using bibliometric analysis. Several foundations for future studies were paved, i ncluding visual techniques (eg, forest plot and choropleth map) to compare sentiments and research topics on abstracts and titles in journals and cluster analysis (eg, SNA) that can be mimicked for future studies to provide readers with knowledge concepts using visual displays.
Visualizations provide deep insight into the relationships between journals in research topics. The results of this study will help readers submit future studies to a given journal (either Medicine or JFMA).
Acknowledgments
The authors thank Enago (www.enago.tw) for the English language review of this manuscript.
Author contributions
JK initiated the research, YT collected data, SYC conducted the analysis, and TW wrote the manuscript. JK contributed to the design of the study and provided critical reviews of the manuscript, and WC contributed to monitoring the study.
Conceptualization: Ju-Kuo Lin, Sam Yu-Chieh Ho.
Data curation: Yu-Tsen Yeh, Sam Yu-Chieh Ho.
Formal analysis: Tsair-Wei Chien.
Funding acquisition: Willy Chou.
Methodology: Tsair-Wei Chien.
Footnotes
Ethics approval and consent to participate: Not applicable.
All data were downloaded from the MEDLINE database at pubmed.com.
Consent to publish: Not applicable.
The authors have no funding and conflicts of interest to disclose.
Supplemental Digital Content is available for this article.
Availability of data and materials: All data used in this study are available in Supplemental Digital Content files.
The datasets generated during and/or analyzed during the current study are publicly available.
How to cite this article: Lin JK, Chien TW, Yeh YT, Ho SC, Chou W. Using sentiment analysis to identify similarities and differences in research topics and medical subject headings (MeSH terms) between Medicine (Baltimore) and the Journal of the Formosan Medical Association (JFMA) in 2020: a bibliometric study. Medicine 2022;101:00(e29029).
Abbreviations: AAC = absolute advantage coefficient, MeH = medical subject headings, OR = odds ratio, SNA = social network analysis.
References
- [1].Riba M, Sala C, Toniolo D, Tonon G. Big data in medicine, the present and hopefully the future. Front Med (Lausanne) 2019;6:263. [DOI] [PMC free article] [PubMed] [Google Scholar]
- [2].Schroter S, Price A, Flemyng E, et al. Perspectives on involvement in the peer-review process: surveys of patient and public reviewers at two journals. BMJ Open 2018;8:e023357. [DOI] [PMC free article] [PubMed] [Google Scholar]
- [3].Ebadi A, Xi P, Tremblay S, Spencer B, Pall R, Wong A. Understanding the temporal evolution of COVID-19 research through machine learning and natural language processing. Scientometrics 2020;19:1- 15. [DOI] [PMC free article] [PubMed] [Google Scholar]
- [4].Sandhu A. The evidence base for oral and maxillofacial surgery: 10-year analysis of two journals. Br J Oral Maxillofac Surg 2012;50:45- 8. [DOI] [PubMed] [Google Scholar]
- [5].Foo JY. Implications of a single highly cited article on a journal and its citation indexes: a tale of two journals. Account Res 2013;20:93- 106. [DOI] [PubMed] [Google Scholar]
- [6].Asaad M, Rajesh A, Banuelos J, Vyas KS, Tran NV. Time from submission to publication in plastic surgery journals: the story of accepted manuscripts. J Plast Reconstr Aesthet Surg 2020;73:383- 90. [DOI] [PubMed] [Google Scholar]
- [7].Chien TW. Content analysis in bibliometric analyses in Pubmed. Available at: https://pubmed.ncbi.nlm.nih.gov/?term=%22content+analysis%22%5Btitle%5D+and+bibliometric. Assessed on February 4, 2021.
- [8].Sukotjo C, Yuan JC, Bordage G. A content analysis of dental education research as reported in two journals. J Dent Educ 2010;74:1106- 12. [PubMed] [Google Scholar]
- [9].Hale TM, Pathipati AS, Zan S, Jethwani K. Representation of health conditions on Facebook: content analysis and evaluation of user engagement. J Med Internet Res 2014;16:e182doi: 10.2196/jmir.3275. [DOI] [PMC free article] [PubMed] [Google Scholar]
- [10].Sedgwick P. How to read a forest plot in a meta-analysis. BMJ 2015;351: h4028. [DOI] [PubMed] [Google Scholar]
- [11].Stephenson J. Explaining the forest plot in meta-analyses. J Wound Care 2017;26:611- 2. [DOI] [PubMed] [Google Scholar]
- [12].Yan YH, Chien TW. The use of forest plot to identify article similarity and differences in characteristics between journals using medical subject headings terms: A protocol for bibliometric study. Medicine (Baltimore) 2021;100:e24610. [DOI] [PMC free article] [PubMed] [Google Scholar]
- [13].Lalkhen AG, Statistics V. Introduction to clinical trials and systematic reviews. Continuing Education in Anesthesia Critical Care & Pain 2008;8:143- 6. [Google Scholar]
- [14].Chien TW. Using bibliometric analysis to evaluate the publications in Taiwan during the entire year of 2020. J Biblio Analy in Stats 2021;18:1-3. 2021/8/23 available at http://www.healthup.org.tw/article/articlex/top10taiwan2020.pdf. [Google Scholar]
- [15].Medicine. A general medical journal. Available at: https://journals.lww.com/md-journal/pages/default.aspxAssessed on January 3, 2021.
- [16].JFMA. A general medical journal. Available at: https://www.journals.elsevier.com/journal-of-the-formosan-medical-association. Assessed on January 3, 2021.
- [17].Chien TW. Study sample in this study. Available at: http://www.healthup.org.tw/html100/medicine2journal.htm. Assessed on January 3, 2021.
- [18].Chien TW, Wang HY, Hsu CF, Kuo SC. Choropleth map legend design for visualizing the most influential areas in article citation disparities: A bibliometric study. Medicine (Baltimore) 2019;98:e17527. [DOI] [PMC free article] [PubMed] [Google Scholar]
- [19].Yang DH, Chien TW, Yeh YT, Yang TY, Chou W, Lin JK. Using the absolute advantage coefficient (AAC) to measure the strength of damage hit by COVID-19 in India on a growth-share matrix. Eur J Med Res 2021;26:61. [DOI] [PMC free article] [PubMed] [Google Scholar]
- [20].Lee CJ, Chou W, Chien TW, Yeh YT, Jen TH. Using the separation index for identifying the dominant role in an organization: a case of publications in organization innovation. The International Journal of Organizational Innovation 2020;12:135- 45. [Google Scholar]
- [21].Chang CS, Yeh YT, Chien TW, Lin JCJ, Cheng BW, Lai FJ. Using the separation index to identify the most dominant role: a case of application on COVID-19 outbreak. The International Journal of Organizational Innovation 2020;12:10- 20. [Google Scholar]
- [22].Chien TW. Cronbach’s Alpha with the dimension coefficient to jointly assess a scale’s quality. Rasch Measurement Transactions 2012;26:1379. [Google Scholar]
- [23].Batagelj V, Mrvar A, Jünger M, Mutzel P. Pajek—analysis and visualization of large networks. Graph Drawing Software. Berlin: Springer; 2003. 77-103. [Google Scholar]
- [24].Chien TW. Figure 1-1 in this study. Available at: http://www.healthup.org.tw/gps/wdmedice2journal.htm. Assessed on January 20, 2022.
- [25].Chien TW. Figure 1-2 in this study. Available at: http://www.healthup.org.tw/gps/wdmedice2journal2.htm. Assessed on January 20, 2022.
- [26].Chien TW. Figure 2 in this study. Available at: http://www.healthup.org.tw/gps/medicine2journalforest.htm. Assessed on January 20, 2022.
- [27].Chien TW. Figure 3 in this study. Available at: http://www.healthup.org.tw/gps/medicine2journalkeys.htm. Assessed on January 20, 2022.
- [28].Chien TW. Figure 4 in this study. Available at: http://www.healthup.org.tw/gps/medicine2journalforest2.htm. Assessed on January 20, 2022.
- [29].Chien TW. The definition of sentiment analysis in WIKI. Available at: https://www.google.com/search?q=artificial+intelligent&rlz=1C1MSIM_enTW725TW725&oq=artificial+intelligent&aqs=chrome.69i57j0i10i433j0i10l6.1639j0j7&sourceid=chrome&i.e.,=UTF-8. Assessed on February 4, 2021.
- [30].Chien TW. Sentiment analysis in article title. Available at: https://pubmed.ncbi.nlm.nih.gov/?term=%22sentiment+analysis%22%5Btitle%5D. Assessed on August 23, 2021.
- [31].Jang H, Rempel E, Roth D, Carenini G, Janjua NZ. Tracking COVID-19 discourse on twitter in north america: topic modeling and aspect-based sentiment analysis. J Med Internet Res 2021;doi: 10.2196/25431. Epub ahead of print. [DOI] [PMC free article] [PubMed] [Google Scholar]
- [32].Boon-Itt S, Skunkan Y. Public perception of the COVID-19 pandemic on twitter: sentiment analysis and topic modeling study. JMIR Public Health Surveill 2020;6:e21978. [DOI] [PMC free article] [PubMed] [Google Scholar]
- [33].Chien TW. Meta-analysis in Pubmed. Available at: https://pubmed.ncbi.nlm.nih.gov/?term=Meta-analysis%5BMeSH+Major+Topic%5D. Assessed on February 10, 2021.
- [34].Chien TW. Over 1,618,141 articles of COVID-19 in Pubmed. Available at: https://pubmed.ncbi.nlm.nih.gov/?term=%28%222020%22%5BDate+-+Publication%5D+%3A+%222020%22%5BDate+-+Publication%5D%29. Assessed on January 26, 2021.
- [35].Chien TW, Wang HY, Kan WC, Su SB. Whether article types of a scholarly journal are different in cited metrics using cluster analysis of MeSH terms to display: a bibliometric analysis. Medicine (Baltimore) 2019;98:e17631doi: 10.1097/MD.0000000000017631. [DOI] [PMC free article] [PubMed] [Google Scholar]
- [36].Meo SA, Eldawlatly AA. Pathophysiology of a scientific paper. Review Saudi J Anaesth 2019;13(suppl 1):S9- 11. [DOI] [PMC free article] [PubMed] [Google Scholar]
- [37].Chien TW. Onine forest plot using the copy-paste methods. Available at: http://www.healthup.org.tw/kpiall/forestplot.asp. Accessed on January 24, 2022.
- [38].Chien TW. Articles with meta-analysis using RevMan in Pubmed. Available at: https://pubmed.ncbi.nlm.nih.gov/?term=Meta-analysis%5BMeSH+Major+Topic%5D+and+%28%22Review+Manager%22+or+RevMan%29+. Accessed on January 24, 2022.
- [39].Michael B, Hedges LV, Higgins JPT, Rothstein HR. Introduction to Meta-Analysis. 2011;John Wiley & Sons, 2021/2/4 available at http://www.healthup.org.tw/marketing/course/pdf2/Metaanalysisenglish.pdf. [Google Scholar]
- [40].Borgatti SP, Everett MG, Freeman LC. Ucinet for Windows: Software for Social Network Analysis. Harvard, MA: Analytic Technologies; 2002. [Google Scholar]
- [41].Bastian M, Heymann S, Jacomy M. Gephi: an open source software for exploring and manipulating networks. In: Third international AAAI conference on weblogs and social media. 2009.
- [42].Falagas ME, Pitsouni EI, Malietzis GA, Pappas G. Comparison of PubMed, Scopus, Web of Science, and Google Scholar: strengths and weaknesses. FASEB J 2008;22:338- 42. [DOI] [PubMed] [Google Scholar]
- [43].Shelepak A. Clarivate analytics (formerly produced by thomson reuters) journal metrics and AJPH. Am J Public Health 2017;107:1526. [DOI] [PMC free article] [PubMed] [Google Scholar]
- [44].Chien TW. Latent class analysis for articles in PubMed. Available at: https://pubmed.ncbi.nlm.nih.gov/?term=%22latent+class+analysis%22%5Btitle%5D. Assessed on February 2, 2021.