Abstract
Although external concentrations are more readily quantified and often used as the metric for regulating and mitigating exposures to environmental chemicals, the toxicological response to an environmental chemical is more directly related to its internal concentrations than the external concentration. The processes of absorption, distribution, metabolism, and excretion (ADME) determine the quantitative relationship between the external and internal concentrations. ADME processes are often susceptible to saturation at high concentration, which can lead to nonlinear changes in internal concentrations that deviate from proportionality. Using generic physiologically-based pharmacokinetic (PBPK) models, we explored how saturable absorption or clearance influence the shape of the internal to external concentration (IEC) relationship. We used the models for hypothetical chemicals to show how differences in kinetic parameters can impact the shape of an IEC relationship; and models for styrene and caffeine to explore how exposure route, frequency, and duration impact the IEC relationships in rat and human exposures. We also analyzed available plasma concentration data for 2,4-dichlorophenoxyacetic acid to demonstrate how a PBPK approach can be an alternative to common statistical methods for analyzing dose proportionality. A PBPK modeling approach is a useful tool that can be used in early stages of a chemical safety assessment program to optimize the design of longer-term animal toxicity studies or to interpret study results.
Keywords: Physiologically based pharmacokinetic (PBPK), animal study design, internal concentrations, nonlinear pharmacokinetics, saturation of absorption, saturation of clearance
Introduction
Modern toxicity testing increasingly seeks and utilizes non-animal approaches, but whole animal studies still play a critical role in assessing potential human health risks because in vivo methods can provide data that are currently unobtainable using alternative approaches. Such data include internal concentrations and dose-response relationships at the organism or population level. These in vivo studies can also provide insight into the roles of pharmacokinetics (PK) and potential mechanisms of toxic action in determining the dose-response relationship. For certain environmental chemicals, chronic toxicity and carcinogenicity studies are required to assess human health risks under prolonged and repeated exposures. These repeated dose animal studies are designed and conducted to meet objectives beyond hazard identification alone; a well-designed study could also inform how the toxicity of a chemical progresses or changes with increasing doses or exposure durations, allowing the studies to be more predictive of human health risks under realistic exposure circumstances. An optimal design of a study is best supported by integrating and collectively assessing the available body of data to determine, for example, human relevant effects, the most suitable animal model (i.e., test species), and appropriate dose levels and dose spacing that can maximize the interpretability of study results (OECD 2014).
Pharmacokinetic data can provide valuable information during in vivo study design through the characterization of the internal to external concentration (IEC) relationship, which might exhibit species, sex, age, time, or dose-dependent differences. While external concentrations can often be more readily quantified and controlled in animal studies than the resultant internal concentrations, toxicological responses are more directly related to internal concentrations. Improved understanding of PK can also provide a stronger mechanistic basis to extrapolate or compare study results across studies, species, doses, and organism life stages. The term “external concentration” is used herein as panoptic shorthand to refer to multiple common terminologies (such as administered dose, applied dose, external exposure, or external dose) used to describe intentional dosing in animal studies and human exposure to environmental chemicals. Similarly, the term “internal concentration” is used herein to represent xenobiotic found in animal or human blood, plasma, or tissues that are described with multiple terms (such as systemic exposure, internal dose, effective dose, or internal exposure).
The IEC relationship is controlled by the processes of absorption, distribution, metabolism, and excretion (ADME). Many ADME processes are mediated by enzymes or transporters, and therefore have the potential to become saturated at higher concentrations. Examples of saturable ADME processes include intestinal metabolism, tissue or plasma protein binding, transporter-mediated tissue absorption, renal tubular reabsorption, hepatic metabolism, enzyme induction or inhibition, and biliary secretion (Yu and Shargel 2016). As a result, changes in chemical concentrations in blood, plasma, or tissues can be higher or lower than would be expected by assuming proportionality in the IEC relationship; “non-linearity” is used herein to describe the resultant IEC relationship that deviates from proportionality. To illustrate how saturable ADME process(es) can lead to a nonlinear IEC relationship, a generic physiologically based pharmacokinetic (PBPK) model for rats was constructed to simulate saturable absorption and clearance processes and the resultant IEC relationships for several hypothetical and known chemicals. In our test cases, the area under the curve (AUC) of plasma concentrations was chosen to represent the internal concentration of interest, which is generally an appropriate dose metric for lifetime exposure to systemically acting chemicals (Clewell, Andersen, and Barton 2002; Voisin et al. 1990). There are cases where other dose metrics are more toxicologically relevant than AUC, for example peak concentration, amount or rate of metabolism, or protein adduct levels. Dose metrics other than AUC can also be simulated using a PBPK model and should be selected on a chemical-specific and case-by-case basis. This generic PBPK model was also parameterized for humans to explore how different exposure scenarios, including variations in routes, duration, and frequency, influence the IEC relationship.
Characterizing the proportionality of the IEC relationship is important for toxicity study design and chemical risk assessment (Borgert, Fuentes, and Burgoon 2021). The common analyses used include visual inspection and comparison of fold changes in external and internal concentrations (Loccisano et al. 2020; Loccisano et al. 2021; Saghir et al. 2013; Terry et al. 2014), as well as statistical methods that examine if a linear assumption can be used to adequately describe the IEC relationship (Bartels et al. 2020; McFadden et al. 2012; Saghir et al. 2012). There are several issues associated with the visual inspection and fold-change methods; both are inherently subjective, are frequently based on the average blood or plasma concentration for each administered dose group, only distinguish tested dose groups as simply proportional or not proportional, and lack informative statistical outputs, such as confidence bounds to provide objective criteria for defining proportionality.
Other statistical methods, such as piecewise regression, can be used to estimate an external concentration above which the IEC relationship markedly deviates from proportionality and to quantitatively address uncertainty in such an estimate with confidence bounds. These methods also require a pre-determined criterion, such as a specific percentage that the IEC relationship is allowed to deviate from the expected proportional relationship before being classified as not proportional. However, choosing such a criterion requires quantitative understanding of the dose-dependent transition of a known or proposed mode of action, and such information is often not available.
The objective of the current proof of principle study, involving multiple test cases, is to demonstrate the potential use of a PBPK model for integrating available ADME data to predict the IEC relationship. It is important to note that the utilized model and test cases represent a theoretical exploration of a modeling approach for data analysis and hypothesis testing. If the model purpose is outside of this context (for example, conducting extrapolations to support regulatory risk assessment), the modeling analysis should go through an application-appropriate, rigorous validation process as described elsewhere (e.g., USEPA 2006, WHO 2010). Nonetheless, the test cases examined herein demonstrate the utility of PBPK models to provide a clearer understanding of the IEC relationship, which can inform better design or interpretation of repeated dose animal toxicity studies.
Methods
Generic PBPK Model
A generic PBPK model was constructed for both rats and humans (physiological parameters listed in Table S1) to simulate, at pseudo steady state, the average daily AUC of plasma concentration of the parent chemical and its metabolite from repeated daily dosing. Unless otherwise specified, all simulations were performed for 100 external doses, the magnitude of which were evenly log-spaced between 1 and 1,0001 mg/kg bw/day. The model included flow-limited compartments for liver, fat, lumped rapidly perfused tissues, and lumped slowly perfused tissues (structure in Figure 1). The selection of utilized compartments was guided by the principle of parsimony (USEPA 2006) and the specific relevance for the conducted test cases. Liver was separated from the lumped rapidly perfused tissue to represent a major metabolism site; fat was separated from the lumped slowly perfused tissues to account for elevated lipophilicity of styrene. The model assumed distribution of chemicals to the tissues is blood flow limited. This generic model included an oral and an inhalation route; and for one of the test cases, a dermal route via a skin compartment was added. Oral exposure can be a single exposure or repeated daily exposure from one or more exposure episodes within a 24-hour period. Oral exposure was described using a combination of a first-order absorption rate and an absorption fraction that could be a fixed value or saturable, exhibiting progressive reductions at higher external concentrations.
Figure 1:
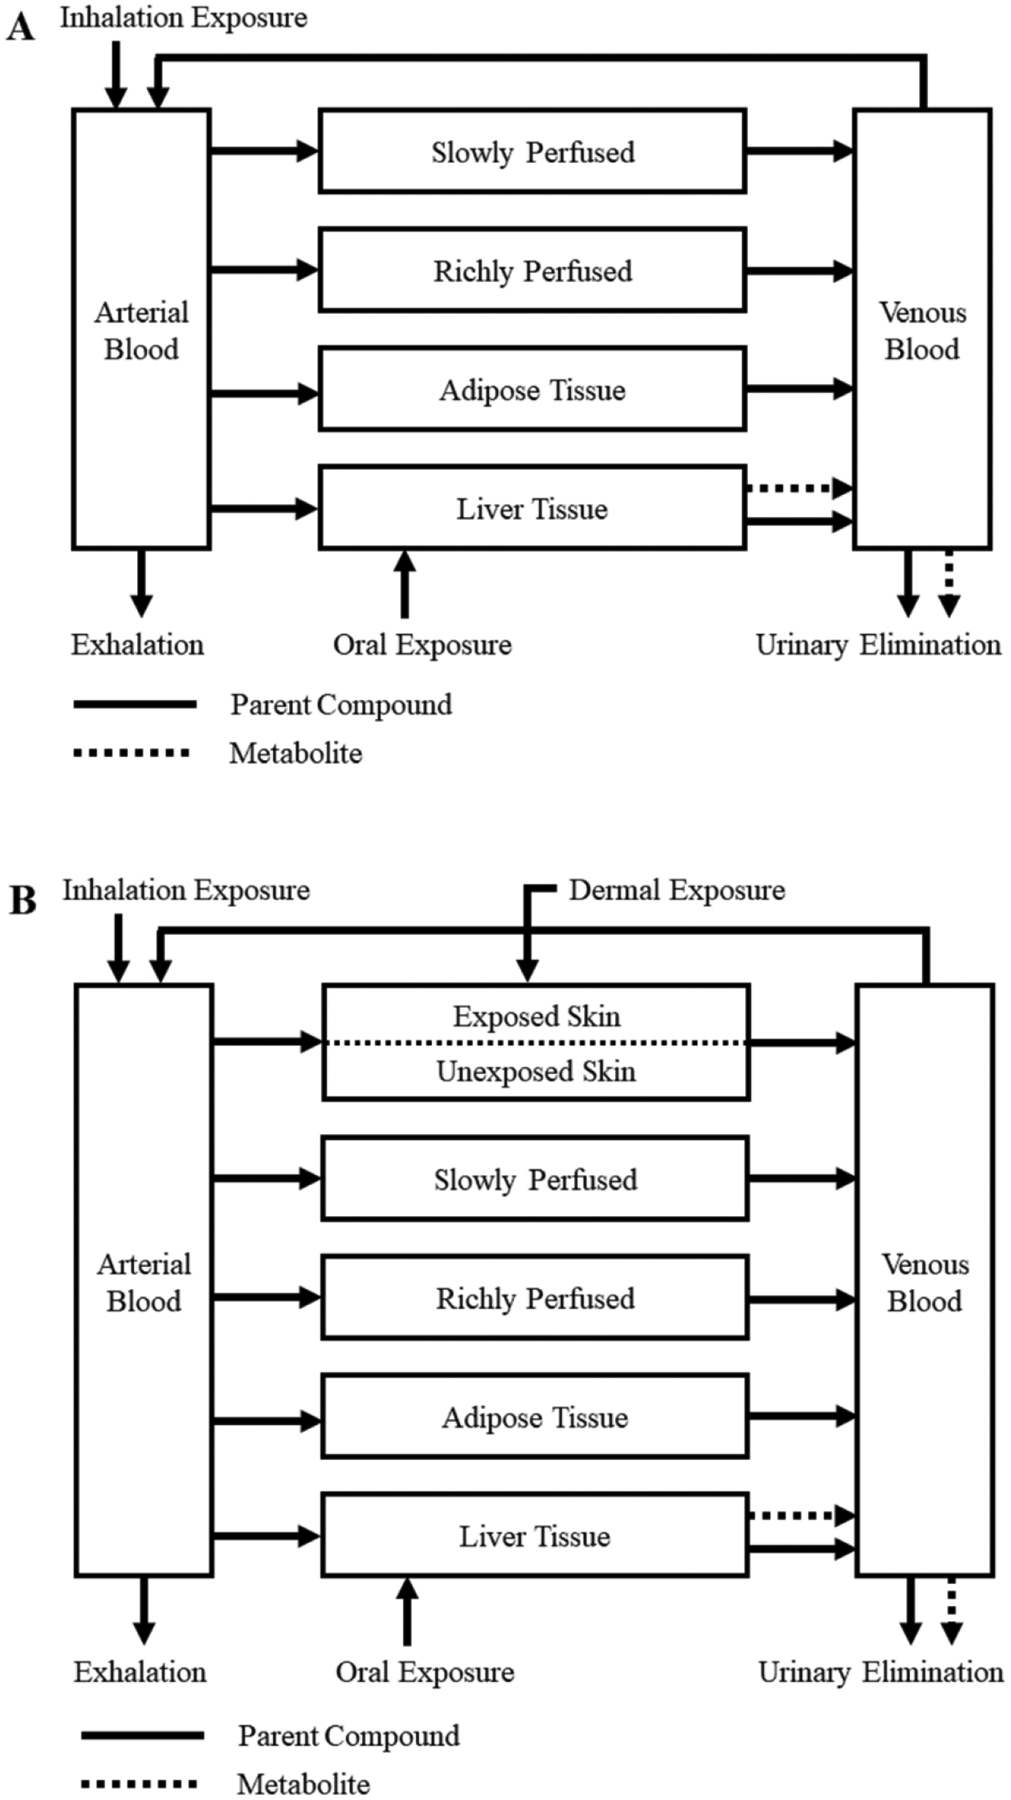
Two schematic diagrams showing the structure of a generic PBPK model for rats (panel A) and humans (panel B). The parent compound is indicated by solid lines whereas metabolite is shown using broken lines. Inhalation, oral, and dermal exposure routes are shown with the model compartment that first receives the external concentration. The skin compartment for dermal exposure (panel B) is divided by a broken line to indicate separate treatment of exposed and unexposed skin areas in the model.
Six proof-of-principle test cases were performed using the model to understand how the IEC relationship was influenced by nonlinear absorption or metabolism/clearance processes (summarized in Table 1). However, these proof-of-concept test cases using hypothetical and known chemicals are not meant to simulate the PK of specific chemicals for risk assessment purposes. The structure, parameterization, and required predictive capabilities of a PBPK model for other purposes should be determined according to the intended use and accepted range of uncertainty. The physiological parameters used in the rat and human models were obtained from the literature (Brown et al. 1997; Lave et al. 1997) (Table S1). With the exception of the styrene test case, all chemicals were assumed to be non-volatile, so the blood:air partition coefficient (PC) was set to a large value (1000) and exhalation of these chemicals was not expected. The tissue:blood PCs (Tables S2–S4) were estimated using the unadjusted Schmitt method in the High Throughput Toxicokinetic (httk) package (v 2.0.4 in R v 4.0.4) (Pearce et al. 2017). In all cases where PCs were estimated with httk, the rapidly perfused tissue:blood PC was set to be the same as the liver:blood value. Plasma protein binding was not assumed in these test cases, so fraction unbound was set to 1.0. In the model it is assumed that a chemical can be metabolized in liver to a single metabolite and/or excreted in urine. Hepatic metabolism and urinary excretion of the parent chemical, as well as urinary excretion of the metabolite, were described using two terms, a first order process and Michaelis-Menten kinetics (see equation below for a generic substrate “S” and product “P”). Hepatic metabolism or urinary excretion were a first order process when Vmax was set to zero and a value was provided for the first order rate.
No further metabolism or clearance was included in the model. This model was implemented in Berkeley Madonna (v.10) for most analyses. The model was also implemented in R (v.4.0.3), as an open-access alternative to Berkeley Madonna, for the analysis of the proportionality of published 2,4-D AUC data (code available in the Supplemental Material, Appendices S1–S4).
Table 1.
Test cases using PBPK modeling
| Case Study Chemicals | Species | Modeling Purposes |
|---|---|---|
| Test Case 1: Hypothetical chemical A | Rat | Evaluate the internal to external (IEC) relationship for the parent assuming a wide range of:
|
| Test Case 2: Hypothetical chemicals A, B | Rat | Simulate the IEC relationships for both the parent and the metabolite, assuming:
|
| Test Case 3: Hypothetical chemicals C, D | Rat | Simulate the IEC relationships for both the parent and the metabolite, assuming first-order or saturable oral absorption (Figure 6) |
| Test Case 4: Styrene | Rat | Compare the IEC relationships across: |
| Human | Compare the IEC relationships across:Compare the estimated air concentrations with the simulated IEC relationship | |
| Test Case 5: Caffeine | Human | Compare the IEC relationships between oral and dermal exposures (Figure 8) Compare the estimated human exposures to caffeine with the simulated IEC relationship |
| Test Case 6: 2,4-D | Rat | Analyze the proportionality of the IEC relationship based on plasma AUCs measured at multiple external concentrations (Figure 9) |
Test case 1: Impact of partition coefficients and absorption/metabolic constants
PBPK analysis often involves sensitivity analyses to evaluate how the model outputs (dose metrics) are affected by the estimated model parameters (USEPA 2006; WHO 2010). Generally, a subset of model parameters is highly influential for the outputs. This test case is similar to a sensitivity analysis, but here the purpose is to understand about how different biology, described with model parameters, alters the IEC relationships. Specifically, we sought to understand how values of PCs, saturable absorption constants (maximum reduction in relative absorption fraction [fimax] and dose associated with half-maximal absorption [f50]), and saturable metabolism constants for the parent (maximum rate of metabolism [Vmax] and concentration associated with half-maximal metabolism [Km]) influence the shape of the IEC curves. By varying the values of each of these constants across a broad range, we illustrated the impacts on IEC for a variety of theoretical chemicals. In this test case, parent metabolism was the only saturable process described in the model to simulate parent plasma AUCs given external concentrations between 1 and 1,000 mg/kg bw/day. The parameter values for hypothetical chemical A were used as the starting point (chemical specific parameter values in Table S2) to generate an IEC curve. This curve was compared to curves generated by increasing or decreasing PCs by 10-fold and 100-fold, one PC at a time and all four PCs together. Additional curves were generated by increasing or decreasing Vmax by 2-fold, 5-fold, and 10-fold; Km by 5-fold, 10-fold, and 100-fold; and Vmax and Km by 10-fold together, with the ratio of Vmax/Km kept the same. Next, we assumed that oral absorption was the only saturable process, the IEC curves were generated by setting (fimax, f50) to (0.9, 100), (0.5, 100), (0.1, 100), (0.9, 500), and (0.9, 50) and compared to a first-order oral absorption scenario by setting fimax to zero.
Test case 2: Impact of saturable metabolism and clearance on the IEC relationship
The purpose of this test case is to demonstrate how saturable hepatic metabolism and urinary excretion influence the IEC relationships for both the parent chemical and its metabolite. In this test case, the model was used to simulate repeated oral dosing to two hypothetical chemicals in rats for 20 days. These hypothetical chemicals represented realistic chemicals with difference physico-chemical properties (for example, A: logKow =1.48; B: logKow = 4.66). The metabolic constants (A: Vmax = 6.1, Km = 2.5; B: Vmax = 528, Km = 180) were predicted using quantitative structure-property relationships algorithms in IndusChemFate (chemical-specific parameter values in Table S2). While the parameter values for hypothetical chemicals A and B were estimated based on known chemicals, the parameter values for their metabolites (such as volume of distribution and excretion rate constants) were placeholder values for proof-of-principle demonstration. When data are available for specific metabolites, these placeholder values can be replaced with data, and additional metabolic pathways can be added to the model. The IEC curves for the parents and the metabolites were simulated based on one of the three saturable processes (described as Michaelis-Menten kinetics): (1) saturable hepatic metabolism of the parent chemical (no urinary clearance of the parent); (2) saturable urinary clearance of the parent (with first-order metabolism of the parent); (3) saturable urinary clearance of the metabolite (first-order metabolism and no urinary clearance of the parent). One additional case was simulated, using only the hypothetical chemical A, for a scenario where both parent metabolism and metabolite clearance were saturable. The maximum rate of metabolite clearance (VmaxUM) was set to either double or half of the parent Vmax. In addition, the IEC curves for first-order metabolism and urinary clearance were generated to compare with the saturable scenarios.
Test case 3: Saturable oral absorption fraction
The purpose of this test case is to demonstrate how saturable oral absorption influences the IEC relationship for the parent chemical and its metabolite. To parameterize the model for describing saturable absorption, fractional oral absorption for two hypothetical chemicals, C and D, was first predicted with the physiologically based oral absorption program, GastroPlus® (version 9.8, Simulation Plus Inc., Lancaster, CA, USA) across a wide range of external concentrations. Such models are commonly used to understand factors impacting oral absorption (Chung et al. 2017; Hansmann et al. 2016; Margolskee et al. 2017). In GastroPlus®, quantitative structure activity relationship (QSAR) predictions of physico-chemical properties of the test materials (Khurana et al. 2017) provided inputs for a variant of the Advanced Compartmental Absorption and Transit (ACAT) model, which included dissolution and absorption of chemicals in nine separate sections of the gastrointestinal tract (De Buck et al. 2007; Parrott et al. 2009).
Next, a simplified representation of saturable oral absorption fraction, following the equation of Dolton and D’Argenio shown below (Dolton and D’Argenio 2017), was programmed as a standalone model (code in Supplementary Material, Appendix S3) to fit the GastroPlus® predicted oral absorption fraction by reducing the residual sum of squares between the log-transformed predicted absorption fractions and the log-transformed GastroPlus® values (Figure S1).
Where fa is the maximum fractional bioavailability of the chemical, fimax is the maximum fractional reduction in relative bioavailability, bolus is the administered oral dose, dose_prop_term is the dose at which the response is no longer dose-proportional, and f50 is the amount of additional dose above the dose_prop_term that is associated with half-maximal reduction in relative bioavailability (i.e., a bolus equal to f50 + dose_prop_term is the dose where the reduction in relative bioavailability is expected to be equal to 0.5*fimax).
To examine the effect of saturable oral absorption on the IEC relationship, we simulated repeated oral dosing of the above two hypothetical chemicals in rats for 20 days. Saturable oral absorption was parameterized using the values fit to the GastroPlus® generated absorption fractions. Parent metabolism was assumed to be a first-order process, using hepatic clearance rates predicted from QSAR-based total microsomal clearance in rats (ADMET predictor module v10.0 of GastroPlus®). There was no urinary excretion for the parent (both urinary excretion rate [CLU] and maximum rate of urinary excretion [VmaxU] were set to 0), and the first-order clearance rate for the metabolite (CLUM) was assumed to be twice the parent metabolism rate (CLH).
Test case 4: Styrene
The purpose of this test case is to compare the IEC relationships between rats and humans, between oral and inhalation exposures (using a rat model), for different exposure frequencies (using a rat oral model), and for different exposure durations (using a human inhalation model). In addition, potential occupational inhalation exposure levels were estimated from more than 14,000 personal samples collected by the United States Occupational Safety and Health Administration (OSHA) from 1984–2020 (OSHA 2020). Styrene air concentrations ranged from 0–2272 ppm with a median of 32 ppm and a mean of 54 ppm (Figure S2). These potential exposure levels were compared to external concentrations at which styrene metabolism saturated by simulating 8 hours/day inhalation exposure for 20 days. Styrene metabolic parameters (Vmax and Km) were fit to available rat data (Withey 1976; Young et al. 1979) (Figure S3) and styrene-specific tissue partition coefficients were obtained from the literature (Ramsey and Andersen 1984) (Table S3). In this test case, the only clearance mechanism described in the model was saturable hepatic metabolism (no urinary excretion) to predict parent AUCs (no metabolite predictions), as suggested by the available animal data. For interspecies comparison, both rat and human models were used to simulate 6 hours per day inhalation exposures for 20 days (parameter values are listed in Table S3), given air concentrations between 1.84 and 1,844 ppm. This range of air concentrations was calculated to be equivalent to oral bolus doses between 1 to 1,000 mg/kg bw/day in rats for total inhalation and total oral concentrations.2 The difference between this conversion and a conversion based on total amount of styrene metabolized (toxicity arises from metabolite) was small (Figure S4). For route comparison, the rat model was used to simulate 6 hours per day inhalation exposure and daily oral exposure for 20 days, given external concentrations between 1 and 1,000 mg/kg bw/day. To explore exposure frequency, the rat model was used to simulate oral exposures, with total daily doses between 1 and 1,000 mg/kg bw/day, from evenly spaced 1, 3, 6 or 12 doses per day for 20 days, or a single dose. For exposure duration, the human model was used to simulate inhalation exposure to air concentrations between 1 and 2,000 ppm, for 1, 8 or 24 hours per day for 20 days.
Test case 5: Caffeine
The purpose of this test case is to simulate the IEC curves from oral or dermal exposures to caffeine (chemical specific parameter values in Table S3). Similar to the styrene test case, potential human exposure levels were also compared to predicted external concentration at which caffeine metabolism is saturated. Human exposures to caffeine can come from multiple sources, such as oral intake from caffeinated beverages and chocolate (EFSA Panel on Dietetic Products 2015) or skin contact with consumer products that contain caffeine. The maximum 95th percentile of caffeine intake estimated from all food/drink sources was 648 mg/day (or 10.8 mg/kg bw/day) for adults (18 to <65 years old) or 786 mg/day (or 13.1 mg/kg bw/day) for those ≥65 years old (OECD 2020). For dermal exposure, the Tier 0 deterministic cosmetic product exposure assessment (SCCS 2021) was used to estimate a worst-case aggregate exposure level from using personal care products such as shower gel, shampoo, hair styling products, body lotion, face cream, hand cream, liquid foundation, lipstick, and deodorant/antiperspirant. Including the use of retention factors to represent the fraction on the skin available for uptake depends on the respective cosmetic product, the maximum aggregate dermal exposure level was estimated to be 4.6 mg/kg bw/day (Bury et al. 2021). Caffeine-specific partition coefficients were obtained from literature (OECD 2020). Caffeine is almost completely metabolized with 3% or less being excreted unchanged in urine (Begas et al. 2007; Bonati et al. 1982; Kot and Daniel 2008), so hepatic metabolism is the only clearance mechanism described in this test case. A published model described caffeine metabolism as a first-order process (OECD 2020), and for the purpose of our test case, a saturable metabolism was also included to simulate the IEC relationships for caffeine. For saturable metabolism, Km was set to a placeholder value of 100 μM, and the Vmax was calculated based on this Km value and a Vmax/Km ratio that corresponded to an in vitro hepatic clearance value of 0.68 μL/min/million hepatocytes (OECD 2020). For a 70 kg adult, the estimated Vmax was 735 μmol/h.3
Test case 6: Analysis of measured AUC data for 2,4-D
The purpose of this test case is to demonstrate the use of PBPK modeling as a biologically relevant alternative to statistical methods (Bartels et al. 2020; McFadden et al. 2012; Saghir et al. 2012) for analyzing the proportionality of the IEC data. In this test case, the rat PBPK model was used to examine whether a linear or a saturable clearance assumption can better explain the published plasma AUC data for 2,4-D administered by diet to male rats for 28 and 71 days and female rats for 29 and 95 days (Saghir et al. 2013). The approximate intake concentrations were 0, 6, 25, 50, 75 or 100 mg/kg bw/day; 100 mg/kg bw/day was reduced to 75 mg/kg bw/day on test day 20 due to excessive toxicity observed in this dose group. Literature data suggested that 2,4-D was virtually unmetabolized (Van Ravenzwaay et al. 2003) and it was primarily eliminated via saturable urinary excretion (Saghir et al. 2013). Thus, in our analysis, urinary excretion of 2,4-D was the only clearance pathway tested and no metabolism was included in the model. Saturable urinary excretion parameters, described as Michaelis-Menten kinetics, were fitted to the AUC data for each sex separately. Code for the generic rat PBPK model can be found in the Supplementary Materials (Appendix S4).
Fitting of urinary excretion parameters (maximum rate of urinary excretion [VmaxU] and dose associated with half-maximal excretion [KmU]) was performed using individual animal data (4 rats at each administered dose). For the 29-day female rat study, data from the main study and a dose refinement study were included; both studies targeted many of the same approximate doses, but achieved slightly different actual doses (e.g., 6 versus 7 mg/kg bw/day). Thus, the average of the external concentrations from the two studies was assigned as the targeted dose level (e.g., 6.5 mg/kg bw/day for the 6 and 7 mg/kg bw/day in the main and refinement studies); the animals were ad libitum fed so it was not possible to precisely determine the actual doses for each treated animal (Saghir et al. 2013). Daily dietary exposure was simulated in the model by dividing the daily dose into 24 equal amounts that are administered every half hour between 6 pm and 5:30 am, to approximate the nocturnal feeding pattern.
The urinary excretion parameters were optimized to fit the observed plasma AUCs by reducing the residual sum of squares between the log-transformed predicted and the log-transformed observed values. Both VmaxU and KmU values were first fit to all the available female data (29-day and 95-day studies), and then the obtained KmU value was set the same for male rats. All available male data were then used to fit VmaxU for male rats (28-day and 71-day studies). The same KmU value was used for both female and male rats because the enzyme affinity was likely to be conserved across sexes; KmU was fit to female data more data points were available. We also fit the KmU based on the male data to test the sensitivity of the optimized results to fitting order. In addition, the AUC data were separately fit using a first-order urinary excretion alone (that is VmaxU was set to zero), and the process of model fitting for the first-order clearance rate (CLU) was identical to the optimization process assuming saturable excretion.
To compare the model fit generated using Michaelis-Menten kinetics with a first-order assumption, the residual sum of squares (RSS), mean absolute error (MAE), and the corrected Akaike information criterion (AIC) were calculated to provide a quantitative basis for comparing the relative “goodness of fit”. The AIC is a penalized measure of goodness of fit, which tested if the added complexity of the saturable excretion (fitting two parameters, VmaxU and KmU) is justified by a substantial improvement in the fit over the model employing only first-order clearance (fitting one parameter, CLU). The corrected AIC (AICc) was used because of the relatively small sample size available in observed data (Cavanaugh and Neath 2019). A small RSS or MAE value indicated a tighter fit of the model predictions to the observed data; conversely, a large ΔAICc value indicated a substantial improvement in the modeled fit due to the incorporation of saturable excretion.
Results
Test case 1: Impact of partition coefficients and absorption/metabolic constants
Varying parameter values from those initially chosen for chemical A provided perspectives for multiple theoretical chemicals. Similar trends were found for the impact of various PCs on the IEC relationships; decreasing PCs had minor impact on the shape of the curve and increasing PCs had more impact and flattens the shape of the curve (Figure 2A, showing only results for rapidly perfused tissue:blood PC). Varying all four PCs together resulted in a more obvious shift of the IEC curve (Figure 2B). Decreasing PCs shifted the curve up, because smaller tissue:blood PCs resulted in more chemical in plasma. Increasing PCs shifted the curve down and flattened the curve, because more chemical distributed to tissues and lessened chemical in plasma. For saturable metabolism of the parent, increasing Vmax moved the sigmoid-like curve to the right (i.e., metabolism saturated at higher external doses) and increasing Km moved the sigmoid-like curve to the left and flattened the curve (Figures 3A and 3B); decreasing Vmax or Km gave similar changes but in the opposite direction. When increasing Vmax and Km by the same ratio, the shape of the IEC curve did not change much and shifted to the right; decreasing these parameters shifted the curve to the left (Figure 3C). For saturable absorption, increasing fimax or decreasing f50 moved the IEC curve further away from a linear curve (Figure 3D).
Figure 2:
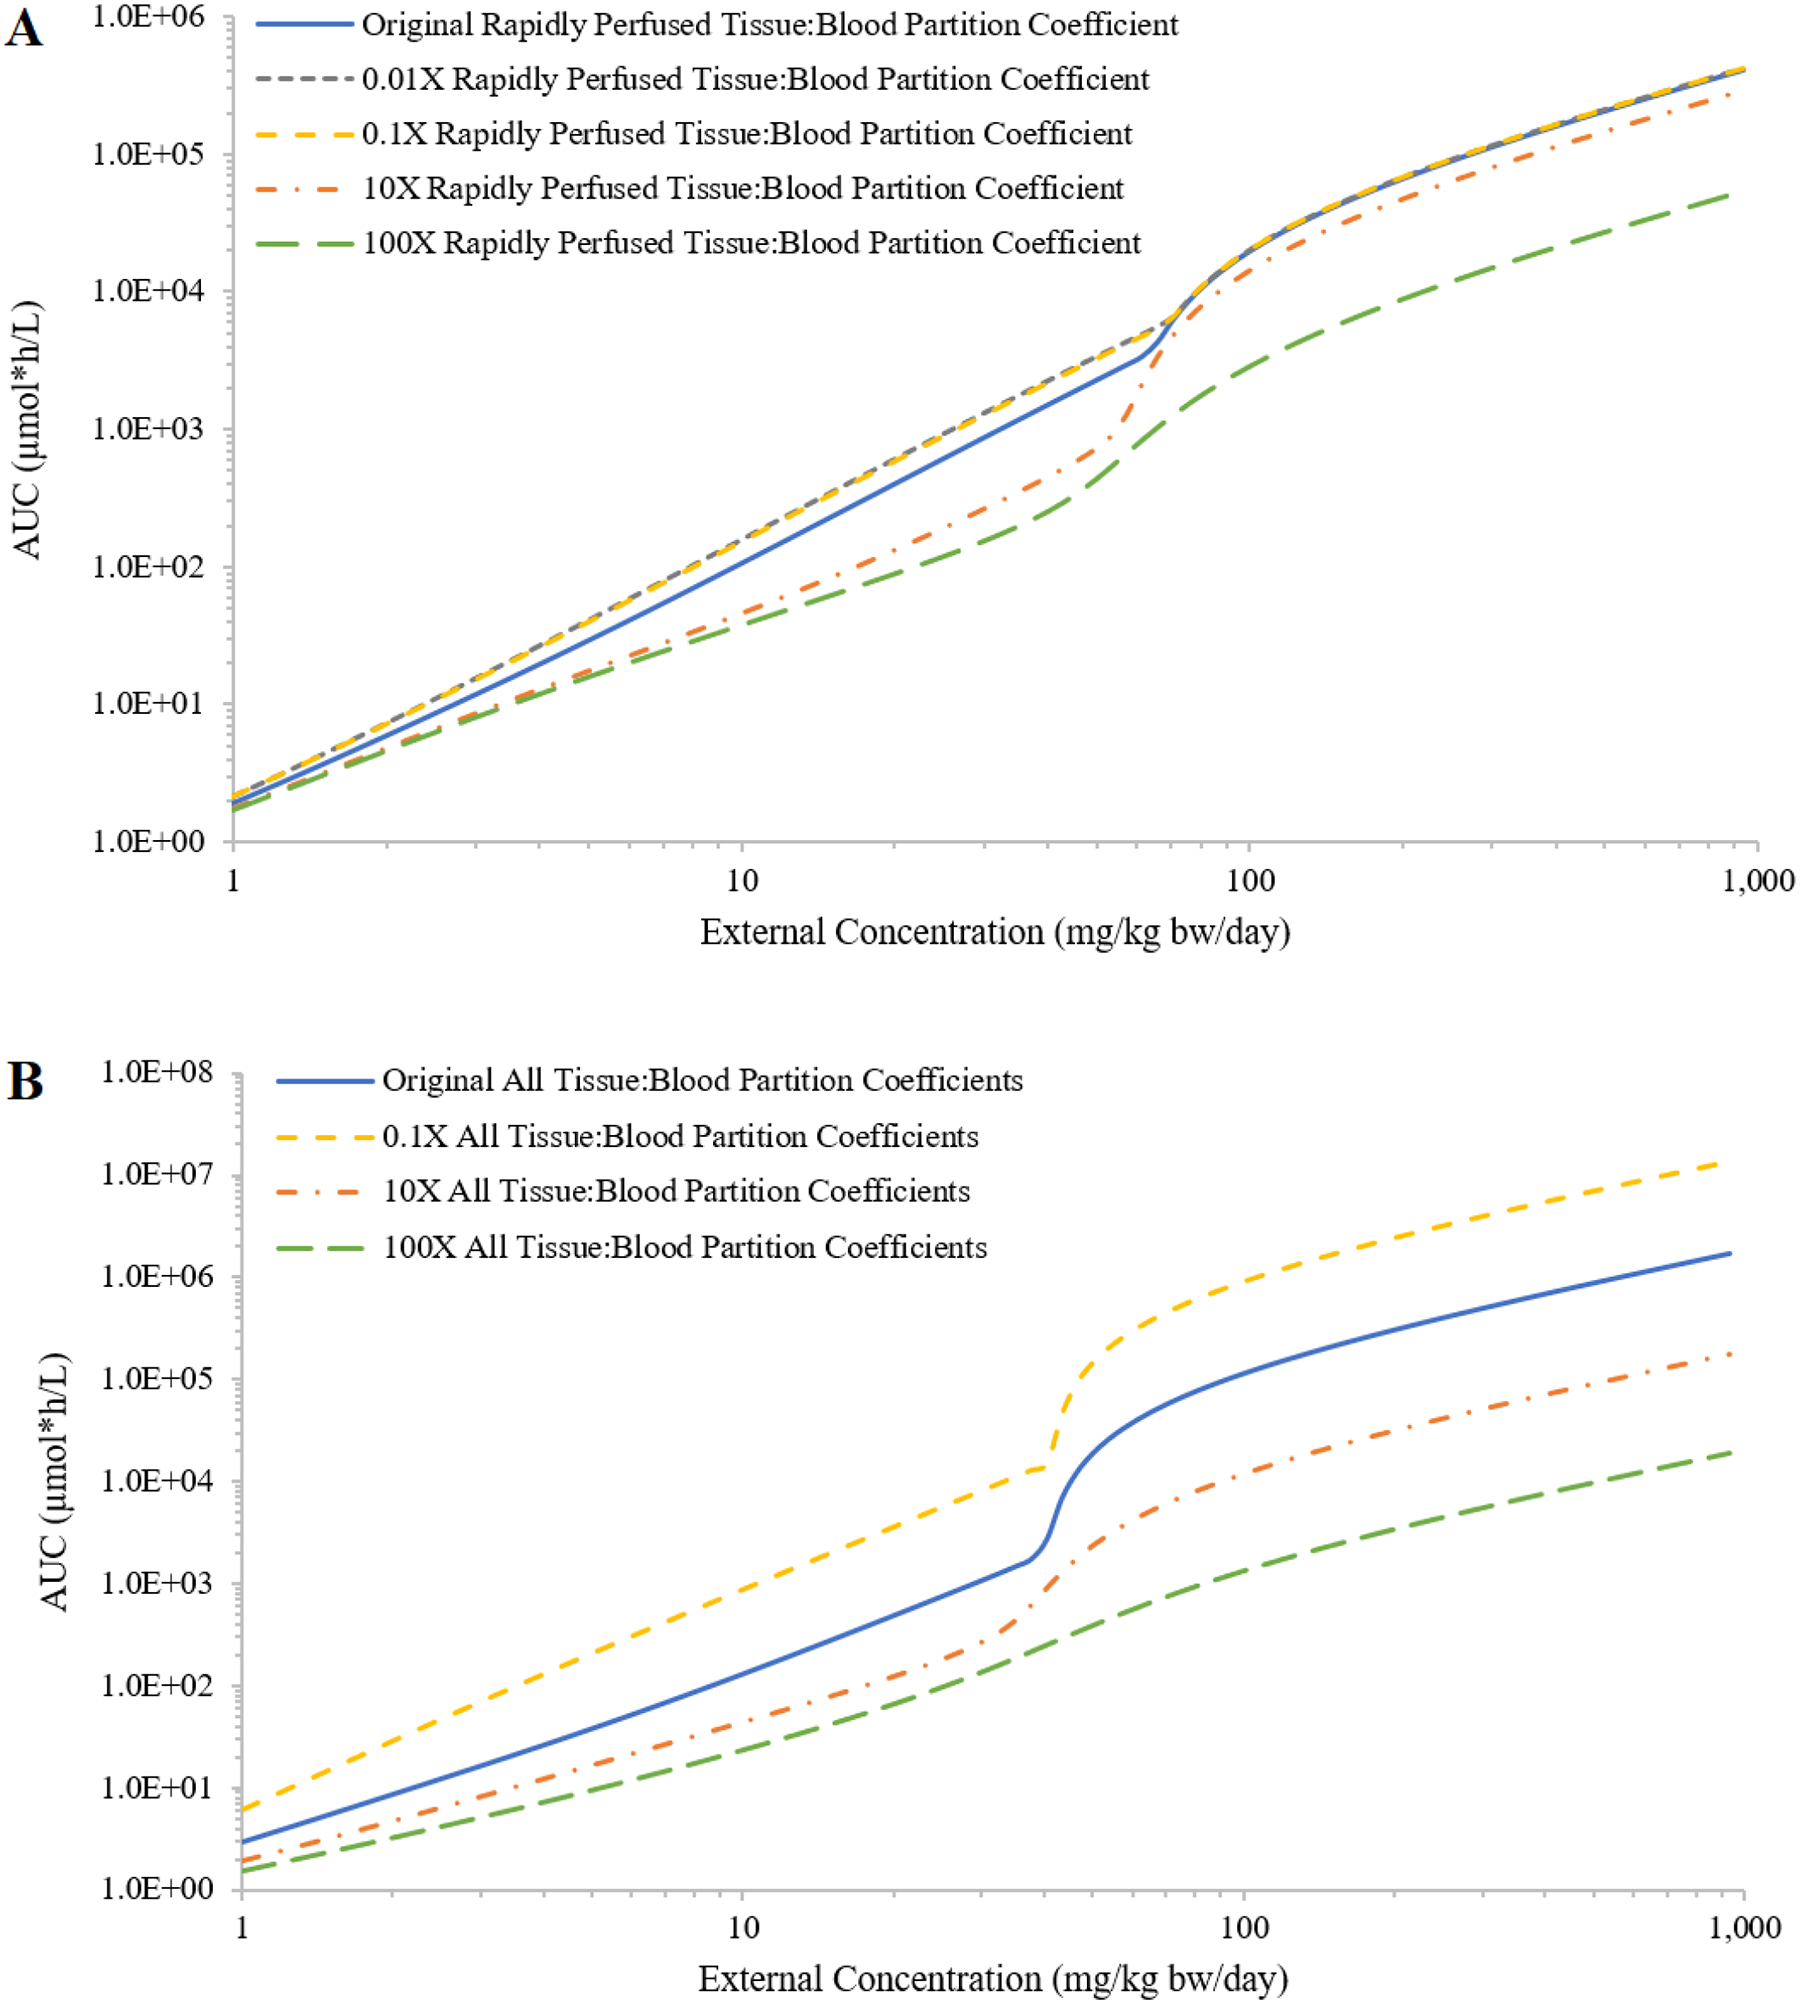
Demonstration of the impact on the relationship between external concentration (mg/kg bw/day) and area under the curve (AUC) of plasma concentrations during the last 24 hours (μmole*h/L; AUC) from decreasing or increasing the values of tissue:blood partition coefficients (PCs) by 10-fold and 100-fold. In panel A, simulations are shown when only the rapidly perfused tissue:blood PC is changed and panel B simulations are the results of all compartment PC values changed an equal amount.
Figure 3:
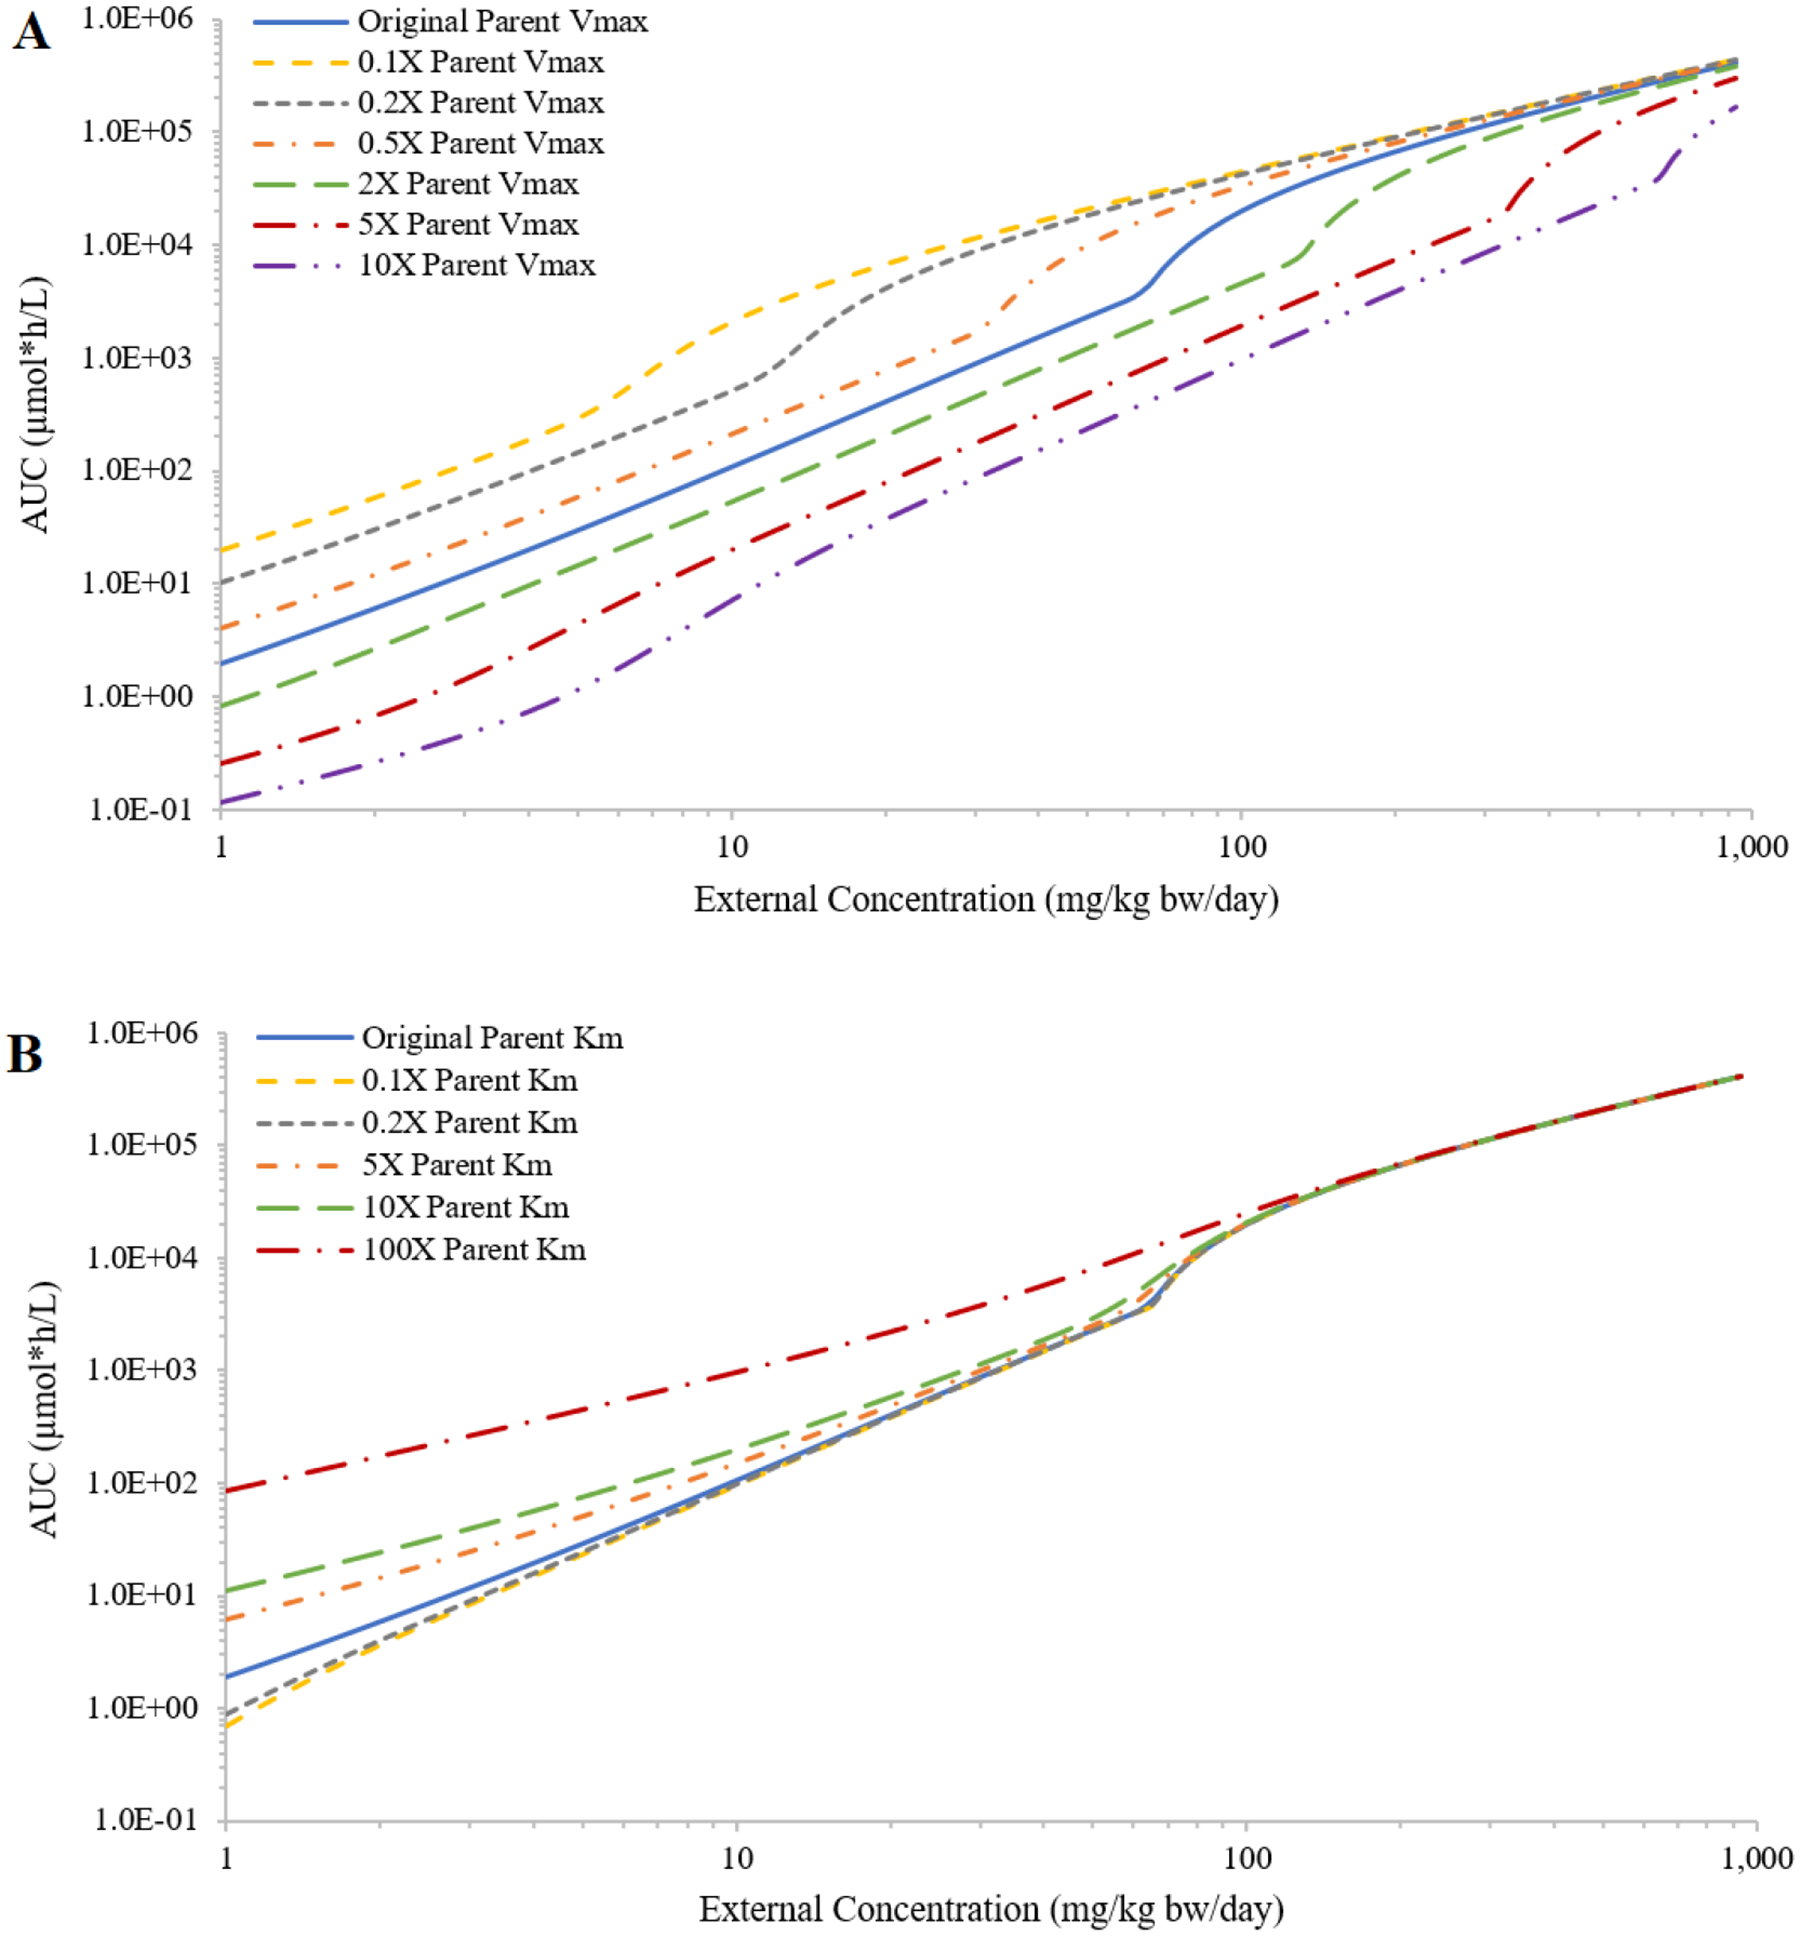
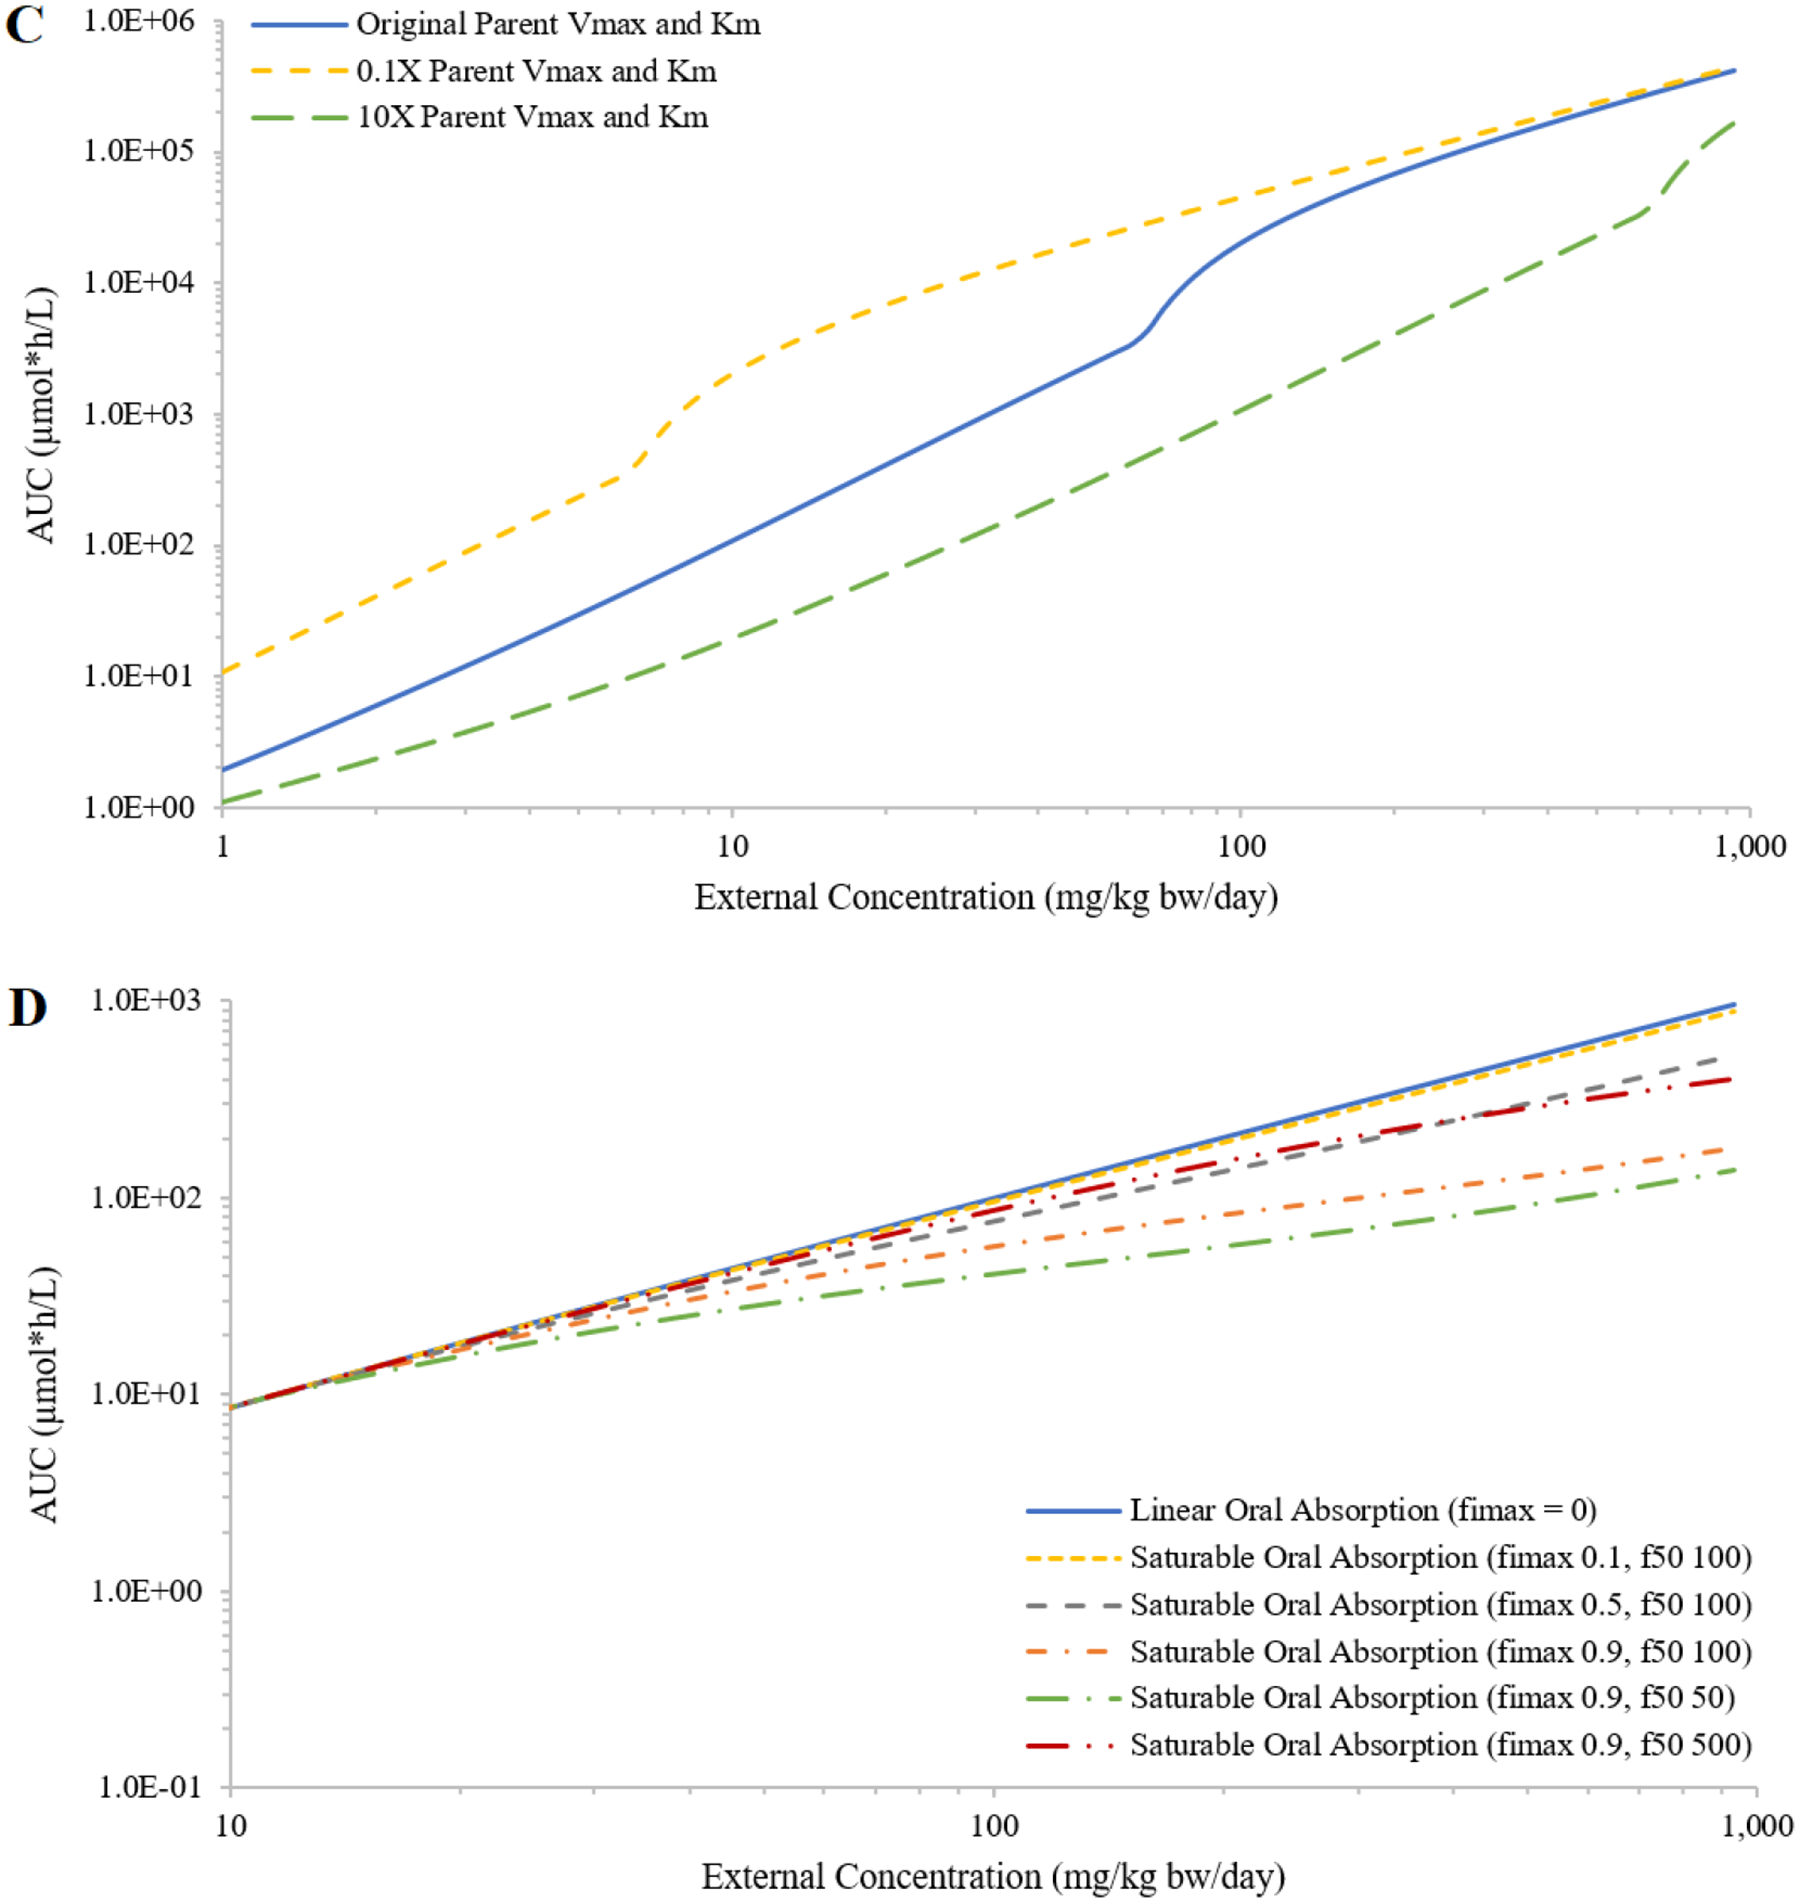
Demonstration of the impact on the relationship between external concentration (mg/kg bw/day) and area under the curve (AUC) of plasma concentrations during the last 24 hours (μmole*h/L; AUC) from decreasing or increasing the values of the maximum rate of hepatic metabolism of the parent (Vmax) by 2, 5, and 10-fold (panel A); decreasing or increasing the Michaelis-Menten constant (Km) by 5, 10, and 100-fold (panel B); decreasing or increasing Vmax and Km together by 10-fold (panel C); or setting the in relative oral absorption fraction (fimax) and dose associated with half-maximal absorption (f50) to (0.9, 100), (0.5, 100), (0.1, 100), (0.9, 500) and (0.9, 50) (panel D). The results are presented for concentrations above 10 mg/kg bw/day to emphasize the divergent results produced by changing fimax and f50.
Test case 2: Impact of saturable metabolism and clearance on the IEC relationship
Although the first-order clearance values were similar between the two hypothetic chemicals (2.4 for chemical A and 2.9 for chemical B), the large difference between the metabolic constants (A: Vmax = 6.1, Km = 2.5; B: Vmax = 528, Km = 180) resulted in different IEC curves given the same range of external concentrations (Figure 4). In the case of saturable hepatic metabolism of the parent, AUCs of both chemicals increased faster than proportional with increasing external concentration. However, only the IEC of chemical A demonstrated a sigmoid-like shape. The IEC curve of chemical B with saturable metabolism was almost indistinguishable from the first-order curve at external concentrations below 10 mg/kg bw/day (Figures 4A and 4B). The simulated AUCs of the metabolites also showed different trends. The AUCs of both metabolites proportionally increased with increasing external doses of the parents, but only the AUCs of chemical A’s metabolite reached a plateau that corresponded to the saturation of the parent metabolism (Figures 4A and 4B).
Figure 4:
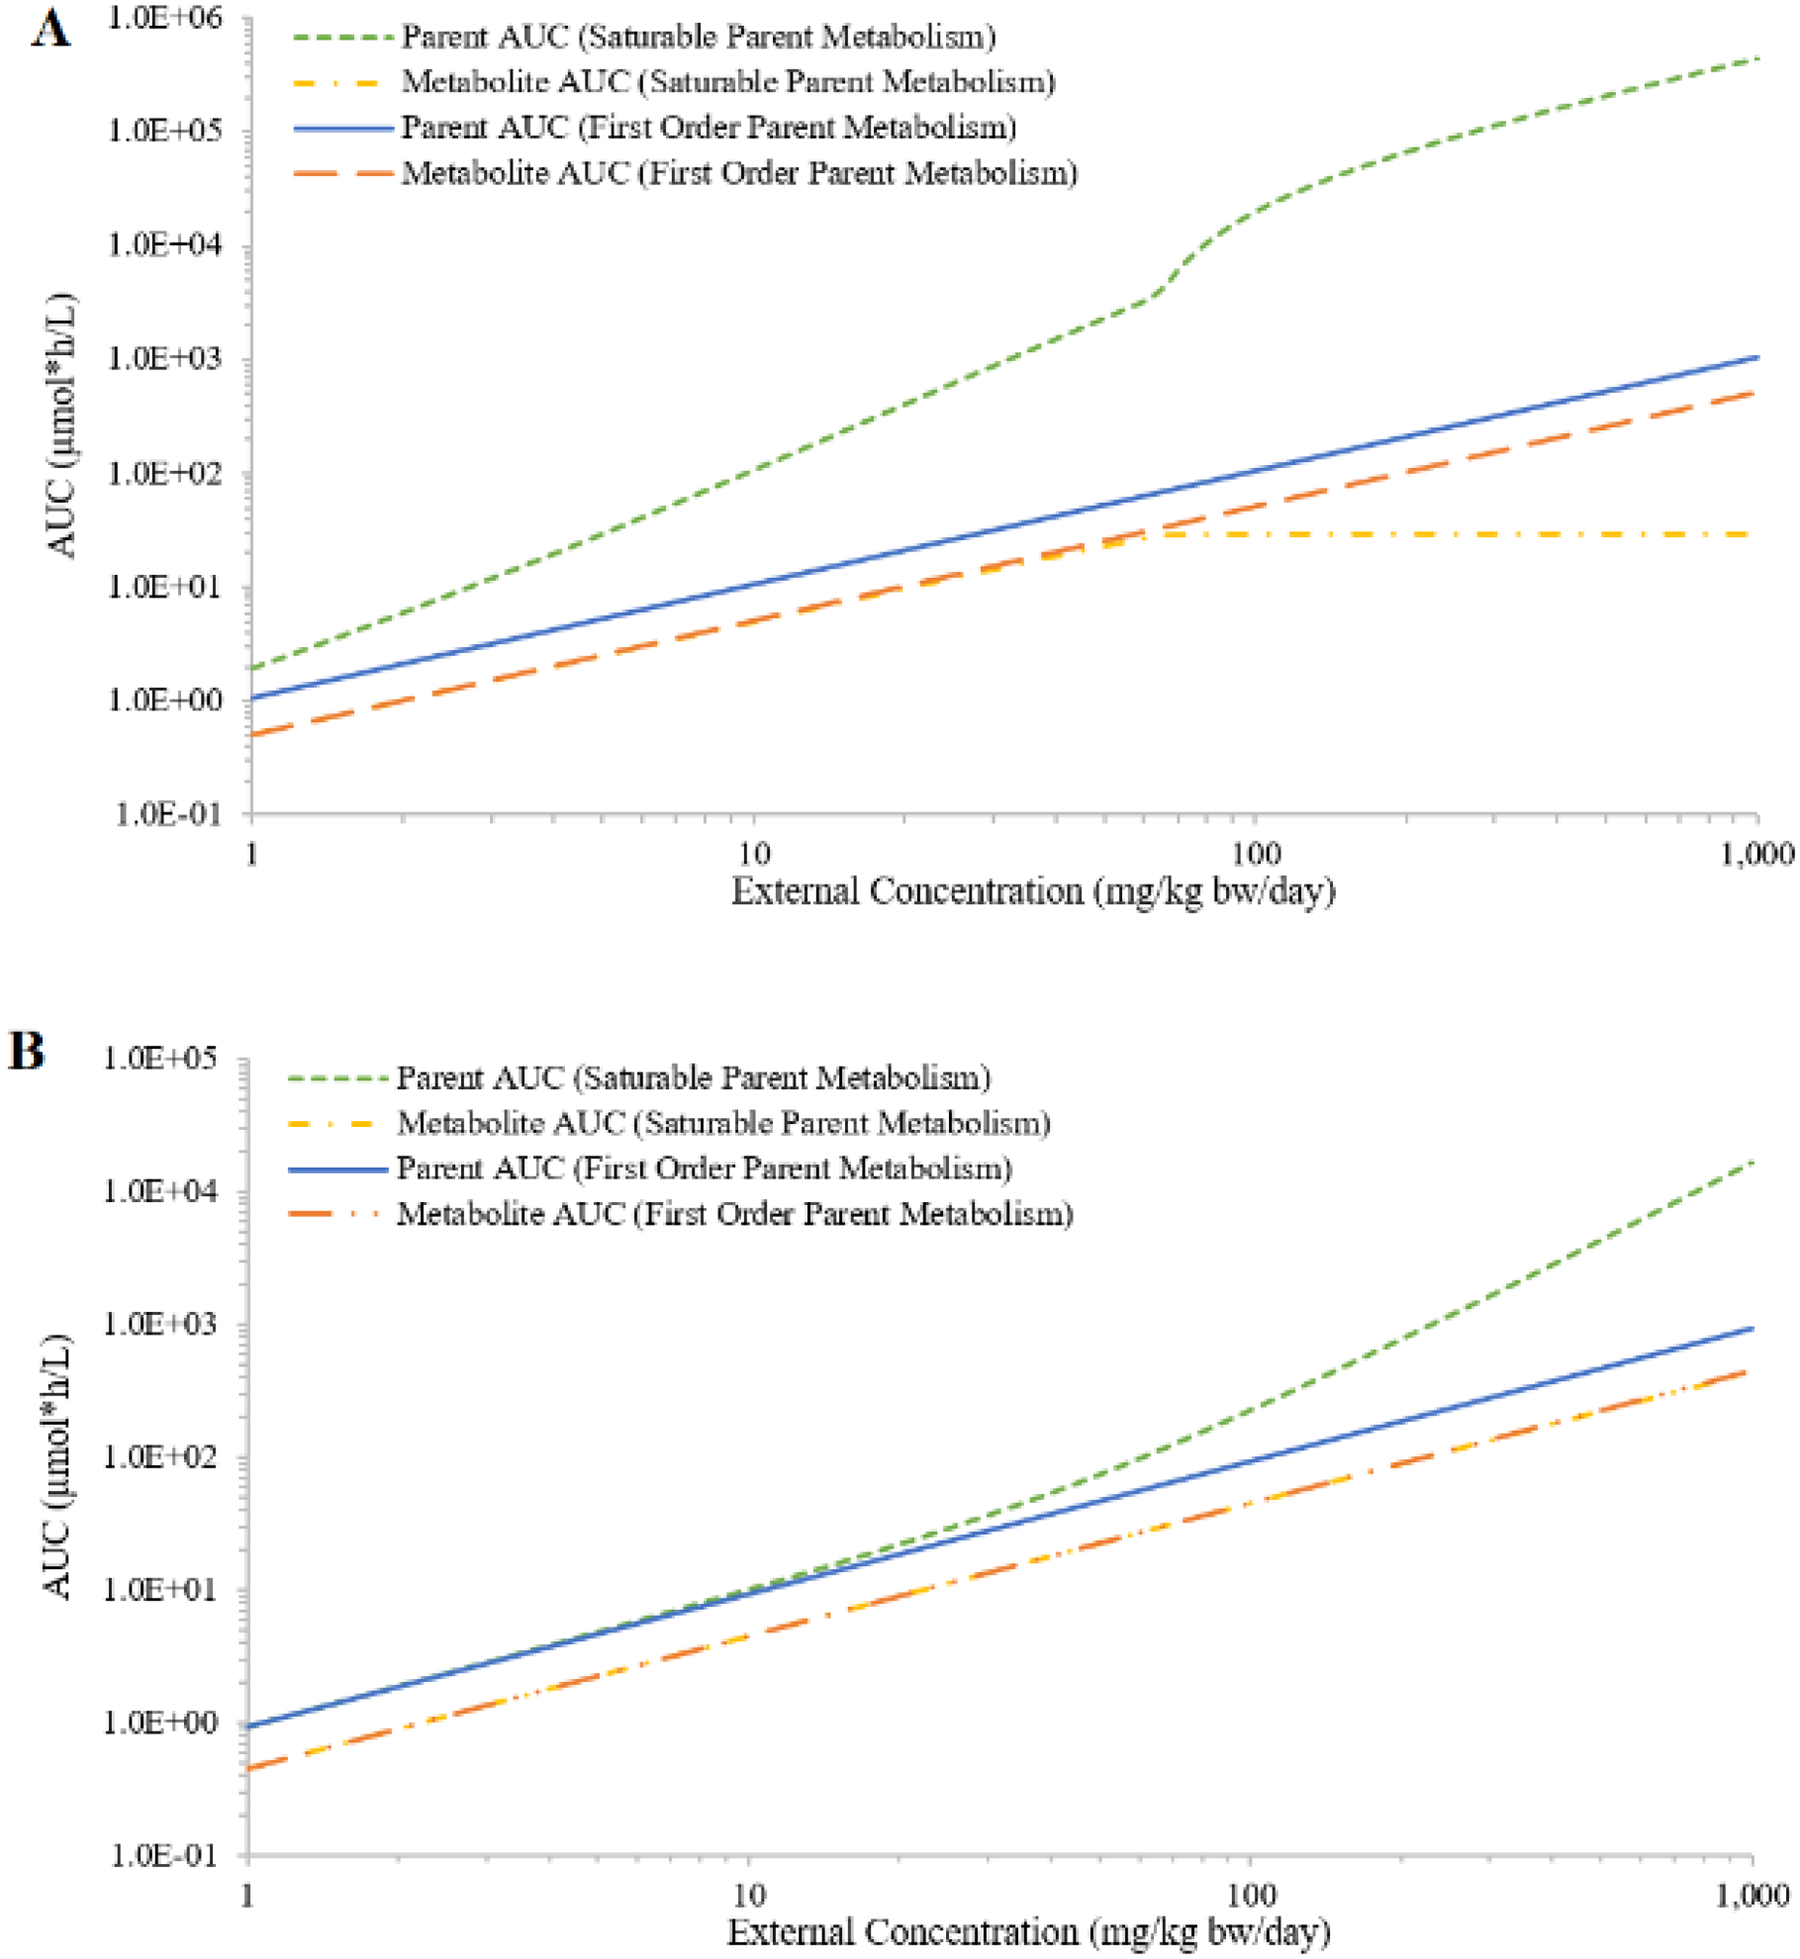
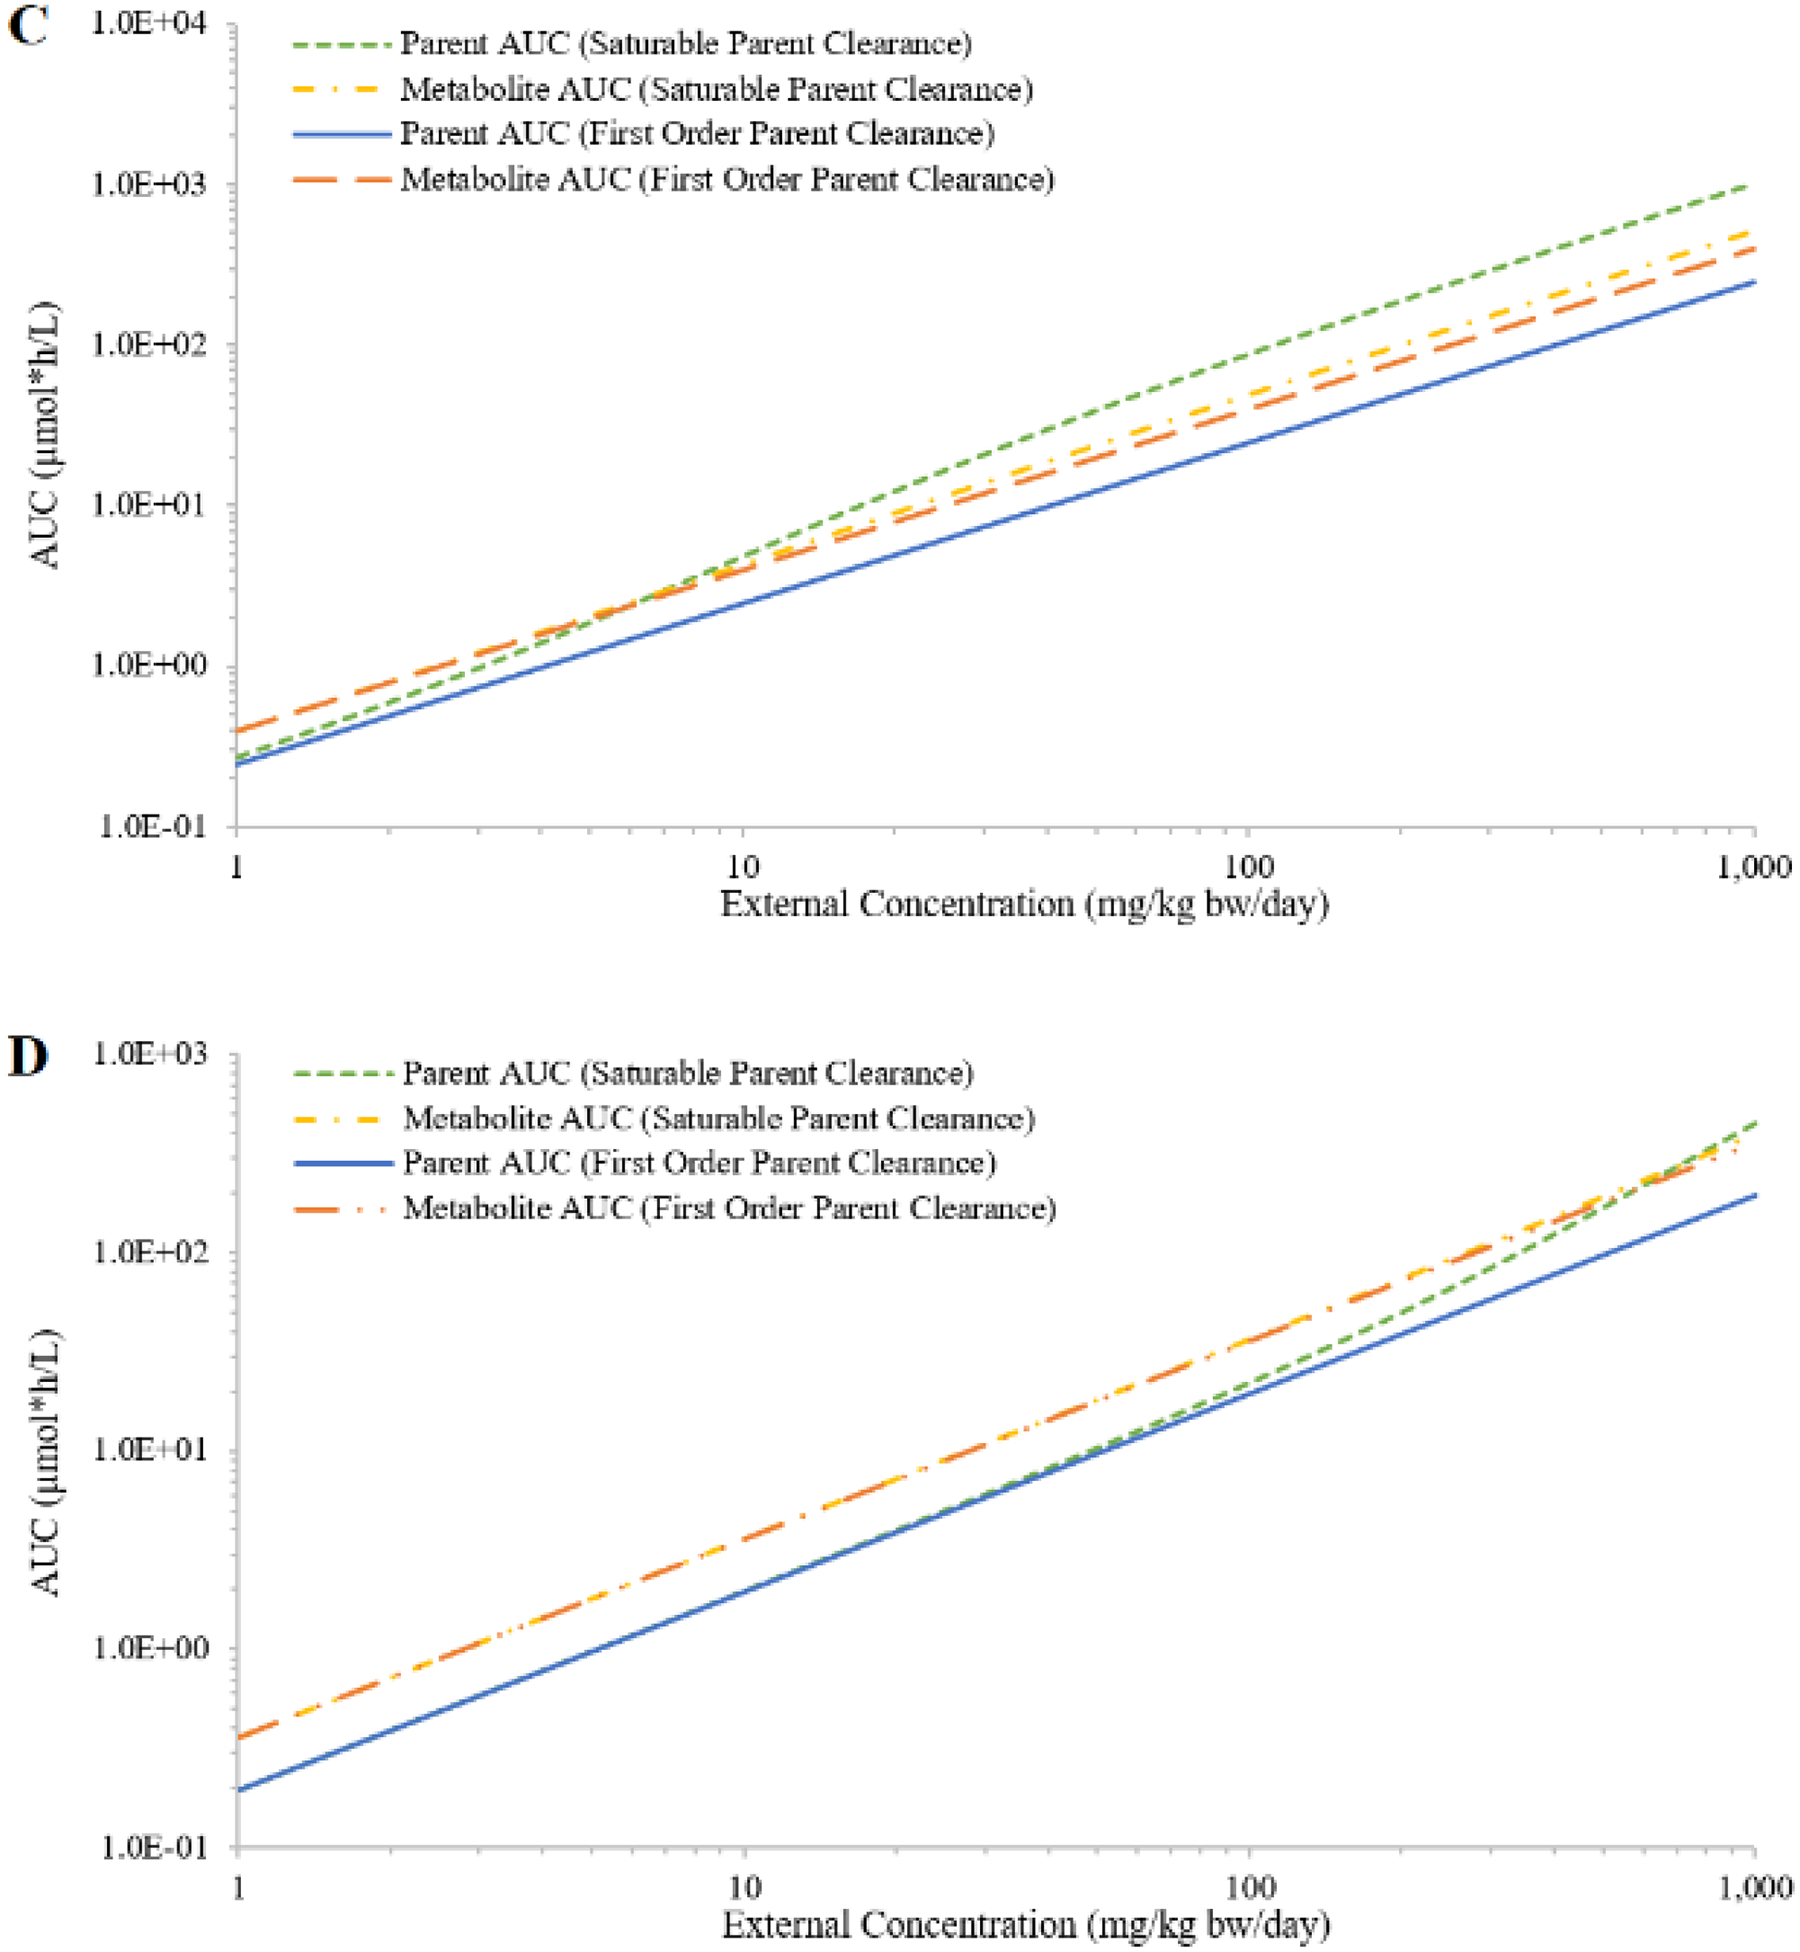
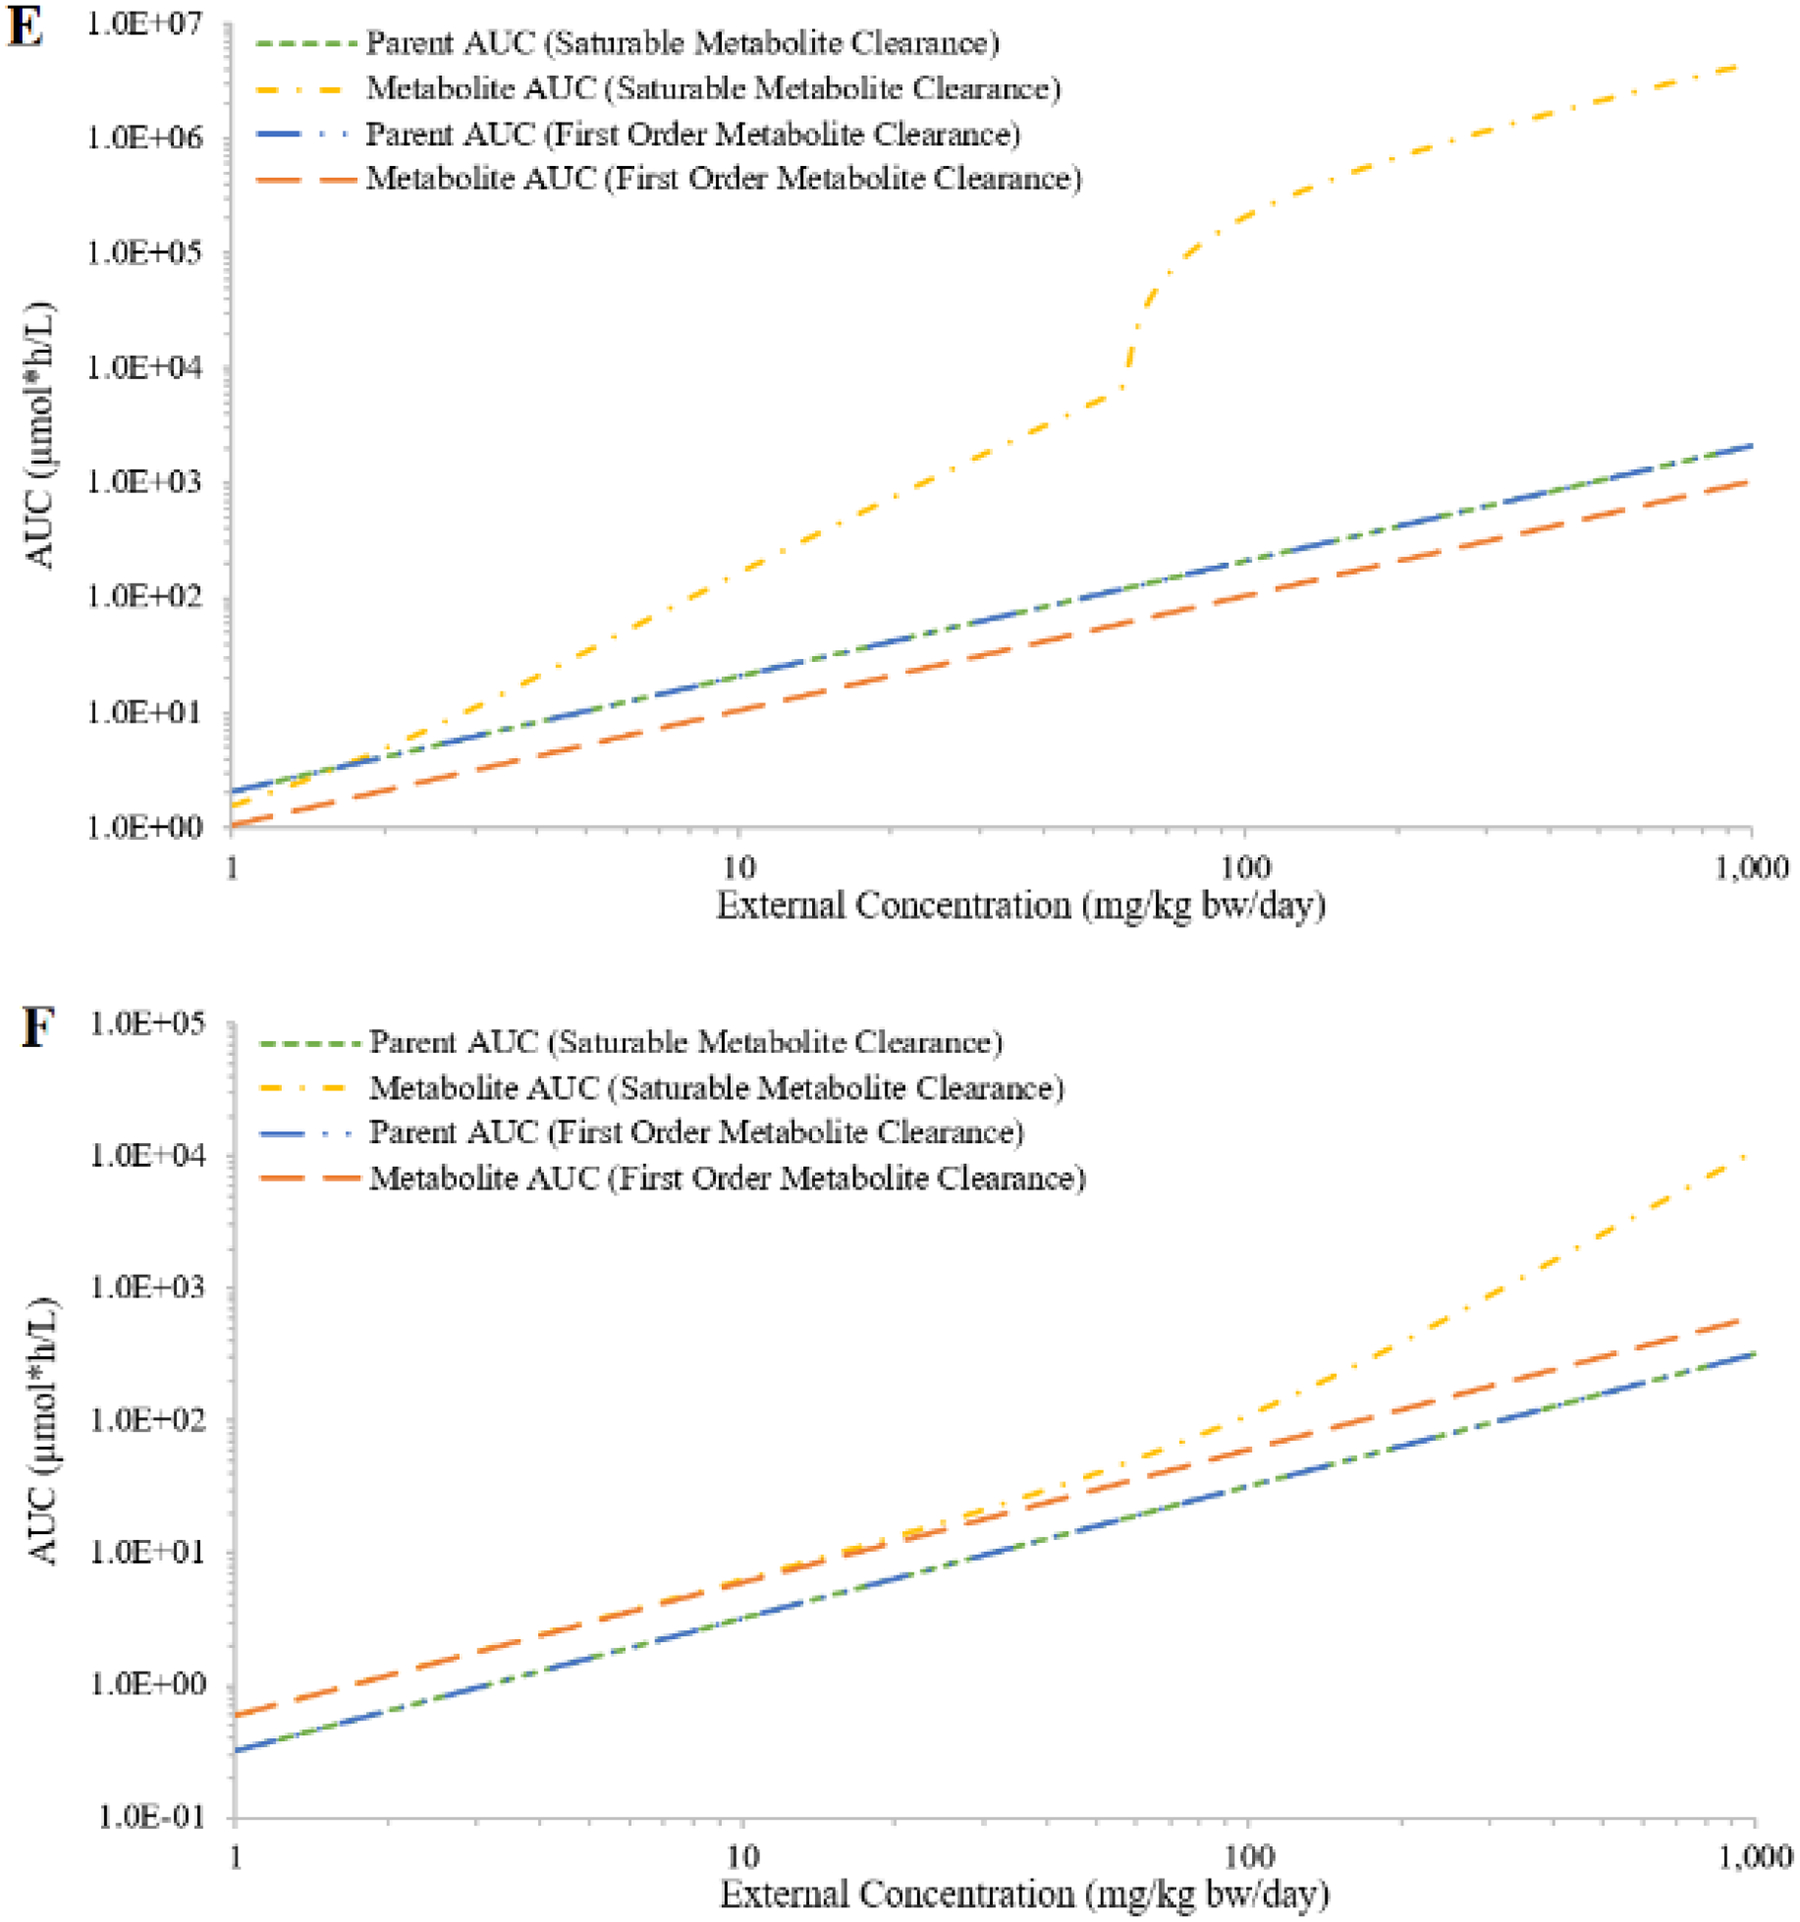
Simulated external concentrations (mg/kg bw/day) versus area under the curve of plasma concentrations during the last 24 hours (AUC; in μmole*h/L) of the parent and the metabolite, assuming saturable or first-order metabolism for hypothetical chemicals A (panel A) and B (panel B); saturable or first-order urinary excretion for hypothetical chemicals A (panel C) and B (panel D); or saturable or first-order urinary excretion of the metabolites for hypothetical chemicals A (panel E) and B (panel F).
In the case of saturable urinary excretion of the parent, the simulated AUCs of both chemicals increased faster than proportional at higher external concentrations; and the simulated AUCs of both metabolites only slightly deviated from proportionality (Figures 4C and 4D). In the case of saturable clearance of the metabolite, the simulated metabolites AUCs (Figures 4E and 4F) demonstrated a similar trend as the parent AUCs in the case of saturable metabolism of the parent (Figures 4A and 4B). The simulated parent AUCs are not affected by the clearance mechanism of the metabolite; they were proportional to external concentrations (Figures 4E and 4F). The reason different profiles were observed for chemicals A and B was due to simulations being limited to a specific range of external concentrations (1 – 1000 mg/kg bw/day). If a much wider range of external concentrations was covered, not considering whether some concentrations were unreasonable or unachievable, the overall profiles were likely to be similar between the two chemicals.
When both parent metabolism and metabolite clearance were described as saturable processes, both the parent and the metabolite AUCs increased faster than proportional with increasing external concentration (Figure 5). When VmaxUM was smaller than Vmax, the disproportional increase of metabolite AUCs was much larger than the disproportional increase of parent AUCs (Figure 5A). When VmaxUM was larger than Vmax, the metabolite AUCs reached a plateau after parent metabolism reached saturation (Figure 5B).
Figure 5:
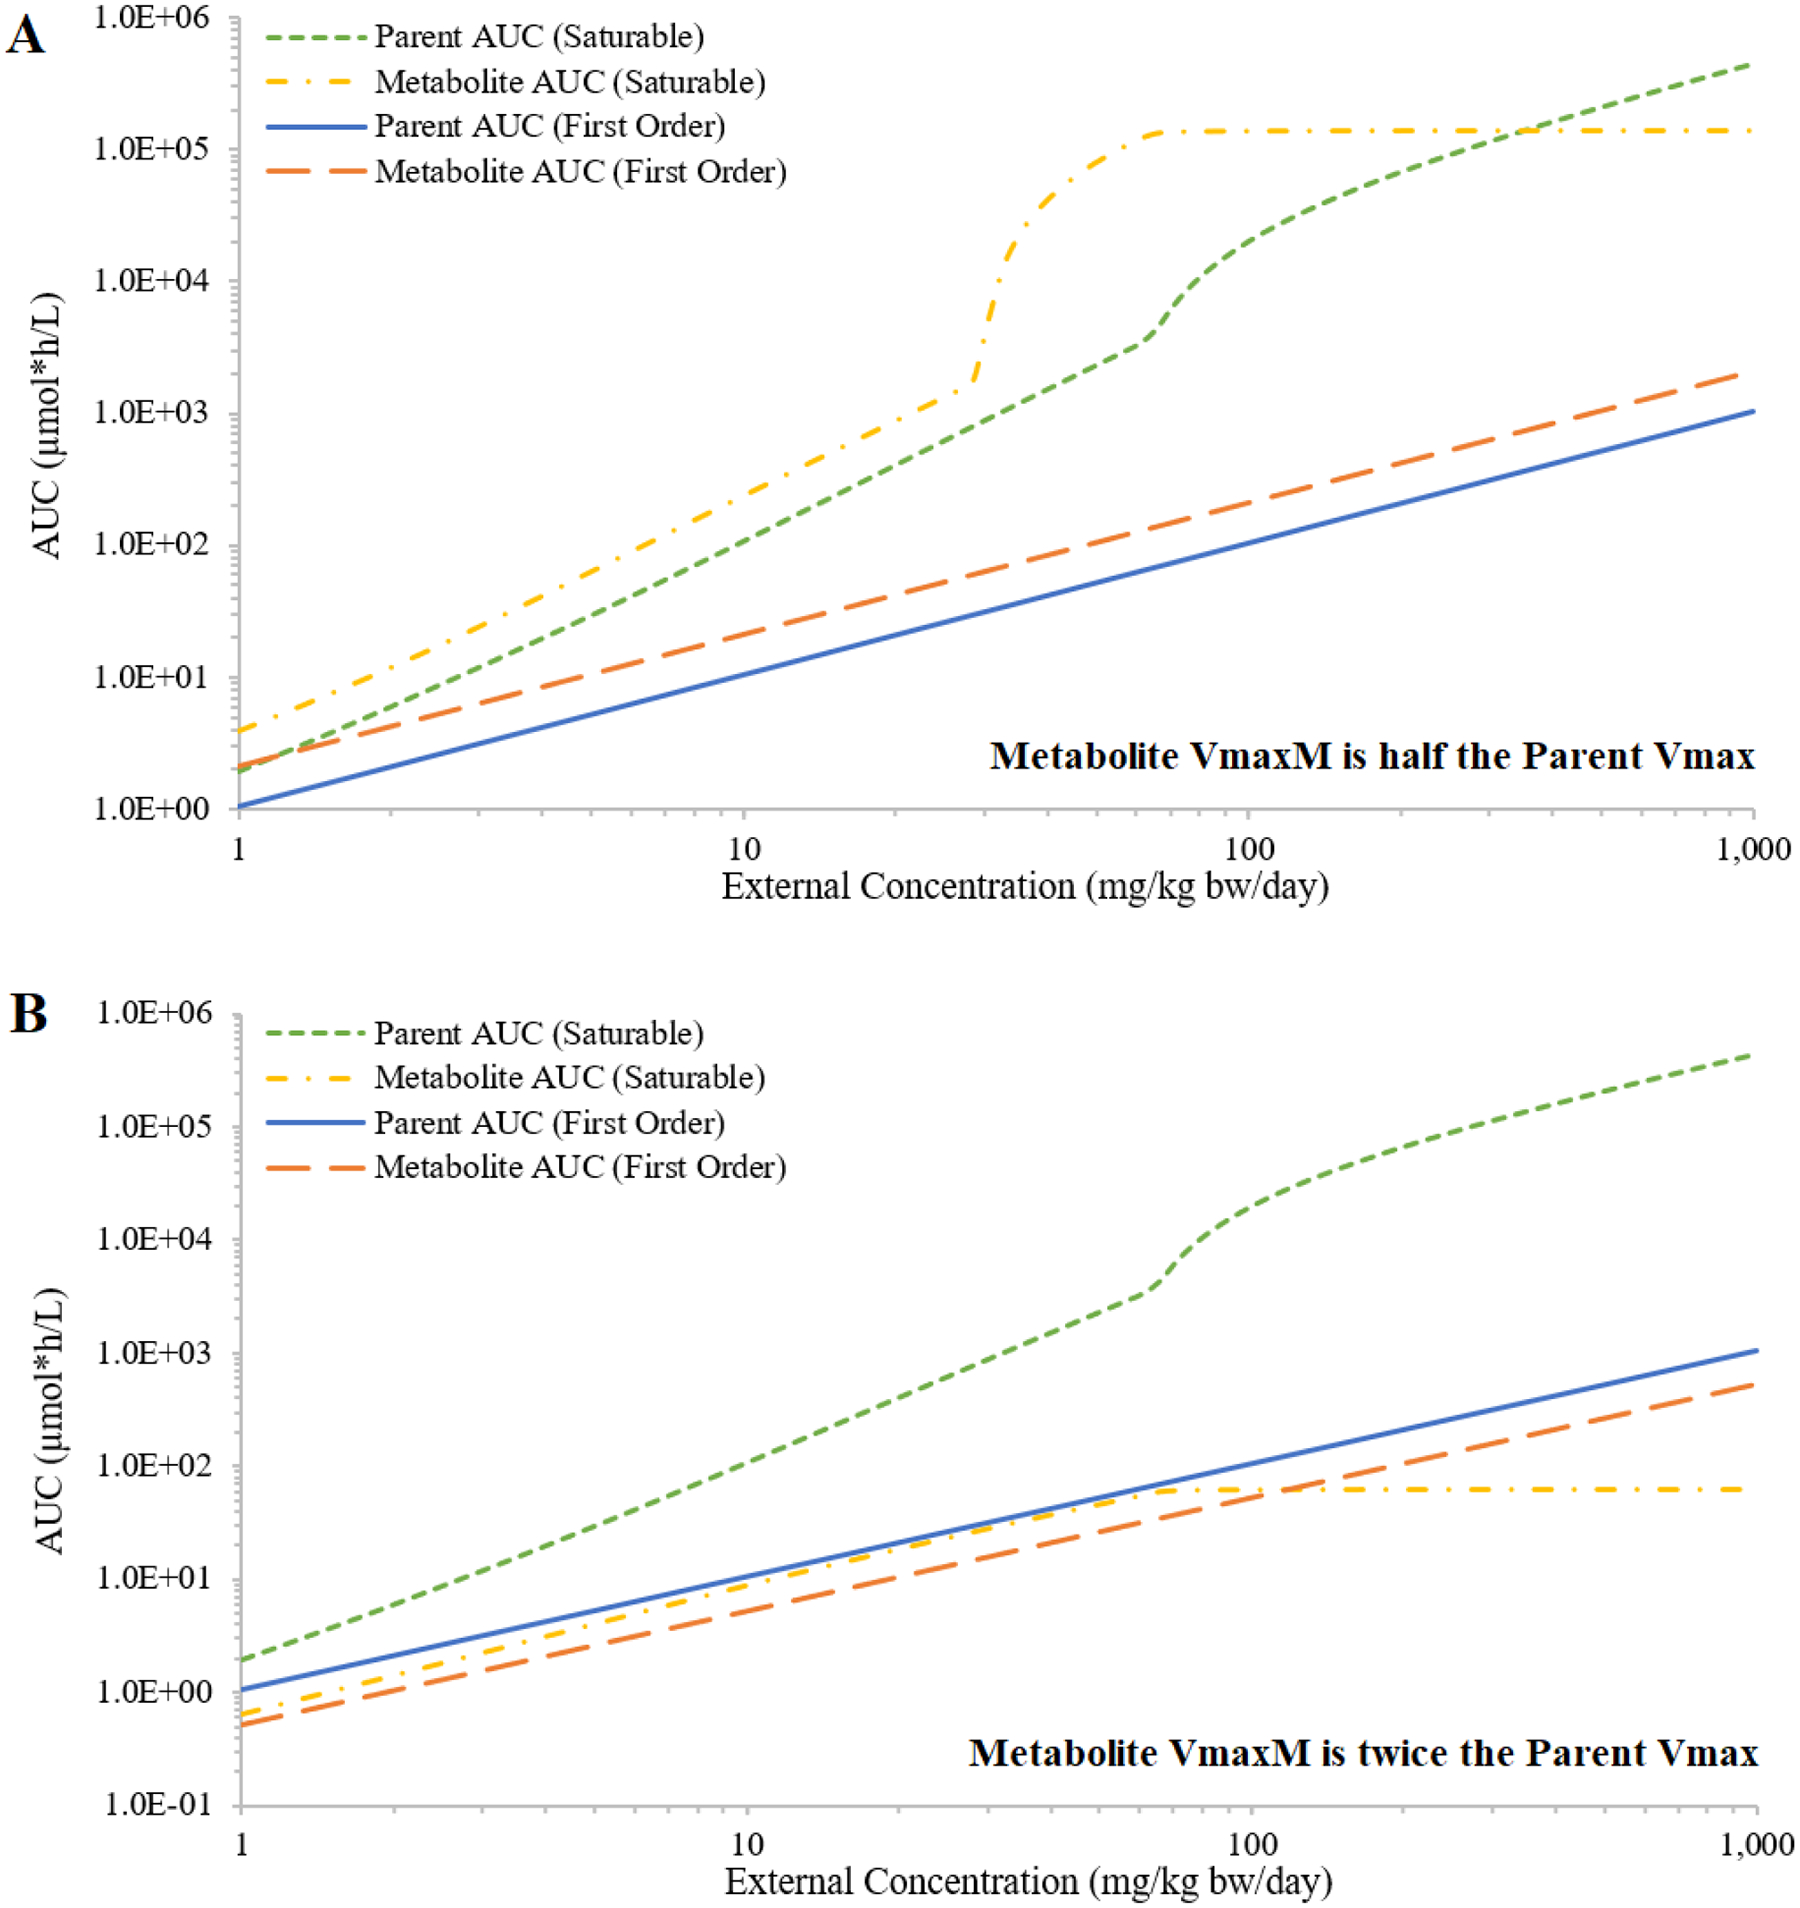
Simulated external concentrations (mg/kg bw/day) versus area under the curve of plasma concentrations during the last 24 hours (AUC; in μmole*h/L) of the parent and the metabolite, where hepatic metabolism of parent (hypothetical Chemical A) and urinary excretion of metabolite of Chemical A are either saturable or first-order. Two conditions are evaluated: the maximum rate of metabolite clearance is half of the maximum rate of parent metabolism (panel A); or the maximum rate of metabolite clearance is double the maximum rate of parent metabolism (panel B).
Test case 3: Saturable oral absorption
The predicted oral absorption fractions based on the optimized parameter values were in good agreement with those generated by Gastroplus (Figure S1; optimized values are listed in Table S2). Implementing the optimized absorption parameter values in the PBPK model, the simulated plasma AUCs for the hypothetical chemicals C and D and their metabolites increased sublinearly with increasing external concentrations, and the degree of sublinearity increased with increasing external concentration (Figure 6).
Figure 6:
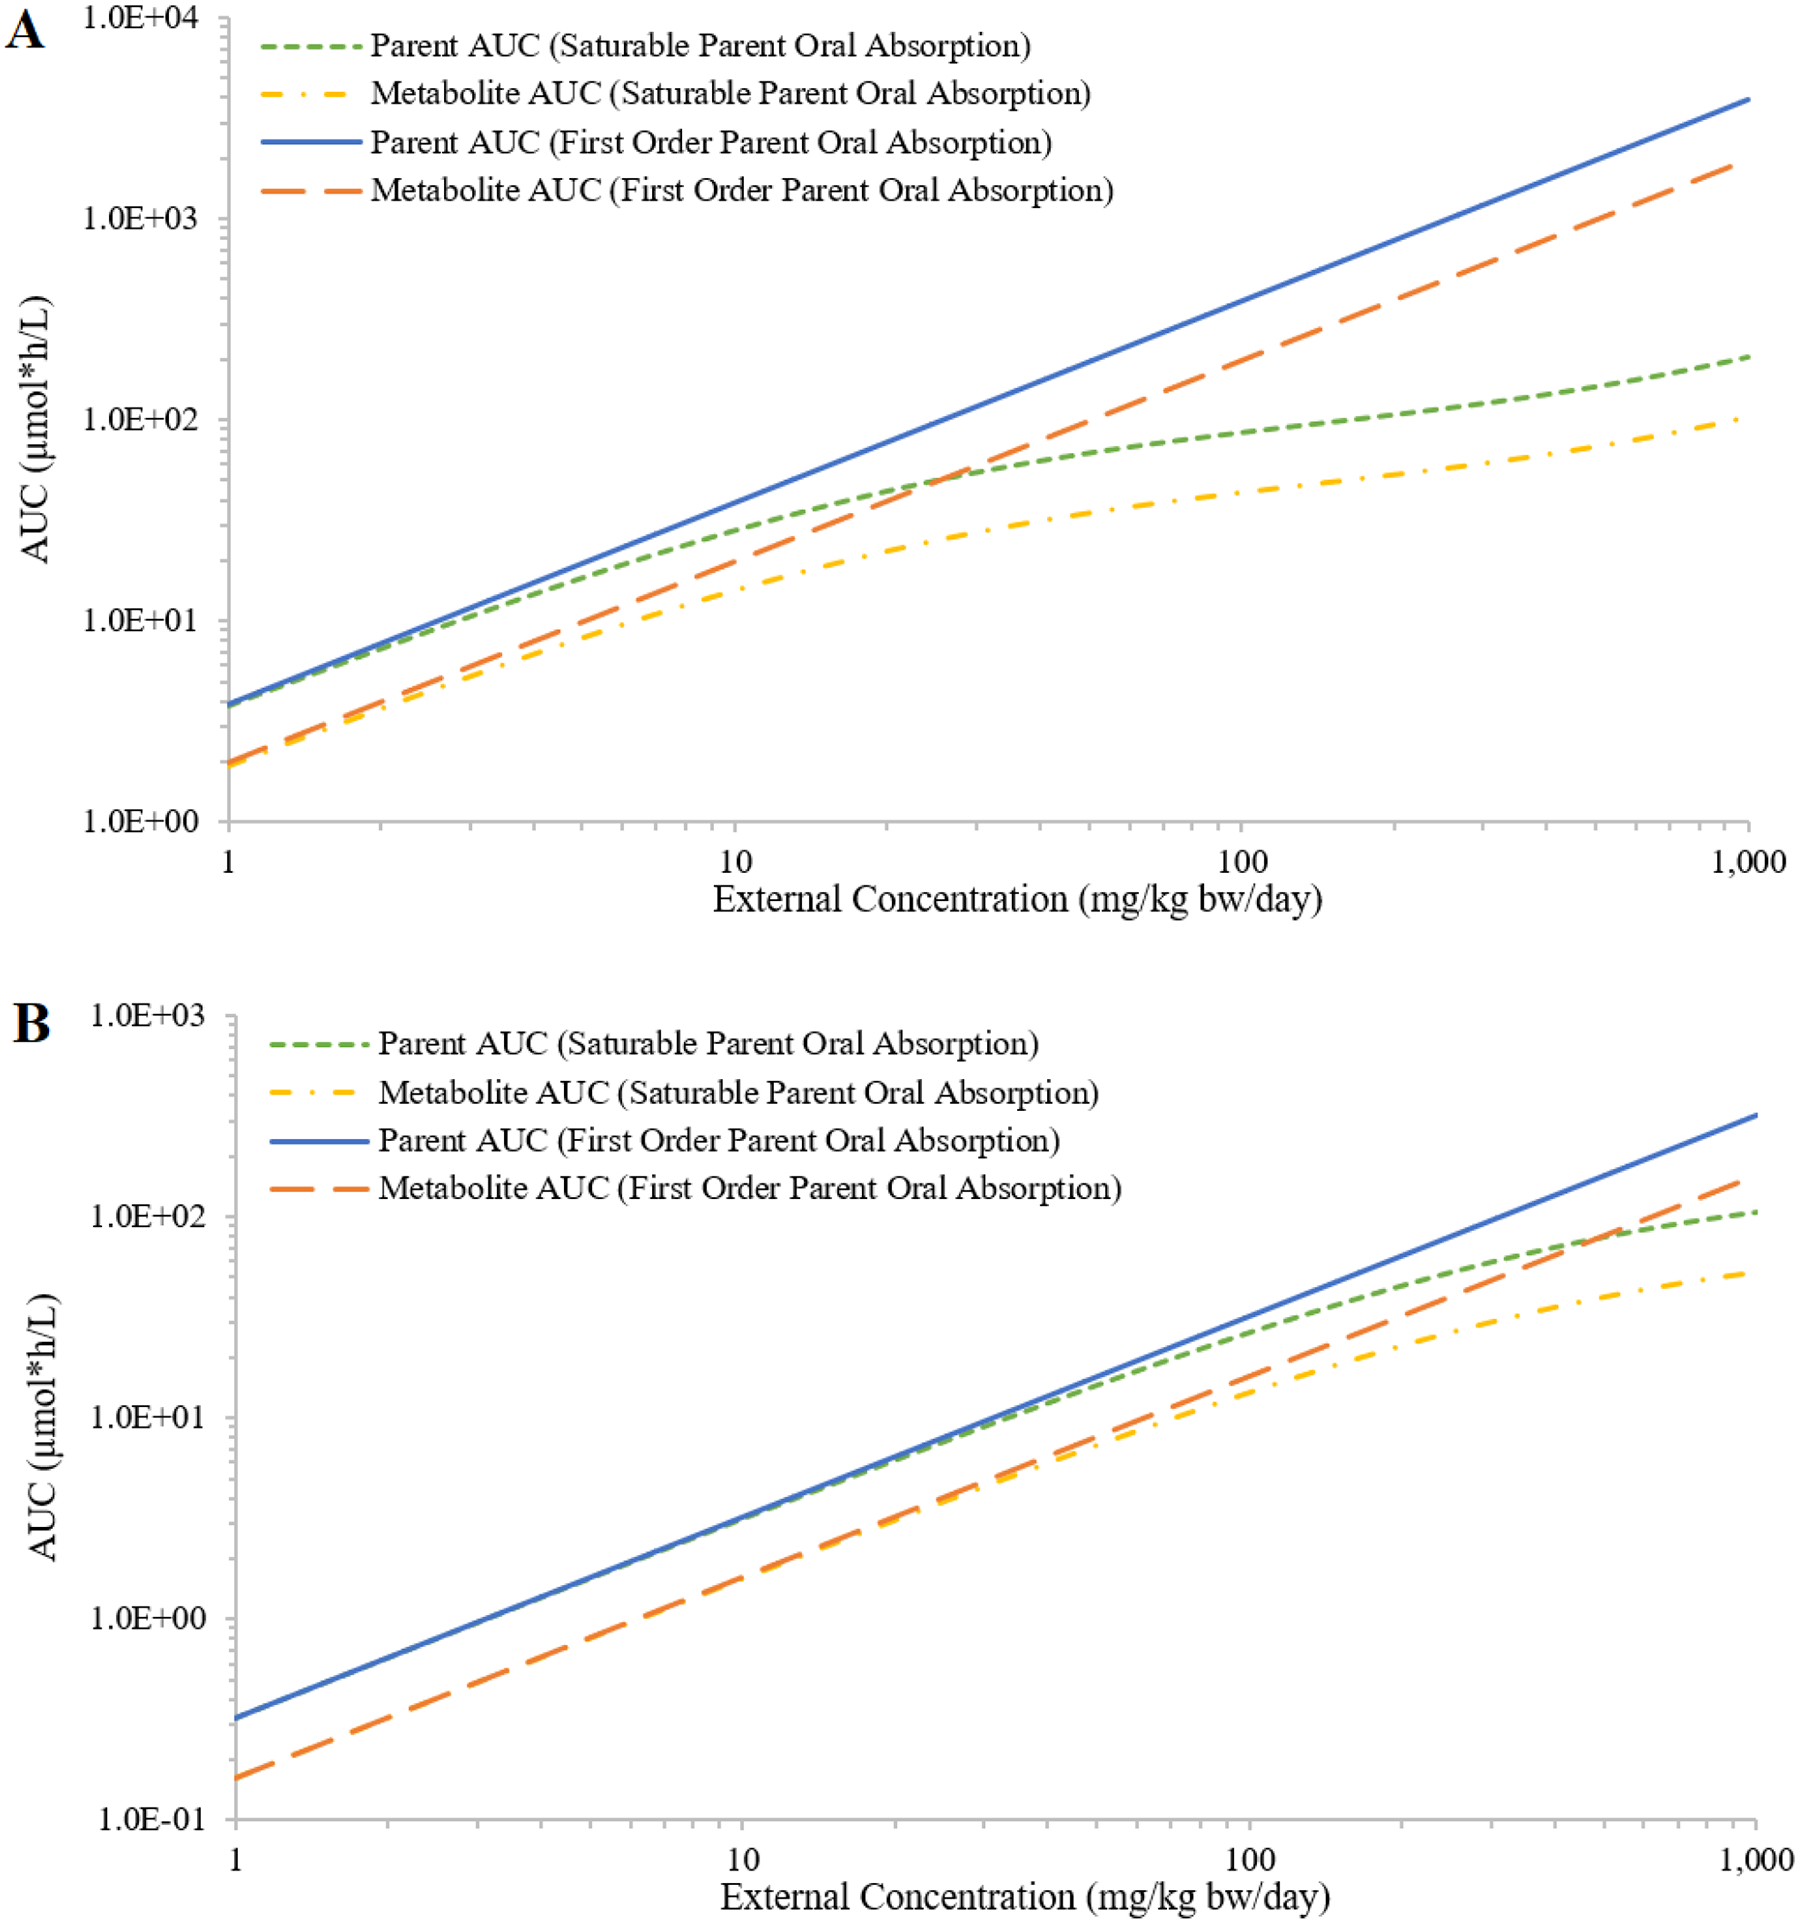
Simulated external concentrations (mg/kg bw/day) versus area under the curve of plasma concentrations during the last 24 hours (AUC; in μmole*h/L) of the parent and the metabolite, assuming saturable or first-order oral absorption of hypothetical chemicals C (panel A) and D (panel B).
Test case 4: Styrene
The IEC curves for styrene were similar between rats and humans (Figure 7A). For rats, the IEC curves suggested saturation of metabolism occurred at a lower external concentration via bolus oral exposure when compared to inhalation exposure (Figure 7B). Oral exposures from a single dose and repeated dose (one dose per day for 20 days) resulted in overlapping IEC curves, which reflected the rapid clearance of styrene (Figure 7C). Multiple doses per day decreased the plasma AUCs and saturation of metabolism occurred at a higher total external daily dose; to achieve the same total daily dose with increasing numbers of doses administered, each individual dose was lower (Figure 7C). Shorter inhalation exposure duration shifted the plasma AUCs down and flattened the IEC curve, because shorter exposure to the same air concentration resulted in lower total daily dose (Figure 7D). Finally, the median of estimated styrene air concentrations of 32 ppm from occupational sampling was close to an exposure concentration at which the rate of metabolism was ~9% Vmax; the mean of 54 ppm was close to an exposure concentration at which the rate of metabolism was ~16% Vmax. At the OSHA 8-hr time weighted average (TWA) Permissible Exposure Limit (PEL) of 100 ppm(OSHA 2017), the rate of metabolism was ~29% Vmax.
Figure 7:
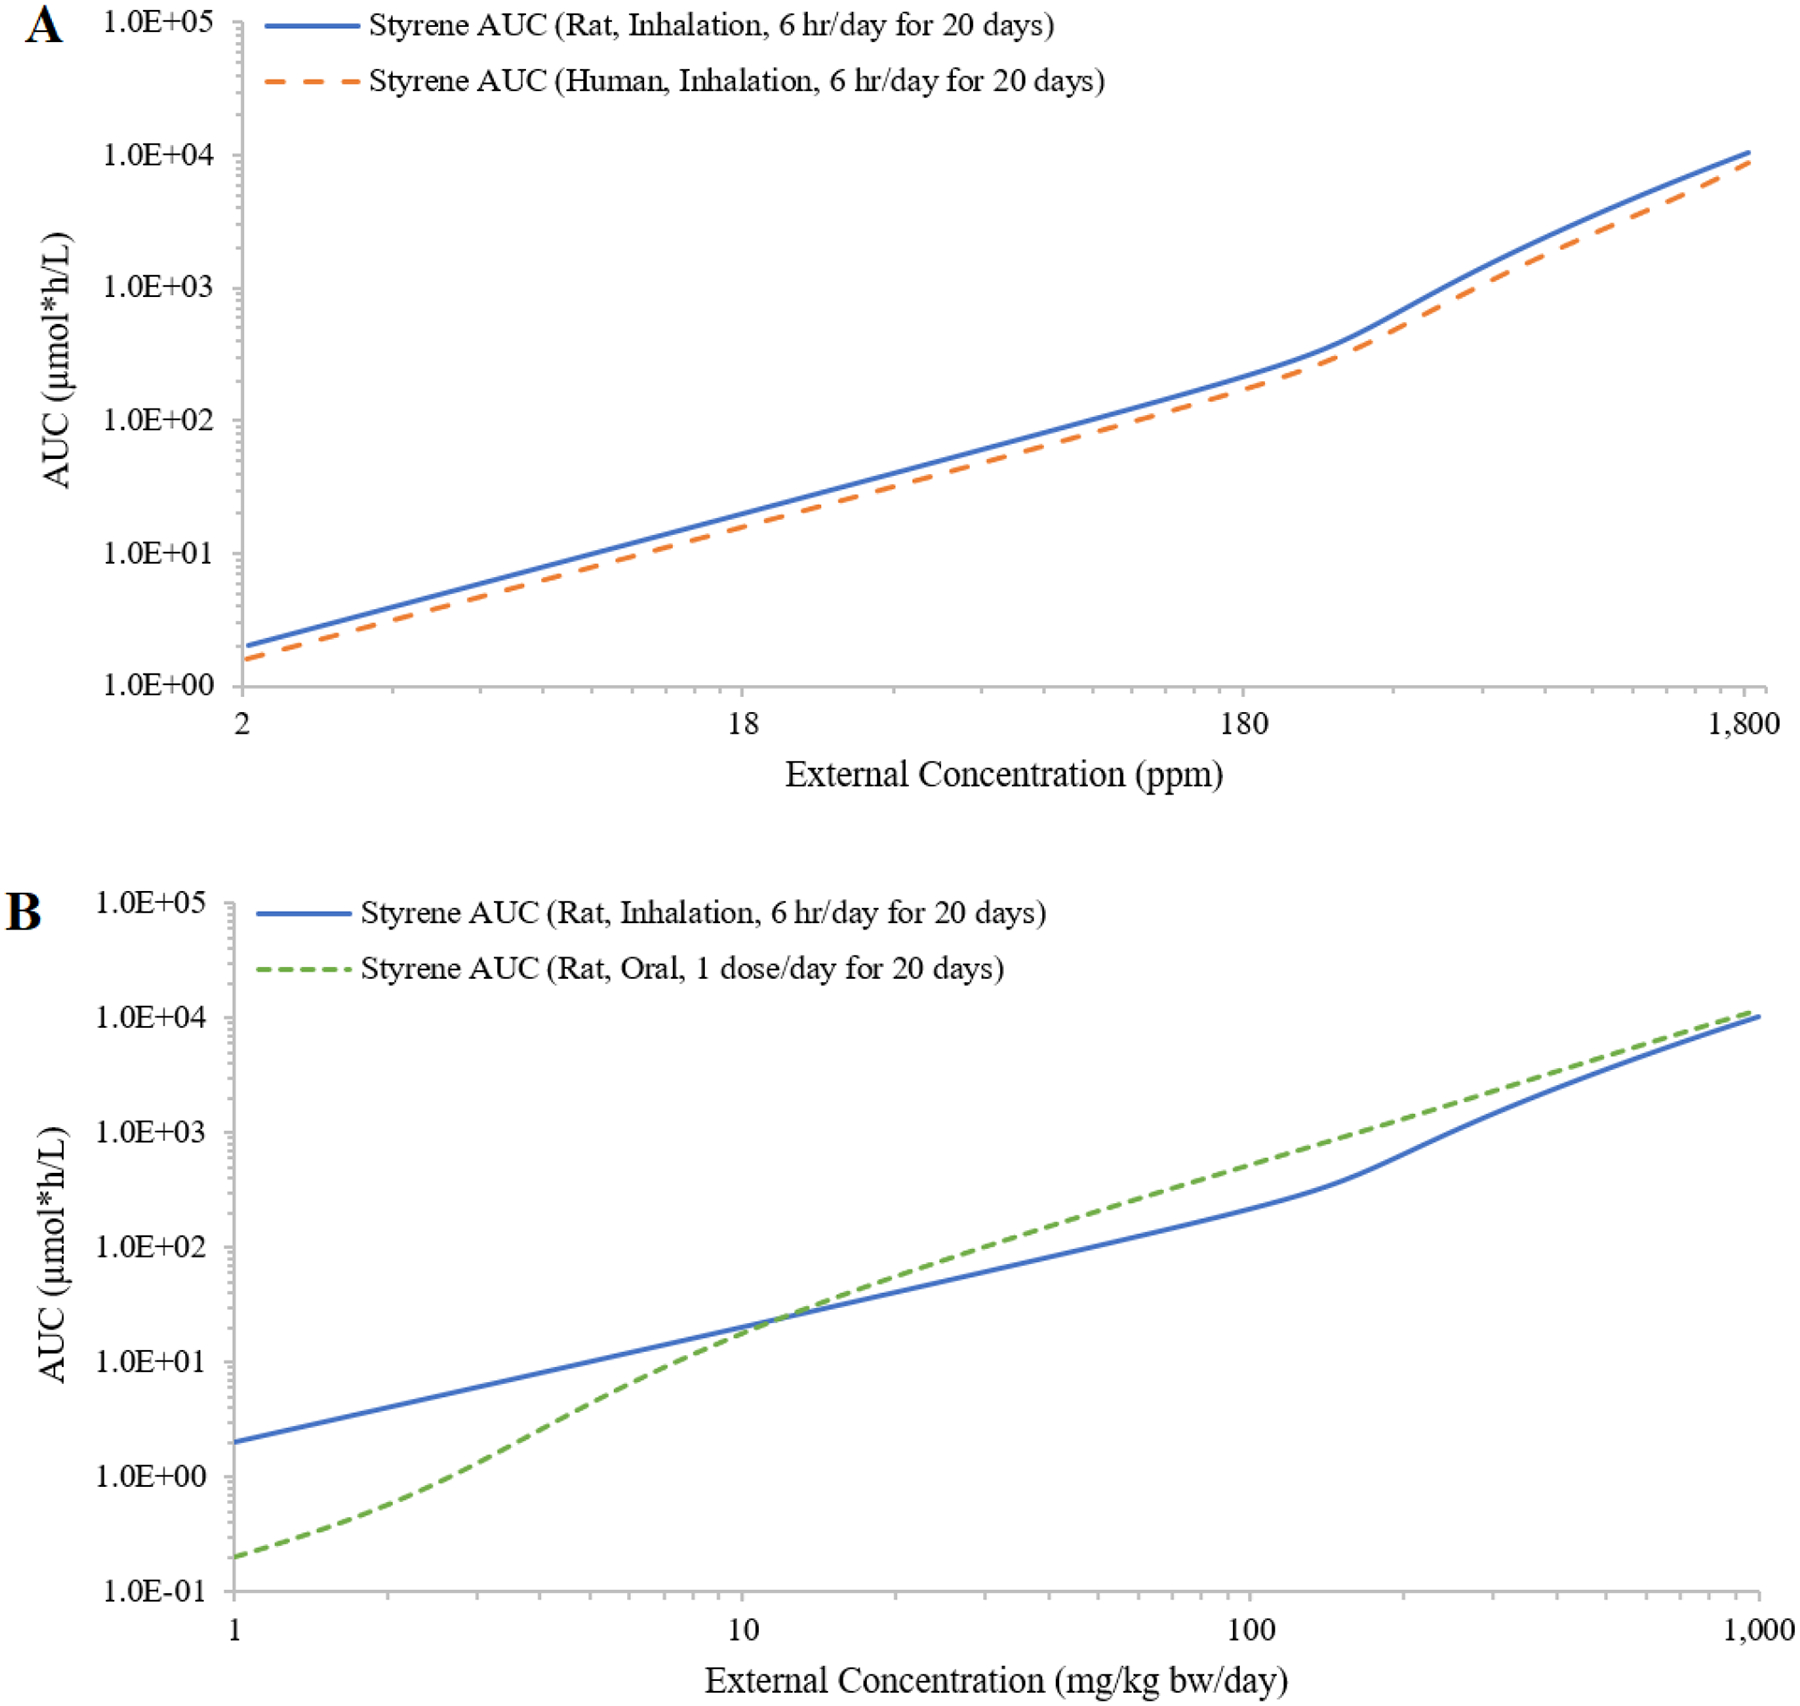
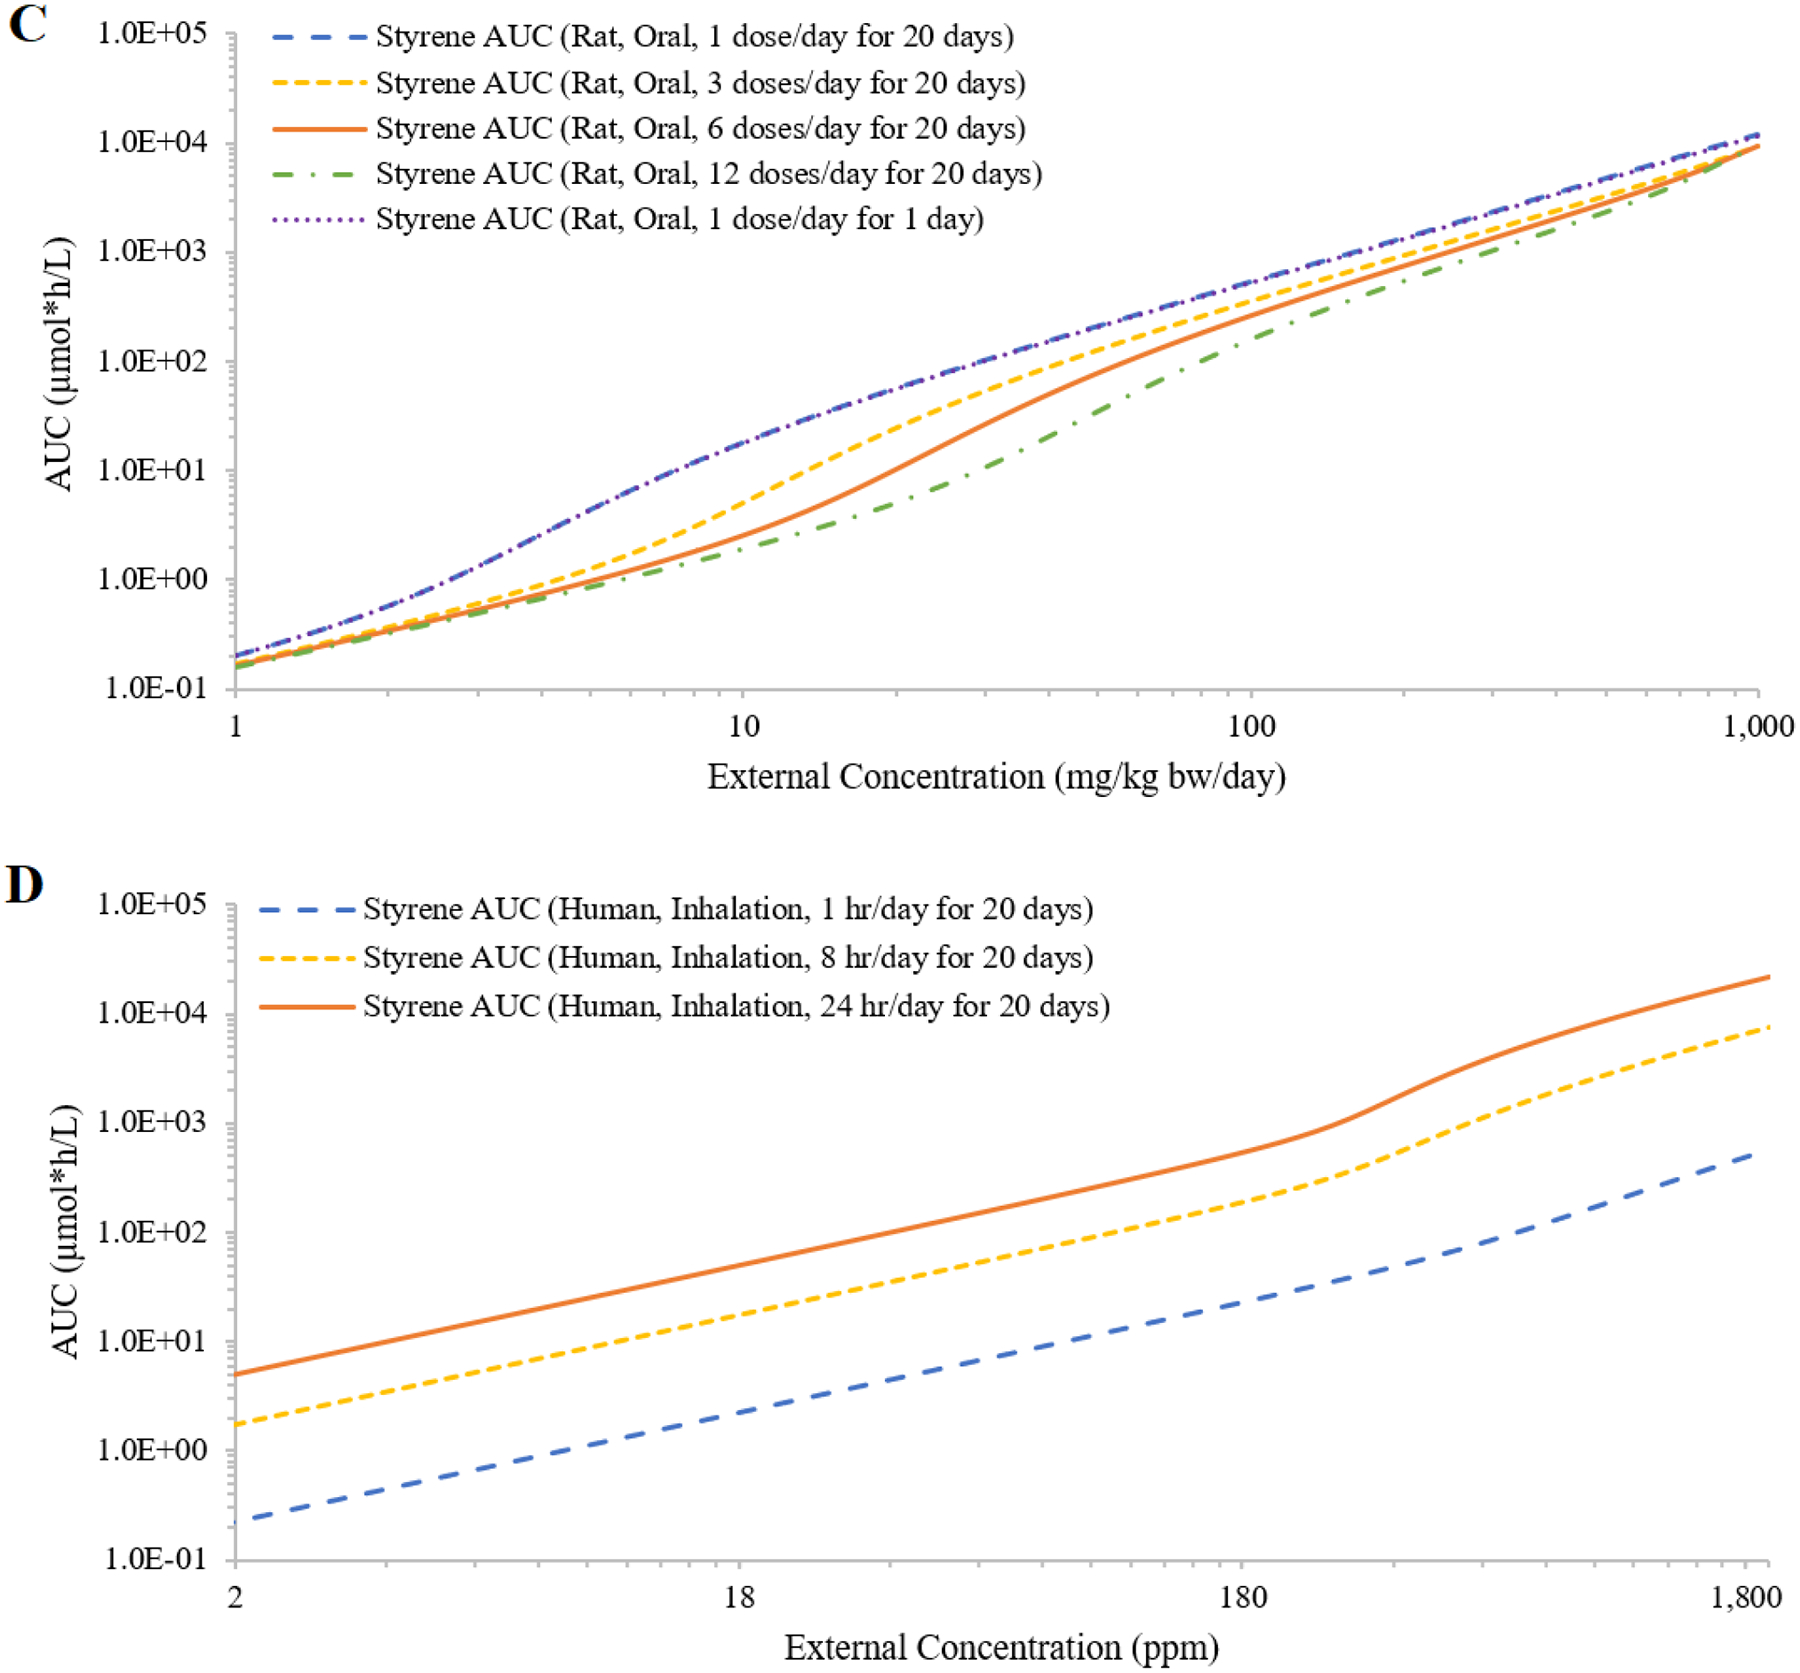
Simulated external concentrations (mg/kg bw/day for oral exposure; ppm for inhalation exposure) versus area under the curve of plasma concentrations during the last 24 hours (AUC; in μmole*h/L) of styrene concentrations in plasma. Panel A compares rat and human AUCs generated by simulating 6 hours/day inhalation exposures for 20 days. Panel B compares rat AUCs generated from daily oral dosing and 6 hours/day inhalation exposure for 20 days. Panel C compares rat AUCs generated from evenly spaced 1, 3, 6 and 12 oral doses per day for 20 days. Panel D compared human AUCs generated from inhalation exposures for 1, 8 and 24 hours/day for 20 days (panel D).
Test case 5: Caffeine
Given the same external concentration, the plasma AUC of caffeine resulting from oral exposure was modestly higher than the AUC resulting from dermal exposure (Figure 8). The maximum 95th percentile of estimated caffeine oral intake for adults was close to the exposure concentration at which the rate of metabolism was ~57–65% Vmax; the estimated maximum aggregate dermal exposure was close to the concentration at which rate of metabolism was ~5.8% Vmax.
Figure 8:
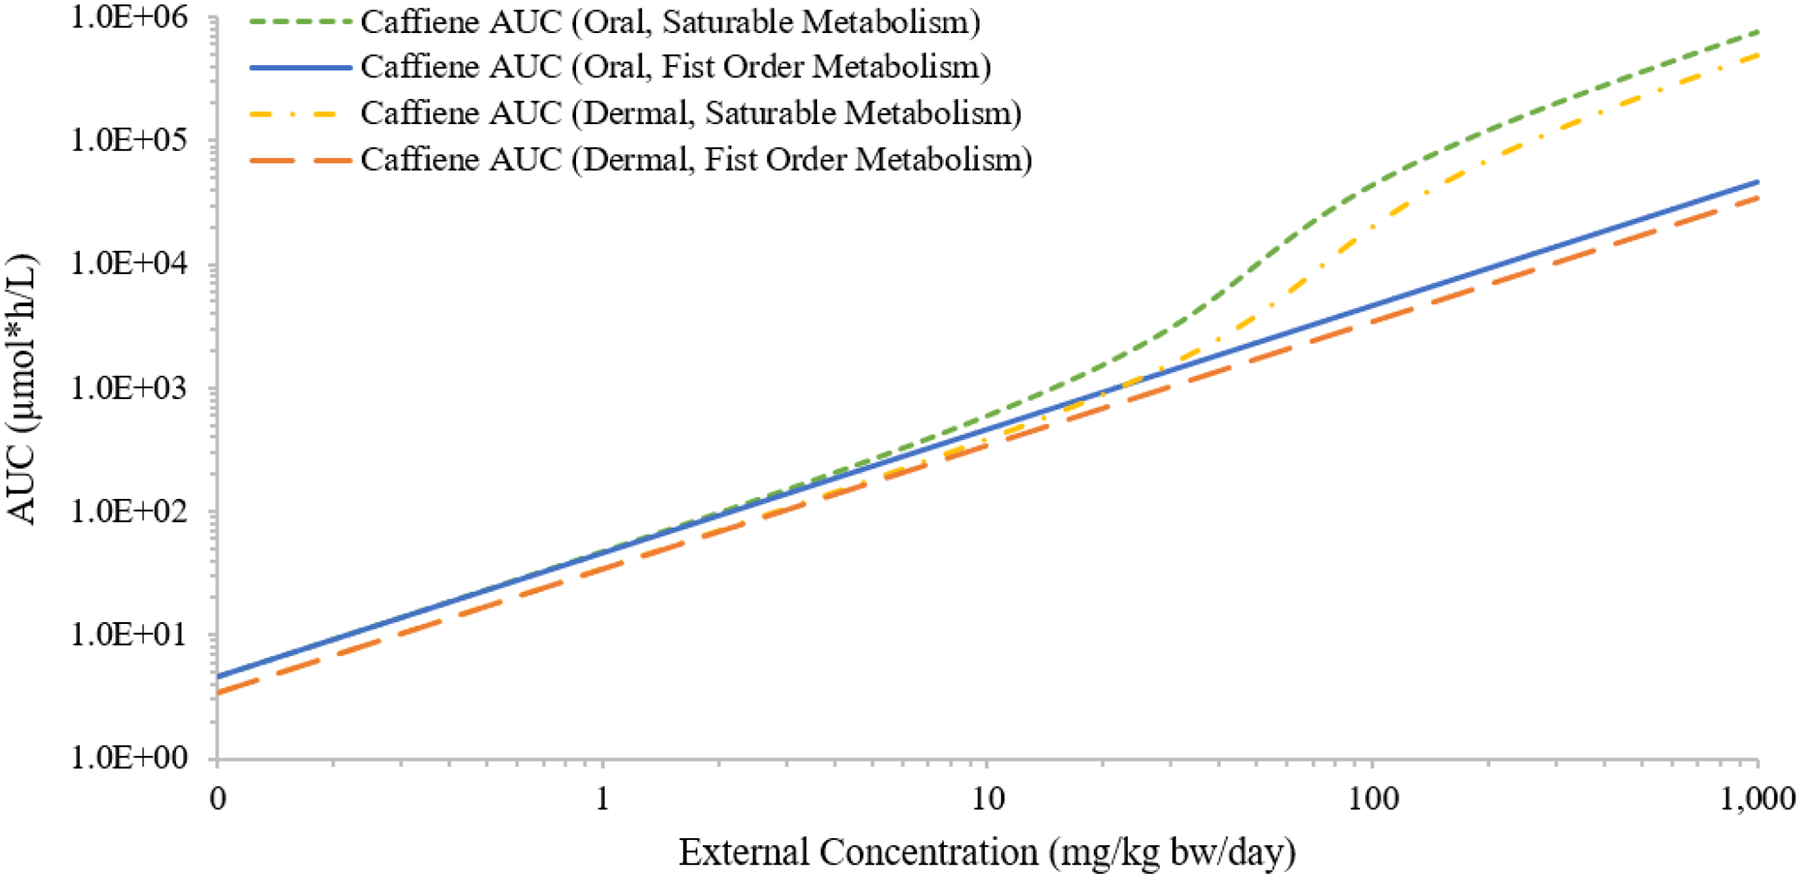
Simulated external concentrations (mg/kg bw/day) versus area under the curve of plasma concentrations during the last 24 hours (AUC; in μmole*h/L) of caffeine from daily oral or dermal exposures for 20 days, assuming saturable or first-order hepatic metabolism of caffeine.
Test case 6: Analysis of measured AUC data for 2,4-D
The optimized urinary excretion parameters (Table S4) produced model predictions that, by visual inspection, agreed with the observed AUCs for both male and female rats and for different lengths of studies (Figures 9, S5). The model parameterized for saturable urinary excretion exhibited sigmoid-like shapes for the IEC relationship, and were similar for males and females though shifted on the x-axis for external exposure due to different VmaxU values (Figures 9 and S5). The larger VmaxU optimized for male rats resulted in urinary excretion approaching saturation at a higher external concentration when compared to female rats, a result that may explain the treatment-related, adverse effects observed at lower external concentration in female rats (Saghir et al. 2013). In addition, the PBPK model was able to describe the accumulation of internal concentration with increasing exposure duration (Figure 9B); this capability was unique to the PBPK approach.
Figure 9:
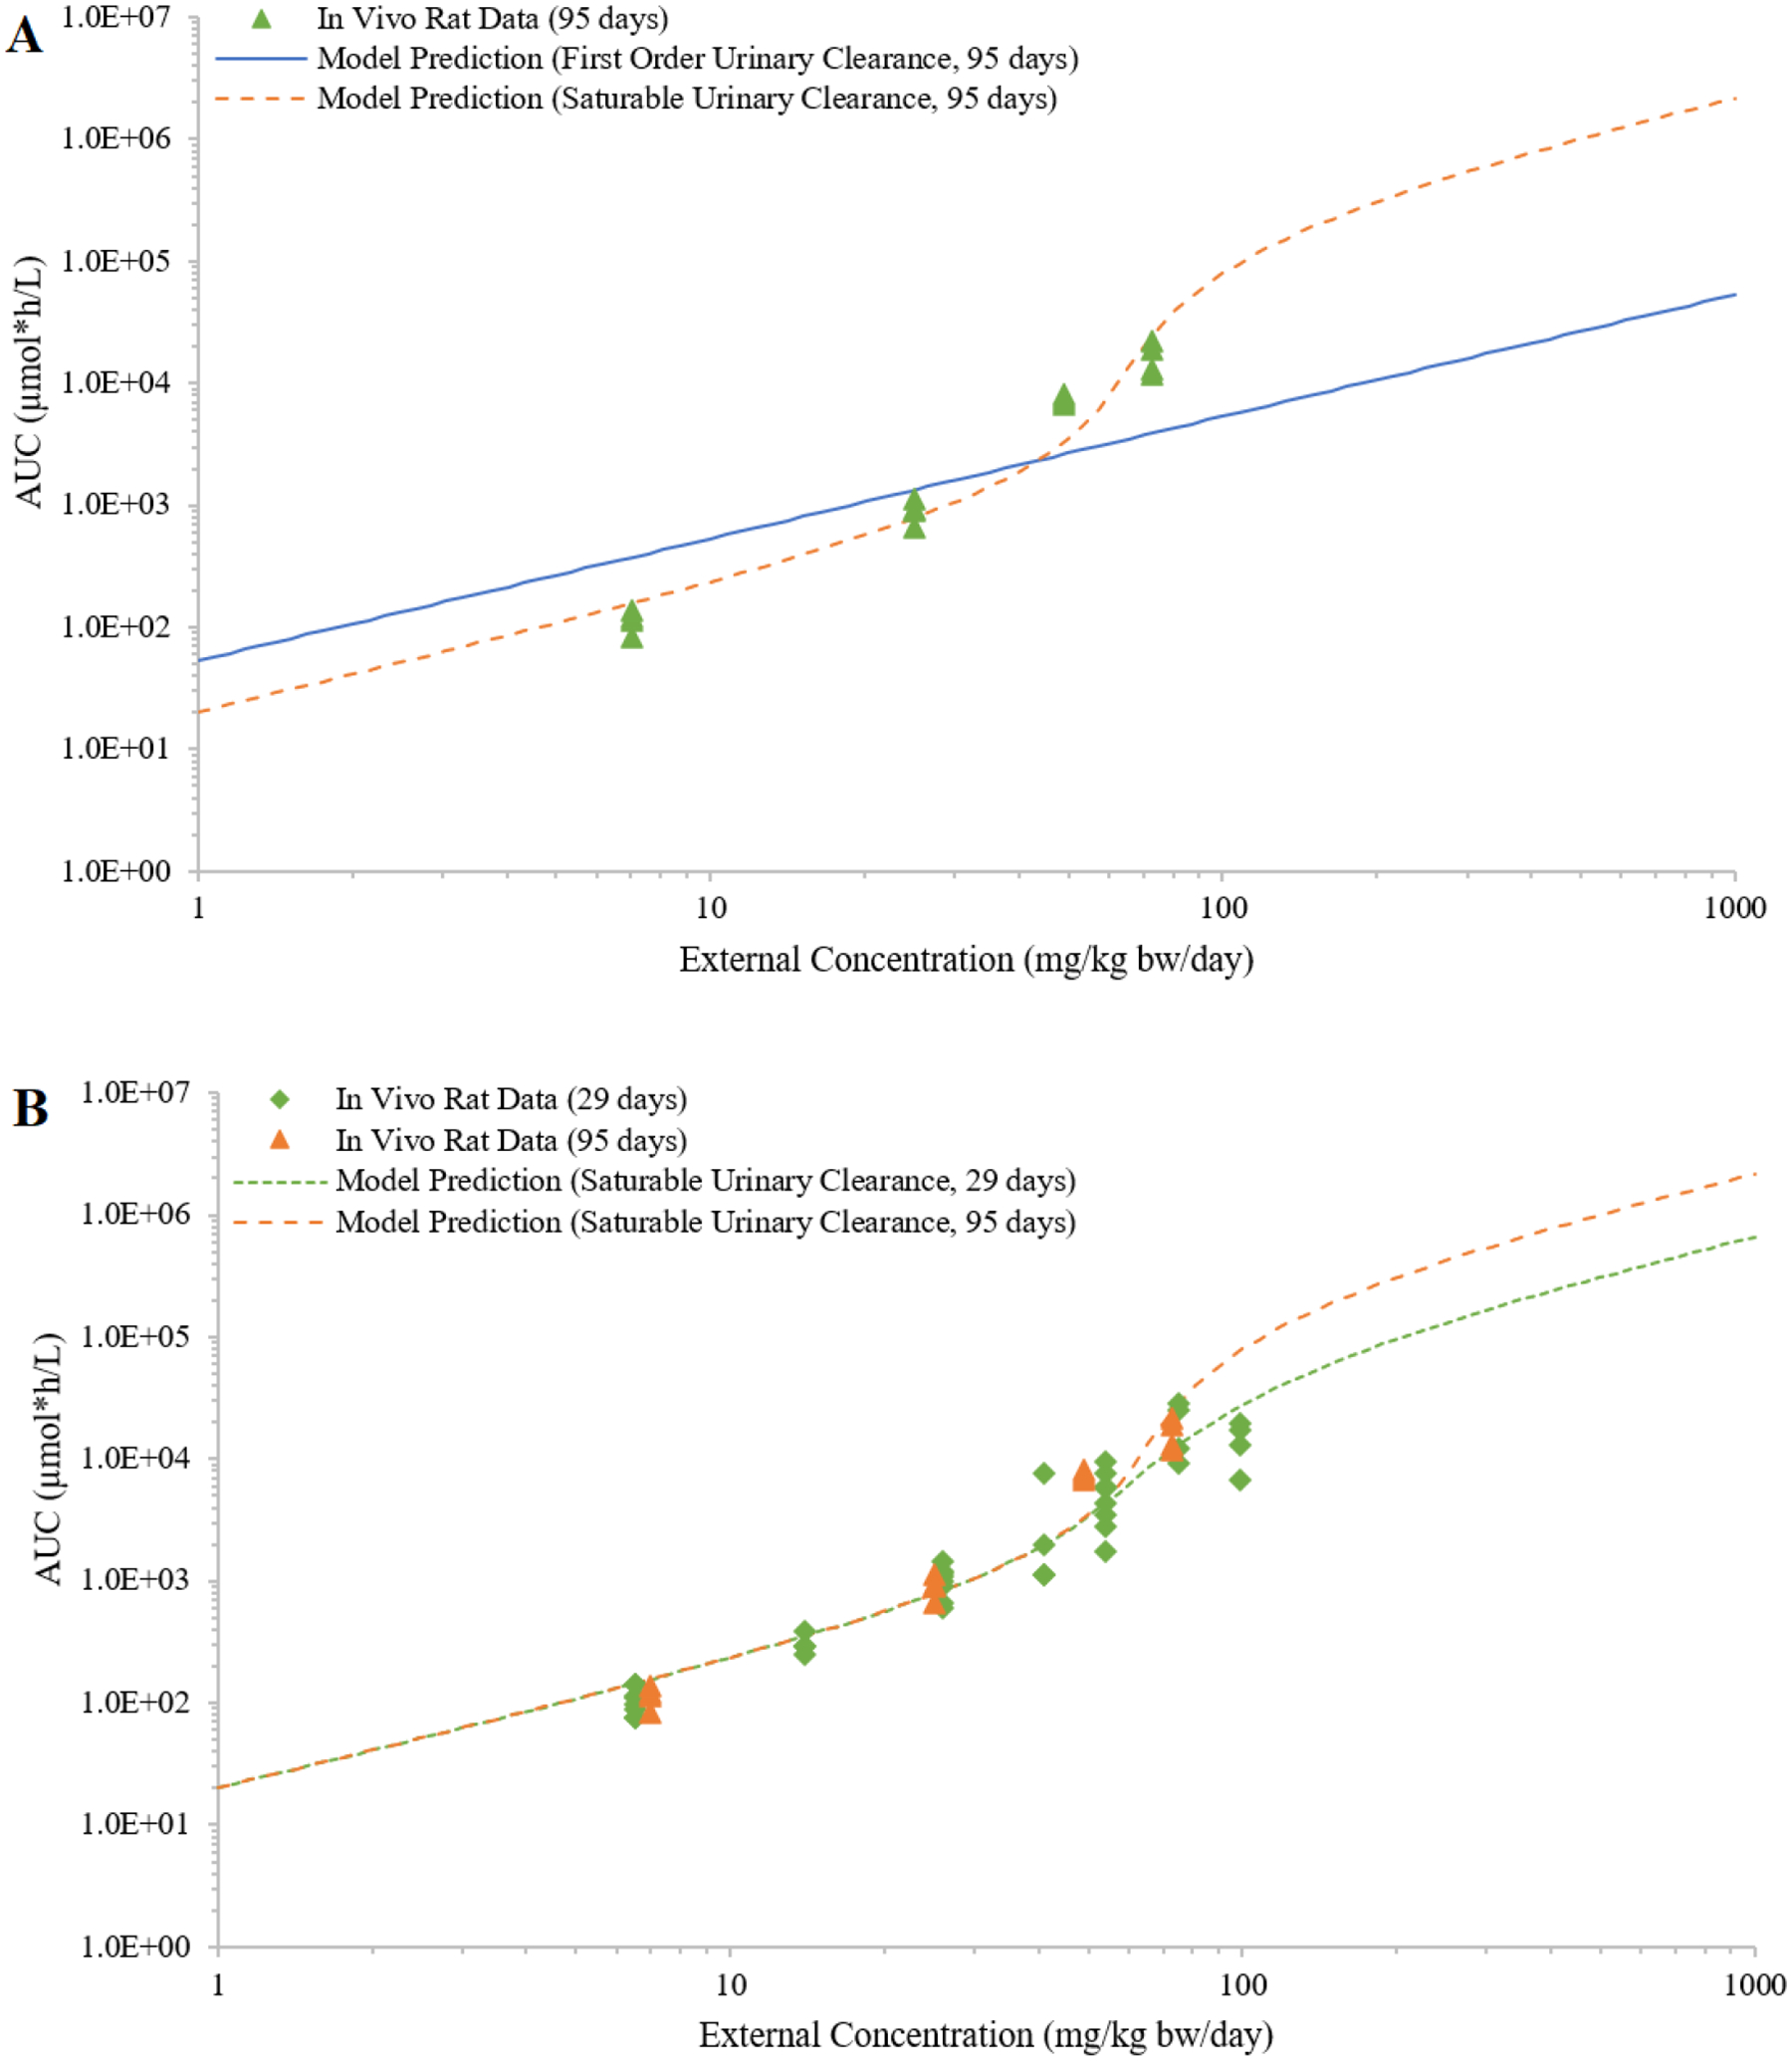
Simulated external concentrations (mg/kg bw/day) versus area under the curve of plasma concentrations during the last 24 hours (AUC; in μmole*h/L) of 2,4-Dichlorophenoxyacetic acid (2,4-D) from dietary exposures of female rats is compared to in vivo data. Panel A shows plasma concentrations from a 95-day in vivo study, and simulated plasma concentration curves with saturable (VmaxU = 2.91; KmU = 58.5) or first-order urinary clearance (CLU= 0.0186) of 2,4-D. Panel B compares the in vivo data and saturable urinary clearance (VmaxU = 2.91; KmU = 58.5) curves for both 29-day and 95-day exposures.
For female rats, the saturable urinary excretion assumption provided a better fit to the in vivo data than the first-order assumption (Figure 9A; Table 2). This result was supported by all three goodness of fit metric calculations (Table 2). For male rats, while the saturable urinary excretion assumption resulted in smaller RSS and MAE, it did not provide a sufficient improvement in model fit to justify its selection over the first-order urinary excretion assumption. Optimizing the KmU to male data rather than female data yielded a minor change in the KmU value and did not change the conclusion (results not shown).
Table 2:
Statistical comparison of the model fits to data from in vivo exposure of rats to 2,4-D (Saghir et al. 2013). The values for the dose associated with half-maximal urinary excretion (KmU) used in these simulations were fit to female data
| Urinary Excretion | Sex | RSSB | MAEB | AICcC | ΔAICcA |
|---|---|---|---|---|---|
| First-Order | Female | 55.7 | 0.878 | 160.7 | 69.9† |
| Saturable | Female | 15.4 | 0.423 | 90.8 | |
| First-Order | Male | 11.0 | 0.408 | 63.9 | 4.99 |
| Saturable | Male | 9.18 | 0.372 | 59.0 |
ΔAICc was calculated as AICcfirst-order – AICcsaturable
Residual sum of squares (RSS) and mean absolute error (MAE) were calculated using log-transformed errors given the log-normal distribution of the residuals.
The corrected Akaike information criterion (AICc) was used given the relatively small sample size of the in vivo dataset
symbol on the ΔAICc value denotes sufficient improvement in fit to justify preferential use of the model using saturable excretion over that which used only first-order excretion (Cavanaugh and Neath 2019).
Discussions
Hypothetical chemicals in our test cases were based on physical-chemical properties from known chemicals, because constructing models in this manner allowed for the chemical-specific parameters to be estimated using in silico approaches and ensured that our simulation results were biologically plausible. The identities of these chemicals were not revealed because the modeling purpose was not simulating the kinetic behaviors of these known chemicals or supporting risk assessment applications. Rather, the purpose of this part of our modeling study was to explore how saturable ADME process(es) influence the profile (such as plateau, shape) of the IEC relationship. Models of known chemicals (styrene and caffeine) were used in the test cases to explore the impact of exposure route, frequency, and duration on the IEC relationship and analyses were undertaken for measured blood concentrations of 2,4-D.
The influence of PCs and saturable clearance and absorption parameters on the IEC relationship was evaluated by increasing or decreasing these parameter values up to 100-fold (test case 1). In liver, changing PCs affected both the distribution into liver and the free concentration available for metabolism; in other tissues, PC changes affected only tissue distribution. In general, changing distribution shifted curves up or down while simultaneously making the region of nonlinearity steeper or flatter, respectively. By contrast, changing Vmax and Km shifted the curves right and left. Saturable absorption reduced the plasma concentrations compared to first-order absorption, with the parameter values influencing the magnitude of the difference as a function of increasing external concentration.
In general, multiple effects on ADME can arise from changes in the chemical structure. For example, greater lipophilicity increases partitioning to fat tissue and may also increase cytochrome P450-mediated metabolic rates. To examine the impact of varying multiple model parameters simultaneously, analyses could be conducted using Monte Carlo methods. However, it can be challenging to capture the potential interdependencies of parameters, such as lipophilicity influencing both distribution and metabolism. Monte Carlo analysis can also be used to evaluate the net impact of the variability in critical biochemical and physiological parameters (such as enzyme levels, body weights) and exposure scenarios (such as dietary intake), which can better inform the design of animal toxicity testing studies.
Using a PBPK model to understand the IEC relationship or to identify an appropriate internal dose metric can aid in better characterization of dose-response relationships observed in animals. For example, Himmelstein and colleagues (2004) used a PBPK model to account for interspecies differences in the uptake and metabolism of 2-chloro-1,3-butadiene (CD) and to interpret different lung tumor findings among different species (Himmelstein et al. 2004). Chronic inhalation studies in B6C3F1 mice and Fischer rats led to lung tumor response (Melnick et al. 1999), which was not observed in Wistar rats and Syrian hamsters (Trochimowicz et al. 1998). While dose-response relationships across species were challenging to interpret at the external concentration level, the model-predicted average daily amount of CD metabolized was able to explain lack of tumor response in Wistar rats and Syrian hamsters; a single dose-response curve could be used to describe tumor response data from all test species when the dose metric accounted for CD metabolism (Himmelstein et al. 2004).
When dose-response data are available, a PBPK model may be used to identify the most toxicologically relevant dose metric (e.g., AUC, peak concentration) for potential toxic moieties (e.g., parent, metabolite) in exposure scenarios (e.g., single dose, repeated dose, or a specific developmental period) that best correlate with the observed dose-dependent toxic effects. For example, our test case 2 showed that when parent metabolism saturates, the parent AUC increases more rapidly for a specific dose range until it re-establishes a proportional increase with increasing external concentration (Figure 4A). On the other hand, the metabolite AUC reaches a plateau when parent metabolism saturates (Figure 4A). Thus, if a toxic response did not increase with increasing external concentration, it may suggest that the toxic moiety is a metabolite and that metabolism of the parent had reached saturation at the higher doses tested. Test case 2 (Figure 4) also highlighted that proportionality of the IEC relationship should be analyzed using the appropriate dose metric for the active moiety, when known, and not always the parent AUCs.
The styrene test case examined the impact of varied exposure routes, durations, and frequencies on the IEC relationship and compared the IEC relationship between rats and humans. Cross-species comparison of rat and human inhalation exposures showed similar IEC curve shapes for styrene (Figure 7A), and this result was specific to chemical of interest. Choices for how to simulate oral exposures, such as a bolus dose or multiple doses, can shift the IEC curve to the left or right, given the same total daily dose (Figure 7C); this will always be an uncertainty factor for dietary or drinking water exposures in contrast to a single bolus dose. This test case also showed that the median and the mean of the estimated air concentrations in workplace (32 and 54 ppm, respectively) were likely to be in the range where the rate of metabolism was approaching linear. Even at the OSHA PEL of 100 ppm, the average rate of metabolism was ~29% of Vmax. Although some measured air concentrations were higher than the OSHA PEL, these concentrations were unlikely to be experienced by workers because respiratory protection and personal protective equipment are recommended by OSHA when engineering controls are not sufficient to reduce air concentrations to levels below the OSHA PEL. Occupational exposure was also anticipated to be much higher than that of general populations, making this test case an analysis of high-end exposures.
When possible, PBPK modeling can be used as a biologically based alternative to other statistical methods for analyzing proportionality of the IEC relationship from limited in vivo data. A PBPK model can account for species physiology and incorporate available ADME information, while the other methods analyze PK data in isolation. Currently, the most common statistical approach for analyzing proportionality of the IEC relationship compares the fold increases in external concentrations with the fold increases in internal concentrations (Loccisano et al. 2020; Loccisano et al. 2021; Saghir et al. 2013). There are two main issues with this approach. First, the internal concentration is not always proportional to the external concentration at the lowest dose level tested. As demonstrated in the current study, an internal concentration can start to deviate from proportionality at very low external concentration (Figure 4B). Deviation from proportionality may even occur at external concentration below the lowest dose level tested (Figure 4A). Second, a criterion does not exist to suggest what degree of nonlinearity in the IEC relationship would result in a dose-dependent transition in mode of action. A nonlinear IEC relationship by itself does not necessarily suggest an adverse effect, and such a criterion can only be determined by weighing all available data on a case-by-case basis (Tan 2021).
Most statistical approaches distinguish tested dose groups as either proportional or not proportional, but a PBPK modeling approach allows for the potential IEC relationship to be simulated across a continuous range of external concentrations. Also, most methods utilize only the mean values in the analysis, and the PBPK modeling approach can optimize parameters to individual animal data to account for study and biological variability. Another difference is that the PBPK analysis may not be feasible for analyzing IEC data when the number of data points available for model optimization is less than the number of optimized parameters (i.e., parameter identification or model overfitting issue). For example, metabolite AUCs measured at three external concentrations are not sufficient to estimate parent metabolism rate, parent urinary excretion rate, metabolite clearance rate, and oral absorption fraction when these parameters cannot be informed by other studies. This limitation, however, does not suggest that other approaches are better, because this situation may indicate that the PK data are too sparse to adequately inform the true IEC relationship regardless of the employed approach. For example, while the fold difference approach can be applied to analyze a dataset with only two dose groups, the results are unlikely to inform the underlying IEC relationship.
In the original 2,4-D test case (Saghir et al. 2013), a “threshold” external concentration was determined when the fold increase in the terminal AUC24 exceeded the fold increase in the external concentration. By contrast, our PBPK approach characterized the IEC relationship across a continuous range of doses (Figures 9A, 9B, S5), and avoided singularly identifying a so-called ‘threshold of non-linearity’ or ‘inflection point’ from the tested dose groups. As demonstrated in our test cases, a point at which the IEC relationship based on a saturable PK mechanism deviated from a linear IEC relationship may exist (for example, parent AUC in Figures 4B and 4D), but the difference in internal concentrations at that ‘point’ was so small that it was unlikely to be indicative of any toxicologically or kinetically meaningful change. If saturable PK contributes to a dose-dependent transition in mode of action, this transition may occur gradually or steeply but is more likely to be observable when the internal concentration is substantially higher than proportional to external concentration. Such was the case for 2,4-D as treatment-related clinical effects were observed at concentrations where the IEC relationship demonstrated substantial superlinearity (Figure 9A) (Saghir et al. 2013).
Saghir and colleagues (2013) attributed the divergent dose-response results to sex-dependent differences in 2,4-D clearance, which they hypothesized to be mediated by the OAT1 transporter (Saghir et al. 2013). Although our model did not explicitly include OAT1-specific data to describe sex-specific clearance, allowing different VmaxU to separately fit the male and female AUCs allowed for the potential sex-dependent difference to be considered in the analysis. In another study, a simple PK model was used to analyze the same dataset, with Vmax and Km values assumed to be the same for both sexes (Slob, Zeilmaker, and Hoogenveen 2020). This assumption may not be appropriate given the sex-dependent differences observed in both toxicity and PK studies on 2,4D (Saghir et al. 2013). Using a PBPK model to account for sex-specific difference in PK and the subsequent toxicity responses was also demonstrated with a study on ethyl-tertiary-butyl ether (ETBE) and its metabolite, tertiary-butyl alcohol (TBA) (Borghoff et al. 2017). This model included ETBE and TBA binding to the male rat-specific protein α2u-globulin in kidneys, saturable metabolism of ETBE and TBA in liver, and induction of TBA metabolism following repeated exposures. From their analysis, they were able to contribute PK differences to the sex-specific, route-specific, and moiety-specific responses observed in cancer bioassays (Borghoff et al. 2017).
While the 2,4-D test case demonstrated a retrospective analysis, a PBPK model can also be used for prospective predictions. With growing interest in applying the 3Rs principles (reduction, refinement, and replacement) to animal toxicity testing, it is critically important to optimize the design of an in vivo study so that it adds the maximum scientific value while minimizing animal use. Optimizing study design is best supported by a weight of evidence approach to evaluate and integrate all available information that has the potential to influence study outcomes, and a provisional PBPK model can aid in data integration and interpretation. In the 2,4-D example, a model that is optimized to fit the data from a dose range-finding study conducted in rats could have provided valuable insight for top dose selection in the subchronic study, potentially avoiding the inclusion of the toxic dose group (100 mg/kg bw/day) in the female rat study (Figure 9B). Alternatively, if in vitro data, such as OAT1-mediated clearance of 2,4-D, were available to parameterize a PBPK model, then the model could supply preliminary prospective predictions of the IEC relationship to inform dose selection and may avoid the need for an in vivo dose range finding study.
Ideally, data collection/model refinement is an iterative process: the quantity and type of available data dictate the structure and outputs of a model, and a model can be used to test hypotheses and identify data gaps for additional experiments. For example, an OECD 417 guideline ADME study may inform the rate and fraction of oral absorption, rate of parent clearance, identity of major metabolites, the extent of storage in tissues, and excretion in urine and feces. If an ADME study shows that the parent chemical is not detected in the tissue, blood, urine, or fecal samples, it may suggest rapid metabolism of the parent and a PBPK model can fit a rapid hepatic clearance rate to simulate parent concentration below the analytical detection limit shortly after dosing ends. On the other hand, a PBPK model may be used to suggest the dose level and spacing for a repeated dose study or to inform the appropriate time points of blood sample collection in a PK study.
An additional benefit of using the PBPK modeling approach is the correspondence between the internal concentration of a chemical and the hazard aspects of the study design. Knowledge of the predicted internal concentrations and the anticipated mode of action enables a study design to incorporate mechanistic biomarkers, which correspond to early events that are predictive of adverse, apical endpoints at the organism level. Monitoring those early biomarkers can allow for an adaptive study design where the doses selected for the longer-term studies are based on the results seen for the short-term measurements. It is even possible to eliminate the need for longer-term studies in certain circumstances, because the progression from early events to apical outcomes can be independent of a specific chemical (Heusinkveld et al. 2020). Toxicological transcriptomic studies have provided ample evidence for such an application of using short-term animal studies to predict apical endpoint alterations that occur after much longer exposure time (Farmahin et al. 2017; Thomas et al. 2013). When evaluating chemicals from a well-studied class, the correspondence between internal concentration and early biomarker measurements also can be used to support read across applications that leverage existing apical outcome data from other chemicals in the same class.
Conclusions
A mechanistically credible PBPK model can reduce the uncertainty in chemical risk assessment by predicting tissue dosimetry for chemicals under conditions where little or no data exist. As more in vitro and in silico tools are available to estimate enzyme and transporter functions in cells or tissues, provisional PBPK models can be constructed to serve a purpose other than direct application to risk assessment. A PBPK model can be developed as a research tool to integrate available ADME data from shorter-term in vivo studies or in vitro assays to simulate longer-term exposure, which can inform dose selection, dose spacing, or sample collection intervals in future whole animal studies. A PBPK model can also be used to interpret toxicity testing results, generate hypotheses on potential modes of action, or identify early mechanistic biomarkers. These capabilities can potentially reduce animal use in longer-term studies, as well as improve our understanding of the study outcomes by providing insight into the IEC relationship. In retrospective analyses, the PBPK approach has important advantages over common statistical methods as it avoids the bimodal distinction of ‘proportional’ versus ‘non-proportional’. The test cases analyzed herein support the assertion that a PBPK model is a useful tool, as part of a weight of evidence approach, to optimize study design or for use in retrospective data analysis to interpret dose-response results.
Supplementary Material
Acknowledgement
This work was supported in part by the Health and Environmental Sciences Institute PBPK Committee. It is recognized via a Memorandum of Understanding between the USEPA and HESI that outlines joint commitments to a multisector and multidisciplinary HESI working group on PBPK modeling. We acknowledge the committee members for their support and helpful feedback on development of this document.
Footnotes
An oral dose of 1,000 mg/kg bw/day is a default maximum dose in repeated dose animal toxicity studies (OECD Guideline 407, 1995/2008).
For example, 1.84 ppm = (1 mg/kg bw/day) * (0.25 kg) / ((5.3 L/h) * (6 h/day) / (1000 L/m3)) / (104.16 g/mole) * (24.45 L/mole)
For this example, Vmax/Km (L/h) = (0.68 μL/min/million hepatocytes) * (99E-6 L/μL) * (60 min/h) * (1000 g/kg) * 0.026 * (70 kg) = 7.35 L/h
REFERENCES
- Bartels Michael, Brown Colin, Chung Git, Chan Melissa, Terry Claire, Gehen Sean, and Corvaro Marco. 2020. ‘Review of the pharmacokinetics and metabolism of triclopyr herbicide in mammals: Impact on safety assessments’, Regulatory Toxicology and Pharmacology: 104714. [DOI] [PubMed] [Google Scholar]
- Begas E, Kouvaras E, Tsakalof A, Papakosta S, and Asprodini EK. 2007. ‘In vivo evaluation of CYP1A2, CYP2A6, NAT-2 and xanthine oxidase activities in a Greek population sample by the RP-HPLC monitoring of caffeine metabolic ratios’, Biomedical Chromatography, 21: 190–200. [DOI] [PubMed] [Google Scholar]
- Bonati Maurizio, Latini Roberto, Galletti Ferruccio, Young John F, Tognoni Gianni, and Garattini Silvio. 1982. ‘Caffeine disposition after oral doses’, Clinical Pharmacology & Therapeutics, 32: 98–106. [DOI] [PubMed] [Google Scholar]
- Borgert CJ, Fuentes C, and Burgoon LD. 2021. ‘Principles of dose-setting in toxicology studies: the importance of kinetics for ensuring human safety’, Archives of Toxicology: 1–14. [DOI] [PMC free article] [PubMed] [Google Scholar]
- Borghoff Susan J, Ring Caroline, Banton Marcy I, and Leavens Teresa L. 2017. ‘Physiologically based pharmacokinetic model for ethyl tertiary-butyl ether and tertiary-butyl alcohol in rats: Contribution of binding to α2u–globulin in male rats and high-exposure nonlinear kinetics to toxicity and cancer outcomes’, Journal of Applied Toxicology, 37: 621–40. [DOI] [PMC free article] [PubMed] [Google Scholar]
- Brown Ronald P, Delp Michael D, Lindstedt Stan L, Rhomberg Lorenz R, and Beliles Robert P. 1997. ‘Physiological parameter values for physiologically based pharmacokinetic models’, Toxicology and industrial health, 13: 407–84. [DOI] [PubMed] [Google Scholar]
- Bury Dagmar, Alexander-White Camilla, Clewell Harvey J III, Cronin Mark, Desprez Bertrand, Detroyer Ann, Efremenko Alina, Firman James, Hack Eric, and Hewitt Nicola J. 2021. ‘New framework for a non-animal approach adequately assures the safety of cosmetic ingredients–A case study on caffeine’, Regulatory Toxicology and Pharmacology, 123: 104931. [DOI] [PubMed] [Google Scholar]
- Cavanaugh Joseph E, and Neath Andrew A. 2019. ‘The Akaike information criterion: Background, derivation, properties, application, interpretation, and refinements’, Wiley Interdisciplinary Reviews: Computational Statistics, 11: e1460. [Google Scholar]
- Chung John I, Kelly Ron C, Wahlstrom Jan, Wu Benjamin, Wu Tian, and Alvarez-Nunez Fernando. 2017. ‘Maximizing the impact of physiologically based oral absorption modeling and simulation’, Journal of pharmaceutical sciences, 106: 734–37. [DOI] [PubMed] [Google Scholar]
- Clewell Harvey J, Andersen Melvin E, and Barton Hugh A. 2002. ‘A consistent approach for the application of pharmacokinetic modeling in cancer and noncancer risk assessment’, Environmental Health Perspectives, 110: 85–93. [DOI] [PMC free article] [PubMed] [Google Scholar]
- De Buck Stefan S, Sinha Vikash K, Fenu Luca A, Gilissen Ron A, Mackie Claire E, and Nijsen Marjoleen J. 2007. ‘The prediction of drug metabolism, tissue distribution, and bioavailability of 50 structurally diverse compounds in rat using mechanism-based absorption, distribution, and metabolism prediction tools’, Drug Metabolism and Disposition, 35: 649–59. [DOI] [PubMed] [Google Scholar]
- Dolton Michael J, and D’Argenio David Z. 2017. ‘Population-based meta-analysis of roxithromycin pharmacokinetics: dosing implications of saturable absorption and protein binding’, Journal of Antimicrobial Chemotherapy, 72: 1129–36. [DOI] [PMC free article] [PubMed] [Google Scholar]
- EFSA Panel on Dietetic Products, Nutrition Allergies. 2015. ‘Scientific Opinion on the safety of caffeine’, EFSA Journal, 13: 4102. [Google Scholar]
- Farmahin Reza, Williams Andrew, Kuo Byron, Chepelev Nikolai L, Thomas Russell S, Barton-Maclaren Tara S, Curran Ivan H, Nong Andy, Wade Michael G, and Yauk Carole L. 2017. ‘Recommended approaches in the application of toxicogenomics to derive points of departure for chemical risk assessment’, Archives of Toxicology, 91: 2045–65. [DOI] [PMC free article] [PubMed] [Google Scholar]
- Hansmann Simone, Darwich Adam, Margolskee Alison, Aarons Leon, and Dressman Jennifer. 2016. ‘Forecasting oral absorption across biopharmaceutics classification system classes with physiologically based pharmacokinetic models’, Journal of Pharmacy and Pharmacology, 68: 1501–15. [DOI] [PubMed] [Google Scholar]
- Heusinkveld Harm, Braakhuis Hedwig, Gommans Robin, Botham Phil, Corvaro Marco, van der Laan Jan Willem, Lewis Dick, Madia Federica, Manou Irene, and Schorsch Frédéric. 2020. ‘Towards a mechanism-based approach for the prediction of nongenotoxic carcinogenic potential of agrochemicals’, Critical reviews in toxicology, 50: 725–39. [DOI] [PubMed] [Google Scholar]
- Himmelstein Matthew W, Carpenter Steven C, Evans Marina V, Hinderliter Paul M, and Kenyon Elaina M. 2004. ‘Kinetic modeling of β-chloroprene metabolism: II. The application of physiologically based modeling for cancer dose response analysis’, toxicological sciences, 79: 28–37. [DOI] [PubMed] [Google Scholar]
- Khurana Rajneet Kaur, Kaur Ranjot, Kaur Manninder, Kaur Rajpreet, Kaur Jasleen, Kaur Harpreet, and Singh Bhupinder. 2017. ‘Exploring and validating physicochemical properties of mangiferin through GastroPlus® software’, Future science OA, 3: FSO167. [DOI] [PMC free article] [PubMed] [Google Scholar]
- Kot Marta, and Daniel Wladyslawa A. 2008. ‘-Caffeine as a marker substrate for testing cytochrome P450 activity in human and rat’, Pharmacological reports, 60: 789. [PubMed] [Google Scholar]
- Lave TH, Dupin S, Schmitt C, Chou RC, Jaeck D, and Coassolo PH. 1997. ‘Integration of in vitro data into allometric scaling to predict hepatic metabolic clearance in man: application to 10 extensively metabolized drugs’, Journal of pharmaceutical sciences, 86: 584–90. [DOI] [PubMed] [Google Scholar]
- Loccisano Anne E, Bus James, Gollapudi Bhaskar, Riffle Brandy, Frericks Markus, Fegert Ivana, and Fabian Eric. 2020. ‘Use of toxicokinetic data for afidopyropen to determine the dose levels in developmental toxicity studies’, Regulatory Toxicology and Pharmacology, 113: 104644. [DOI] [PubMed] [Google Scholar]
- Loccisano Anne E, Freeman Elaine, Riffle Brandy, Doi Adriana, Frericks Markus, Fegert Ivana, and Fabian Eric. 2021. ‘Afidopyropen: Challenges and impact of a toxicokinetic study designed to identify a point of inflection from dose-proportionality’, Regulatory Toxicology and Pharmacology, 124: 104962. [DOI] [PubMed] [Google Scholar]
- Margolskee Alison, Darwich Adam S, Pepin Xavier, Aarons Leon, Galetin Aleksandra, Rostami-Hodjegan Amin, Carlert Sara, Hammarberg Maria, Hilgendorf Constanze, and Johansson Pernilla. 2017. ‘IMI–Oral biopharmaceutics tools project–Evaluation of bottom-up PBPK prediction success part 2: An introduction to the simulation exercise and overview of results’, European Journal of Pharmaceutical Sciences, 96: 610–25. [DOI] [PubMed] [Google Scholar]
- McFadden Lisa G, Bartels Michael J, Rick David L, Price Paul S, Fontaine Donald D, and Saghir Shakil A. 2012. ‘Statistical methodology to determine kinetically derived maximum tolerated dose in repeat dose toxicity studies’, Regulatory Toxicology and Pharmacology, 63: 344–51. [DOI] [PubMed] [Google Scholar]
- Melnick Ronald L, Sills Robert C, Portier Christopher J, Roycroft Joseph H, Chou Billy J, Grumbein Sondra L, and Miller Rodney A. 1999. ‘Multiple organ carcinogenicity of inhaled chloroprene (2-chloro-1, 3-butadiene) in F344/N rats and B6C3F1 mice and comparison of dose–response with 1, 3-butadiene in mice’, Carcinogenesis, 20: 867–78. [DOI] [PubMed] [Google Scholar]
- OECD. 2014. Guidance Document 116 on the Conduct and Design of Chronic Toxicity and Carcinogenicity Studies, Supporting Test Guidelines 451, 452 and 453; Second edition, OECD Series on Testing and Assessment, No. 116
- ———. 2020. ‘Case study on the use of integrated approaches for testing and assessment for systemic toxicity arising from cosmetic exposure to caffeine. Series on Testing and Assessment No. 321’, ENV/JM/MONO(2020)17. [Google Scholar]
- OSHA. 2017. “Occupational Safety and Health Standards - 1910 Subpart Z.” In Toxic and Hazardous Substances. 82 FR 2735–2736, Jan. 9, 2017; https://www.osha.gov/laws-regs/regulations/standardnumber/1910/1910.1000TABLEZ2. [Google Scholar]
- ———. 2020. “OSHA Chemical Exposure Health Data.” In, edited by Occupational Safety and Health Administration US Department of Labor. https://www.osha.gov/opengov/health-samples. [Google Scholar]
- Parrott N, Lukacova V, Fraczkiewicz G, and Bolger MB. 2009. ‘Predicting pharmacokinetics of drugs using physiologically based modeling—application to food effects’, The AAPS journal, 11: 45–53. [DOI] [PMC free article] [PubMed] [Google Scholar]
- Pearce Robert G, Woodrow Setzer R, Strope Cory L, Wambaugh John F, and Sipes Nisha S. 2017. ‘Httk: R package for high-throughput toxicokinetics’, Journal of statistical software, 79: 1. [DOI] [PMC free article] [PubMed] [Google Scholar]
- Ramsey John C, and Andersen Melvin E. 1984. ‘A physiologically based description of the inhalation pharmacokinetics of styrene in rats and humans’, Toxicology and applied pharmacology, 73: 159–75. [DOI] [PubMed] [Google Scholar]
- Saghir Shakil A, Bartels Michael J, Rick David L, McCoy Alene T, Rasoulpour Reza J, Ellis-Hutchings Robert G, Sue Marty M, Terry Claire, Bailey Jason P, and Billington Richard. 2012. ‘Assessment of diurnal systemic dose of agrochemicals in regulatory toxicity testing–an integrated approach without additional animal use’, Regulatory Toxicology and Pharmacology, 63: 321–32. [DOI] [PubMed] [Google Scholar]
- Saghir Shakil A, Marty Mary S, Zablotny Carol L, Passage Julie K, Perala Adam W, Neal Barbara H, Hammond Larry, and Bus James S. 2013. ‘Life-stage-, sex-, and dose-dependent dietary toxicokinetics and relationship to toxicity of 2, 4-dichlorophenoxyacetic acid (2, 4-D) in rats: implications for toxicity test dose selection, design, and interpretation’, toxicological sciences, 136: 294–307. [DOI] [PMC free article] [PubMed] [Google Scholar]
- SCCS. 2021. ‘The SCCS notes of guidance for the testing of cosmetic ingredients and their safety evaluation 11th revision, 30–31 March 2021, SCCS/1628/21’. [DOI] [PubMed]
- Slob Wout, Zeilmaker Marco J, and Hoogenveen Rudolf T. 2020. ‘The relationship between internal and external dose: Some general results based on a generic compartmental model’, toxicological sciences, 177: 60–70. [DOI] [PubMed] [Google Scholar]
- Tan YM; Barton H; Boobis A; Brunner R; Clewell H; Cope R; Dawson J; Domoradzki J; Egeghy P; Gulati P; Ingle B; Kleinstreuer N; Lowe K; Lowit A; Mendez E; Miller D; Minucci J; Nguyen J; Paini A; Perron M; Phillips K; Qian H; Ramanarayanan T; Sewell F; Villanueva P; Wambaugh J; Embry M. 2021. ‘Opportunities and challenges related to saturation of toxicokinetic processes: implications for risk assessment’, Regul. Toxicol. Pharmacol, In Press. [DOI] [PMC free article] [PubMed] [Google Scholar]
- Terry Claire, Rasoulpour Reza J, Saghir Shakil, Marty Sue, Gollapudi B Bhaskar, and Billington Richard. 2014. ‘Application of a novel integrated toxicity testing strategy incorporating “3R” principles of animal research to evaluate the safety of a new agrochemical sulfoxaflor’, Critical reviews in toxicology, 44: 1–14. [DOI] [PubMed] [Google Scholar]
- Thomas Russell S, Wesselkamper Scott C, Wang Nina Ching Y, Jay Zhao Q, Petersen Dan D, Lambert Jason C, Cote Ila, Yang Longlong, Healy Eric, and Black Michael B. 2013. ‘Temporal concordance between apical and transcriptional points of departure for chemical risk assessment’, toxicological sciences, 134: 180–94. [DOI] [PubMed] [Google Scholar]
- Trochimowicz HJ, Loser E, Feron VJ, Clary JJ, and Valentine R. 1998. ‘CHRONIC INHALATION TOXICITY AND CARCINOGENICITY STUDIES ON-CHLOROPRENE IN RATS AND HAMSTERS’, Inhalation Toxicology, 10: 443–72. [Google Scholar]
- USEPA. 2006. ‘Approaches For the Application of Physiologically Based Pharmacokinetic (PBPK) Models and Supporting Data In Risk Assessment (Final Report).’, U.S. Environmental Protection Agency, Washington, D.C., EPA/600/R-05/043F. [Google Scholar]
- Van Ravenzwaay B, Hardwick TD, Needham D, Pethen S, and Lappin GJ. 2003. ‘Comparative metabolism of 2, 4-dichlorophenoxyacetic acid (2, 4-D) in rat and dog’, Xenobiotica, 33: 805–21. [DOI] [PubMed] [Google Scholar]
- Voisin Emmanuelle M, Ruthsatz Manfred, Collins Jerry M, and Hoyle Peter C. 1990. ‘Extrapolation of animal toxicity to humans: interspecies comparisons in drug development’, Regulatory Toxicology and Pharmacology, 12: 107–16. [DOI] [PubMed] [Google Scholar]
- WHO. 2010. ‘Characterization and application of physiologically based pharmacokinetic models in risk assessment’, World Health Organization, International Programme on Chemical Safety, Geneva, Switzerland. [Google Scholar]
- Yu Andrew B. C., and Shargel Leon. 2016. ‘Nonlinear Pharmacokinetics.’ in Shargel Leon and Yu Andrew B. C. (eds.), Applied Biopharmaceutics & Pharmacokinetics, 7e (McGraw-Hill Education: New York, NY: ). [Google Scholar]
Associated Data
This section collects any data citations, data availability statements, or supplementary materials included in this article.


