Abstract
Magnetotactic bacteria (MTB), which precisely bio-synthesize magnetosomes of magnetite or greigite nanoparticles, have attracted broad interdisciplinary interests in microbiology, magnetic materials, biotechnology and geobiology. Previous experimental and numerical investigations demonstrate a close link among MTB species, magnetosome crystal habits, and magnetic characteristics, but quantitative constraints are currently lacking. In this study, we build three-dimensional finite-element micromagnetic models of intact magnetosome chains in common MTB species and corresponding collapsed chains. Realistic numerical microstructures were constructed for the three typical biogenic magnetite crystal forms—cuboctahedron, prism and bullet. Our calculations reveal characteristic magnetic properties associated with specific magnetite crystal forms and MTB species. Cuboctahedron and bullet crystals show distinct low coercivity (less than 30 mT) and high coercivity (greater than 50 mT) clusters, respectively. Prismatic crystals have a broad range of hysteresis parameters that are strongly controlled by chain structure. This magnetic property clustering, combined with magnetic unmixing methods and electron microscopy observations, can fingerprint biogenic magnetite components in geological and environmental samples. The passive magnetic orientation efficiency of various magnetosome chains was calculated. Some bullet-shaped magnetosome chains have higher magnetic moments than those with cuboctahedron and prism magnetosomes, which may enable larger MTB cells to overcome viscous resistance for efficient magnetic navigation.
Keywords: magnetotactic bacteria, magnetite magnetosomes, magnetic properties, crystal morphology, micromagnetic simulation
1. Introduction
Magnetotactic bacteria (MTB) can move along geomagnetic field lines to more habitable aquatic environments [1]. This magnetic orientation function in bacteria is facilitated through the synthesis of magnetosomes, which are intracellular organelles composed of chain-arranged magnetic nanoparticles of magnetite (Fe3O4) or greigite (Fe3S4) enveloped by a lipid membrane [1,2]. The precise production of magnetosome nanoparticles with regular crystal forms and a relatively narrow size range are genetically controlled [1,3]. Interacting magnetic particles arranged in a chain produce a dipole moment approximately parallel to the chain axis, which interacts with the external magnetic field to determine the movement orientation of MTB [1,4]. After MTB death, magnetosome nanoparticles can be preserved as magnetofossils in sediments [5], which can record palaeomagnetic signals [6], palaeoenvironmental information [7–9] and ancient microbial activities [10]. Therefore, MTB provides a model system for studying the interface of biological, physical and geological processes.
So far hundreds of MTB species that synthesize various magnetite crystal morphologies (octahedral, cuboctahedral, elongated prismatic, bullet-shaped and tooth-shaped) have been found [2,11]. Li et al. [11] suggest that the species-specific nature of the crystal habit of biogenic magnetite can be used as a proxy for taxonomy to trace ancient microbial and environmental conditions. Additionally, magnetite morphology is also closely related to its magnetic properties [12,13]. Therefore, it is essential to establish the link among MTB species, crystal forms and magnetic properties.
Previous studies investigated experimentally the magnetic properties of common MTB species using laboratory-cultivated or wild-type MTB samples [14–18]. These experimental data provide important constraints on the biomineralization mechanism in MTB, and also contribute to the magnetic detection of magnetofossils in geological materials [14–16,18,19]. However, it is currently challenging to obtain pure enriched samples and systematic samples with controlled morphological parameters for many MTB species. Therefore, it is difficult to determine experimentally the systematic range of magnetic properties of varying magnetosome chains and morphologies. Recent development of micromagnetic methods enables quantitative calculations of the magnetic properties of magnetosome chains with changing morphological parameters [20,21], i.e. particle size, particle spacing, particle elongation and chain structure (straight chain, collapsed chain, and ring-shaped chain) [22–28]. However, the majority of simulation work relies on approximated chain models, while micromagnetic models with realistic chains are scarce, especially for the rarely simulated bullet-shaped magnetosome chains.
In this study, we apply a micromagnetic modelling approach [23] to calculate the magnetic properties of typical magnetite-producing MTB species. We select three typical magnetite crystal forms (cuboctahedron, prism and bullet) of MTB to build micromagnetic models using transmission electron microscopic (TEM) images of intact magnetosome chains and collapsed chains. Micromagnetic calculations are performed to determine the magnetic properties and navigation efficiency of biogenic magnetite synthesized by various MTB species.
2. Micromagnetic methods
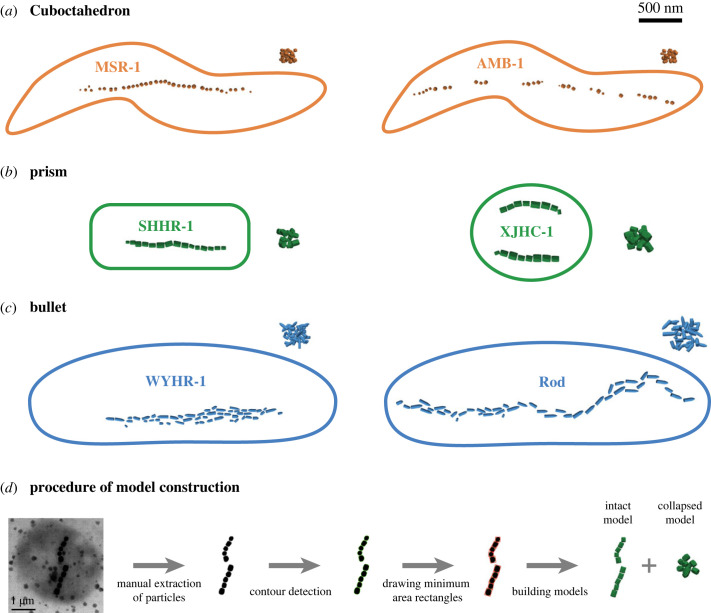
Biogenic magnetite has multiple crystal forms: cuboctahedral, octahedral, elongated prismatic, tooth-shaped and bullet-shaped [2,11]. Cuboctahedral and octahedral crystals usually have similar two-dimensional projections. The asymmetric two-dimensional projections of tooth-shaped and bullet-shaped crystals are also similar. Therefore, we simulate the three most typical crystal morphology categories of magnetite magnetosomes: cuboctahedron, prism and bullet [29]. We select two typical MTB species in each crystal morphology category: AMB-1 [11] and MSR-1 [3] for cuboctahedron, SHHR-1 [11] and XJHC-1 [30] for prism, WYHR-1 [31] and a rod MTB [2] for bullet (figure 1).
Figure 1.
Micromagnetic model constructions of intact biogenic magnetite chains with three crystal forms and the corresponding chain collapse models (a–c), and an example of model construction procedures based on microscopic images (d). Published transmission electron microscopic (TEM) images of six typical magnetotactic bacteria were used to create these models: (a) MSR-1 [3] and AMB-1 [11] for cuboctahedron magnetosomes, (b) SHHR-1 [11] and XJHC-1 [30] for prism magnetosomes, (c) WYHR-1 [31] and a rod MTB [2] for bullet magnetosomes. Green curves and red rectangles in (d) represent detected particle contours and recognized minimum area rectangles using the OpenCV-Python library, respectively.
Microstructure models of realistic intact chains were created based on TEM images of MTB using Trelis 16.3 (figure 1). The information about particle position, size and rotation angle of intact magnetosome chains (table 1) was obtained from TEM images using the computer vision library OpenCV-Python (figure 1d) following the approach of Bai et al. [23]. Bullet-shaped crystals in chains have variable overlap in the two-dimensional images. Therefore, we approximately segmented the overlapping particles. Moreover, we constructed chain collapse models by randomly distributing magnetosome particles in a cube space with controlled spacing (figure 1). These chain collapse models were used as one possible endmember to investigate the effect of chain deformation on magnetic properties, although other chain collapse modes are possible and may provide a closer match to observed magnetic properties [22]. We modelled a range of bullet-shaped particles with varying size and elongation to investigate the effect of crystal form on magnetic properties. Single crystal models with three crystal forms were built: bullet model-1, bullet model-2 and prism for comparison. The modelled bullet crystals have a flat base and a conical tip: bullet model-1 is created by connecting a cylinder and an elongated hemisphere; bullet model-2 only contains an elongated hemisphere. The prism model is used to compare with bullet particles with the same elongation to explore the influence of particle shape on magnetism. In addition, we built bullet models elongating along the [111] and [100] axes to investigate the effect of magnetocrystalline anisotropy. Magnetocrystalline anisotropy axes of magnetite were rotated according to their orientation.
Table 1.
Morphological information of biogenic magnetite from published transmission electron microscopic (TEM) images.
| crystal form | MTB type | references | length (nm) | width (nm) | elongation | gap (nm)a | particles # |
|---|---|---|---|---|---|---|---|
| cuboctahedron | MSR-1 | Uebe & Schüler [3] | 44.54 ± 8.17 | 41.87 ± 7.53 | 1.06 ± 0.06 | 6.08 ± 2.53 | 34 |
| cuboctahedron | AMB-1 | Li et al. [11] | 47.63 ± 10.99 | 42.37 ± 10.07 | 1.13 ± 0.11 | 7.11 ± 5.31 | 30 |
| prism | SHHR-1 | Li et al. [11] | 79.11 ± 16.73 | 58.96 ± 10.54 | 1.34 ± 0.14 | 5.06 ± 1.83 | 15 |
| prism | XJHC-1 | Liu et al. [30] | 100.63 ± 17.20 | 78.13 ± 15.14 | 1.30 ± 0.10 | 3.84 ± 1.86 | 16 |
| bullet | WYHR-1 | Li et al. [31] | 86.71 ± 29.22 | 35.69 ± 4.22 | 2.41 ± 0.72 | - | 50 |
| bullet | rod | Amor et al. [2] | 126.78 ± 32.64 | 42.28 ± 4.89 | 2.97 ± 0.66 | - | 44 |
aThe particle gap of bullet magnetosome chains cannot be effectively measured owing to irregular chain arrangement and multiple chain branching.
We use the finite element (FE) micromagnetic simulation software MERRILL (version 1.3.5) to calculate the magnetic properties [21]. MERRILL computes a magnetization distribution that minimizes the total magnetic free energy to determine the stable magnetic domain state [21]. The total magnetic free energy Etot, for the normalized magnetization vector M = (Mx, My, Mz), is given by
| 2.1 |
where A, K1 and Ms are the temperature-dependent material parameters for the exchange constant, the cubic magnetocrystalline anisotropy constant and the saturation magnetization, respectively; Hz and Hd are the external Zeeman field and the demagnetizing field, respectively [21,32]. More importantly, MERRILL can simulate magnetic particles with realistic and complex shapes in three dimensions using FE methods [21]. Hysteresis loops and back-field isothermal remanent magnetization (IRM) curves of all magnetosome chain models were calculated for all six types of MTB. First-order reversal curve (FORC) [33] diagrams were calculated for both intact and collapsed chain models of MSR-1, SHHR-1 and WYHR-1. Intact and collapsed models were subjected to external magnetic fields with 50 and 20 random directions, respectively. ParaView 5.5.2 was used to visualize the domain states [34].
3. Modelling results
3.1. Hysteresis loops and back-field curves
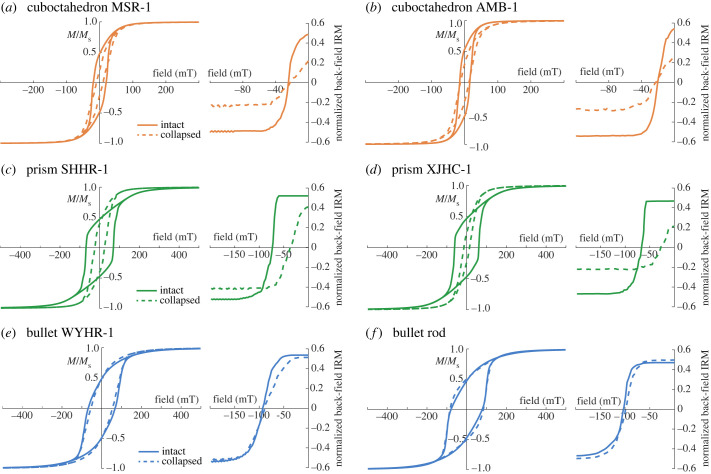
Micromagnetic simulation results indicate large changes in the coercivity (Bc), the coercivity of remanence (Bcr) and the ratio of saturation remanence to saturation magnetization (Mrs/Ms) with variable magnetosome crystal forms and chain structures (figure 2 and table 2). Average Bc and Bcr values of the intact chains with cuboctahedron, prism and bullet crystals are presented in table 2. Simulated Bc and Bcr values of intact prism chains and bullet chains are significantly larger than those of intact cuboctahedron chains (figure 2 and table 2). Average Mrs/Ms of the intact models is approximately 0.5 (table 2), indicating a dominant uniaxial anisotropy owing to chain arrangement.
Figure 2.
Simulated hysteresis loops and back-field isothermal remanent magnetization (IRM) curves averaged in multiple directions of all intact (solid lines) and collapsed (dashed lines) chain models.
Table 2.
Hysteresis parameters and magnetic alignment calculated in this study and experimental data of magnetotactic bacteria and magnetofossils.
| crystal form | MTB type | data source | Bc (mT) | Bcr (mT) | Mrs/Ms | m (10−15Am2) | m/Ms | ⟨cos θ⟩ |
|---|---|---|---|---|---|---|---|---|
| cuboctahedron | MSR-1 | intact model | 19 | 26 | 0.48 | 0.46 | 0.96 | 0.82 |
| cuboctahedron | MSR-1 | collapsed model | 10 | 24 | 0.22 | — | — | — |
| cuboctahedron | AMB-1 | intact model | 16 | 20 | 0.54 | 0.46 | 0.94 | 0.82 |
| cuboctahedron | AMB-1 | collapsed model | 13 | 22 | 0.30 | — | — | — |
| cuboctahedron | AMB-1 | experimenta | 19 | 23 | 0.46 | — | — | — |
| cuboctahedron | AMB-1 | experimentb | 18 | 23 | 0.45 | — | — | — |
| cuboctahedron | AMB-1 | experimentc | 31 | 37 | 0.50 | — | — | — |
| prism | SHHR-1 | intact model | 68 | 75 | 0.47 | 1.27 | 0.97 | 0.94 |
| prism | SHHR-1 | collapsed model | 24 | 39 | 0.40 | — | — | — |
| prism | XJHC-1 | intact model | 62 | 66 | 0.47 | 2.96 | 0.95 | 0.97 |
| prism | XJHC-1 | collapsed model | 15 | 27 | 0.24 | — | — | — |
| prism | MV-1 | experimentd | 36 | 44 | 0.47 | — | — | — |
| bullet | WYHR-1 | intact model | 67 | 96 | 0.49 | 1.29 | 0.98 | 0.94 |
| bullet | WYHR-1 | collapsed model | 53 | 90 | 0.48 | — | — | — |
| bullet | rod | intact model | 79 | 103 | 0.47 | 2.13 | 0.90 | 0.96 |
| bullet | rod | collapsed model | 85 | 98 | 0.50 | — | — | — |
| bullet | MYR-1 | experimente | 55 | 61 | 0.59 | — | — | — |
| – | magnetofossil | experimentf | 20 | 41 | 0.24 | — | — | — |
| – | magnetofossil | experimentf | 19 | 43 | 0.22 | — | — | — |
| – | magnetofossil | experimentf | 19 | 44 | 0.22 | — | — | — |
| – | magnetofossil | experimentg | 23 | 35 | 0.40 | — | — | — |
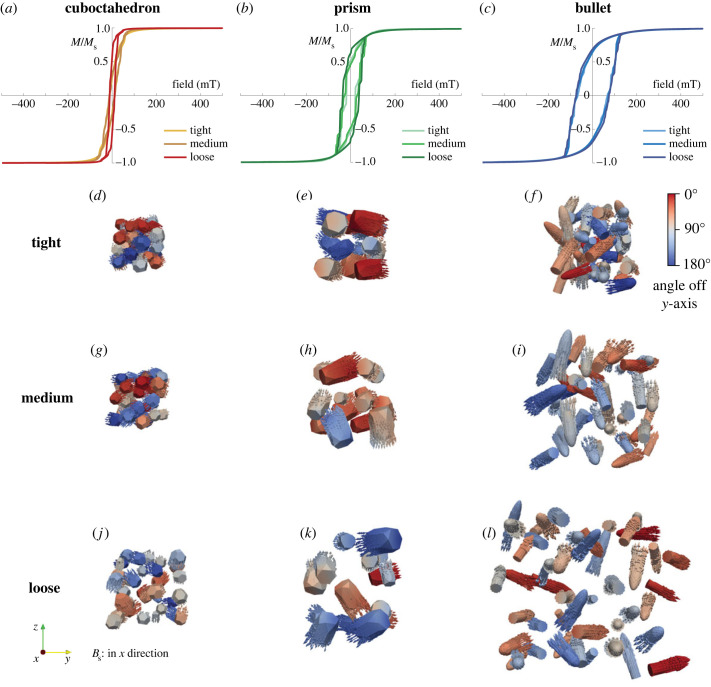
Collapsed models of both cuboctahedron and prism magnetosome chains have lower Bc and Mrs/Ms than intact chain models (figure 2 and table 2). Bc values of collapsed cuboctahedron models (from 19 to 10 mT for MSR-1 and from 16 to 13 mT for AMB-1, table 2) reduce less than prism models (from 68 to 24 mT for SHHR-1 and from 62 to 15 mT for XJHC-1, table 2). Mrs/Ms values of the two cuboctahedron models and XJHC-1 decrease to approximately 0.2–0.3, while this ratio of SHHR-1 only decreases to 0.4 (table 2). Bc values of the collapsed bullet models, however, do not decrease significantly or even increase slightly for some models (from 67 to 53 mT for WYHR-1 and from 79 to 85 mT for a rod MTB, table 2) with constant Mrs/Ms of approximately 0.5 (table 2). Bcr values of both cuboctahedron and bullet collapsed models are similar to the corresponding intact models (table 2). Collapsed prism models have significantly reduced Bcr compared with intact chain models (from 75 to 39 mT for SHHR-1 and from 66 to 27 mT for XJHC-1, table 2), which indicates that chain collapse has a much stronger influence on the prism magnetosome chains compared with other crystal forms. Decreasing particle spacing reduces the Mrs/Ms for both collapsed cuboctahedron and prism models (figure 3a,b), and reduces the Bc for collapsed prism models (figure 3b). However, particle spacing does not obviously affect hysteresis characteristics of bullet models (figure 3c).
Figure 3.
Simulated hysteresis loops and saturation remanent magnetization states of collapsed model for the three types of crystal forms with different spacing (tight, medium and loose). The colour bar represents the angle between the magnetic moment direction and the y-axis. Bs is the applied saturation magnetic field.
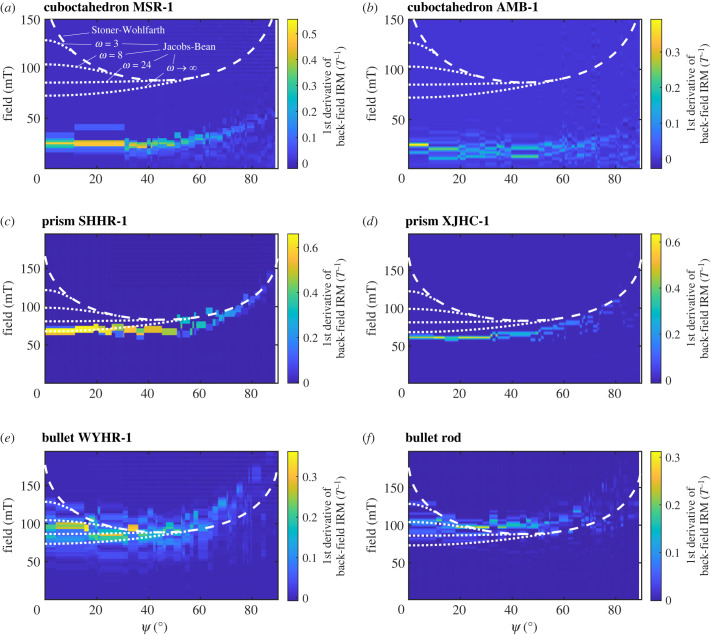
The switching field distributions calculated from the first derivative of modelled back-field IRM curves for all intact magnetosome chains show an angular dependence. Theoretical predictions using the Stoner–Wohlfarth [38] and the Jacobs–Bean [39,40] models were also calculated. The switching field of cuboctahedron chains is significantly lower than the predicted value (figure 4a,b), probably owing to the large interparticle distance. Our calculated switching fields are more consistent with prediction from the Jacobs–Bean model (figure 4a,b). The switching field of the prism and bullet chains agree well with the theoretical predictions from the Jacobs–Bean model (figure 4c–f).
Figure 4.
Switching field distribution from the first derivative of back-field isothermal remanent magnetization (IRM) curves for all intact chain models. Ψ is the angle between the applied field and the chain axis. Dashed lines and dotted lines are calculated from the Stoner–Wohlfarth model [38] and the Jacobs–Bean model [39,40] with varying ω (the ratio of saturation magnetization to magnetocrystalline anisotropy field) [40], respectively. Colour bars indicate the first derivative values of normalized back-field IRM for applied magnetic fields.
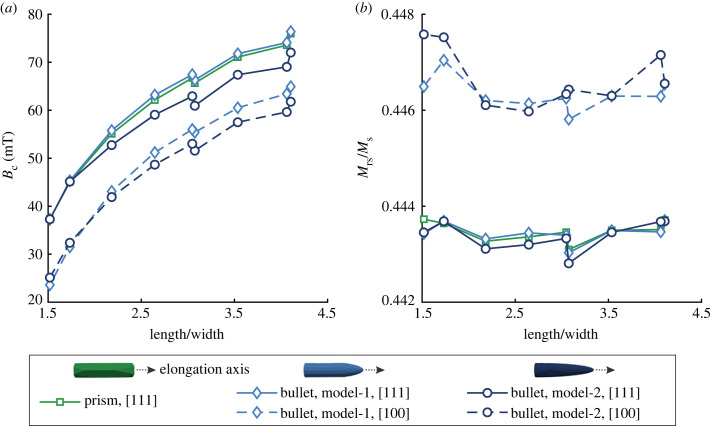
For the single-particle models, Bc values increase gradually with increasing aspect ratios because of the increase in shape anisotropy (figure 5a). Prism model and bullet model-1 (connecting of cylinder and hemisphere) have similar Bc values and are slightly larger than that of bullet model-2 (elongated hemisphere) with aspect ratios greater than 2 (figure 5a). This demonstrates that the shape of elongated crystals affects the magnetic properties less than the aspect ratio. Moreover, the Bc values of bullet crystals with the [111] elongation axes are approximately 10–15 mT larger than those of crystals elongating along the [100] direction (figure 5a), indicating the significant impact of different easy-axis directions and crystal elongation axis on magnetic properties. The Mrs/Ms of all single-particle models are approximately 0.44–0.45 (figure 5b).
Figure 5.
Simulated hysteresis parameters of single-particle models with different aspect ratios: (a) coercivity (Bc) and (b) the ratio of saturation remanence to saturation magnetization (Mrs/Ms). Single-particle bullet models include two geometric forms (bullet model-1 with connecting cylinder and hemisphere; bullet model-2 with elongated hemisphere) and two elongation axes ([111] and [100]).
3.2. Domain states
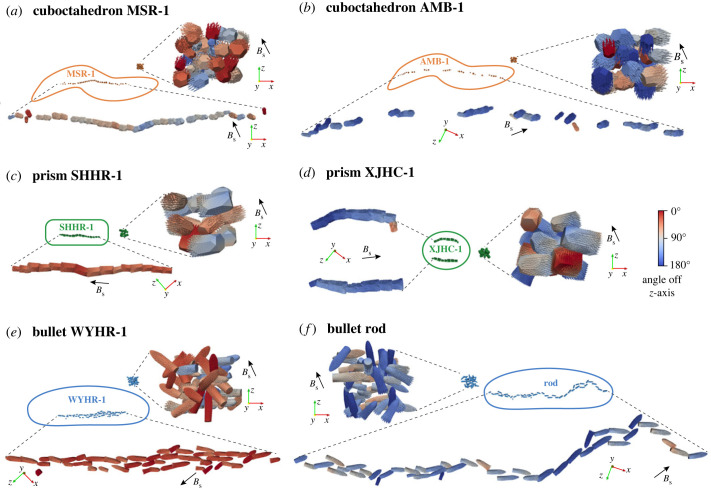
Magnetite particles in intact chain models are in single-domain states with magnetic moments aligned approximately along the chain direction (figure 6a–f), indicating a relatively strong magnetostatic interaction between adjacent particles along the chain direction. However, the distorted distribution of magnetic moment directions in collapsed chain models (figure 6a–f) and the presence of some vortex particles (figure 6d) point to magnetic interaction between particles along multiple directions.
Figure 6.
Modelled saturation remanent magnetization states of all intact and collapsed chain models. The black arrow represents the direction of the applied saturation magnetic field. The colour bar represents the angle between the magnetic moment direction and the z-axis. Bs is the applied saturation magnetic field.
3.3. First-order reversal curve diagrams
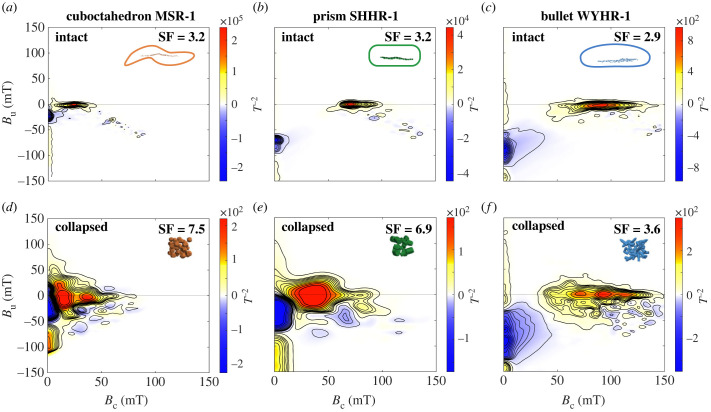
FORC diagrams of three intact chain models all show a narrow central ridge and a negative lower-left region (figure 7a–c). Central ridges of the prism (SHHR-1) and bullet models (WYHR-1) are more rightward distributed with higher coercivity than that of the cuboctahedron model (MSR-1, figure 7a–c). FORC diagrams of three collapsed models manifest the expansion of wings on both sides of the central ridge (figure 7d–f), indicating relatively strong magnetostatic interactions. The central ridge of the collapsed prism model shifts to the left with reduced coercivity relative to the intact SHHR-1 model (figure 7b,e). Compared with the intact WYHR-1 model, the central ridge of the collapsed bullet model does not change significantly (figure 7c,f).
Figure 7.
Micromagnetic simulation of first-order reversal curve (FORC) diagrams of intact and collapsed chain models of MSR-1 (a,d), SHHR-1 (b,e), and WYHR-1 (c,f). FORCs were processed using the Forcot software [41]. The smoothing factor (SF) is indicated.
4. Discussion and conclusion
4.1. Linkages between magnetosome crystal morphology and magnetic properties
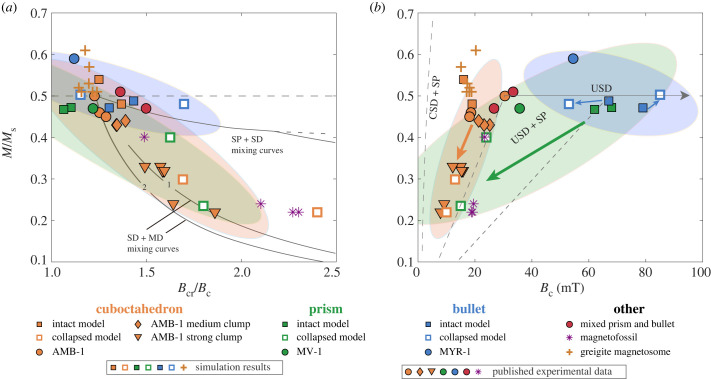
We plotted simulated hysteresis parameters of intact magnetosome chain models and strong collapse models for different MTB species in the Day diagram (figure 8a) [42] and the Néel diagram (figure 8b) [43]. Different crystal forms show less obvious clustering in the Day diagram because of the overlapping Bc/Bcr (figure 8a). In contrast, magnetosome chains with three crystal forms show a clear linkage to their hysteresis parameter ranges in the Néel diagram (figure 8b). This demonstrates that the Néel diagram is a better tool for the magnetic identification of magnetosome crystal morphologies. Cuboctahedron magnetosome chains show specific clustering regions in the Néel diagram (figure 8b): data for cuboctahedron magnetosome chains have typically low coercivity (less than 30 mT) and move to the lower-left region with decreasing Bc and Mrs/Ms during chain collapse. This is mainly owing to the large spacing between cuboctahedron particles in chains, which significantly reduces the coercivity [24,46]. The simulated coercivity of AMB-1 (16 mT) is close to the experimental data of the cultured AMB-1 (18–31 mT) [16,35,36]. Bullet magnetosomes in both intact and collapsed chains show distinct magnetic properties (figure 8b): high coercivity (53–85 mT), Mrs/Ms of approximately 0.5, and not obviously affected by chain collapse, which is consistent with the measured coercivity (55 mT) of MYR-1 synthesizing bullet-shaped magnetite [15]. This indicates that the magnetic properties of bullet-shaped magnetite are dominated by uniaxial anisotropy owing to their higher elongations (table 1). Simulated hysteresis parameters of prism magnetosome chains have a wide distribution and partially coincide with cuboctahedron and bullet, mostly owing to a more pronounced effect of chain collapse on prism chains (figure 8b). The experimental coercivity data of MV-1 (36 mT) [14] is lower than that of the simulated prism magnetosome chains (68 mT for SHHR-1 and 62 mT for XJHC-1), probably because of the larger spacing between the magnetite particles in the MV-1 chain which reduces the coercivity [24]. Moreover, the micromagnetic simulation results of Bai et al. [23] indicate a coercivity range of approximately 15–21 mT for greigite magnetosomes, which partially overlaps with the range calculated for the cuboctahedron magnetosome in this study (figure 8b).
Figure 8.
(a) Day diagram [42] and (b) Néel diagram [43] of simulation results in this study (square) and greigite magnetosomes (cross) [23], and published experimental data of magnetotactic bacteria (circle, diamond, and inverted triangle) and magnetofossils (star) [7,14–16,18,37]. Reference lines in the Day diagram and the Néel diagram are adapted from Dunlop [44] and Tauxe et al. [45], respectively. Elliptical regions are the 90% confidence ellipses of all data of each crystal form. Orange, green and blue arrows indicate data trends from intact chain models to collapsed chain models. CSD, cubic single domain; MD, multidomain; SD, single domain; SP, superparamagnetic; USD, uniaxial single domain.
Previous studies indicate a correlation between the crystal habits of biogenic magnetite or greigite and MTB species owing to a strong genetically controlled biomineralization [2,11,30,47,48]. For example, Desulfobacterota phylum and Nitrospirota phylum synthesize straight bullet-shaped and curved bullet-shaped magnetite, respectively [48]. Moreover, MTB have been widely found in various modern aquatic and sedimentary environments [47,49]. In this study, the micromagnetic simulation method based on TEM images can accurately predict the magnetic properties of typical MTB. These magnetic parameters can be used to indicate the crystal morphology of biogenic magnetite, thereby tracing possible MTB species and living environments. However, the correlation among crystal morphology of biogenic magnetite, MTB species and ecology has not been systematically demonstrated owing to the high diversity of MTB species, so a systematic database needs to be established in the future.
4.2. Implications for magnetofossil identification
It is challenging to directly identify in situ magnetofossils in sediments or rocks owing to their nanoscale size. Extracting in situ magnetofossil information currently relies on rock magnetic techniques, such as principal component analysis of FORC diagrams (FORC-PCA) [50,51] and IRM unmixing [7,8,37,52,53]. Our simulation results demonstrate that the clustering regions in the Néel diagram can be used to distinguish the crystal morphologies of biogenic magnetite (figure 8b), and thereby constrain the interpretation of magnetofossil components using magnetic unmixing methods. Furthermore, based on the species specificity of crystal habits of modern MTB discussed in §4.1, this clustering relationship of magnetic signals has the potential to infer possible ancient MTB species of magnetofossils and palaeoecological information.
Previous investigations have identified two typical IRM components of biogenic magnetite in natural samples: lower-coercivity biogenic soft (BS) and higher-coercivity biogenic hard (BH) [52]. BS and BH were considered to represent equant and elongated biogenic magnetite, respectively [52,54–56]. Moreover, recent micromagnetic studies indicate that BH and BS could also be produced by different magnetosome chain structures [25]. Our modelling results provide new constraints for the morphological characteristics of biogenic magnetite indicated by BH and BS: (i) BS represents cuboctahedral biogenic magnetite (both straight and strongly collapsed chains) and prismatic biogenic magnetite with collapsed chain structure; (ii) BH corresponds to all bullet-shaped biogenic magnetite (both straight and strongly collapsed chains), as well as prismatic biogenic magnetite tightly arranged in an approximately straight chain (figure 8b). Clearly, BS and BH components originate from both biogenic magnetite crystal morphologies and chain structures. Moreover, some of the soft magnetic components may also originate from greigite magnetofossils (figure 8b) [23]. Thus, electron microscopy is needed to directly identify biogenic magnetite or greigite in sediments, and the origin of the BH and BS components.
Experimental data of magnetofossils are located in the confidence ellipse of cuboctahedron and prism in the Néel diagram (figure 8b), indicating that they are dominant in sediments, while the contributions from bullet-shaped particles or prism particles tightly arranged in linear chains, i.e. represented by BH, are relatively small. Moreover, FORC diagram is also helpful to distinguish the in situ chain structure of magnetofossils to determine whether there is possible chain collapse (figure 7) [22,25,26]. For complicated natural samples containing various magnetic minerals, the magnetic approach proposed in this study needs to be combined with other rock magnetic techniques (e.g. FORC-PCA [50,51] and IRM unmixing [52,53]) and microscopic observations to identify magnetic mineral phases.
4.3. Magnetic orientation in magnetotactic bacteria
The magnetic dipole moment of magnetosome chains is used by MTB to orient passively along the external magnetic field [4]. The magnetic energy between the magnetic moment m and the external magnetic field B should exceed thermal energy kBT (Boltzmann constant kB multiplied by temperature T) to overcome the rotational Brownian motion. The alignment angle θ between m and B can be evaluated using the Langevin function [57]
| 4.1 |
Higher values of 〈cos θ〉 close to 1 indicate a more optimal passive magnetic orientation to the external magnetic field. We calculated the 〈cos θ〉 values for the three modelled MTB using the simulated magnetic dipole moment of magnetosome chains: 0.82 for MSR-1 and AMB-1, 0.94 for SHHR-1 and 0.97 for XJHC-1, and 0.94 for WYHR-1 and 0.96 for a rod MTB (table 2). These results indicate that MTB with a larger total volume of magnetite in chains has a higher degree of passive orientation.
In contrast to chains containing cuboctahedra and prisms, the chain arrangement of bullet-shaped magnetite is more disordered and the crystal elongation direction is the hard axis [001] rather than the easy axis [111] for some MTB species [11,58]. Our simulation results show that the magnetic properties of bullet-shaped particles are dominated by shape anisotropy (i.e. elongation), as predicted by the previous theoretical model [59]. Thus, bullet magnetosome chains are more resilient to deviations from perfect chains owing to their high elongations. Simulated bullet and prism magnetosome chains have similar magnetotactic efficiency (approx. 0.95). Therefore, relatively disordered particle arrangement in the chain and elongation along the hard axis do not affect the magnetotactic efficiency of bullet-shaped magnetosomes. Moreover, some large MTB cells, such as giant rod MTB [15,60], produce hundreds of bullet-shaped magnetite crystals with a strong magnetic moment to overcome the viscous resistance [60]. MTB living in sediments need an even larger magnetic moment for magnetic navigation owing to higher viscous drag and poor geomagnetic alignment [61]. Therefore, our simulation results indicate that the bullet-synthesizing MTB can provide a sufficient magnetic moment to adapt to their larger cell volume and complex living environment, even when the chain deviates from the easy axis and perfect arrangement.
Acknowledgements
We thank Editor Tim Holt for efficient editorial handling, and two anonymous referees for providing constructive comments that improved this paper.
Ethics
This work did not require ethical approval from a human subject or animal welfare committee.
Data accessibility
Relevant data and code are available from the Zenodo repository: https://doi.org/10.5281/zenodo.7960534 [62].
Declaration of AI use
We have not used AI-assisted technologies in creating this article.
Authors' contributions
Z.P.: data curation, formal analysis, investigation, methodology, software, validation, visualization, writing—original draft, writing—review and editing; L.C.: conceptualization, funding acquisition, investigation, resources, supervision, writing—review and editing; F.B.: investigation, methodology, software; R.J.H.: investigation, supervision, writing—review and editing.
All authors gave final approval for publication and agreed to be held accountable for the work performed therein.
Conflict of interest declaration
We declare we have no competing interests.
Funding
This study was supported by a National Natural Science Foundation (NSFC) grant (grant no. 41974074) to L.C., and by a Royal Society-Newton Advanced Fellowship (to L.C. and R.J.H.) jointly funded by the Royal Society (grant no. NAF\R1\201096) and the NSFC (grant no. 42061130214).
References
- 1.Bazylinski DA, Frankel RB. 2004. Magnetosome formation in prokaryotes. Nat. Rev. Microbiol. 2, 217-230. ( 10.1038/nrmicro842) [DOI] [PubMed] [Google Scholar]
- 2.Amor M, Mathon FP, Monteil CL, Busigny V, Lefevre CT. 2020. Iron-biomineralizing organelle in magnetotactic bacteria: function, synthesis and preservation in ancient rock samples. Environ. Microbiol. 22, 3611-3632. ( 10.1111/1462-2920.15098) [DOI] [PubMed] [Google Scholar]
- 3.Uebe R, Schüler D. 2016. Magnetosome biogenesis in magnetotactic bacteria. Nat. Rev. Microbiol. 14, 621-637. ( 10.1038/nrmicro.2016.99) [DOI] [PubMed] [Google Scholar]
- 4.Klumpp S, Lefèvre CT, Bennet M, Faivre D. 2019. Swimming with magnets: from biological organisms to synthetic devices. Phys. Rep. 789, 1-54. ( 10.1016/j.physrep.2018.10.007) [DOI] [Google Scholar]
- 5.Kopp RE, Kirschvink JL. 2008. The identification and biogeochemical interpretation of fossil magnetotactic bacteria. Earth-Sci. Rev. 86, 42-61. ( 10.1016/j.earscirev.2007.08.001) [DOI] [Google Scholar]
- 6.Heslop D, Roberts AP, Chang L, Davies M, Abrajevitch A, De Deckker P. 2013. Quantifying magnetite magnetofossil contributions to sedimentary magnetizations. Earth Planet. Sci. Lett. 382, 58-65. ( 10.1016/j.epsl.2013.09.011) [DOI] [Google Scholar]
- 7.Chang L, Harrison RJ, Zeng F, Berndt TA, Roberts AP, Heslop D, Zhao X. 2018. Coupled microbial bloom and oxygenation decline recorded by magnetofossils during the Palaeocene–Eocene Thermal Maximum. Nat. Commun. 9, 4007. ( 10.1038/s41467-018-06472-y) [DOI] [PMC free article] [PubMed] [Google Scholar]
- 8.Roberts AP, Florindo F, Villa G, Chang L, Jovane L, Bohaty SM, Larrasoaña JC, Heslop D, Fitz Gerald JD. 2011. Magnetotactic bacterial abundance in pelagic marine environments is limited by organic carbon flux and availability of dissolved iron. Earth Planet. Sci. Lett. 310, 441-452. ( 10.1016/j.epsl.2011.08.011) [DOI] [Google Scholar]
- 9.Yamazaki T, Kawahata H. 1998. Organic carbon flux controls the morphology of magnetofossils in marine sediments. Geology 26, 1064-1066. () [DOI] [Google Scholar]
- 10.Chang SBR, Kirschvink JL. 1989. Magnetofossils, the magnetization of sediments, and the evolution of magnetite biomineralization. Annu. Rev. Earth Planet. Sci. 17, 169-195. ( 10.1146/annurev.earth.17.1.169) [DOI] [Google Scholar]
- 11.Li J, et al. 2020. Bullet-shaped magnetite biomineralization within a magnetotactic deltaproteobacterium: implications for magnetofossil identification. J. Geophys. Res.: Biogeosci. 125, e2020JG005680. ( 10.1029/2020jg005680) [DOI] [Google Scholar]
- 12.Muxworthy AR, Williams W. 2006. Critical single-domain/multidomain grain sizes in noninteracting and interacting elongated magnetite particles: implications for magnetosomes. J. Geophys. Res.: Solid Earth 111, B12S12. ( 10.1029/2006jb004588) [DOI] [Google Scholar]
- 13.Muxworthy AR, Williams W. 2008. Critical superparamagnetic/single-domain grain sizes in interacting magnetite particles: implications for magnetosome crystals. J. R. Soc. Interface 6, 1207-1212. ( 10.1098/rsif.2008.0462) [DOI] [PMC free article] [PubMed] [Google Scholar]
- 14.Jovane L, Florindo F, Bazylinski DA, Lins U. 2012. Prismatic magnetite magnetosomes from cultivated Magnetovibrio blakemorei strain MV-1: a magnetic fingerprint in marine sediments? Environ. Microbiol. Rep. 4, 664-668. ( 10.1111/1758-2229.12000) [DOI] [PubMed] [Google Scholar]
- 15.Li J, et al. 2010. Biomineralization, crystallography and magnetic properties of bullet-shaped magnetite magnetosomes in giant rod magnetotactic bacteria. Earth Planet. Sci. Lett. 293, 368-376. ( 10.1016/j.epsl.2010.03.007) [DOI] [Google Scholar]
- 16.Li J, Wu W, Liu Q, Pan Y. 2012. Magnetic anisotropy, magnetostatic interactions and identification of magnetofossils. Geochem. Geophys. Geosyst. 13, 1-16. ( 10.1029/2012gc004384) [DOI] [Google Scholar]
- 17.Moskowitz BM, Frankel RB, Bazylinski DA. 1993. Rock magnetic criteria for the detection of biogenic magnetite. Earth Planet. Sci. Lett. 120, 283-300. ( 10.1016/0012-821x(93)90245-5) [DOI] [Google Scholar]
- 18.Pan Y, Petersen N, Winklhofer M, Davila AF, Liu Q, Frederichs T, Hanzlik M, Zhu R. 2005. Rock magnetic properties of uncultured magnetotactic bacteria. Earth Planet. Sci. Lett. 237, 311-325. ( 10.1016/j.epsl.2005.06.029) [DOI] [Google Scholar]
- 19.Chang L, Winklhofer M, Roberts AP, Heslop D, Florindo F, Dekkers MJ, Krijgsman W, Kodama K, Yamamoto Y. 2013. Low-temperature magnetic properties of pelagic carbonates: oxidation of biogenic magnetite and identification of magnetosome chains. J. Geophys. Res.: Solid Earth 118, 6049-6065. ( 10.1002/2013jb010381) [DOI] [Google Scholar]
- 20.Harrison RJ, Lascu I. 2014. FORCulator: a micromagnetic tool for simulating first-order reversal curve diagrams. Geochem. Geophys. Geosyst. 15, 4671-4691. ( 10.1002/2014gc005582) [DOI] [Google Scholar]
- 21.Ó Conbhuí P , Williams W, Fabian K, Ridley P, Nagy L, Muxworthy AR. 2018. MERRILL: micromagnetic earth related robust interpreted language laboratory. Geochem. Geophys. Geosyst. 19, 1080-1106. ( 10.1002/2017gc007279) [DOI] [PMC free article] [PubMed] [Google Scholar]
- 22.Amor M, Wan J, Egli R, Carlut J, Gatel C, Andersen IM, Snoeck E, Komeili A. 2022. Key signatures of magnetofossils elucidated by mutant magnetotactic bacteria and micromagnetic calculations. J. Geophys. Res.: Solid Earth 127, 1-30. ( 10.1029/2021jb023239) [DOI] [PMC free article] [PubMed] [Google Scholar]
- 23.Bai F, Chang L, Pei Z, Harrison RJ, Winklhofer M. 2022. Magnetic biosignatures of magnetosomal greigite from micromagnetic calculation. Geophys. Res. Lett. 49, e2022GL098437. ( 10.1029/2022gl098437) [DOI] [Google Scholar]
- 24.Berndt TA, Chang L, Pei Z. 2020. Mind the gap: Towards a biogenic magnetite palaeoenvironmental proxy through an extensive finite-element micromagnetic simulation. Earth Planet. Sci. Lett. 532, 116010. ( 10.1016/j.epsl.2019.116010) [DOI] [Google Scholar]
- 25.Chang L, Harrison RJ, Berndt TA. 2019. Micromagnetic simulation of magnetofossils with realistic size and shape distributions: linking magnetic proxies with nanoscale observations and implications for magnetofossil identification. Earth Planet. Sci. Lett. 527, 1-12. ( 10.1016/j.epsl.2019.115790) [DOI] [Google Scholar]
- 26.Pei Z, Berndt TA, Chang L, Bai F, Williams W, Paterson GA. 2022. Bending and collapse: magnetic recording fidelity of magnetofossils from micromagnetic simulation. J. Geophys. Res.: Solid Earth 127, e2021JB023447. ( 10.1029/2021jb023447) [DOI] [Google Scholar]
- 27.Witt A, Fabian K, Bleil U. 2005. Three-dimensional micromagnetic calculations for naturally shaped magnetite: octahedra and magnetosomes. Earth Planet. Sci. Lett. 233, 311-324. ( 10.1016/j.epsl.2005.01.043) [DOI] [Google Scholar]
- 28.Zingsem BW, Feggeler T, Terwey A, Ghaisari S, Spoddig D, Faivre D, Meckenstock R, Farle M, Winklhofer M. 2019. Biologically encoded magnonics. Nat. Commun. 10, ARTN 4345. ( 10.1038/s41467-019-12219-0) [DOI] [PMC free article] [PubMed] [Google Scholar]
- 29.Pei Z, Chang L, Xue P, Harrison RJ. 2022. MagNet: automated magnetic mineral grain morphometry using convolutional neural network. Geophys. Res. Lett. 49, e2022GL099118. ( 10.1029/2022gl099118) [DOI] [Google Scholar]
- 30.Liu P, et al. 2021. Diverse phylogeny and morphology of magnetite biomineralized by magnetotactic cocci. Environ. Microbiol. 23, 1115-1129. ( 10.1111/1462-2920.15254) [DOI] [PubMed] [Google Scholar]
- 31.Li J, Zhang H, Liu P, Menguy N, Roberts AP, Chen HT, Wang YZ, Pan Y. 2019. Phylogenetic and structural identification of a novel Magnetotactic Deltaproteobacteria strain, WYHR-1, from a freshwater lake. Appl. Environ. Microbiol. 85, 1-11. ( 10.1128/AEM.00731-19) [DOI] [PMC free article] [PubMed] [Google Scholar]
- 32.Nagy L, Williams W, Muxworthy AR, Fabian K, Almeida TP, Ó Conbhuí P, Shcherbakov VP. 2017. Stability of equidimensional pseudo–single-domain magnetite over billion-year timescales. Proc. Natl Acad. Sci. USA 114, 10 356-10 360. ( 10.1073/pnas.1708344114). [DOI] [PMC free article] [PubMed] [Google Scholar]
- 33.Roberts AP, Pike CR, Verosub KL. 2000. First-order reversal curve diagrams: a new tool for characterizing the magnetic properties of natural samples. J. Geophys. Res. 105, 28 461-28 475. ( 10.1029/2000jb900326) [DOI] [Google Scholar]
- 34.Ahrens J, Geveci B, Law C. 2005. ParaView: an end-user tool for large data visualization. In Visualization handbook (eds Hansen CD, Johnson CR), pp. 717-731. Burlington, MA: Elsevier. [Google Scholar]
- 35.Li J, Pan Y, Liu Q, Qin H, Deng C, Che R, Yang X. 2009. A comparative study of magnetic properties between whole cells and isolated magnetosomes of Magnetospirillum magneticum AMB-1. Chin. Sci. Bull. 55, 38-44. ( 10.1007/s11434-009-0333-x) [DOI] [Google Scholar]
- 36.Li J, Pan Y, Chen G, Liu Q, Tian L, Lin W. 2009. Magnetite magnetosome and fragmental chain formation of Magnetospirillum magneticum AMB-1: transmission electron microscopy and magnetic observations. Geophys. J. Int. 177, 33-42. ( 10.1111/j.1365-246X.2009.04043.x) [DOI] [Google Scholar]
- 37.Ludwig P, Egli R, Bishop S, Chernenko V, Frederichs T, Rugel G, Merchel S, Orgeira MJ. 2013. Characterization of primary and secondary magnetite in marine sediment by combining chemical and magnetic unmixing techniques. Global Planet. Change 110, 321-339. ( 10.1016/j.gloplacha.2013.08.018) [DOI] [Google Scholar]
- 38.Stoner EC, Wohlfarth EP. 1948. A mechanism of magnetic hysteresis in heterogeneous alloys. Philos. Trans. R. Soc. A Math. Phys. Sci. 240, 599-642. ( 10.1098/rsta.1948.0007) [DOI] [Google Scholar]
- 39.Jacobs IS, Bean CP. 1955. Approach to elongated fine-particle magnets. Phys. Rev. 100, 1060-1067. ( 10.1103/PhysRev.100.1060) [DOI] [Google Scholar]
- 40.Richter HJ. 1996. Analytical formulae of switching fields for fanning in a chain of spheres. J. Magn. Magn. Mater. 154, 263-270. ( 10.1016/0304-8853(95)00611-7) [DOI] [Google Scholar]
- 41.Berndt TA, Chang L. 2019. Waiting for Forcot: accelerating FORC processing 100× using a fast-Fourier-transform algorithm. Geochem. Geophys. Geosyst. 20, 6223-6233. ( 10.1029/2019gc008380) [DOI] [Google Scholar]
- 42.Day R, Fuller M, Schmidt VA. 1977. Hysteresis properties of titanomagnetites: grain-size and compositional dependence. Phys. Earth Planet. In. 13, 260-267. ( 10.1016/0031-9201(77)90108-X) [DOI] [Google Scholar]
- 43.Néel L. 1955. Some theoretical aspects of rock-magnetism. Adv. Phys. 4, 191-243. ( 10.1080/00018735500101204) [DOI] [Google Scholar]
- 44.Dunlop DJ. 2002. Theory and application of the Day plot (Mrs/Ms versus Hcr/Hc) 1. Theoretical curves and tests using titanomagnetite data. J. Geophys. Res. 107, EPM-4. ( 10.1029/2001jb000486) [DOI] [Google Scholar]
- 45.Tauxe L, Bertram HN, Seberino C. 2002. Physical interpretation of hysteresis loops: micromagnetic modeling of fine particle magnetite. Geochem. Geophys. Geosyst. 3, 1-22. ( 10.1029/2001gc000241) [DOI] [Google Scholar]
- 46.Hanzlik M, Winklhofer M, Petersen N. 2002. Pulsed-field-remanence measurements on individual magnetotactic bacteria. J. Magn. Magn. Mater. 248, 258-267. ( 10.1016/S0304-8853(02)00353-0) [DOI] [Google Scholar]
- 47.Lefèvre CT, Bazylinski DA. 2013. Ecology, diversity, and evolution of magnetotactic bacteria. Microbiol. Mol. Biol. Rev. 77, 497-526. ( 10.1128/mmbr.00021-13) [DOI] [PMC free article] [PubMed] [Google Scholar]
- 48.Liu P, et al. 2023. Key gene networks that control magnetosome biomineralization in magnetotactic bacteria. Natl. Sci. Rev. 10, 1-12. ( 10.1093/nsr/nwac238) [DOI] [PMC free article] [PubMed] [Google Scholar]
- 49.Lin W, Pan Y, Bazylinski DA. 2017. Diversity and ecology of and biomineralization by magnetotactic bacteria. Environ. Microbiol. Rep. 9, 345-356. ( 10.1111/1758-2229.12550) [DOI] [PubMed] [Google Scholar]
- 50.Harrison RJ, Muraszko J, Heslop D, Lascu I, Muxworthy AR, Roberts AP. 2018. An improved algorithm for unmixing first-order reversal curve diagrams using principal component analysis. Geochem. Geophys. Geosyst. 19, 1595-1610. ( 10.1029/2018gc007511) [DOI] [Google Scholar]
- 51.Lascu I, Harrison RJ, Li Y, Muraszko JR, Channell JET, Piotrowski AM, Hodell DA. 2015. Magnetic unmixing of first-order reversal curve diagrams using principal component analysis. Geochem. Geophys. Geosyst. 16, 2900-2915. ( 10.1002/2015gc005909) [DOI] [Google Scholar]
- 52.Egli R. 2004. Characterization of individual rock magnetic components by analysis of remanence curves, 1. Unmixing natural sediments. Stud. Geophys. Geod. 48, 391-446. ( 10.1023/B:SGEG.0000020839.45304.6d) [DOI] [Google Scholar]
- 53.Egli R. 2004. Characterization of individual rock magnetic components by analysis of remanence curves. 3. Bacterial magnetite and natural processes in lakes. Phys. Chem. Earth 29, 869-884. ( 10.1016/j.pce.2004.03.010) [DOI] [Google Scholar]
- 54.He K, Pan Y. 2020. Magnetofossil abundance and diversity as paleoenvironmental proxies: a case study from southwest Iberian margin sediments. Geophys. Res. Lett. 47, e2020GL087165. ( 10.1029/2020gl087165) [DOI] [Google Scholar]
- 55.Lascu I, Plank C. 2013. A new dimension to sediment magnetism: charting the spatial variability of magnetic properties across lake basins. Global Planet. Change 110, 340-349. ( 10.1016/j.gloplacha.2013.03.013) [DOI] [Google Scholar]
- 56.Yamazaki T, Ikehara M. 2012. Origin of magnetic mineral concentration variation in the Southern Ocean. Paleoceanography 27, PA2206. ( 10.1029/2011pa002271) [DOI] [Google Scholar]
- 57.Frankel RB. 1984. Magnetic guidance of organisms. Annu. Rev. Biophys. Bioeng. 13, 85-103. [DOI] [PubMed] [Google Scholar]
- 58.Li J, Menguy N, Gatel C, Boureau V, Snoeck E, Patriarche G, Leroy E, Pan Y. 2015. Crystal growth of bullet-shaped magnetite in magnetotactic bacteria of the Nitrospirae phylum. J. R. Soc. Interface 12, 20141288. ( 10.1098/rsif.2014.1288) [DOI] [PMC free article] [PubMed] [Google Scholar]
- 59.Kornig A, Winklhofer M, Baumgartner J, Gonzalez TP, Fratzl P, Faivre D. 2014. Magnetite crystal orientation in magnetosome chains. Adv. Funct. Mater. 24, 3926-3932. ( 10.1002/adfm.201303737) [DOI] [PMC free article] [PubMed] [Google Scholar]
- 60.Hanzlik M, Winklhofer M, Petersen N. 1996. Spatial arrangement of chains of magnetosomes in magnetotactic bacteria. Earth Planet. Sci. Lett. 145, 125-134. ( 10.1016/S0012-821x(96)00191-4) [DOI] [Google Scholar]
- 61.Mao X, Egli R, Petersen N, Hanzlik M, Zhao X. 2014. Magnetotaxis and acquisition of detrital remanent magnetization by magnetotactic bacteria in natural sediment: first experimental results and theory. Geochem. Geophys. Geosyst. 15, 255-283. ( 10.1002/2013gc005034) [DOI] [Google Scholar]
- 62.Pei Z. 2023. Micromagnetic calculation of the magnetite magnetosome in magnetotactic bacteria. Zenodo. ( 10.5281/zenodo.7960534) [DOI] [PMC free article] [PubMed]
Associated Data
This section collects any data citations, data availability statements, or supplementary materials included in this article.
Data Citations
- Pei Z. 2023. Micromagnetic calculation of the magnetite magnetosome in magnetotactic bacteria. Zenodo. ( 10.5281/zenodo.7960534) [DOI] [PMC free article] [PubMed]
Data Availability Statement
Relevant data and code are available from the Zenodo repository: https://doi.org/10.5281/zenodo.7960534 [62].


