Abstract
Aim:
Ureteral obstruction leads to significant changes in kidney renin expression. It is unclear whether those changes are responsible for the progression of kidney damage, repair, or regeneration. In the current study, we aimed to elucidate the contribution of renin-producing cells (RPCs) and the cells of renin lineage (CoRL) towards kidney damage and regeneration using a model of partial and reversible unilateral ureteral obstruction (pUUO) in neonatal mice.
Methods:
Renin cells are progenitors for other renal cell types collectively called CoRL. We labeled the CoRL with Green Fluorescent Protein (GFP) using genetic approaches. We performed lineage tracing to analyze the changes in the distribution of CoRL during and after the release of obstruction. We also ablated the RPCs and CoRL by cell-specific expression of Diptheria Toxin Sub-unit A (DTA). Finally, we evaluated the kidney damage and regeneration during and after the release of obstruction in the absence of CoRL.
Results:
In the obstructed kidneys, there was a 163% increase in the renin-positive area and a remarkable increase in the distribution of GFP+ CoRL. Relief of obstruction abrogated these changes. In addition, DTA-expressing animals did not respond to pUUO with increased RPCs and CoRL. Moreover, reduction in CoRL significantly compromised the kidney’s ability to recover from the damage after the release of obstruction.
Conclusions:
CoRL play a role in the regeneration of the kidneys post-relief of obstruction.
Keywords: Obstructive nephropathy, lineage tracing, renin cells, cells of renin lineage, kidney regeneration
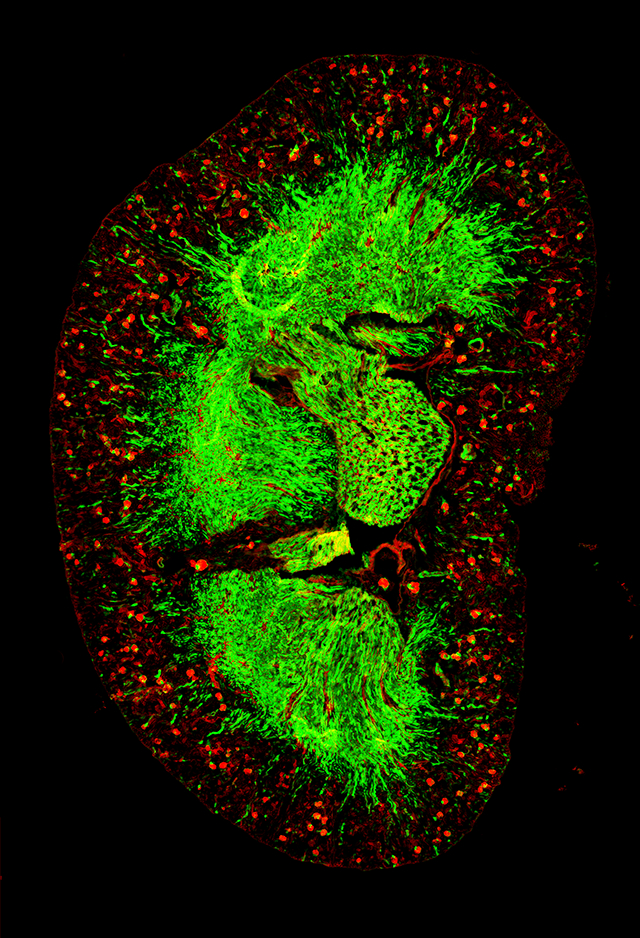
Graphical Abstract
1. Introduction
Ureteral obstruction injury is accompanied by hydronephrosis, renal hypoplasia, and dysplasia. Following obstruction, marked changes in gene expression and the epigenetic landscape lead to severe tissue remodeling that culminates in end-stage renal disease. Studies on animal models to intervene in this condition by surgically releasing the obstruction offer the opportunity to understand the cell fate changes and molecular components driving kidney regeneration and repair. The neonatal partial unilateral ureteral obstruction (pUUO) model in rodents simulates obstructive nephropathy in the developing human fetus with the progression to renal disease in children1.
Our previous studies using the pUUO model in neonatal mice identified that persistent obstruction leads to substantial renal damage and loss of vascular and tubular structures. The release of obstruction resulted in a remarkable recovery with the regeneration of renal arterioles and tubules and improved renal blood flow2. However, the mechanisms underlying the restoration of the kidney arterioles and their associated nephrons remain unclear.
Considering the central role of renin in vascular morphogenesis, we sought to understand the contribution of renin-producing cells (RPCs) and the cells of the renin lineage (CoRL) to kidney damage and repair following either persistent obstruction or relief of obstruction. Renin-expressing cells exhibit dynamic changes following neonatal ureteral obstruction. Earlier studies in neonatal rats and mice showed that following complete ureteral obstruction, the renin mRNA and immuno-reactive renin increased and maintained a fetal distribution3,4,5,6. However, relief of obstruction reversed this increase in renin in neonatal rats7. Similarly, the adult UUO animal models showed increased renin expression8,9,10,11 and renin lineage cells12. Despite the changes observed in renin cells, the effects of these changes during the obstruction injury were and -still are- not well understood.
Renin cells play a central role in vascular morphogenesis during embryonic development13,14. In addition, deletion of renin or inhibition of the renin-angiotensin system (RAS) leads to severe vascular deformities, wherein the CoRL increase and contribute to the concentric thickening of the intrarenal arteries and arterioles15,16. However, little is known about the CoRL in the context of tissue remodeling events during ureteral obstruction and relief of obstruction. We hypothesize that the CoRL undergo fate changes to facilitate kidney repair and regeneration. We labeled the RPCs with GFP to check this and analyzed the cell fate changes. We also ablated the RPCs and CoRL by cell-specific expression of diphtheria toxin A chain (DTA) protein through genetic approaches to further understand their contribution to tissue repair.
2. Results
2.1. Persistent ureteral obstruction results in an increase in renin levels
We performed pUUO on the left kidneys of newborn mice at 36–48h after birth and released the obstruction for some animals a week later. We harvested the kidneys at 3W after surgery (Figure 1A) and analyzed the expression and distribution of renin using an anti-renin antibody and by qRT-PCR. We observed a marked increase in the renin-specific signals at the juxtaglomerular (JG) areas and along the afferent arterioles in the ipsilateral kidneys, obstructed for 3W. Release of obstruction prevented the increase in renin noticed post-obstruction (Figure 1B, Suppl1A–C). However, the contralateral (non obstructed) right kidneys did not show changes in the renin signals post-obstruction among the 3 groups (Figure-Suppl1D). Quantification of the renin-positive areas confirmed a significant expansion of renin distribution following 3W of obstruction compared to sham-operated kidneys (Figure 1C. Sham-3W: 0.57±0.02% (n=6); Obstructed-3W: 1.5±0.37% (n=6), P<0.01). Relief of obstruction at 1W, prevented this increase (Figure 1C. Post-release-2W: 0.57±0.16% (n=5), Obstructed-3W vs. Post-release-2W: P<0.01). Renin mRNA levels analyzed by qRT-PCR showed similar changes (Figure 1D). However, there was a marginal increase in the circulating renin levels following persistent obstruction which was not significantly different from sham animals (Figure Suppl1F).
Figure 1. Persistent ureteral obstruction induces renin expression:
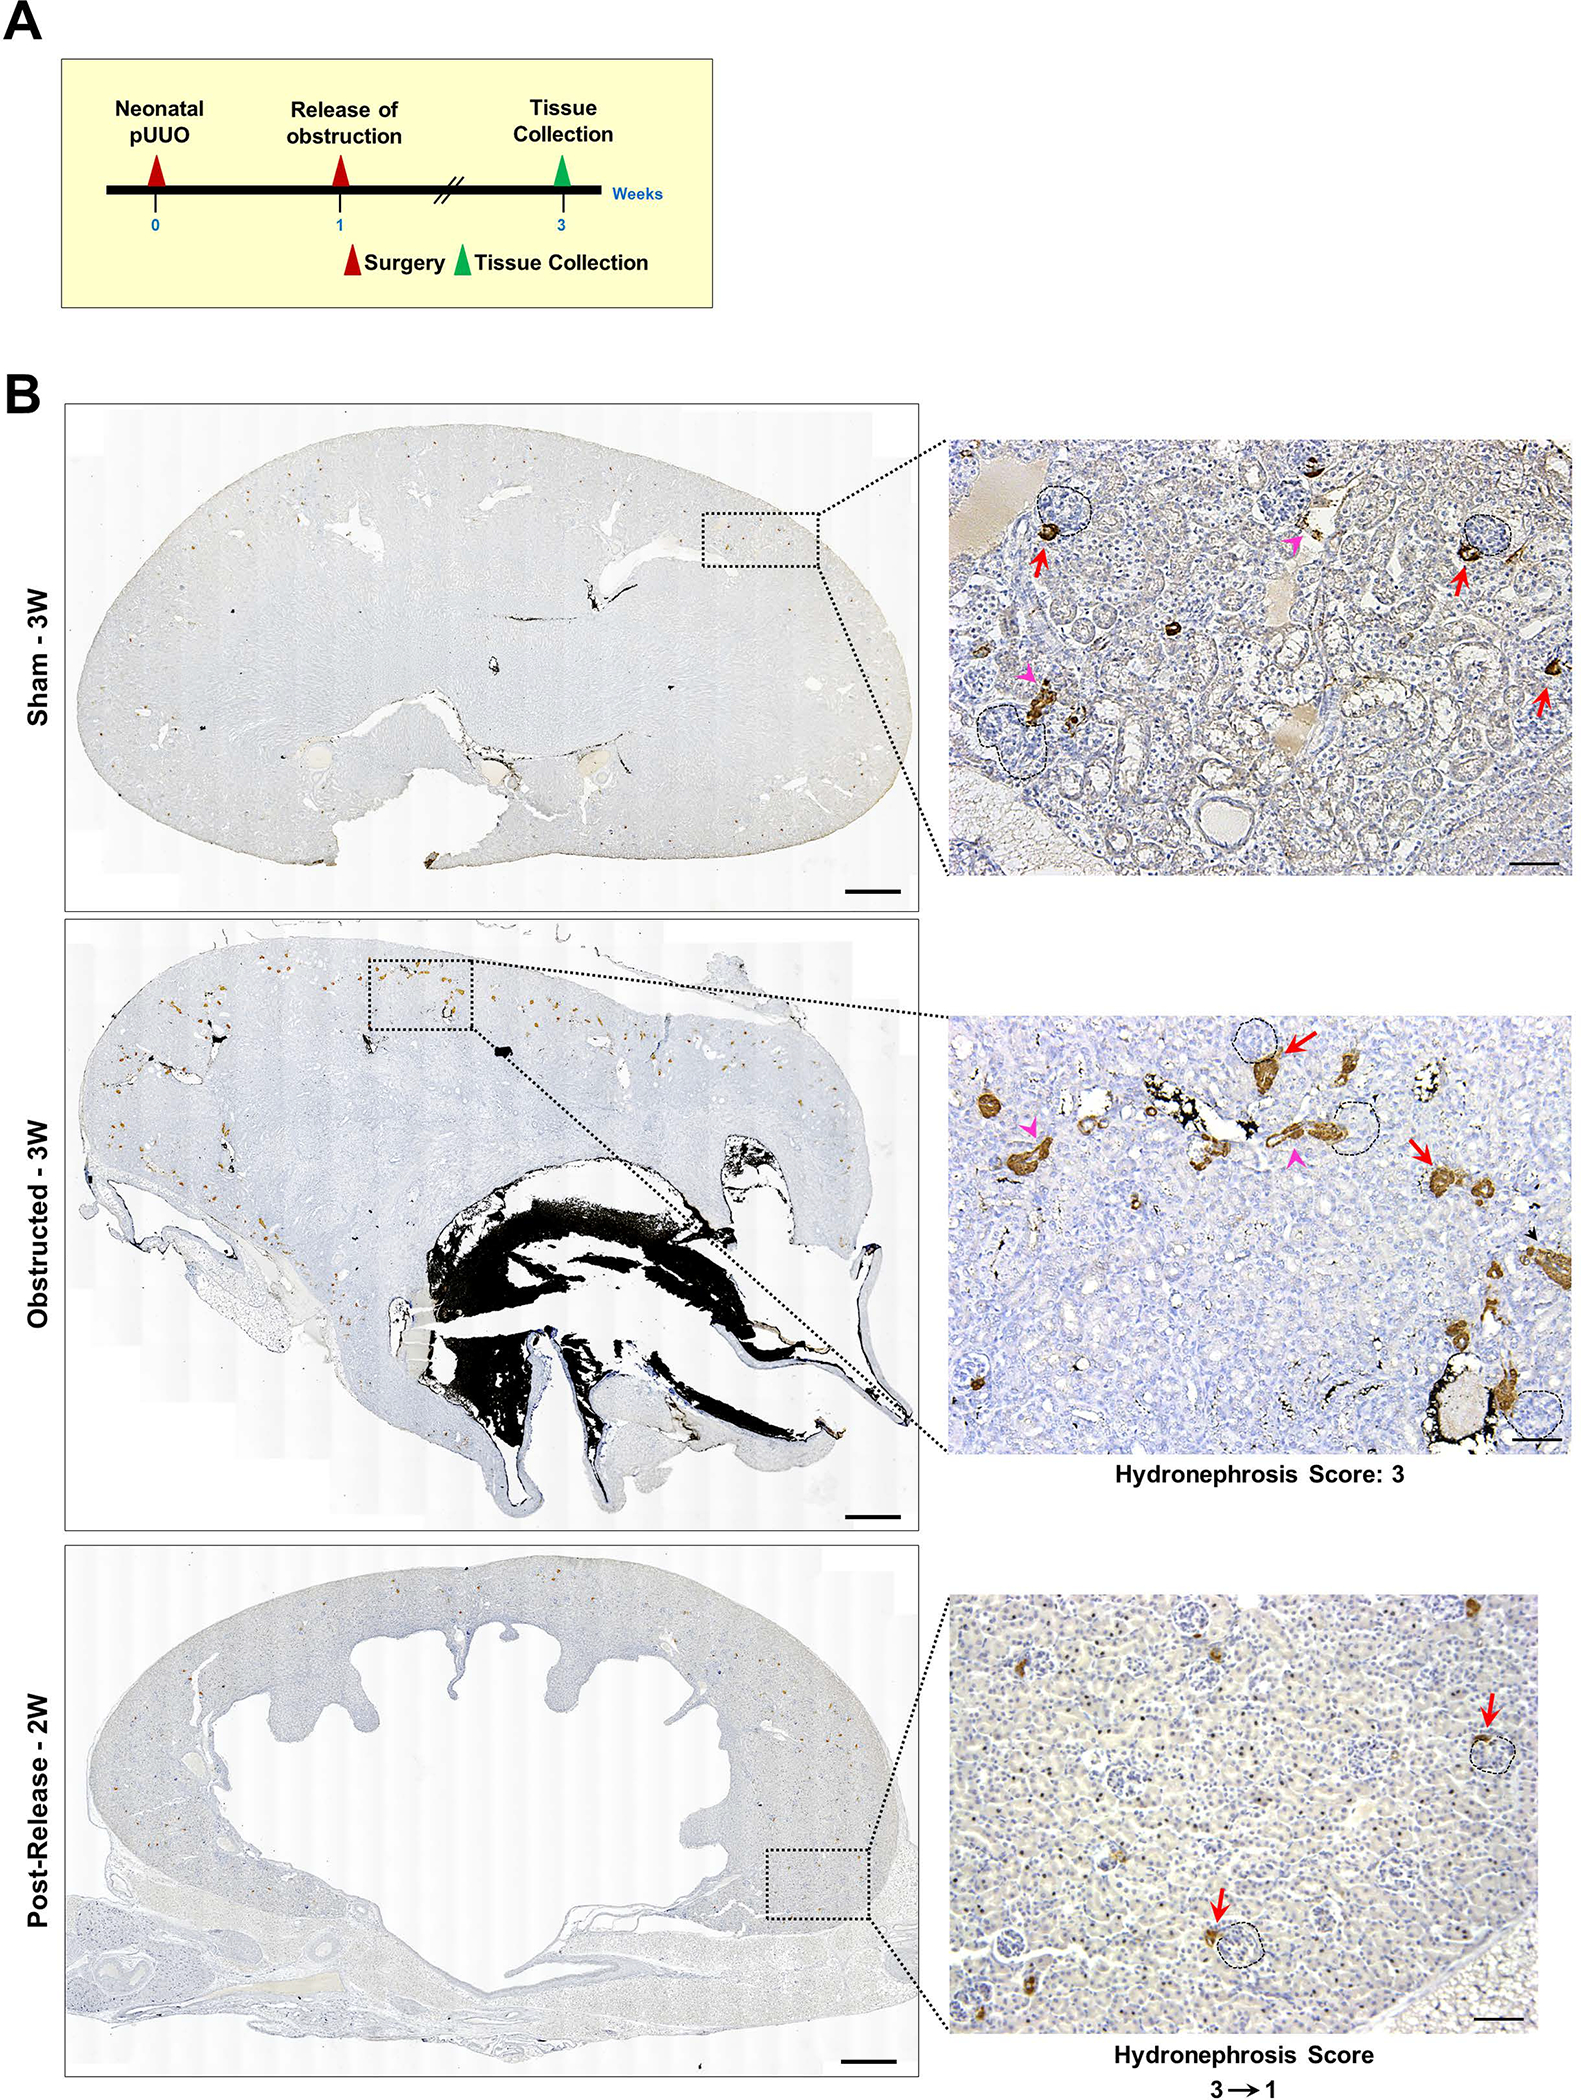
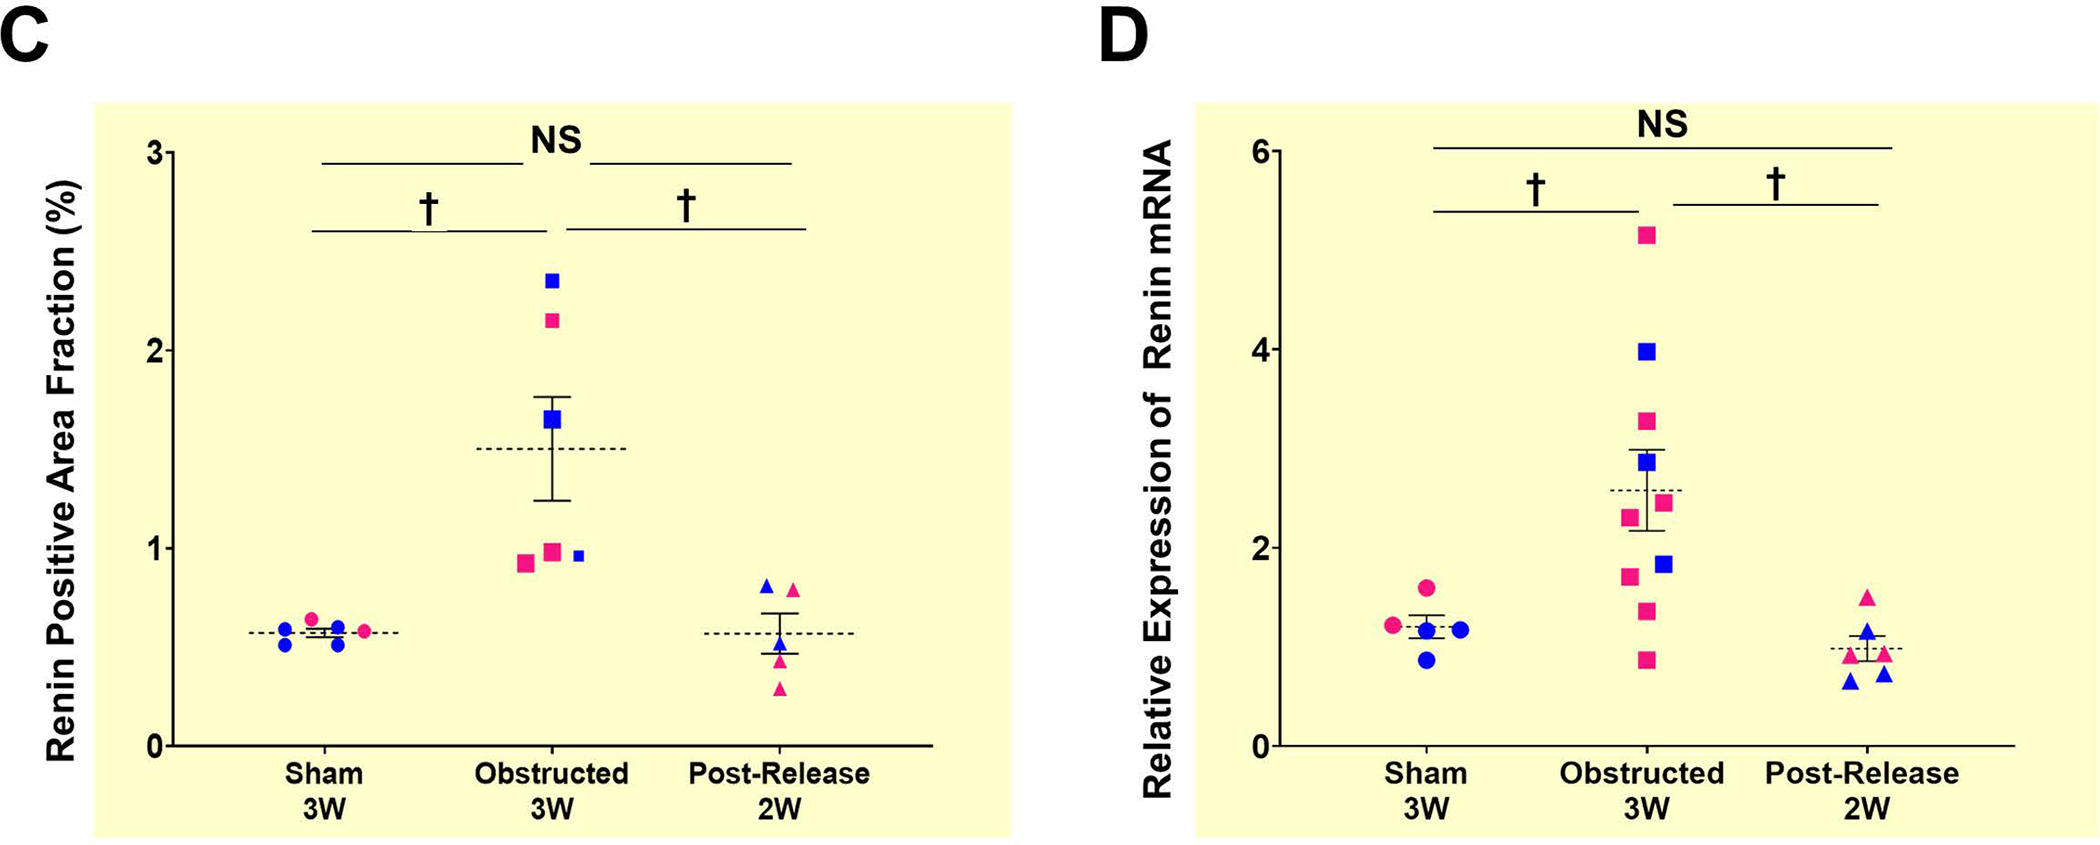
(A) Experimental design: Partial unilateral ureteral obstruction (pUUO) was performed in the left kidneys of newborn mice within the first 48h after birth. The obstruction was released at 1W for some animals, and tissues were collected at 3W after birth (B) Tile scan images of representative kidney sections showing the overall distribution of renin cells in the 3 different surgery groups by immunostaining. There is a marked increase in renin expression in the JG cells (red arrows) and afferent arterioles (pink arrowheads) of the ipsilateral kidneys following obstruction. Removal of the obstruction at 1W resulted in renin distribution similar to the sham-operated kidneys. Dashed black circles mark glomeruli. Hydronephrosis scores beneath the images on the right show the degree of hydronephrosis measured on a scale of 1–4. The numbers with the arrow displayed at the bottom of the 2W post-release panel indicate the changes in the scores from the time of the release of obstruction (score:3) to the time of harvest at 2W post-release (score:1) (Scale bar 500μm,50μm) (C) Quantification of the renin-positive area in the shams (n=6), kidneys obstructed for 3W (n=6), and those released after one week (n=5). Data points in blue indicate males and in pink females. The size difference of the data points for the obstructed group represents the damage index (Largest-Hydronephrosis score 4; Smallest-Hydronephrosis score-2.5) (D) Quantitative reverse transcription PCR (qRT-PCR) for Ren1 mRNA from kidneys obstructed for 3W (n=10), sham-operated kidneys (n=6) and after release (n=6) (†P<0.01; NS Non-significant).
2.2. CoRL increase following persistent ureteral obstruction
To investigate the fate of renin lineage cells during kidney damage and regeneration, we performed lineage tracing in Ren1dCre mice crossed with the R26RmTm(homo) Cre reporter. In the resultant Ren1dCre/+;R26RmTmG/+ (referred to as “Ren1dCre;mTmG” mice), we performed the surgeries and tissue collections as mentioned above (Figure 2A). Kidney sections from sham-operated mice (Figure 2B; Suppl2A) showed the presence of GFP labeling in all the cells of renin lineage (CoRL), including renin-producing JG cells, smooth muscle cells (SMCs) lining the renal arteries and arterioles, the intra-glomerular mesangium, the parietal epithelium surrounding the glomeruli, and a subset of tubular epithelial cells. Furthermore, in kidneys obstructed for 3W, the GFP+ cells increased in the glomeruli and renal vasculature (Figure 2B; Suppl2B). The status was similar to the sham-operated kidneys at 2W post-release of obstruction (Figure 2B; Suppl2C). Interestingly, the fibrotic interstitial cells of the obstructed kidneys were not GFP+, indicating that CoRL may not directly contribute to interstitial fibrosis (Figure 2F–H; Suppl2B).
Figure 2. Persistent ureteral obstruction leads to an increase in the CoRL:
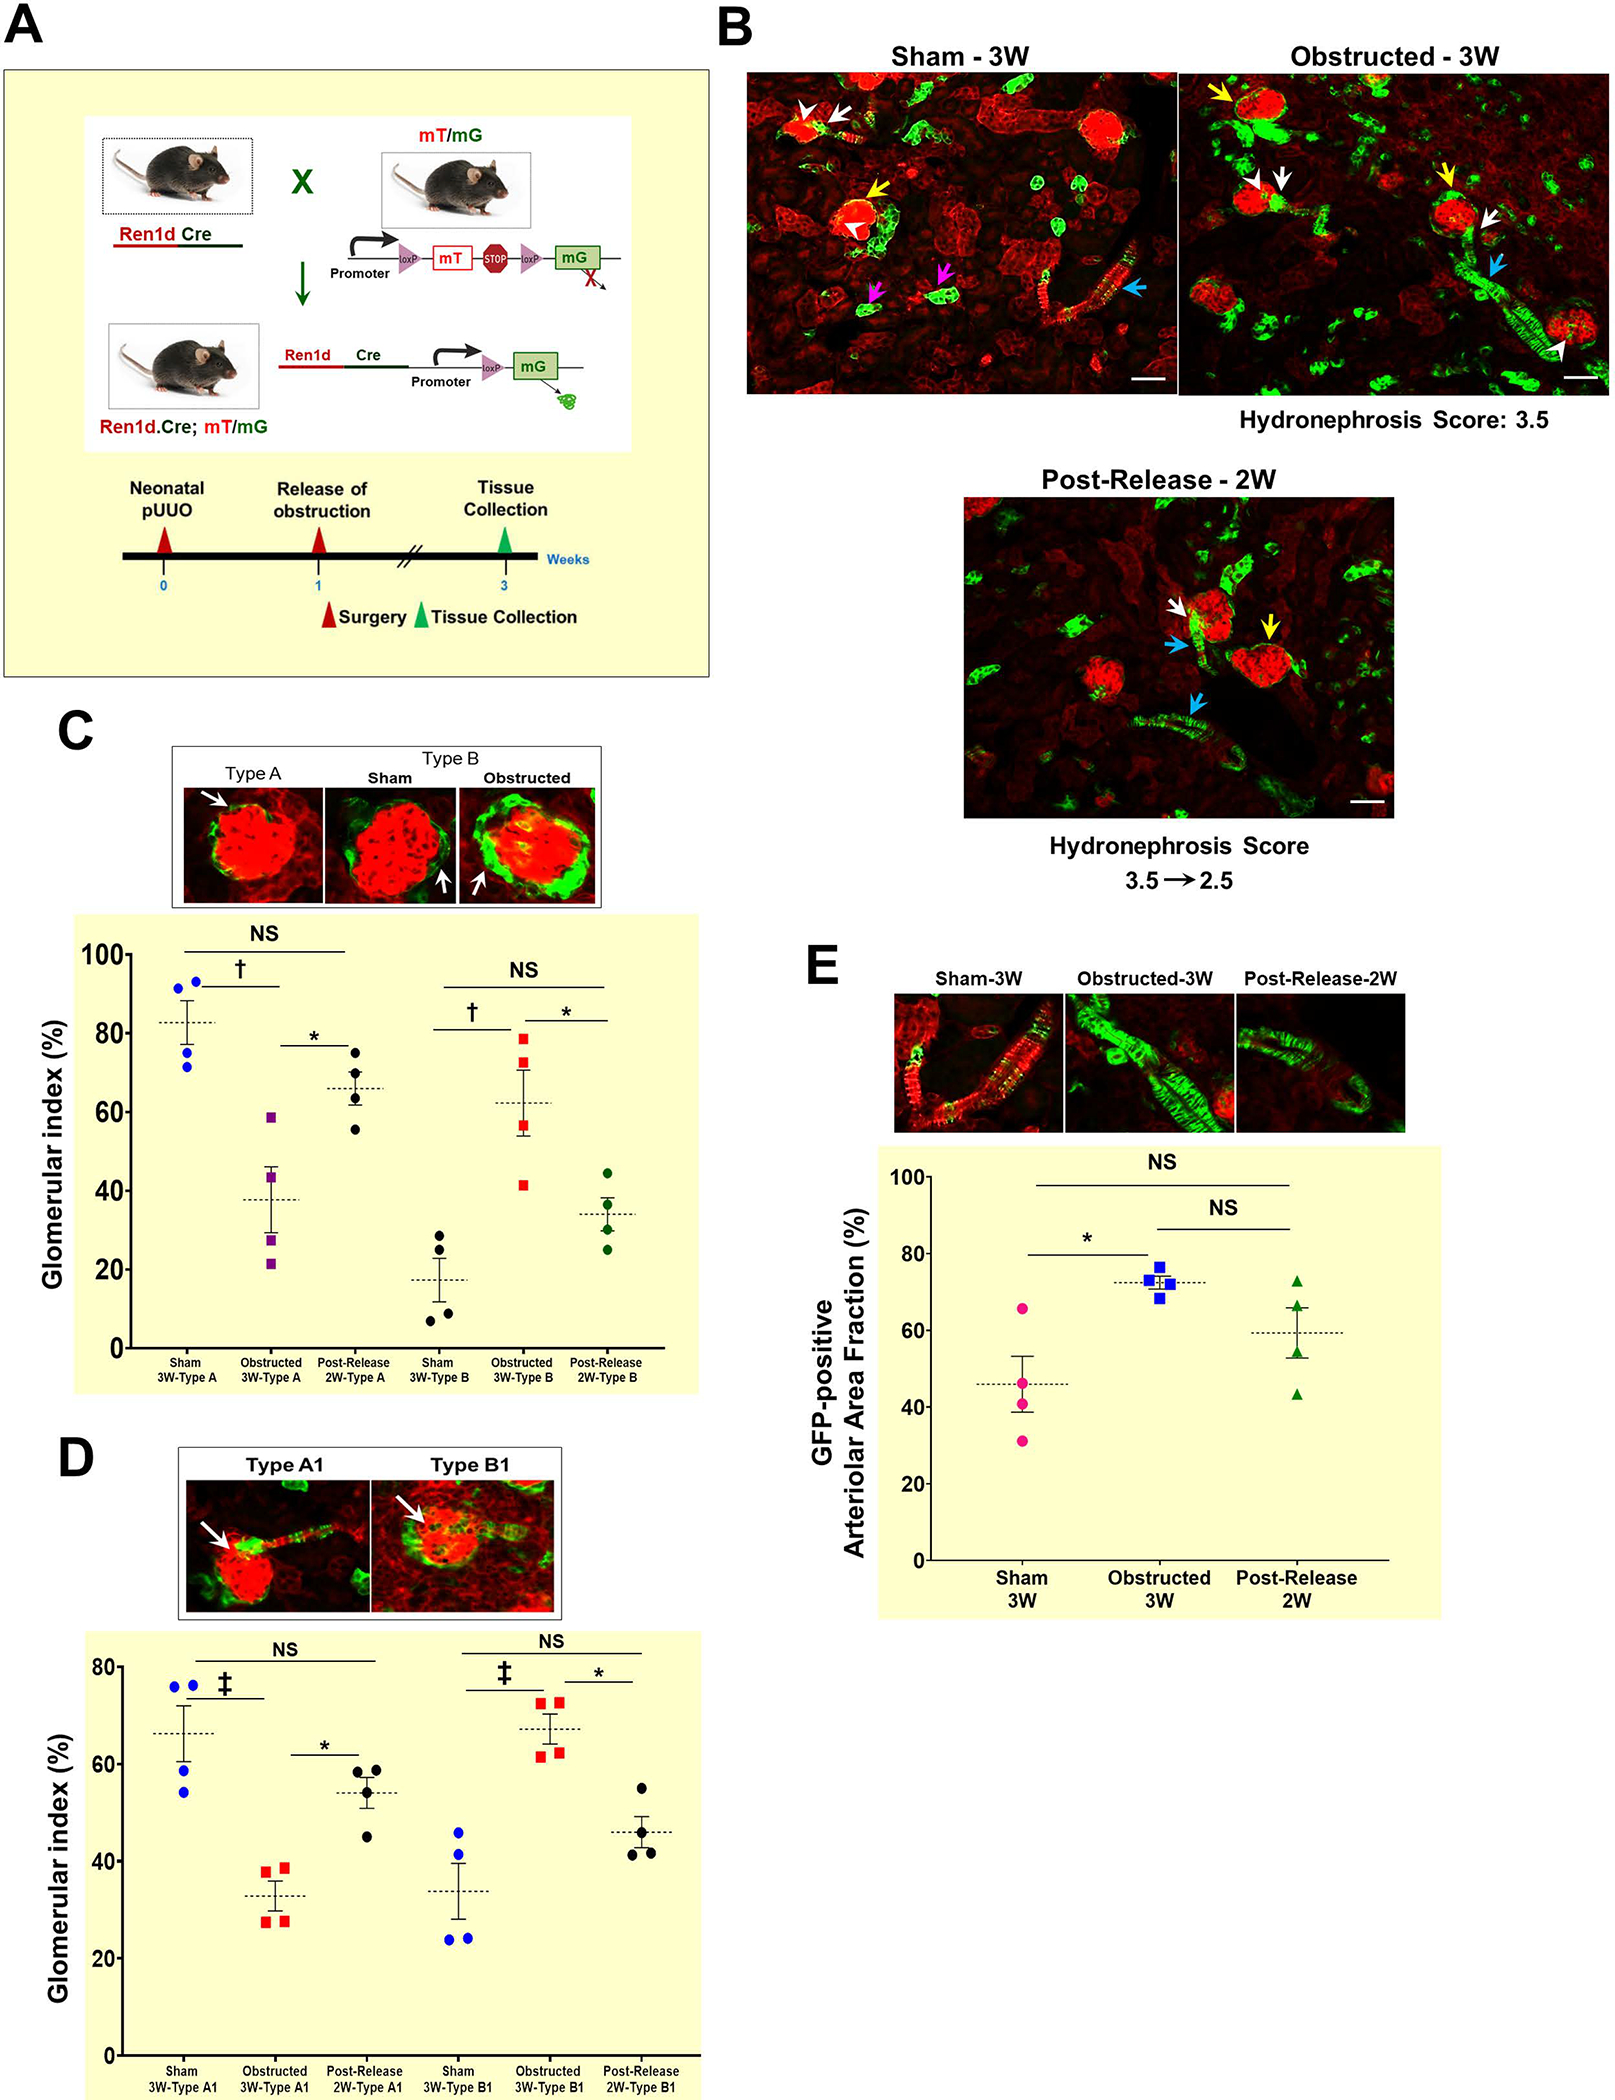
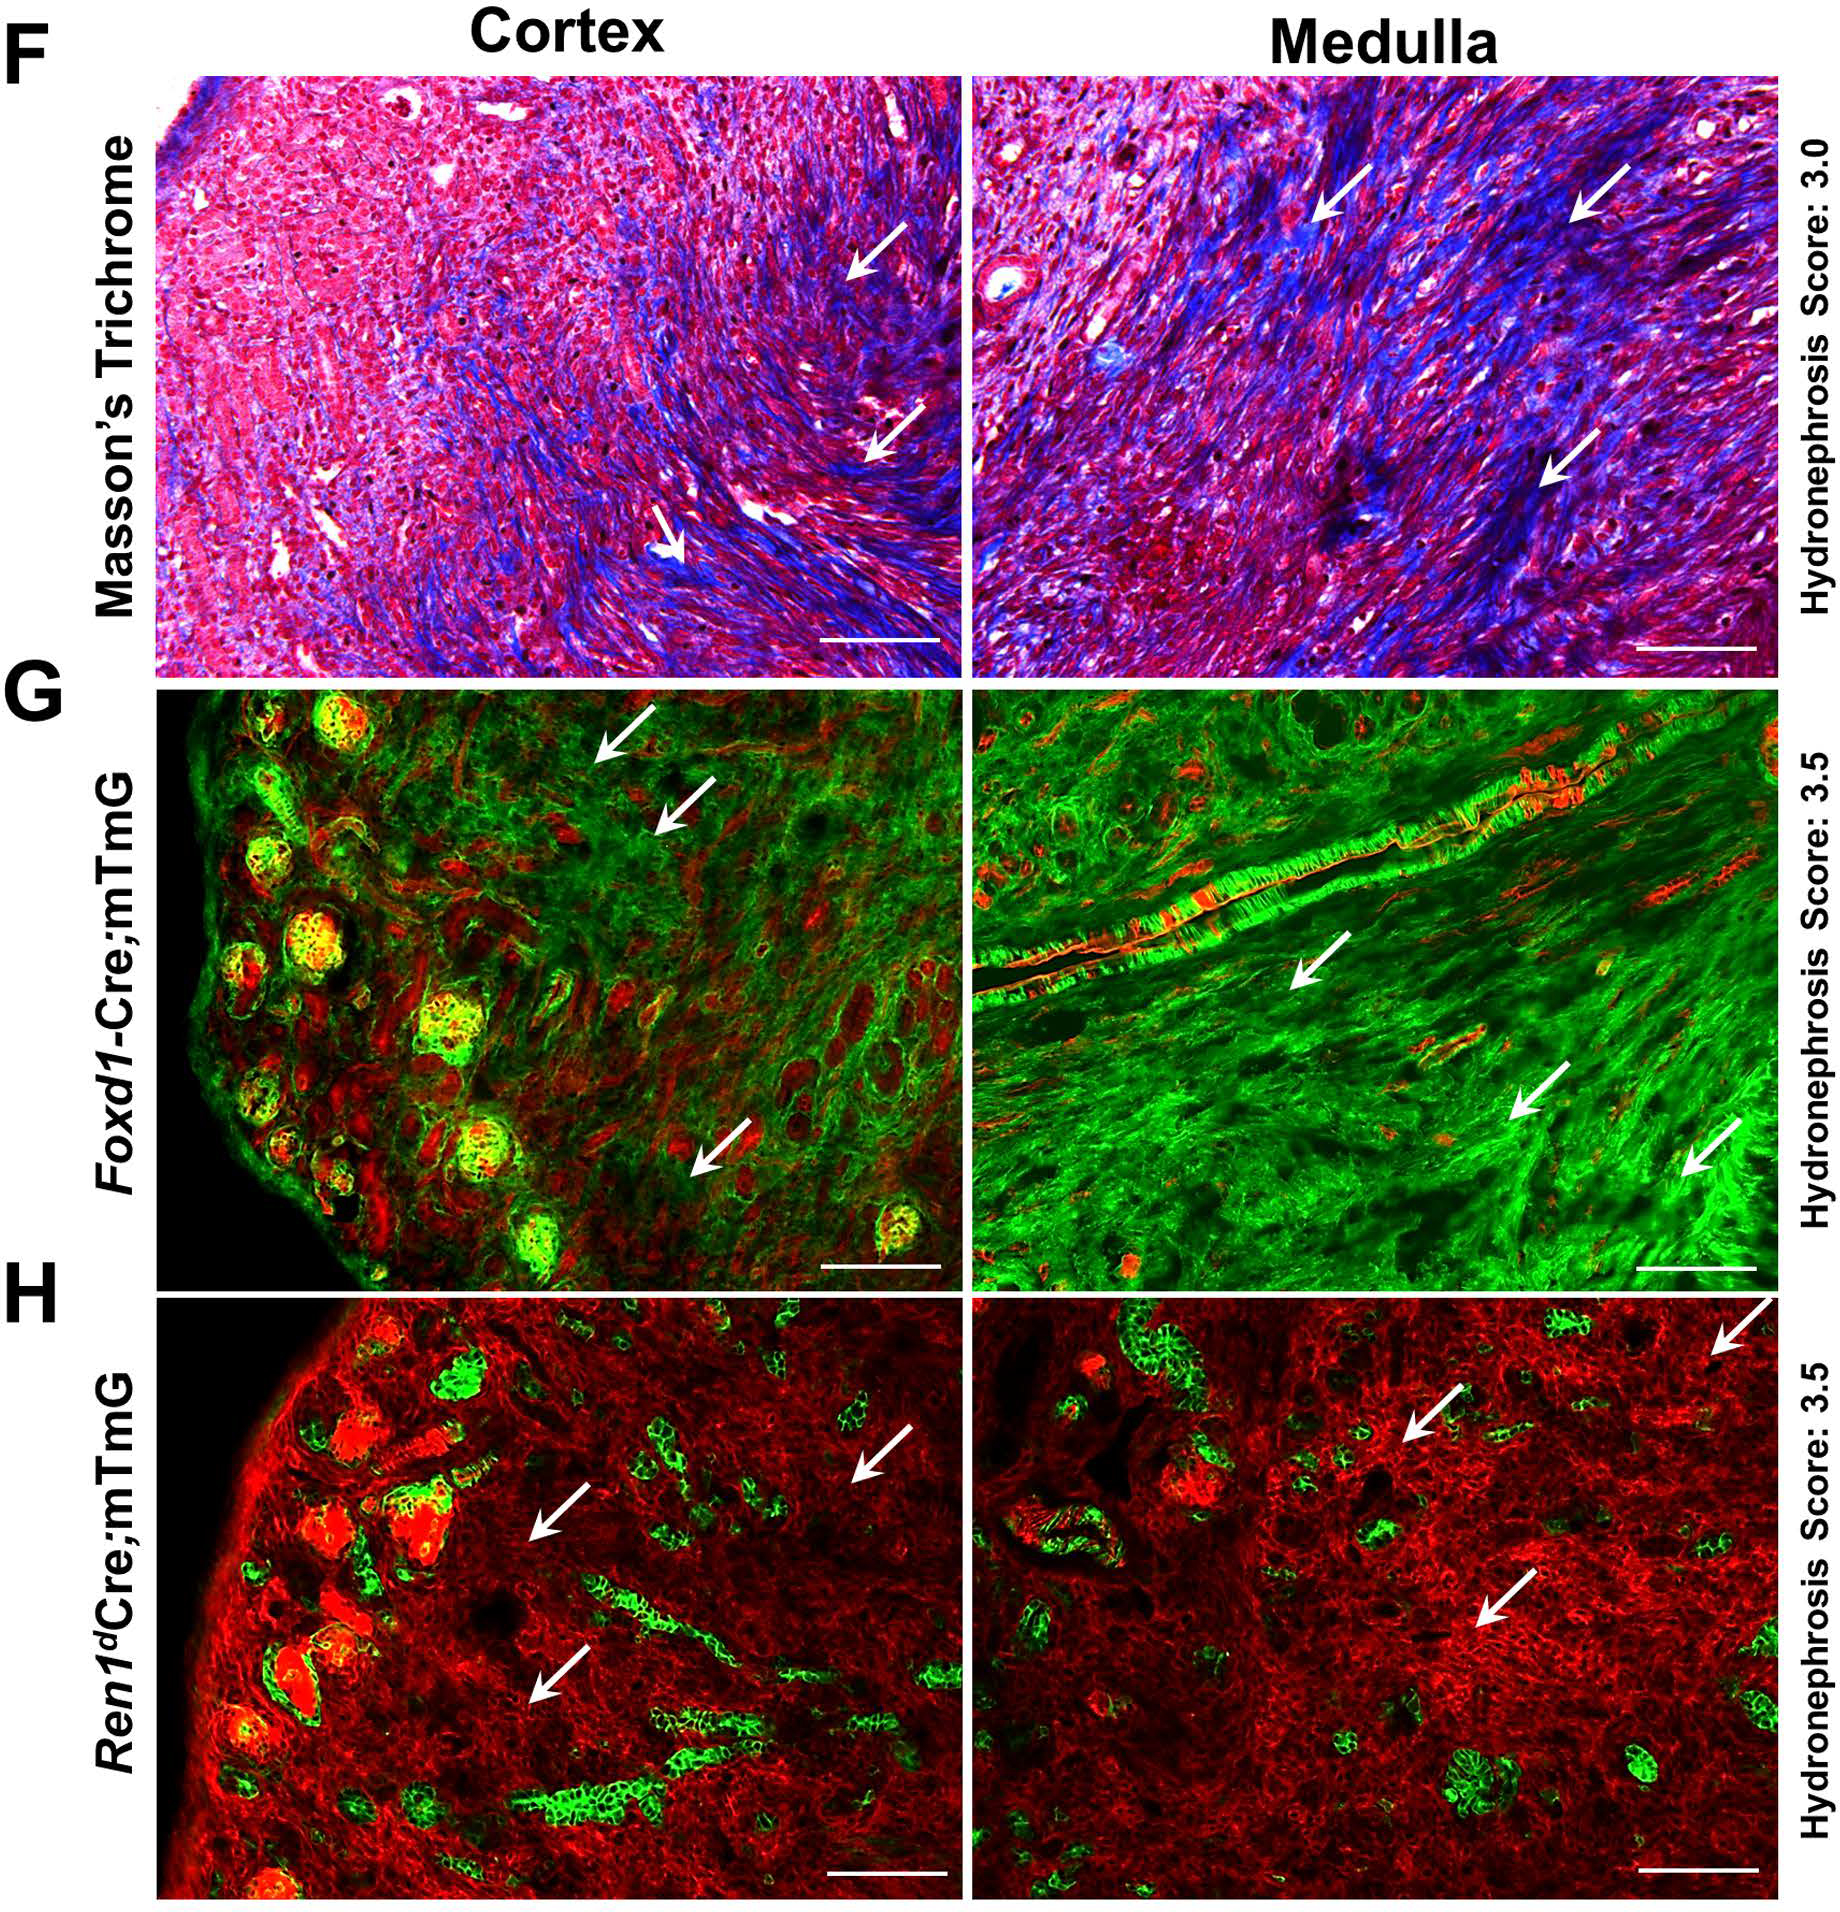
(A) Mice expressing GFP in the CoRL were subjected to pUUO and release surgeries, and tissues were collected at 3W after birth for lineage tracing (B) Kidney sections showing GFP labeling in CoRL encompass the renin-producing Juxta-glomerular (JG) cells (white arrows), parietal epithelium surrounding the glomeruli (yellow arrows), smooth muscle cells lining the renal arteries and arterioles (cyan arrows), intra-glomerular mesangium (white arrowhead) and a subset of tubular epithelial cells (pink arrows). Obstructed kidneys showed expansion of the GFP+ CoRL. The kidneys with the obstruction removed, showed a similar pattern of GFP+ cells to the sham-operated kidneys (Scale bar 50μm). (C) The top panel shows a Type A glomerulus with a thin layer of parietal epithelium and Type B glomeruli showing the thickening of the parietal epithelium. Obstructed kidneys showed a significant decrease in the normal Type A glomeruli, with an increase in the Type B glomeruli. Following the release of obstruction, the distribution of Type A and B glomeruli was similar to the sham animals (D) The top panel represents the Type A1 and B1 glomerulus. Only very few GFP+ intra-glomerular mesangial cells are seen in the TypeA1 glomerulus. Type B1 glomerulus displayed expansion of the intra-glomerular mesangium. Type B1 glomeruli were significantly increased following the persistent obstruction for 3W, with a concurrent decrease in the normal Type A1 glomeruli. The status of the Type A1 and B1 glomeruli was not-significantly different between the obstruction-released and sham-operated kidneys (E) The top panel denotes the level of the GFP+ cells in the renal vasculature under different surgery conditions. The GFP+, renin-negative SMCs of the renin-lineage were significantly increased in the kidneys obstructed for 3W compared to the shams. This increase is maintained even at 2W post-release and was not different from the obstructed kidneys. (F-G) Kidneys with persistent obstruction for 3W show collagen-positive fibrotic interstitium (white arrows) by Masson’s Trichrome staining which correspond to the expansion of GFP+ cells of the Foxd1-lineage (white arrows) (H) Obstructed kidneys from Ren1dCre.mTmG mice with a similar hydronephrosis score as in B do not display a surge in the GFP+ cells of renin lineage within the fibrotic interstitial cells (white arrows) indicating that the CoRL may not directly contribute to the progression of interstitial fibrosis during pUUO in neonatal mice (Scale bar 100μm) (*P<0.05; †P<0.01; ‡P<0.001; NS non-significant).
To quantify these changes, we categorized the glomeruli with a thin lining of GFP+ cells in the parietal epithelium as Type A and those with a thick lining as Type B (Figure 2C). The glomerular index measured as the percentage of each type of glomeruli over the total number of glomeruli was compared between the surgery groups (Total glomeruli counted per surgery group: Sham-3W: 177; Obstructed-3W: 214; Release-3W: 244). We observed a significant decrease in the Type A glomeruli with a concurrent increase in the Type B glomeruli in the obstructed group (Type A: Sham-3W: 82.73±6.41% (n=4); Obstructed-3W: 37.72±9.66% (n=4), P<0.01. Type B: Sham-3W: 17.273±6.41% (n=4); Obstructed-3W: 62.28±9.66% (n=4), P<0.01). However, the kidneys subjected to the relief of obstruction showed a reversal with a pattern similar to the shams (Figure 2C: Type A: Post-release-2W: 65.98±4.84% (n=4), P<0.05 Type B: Post-release-2W: 34.02±4.84% (n=4), Obstructed-3W vs. Post-release-2W: P<0.05).
Similarly, we categorized glomeruli without the expansion of GFP+ cells in the intra-glomerular mesangium as Type A1 and those showing abnormal expansions as Type B1(Figure 2D). We observed a significant decrease in the Type A1 with an increase in the Type B1 glomeruli in obstructed kidneys compared to shams (Type A1: Sham-3W: 66.21±6.63% (n=4); Obstructed-3W: 32.83±3.56 (n=4), P<0.001 Type B1: Sham-3W: 33.79±6.63% (n=4); Obstructed-3W: 67.17±3.56 (n=4), P<0.001). However, when we removed the obstruction, the status was similar to the sham-operated kidneys (Type A1: Post-release-2W: 54.05±3.68% (n=4) Type B1: Post-release-2W: 45.95±3.68% (n=4), Obstructed-3W vs. Post-release-2W: P<0.05). These results indicate that persistent obstruction leads to the expansion of renin-lineage cells in the intra-glomerular mesangium, and the release of obstruction mitigates these changes. Renal arterioles in the obstructed kidneys displayed an altered morphology, thickening, degeneration, and increased GFP+ CoRL (Figure 2E). Quantification of the GFP+ area revealed a significant increase in the obstructed group compared to the sham group (Sham-3W: 45.93±8.39% (n=4); Obstructed-3W: 72.42±1.93% (n=4); P<0.05). Although the expansion of renin lineage cells of the vasculature tends to decrease upon relief of obstruction, the distribution was not significantly different compared to the obstructed kidneys (Post-release-2W: 59.31±7.55% (n=4), NS, Non-significant).
These observations indicate that obstruction injury increases the GFP+ cells in the renin-expressing JG cells and the renin-negative CoRL, such as mesangial, parietal epithelial, and vascular SMCs. The increases seen in the JG cells and the glomeruli only under the persistent obstruction conditions may contribute to the damage responses during ureteral obstruction. Whereas the sustained rise of CoRL in the vascular SMCs, seen even after the removal of obstruction, may indicate a regenerative response of the kidney after the release of obstruction.
2.3. DTA-mediated ablation of renin-producing cells (RPCs) and cells of renin lineage (CoRL)
To further understand the significance of the dynamic changes the RPCs and CoRL undergo post-obstruction and release of obstruction, we used genetic approaches to ablate them. As the total knockout for the renin gene (Ren1c−/−) results in an aberrant kidney phenotype16, in this study, we aimed to partially remove the RPCs and CoRL and observe the effect of obstruction and its release.
RPCs are present along the renal arterioles during embryonic development and restricted to the JG cells in the adult stage. To ablate the RPCs, we used the Ren1dDTA mice, where the Ren1d mouse renin promoter controls the DTA expression at the renin locus17. Therefore, the DTA is expressed only in the active renin-expressing cells transiently, resulting in the ablation of all the RPCs. The Ren1dGFP knock-in mice generated with a similar approach confirmed the expression of GFP only in the renin-producing cells during the embryonic and adult stages of kidney development18. Since the homozygous Ren1dDTA mice with complete ablation of renin-cells had smaller kidneys and showed renal abnormalities17, in the current study, we used the heterozygous Ren1dDTA/+ mice exhibiting partial ablation of renin-expressing cells.
In addition to the ablation of RPCs, we aimed to remove the CoRL to understand their role in kidney damage and repair in our neonatal pUUO and release mouse model. Therefore, we used the Cre-loxP system19 to express DTA in all the renin-expressing progenitor cells (RPCs) and their progenies (CoRL). We developed a crossing strategy to generate and compare the littermates exhibiting DTA expression only in the RPCs, DTA expression in the RPCs and CoRL, and GFP expression in all the CoRL for lineage tracing. We crossed the R26RDTA(homo) mice with compound Ren1dCre/+;Ren1dDTA/+;R26RmTmG/+ heterozygous mice (Figure 3A). The cross generated off-springs expressing DTA with several genotype combinations inheriting one copy of R26RDTA/+ with the presence or absence of Cre, Ren1dDTA/+, or mTmG alleles. In the animals that inherited the Ren1dDTA and the non-recombined R26RDTA/+ alleles (Ren1dDTA/+;R26RDTA/+), DTA-mediated, cell-specific ablation occurs only in the active RPCs. We referred to this genotype as “Ren1d-DTA”. However, in the Ren1dCre/+;R26RDTA/+ animals (referred to as “Ren1dCre;ROSA-DTA”) the ROSA-promoter drives DTA expression. In the ROSA-DTA animals, DTA expression is regulated at the Rosa26 locus through Cre-recombination, resulting in a more robust and permanent toxin expression in all the RPCs and CoRL. The Ren1dCre/+;R26RDTA/mTmG mice ( “Ren1dCre;ROSA-DTA;mTmG”) express both DTA and GFP in the RPCs and CoRL and allowing the visualization of the CoRL left after the DTA-mediated ablation. The compound heterozygous mice Ren1dCre/+;Ren1dDTA/+;R26RmTmG/+ (referred to as “Ren1dCre; Ren1d -DTA;mTmG”), express DTA in the RPCs and GFP in the CoRL.
Figure 3. DTA-mediated ablation of renin cells and renin lineage cells:
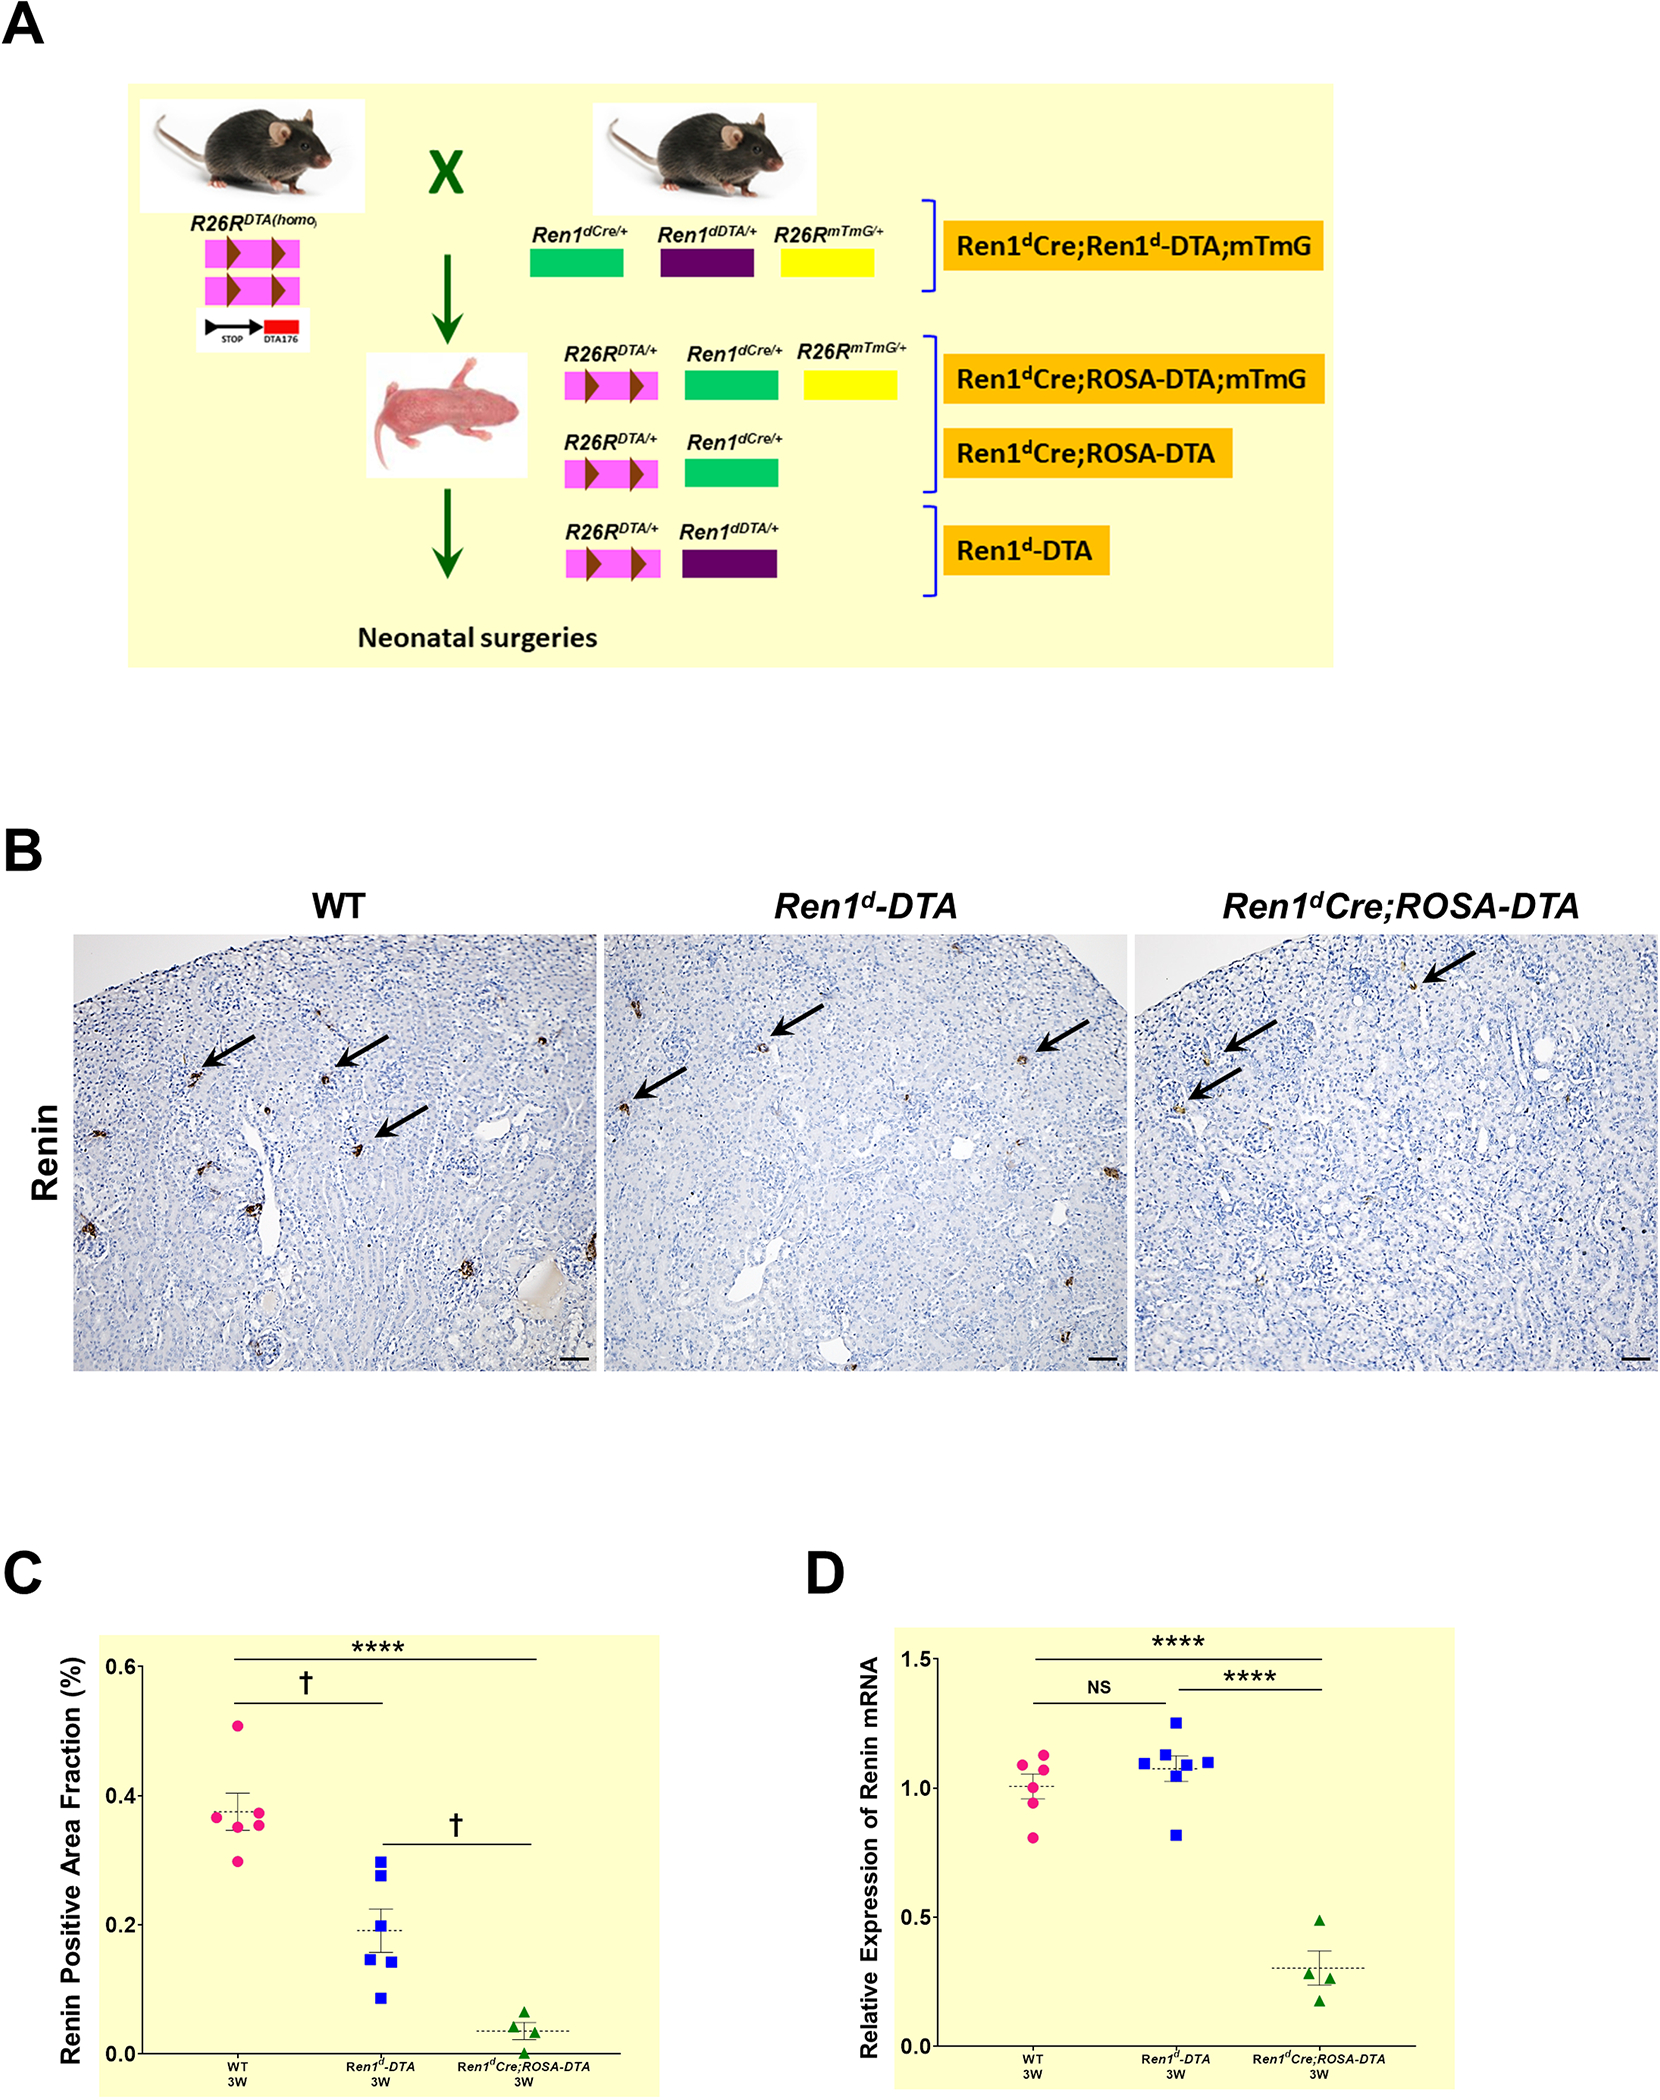
(A) Crossing strategy to generate neonatal mice expressing DTA in RPCs (Ren1d-DTA) and CoRL (Ren1dCre;ROSA-DTA; Ren1dCre;ROSA-DTA;mTmG) (B) Immunostaining for renin on the kidney sections from 3W old WT, Ren1d-DTA, and Ren1dCre;ROSA-DTA mice not subjected to any surgeries. Renin-positive areas (black arrows) are markedly reduced in the animals expressing DTA compared to the WT group (Scale bar 50μm) (C) Quantification of the renin-positive area fraction in the DTA-genotypes show a reduction which is more pronounced in the Ren1dCre;ROSA-DTA (D) Basal renin mRNA levels analyzed by qRT-PCR showed a significant decrease in the Ren1dCre;ROSA-DTA mice compared to the other two genotypes (*P<0.05; †P<0.01; ****P<0.0001).
2.4. Ablation of renin cells using DTA leads to a significant reduction in the RPCs
We analyzed the basal levels of RPCs in 3W old WT, Ren1d-DTA, and Ren1dCre;ROSA-DTA mice without surgeries. Immunostaining against renin showed a marked reduction of renin-expressing JG cells in the DTA-expressing mice compared to the WT controls, being more pronounced in the Ren1dCre;ROSA-DTA mice (Figure 3B; Suppl3 A–C). Further quantification confirmed these obsevations (Figure 3C: WT-3W: 0.38±0.03% (n=6); Ren1d-DTA-3W: 0.19±0.04% (n=6); Ren1dCre;ROSA-DTA-3W: 0.04±0.02% (n=4), P<0.0001). Moreover, renin-mRNA levels showed a significant reduction only in the kidneys of Ren1dCre;ROSA-DTA mice (Figure 3D). In addition, by qRT-PCR for DTA mRNA, the toxin, as expected, was expressed only in the kidneys of DTA-positive genotypes but not in the WTs (Suppl3D).
2.5. Ablation of renin-cells using DTA leads to a significant decrease in the CoRL
To study the effect of DTA-mediated ablation of CoRL at the basal states in both models, we traced the GFP+ CoRL using the mTmG Cre-reporter. We observed a striking difference in the status of the GFP+ CoRL in the DTA-positive animals compared to the DTA-negative (Ren1dCrehomo;mTmGhomo) controls. Though both DTA groups showed a significant reduction in the GFP+ CoRL compared to the control kidneys, the decline was more severe in the Ren1dCre;ROSA-DTA;mTmG mice [Figure 4A–D: GFP+ CoRL area fraction: WT-3W: 15.69±1.35% (n=5); Ren1dCre;Ren1d-DTA;mTmG-3W: 10.66±0.94 % (n=4); Ren1dCre;ROSA-DTA;mTmG-2.01±0.34% (n=4)]. Differences in the extent of ablation of the CoRL between the two DTA genotypes are due to the different modes of toxin expression in these animals.
Figure 4: Ablation of RPCs and CoRL with DTA:
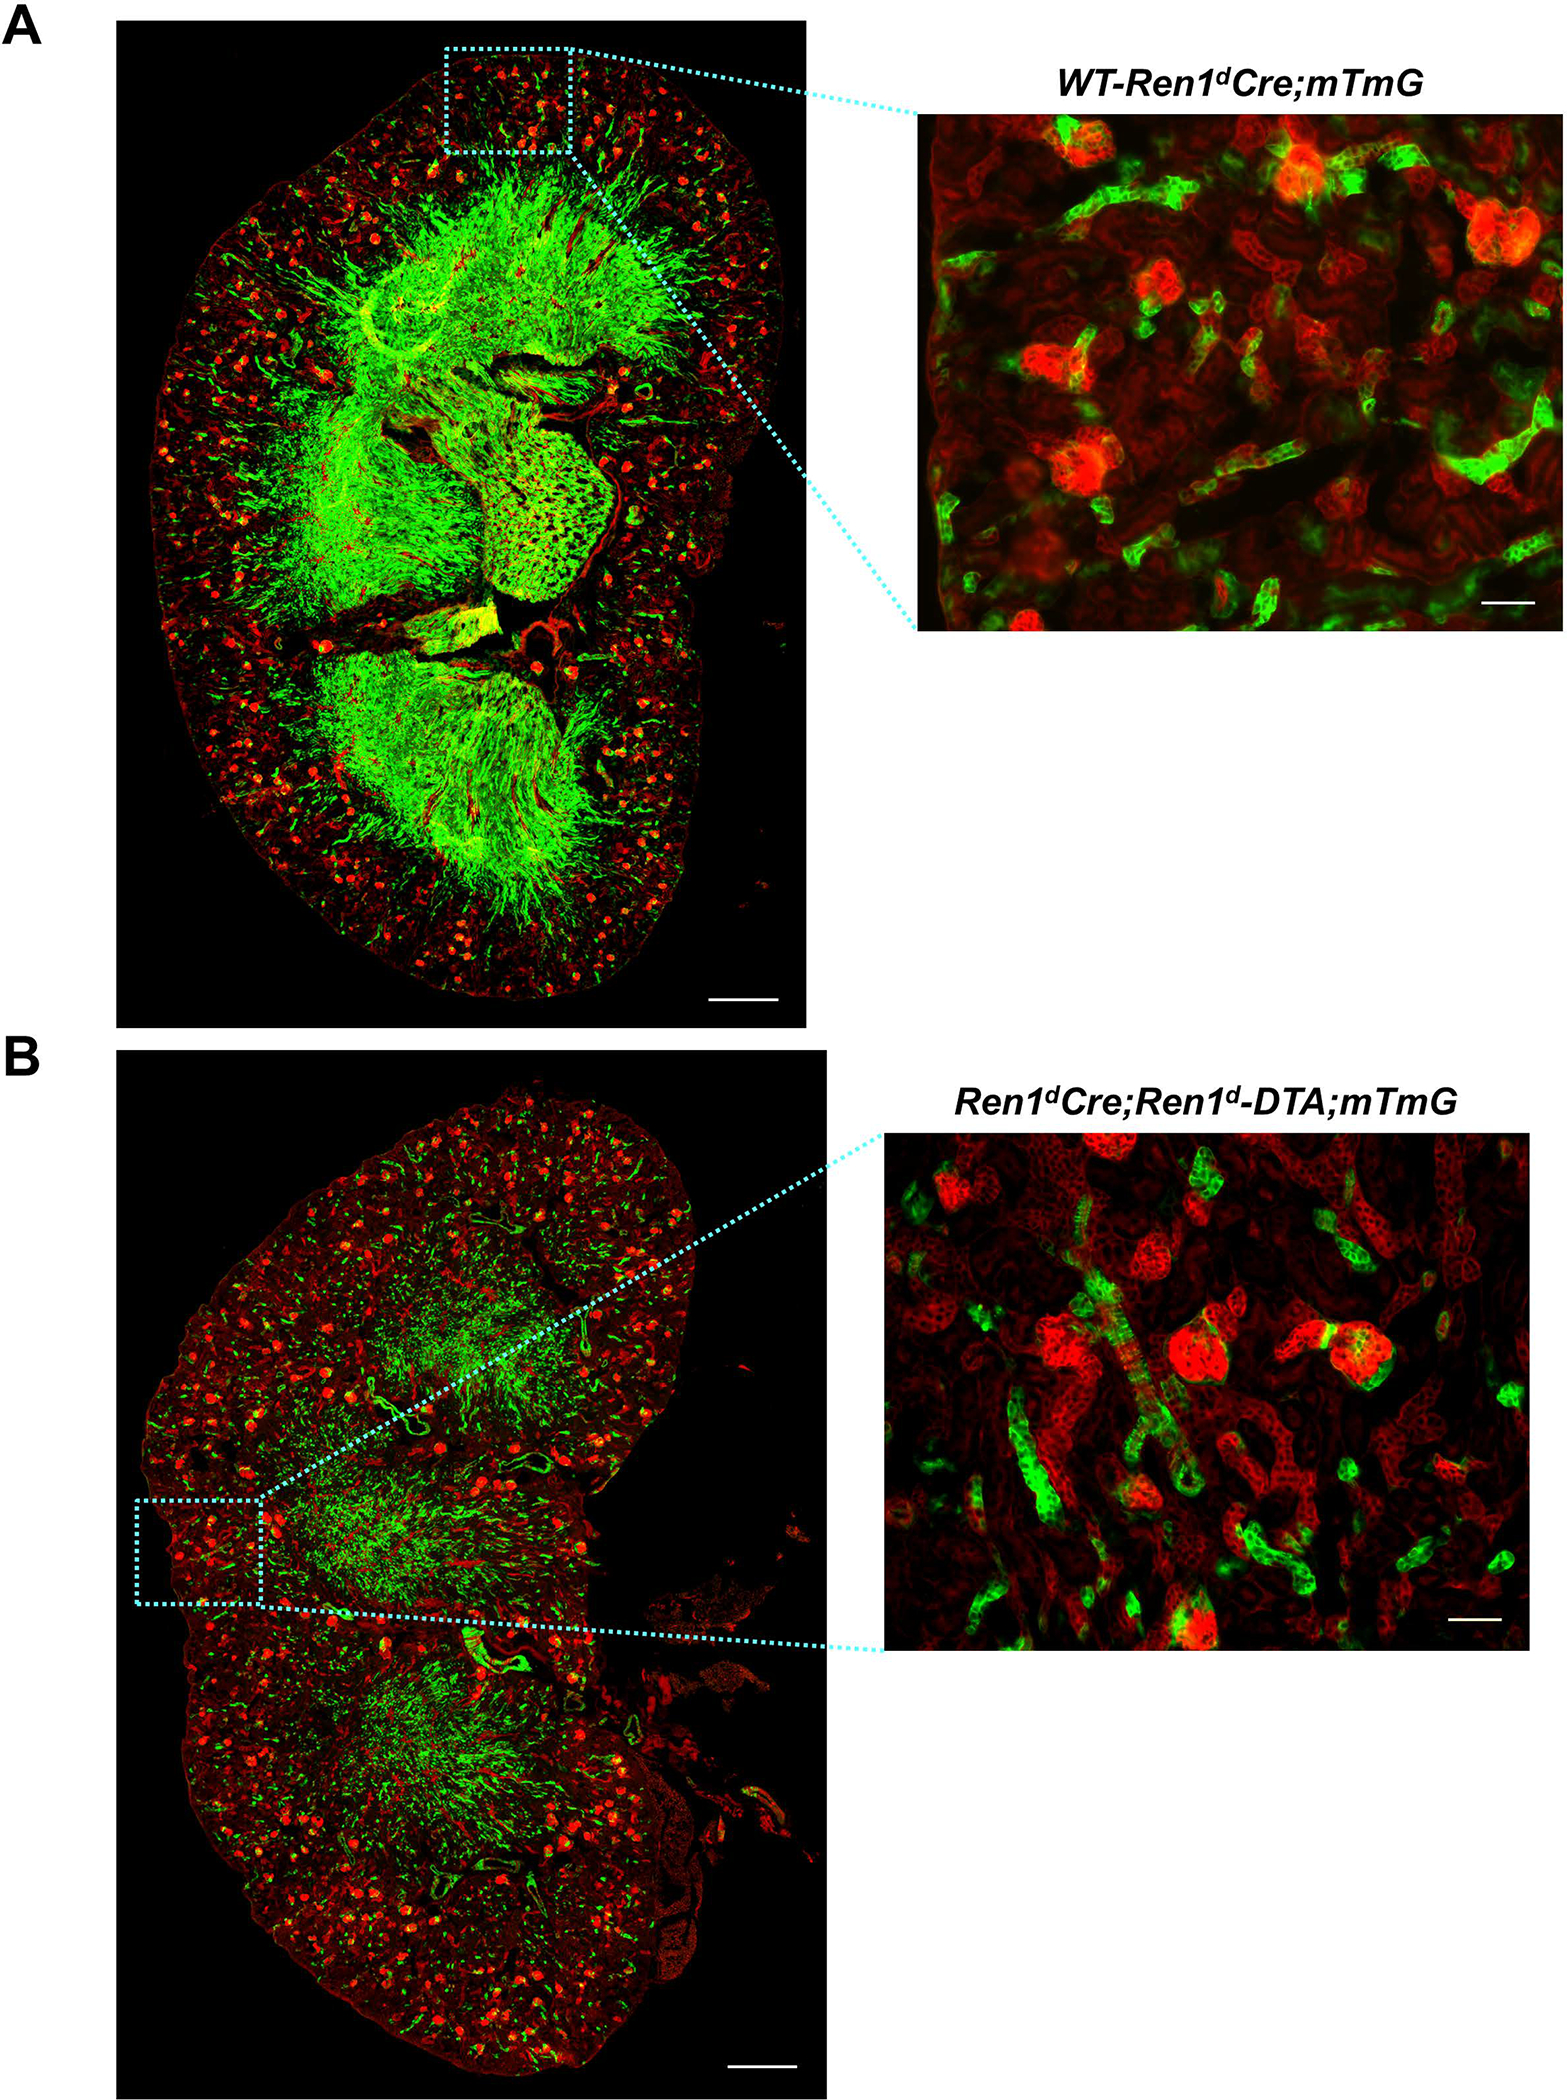
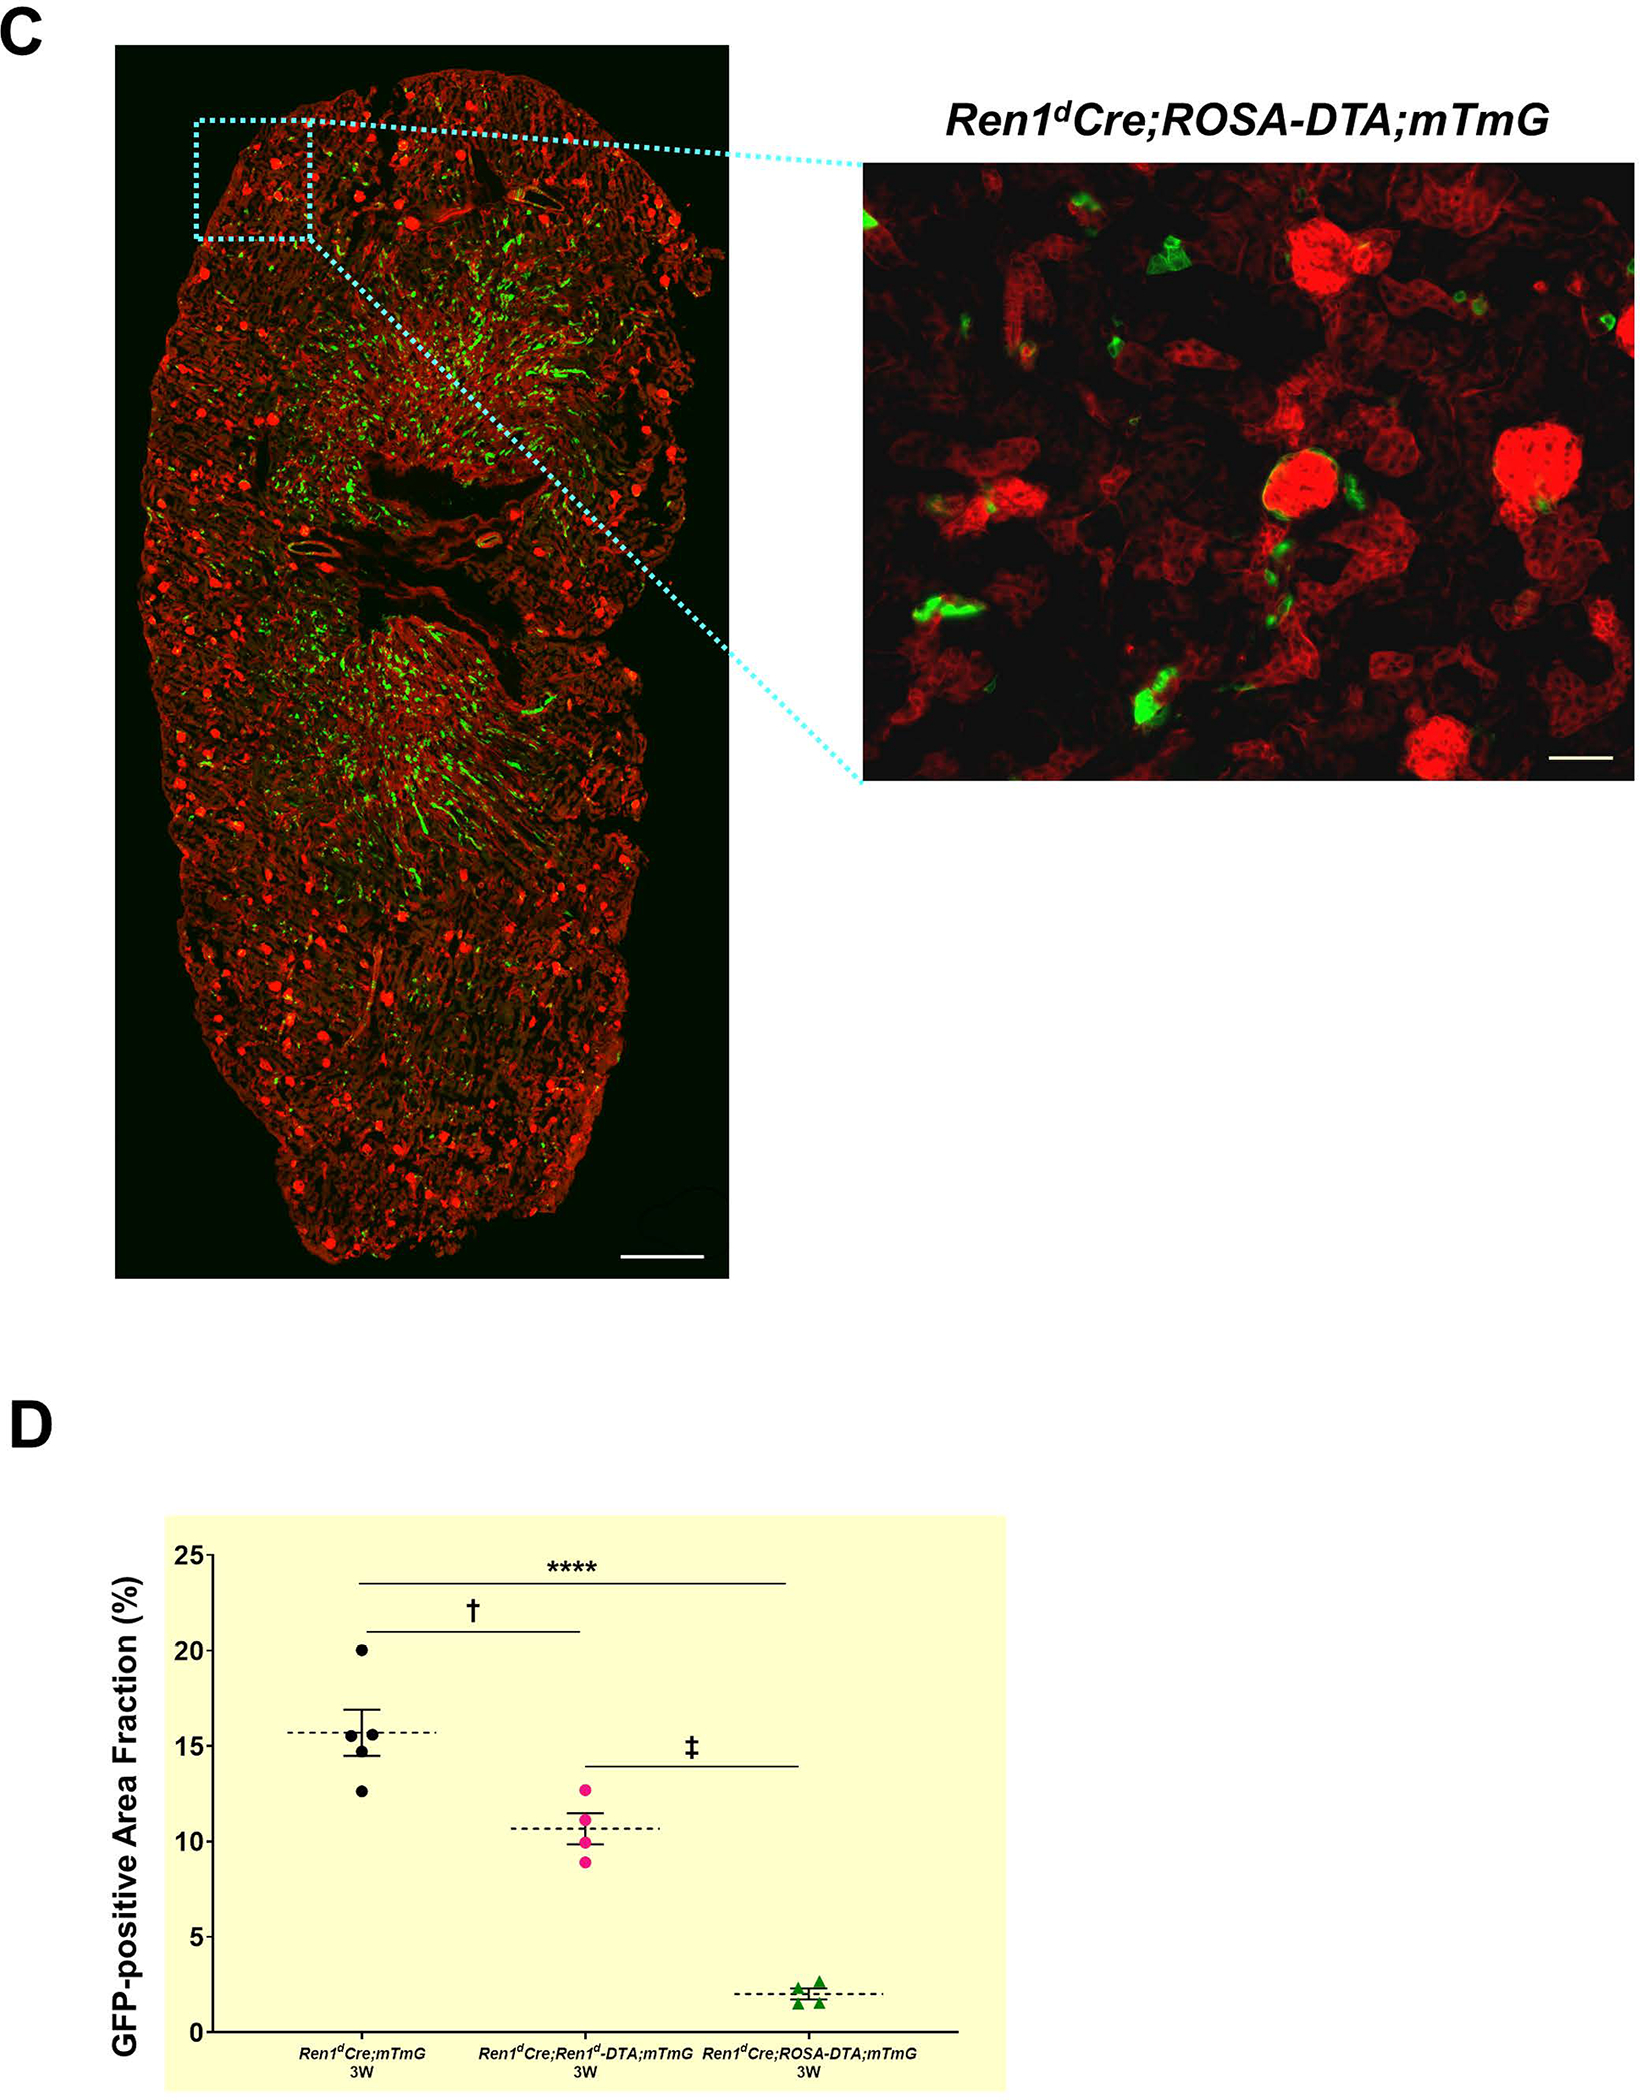
(A-C) Whole tile scan images of kidney sections from 3W old WT and DTA-positive animals under basal state. GFP+ renin lineage cells are significantly reduced in the animals expressing DTA and more pronounced in the Ren1dCre;ROSA-DTA;mTmG mice (Scale bar 500μm, 50μm) (D) Quantification on the GFP+ area fraction of the CoRL (†P<0.01; ****P<0.0001).
As a subset of CoRL comprising both the proximal and the collecting duct epithelium contributes to the tubular mass of the kidney20, we further analyzed the basal state of these cells in the DTA models. Immunostaining for the collecting duct epithelium using an anti-calbindin antibody (Figure Suppl 4A–B) and proximal tubules using the lotus lectin (LTA, FigureSuppl 4D–E) revealed a noticeable reduction in these cell types in the Ren1dCre;ROSA-DTA animals in comparison to the Ren1d-DTA group. Quantification on the calbindin-positive tubular area fraction (Figure Suppl 4C: Ren1d-DTA-3W: 3.97±0.15 % (n=3); Ren1dCre;ROSA-DTA-3W: 2.5±0.22% (n=4), P<0.001) and LTA- positive tubular area fraction (Figure Suppl 4F: Ren1d-DTA-3W: 13.25±1.20 % (n=3); Ren1dCre;ROSA-DTA-3W: 8.66±1.40% (n=4), P<0.05) validated these observations.
In addition, immunostaining for Proliferating cell nuclear antigen (PCNA) showed a significant increase in proliferating cells in the medullary compartment but not in the cortex of the Ren1dCre;ROSA-DTA mice (Figure Suppl 4G–J: Ren1d-DTA-3W: 0.001± 0.0003% (n=3); Ren1dCre;ROSA-DTA-3W: 0.003±0.0003% (n=4), P<0.001). These results indicate a stronger ablation of the CoRL in the Ren1dCre;ROSA-DTA mice probably promote cellular proliferation as a compensatory mechanism to maintain tissue homeostasis.
Furthermore, using Terminal deoxynucleotidyl transferase dUTP nick end labeling (TUNEL) assay, we checked if the Ren1dCre;ROSA-DTA animals had increased apoptosis (Figure Suppl 4K–L). Though we observed an increase in the apoptotic bodies (to the extent of 28% increase) in the kidneys of Ren1dCre;ROSA-DTA mice, the levels were not significantly different when compared to the Ren1d-DTA group (Figure Suppl 4M). Thus our results indicate that continued expression of DTA toxin in the renin-cell derivatives of Ren1dCre;ROSA-DTA mice exacerbate the ablation of CoRL in contrast to the Ren1-DTA mice. Moreover, an increase in the loss of tubular epithelial cells, cellular proliferation, and cell death contribute to the differences in the kidney phenotype observed between these animals.
2.6. Phenotypic changes in the kidneys due to DTA-mediated ablation of RPCs and CoRL
To identify the effects of the ablation of RPCs and CoRL we performed Hematoxylin & Eosin (H&E) staining on kidney sections harvested from the 3W-old mice before subjecting them to any surgeries. The Ren1d-DTA animals expressing DTA only in the active RPCs showed normal morphology similar to the WT animals (Figure 5A; Suppl 5A–B). However, kidney sections from a similar age group of Ren1dCre;ROSA-DTA animals displayed focal sclerotic areas in the renal cortex and tubular dilations (Figure 5A; Suppl 5C). These results indicate a stronger ablation of the RPCs and CoRL in the Ren1dCre;ROSA-DTA group leads to kidney injury. However, kidney function was still preserved in these animals as the Blood urea nitrogen (BUN) levels were similar to the WT mice (Figure 5B). Quantification of the renal arterial vascular area fractions detected by immunostaining using an anti-Myh11antibody in the two DTA models showed no significant differences in comparison to the WT control group [Figure Suppl6 A–D: WT-3W: 2.33±0.24 % (n=6); Ren1d-DTA −3W: 2.15 ±0.15 % (n=6); Ren1dCre;ROSA-DTA-3W: 2.38±0.45% (n=4), NS-Non-significant)].
Figure 5. Histological changes due to DTA-mediated ablation of RPCs and CoRL:
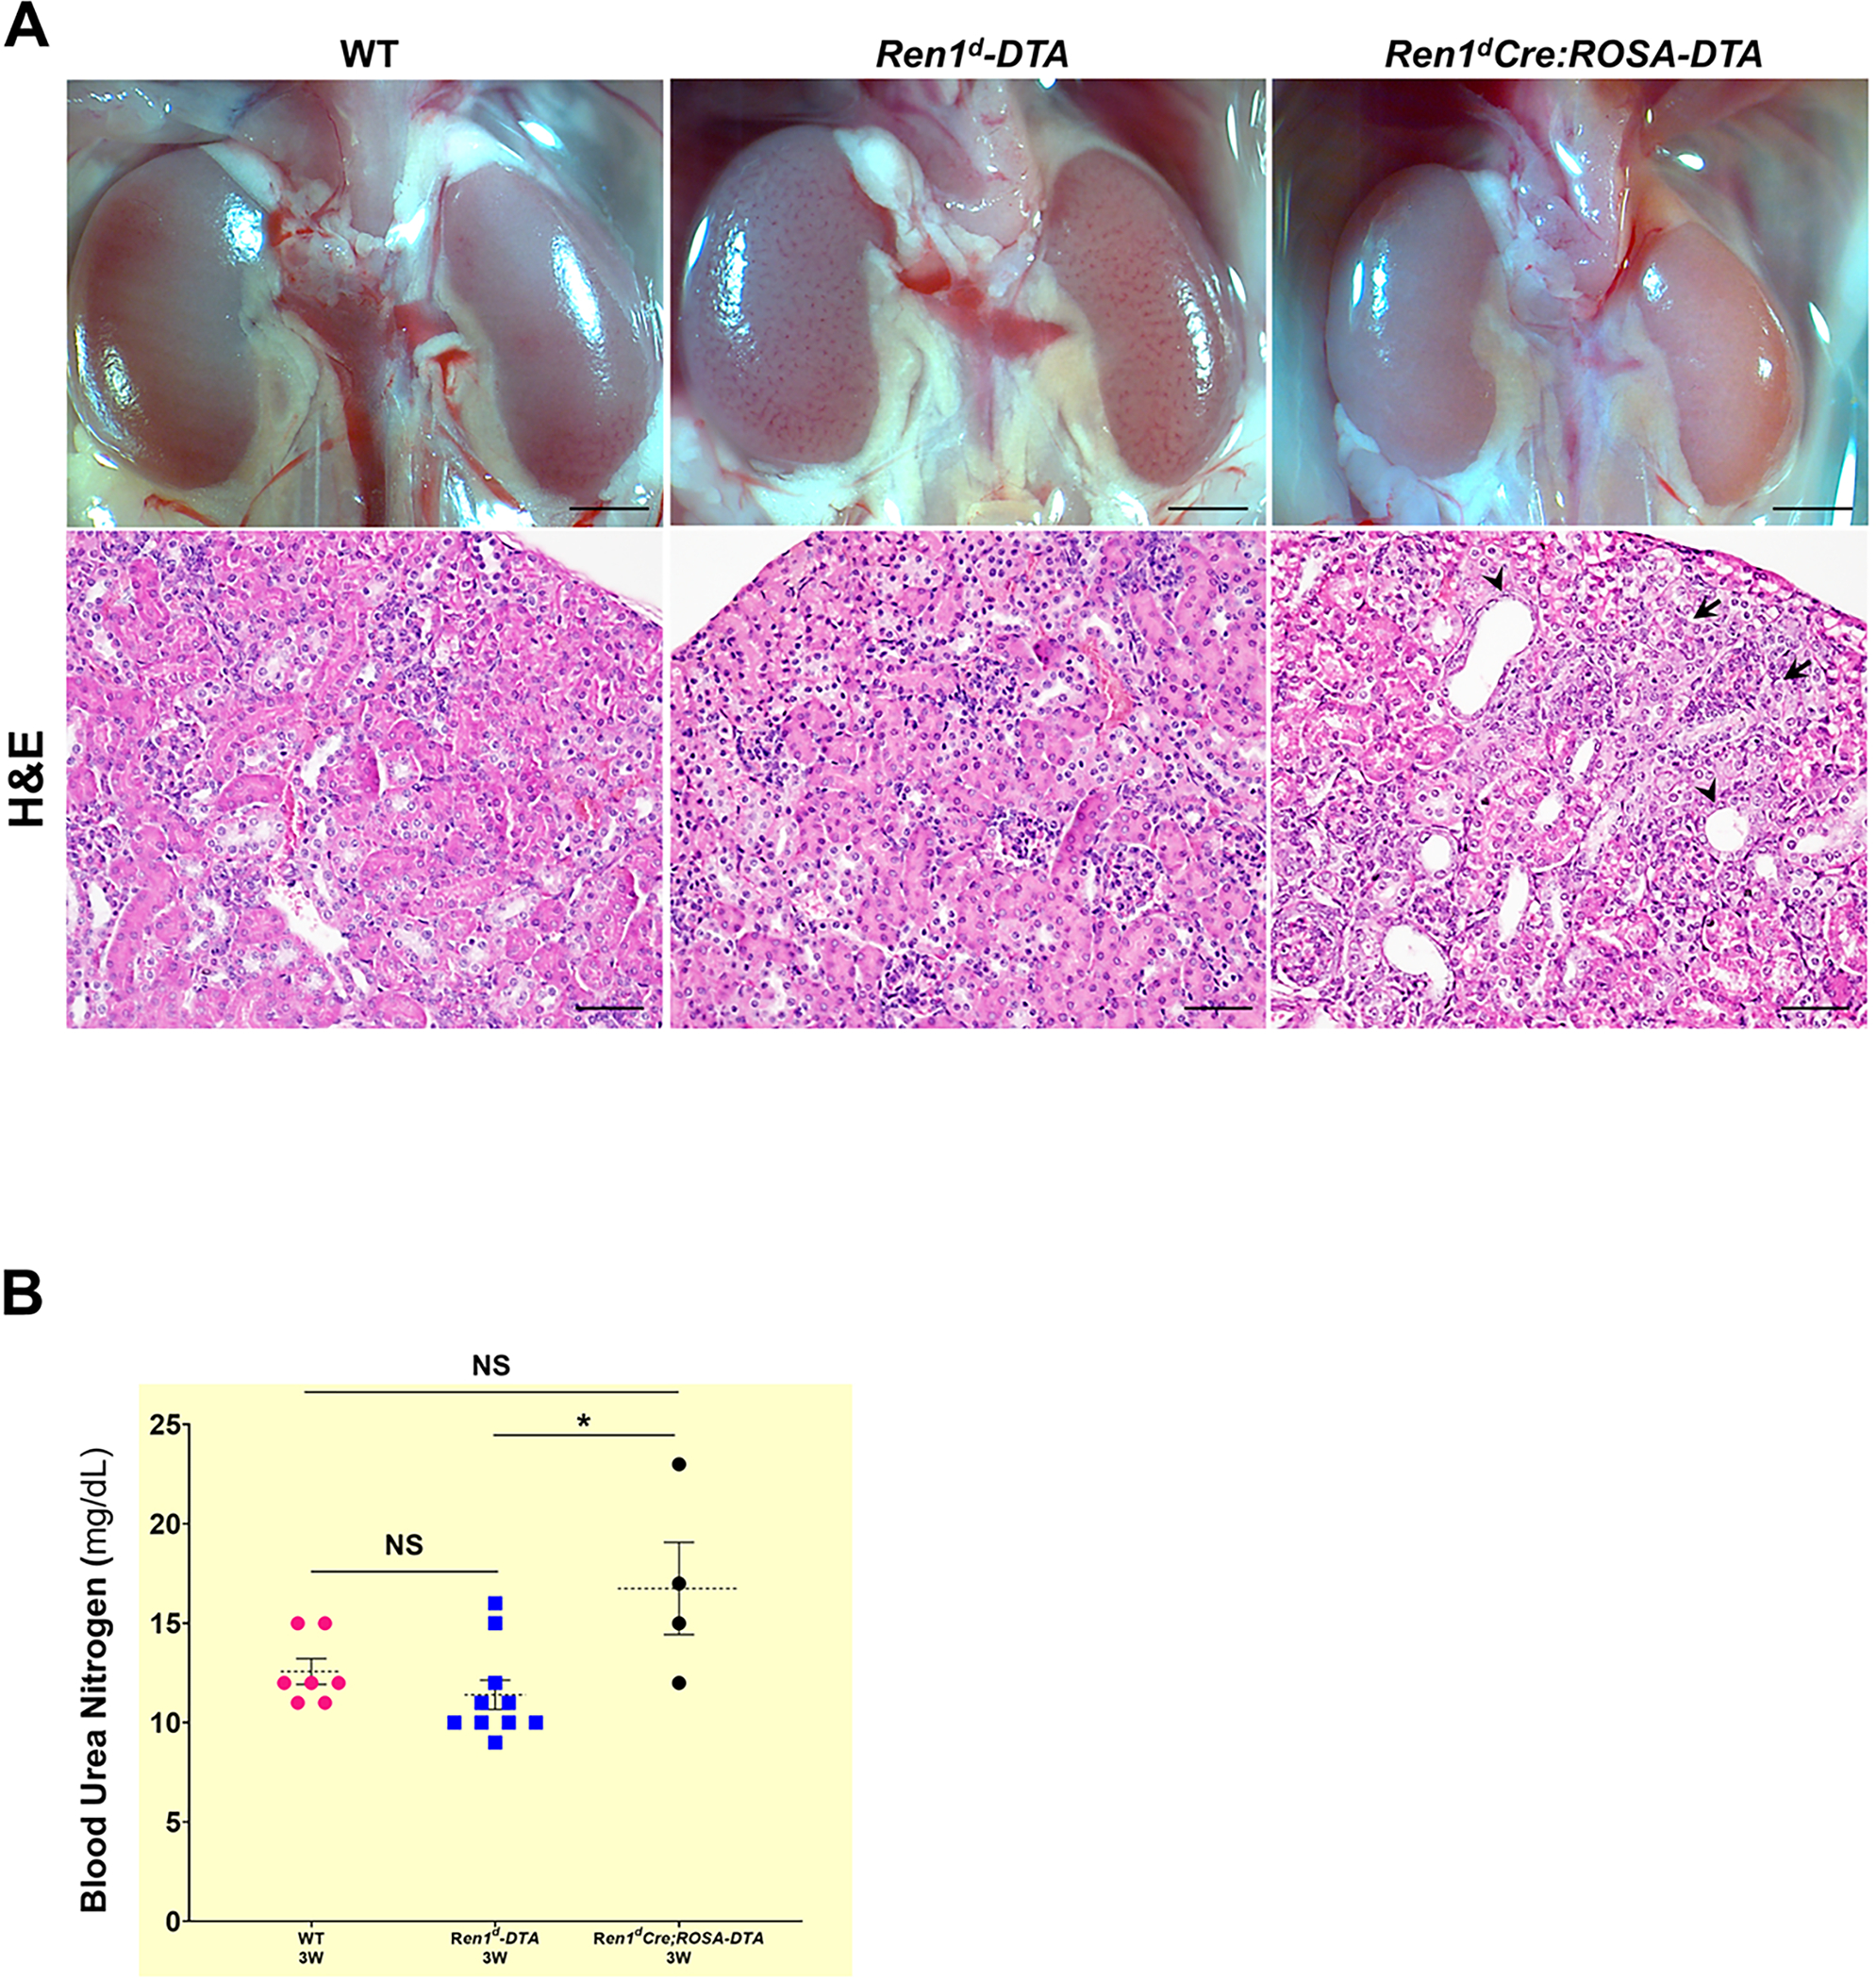
(A) Micrographs on whole kidneys and H&E staining on the kidney sections from 3W old WT, Ren1d-DTA, and Ren1dCre;ROSA-DTA animals under basal conditions. Kidneys of Ren1d-DTA mice with intact CoRL showed normal tissue histology similar to the WT group. However, kidney sections of Ren1dCre;ROSA-DTA genotype showed focal sclerotic areas in the renal cortex (black arrows) and tubular dilations (arrowheads) (Scale bar 50μm) (B) BUN levels of the 3W old DTA-positive animals, are not significantly different from the similar age group of WT animals indicating that the kidney function is preserved in the DTA-positive animals (*P<0.05; NS non-significant).
Due to the kidney damage observed in Ren1dCre;ROSA-DTA mice, we checked the expression levels of the genes that promote tissue injury in the non-surgery animals of both DTA models. qRT-PCR showed that Tgfβ1 mRNA levels in the DTA-expressing mice were similar to the WT group (Figure Suppl 7A). However, in the kidneys of Ren1dCre; ROSA-DTA mice, the mRNA levels of tubular injury marker KIM-1 and αSMA, a marker for activated myofibroblasts that promote tissues fibrosis, were significantly elevated (Figure Suppl 7B–C). In addition, the collagen-positive areas (Figure Suppl 7D–G) measured by Massons’ Trichrome staining showed no significant differences between all the genotypes. These results indicate that though the depletion of CoRL in Ren1dCre;ROSA-DTA mice exacerbates the levels of the kidney injury marker KIM1 (Figure Suppl 7A), there is no renal fibrosis at this stage (Figure Suppl 7D–G).
2.7. Ablation of CoRL affects the survival and the ability of the kidneys to regenerate after the removal of the obstruction.
We performed the obstruction and release surgeries in DTA-expressing newborn pups (Figure 1A) to see the effect of ablation of the CoRL on the progression of kidney damage after obstruction and the extent of repair following its release. In addition, we analyzed the growth and development of mice from both DTA genotypes at different time points post-surgery. Ren1dCre;ROSA-DTA group at 1W after the obstruction showed a significant decline in the body weight (Figure Suppl 8A). Similarly, the body weight of the sham and post-release groups, but not the obstructed group at 3W, was significantly lower in ROSA-DTA compared to Ren1d-DTA mice (Figure Suppl 8B). However, the kidney-to-body weight ratio was similar between both DTA groups (Figure Suppl 8C–E). These results indicate that ablation of CoRL affects the body weight gain in the surgery animals with no influence on the kidney-to-body weight ratio. Similarly, not many changes were seen in the hydronephrotic scores post-obstruction, indicating the extent of obstruction damage is similar between the DTA-genotypes (Figure Suppl 8F). However, the survival of the pups and the percentage of kidneys that recovered from the damage (caused by obstruction) were significantly reduced in the Ren1dCre;ROSA-DTA group compared to the Ren1d-DTA genotype (Figure Suppl 8G–H). Comparing these genotypes with the WT animals2 further confirmed that ablation of CoRL compromised the survival and the ability of the kidneys to regenerate after the removal of the obstruction (Figure Suppl 8G–H). Table 1 shows the details on the survival and mortality of each surgical procedure for the 3 genotypes studied.
Table 1.
Comparison between the genotypes on the survival post-surgery
| Genotype | Sham | Obstructed | Obstruction-released |
|---|---|---|---|
| DTA-Negative (WT)† | 71(4) | 123(28) | 94(3) |
| Ren1d-DTA | 20(5) | 25(10) | 14(0) |
| Ren1dCre:ROSA-DTA | 18(7) | 28(21) | 12(1) |
Numbers in parenthesis indicate the number of animals dead post-surgery
WT includes animals obtained during the current and previous studies
In contrast to the WT-kidneys (Figure 1B and C), the DTA-positive mice did not show changes in the distribution of renin-positive cells by immunostaining (Figure 6A–B; Suppl 9A–H) and plasma renin levels by ELISA (Figure Suppl 9 I–J) in response to the surgical treatments. However, the Ren1d-DTA group showed changes in the renin mRNA levels similar to the WT mice (Figure 1D) but not the Ren1dCre;ROSA-DTA mice (Figure Suppl 9K–L). Similarly, GFP+ CoRL did not increase due to obstruction in the Ren1dCre;ROSA-DTA mice (Figure 6C) in contrast to the WT group (Figure 2). Thus our results indicate that significant ablation of the CoRL in the Ren1dCre;ROSA-DTA mice predispose them to kidney injury (Figure 5A; Figure Suppl 7B–C), poor survival post-surgery, and compromised kidney repair following the relief of obstruction (Figure Suppl 8G–H). Moreover, DTA-mediated ablation of RPCs and CoRL mitigates the obstruction-mediated surge in the RPCs and CoRL.
Figure 6. Ablation of renin cells prevented the increase in the number of renin cells following persistent obstruction:
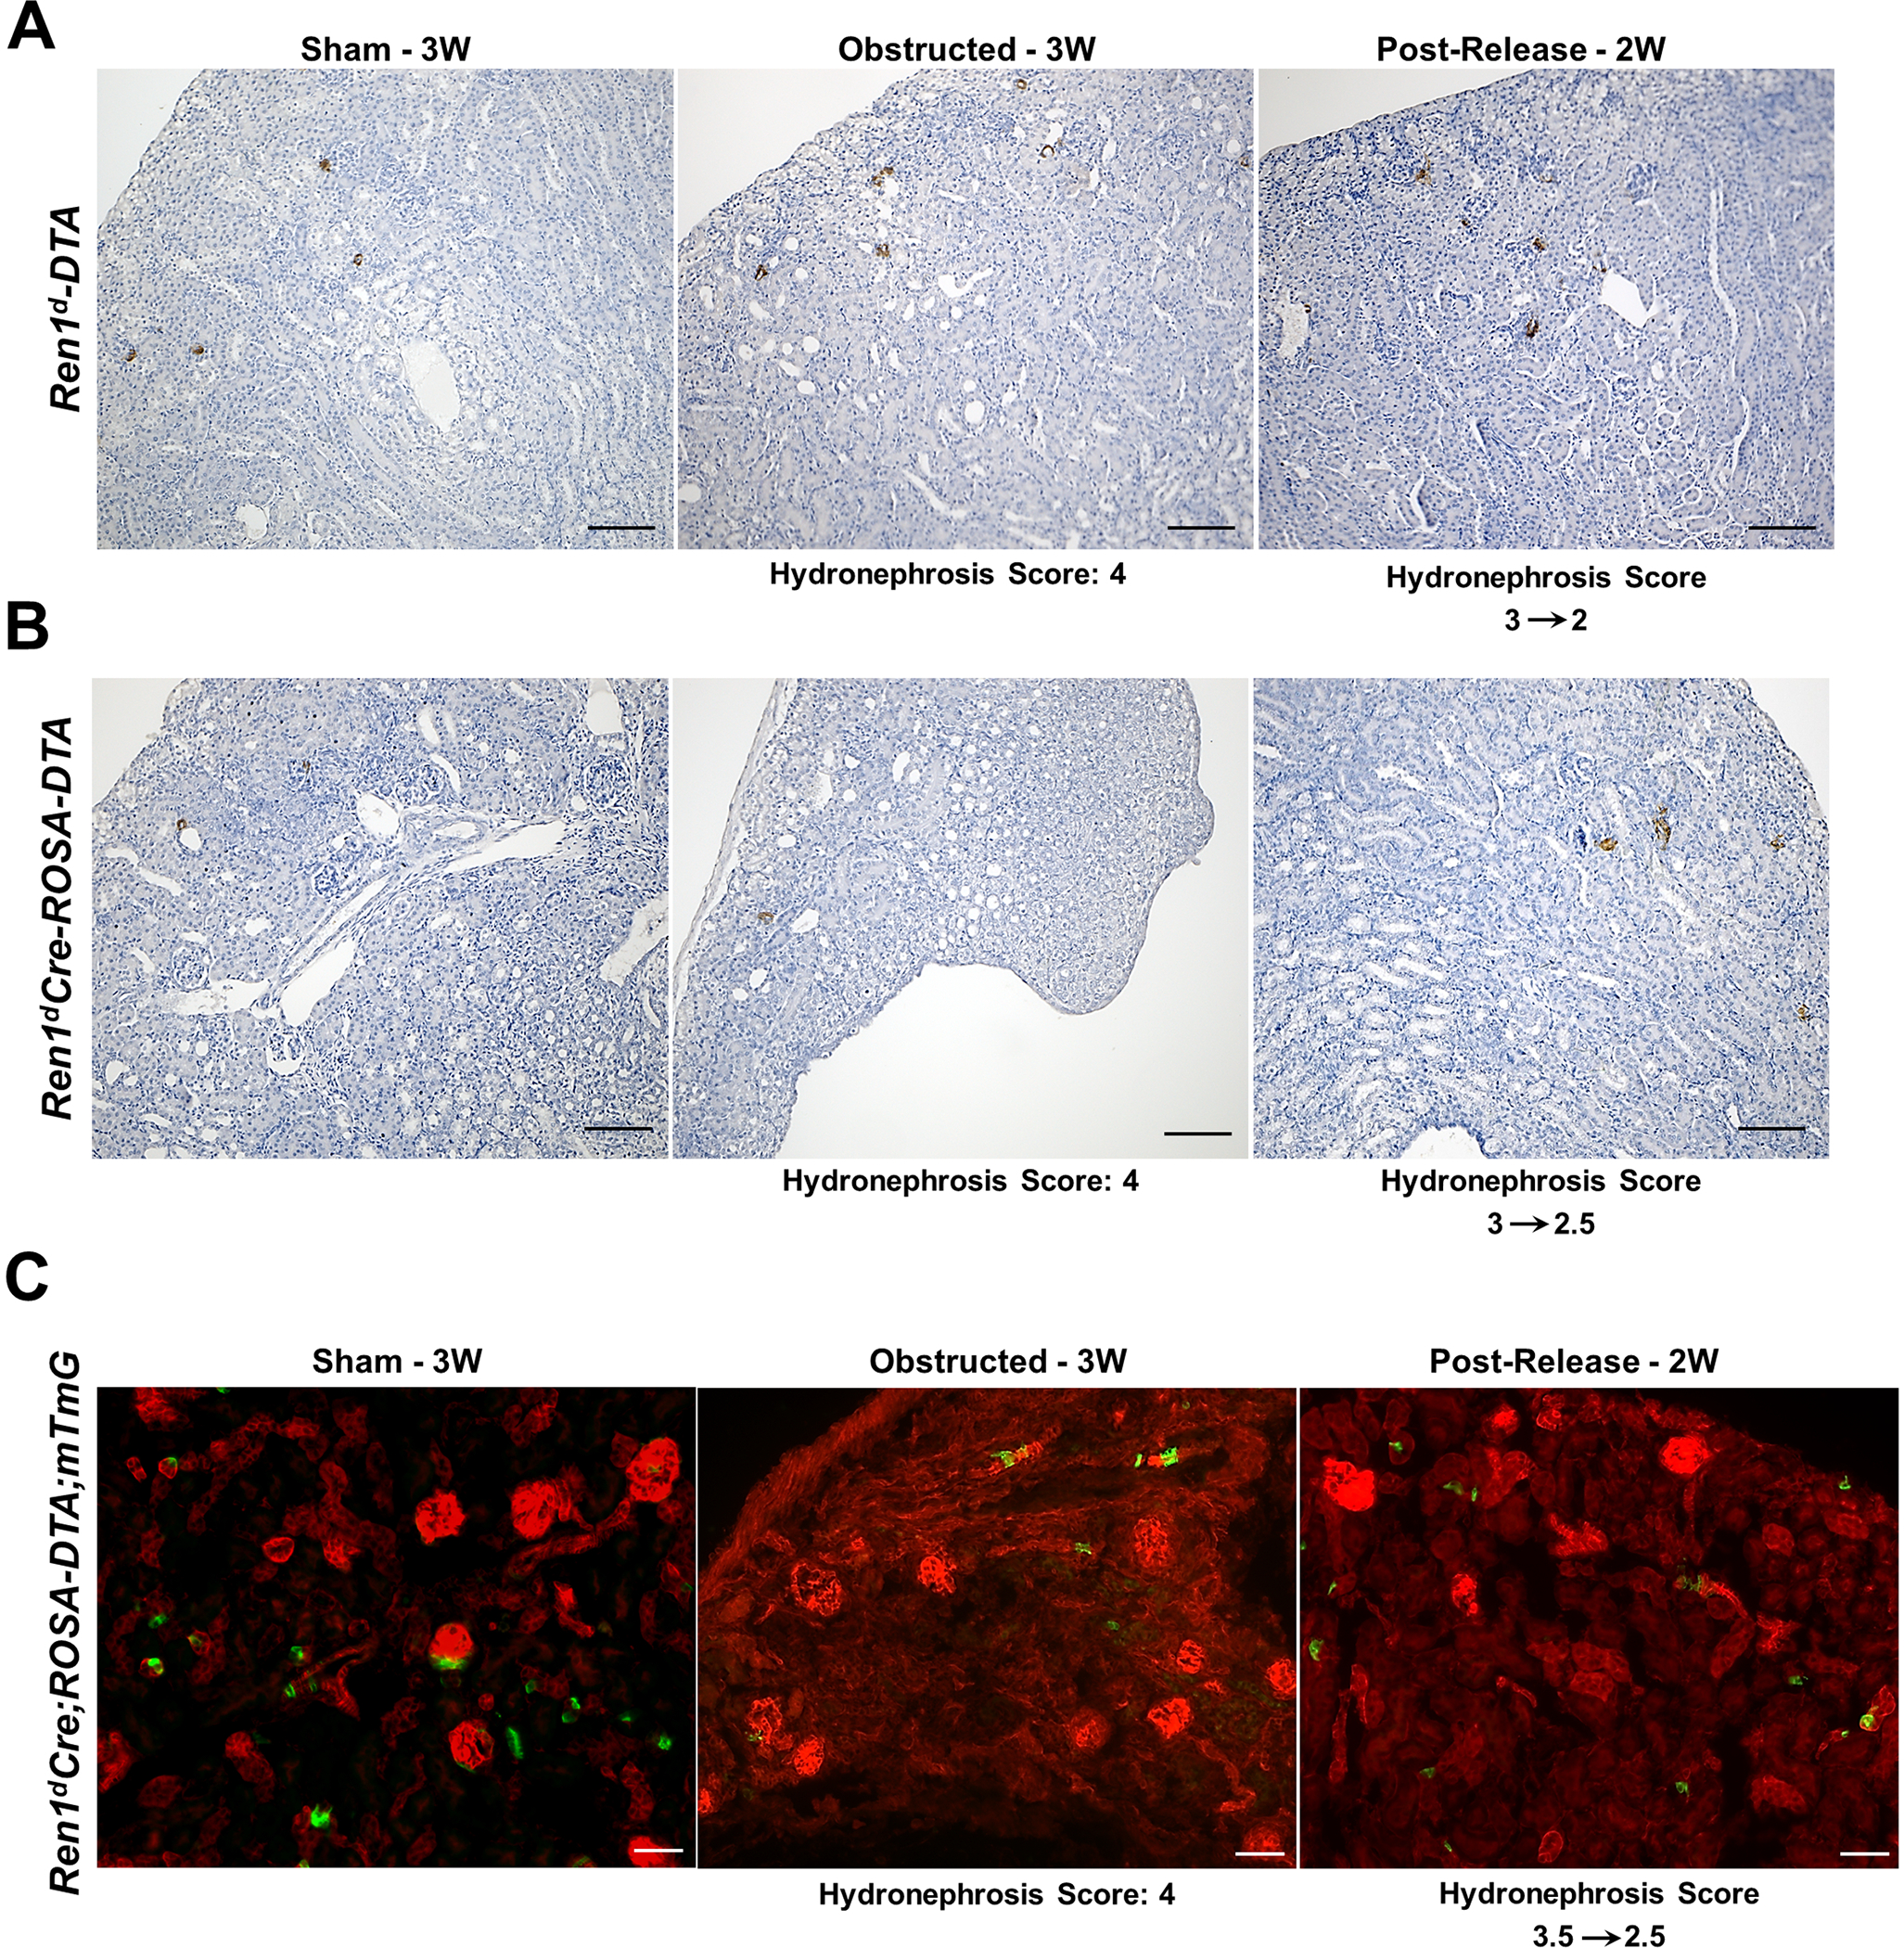
(A-B) Immunostaining using an anti-renin antibody on kidney sections from DTA-positive animals post-surgery show renin-positive cells are reduced in both the DTA-expressing Ren1d-DTA and Ren1dCre;ROSA-DTA genotypes and the effect is more pronounced in the latter (Scale bar 50μm) (C) Lineage tracing on kidney sections from 3W old Ren1dCre;ROSA-DTA;mTmG mice expressing DTA and GFP in the RPCs and CoRL shows a considerable reduction of the GFP+, CoRL in the sham-operated kidneys. Also, the obstructed kidneys did not show any increase in the distribution of GFP+ cells as observed in the non-DTA animals (Scale bar 50μm).
2.8. Ablation of the CoRL increases the interstitial fibrosis caused by persistent obstruction
Our previous studies using Masson’s trichrome staining on the kidneys of WT mice revealed extensive fibrosis following the persistent obstruction at 3W, which is mitigated by its removal after one week2. These changes correspond to the dynamic shifts in the RPCs and CoRL seen in response to the obstruction and release surgeries in the current study (Figures 1 and 2). However, in DTA-positive animals, the RPCs and CoRL are depleted (Figures 3 and 4), and the remaining cell population do not change much in response to the surgeries (Figure 6). Therefore, we wanted to check if this phenomenon affects tissue injury and repair.
By Masson’s trichrome staining, we measured the collagen-positive areas in the kidneys of the DTA-models (Figure 7A–B). In the obstructed kidneys, the extent of interstitial fibrosis increased with the HI index. Similar to the DTA-negative, WT mice (Figure 7C)2, the increases in the collagen-positive areas post-obstruction were significantly reduced following the release only in the Ren1d-DTA genotype (Figure 7D). However, in the Ren1dCre;ROSA-DTA mice, the fibrotic area fraction post-release was not significantly different from either the sham or the obstructed groups, indicating that their recovery is only partial in this genotype (Figure 7E). These results suggest that ablation of CoRL to a greater extent in the Ren1dCre;ROSA-DTA mice may have compromised the ability of the kidneys to regenerate completely from the tissue damage (Figure 7D–E; Collagen-positive area fraction: Ren1d-DTA: Sham-3W: 4.43±1.92% (n=9); Obstructed-3W:20.25±4.39% (n=10); Post-Release-2W: 6.54±0.57% (n=9) Ren1dCre;ROSA-DTA: Sham-3W: 10.04±0.89% (n=6); Obstructed-3W: 36.60±12.88% (n=5); Post-Release-2W: 15.45±2.91% (n=6)).
Figure 7. Depletion of CoRL exacerbates kidney fibrosis and impairs recovery during pUUO:
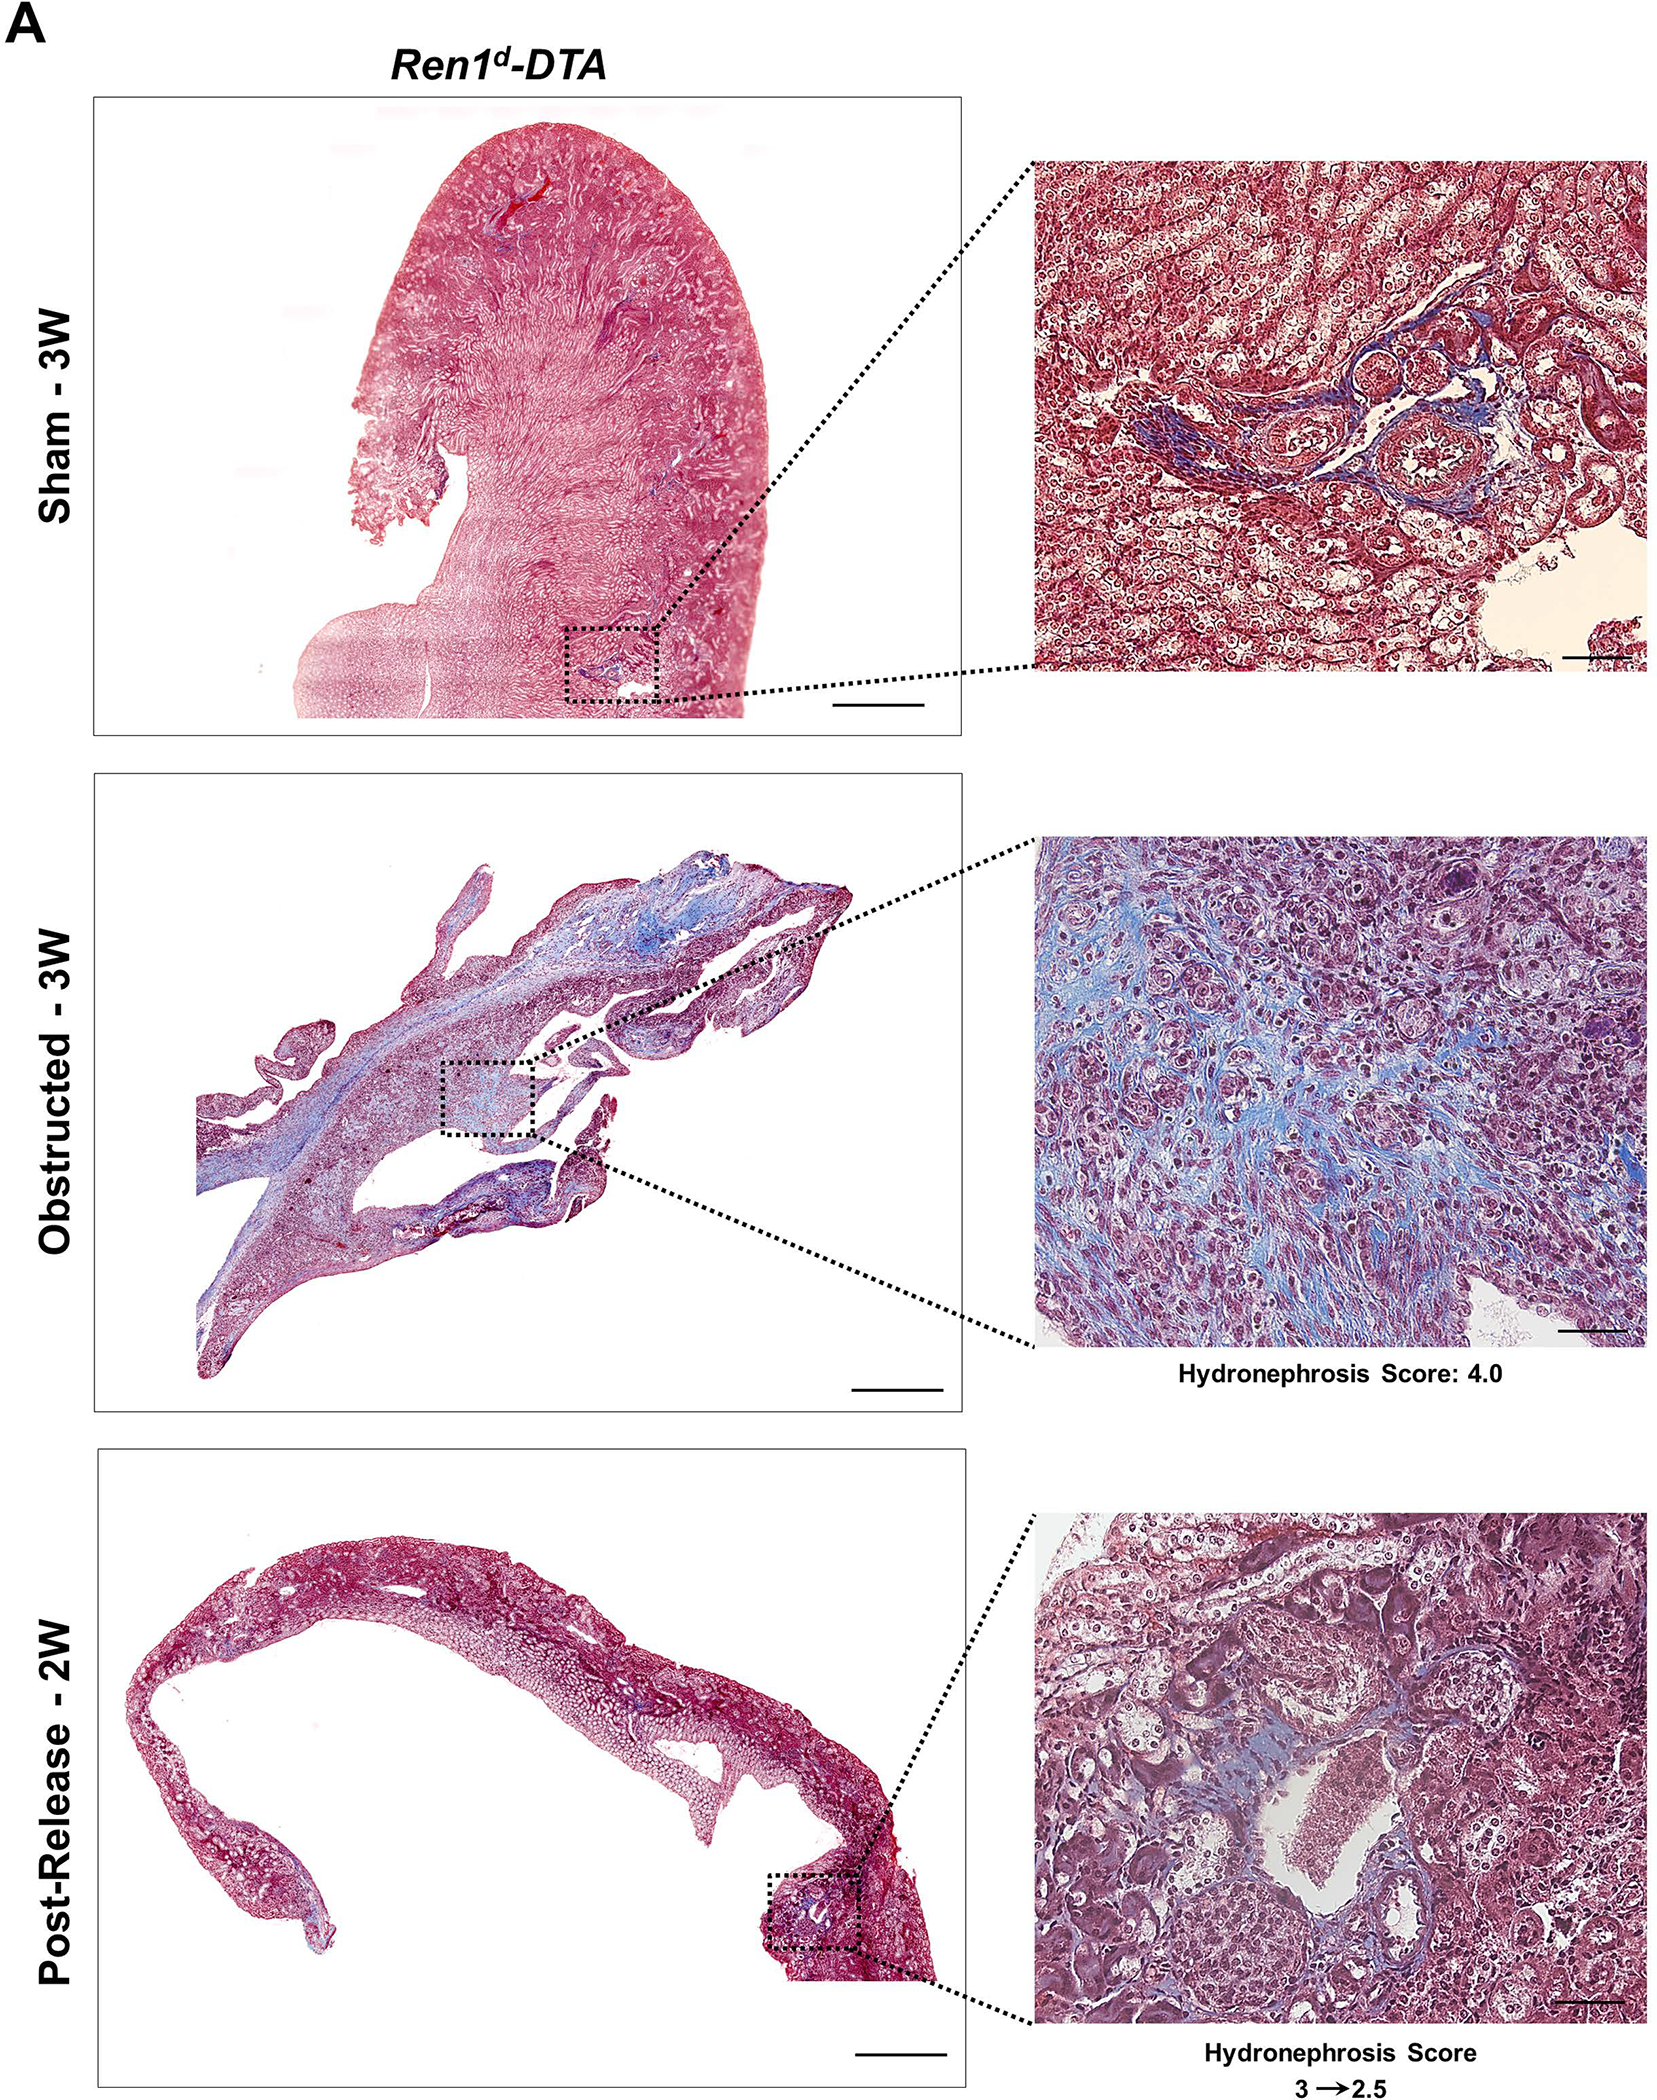
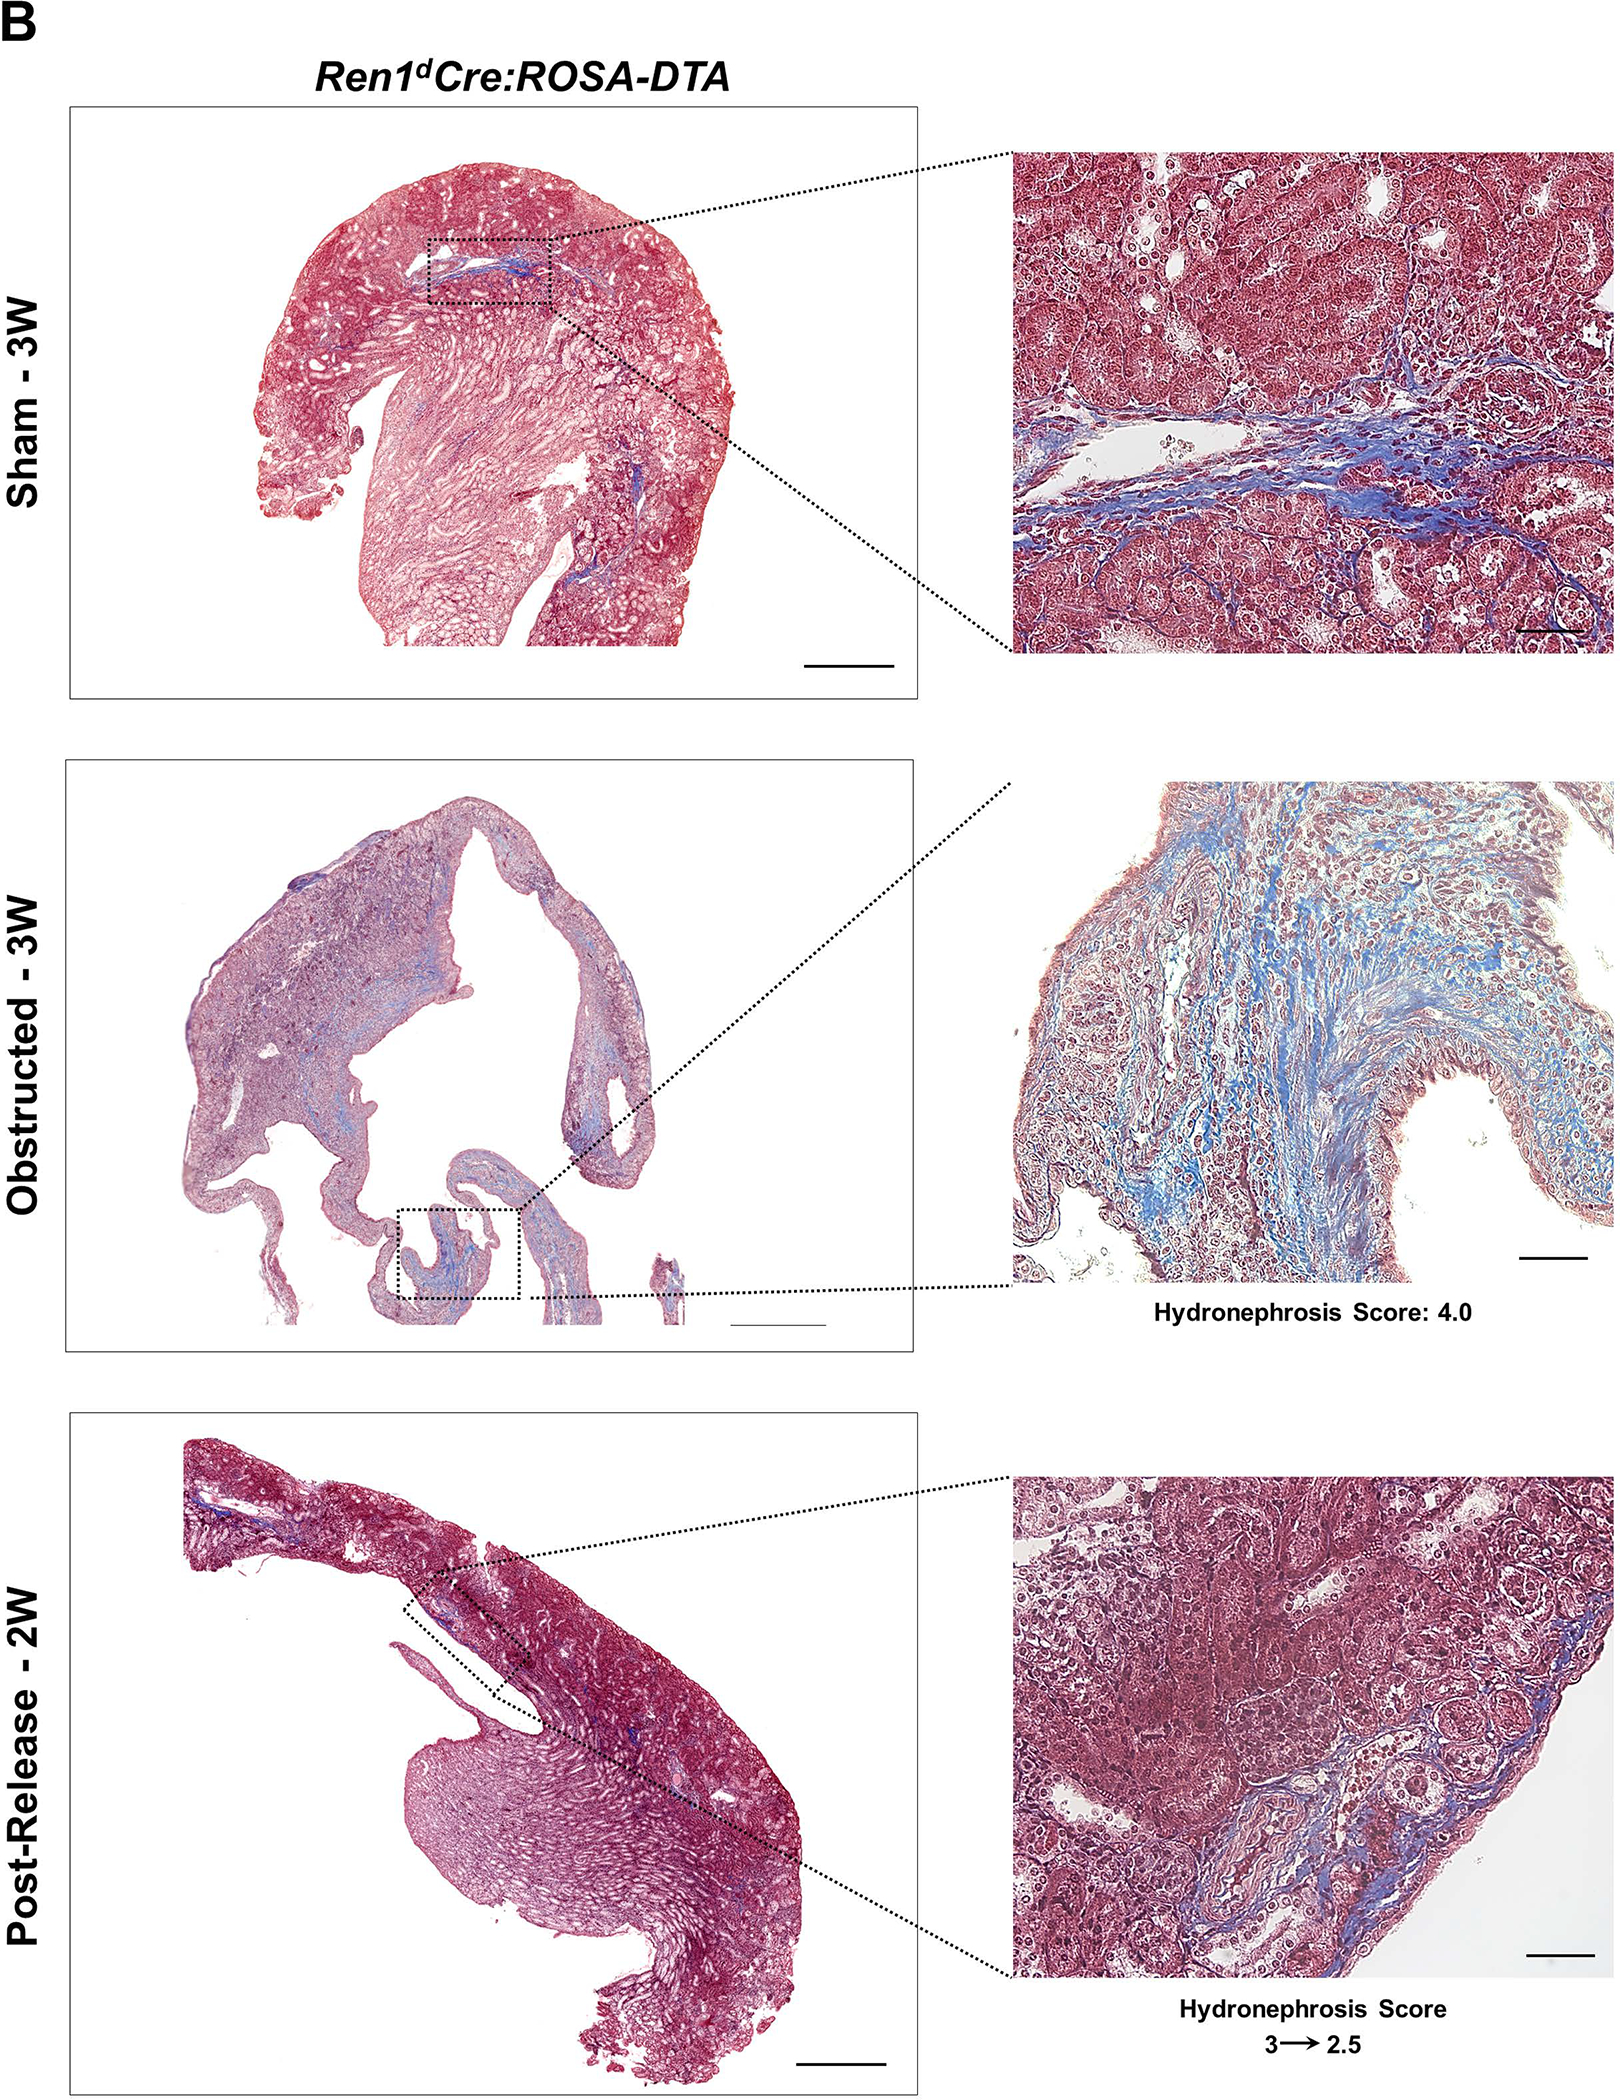
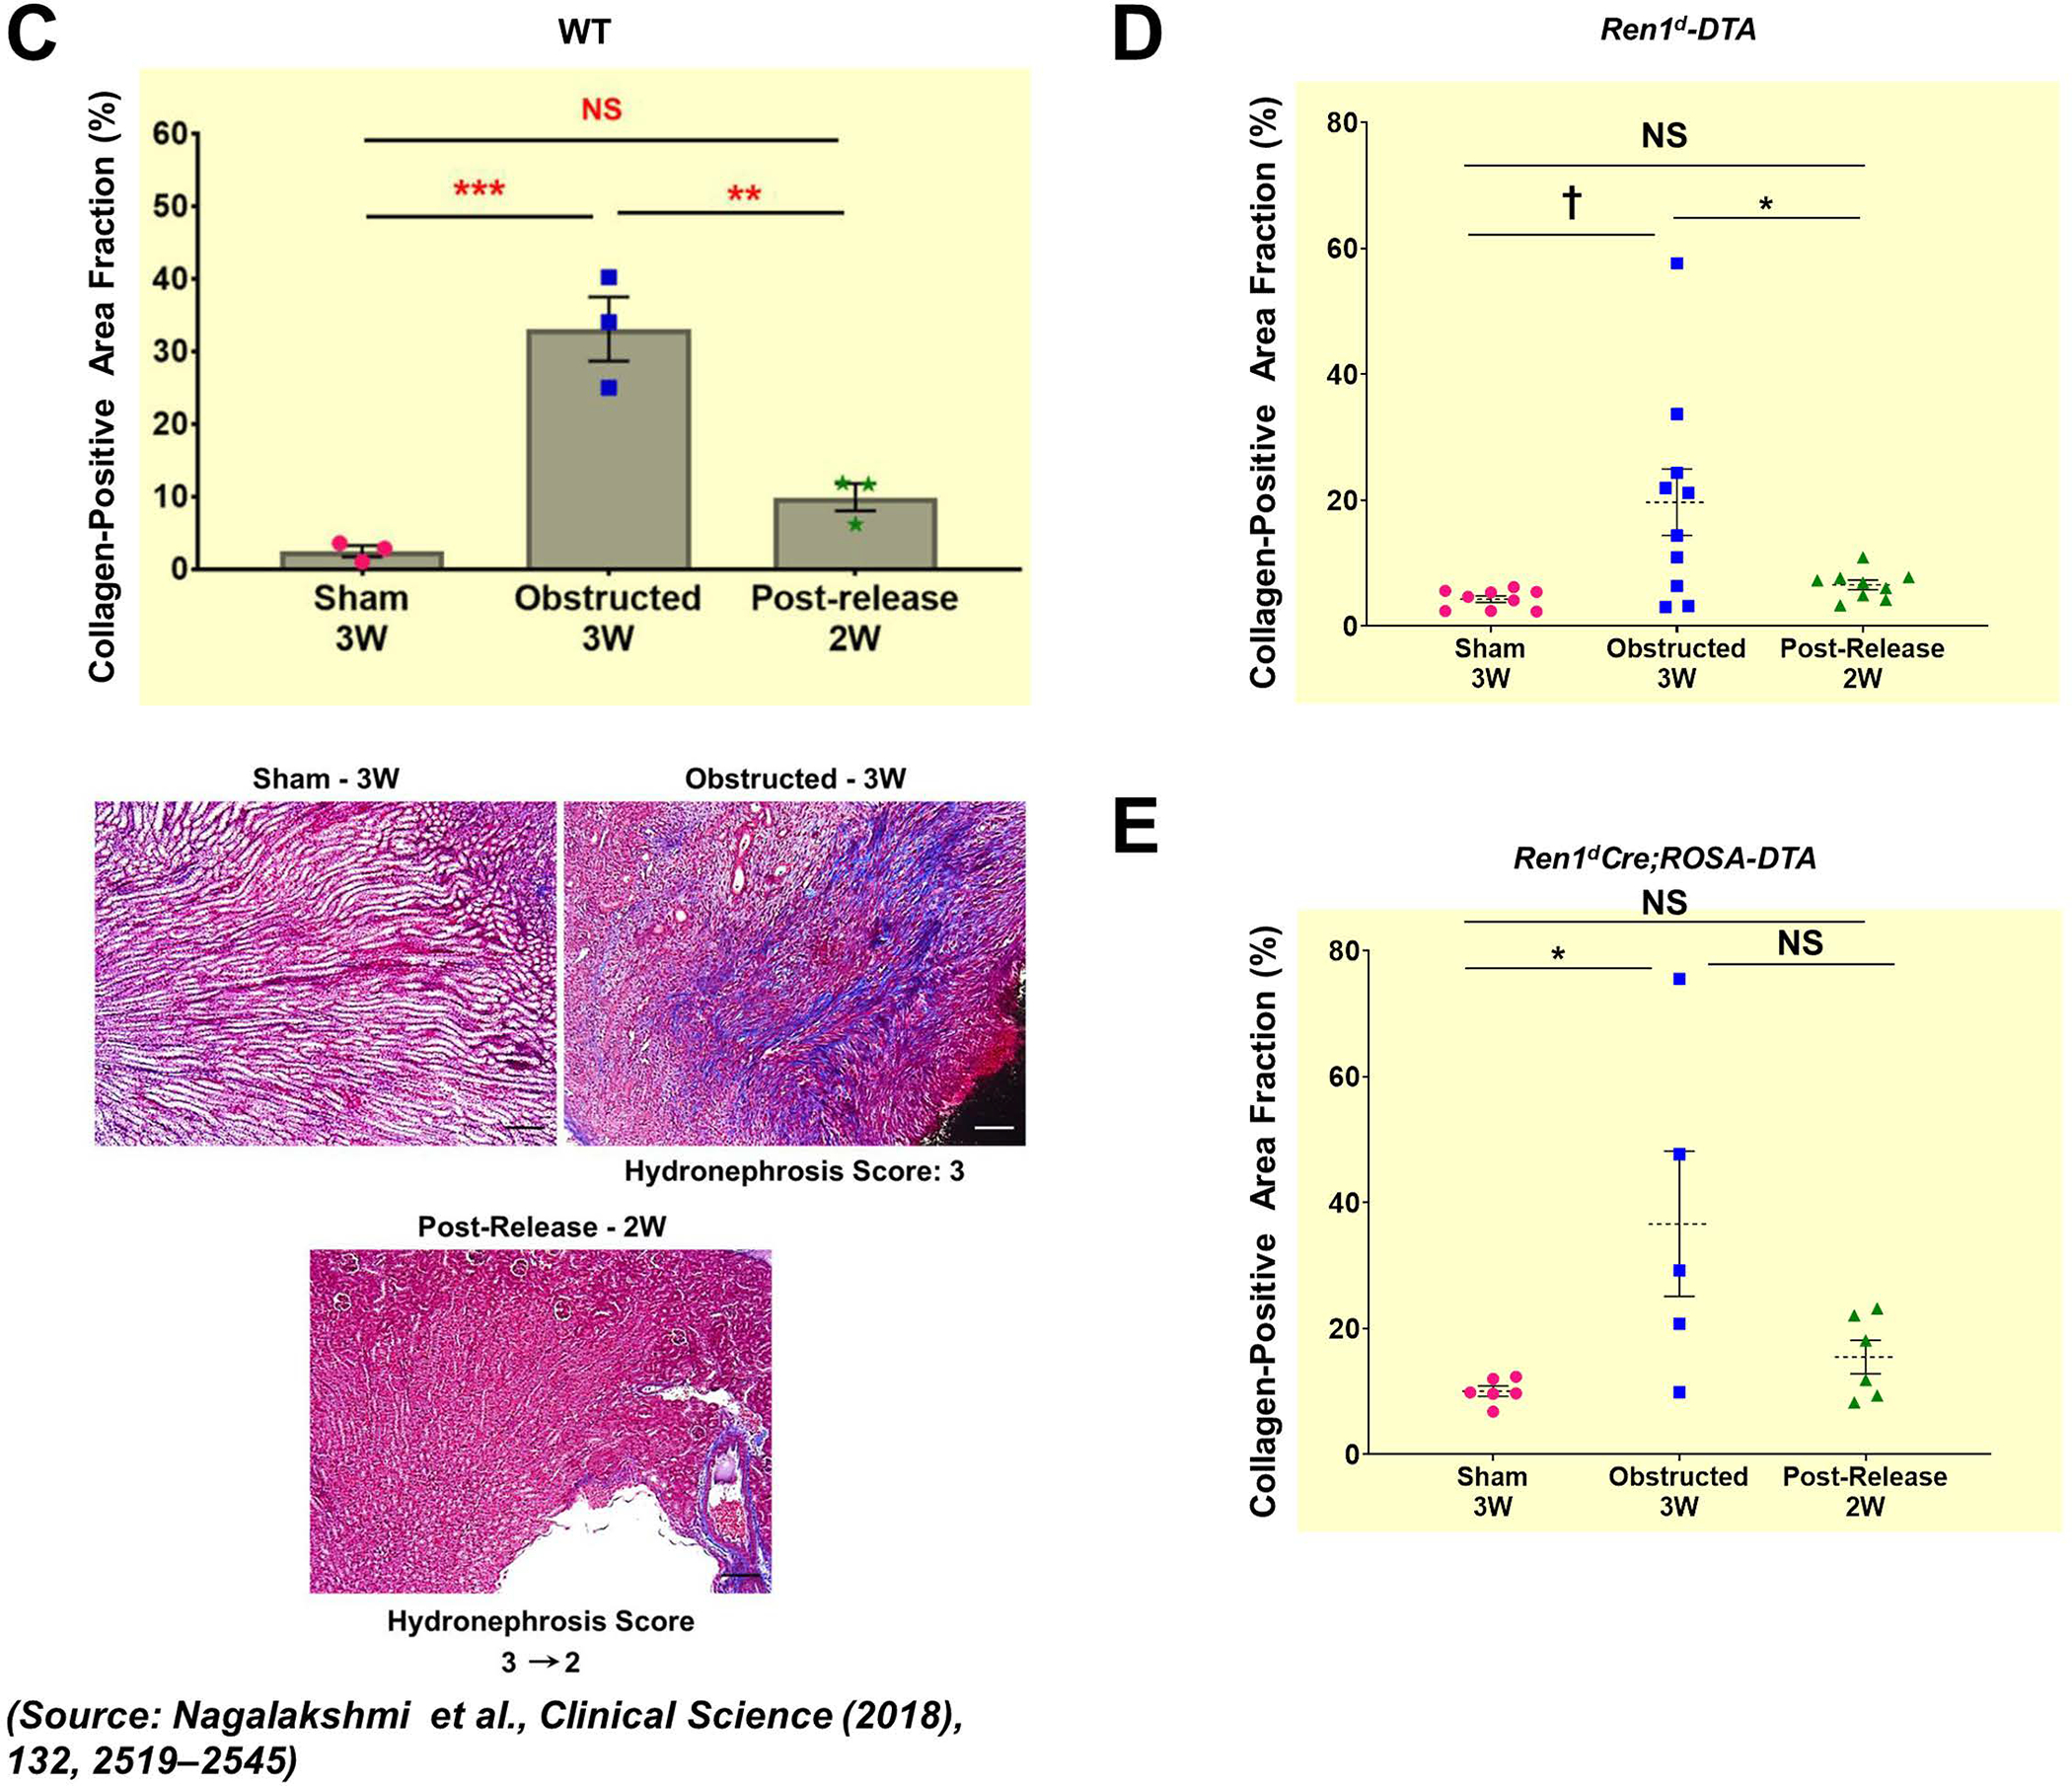
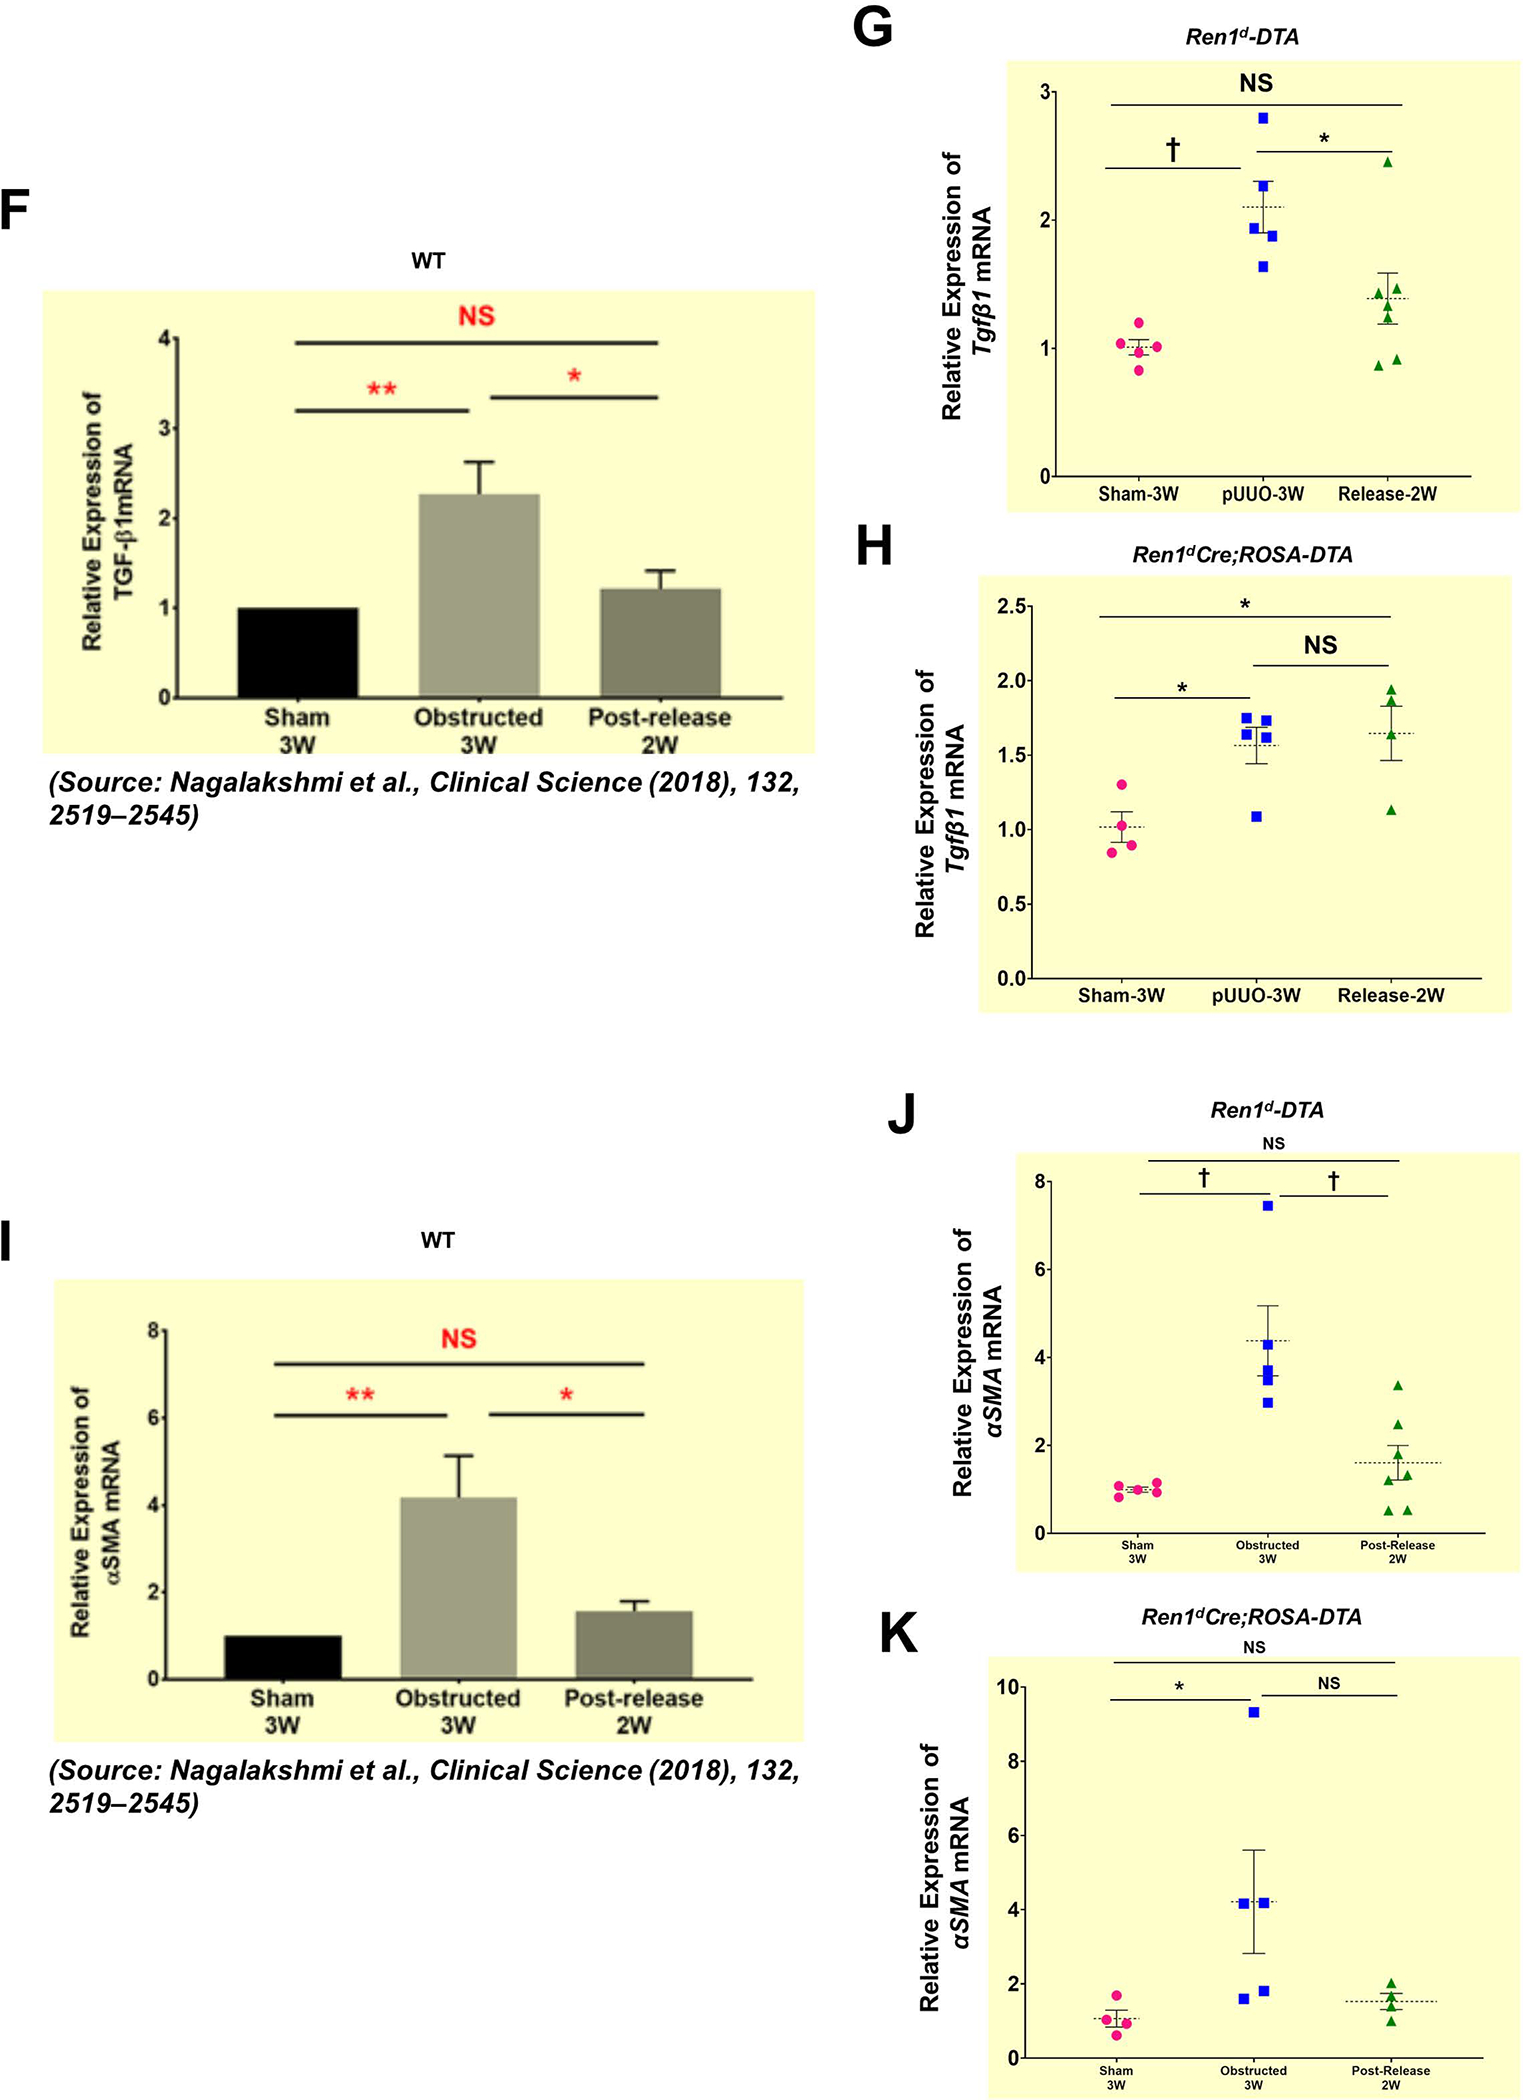
(A-B) Representative tile scan images on the left and enlarged view on the right show Masson’s Trichrome staining on the kidneys from various surgery treatments. Exacerbated collagen deposition occurs in the persistently obstructed kidneys. In addition, depletion of CoRL in Ren1dCre;ROSA-DTA animals leads to a poor recovery from the fibrotic damage following the relief of obstruction (Scale bar 500μm, 50μm) (C-E) Quantification of the collagen-positive, fibrotic area fractions in the kidneys confirmed a significant increase post-obstruction in both DTA models similar to the WT mice with no toxin expression. Following the removal of obstruction the fibrotic areas decreased significantly in the WT and Ren1d-DTA goup. In Ren1dCre;ROSA-DTA animals, the collagen-positive area was lower, although did not reach statistical significance after the relief of obstruction compared to the persistently obstructed kidneys (F-H) Tgfb1 mRNA measured by qRT-PCR increased in the obstructed kidneys of the DTA and WT animals. Release of obstruction abrogated the obstruction-mediated surge in Tgfb1 levels only in the WT and Ren1d-DTA mice. The Ren1dCre;ROSA-DTA group exhibited elevated levels of Tgfb1 expression even after 2W post-relief of obstruction (I-K) qRT-PCR for αSMA shows a significant decrease at 2W after the release of obstruction in the kidneys of both the WT and Ren1d-DTA mice, but not in the Ren1dCre;ROSA-DTA mice (*P<0.05; †P<0.01; ‡P<0.001; NS non-significant).
Tgfb1mRNA expression levels by qRT-PCR increased post-obstruction in both DTA-genotypes. However, relief of obstruction decreased the Tgfb1 levels only in the Ren1d-DTA group as seen in the WT mice2 (Figure 7F–G) but not in the Ren1dCre;ROSA-DTA group (Figure 7H). αSMA is a marker of activated myofibroblasts stimulating fibrotic damage during tissue injury. αSMA mRNA expression by qRT-PCR increased after obstruction in both the DTA models. The obstruction removal after 1 week decreased the αSMA mRNA to the levels of the shams only in the Ren1d-DTA group similar to the WTmicein our previous studies2 (Figure 7I–J). However, in the ROSA-DTA group, the αSMA expression levels post-release were lower than most of the obstructed mice but did not reach statistical significance, indicating that the recovery from the damage after the release of obstruction is only partial in this genotype (Figure 7K).
In addition, when we measured the mRNA levels of KIM-1, a tubular injury marker, we observed differences between the Ren1d-DTA and the ROSA-DTA groups. In the Ren1d-DTA group, the KIM1 expression was increased post-obstruction, and the obstruction removal ameliorated the tubular injury (Figure Suppl7H). However, in the ROSA-DTA mice, the basal levels of KIM1 were significantly high (Figure Suppl7B) and there was no change post-surgeries (Figure Suppl7I). Since the Ren1dCre;ROSA-DTA mice undergo tubular injury at the basal states due to the permanent expression of DTA in the CoRL, KIM1 may not be an ideal candidate to test for kidney repair in this model.
These results collectively suggest that the kidneys’ ability to repair from the obstruction injury is compromised in the Ren1dCre;ROSA-DTA mice due to the significant depletion of CoRL indicating that the presence of the renin lineage cells is indispensable for kidney regeneration post-release of obstruction.
3. Discussion
We explored the role of renin-producing cells and CoRL in kidney damage and repair using a pUUO model in neonatal mice and found that i) renin cells undergo dynamic changes during persistent ureteral obstruction and release of obstruction ii) CoRL do not contribute directly to interstitial fibrosis iii) ablation of renin cells impairs the reparative response and the ability of the kidney to recover and regenerate after removing the obstruction.
Ureteral obstruction activates the renin-angiotensin system (RAS), a crucial mediator in promoting renal tubular-interstitial fibrosis and atrophy9,10,11,21,22. The onset of RAS activation mediated by the increase in renin has been reported in several animal models of ureteral obstruction. In these models, the ureteral blockage increased the number of renin cells in the JG area and along the afferent arterioles3,4,5,6. Our current study on neonatal mice corroborates previous findings, as we observed an increase in the RPCs to 163.16% post-obstruction. Moreover, the expansion of the renin-positive areas was not sex-dependent and increased with the damage. Kidneys without hydronephrotic damage showed no change in the RPCs (data not shown). Because the severity of the obstruction varies between the mice within the obstructed group2,23, as it happens in human babies with congenital ureteral obstruction, we observed heterogeneity in the distribution of RPCs between the tissue samples.
The activation of the intra-renal RAS in response to the ureteral blockage in the obstructed kidneys is attributed to several factors, including renal vasoconstriction and local hemodynamic changes2,24,25,26, sympathetic nerve activity4,5,30, and changes in the interstitial pressure and stretch following the obstruction26. Furthermore, the inherent cellular plasticity exhibited by the SMCs lining the afferent arterioles enables them to change their fate to an endocrine renin cell phenotype in response to challenges to homeostasis, an effect not due to an increase in proliferation13,28,29,30,16,31. The increase in renin-producing cells triggered by the ureteral obstruction is reversed following the relief of obstruction in the current study and other studies on guinea pigs32 and neonatal rats7.
Our lineage tracing analysis with Ren1dCre;mTmG showed that the GFP+ CoRL increased under a persistent ureteral obstruction but not when the obstruction was removed. Those differences correspond to the different repair and regenerative responses exhibited by the kidneys under these conditions2,33. During chronic kidney injury, the kidneys trigger a cascade of regenerative reactions to repair them. The reparative responses include a surge in the population of inflammatory cells, increases in pro and anti-inflammatory cytokines, resident fibroblasts, vascular progenitors, macrophages, and renal and hematopoietic stem cells34,35,36,37. However, under a chronic injury stimulus without any intervention (as it occurs during persistent ureteral obstruction), these regenerative responses become counter-productive, resulting in a failed tissue repair, ensuing tissue fibrosis, and organ damage. The rise in RPCs and the CoRL in the JG areas, afferent arterioles, the intra-glomerular mesangium, and the parietal epithelium seen in the current study occurs only during the continued ureteral obstruction. Therefore, this increase may constitute a counter-productive regenerative response, as these events occur only in the presence of signals derived from the persistent obstruction and not during the kidney repair (Figure 8). Similar changes in renin lineage cells have also been reported in adult mice in response to glomerular and podocyte injury12,38,39,40,41 and vascular hypertrophy during chronic stimulation of renin cells15,16. The increased cellular proliferation triggered by a ureteral obstruction in neonatal 2,42 and adult UUO models12,43 may be attributed to cellular reprogramming and cell fate changes leading to the expansion of the CoRL during persistent obstructive injury.
Figure 8. A proposed model on the role of CoRL in kidney repair and regeneration following the neonatal pUUO and release of obstruction:
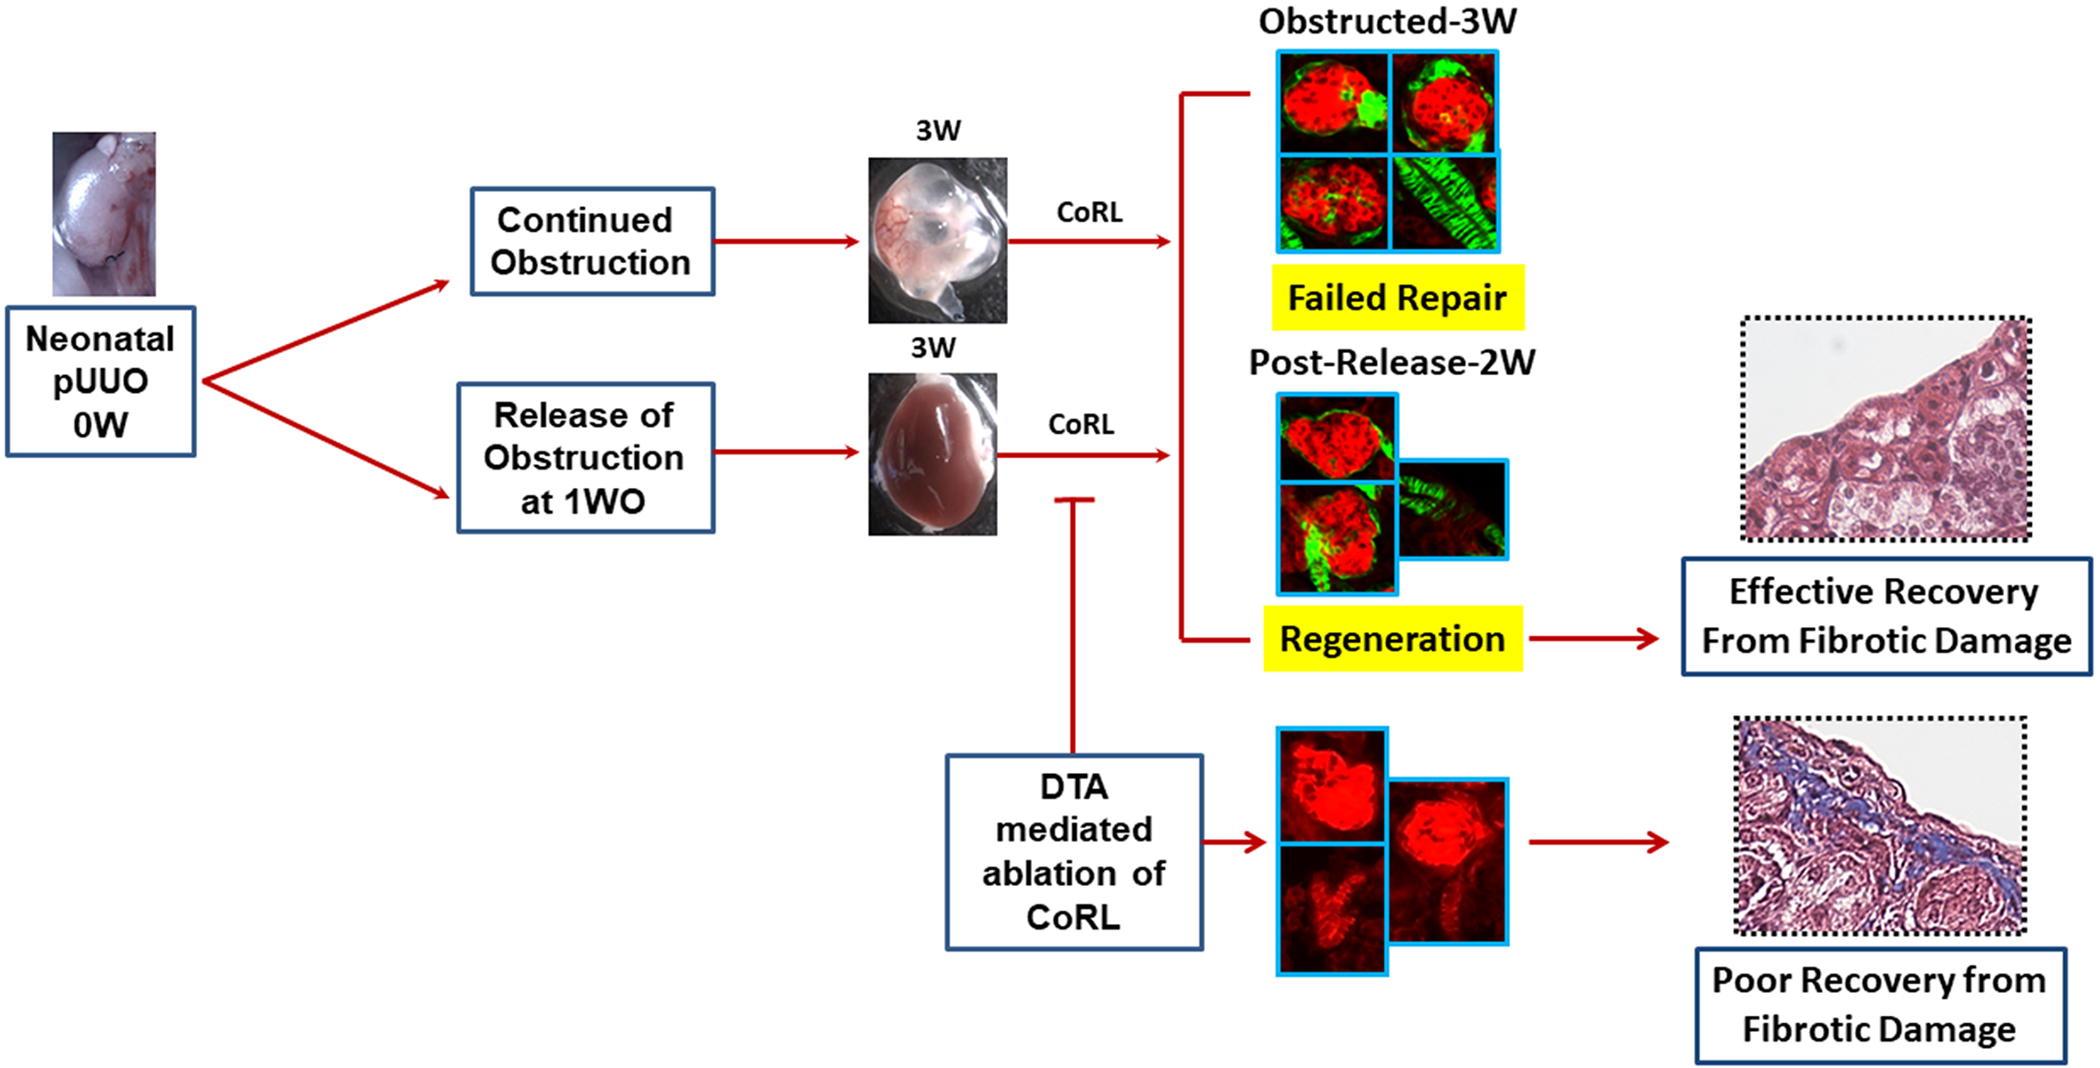
CoRL increases significantly in the mesangial, epithelial, and SMCs of the kidneys persistently obstructed for 3W. The increase in the renin-producing cells and lineage cells during continued obstruction is a counter-productive regenerative response resulting in a failed repair. However, the sustained increase in the vasculature-specific renin lineage cells seen after the release of obstruction could promote kidney regeneration. Besides, ablation and depletion of renin-lineage cells impair these reparative responses, thus the ability of the kidney to recover and regenerate after removing the obstruction.
However, the fate of CoRL in the kidney vasculature differs from those of other kidney cell types. Indeed, we observed an increase in the GFP+ CoRL in the renal vasculature both in the presence of continuous damage (persistent obstruction) and during kidney repair (i.e., following the removal of the obstruction). This suggests that CoRL may facilitate the regeneration of the vasculature post-release of obstruction to compensate for the vascular rarefaction the kidneys undergo during the first week of obstruction2. Our studies indicate that increases in the renin-producing cells and the GFP+ (renin-negative) CoRL in the glomeruli and the epithelium are primarily due to a failed reparative response in the presence of damage. However, the expansion of vascular-specific, GFP+ CoRL, could contribute to vascular repair and regeneration post-release obstruction (Figure 8).
The second finding of the current study is that we do not see any increase in the GFP+ renin lineage cells in the interstitium of the obstructed kidneys. This indicates that CoRL do not directly contribute to interstitial fibrosis, in contrast to the Foxd1+ stromal derived cells2, from which the renin-cell progenitors originate44. However, studies on adult mice suggested a potential migration of renin lineage cells to the interstitium in obstructed kidneys during the progression of renal fibrosis12. The differences between the studies suggest that CoRL behave differently in the neonatal than in the adult kidney injury models.
Next, we adopted cell-specific DTA-expression strategies 45,46,47,48 to remove RPCs and CoRL using genetic approaches. The mouse models we have generated (Ren1d-DTA; Ren1dCre;ROSA-DTA and Ren1dCre;ROSA-DTA;mTmG ) exhibited mosaic ablation of RPCs and CoRL. The extent of ablation varied between the models, with more severe ablation in Ren1dCre;ROSA-DTA mice compared to the Ren1d-DTA group. The differences in the degree of ablation are due to the differences in the mode of DTA expression between them. In the Ren1d-DTA mice, the renin promoter at the renin locus drives the DTA expression17; therefore, the toxin expression is restricted only to the cells actively producing renin. However, in the Ren1dCre;ROSA-DTA group, the stronger ROSA-promoter drives the DTA expression. Due to cre-recombination events at the Rosa26 locus, DTA is permanently expressed in all the renin cell derivatives. In addition, due to the differences in the promoter activity between the DTA models, we suspect that the DTA expression in Ren1d-DTA mice may have been rather low during development resulting in the survival of more lineage cells or by potential proliferation and replacement from other precursors.
As the DTA- models used in the current study did not respond to neonatal ureteral obstruction and release by increasing the RPCs and CoRL, they serve as an ideal system to evaluate the regenerative potential of the kidney in the absence of active recruitment of renin cells and the subsequent RAS activation, which are the typical responses to obstruction injury in the wild-type animals. We determined the regenerating potential post-release of obstruction in the DTA models by measuring the interstitial collagen deposition, an indicator of tissue fibrosis, and the expression levels of the genes that promote tissue injury, inflammation, and fibrosis. TGF-β149,50,51 and αSMA52 are markers well known to promote renal fibrosis during CKD. Our earlier studies in 3W-old wild-type mice showed that these markers increased significantly following the ureteral obstruction, and the surgical removal of obstruction keeps them under check2. We observed a similar response to obstruction and release of obstruction in the Ren1d-DTA mouse, where the DTA is expressed mainly in the active renin-producing cells. However, in the Ren1dCre;ROSA-DTA mice, where there is a severe depletion of CoRL despite removing the obstruction, the tissue fibrosis and the pro-fibrotic markers were maintained at elevated levels. Moreover, the status was not significantly different from the obstructed kidneys. In addition, the secondary defects due to the reduction in CoRL, such as increased proliferation in the renal medulla and decreased tubular mass, could also contribute to the impaired regeneration. These results indicate that the ablation of CoRL exacerbates kidney damage and compromises the kidney’s ability to recover and regenerate following the removal of the obstruction. It is not clear how the CoRL improve the kidneys’ regeneration potential post-release of obstruction. It could be due to cell-specific factors released by them during kidney repair. Analyzing further the putative regenerative factors secreted by the CoRL in the kidneys under obstruction and after obstruction release will help us understand the mechanistic role of the renin-lineage cells in facilitating kidney repair and regeneration.
The mouse models used in the current study have limitations and advantages. The animals positive for both DTA and Cre expression (Ren1dCre;ROSA-DTA; Ren1dCre;ROSA-DTA;mTmG) displayed a higher degree of mortality, and the recovery from the kidney damage was poorer than the animals with Ren1d-DTA genotype. This posed a limitation on having many animals positive for both the DTA and Cre-expression to conduct mechanistic studies to identify how the CoRL improved kidney regeneration post-relief of obstruction. On the other hand, differences in the status of the CoRLs between the DTA models offered a unique opportunity to identify the importance of renin-lineage cells in kidney repair and regeneration.
In summary, using the pUUO model, we elucidated the contribution of RPCs and CoRL in neonatal mice towards kidney damage, repair, and regeneration. The current study identified the regenerative potential of RPCs and CoRL and opened an opportunity to identify the factors they produce leading to kidney regeneration after the release of obstruction. The knowledge obtained from these studies could help to develop potential regenerative therapeutic tools to treat chronic kidney injuries in children and adults.
4. Methods
All the material submitted conforms to good publishing practice in physiology53
4.1. Animals
Animals used in the current study are i) For lineage tracing the CoRL, we generated Ren1dCre/+;R26RmTmG/+ (Ren1dCre;mTmG ) animals by crossing Ren1dCre mice29 with the ROSA mT/mG (R26RmTmG(homo)) Cre reporter54 ii) For ablating the active renin-producing cells, we used the Ren1dDTA/+ (Ren1d-DTA) animals previously generated in our lab by targeting the diphtheria toxin A chain (DTA-176) to the renin gene, under the control of the endogenous renin locus preserving its chromosomal location17 iii) To ablate the CoRL and label them with a green fluorescent protein (GFP) we crossed B6.129-GT(ROSA)26Sortm1(DTA)Lky/J mice (R26RDTA(homo))55 and the animals that are compound heterozygotes for Ren1dDTA/+;Ren1dCre/+;R26RmTmG/+ (Ren1dCre;Ren1d-DTA;mTmG) genotype. In the resultant mice with genotypes Ren1dCre/+; R26RDTA/+ (Ren1dCre;ROSA-DTA) and Ren1dCre/+; R26RDTA/mTmG (Ren1dCre;ROSA-DTA;mTmG), Cre-mediated recombination enabled DTA expression both in the renin-cell progenitors and in the CoRL. In the mTmG-positive animals, GFP is expressed in all the renin-cell derivatives. Thus the crossing strategy we have adopted yielded all the DTA-expressing genotypes used in the study (Ren1dDTA/+, Ren1dCre/+;R26RDTA/+, and Ren1dCre/+;R26RDTA/mTmG) and facilitated to study of them as littermates with similar genetic background iv) The WT (wild type) controls used in the study are with C57BL/6 background. All animals used in the current study were from parents of a mixed genetic background. They were maintained in the C57BL/6 background after several generations of backcrossing with the C57BL/6 mice.
All animals were maintained in the University of Virginia’s vivarium facilities equipped with controlled temperature and humidity conditions in a 12h dark/light cycle. All procedures were performed per the Guidelines for the Care and Use of Laboratory Animals published by the United States National Institutes of Health (https://grants.nih.gov/grants/olaw/guide-for-the-care-and-use-of-laboratory-animals.pdf) and approved by the University of Virginia Animal Care and Use Committee.
4.2. Animal surgeries
We performed the neonatal pUUO in mice at 36–48h after birth and, as previously reported2,56, released the blockage for some animals after one week (Figure 1A). By scoring for hydronephrosis at the time of the release of obstruction, we evaluated the extent of the damage. The scoring was done on the hydronephrosis index (HI) scale of 1–42,23. The kidneys that appeared without any hydronephrotic damage were given a score of one, and those with severe hydronephrosis, retaining a very little parenchyma, obtained a score of 4 (Figure Suppl1E). In addition, to evaluate the obstruction damage at 3W post-obstruction (3 WO) and the reduction in hydronephrosis at 2W post-release (2 WR), we visually scored them under the microscope. If the hydronephrosis score decreased after the release of obstruction, then the kidneys were considered to recover from the obstruction damage. However, when the scoring remained the same or increased further at the time of tissue collection, they were not used for further studies due to poor recovery from the damage. Also, smaller kidneys showing signs of atrophy after the release of obstruction (Figure Suppl1E) were excluded from the analyses. In addition, we checked the patency of the kidneys for a subset of animals that were not intended for molecular studies using a pelvic injection of India ink 23. Kidneys that recovered from the damage maintained the patency, and those that were not patent were excluded from further analyses.
4.3. Histology, Immunostaining, and TUNEL assay
Animals were anesthetized with tribromoethanol (300 mg/kg) at 3 WO and 2 WR. Kidneys were removed, weighed, and fixed in 2% paraformaldehyde (PFA) for one hour at 4oC for frozen sections or in 10% formalin or Bouin’s solution overnight for paraffin sections. 5–10 μm sections from paraffin-embedded or cryo-fixed tissues were used for histological analysis and lineage tracing. Bouin’s fixed paraffin kidney sections were stained with hematoxylin and eosin (H&E) to analyze the tissue histology. Fibrotic damage was assessed using Masson’s trichrome staining57. Immunostaining was performed on paraffin sections as previously described20 with an anti-renin antibody (rabbit polyclonal anti-mouse antibody; 1:500, Gomez et al., 2009), anti-smooth muscle Myh11 antibody (ab124679, Abcam, 1:1000), anti-calbindin antibody (C9848, Sigma,1:500), proliferating cell nuclear antigen (PCNA 13110S, Cell SignalingTechnology,1:1000) and biotinylated Lotus tetragonolobus lectin (LTA-B1325, VectorLaboratories,1:50). Immunostaining using DAB was performed with the appropriate Vectastain ABC kits (Vector Laboratories, Burlingame, CA). Terminal deoxynucleotidyl transferase dUTP nick end labeling (TUNEL) assay labeled the cells undergoing apoptosis. Apopag Peroxidase In Situ Apoptosis Detection Kit (S1700, EMD Millipore) was used according to the manufacturer’s instructions.
4.4. Lineage tracing and Quantification of GFP positive (GFP+) CoRL
Frozen sections were prepared as mentioned above with the kidneys collected from Ren1dCre;mTmG, Ren1dCre;Ren1d-DTA;mTmG, and Ren1dCre;ROSA-DTA;mTmG animals. Lineage tracing and quantification on GFP+ renin lineage cells were done by imaging the kidney sections at 20x magnification using a Zeiss Upright AxioImager Microscope. A minimum of 7–8 images were taken per replicate, and 3–4 replicates were tested per group. Further quantification on GFP+ cells was done using Image J software (National Institutes of Health) 2. For the classification of Type A and Type B glomeruli, we visually scored the glomeruli for the thickening of the parietal epithelium. As shown in the representative images in Figure 2C, glomeruli with a thin lining of GFP+ parietal epithelium were categorized as Type A, and those showing a thickening as Type B. Similarly, visual scoring and classification were done for Type A1 and B1 glomeruli, based on the expansion of GFP+ cells in the intra-glomerular mesangium as shown in the Figure 2C. Glomeruli index measurements were calculated by normalizing the number of glomeruli in each category by the total number of glomeruli counted. In addition, we measured the GFP+ vasculature area fraction as GFP+ vasculature area/Total vasculature area X 100. First, using the freehand selection tool of Image J software, we selected the vasculature segment by tracing along the outside border. Next, we measured the total area (including the GFP+ and RFP+ cells). Then the GFP + vasculature area was measured by tracing only the GFP+ cells within the vasculature segment chosen.
4.5. Image analysis and quantification measurements
Using Image J software, we analyzed the 10x or 20x images taken on the kidney sections stained for various markers for quantification measurements. Briefly, using the free hand selection tool of the software, the renin-positive area, calbindin-positive tubules, and collage-positive fibrotic regions were highlighted and measured. In addition, we quantified the Myh11 stained renal vasculature, GFP+ CoRL, and the LTA-positive tubular area fractions by setting a color threshold and measuring the area. Similarly, we used the Image J software to quantify the PCNA-positive proliferating cells. Briefly, the bright field images were converted to greyscale, and after background subtraction, a color threshold was set to highlight the PCNA-positive cells. The binary images thus created were run through a series of binary menu commands of the software and counted using the analyze particles option. The apoptotic cell bodies and the apoptotic area fraction were measured using a similar approach. The quantifications were normalized for the total kidney area, and all the image analysis parameters were kept constant between the treatments compared.
4.6. RNA extraction and PCR analysis
RNA extraction and quantitative reverse transcription PCR (qRT-PCR) analyses were performed as reported before2. Briefly, kidneys harvested from the surgery animals were preserved in RNA later Stabilization Solution (Thermo Fisher Scientific, Waltham, MA). After homogenizing the tissues with TRIzol reagent (Thermo Fisher Scientific, Waltham, MA), we isolated the RNA by phase separation using BCP (Molecular Research Centre, Cincinnati, OH). The RNA was purified using the RNeasy mini-spin column (Qiagen, Valencia, CA). Reverse transcription (RT) was performed using oligo (dT)15 primers and M-MLV Reverse Transcriptase (Promega, Madison, WI) following the manufacturer’s protocol. Quantitative PCR was performed in a CFX Connect system (Bio-Rad Laboratories, Hercules, CA) using SYBR Green I (Thermo Fisher Scientific, Waltham, MA) and Taq DNA polymerase (Promega), as per the manufacturer’s instructions. mRNA values were normalized to Rps14 (Ribosomal Protein S14) expression. The changes in expression were determined by the ΔΔCt method. Primers used in the current study are listed in Table 2.
Table 2.
Primers used for the qRT-PCR
| Target gene | Forward primer | Reverse primer |
|---|---|---|
| Renin | ACAGTATCCCAACAGGAGAGACAAG | GCACCCAGGACCCAGACA |
| TGF-β | CAATTCCTGGCGTTACCTTGG | GCCCTGTATTCCGTCTCCTT |
| DTA | AAGGTTCGGTGATGGTGCTT | CTACGCTTAACGCTTTCGCC |
| Rps14 | TCTTTCCGGTGGAGGAGTCT | GTTTCCTTGCCAGAAAGATCGG |
| αSMA | CCCTGAAGAGCATCCGACA | AGAGTCCAGCACAATACCAGTT |
| KIM-1(Havcr1) | AACCAGAGATTCCCACACGTC | AGATGTTGGAGGAGTGGAGGT |
4.7. Blood chemistry
Blood was collected from anesthetized animals by cardiac puncture and placed into tubes containing EDTA or heparinized plasma separator tubes (BD Microtainer, Becton Dickinson). The basic metabolic panel for blood urea nitrogen (BUN), potassium, sodium, calcium, glucose, chloride, and CO2 was performed by the University of Virginia Hospital clinical laboratory.
4.7. Renin-ELISA
Plasma was separated by centrifuging the blood samples at 2000g at 4°C for 20 minutes. Then, following the manufacturer’s protocol, plasma renin concentration was quantified using the ELISA kit for mouse renin 1 (Ray Biotech, Norcross, GA). Changes observed in plasma renin levels in wild-type and mutant animals due to the treatments tested were expressed as a relative plasma renin concentration, as previously described 59.
4.9. Statistical Analyses
Statistical analysis was performed using GraphPad Prism (version 8). Results are presented as mean ± SEM (standard error of the mean). The normality of the data distribution was assessed using the Shapiro-Wilk test, and the comparative analyses were chosen accordingly. For comparisons between more than two groups, one-way analysis of variance (ANOVA) was used for normally distributed data, and Kruskal–Wallis analysis for non-normal data distribution. For two groups, a two-tailed Student’s t-test was applied for normally distributed data and a Mann-Whitney U-test for not normally distributed data. P ≤ 0.05 was considered significant. SPSS Statistics 28(IBM) package was utilized for the chi-Square test to identify the differences in the data distribution of the treatments studied.
Supplementary Material
ACKNOWLEDGMENTS
The authors thank Devon L. Farrar, Thomas Wagamon, Douglas White, and Fang Xu for technical assistance.
FUNDING
This work was supported by NIH grants DK 096373 and DK 116718 (to RAG), DK 116196, DK 096373, and HL 148044 (to MLSSL), and the UVA Pinn Scholar award (to MLSSL).
Footnotes
CONFLICT OF INTEREST
The authors declare that they have no competing financial interests.
ETHICAL APPROVAL
Ethical Committee for Animal Experimentation of the University of Virginia
REFERENCES
- 1.Chevalier RL, Gomez RA & Jones CE Developmental determinants of recovery after relief of partial ureteral obstruction. Kidney Int. 33, 775–781 (1988). [DOI] [PubMed] [Google Scholar]
- 2.Nagalakshmi VK et al. Changes in cell fate determine the regenerative and functional capacity of the developing kidney before and after release of obstruction. Clin. Sci. (Lond) 132, 2519–2545 (2018). [DOI] [PMC free article] [PubMed] [Google Scholar]
- 3.El-Dahr SS et al. In situ localization of renin and its mRNA in neonatal ureteral obstruction. Am. J. Physiol. 258, (1990). [DOI] [PubMed] [Google Scholar]
- 4.Sayem El-Dahr S et al. Renal nerves modulate renin gene expression in the developing rat kidney with ureteral obstruction. J. Clin. Invest. 87, 800–810 (1991). [DOI] [PMC free article] [PubMed] [Google Scholar]
- 5.Norwood VF et al. Neonatal ureteral obstruction stimulates recruitment of renin-secreting renal cortical cells. Kidney Int. 45, 1333–1339 (1994). [DOI] [PubMed] [Google Scholar]
- 6.Forbes MS et al. Chronic unilateral ureteral obstruction in the neonatal mouse delays maturation of both kidneys and leads to late formation of atubular glomeruli. Am. J. Physiol. Renal Physiol 305, (2013). [DOI] [PMC free article] [PubMed] [Google Scholar]
- 7.Chevalier RL, Kim A, Thornhill BA & Wolstenholme JT Recovery following relief of unilateral ureteral obstruction in the neonatal rat. Kidney Int. 55, 793–807 (1999). [DOI] [PubMed] [Google Scholar]
- 8.El-Dahr SS et al. Expression of renin and its mRNA in the adult rat kidney with chronic ureteral obstruction. Am. J. Kidney Dis. 15, 575–582 (1990). [DOI] [PubMed] [Google Scholar]
- 9.El-Dahr SS et al. Upregulation of renin-angiotensin system and downregulation of kallikrein in obstructive nephropathy. Am. J. Physiol. 264, (1993). [DOI] [PubMed] [Google Scholar]
- 10.Pimentel JL et al. Sequential changes in renal expression of renin-angiotensin system genes in acute unilateral ureteral obstruction. Kidney Int. 48, 1247–1253 (1995). [DOI] [PubMed] [Google Scholar]
- 11.Figueroa SM et al. Upregulation of Cortical Renin and Downregulation of Medullary (Pro)Renin Receptor in Unilateral Ureteral Obstruction. Front. Pharmacol. 10, (2019). [DOI] [PMC free article] [PubMed] [Google Scholar]
- 12.Stefanska A et al. Cells of renin lineage express hypoxia inducible factor 2α following experimental ureteral obstruction. BMC Nephrol. 17, (2016). [DOI] [PMC free article] [PubMed] [Google Scholar]
- 13.Ariel Gomez R & Sequeira-Lopez MLS Renin cells in homeostasis, regeneration and immune defence mechanisms. Nat. Rev. Nephrol. 14, 231–245 (2018). [DOI] [PMC free article] [PubMed] [Google Scholar]
- 14.Sequeira-Lopez MLS & Gomez RA Renin Cells, the Kidney, and Hypertension. Circ. Res. 128, 887–907 (2021). [DOI] [PMC free article] [PubMed] [Google Scholar]
- 15.Oka M, Medrano S, Sequeira-Lopez MLS & Ariel Gómez R Chronic Stimulation of Renin Cells Leads to Vascular Pathology. Hypertens. (Dallas, Tex. 1979) 70, 119–128 (2017). [DOI] [PMC free article] [PubMed] [Google Scholar]
- 16.Watanabe H et al. Inhibition of the renin-angiotensin system causes concentric hypertrophy of renal arterioles in mice and humans. JCI insight 6, (2021). [DOI] [PMC free article] [PubMed] [Google Scholar]
- 17.Pentz ES, Moyano MA, Thornhill BA, Sequeira Lopez MLS & Gomez RA Ablation of renin-expressing juxtaglomerular cells results in a distinct kidney phenotype. Am. J. Physiol. Regul. Integr. Comp. Physiol. 286, (2004). [DOI] [PubMed] [Google Scholar]
- 18.Pentz ES et al. Ren1 d and Ren2 cooperate to preserve homeostasis: evidence from mice expressing GFP in place of Ren1 d. (2001). [DOI] [PubMed]
- 19.Kretzschmar K & Watt FM Lineage Tracing. Cell 148, 33–45 (2012). [DOI] [PubMed] [Google Scholar]
- 20.Sequeira-Lopez MLS, Nagalakshmi VK, Li M, Sigmund CD & Ariel Gomez R Vascular versus tubular renin: role in kidney development. Am. J. Physiol. Regul. Integr. Comp. Physiol. 309, R650–R657 (2015). [DOI] [PMC free article] [PubMed] [Google Scholar]
- 21.Yoo KH, Norwood VF, El-Dahr SS, Yosipiv I & Chevalier RL Regulation of angiotensin II AT1 and AT2 receptors in neonatal ureteral obstruction. Am. J. Physiol. 273, (1997). [DOI] [PubMed] [Google Scholar]
- 22.Bae EH et al. Altered regulation of renin-angiotensin, endothelin and natriuretic peptide systems in rat kidney with chronic unilateral ureteral obstruction. Urol. Int. 79, 170–176 (2007). [DOI] [PubMed] [Google Scholar]
- 23.Thornhill BA & Chevalier RL Variable partial unilateral ureteral obstruction and its release in the neonatal and adult mouse. Methods Mol Biol. 2012;886381–92. doi 10.1007/978-1-61779-851-1_33. (2012). [DOI] [PubMed] [Google Scholar]
- 24.Vaughan ED, Sweet RC & Gillenwater JY Peripheral Renin and Blood Pressure Changes Following Complete Unilateral Ureteral Occlusion. J. Urol. 104, 89–92 (1970). [DOI] [PubMed] [Google Scholar]
- 25.Vaughan ED, Marion D, Poppas DP & Felsen D Pathophysiology of unilateral ureteral obstruction: studies from Charlottesville to New York. J. Urol. 172, 2563–2569 (2004). [DOI] [PubMed] [Google Scholar]
- 26.Pimentel JL, Martinez-Maldonado M, Wilcox JN, Wang S & Luo C Regulation of renin-angiotensin system in unilateral ureteral obstruction. Kidney Int. 44, 390–400 (1993). [DOI] [PubMed] [Google Scholar]
- 27.el-Dahr SS et al. Renal nerves modulate renin gene expression in the developing rat kidney with ureteral obstruction. J Clin Invest. 1991. Mar;87(3)800–10. [DOI] [PMC free article] [PubMed] [Google Scholar]
- 28.Guessoum O, Zainab M, Sequeira-Lopez MLS & Gomez RA Proliferation does not contribute to murine models of renin cell recruitment. Acta Physiol. 230, (2020). [Google Scholar]
- 29.Sequeira López MLS, Pentz ES, Nomasa T, Smithies O & Gomez RA Renin cells are precursors for multiple cell types that switch to the renin phenotype when homeostasis is threatened. Dev. Cell 6, 719–728 (2004). [DOI] [PubMed] [Google Scholar]
- 30.Sequeira-Lopez MLS & Gomez RA Renin Cells, the Kidney, and Hypertension. Circ. Res. 128, 887–907 (2021). [DOI] [PMC free article] [PubMed] [Google Scholar]
- 31.Watanabe H et al. Renin Cell Baroreceptor, a Nuclear Mechanotransducer Central for Homeostasis. Circ. Res. 129, 262–276 (2021). [DOI] [PMC free article] [PubMed] [Google Scholar]
- 32.Chevalier RL & Gomez RA Response of the renin-angiotensin system to relief of neonatal ureteral obstruction. Am J Physiol. 1988 Dec;255(6 Pt 2)F1070–7. (1988). [DOI] [PubMed] [Google Scholar]
- 33.Kaissling B, LeHir M & Kriz W Renal epithelial injury and fibrosis. Biochim. Biophys. Acta 1832, 931–939 (2013). [DOI] [PubMed] [Google Scholar]
- 34.Kang HM et al. Sox9-Positive Progenitor Cells Play a Key Role in Renal Tubule Epithelial Regeneration in Mice. Cell Rep. 14, 861–871 (2016). [DOI] [PMC free article] [PubMed] [Google Scholar]
- 35.Park HC et al. Postobstructive regeneration of kidney is derailed when surge in renal stem cells during course of unilateral ureteral obstruction is halted. Am. J. Physiol. - Ren. Physiol 298, 357–364 (2010). [DOI] [PMC free article] [PubMed] [Google Scholar]
- 36.Wang X et al. Myofibroblasts and cellular events triggering fibrosis review. Front. Physiol 12, 1–13 (2021). [Google Scholar]
- 37.Mack M & Yanagita M Origin of myofibroblasts and cellular events triggering fibrosis. Kidney Int. 87, 297–307 (2015). [DOI] [PubMed] [Google Scholar]
- 38.Pippin JW et al. Cells of Renin lineage are adult pluripotent progenitors in experimental glomerular disease. Am. J. Physiol. - Ren. Physiol 309, F341–F358 (2015). [DOI] [PMC free article] [PubMed] [Google Scholar]
- 39.Eng DG et al. Detection of renin lineage cell transdifferentiation to podocytes in the kidney glomerulus with dual lineage tracing. Kidney Int. 93, 1240–1246 (2018). [DOI] [PMC free article] [PubMed] [Google Scholar]
- 40.Pippin JW et al. Cells of renin lineage take on a podocyte phenotype in aging nephropathy. Am. J. Physiol. - Ren. Physiol 306, (2014). [DOI] [PMC free article] [PubMed] [Google Scholar]
- 41.Starke C et al. Renin Lineage Cells Repopulate the Glomerular Mesangium after Injury. J Am Soc Nephrol 26, 48–54 (2015). [DOI] [PMC free article] [PubMed] [Google Scholar]
- 42.Kubik MJ et al. Renal developmental genes are differentially regulated after unilateral ureteral obstruction in neonatal and adult mice. Sci. Rep. 10, (2020). [DOI] [PMC free article] [PubMed] [Google Scholar]
- 43.Chevalier RL, Thornhill BA & Wolstenholme JT Renal cellular response to ureteral obstruction: role of maturation and angiotensin II. Am J Physiol. 1999. Jul;277(1 Pt 2)F41–7. [DOI] [PubMed] [Google Scholar]
- 44.Sequeira-Lopez ML et al. The earliest metanephric arteriolar progenitors and their role in kidney vascular development. Am J Physiol Regul Integr Comp Physiol. 2015 Jan 15;308(2)R138–49. doi 10.1152/ajpregu.00428.2014. Epub 2014 Nov 26. (2014). [DOI] [PMC free article] [PubMed] [Google Scholar]
- 45.Arase K et al. Ablation of a specific cell population by the replacement of a uniquely expressed gene with a toxin gene. Proc. Natl. Acad. Sci. U. S. A. 96, 9264–9268 (1999). [DOI] [PMC free article] [PubMed] [Google Scholar]
- 46.Grieshammer U, Lewandoski M, Prevette D, Oppenheim RW & Martin GR Muscle-Specific Cell Ablation Conditional upon Cre-Mediated DNA Recombination in Transgenic Mice Leads to Massive Spinal and Cranial Motoneuron Loss. Dev. Biol. 197, 234–247 (1998). [DOI] [PubMed] [Google Scholar]
- 47.Hum S, Rymer C, Schaefer C, Bushnell D & Sims-Lucas S Ablation of the renal stroma defines its critical role in nephron progenitor and vasculature patterning. PLoS One 9, (2014). [DOI] [PMC free article] [PubMed] [Google Scholar]
- 48.Sequeira-Lopez MLS et al. The earliest metanephric arteriolar progenitors and their role in kidney vascular development. Am. J. Physiol. Regul. Integr. Comp. Physiol. 308, R138–R149 (2015). [DOI] [PMC free article] [PubMed] [Google Scholar]
- 49.Meng XM, Nikolic-Paterson DJ & Lan HY TGF-β: the master regulator of fibrosis. Nat. Rev. Nephrol. 12, 325–338 (2016). [DOI] [PubMed] [Google Scholar]
- 50.Chalkia A et al. Transforming Growth Factor-β1/Smad Signaling in Glomerulonephritis and Its Association with Progression to Chronic Kidney Disease. Am. J. Nephrol. 52, 653–665 (2021). [DOI] [PubMed] [Google Scholar]
- 51.Yu X-Y, Sun Q, Zhang Y-M, Zou L & Zhao Y-Y TGF-β/Smad Signaling Pathway in Tubulointerstitial Fibrosis. Front. Pharmacol. 13, (2022). [DOI] [PMC free article] [PubMed] [Google Scholar]
- 52.Meran S & Steadman R Fibroblasts and myofibroblasts in renal fibrosis. doi: 10.1111/j.1365-2613.2011.00764.x [DOI] [PMC free article] [PubMed] [Google Scholar]
- 53.Pontus Persson B. Good publication practice in physiology 2019 | Enhanced Reader. Acta Physiologica 227:e13405 (2019). [DOI] [PubMed] [Google Scholar]
- 54.Muzumdar MD, Tasic B, Miyamichi K, Li L & Luo L A global double-fluorescent Cre reporter mouse. Genesis. 2007 Sep;45(9)593–605. (2007). [DOI] [PubMed] [Google Scholar]
- 55.Wu S, Wu Y & Capecchi MR Motoneurons and oligodendrocytes are sequentially generated from neural stem cells but do not appear to share common lineage-restricted progenitors in vivo. Development 133, 581–590 (2006). [DOI] [PubMed] [Google Scholar]
- 56.Thornhill BA, Forbes MS, Marcinko ES & Chevalier RL Glomerulotubular disconnection in neonatal mice after relief of partial ureteral obstruction. Kidney Int. 2007 Nov;72(9)1103–12. Epub 2007 Aug 22. (2007). [DOI] [PubMed] [Google Scholar]
- 57.Sequeira-Lopez MLS et al. The microRNA-processing enzyme dicer maintains juxtaglomerular cells. J. Am. Soc. Nephrol. 21, 460–467 (2010). [DOI] [PMC free article] [PubMed] [Google Scholar]
- 58.Gomez RA, Pentz ES, Jin X, Cordaillat M & Sequeira Lopez MLS CBP and p300 are essential for renin cell identity and morphological integrity of the kidney. Am. J. Physiol. Heart Circ. Physiol. 296, (2009). [DOI] [PMC free article] [PubMed] [Google Scholar]
- 59.Belyea BC et al. Identification of renin progenitors in the mouse bone marrow that give rise to B-cell leukaemia. (2014). doi: 10.1038/ncomms4273 [DOI] [PMC free article] [PubMed] [Google Scholar]
Associated Data
This section collects any data citations, data availability statements, or supplementary materials included in this article.


