

SUMMARY
RNA splicing factors are recurrently mutated in clonal blood disorders, but the impact of dysregulated splicing in hematopoiesis remains unclear. To overcome technical limitations, we integrated Genotyping of Transcriptomes (GoT) with long-read single-cell transcriptome profiling and proteogenomics for single-cell profiling of transcriptomes, surface proteins, somatic mutations, and RNA splicing (GoT-Splice). We applied GoT-Splice to hematopoietic progenitors from myelodysplastic syndrome (MDS) patients with mutations in the core splicing factor SF3B1. SF3B1mut cells were enriched in the megakaryocytic-erythroid lineage, with expansion of SF3B1mut erythroid progenitor cells. We uncovered distinct cryptic 3’ splice site usage in different progenitor populations and stage-specific aberrant splicing during erythroid differentiation. Profiling SF3B1-mutated clonal hematopoiesis samples revealed that erythroid bias and cell-type specific cryptic 3’ splice site usage in SF3B1mut cells precede overt MDS. Collectively, GoT-Splice defines the cell-type specific impact of somatic mutations on RNA splicing, from early clonal outgrowths to overt neoplasia, directly in human samples.
Keywords: Single-cell, RNA-seq, multi-omics, splicing, long-read sequencing, genotyping, clonal hematopoiesis, myelodysplastic syndrome
Graphical Abstract
eTOC
Cortés-López and colleagues develop GoT-Splice for the concurrent profiling of gene expression, surface proteins, somatic mutations, and RNA splicing in individual cells. By utilizing this method, they investigate the effects of SF3B1 mutations in patients with myelodysplastic syndrome and clonal hematopoiesis, unveiling splicing abnormalities that lead to lineage-specific clonal expansions.
INTRODUCTION
Genetic diversity in the form of clonal outgrowths has been ubiquitously observed across normal and malignant human tissues1–13. Likewise, single-cell RNA sequencing (scRNA-seq) has revealed phenotypic diversity as a hallmark of both normal and malignant human tissues14–20. These two axes of cellular diversity likely exhibit complex interplay, as cell state may affect the phenotypic impact of somatic mutations21. Recent advances in single-cell multi-omics sequencing have allowed us to link genetic variation and transcriptional cell state diversity in somatic evolution of human tissues15,22,23. For example, using Genotyping of Transcriptomes (GoT)15 technology, which enables genotyping of somatic mutations together with high-throughput droplet-based scRNA-seq, we demonstrated that the effects of somatic mutations on cellular fitness in myeloproliferative disorders vary as a function of progenitor cell identity15.
Mutations in genes encoding RNA splicing factors demonstrate the challenge of linking genotype to phenotype in complex human tissues. Somatic change-of-function mutations in RNA splicing factors are recurrent in hematologic malignancies24–26, highlighting the importance of dysregulated RNA splicing in human hematopoietic disorders. SF3B1 (splicing factor 3b subunit 1), a core component of the spliceosome complex, is a commonly mutated splicing factor across hematologic malignancies and solid tumors, and is implicated in the pathogenesis of myelodysplastic syndromes (MDS)27,28. SF3B1 mutations also increase the risk of myeloid neoplasms in individuals with clonal hematopoiesis (CH), compared to other CH driver mutations1,2. SF3B1 mutations result in incorrect branch point recognition during RNA splicing, often leading to an increased usage of aberrant (or cryptic) intron-proximal 3’ splice sites in hundreds of genes29. Such aberrant 3’ splice site recognition typically results in the inclusion of short intronic fragments in spliced mRNA, commonly causing frameshifts that render the transcript a substrate for nonsense mediated mRNA decay (NMD)30. Through mis-splicing, SF3B1 mutations have been shown to affect cell metabolism31 and ribosomal biogenesis32, leading to the aberrant hematopoietic differentiation typical of MDS. However, the mechanisms through which mis-splicing disrupts hematopoietic differentiation in humans remain elusive.
To date, cellular and murine models have been critical for elucidating the role of splicing factor mutations in disordered hematopoiesis. Nonetheless, these methods may not fully recapitulate MDS development in humans. For example, alternatively spliced genes from murine models of SF3B1mut MDS, which phenotypically resemble human MDS, show limited overlap with those identified in humans33. Analysis of splice-altering mutations in humans has been further hampered by three main limitations. Firstly, normal wildtype (WT) and aberrant mutated (MUT) cells are often admixed, limiting identification of signals specifically linked to the SF3B1mut genotype. This challenge is amplified in the context of CH, where MUT cells are typically a minority of the hematopoietic progenitor population. Secondly, the hematopoietic differentiation process yields significant complexity of cell progenitor types that further hinders the ability to link mutated genotypes with distinct cellular phenotypes. SF3B1mut MDS is indeed associated with a specific clinico-morphological phenotype of refractory anemia and accumulation of ringed sideroblasts28,34, strongly suggesting that the interplay between cell identity and SF3B1 mutations is fundamental in driving disrupted hematopoietic differentiation. Finally, scRNA-seq by 3’ or 5’ biased short-read sequencing provides an incomplete picture of the consequences of splicing factor mutations on the transcriptome and their downstream effects.
To overcome these limitations and identify cell-identity-dependent mis-splicing mediated by SF3B1 mutations, we developed GoT-Splice by integrating GoT15 with long-read single-cell transcriptome profiling (with Oxford Nanopore Technologies [ONT]) as well as proteogenomics (with CITE-seq)35. This enabled the simultaneous profiling of gene expression, cell surface protein markers, somatic mutation genotyping, and RNA splicing within the same single cell. The application of GoT-Splice to bone marrow progenitor samples from individuals with SF3B1mut MDS and CH revealed that, while SF3B1 mutations arise in uncommitted hematopoietic stem progenitor cells (HSPCs), their enrichment increases along the differentiation trajectory into committed erythroid progenitors (EPs), in line with the SF3B1mut-driven dyserythropoiesis phenotype. Importantly, the integration of GoT with full-length isoform mapping via long-read sequencing demonstrated that SF3B1 mutations exert cell-type specific mis-splicing, already apparent in CH.
RESULTS
GoT integrated with proteogenomics reveals enrichment of SF3B1mut cells in the erythroid lineage linked to overexpression of cell-cycle and mRNA translation genes
As the impact of somatic mutations on the transcriptome varies as a function of underlying cell identity in myeloproliferative neoplasms15, we hypothesized that an interplay between cell identity and SF3B1 mutations may drive disrupted hematopoietic differentiation in MDS. To test this, we applied GoT15 (Figure 1a) to CD34+ bone marrow progenitor cells from three untreated MDS patients with SF3B1 K700E mutations (discovery cohort, MDS01-03) and a separate cohort of MDS patients undergoing treatment (validation cohort, MDS04-06) with erythropoietin (EPO) and/or granulocyte colony-stimulating factor (G-CSF; Figure 1b; Table S1). As normal hematopoietic development has been extensively studied using flow cytometry cell surface markers, we further integrated GoT with single-cell proteogenomics (CITE-seq35,36; Figure 1a). After sequencing and quality control filtering, we obtained 24,315 cells across the six MDS samples (Figure S1a–b; MDS02 was sequenced in two technical replicates). To chart the differentiation map of the CD34+ progenitor cells, we integrated the data across the six MDS samples and clustered based on transcriptomic data alone, agnostic to the genotyping and protein information (Figure 1c; Figure S1c–d). Using previously annotated RNA identity markers for human CD34+ progenitor cells37, validated via Antibody-Derived Tag (ADT) markers in the CITE-seq panel (Table S1, 2), we identified the expected progenitor subtypes in the primary MDS cohort, along with a population of mature monocytic cells characterized by CD14 expression and lack of CD34 expression, which is often observed in CD34+ sorting of human bone marrow38,39, and was not completely removed with monocyte-specific blocking reagents39 (Figure 1c; Figure S1e–g). Cell clustering was further validated using RNA and ADT multimodal integration (Figure S1h). The expected progenitor subtypes were similarly identified in the MDS validation cohort (MDS04-06; Figure S1i–k).
Figure 1. Enrichment of SF3B1mut cells in the megakaryocytic-erythroid lineage.
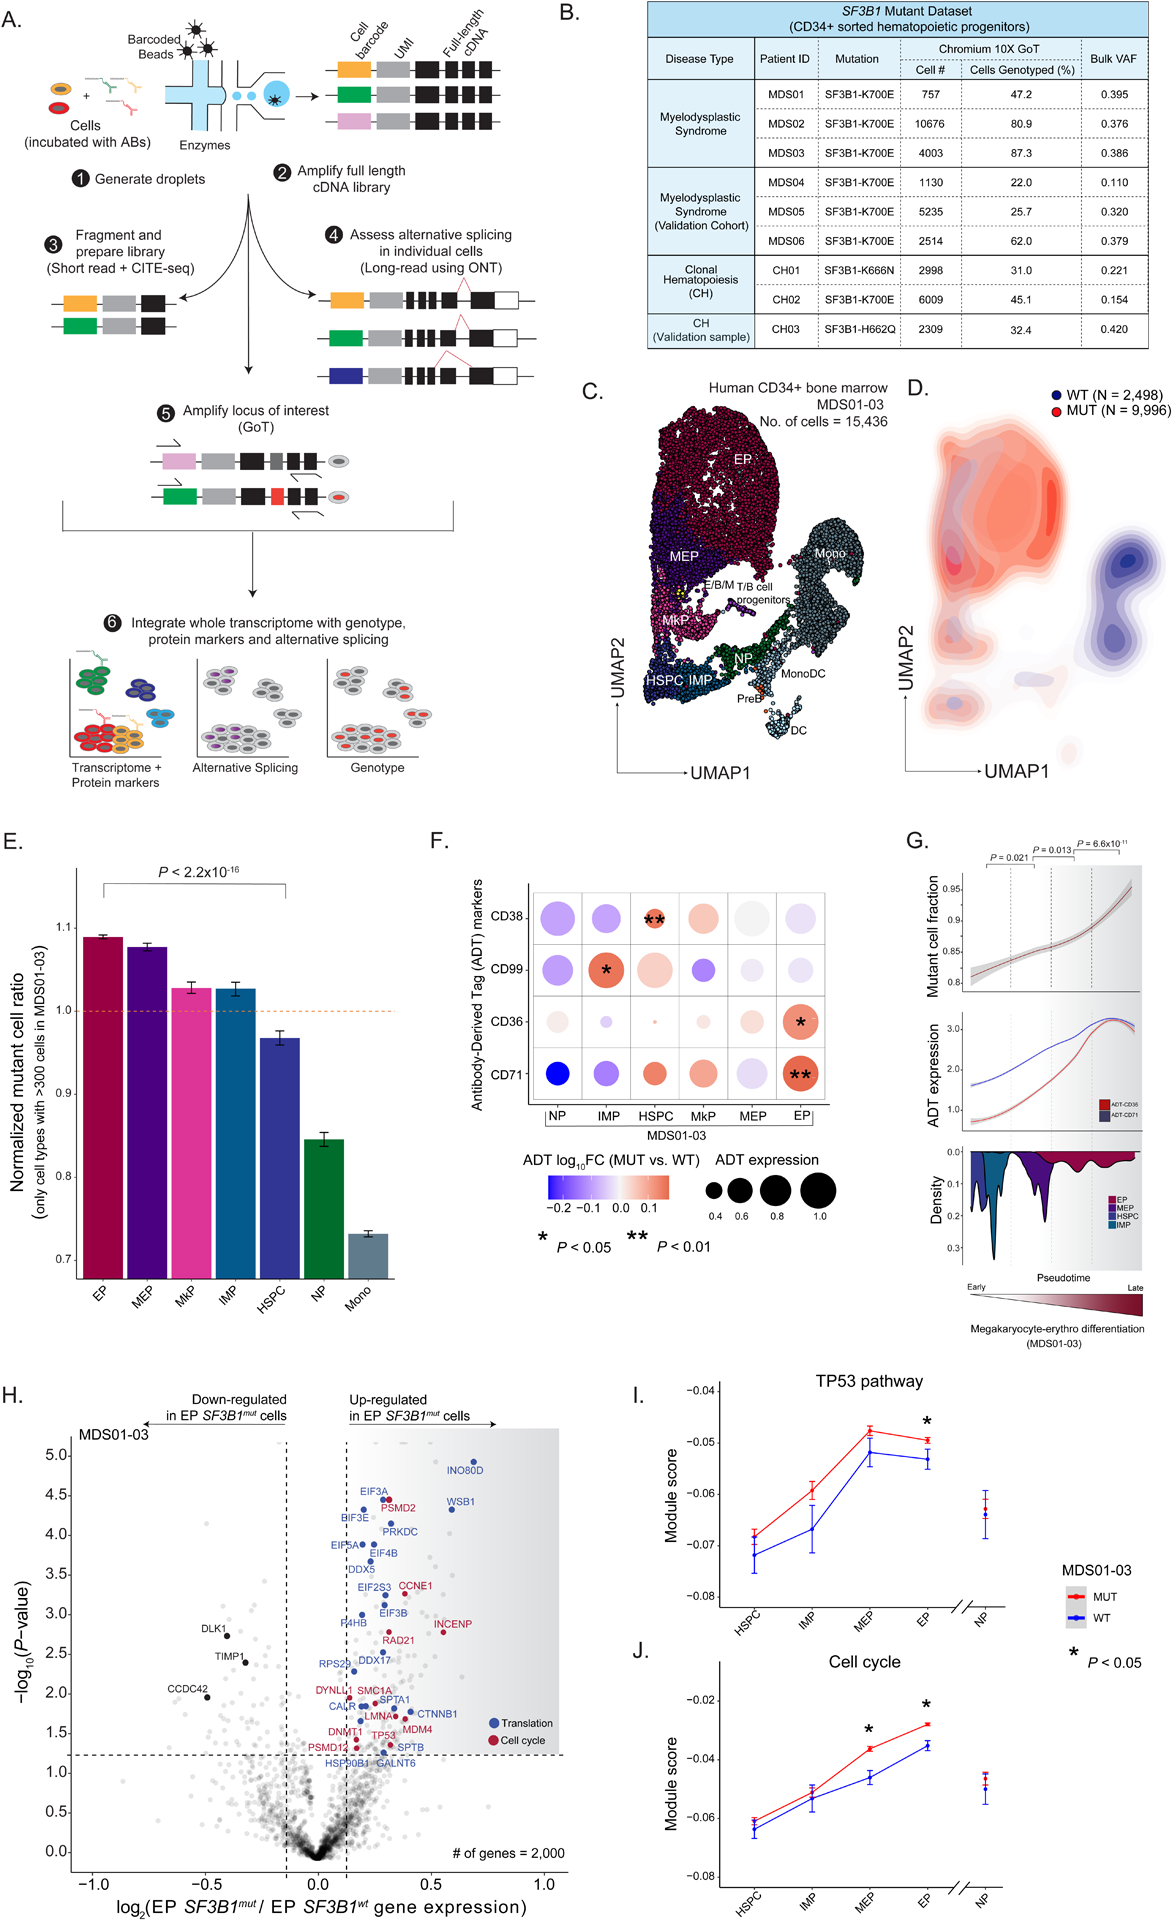
(A) GoT-Splice workflow combines GoT with CITE-seq and long-read full-length cDNA using ONT for the simultaneous single-cell profiling of protein and gene expression, somatic mutations, and alternative splicing. (B) Patient metadata and quality controlled GoT data for SF3B1-mutant MDS and CH samples. (C) Uniform manifold approximation and projection (UMAP) of CD34+ cells (n = 15,436 cells) from MDS patients with SF3B1 K700E mutations (n = 3 individuals), overlaid with cluster cell-type assignments. HSPC, hematopoietic stem progenitor cells; IMP, immature myeloid progenitors; MkP, megakaryocytic progenitors; MEP, megakaryocytic-erythroid progenitors; EP, erythroid progenitors; NP, neutrophil progenitors; E/B/M, eosinophil/basophil/mast progenitor cells; T/B cell progenitors; Mono, monocyte; DC, dendritic cells; Pre-B, precursors B cells; Mono DC, monocyte/dendritic cell progenitors. (D) Density plot of SF3B1mut vs. SF3B1wt cells, with genotypes (MDS01-03) for 12,494 cells (80.9 % of all cells). (E) Normalized frequency of SF3B1mut cells in progenitor subsets with at least 300 genotyped cells. Bars show analysis of MDS01-03 with mean +/− s.e.m. of 100 downsampling iterations to 1 genotyping UMI per cell. Cell types with >300 cells were analyzed. P-value from likelihood ratio test of linear mixed model with or without mutation status. (F) Differential ADT marker expression between SF3B1mut and SF3B1wt cells. Red: higher expression in SF3B1mut cells; blue: higher expression in SF3B1wt cells. Dot size corresponds to the average ADT expression across cells in each cell-type. P-values determined through permutation testing. (G) Mutant cell fraction and ADT expression levels of CD36 and CD71 as a function of pseudotime along the megakaryocyte-erythroid differentiation trajectory for SF3B1mut and SF3B1wt cells in MDS01-03. Shading denotes 95% confidence interval. Histogram shows cell density of analyzed clusters, ordered by pseudotime. P-values were calculated by Wilcoxon rank sum test by comparing mutant cell fraction between pseudotime trajectory quartiles. (H) Differential gene expression between SF3B1mut and SF3B1wt EP cells in MDS samples. Genes with an absolute log2(fold change) > 0.1 and P-value < 0.05 were defined as differentially expressed (DE). Cell cycle (red) and translation (blue) pathways (Reactome) are highlighted. (I) Expression (mean +/− s.e.m.) of TP53 pathway related genes (Reactome) between SF3B1mut and SF3B1wt cells in progenitor cells from MDS01-03 samples. Red: module score in SF3B1mut cells; blue: module score in SF3B1wt cells. P-values from likelihood ratio test of linear mixed model with or without mutation status. (J) Same as (I) for expression of cell cycle related genes (Reactome) between SF3B1mut and SF3B1wt cells in progenitor cells from MDS01-03 samples.
Genotyping data were available for 15,650 MDS cells (64.4% across MDS01-06) through GoT (Figure 1b; Figure S2a–d). The per-patient mutant cell fractions obtained through GoT were highly correlated with the variant allele frequencies (VAFs) obtained through bulk sequencing of matched unsorted peripheral blood mononuclear cells (Pearson’s r = 0.81, P-value = 0.008; Figure S2a). Projection of the genotyping information onto the differentiation map showed co-mingling of MUT and WT cells throughout the differentiation topology, highlighting the need for single-cell multi-omics to link genotypes with cellular phenotypes in SF3B1mut MDS. Although MUT cells were found across CD34+ progenitor cells, we observed an accumulation of MUT cells along the erythroid trajectory (Figure 1d), suggesting that SF3B1 mutant cell frequency (MCF) varies as a function of the progenitor subtype. To confirm this, we evaluated the MCF across the different prevalent progenitor cell types (limited to progenitor subsets with > 300 cells). Across samples, we observed a significant increase in MCF in the megakaryocyte-erythroid lineage, with the highest MCF in EPs compared to HSPCs (P-value < 10−16; Figure 1e; Figure S2d), consistent with the erythroid lineage-specific impact of mutated SF3B140,41.
The ability to layer protein measurements on top of GoT data further allowed us to identify differentially expressed proteins between MUT and WT cells within each progenitor subset. After quality control filtering for ADT markers with adequate expression in at least two major progenitor subtypes (see Methods), protein expression was highest in the expected cell types, and correlated with mRNA expression at the cell and cell-type level, comparable to previous data35 (Figure S2e–f). We directly compared protein expression between MUT and WT cells, accounting for sample-to-sample variability in mutated cells through downsampling (see Methods), and observed differential expression of CD38, CD99, CD36 and CD71 in at least one progenitor cell-type (Figure 1f; Table S2). CD38 is a known marker for the transition of primitive CD34+ stem and progenitor cells into more committed precursor cells37,42–44. Its overexpression in SF3B1mut is consistent with the observed higher MCF in committed progenitor subsets. CD99, over-expressed in MUT immature myeloid progenitor cells (IMP) cells, was previously noted to be overexpressed in both AML and MDS stem cells, serving as a potential therapeutic target of malignant stem cells45,46. Finally, CD36 and CD71, erythroid lineage markers, were found to be over-expressed in MUT EPs when compared to WT EPs, consistent with the SF3B1mut-driven dyserythropoiesis phenotype. We further leveraged these erythroid maturation cell surface protein markers to validate pseudo-temporal (pseudotime) ordering of the continuous process of erythroid maturation47 (Figure S2g). This analysis revealed an increase in MCF along erythroid lineage maturation (Figure 1g), confirming enrichment of SF3B1 mutated cells along the differentiation trajectory into committed EPs.
To further explore SF3B1 driven transcriptional dysregulation in committed EPs, we performed differential gene expression analysis between SF3B1mut and SF3B1wt cells. Mutated EPs upregulated genes encoding important translation and ribosome biogenesis factors (Figure 1h; Table S3), including several eukaryotic initiation factors (e.g., EIF3A [FDR adjusted P-value = 0.007], EIF5A [FDR adjusted P-value = 0.011]), DEAD-box helicases (e.g., DDX5 [FDR adjusted P-value = 0.016]), and ribosome subunits (e.g., RPS29 [FDR adjusted P-value = 0.1]). While we did not directly assess translational defects, this dysregulation of translation factor expression is evocative of studies showing that translational regulation is critical during hematopoiesis48–51, and may lead to cell- and tissue type–restricted activation of TP53 signaling pathway in myeloid disease52–57. Specifically, cells that require high levels of protein synthesis, such as erythroid progenitors, may be more sensitive to even subtle changes in translational regulation58. In line with this notion, TP53 gene target upregulation in SF3B1mut cells was more prominent in the megakaryocyte-erythroid lineage, with no increased expression of TP53-related genes in earlier progenitors (HSPCs) or in neutrophil progenitors (NPs) compared to WT cells (Figure 1i). Our results therefore establish a molecular phenotype for the SF3B1 mutation in human bone marrow progenitors, implicating changes in translation pathway genes.
Mutated EPs also upregulated genes related to the cell cycle (FDR adjusted P-value = 0.08; Figure 1h, j; Table S3). For example, we observed an increase in the expression of CCNE1, a positive regulator of the G1/S transition of the cell cycle59, and MDM4, which works together with TP53 during the G1/S checkpoint to determine the fate of cells by regulating pathways involved in DNA repair, apoptosis, and senescence60,61. Increased expression of MDM4 can attenuate TP53 activation induced by ribosomal stress62,63, thereby reducing the functional impact of p53, thus promoting cell survival and accumulation. Taken together, these factors contribute to the enrichment of SF3B1 mutations in the erythroid lineage.
GoT-Splice links somatic mutations, alternative splicing, and cellular phenotype at single-cell resolution
Given the pivotal role of SF3B1 in mRNA splicing, we next explored how mis-splicing may link genotypes and cellular phenotypes. Indeed, SF3B1 mutations promote recognition of alternative branch points, most often leading to increased usage of aberrant 3’ splice sites29. However, previous studies in primary human samples have been performed on bulk samples admixing MUT and WT cells as well as progenitor subtypes30,32,64,65. Conversely, short-read scRNA-seq does not adequately cover splice junctions. Recent advances suggest that long-read integration into scRNA-seq may overcome these limitations66–70. We therefore integrated GoT with full-length ONT long-read sequencing, allowing for high-throughput, single-cell integration of genotype, cell surface proteome, gene expression, and mRNA splicing information (GoT-Splice; Figure 1a). Single-cell cDNA sequencing with ONT presents unique challenges, as cDNA amplification artifacts are still productively sequenced when using standard ONT ligation chemistry, leading to a high fraction of uninformative reads in the highly amplified single-cell libraries. To enhance ONT efficiency, we incorporated a biotin enrichment step using on-bead PCR to selectively amplify full-length reads containing intact cell barcodes and unique molecular identifiers67 (UMIs; Figure 2a), increasing the yield of full-length reads from 50.4% +/− 2.7 to 77.6% +/− 2.0 (mean +/− s.e.m.) of sequenced reads. Thus, GoT-Splice delivers high-resolution single-cell full-length transcriptional profiles comparable with short-read sequencing (Figure 2b–c). However, full-length ONT sequencing alone is insufficient to support efficient genotyping of the SF3B1mut locus, as analysis of ONT-alone data revealed that only 3% of cells have at least 1 UMI covering the SF3B1mut locus vs. 56% of cells with GoT (average across MDS samples; Figure S2b), demonstrating the power of our integrated approach.
Figure 2. Simultaneous profiling of gene expression, cell surface protein markers, somatic mutation status, and alternative splicing at single-cell resolution.
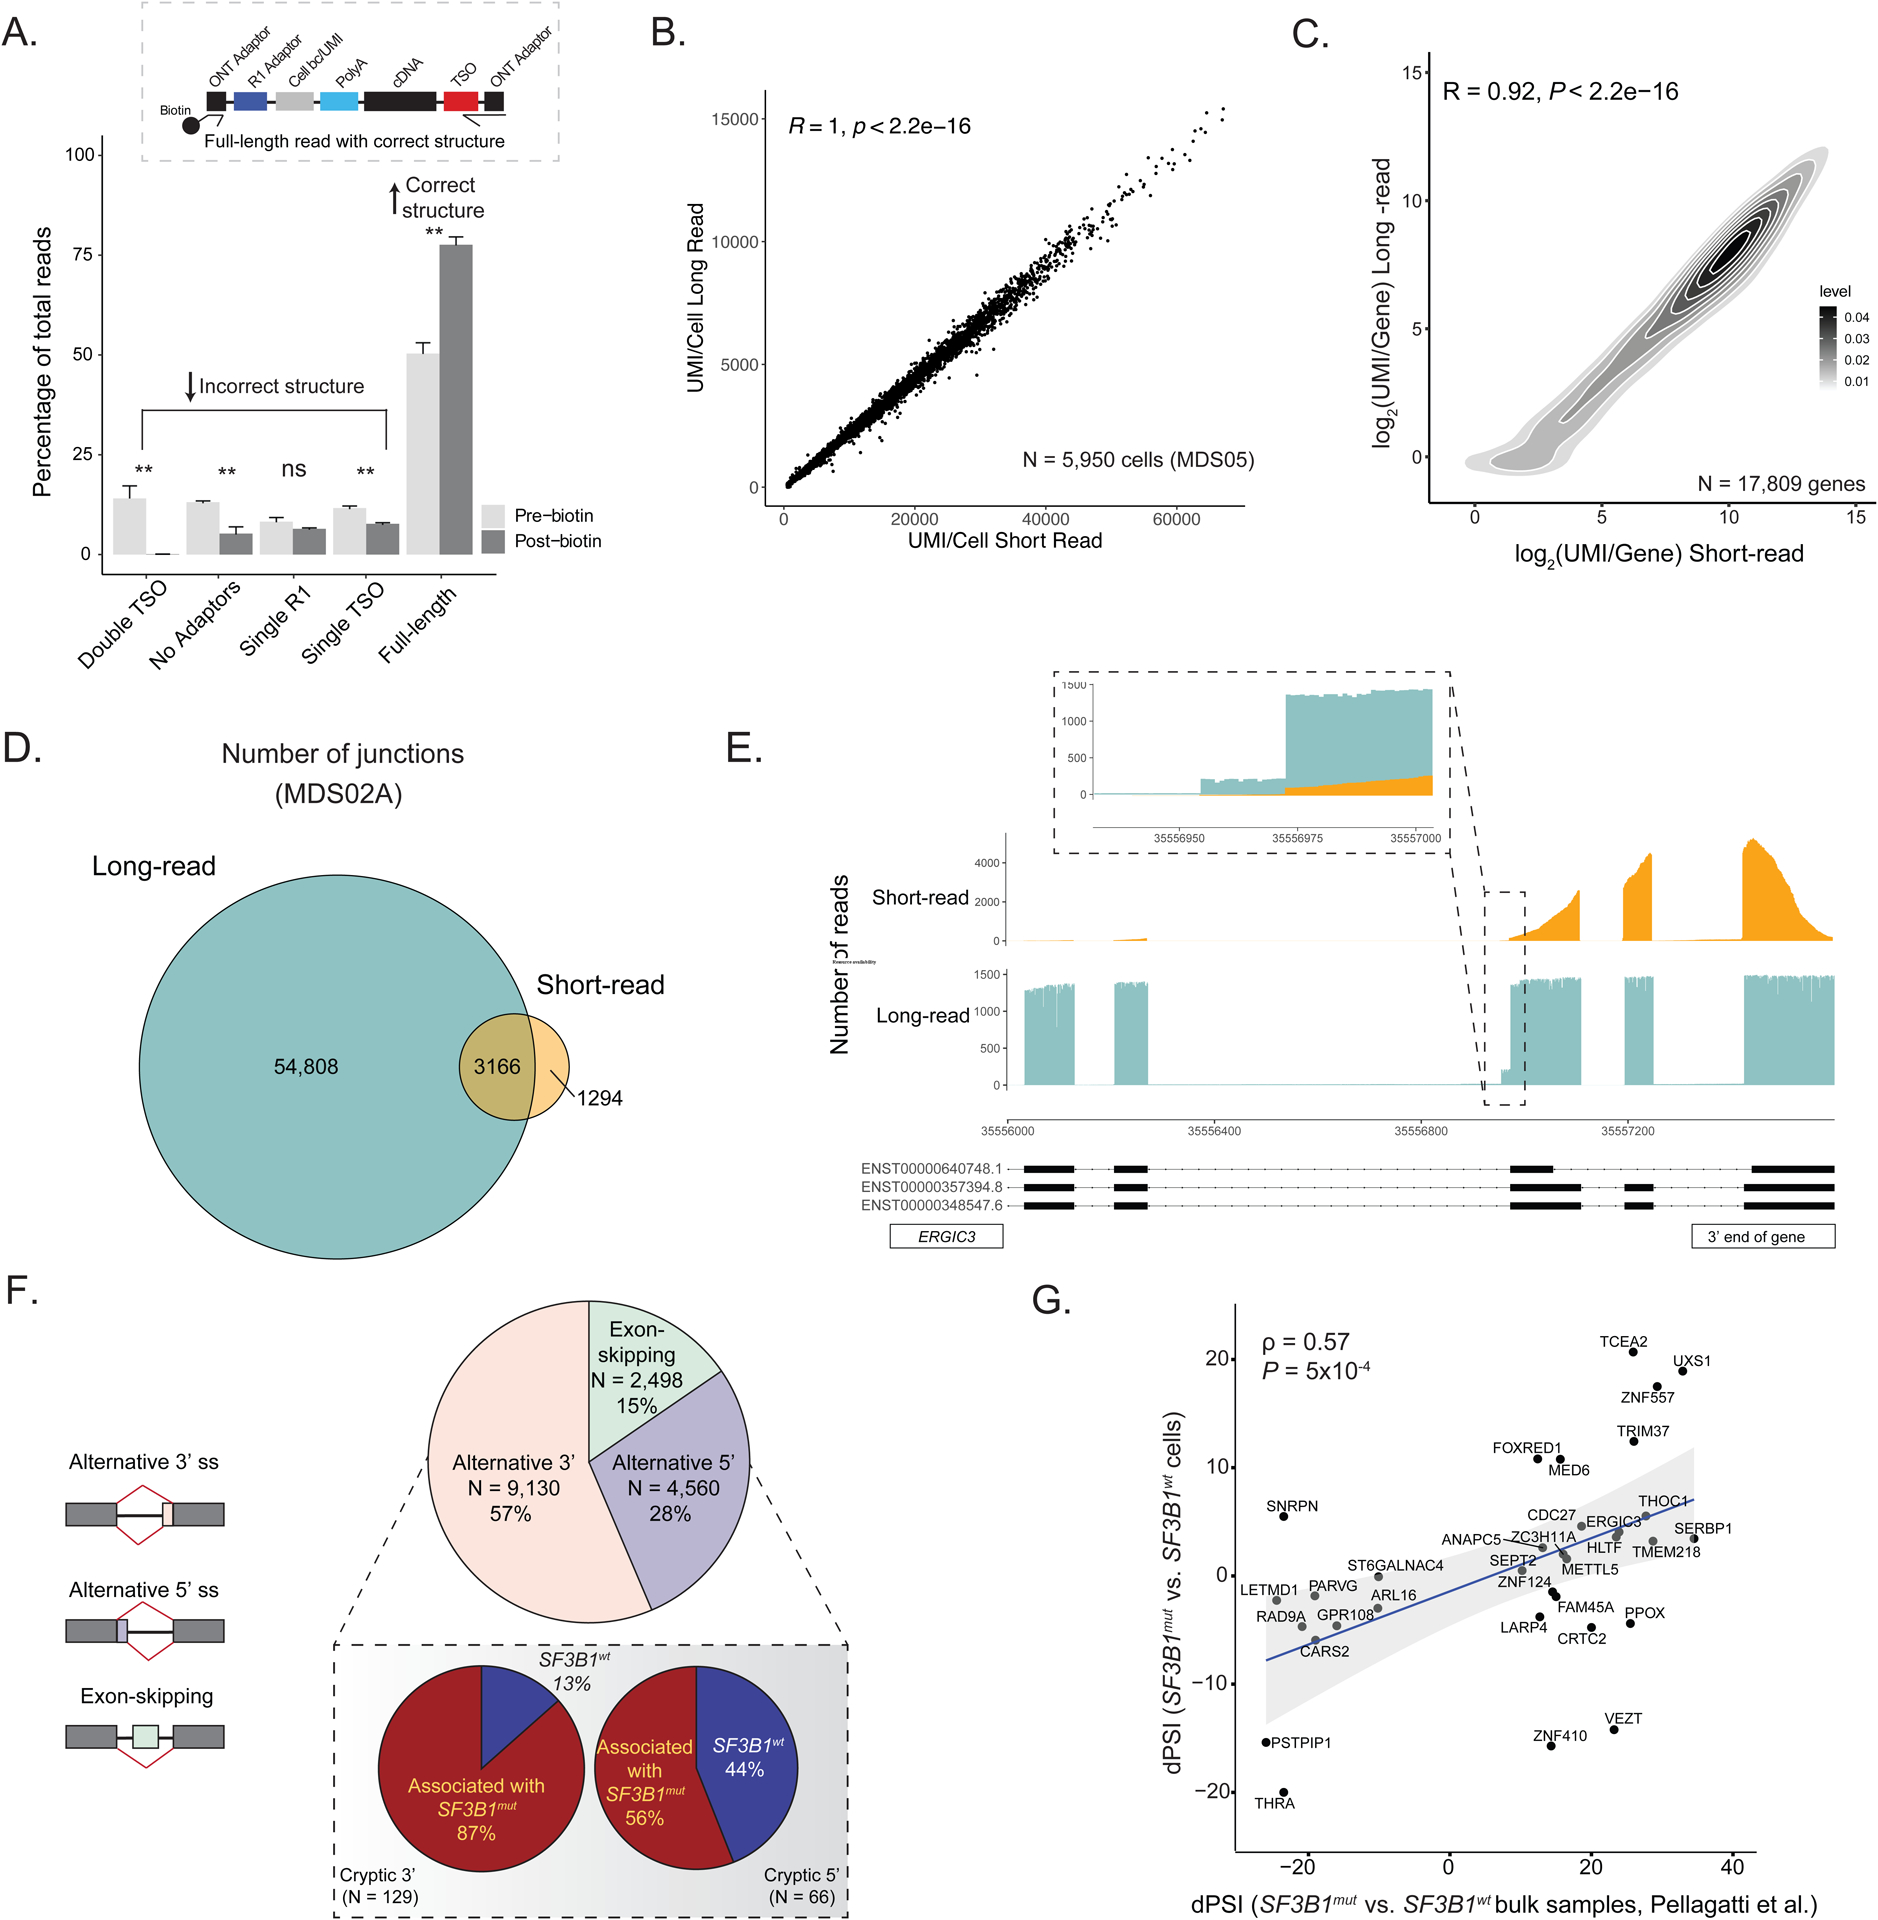
(A) Comparison of the percentage of ONT reads with either incorrect structure (double TSO, no adaptors, single R1 or single TSO) or correct structure (full-length reads) both before and after the inclusion of a biotin enrichment protocol step during preparation for sequencing. Bars show the aggregate analysis of n = 5 samples with mean +/− s.d. of the percentage for each category. (B) Scatter plot of the correlation between the number of UMIs/cell detected in long-read ONT vs. short-read Illumina data for cells sequenced across both platforms for sample MDS05. (C) Density plot of the correlation between the number of UMIs/gene detected in long-read ONT vs. short-read Illumina data for sample MDS05. (D) Number of splice junctions captured in the full-length long-read ONT data compared to short-read sequencing data (gene coverage >= 10 in both sequencing protocols, junction cluster coverage >= 600 and junction read support >= 1 read [see Methods]), demonstrating increased junction capture with GoT-Splice across cells. (E) Greater sequencing coverage uniformity of GoT-Splice compared to short-read sequencing over splice junctions, illustrated with the ERGIC3 gene. (F) Pie chart summarizing the distribution of different alternative splicing events detected after junction annotation. Inset: Differences in the usage of cryptic 3’ and 5’ splice site events between SF3B1mut and SF3B1wt cells measured with a dPSI (SF3B1mut PSI - SF3B1wt PSI). Associated with SF3B1mut: +ve dPSI; associated with SF3B1wt: -ve dPSI. (G) Comparison of dPSI values for shared cryptic 3’ splicing events identified in the MUT vs. WT cell comparison from GoT-Splice of SF3B1mut MDS01-03 samples and in the SF3B1mut vs. SF3B1wt bulk comparison from bulk RNA-sequencing of CD34+ cells of MDS samples in Pellagatti et al.32. Correlation coefficient ρ calculated using Spearman’s correlation and P-value derived from Student’s t-distribution.
To accurately identify splice junctions using single-cell long-read sequencing, we developed an analytical pipeline that leverages the SiCeLoRe pipeline67 (Figure S3a). To reduce alignment noise, we generated a splice junction reference identified in single-cell SMART-seq2 data from human CD34+ cells without SF3B1 mutation (Methods). Next, we performed intron-centric junction calling for the independent measurement of splicing at both the 5’ and 3’ ends of each intron. This allows for unbiased assessment of junctions and greater accuracy in measuring the degree of transcript mis-splicing compared to exon-centric quantification approaches71, which are typically used for cassette exon usage profiling and rely on potentially inaccurate or incomplete72,73predefined transcript models or splicing events. As anticipated, when comparing short-read and long-read sequencing, we found a 12.3-fold increase in the number of junctions detected using long-read sequencing, with the majority of junctions (~90%) unique to long-read data (Figure 2d; Figure S3b). Notably, at the single-cell level, despite lower absolute number of UMI/cell, we observed a 5.5-fold increase in detected junctions with long-read sequencing (Figure S3c). Additionally, GoT-Splice afforded greater coverage uniformity across the entire transcript, compared to 3’-biased coverage in short-read sequencing, enabling the detection of splicing events further from the 3’ transcript end (Figure 2e). To further highlight the discovery power of long-read sequencing, we compared short- and long-read capture of cryptic 3’ splicing events in relation to distance from the 3’ transcript end (Methods), showing that long-read sequencing identifies substantially greater numbers of cryptic events both along the length of the transcript and overall compared to short-read (Figure S3d), with the majority of cryptic 3’ splicing events detected in short-reads also captured in long-reads (Figure S3d, pie-chart inset).
The most common mis-splicing events (57%) observed in MDS SF3B1mut cells involved alternative 3’ splice sites(Figure 2f), consistent with prior reports29,74. Notably, such alternative 3’ splice site usage was not observed in a SF3B1 WT CD34+ sample (Figure S3e). Among the differentially mis-spliced cryptic 3’ splice sites (0–100bp from canonical splice site) between SF3B1mut and SF3B1wt cells, 87% were used more highly in SF3B1mut cells (Figure 2f, inset), aligning with known characteristics of SF3B1 mutations. ONT long-read sequencing also allowed quantification of different splicing events within the same mRNA transcript. While only one aberrant 3’ splice site event was observed for most mRNA transcripts, we identified 428 genes (21.4% of total genes with at least one cryptic 3’ splice site) with more than one aberrant 3’ splice site event. These cryptic 3’ splicing events frequently appeared in different copies of the transcript (Figure S3f). Consistent with previous MDS bulk sequencing data29,75, we observed a relative enrichment of purines upstream of the aberrant 3’ splice site when compared to the canonical 3’ splice site (Figure S3g).
To assess how our method compares with available isoform detection tools, we compared the recovery and quantification of novel splicing junctions to full-length isoform quantification methods FLAMES68 and IsoQuant76. While isoform junction annotation was largely comparable across all three methods (Figure S4a), detection of cryptic 3’ events was increased using our approach, compared with FLAMES and IsoQuant, which are designed to annotate and quantify full-length isoforms. For these cryptic 3’ events, we observed more variation on local splicing event assignment, with little agreement between the three methods (Figure S4a, right). Additionally, many 3’ cryptic events detected by our method were not identified by FLAMES and IsoQuant (Figure S4a, right). We also observed a high correlation between GoT-Splice delta PSI (dPSI; percent spliced in) measurements obtained by comparing SF3B1mut and SF3B1wt cells and dPSI derived from bulk RNA-sequencing of CD34+ cells from SF3B1mut vs. SF3B1wt MDS samples32 for shared cryptic 3’ splice sites (Figure 2g). This correlation with dPSI derived from bulk data of SF3B1mut MDS samples32 was not statistically significant in IsoQuant; in contrast, FLAMES preserved the positive correlation observed when using GoT-Splice (Figure 2g) although with a smaller Spearman’s correlation coefficient value compared to GoT-Splice (Figure S4b). Furthermore, in line with previous work in MDS, the majority of the cryptic 3’ splice sites identified by GoT-Splice were ~15–20 bps upstream of the canonical 3’ site29 (Figure 3a–b; Figure S4c–f). The dPSI for the differentially spliced cryptic 3’ splice site events obtained by comparing SF3B1mut and SF3B1wt cells were highly correlated across MDS samples (average Pearson’s r of 0.55; P-value < 0.001), highlighting the ability of our differential splicing analysis pipeline to identify statistically robust recurrent mis-splicing events (Figure 3a–b; Figure S4c–f; Table S4). Unlike GoT-Splice, which identified a far larger number of mis-splicing events validated with manual review, full-length isoform quantification methods did not demonstrate the expected increased usage of cryptic 3’ splice sites in MUT vs. WT cells (Figure 3a–b and Figure S4g), with equal number of statistically significant mis-splicing events, further suggesting lower performance in identifying 3’ cryptic mis-splicing. This is potentially due to the applied correction of splice sites in these full-length isoform algorithms, which may hinder cryptic mis-splicing detection, particularly for cryptic splice sites found within 10 bp of the canonical site (Figure S4h).
Figure 3. Progenitor cell-type specific mis-splicing in SF3B1mut MDS.
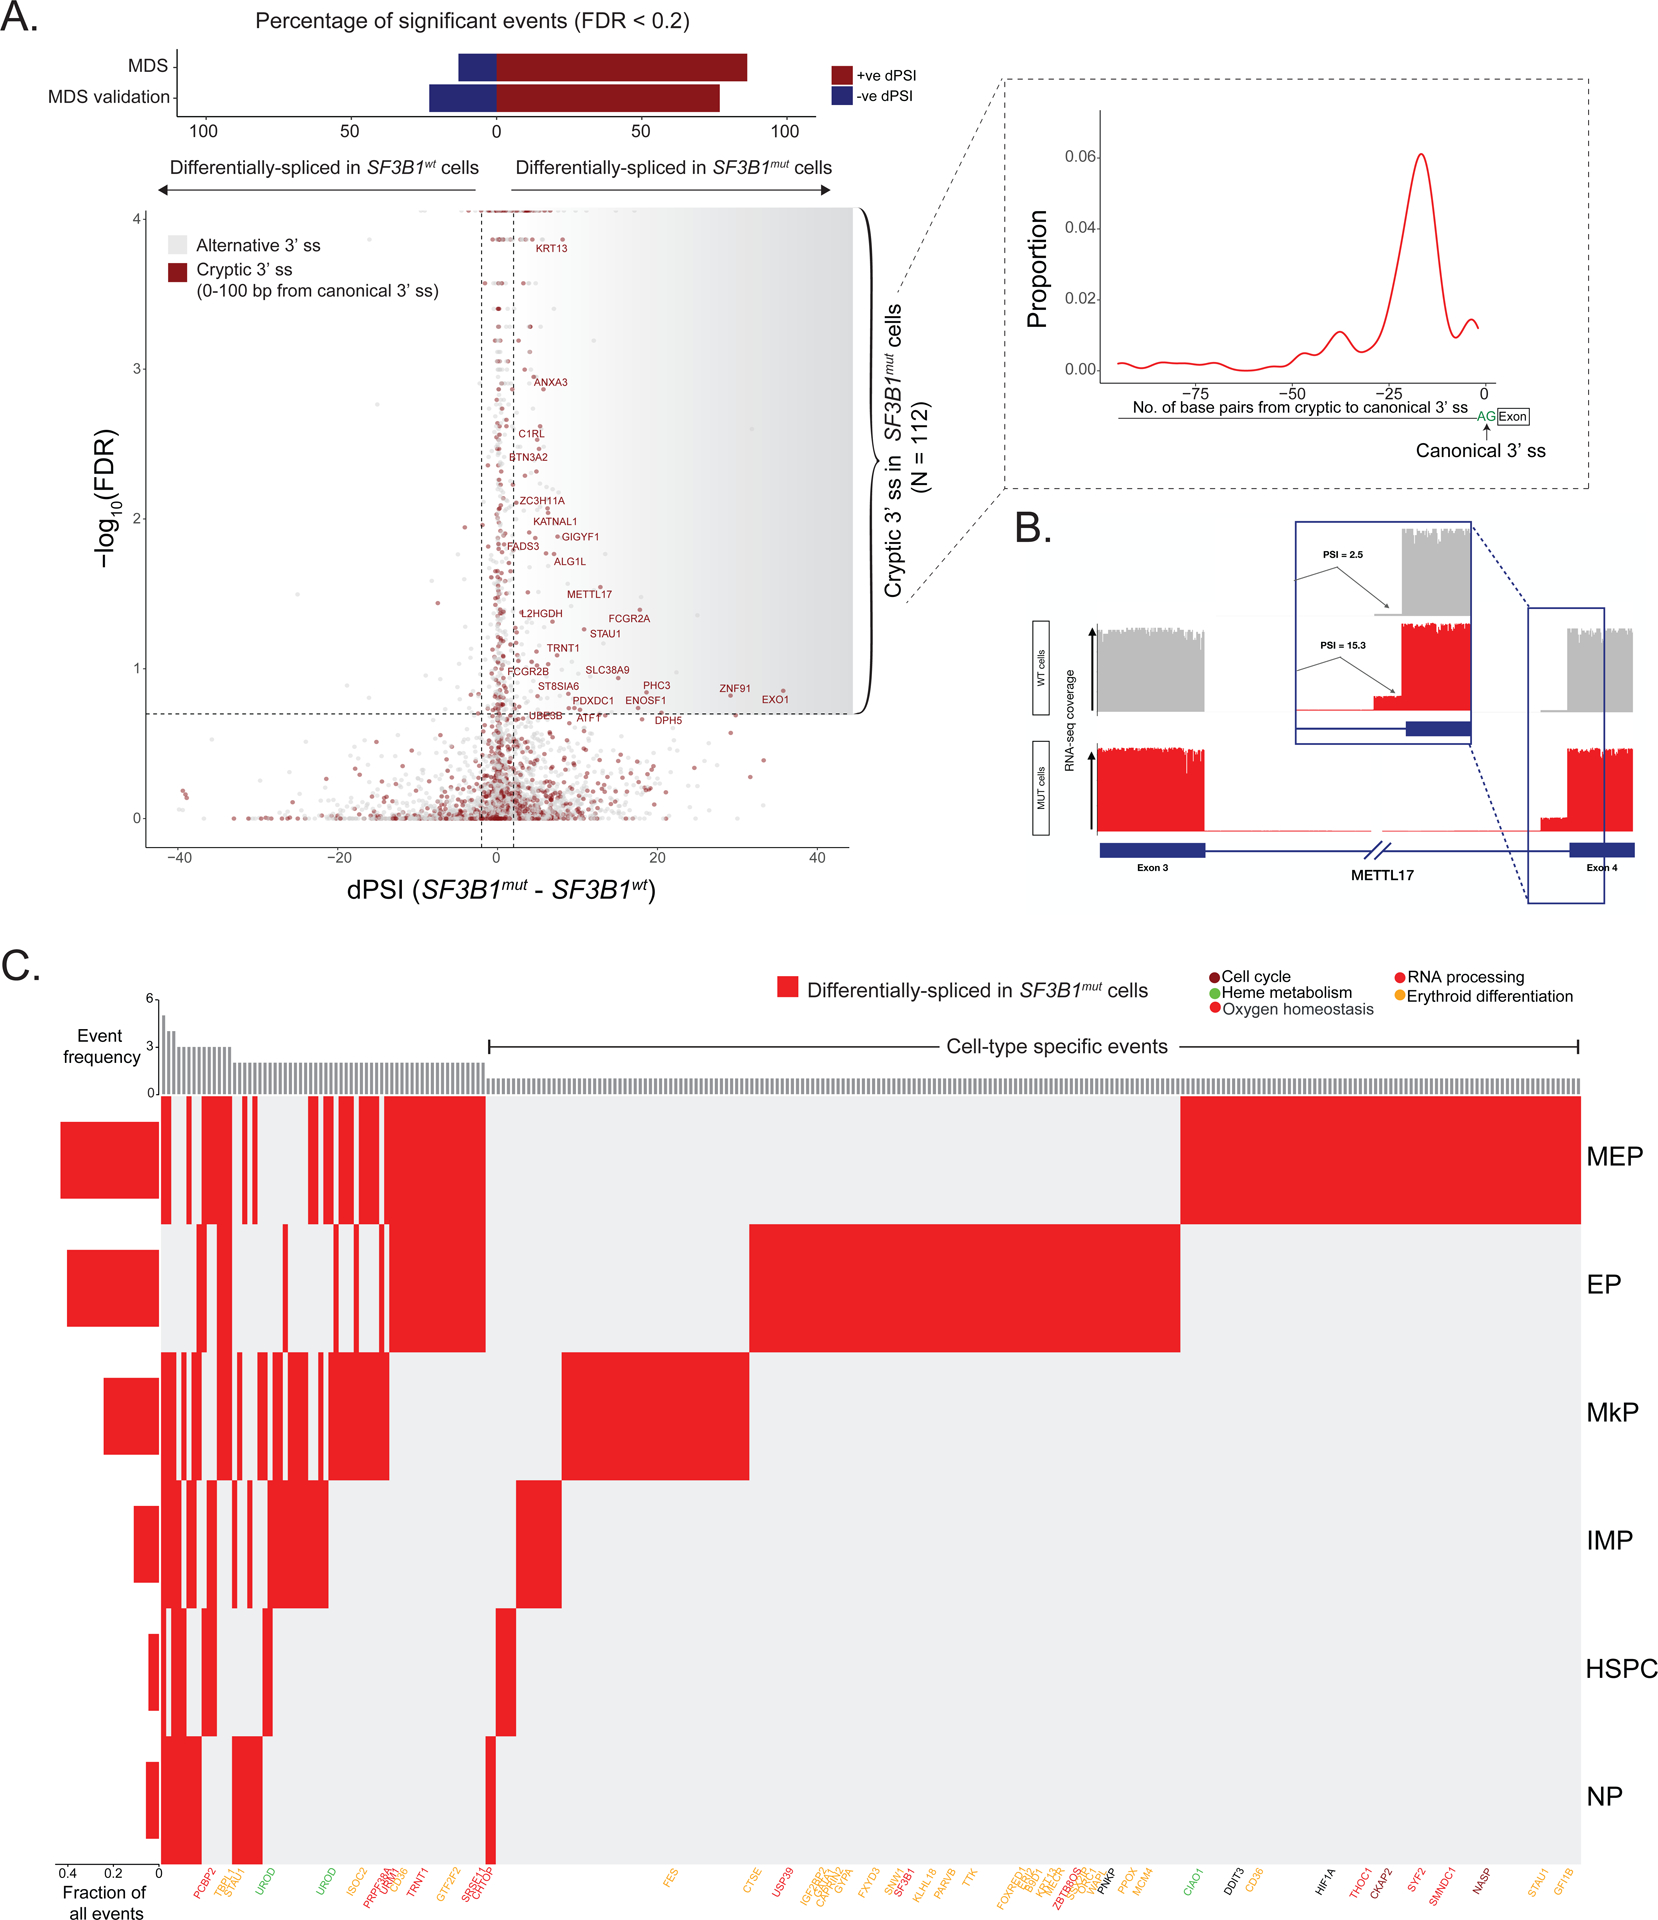
(A) Differential splicing analysis between SF3B1mut and SF3B1wt cells across MDS samples. Junctions with absolute dPSI > 2 and BH-FDR adjusted P-value < 0.2 were defined as differentially spliced. Top: Bars showing percentage of genes differentially spliced in SF3B1mut and SF3B1wt cells in MDS and MDS validation cohorts. Inset: Expected peak in the number of identified cryptic 3’ splice sites at 15–20 base pairs upstream of the canonical 3’ splice site in SF3B1mut cells. (B) Sashimi Plot of METTL17 intron junction with an SF3B1mut associated cryptic 3’ splice site showing RNA-seq coverage in SF3B1mut vs. SF3B1wt cells within MDS samples. Inset: Expected increase in PSI value for the usage of this cryptic 3’ splice site in SF3B1mut cells. (C) dPSI values between SF3B1mut and SF3B1wt cells for cryptic 3’ splicing events identified in main progenitor subsets across MDS samples. Columns- cryptic 3’ junctions differentially spliced in at least one cell-type, with P-value <= 0.05 and dPSI >= 2. Rows- cell-type. Genes highlighted for cell cycle (purple), heme metabolism (green), oxygen homeostasis (black), RNA processing (red) and erythroid differentiation (yellow) pathways. Left bar plots show the fraction of differentially spliced cryptic 3’ splice sites per cell. Top bar plots quantify the total number of cell types where an event is differentially spliced, with the cell-type specific events on the right.
To assess how the SF3B1mut MDS alternative splicing profiles compare to another hematologic malignancy, we compared cryptic 3’ events detected from SF3B1mut MDS cells (positive dPSI, FDR adjusted P-value < 0.2) to those detected using previously published bulk RNA sequencing data from SF3B1mut chronic lymphocytic leukemia (CLL) samples77. We detected more cryptic 3’ events in our MDS dataset, with 10 events overlapping between MDS and CLL (Figure S4i, Table S4). This low overlap is likely driven by expression differences between MDS and CLL cells, as genes with shared events had higher expression levels in MDS cells compared to CLL-only events (Figure S4j).
To demonstrate GoT-Splice’s generalizability for profiling somatic mutations, we analyzed a DNMT3Amut clonal hematopoiesis (CH) sample (R882C; VAF of 0.09). Recent work has implicated DNMT3A in splicing regulation in hematopoiesis, independent of DNA methylation78. We quantified the distribution of alternative splicing patterns and found that exon skipping was the most common event (Figure S5a), as previously reported79. Comparison between DNMT3Amut and DNMT3Awt cells revealed genotype-specific events including the SRSF3 exon 4 skipping event80, exclusive to DNMT3Amut cells (Figure S5b–c). SRSF3 exon 4 harbors a premature termination codon that causes NMD. Thus, the lack of exon 4 usage in DNMT3Amut cells can lead to the overexpression of SRSF3, a known oncogenic splicing factor81. We further applied GoT-Splice to CD34+ cells from an acute myeloid leukemia (AML) patient with a mutation in the splicing factor U2AF1 (S34F; VAF of 0.16). Despite challenges associated with low expression of U2AF1 in this sample, genotyping data were available for 1,662 AML cells (12.8% of all cells) through GoT-Splice (Figure S5d). Alternative splicing events between U2AF1mut and U2AF1wt cells were enriched for exon skipping events82 (Figure S5e). Through our differential splicing analysis pipeline, we further identified 103 significant differentially spliced events between U2AF1mut and U2AF1wt cells (Figure S5f), two of which were exon skipping events in KIN and DAP3 that were more prevalent in U2AF1mut cells (Figure S5g), as previously reported82. These findings demonstrate the generalizability of our method beyond SF3B1 mutation detection and reveal how DNMT3A and U2AF1 mutations result in different splicing changes compared to SF3B1 mutations (exon skipping vs. alternative 3’ splice sites, respectively).
Altogether, GoT-Splice enables to link somatic mutations to transcriptional and cell surface protein marker phenotypes, and single-cell splicing changes.
GoT-Splice shows progenitor-specific patterns in SF3B1mut- mis-splicing
An important advantage of GoT-Splice is the ability to detect splicing changes at single-cell resolution, allowing the comparison of alternative splicing aberrations between MUT and WT cells in specific cell subsets (Figure 3c, Table S4). We identified both shared and unique SF3B1mut cryptic 3’ splice site events across progenitor subtypes in MDS, with the highest usage of cryptic 3’ splice sites occurring in the megakaryocyte-erythroid lineage. SF3B1mut MEPs and EPs accounted for most of the cell-type specific cryptic 3’ splice site events, highlighting the specific impact of SF3B1 mutations on the erythroid lineage. These progenitor-specific patterns in SF3B1mut mis-splicing were confirmed in the validation cohort (MDS04–06; Figure S5h–j). In both MDS cohorts, progenitor-specific cryptic 3’ splice sites involved genes related to cell cycle (e.g., CENPT)83, RNA processing (e.g., CHTOP, SF3B184, SRSF11, PRPF38A), oxygen homeostasis (e.g., HIF1A), erythroid differentiation (e.g., CD36, FOXRED1, GATA134,85,86), and heme metabolism (e.g., UROD, PPOX, CIAO1) (Figure 3c; Figure S5h–i; Table S4). Notably, long-read sequencing was advantageous in detecting cryptic splicing events in functionally important genes (PPOX, UROD) with poor short-read coverage due to substantial drop-off in the 10x short-reads across the transcript (Figure S5j). Although some genes and pathways identified in the analysis of cryptic 3’ splice sites across cohorts have previously been reported to be disrupted by alternative splicing in bulk studies of SF3B1mut MDS samples32, their cell-type specificity was unknown. For instance, while the alternative splicing event in SF3B1 itself has been suggested before as being neoplasm-specific, here we resolved its erythroid-specific pattern. This isoform – SF3B1ins – is predicted to affect splicing by impairing U2 snRNP assembly84, likely contributing to enhanced mis-splicing dysregulation in the megakaryocyte-erythroid lineage. In addition, cell cycle plays a critical role in terminal differentiation of hematopoietic stem cells87 and RNA processing, erythroid differentiation, and heme metabolism pathways are directly linked to the regulation of erythropoiesis88–90. Furthermore, we observed significant overlap of megakaryocyte-erythroid lineage-specific aberrantly spliced genes between discovery and validation MDS cohorts (P-value = 0.00029, Fisher’s exact test, with 46.8% of the cryptically spliced genes in MDS also aberrantly spliced in the MDS validation cohort; Figure S5i), indicating cell-type and differentiation-stage dependency of SF3B1mut-induced alternative splicing27,91–93.
Notably, erythropoiesis occupies a continuum of cell states and is dependent on transcriptional changes that occur along the differentiation trajectory47. Analyzing SF3B1mut mis-splicing along this continuum (Figure 4a) revealed that some erythroid differentiation, oxygen homeostasis and heme metabolism genes can be mis-spliced more frequently at the earliest stages of EP maturation (e.g., UROD, HIF1A, FOXRED194), while others display increased mis-splicing in more differentiated EPs (e.g., GYPA and PPOX). UROD is part of the heme biosynthesis pathway; heme is an important structural component of erythroid cells and plays a regulatory role in the differentiation of erythroid precursors95. PPOX encodes an enzyme involved in mitochondrial heme biosynthesis and, as such, its degradation leads to ineffective erythropoiesis and mitochondrial iron accumulation typical of MDS with ring sideroblast clinical phenotype96. These results provide evidence that pathogenic SF3B1mut-driven mis-splicing impacts key mediators of hemoglobin synthesis and erythroid differentiation at all stages of erythroid maturation97,98.
Figure 4. SF3B1mut-associated mis-splicing changes along the continuum of erythropoiesis.
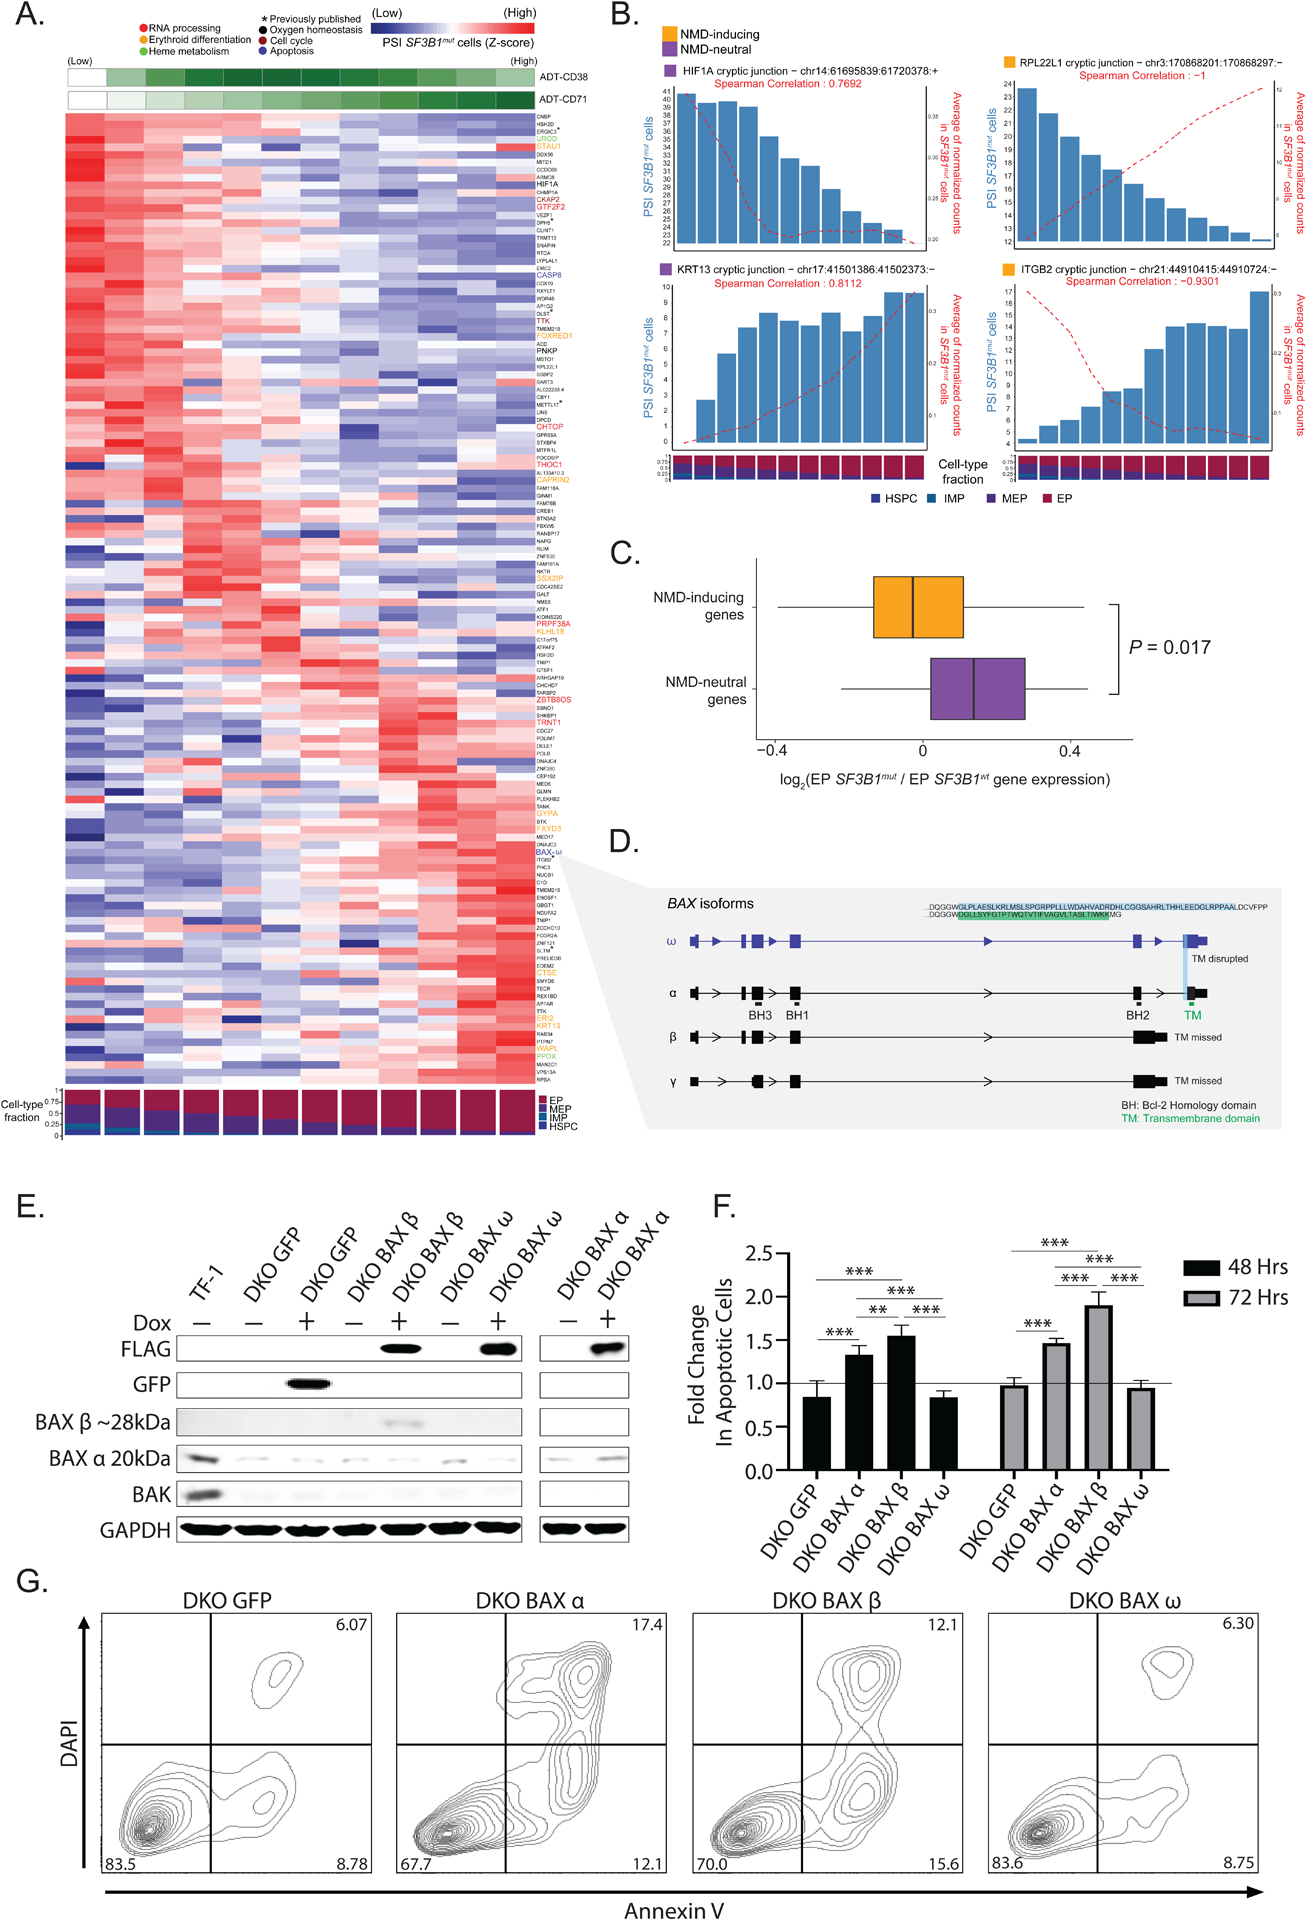
(A) Percent spliced-in (PSI) of junctions in SF3B1mut cells along the hematopoietic differentiation trajectory (HSPCs, IMPs, MEPs, EPs). Rows (z-score normalized)- cryptic 3’ splice sites; columns- PSI for usage of a given cryptic 3’ splice site in each window (size of 3000 SF3B1mut cells, sliding by 300 SF3B1mut cells). Only junctions differentially spliced in at least one cell-type with a dPSI > 2 were analyzed. ADT expression of CD71 and cell type fractions are shown. Rows ordered according to PSI peak. Genes highlighted for cell cycle (purple), heme metabolism (green), oxygen homeostasis (black), RNA processing (red), erythroid differentiation (yellow) and apoptosis (blue) pathways. (B) Examples of mis-spliced genes at different erythroid maturation stages. Bars represent PSI in SF3B1mut cells. Red lines represent junction ONT expression in SF3B1mut cells. (C) Fold change (log2) of gene expression between SF3B1mut and SF3B1wt EP cells in NMD-inducing vs. NMD-neutral genes. (D) BAX gene model and relevant isoforms. Characteristic domains are highlighted in main isoform BAX-ɑ. The cryptic 3’ splicing event on the terminal exon defines the BAX-ω isoform, characterized by frameshift disruption of the transmembrane domain (TM). (E) Western blot of TF-1 BAX/BAK knockout cells (DKO) with doxycycline-inducible expression of control GFP or FLAG-tagged BAX isoforms α, β, and ω after 24 hours. (F) Fold change in annexin V positive TF-1 DKO cells expressing different BAX isoforms under cytokine depleted conditions + doxycycline (1ug/mL) at 48 and 72 hours normalized to apoptotic cells - doxycycline treatment (black line). N=2 independent experiments performed in triplicate. (G) Representative annexin V/DAPI flow cytometry plots of different BAX isoforms after 72 hours under cytokine depleted conditions + doxycycline. Percent frequencies noted in relevant quadrants. Bars represent mean values. Error bars represent ±SD; ** P < 0.01 *** P < 0.001.
In some cases, the degree of mis-splicing of a particular transcript (measured by PSI) positively correlated with its expression across the erythroid differentiation trajectory. In others, mis-splicing was negatively correlated with gene expression, often in cryptic 3’ splice site events predicted to lead to transcript degradation by NMD (Figure 4b for examples). Cryptic 3’ splice sites result in the inclusion of short intronic fragments in mRNA and often introduce a premature termination codon (PTC)99–101. mRNAs harboring an NMD-inducing PTC located ≥50 bps upstream of the last exon–exon junction are predicted to undergo NMD, which prevents production of potentially aberrant proteins. In contrast, mRNAs harboring an NMD-neutral PTC, generally located ≤50 bps upstream of the last exon–exon junction or in the last exon, fail to trigger NMD and produce dysfunctional proteins102,103. We classified cryptic 3’ splice sites detected in the MDS samples into two major groups: (i) NMD-inducing events (due to the introduction of a PTC) and (ii) NMD-neutral events (Table S4). In accordance with previous reports74, of the 421 cryptic 3’ splice sites significantly associated with SF3B1mut cells, 228 (54%) were classified as NMD-inducing events while the remaining 193 (46%) harbored NMD-neutral events. Despite the somewhat equal identification of NMD-inducing and NMD neutral events, we observed an overall decrease in the expression of genes with NMD-inducing event in the MUT cells that harbored these mis-spliced transcripts when compared to NMD-neutral events (P-value = 0.017, Mann Whitney U test; Figure 4c).
NMD-inducing events affected key genes in erythroid development, such as UROD, GYPA, FOXRED1 and PPOX. Transcript loss via NMD104,105 may thus contribute to disrupted terminal differentiation of EPs. Notable among NMD-neutral affected genes, we identified BAX, a member of the Bcl-2 gene family and transcriptional target of TP53. BAX plays a vital role in the apoptotic cascade, balancing survival, differentiation, and proliferation of EPs during later stages of erythropoiesis106 (Figure 4a). The identified BAX cryptic 3’ splice site, though NMD-neutral, causes a frameshift in the last exon, disrupting the C-terminus of the protein. This BAX isoform, known as BAX-ω (Figure 4d), has been shown to protect cells from apoptotic cell death107,108.
To functionally evaluate the significance of SF3B1mut-specific alternatively spliced BAX isoforms, we generated BAX and BAK1 double knockout (DKO) human TF-1 erythroid leukemia cells and re-expressed FLAG-tagged BAX-α, BAX-β, and BAX-ω isoforms under a doxycycline-inducible promoter (Figure 4e). BAX and BAK1 have functionally redundant proapoptotic roles109 and DKO cell lines have previously been utilized in similar functional validation experiments of BAX variants110,111. TF-1 cells are an established immature cell line of erythroid origin and are dependent on growth factors for proliferation and survival112. We tested the ability of different BAX isoforms to induce apoptosis under cytokine-depleted conditions. As expected, TF-1 DKO inducible GFP control cells had no increase in apoptosis while induction of BAX-α and BAX-β expression led to a significant increase in apoptotic cells at 48 and 72 hours, consistent with their established roles as inducers of apoptosis113. Importantly, expression of BAX-ω showed no change in apoptosis under cytokine-depleted conditions, supporting an anti-apoptotic role for BAX-ω expression in immature erythroid cells (Figure 4f–g). Collectively, our data highlight SF3B1mut-specific mis-splicing in the induction of NMD in erythroid differentiation genes and alternative splicing of apoptosis mediators as important events in the pathogenesis of SF3B1mut MDS cells.
Accumulation of SF3B1mut cells in the erythroid progenitor population and extensive mis-splicing in clonal hematopoiesis
While SF3B1 mutations are the most common genetic alterations in MDS patients, they are also associated with a high-risk of malignant transformation in clonal hematopoiesis (CH)4–8,114,115. However, the study of SF3B1 mutations directly in primary human samples has been largely limited to MDS, where confounding co-occurrence of other genetic alterations is common. Additionally, it remains unclear exactly how splicing mutations impact cellular phenotypes in CH. For example, while SF3B1 mutations have been proposed to be drivers of CH116, enhancing likelihood of progression to myeloid neoplasia, these mutations often occur as early genetic events in CH cases, with gradually increasing VAF over time. In contrast, mutations in U2AF1 and SRSF2 appear later in life, with rapidly increasing VAF117. Thus, CH presents a unique setting to interrogate the molecular consequences of SF3B1 mutations in non-malignant human hematopoiesis.
We therefore isolated viable CD34+ cells from two CH samples with SF3B1 mutations (VAFs: 0.15 and 0.22, from CD34+ autologous grafts collected from patients with multiple myeloma in remission) and performed GoT-Splice. A total of 9,007 cells across both samples passed quality filters (Figure S6a) and were integrated and clustered based on transcriptome data alone, agnostic to genotyping information (Figure 5a; Figure S6b). Consistent with clinical data indicating normal hematopoietic production, we identified the expected progenitor subtypes using previously annotated progenitor identity markers (Figure 5a; Figure S6c–d). Genotyping data were available for 3,642 cells (40.4%) through GoT (Figure S6e), and copy number analysis with scRNA-seq data confirmed the expected absence of chromosomal gains or losses (Figure S6f).
Figure 5. SF3B1 mutations are enriched along the erythroid lineage in clonal hematopoiesis.
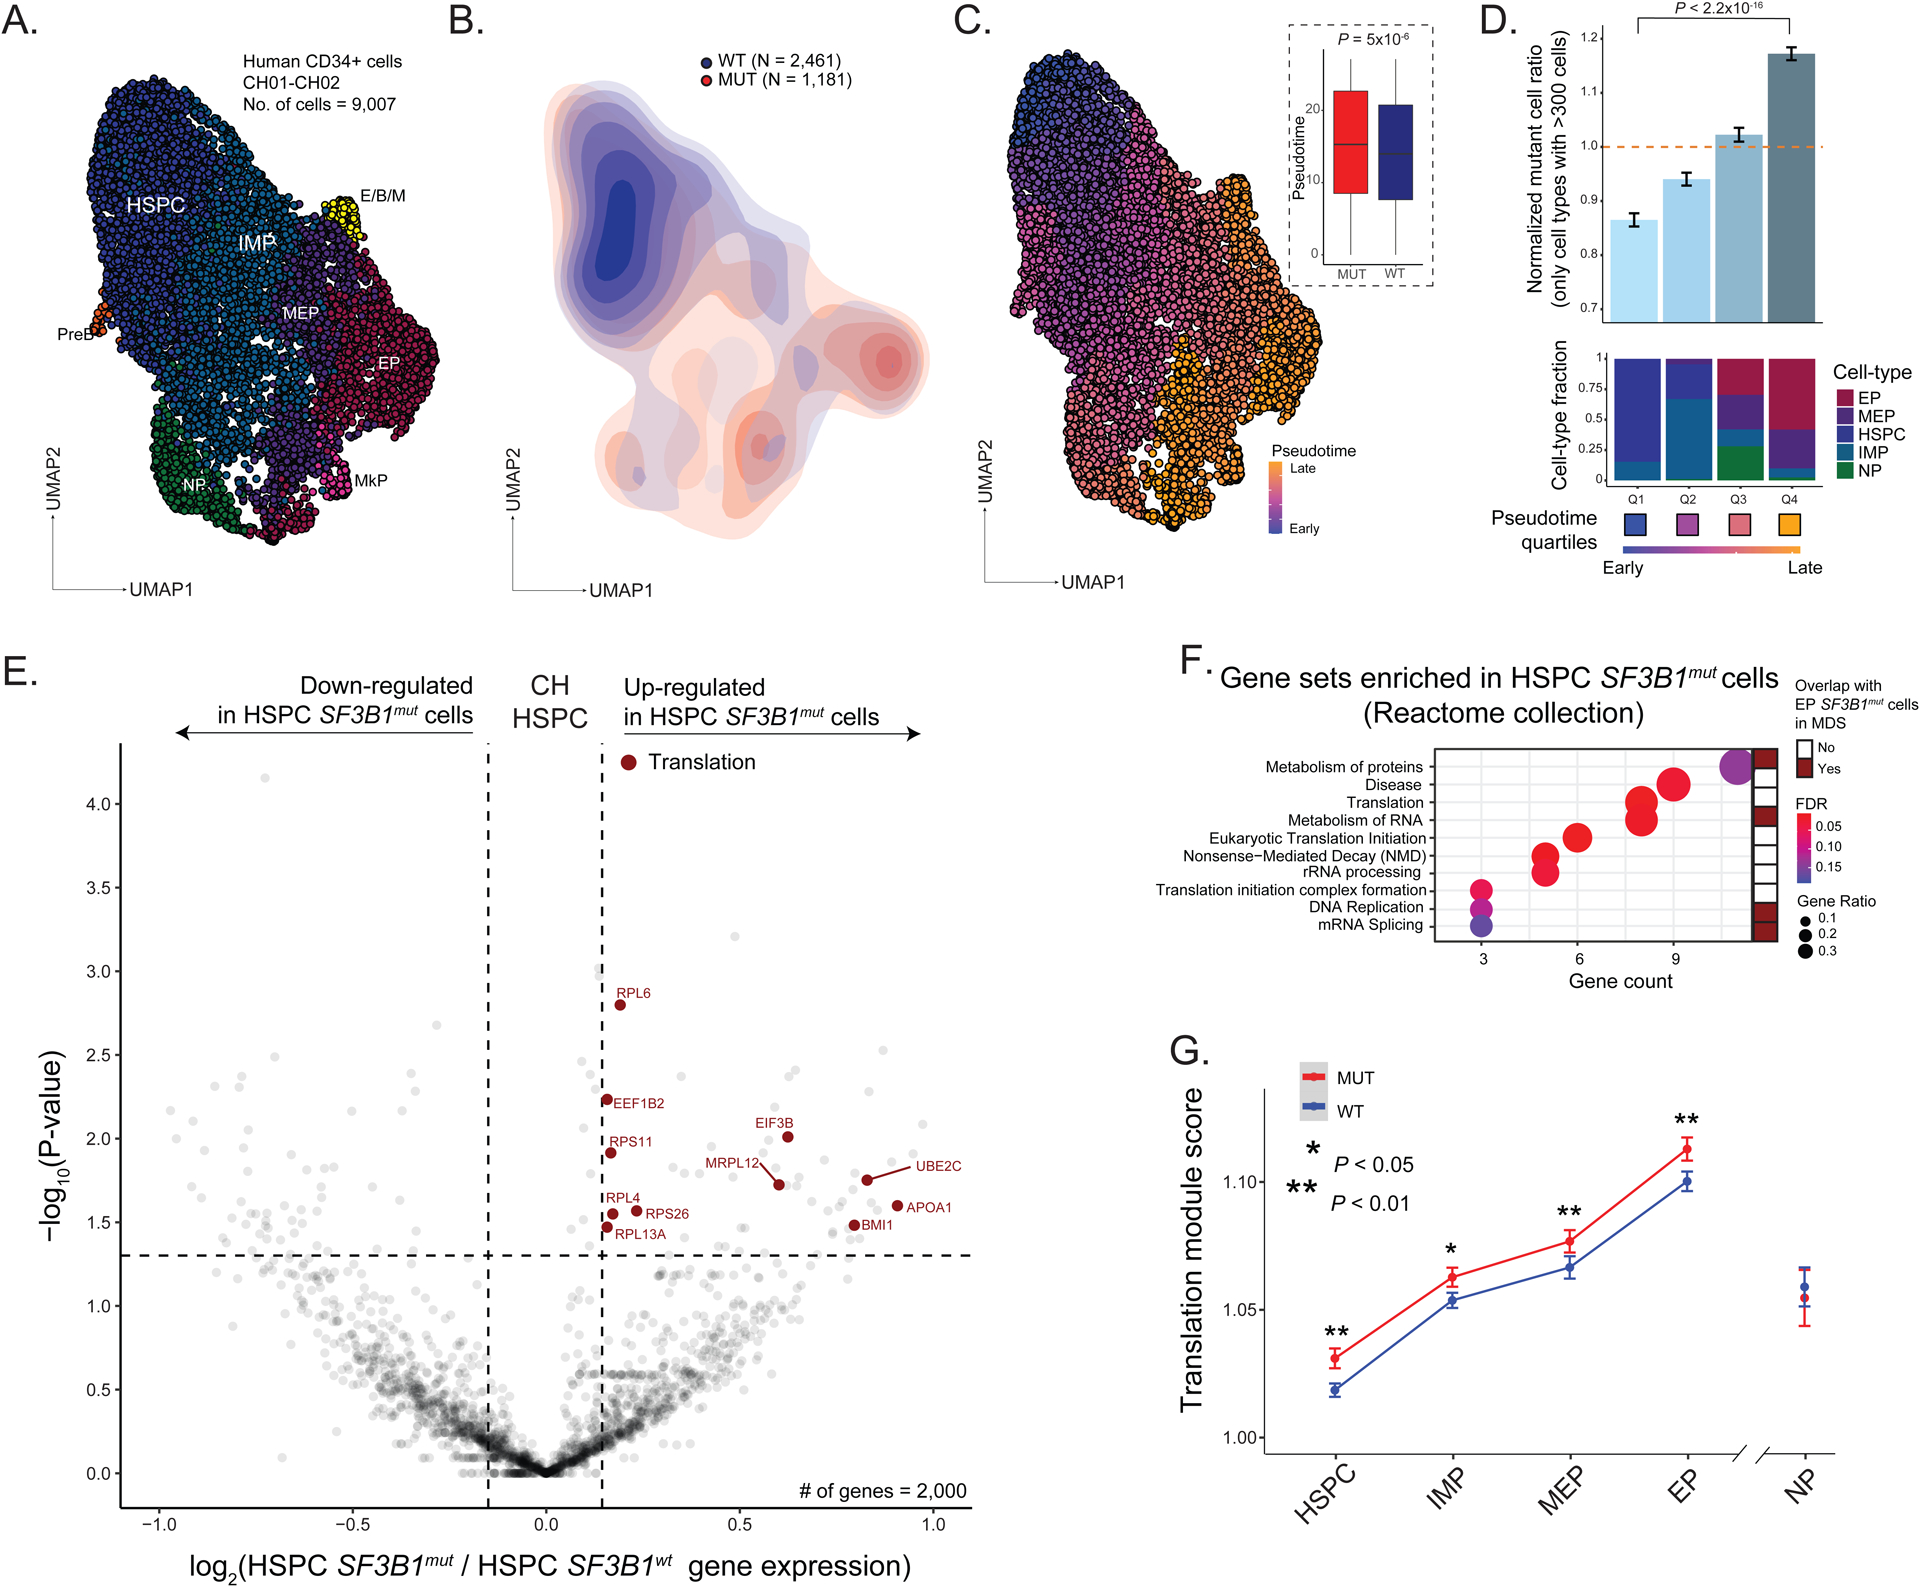
(A) UMAP of CD34+ (n = 9,007) cells from clonal hematopoiesis (CH) samples with SF3B1 K700E or SF3B1 K666N mutation (n = 2 individuals), overlaid with cluster cell-type assignments. See Figure 1A for cell-type descriptions. (B) Density plot of SF3B1mut vs. SF3B1wt cells. (C) UMAP of CD34+ cells from CH samples overlaid with pseudotemporal ordering. Inset: Pseudotime in SF3B1mut vs. SF3B1wt cells in the aggregate of CH01-02. P-value for comparison of means from Wilcoxon rank sum test. (D) Normalized ratio of mutated cells along pseudotime quartiles. Bars show aggregate analysis of samples CH01-CH02 with mean +/− s.e.m. of 100 downsampling iterations to 1 genotyping UMI per cell. Only cell types with >300 cells were analyzed. P-value from likelihood ratio test of linear mixed model with or without mutation status. Bottom: Fraction of cell types within each pseudotime quartile. (E) Differential gene expression between SF3B1mut and SF3B1wt HSPC cells in CH samples. Genes with an absolute log2(fold change) > 0.1 and P-value < 0.05 were defined as differentially expressed (DE). DE genes in the translation pathway (red, Reactome) are highlighted (see Table S5). (F) Gene Set Enrichment Analysis of DE genes in SF3B1mut HSPC cells across CH samples. Gene sets that overlap with SF3B1mut EP cells in MDS highlighted (red). (G) Expression (mean +/− s.e.m.) of translation-related genes (Reactome) between SF3B1mut and SF3B1wt cells in progenitor cells from CH01-02 samples. P-values from likelihood ratio test of linear mixed model with or without mutation status.
Projection of the genotyping information onto the differentiation map (Figure 5b), showed no novel cell identities formed by the SF3B1 mutations, consistent with the fact that patients with CH exhibit no overt peripheral blood count or morphological abnormalities. However, a differentiation pseudotime ordering analysis revealed enrichment of SF3B1mut cells at later pseudotime points compared to SF3B1wt cells (Figure 5c; Figure S6g). As in MDS, mutated cells were enriched in more differentiated EPs compared to the earlier HSPCs (P-value < 0.001, linear mixed model, Figure 5d; Figure S6h), showing that SF3B1mut CH cells already demonstrate an erythroid lineage bias.
To further identify transcriptional dysregulation in SF3B1mut CH cells, we performed differential gene expression analysis between mutated and wildtype cells. We observed an up-regulation of genes involved in mRNA translation in the SF3B1mut HSPCs (where spliceosome mutations originate from the most primitive multipotent compartment116,118) in CH (FDR adjusted P-value = 0.005; Figure 5e–f; Table S5), a pathway also observed to be upregulated in the MDS analysis (Figure 1h). In CH, upregulation of mRNA translation pathway genes was observed across multiple cell subtypes along erythroid differentiation, while absent in NPs (Figure 5g). Thus, although no overt blood count abnormalities are observed with SF3B1 mutation in CH individuals, both the erythroid differentiation bias and aberrant transcriptional profiles are already apparent at this early pre-disease stage.
The analysis of differentially used alternative 3’ splice sites between SF3B1mut and SF3B1wt CH cells revealed a marked increase in cryptic 3’ splice site usage in SF3B1mut cells, as observed in MDS (Figure 6a). These mutant-specific cryptic 3’ splice sites affected genes including UROD, OXAIL, SERBP1, MED6, and ERGIC3, which were also detected to be cryptically spliced in the SF3B1mut MDS cells. Importantly, the lower VAF associated with pre-malignant CH samples highlights the necessity for GoT-Splice to increase the detection of mis-splicing events occurring at low frequencies, and that may otherwise be missed in bulk sequencing studies (Figure 6b; Figure S6i). To validate these results, we analyzed CD34+ cells from a CH sample collected from an individual without myeloma history (CH03, Methods) and observed high correlation of shared splice junctions with our previous samples (Spearman’s rho = 0.96, P-value = 2.03x10⁻¹²; Figure S6j). We also recapitulated 3’ cryptic splice site and exon inclusion events in key genes (e.g., SERBP1 and HNRNPA1; Figure S6k).
Figure 6. SF3B1mut clonal hematopoiesis progenitor cells display cell-type specific cryptic 3’ splice site usage.
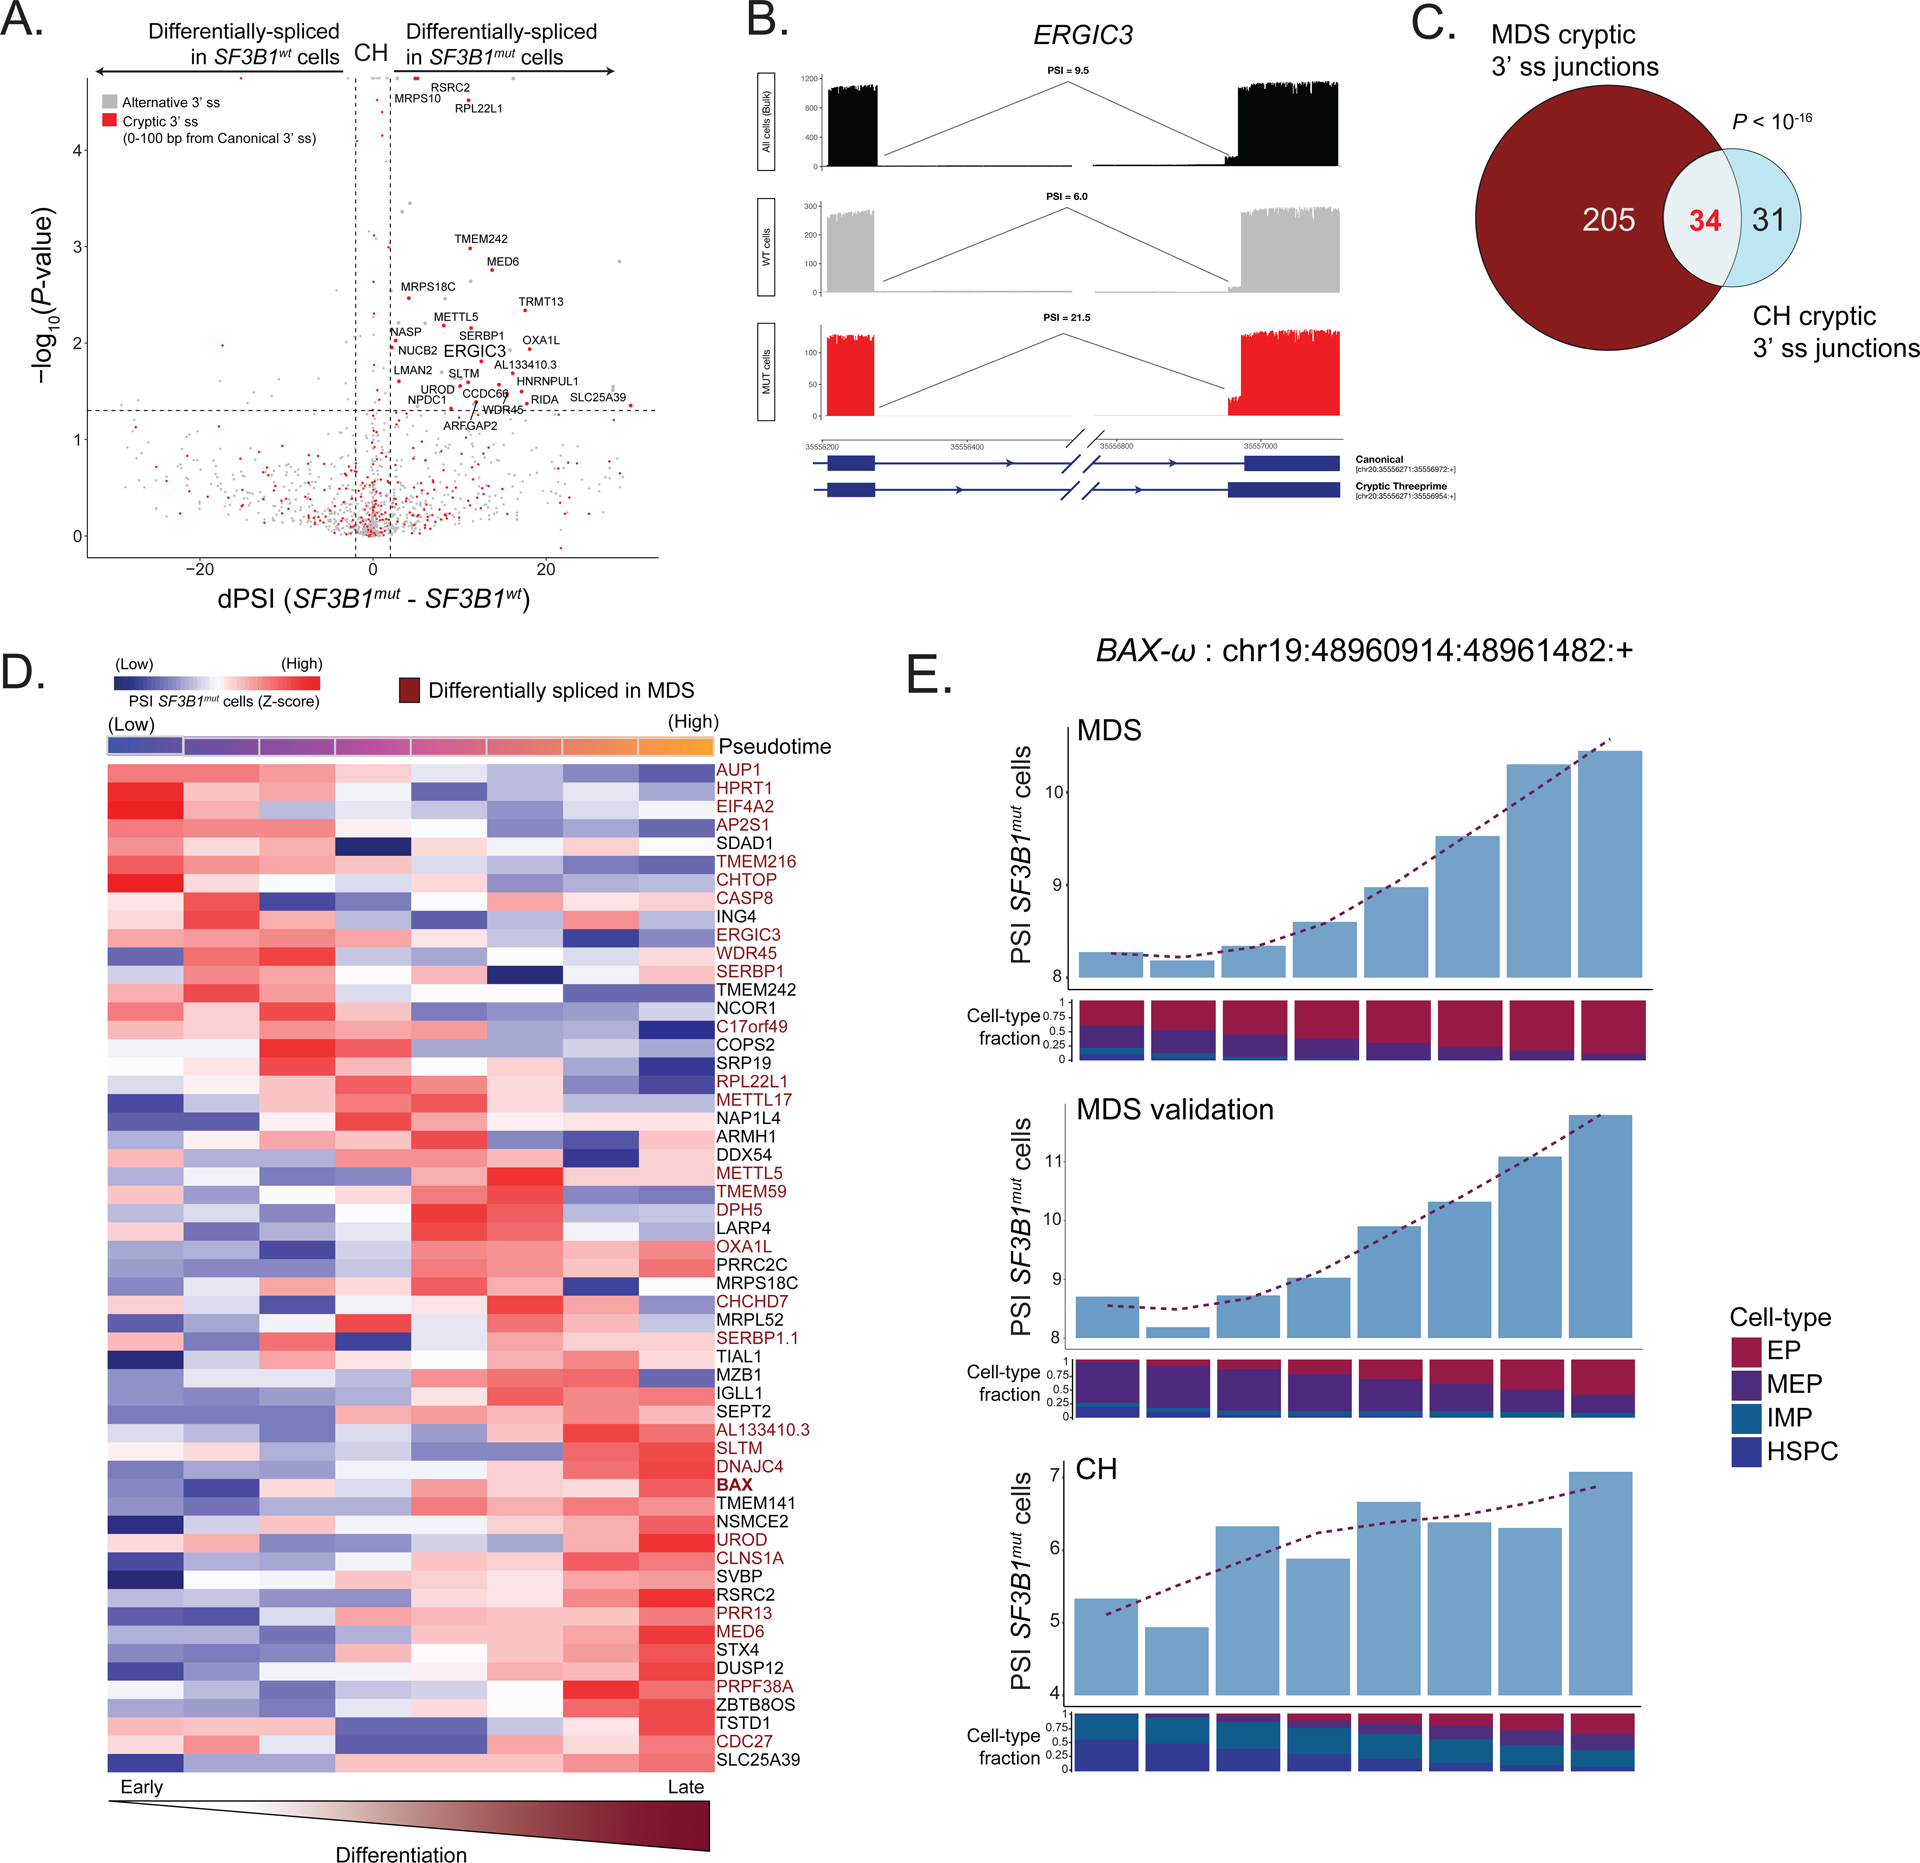
(A) Differential splicing analysis between SF3B1mut and SF3B1wt cells across CH samples. Junctions with an absolute delta percent spliced-in (dPSI) > 2 and BH-FDR adjusted P-value < 0.2 were defined as differentially spliced. (B) Sashimi Plot of ERGIC intron junction with an SF3B1mut associated cryptic 3’ splice site showing RNA-seq coverage in SF3B1mut vs. SF3B1wt cells within CH samples, as well as compared to the CH samples when treated as bulk (pseudobulk of all cells regardless of genotype). PSI values showing the expected increase in usage of this cryptic 3’ splice site in SF3B1mut cells alone when compared to both SF3B1wt cells as well as all cells (pseudobulk of sample). (C) Venn Diagram of overlapping genes with cryptic junctions significantly differentially spliced in at least one erythroid lineage cell type (HSPCs, IMPs, MEPs, EPs) with a dPSI > 2 between MDS01-03 and CH samples. P-value for the overlap from Fisher’s Exact test. (D) Percent spliced-in (PSI) of junctions in SF3B1mut cells along the hematopoietic differentiation trajectory of erythroid lineage cells. Rows (z-score normalized)- cryptic 3’ splice sites; columns- PSI for usage of a given cryptic 3’ splice site in each window (size of 600 SF3B1mut cells, sliding by 60 SF3B1mut cells). Only junctions differentially spliced in at least one cell type with a dPSI > 2 were analyzed. Pseudotime across each window shown. Rows are ordered according to the peak in PSI. Cryptic events also differentially spiced in MDS highlighted (red). (E) Bar plots of PSI values for usage of the BAX-ω isoform across each window of SF3B1mut cells in the MDS, MDS validation and CH cohorts along the hematopoietic differentiation trajectory of erythroid lineage cells. Fraction of cell types in each window shown per cohort (MDS: SF3B1mut cells (n = 6376) ordered by CD71 expression, MDS validation: SF3B1mut cells (n = 987) ordered by pseudotime, CH: MUT cells (n = 1021) ordered by pseudotime).
To compare mis-spliced transcripts between CH and MDS, we compared cryptic 3’ splice sites with a P-value < 0.05 and dPSI of >= 2 in at least one cell-type along the erythroid differentiation trajectory (HSPC, IMP, MEP, or EP) in both CH and MDS cohorts (Table S6). While the overall number of significant cryptic 3’ splice sites in CH was lower than in MDS, we observed a significant overlap in shared cryptic events (P-value < 10−16, Fisher’s exact test; Figure 6c). Similarly to MDS, we identified stage-specific mis-splicing events in erythroid maturation, the majority of which overlapped with MDS cryptic 3’ splice sites (Figure 6d). Notably, CH and MDS showed similar mis-splicing dynamics (i.e., increased PSI of BAX-ω in SF3B1mut cells) in the BAX transcript along the erythroid differentiation trajectory (Figure 6e; Table S6). Collectively, these data demonstrate that the aberrant splicing phenotype is already apparent in CH, impacting genes that are also observed in MDS SF3B1mut induced mis-splicing.
DISCUSSION
Here, we present GoT-Splice, a single-cell multi-omics integration that enables joint profiling of genotype, gene expression, protein, and aberrant splicing all within the same cell. GoT15, allows for the comparison between somatically mutated and wildtype cells within the same sample for genotype-to-phenotype inferences. By further optimization of long-read sequencing of scRNA-seq libraries67, we could simultaneously capture both short and long-read data within the same cell, making it possible to analyze the impact of somatic mutations on transcriptional and splicing phenotypes. This stands in contrast to other methods that provide single-cell genotyping capture but either lack mRNA capture119 or have lower throughput without full length isoform data22,120,121.
To date, few tools are available to process and analyze single-cell long-read data, especially for the purpose of alternative splicing. To address existing analytic gaps, we developed a long-read splicing analysis pipeline that detects and quantifies alternative splicing events within single cells and highlights differential junction usage across cell subpopulations. For processing the long-read data we opted for an intron-centric approach followed by split 5’ and 3’ PSI measurements. Calculating the rate of splicing at the 5’ and 3’ ends of the intron improves the detection of the true splicing rate of each individual intron, compared to exon-centric approaches71. In addition, our pipeline detected differential splicing patterns between MUT and WT cells, both across entire samples and within individual cell types, with sample-aware permutation testing to integrate across samples. Finally, we provide information regarding the translational consequences of the alternatively spliced junctions. Altogether, our pipeline offers a comprehensive toolkit to process and analyze differential splicing events in scRNA-seq long-read data.
By applying GoT-Splice to the most common splice-altering mutation (SF3B1), we interrogated differentiation biases, differential gene expression, protein expression and splicing patterns, comparing SF3B1mut vs. SF3B1wt cells co-existing within the same bone marrow. Importantly, while GoT revealed that SF3B1mut cells arise early on in uncommitted HSPCs, we observed a differentiation bias of SF3B1mut cells toward the erythroid progenitor fate. This finding is of particular interest given the clinical association between SF3B1 mutations and dysplastic erythropoiesis. Notably, an increase in cell cycle and checkpoint gene expression (MDM4 and CCNE1) as well as the over-expression of erythroid lineage markers, CD36 and CD71, specifically in SF3B1mut EPs, support the enrichment of SF3B1 mutations along the erythroid lineage.
CH samples likewise showed erythroid biased differentiation with higher mutated cell frequency in committed erythroid progenitors compared with HSPCs. SF3B1mut CH cells showed upregulation of genes in pathways involved in translation and mRNA processing, similar to SF3B1mut cells in MDS. This finding suggests that the pervasive mis-splicing observed with SF3B1 mutations may disrupt translation, which may also contribute to dyserythropoiesis122,123. Thus, in addition to the shared erythroid differentiation bias in MDS and CH, aberrant transcriptional profiles linked to the dyserythropoiesis phenotype are also already apparent at the pre-disease CH stage.
Leveraging the single-cell resolution of GoT-Splice and differential splicing analysis between SF3B1mut and SF3B1wt cells revealed cell-type specific effects of SF3B1 mutations on mis-splicing. Key genes involved in pathways important for terminal differentiation of hematopoietic stem cells as well as the regulation of erythropoiesis (namely RNA processing, erythroid differentiation, cell cycle and heme metabolism) were cryptically spliced across distinct SF3B1mut progenitor cell types, many of which were previously reported to be affected in bulk studies of SF3B1mut MDS29,56,75. While some cryptic events were neutral, many key genes important for erythroid differentiation were NMD-inducing (e.g., UROD, GYPA, PPOX) or caused a frameshift event that may affect protein structure and function in both the primary and validation MDS cohorts, such as key apoptosis mediators (e.g., BAX). Indeed, our functional data support an anti-apoptotic role for BAX-ω in SF3B1mut cells. These data are consistent with the recent discovery of C-terminal BAX mutations in myeloid clones that arise in chronic lymphocytic leukemia patients upon prolonged exposure to venetoclax, demonstrating a role for BAX C-terminal alterations in conferring a survival advantage to myeloid cells with this pro-apoptotic treatment110. Of note, early clinical observations reported lower response to venetoclax in SF3B1mut AML124,125, consistent with a potential anti-apoptotic effect of BAX-ω. Together, these findings suggest a potential mechanism underlying the observed erythroid-dysplasia phenotype in SF3B1mut MDS. Despite the injury to translational machinery (Figure 1h–i), SF3B1mut EPs may gain some degree of protection against cell death due to the disruption of protein function of pro-apoptotic genes in the TP53 pathway126,127 resulting from aberrant splicing, as exemplified by the BAX-ω isoform. Overall, mis-splicing of genes involved in erythroid differentiation and apoptosis regulation may therefore lead to the accumulation of SF3B1mut EPs erythroid progenitor cells that fail to reach terminal differentiation106, leading to the dyserythropoiesis clinical phenotype.
Collectively, this work advances our ability to connect somatic genotypes with complex phenotypes in human samples. Splicing changes have a critical role in cancer biology128,129, also evidenced by the prevalence of splice factor mutations across blood and solid tumor malignancies130,131. The ability to layer genotyping together with rich splicing annotation can thus enable the investigation of aberrant splicing in cancer evolution. Notably, somatic evolution not only affects cancer, but has been recently shown to ubiquitously impact non-malignant human tissues in the form of somatic mosaicism132,133. However, in somatic mosaicism, the challenge of connecting genotypes to cellular phenotypes is magnified given the admixture of mutated and wildtype cells, and thus studies to-date in humans have been largely limited to genotyping. Overcoming this challenge requires advances in single-cell multi-omics for genotype-phenotype mapping in human somatic mosaicism21,134. This context highlights the importance of this work as one of the first phenotypic studies of clonal mosaicism in human samples, leading to the observation that the somatic mutation-related phenotype aligns with the more advanced MDS cellular phenotype. We speculate that this observation and other recent data134 suggest that clonal mosaicisms and neoplastic disorders may, at times, lie across a continuum, whereby clinical phenotypes appear as a result of increasing frequency of mutated cells rather than a qualitative phenotypic change.
Limitations of the Study
Although GoT-Splice offers a powerful approach to simultaneously assess multiple single-cell modalities, including genotype and splicing isoforms, we note some limitations. The percentage of cells successfully genotyped can vary due to factors like gene expression levels or the efficiency of the 10x Genomics capture. For instance, in the SF3B1 analysis conducted in this study, the percentage of genotyped cells ranged from approximately 20% to nearly 90% across individuals. Additionally, due to potential incomplete capture of the heterozygously-mutated allele, mutated cells may be mis-classified as wildtype when the wildtype allele is captured but the mutant allele is missed. We note that this confounding factor is expected to diminish true signals in mutated vs. wildtype comparisons, rather than leading to erroneous signals. To address this, we have implemented mitigating strategies such as genotyping wildtype cells with two or more genotyping amplicon UMIs and down-sampling to determine mutant cell frequency (see Methods for more details). Finally, larger cohort sizes and further functional characterizations are needed to validate our biological findings and examine the impact of isoform BAX-ω on SF3B1mut cells in MDS and CH.
STAR METHODS
Resource availability
Lead contact
Further information and requests for resources and reagents should be directed to and will be fulfilled by the lead contact, Dan A. Landau (dlandau@nygenome.org).
Materials availability
This study did not generate new unique reagents.
Data and code availability
The processed single cell RNA-Seq data are available through the NCBI Gene Expression Omnibus (GEO) and are publicly available as of the date of publication. Accession numbers are listed in the key resources table. De-identified patient FASTQ files have been deposited at the European Genome–phenome Archive (EGA) and accession numbers are listed in the key resources table. They are available upon request if access is granted.
All original code has been deposited at GitHub and Zenodo and is publicly available as of the date of publication. DOIs are listed in the Key Resources Table.
Any additional information required to reanalyze the data reported in this paper is available from the lead contact upon request.
KEY RESOURCES TABLE
| REAGENT or RESOURCE | SOURCE | IDENTIFIER |
|---|---|---|
| Antibodies | ||
| CITE-seq ADTs (see Table S2) | BioLegend TotalSeq-A | N/A |
| CD34-PE-Vio770 | Miltenyi Biotec | clone AC136; RRID: AB_2660374 |
| BAX | Santa Cruz Biotechnology | sc-7480; RRID: AB_626729 |
| BAK | Thermo Fisher | MA5–36225; RRID: AB_2884059 |
| GFP | Cell Signaling Technology | 2555S; RRID: AB_10692764 |
| GAPDH | Cell Signaling Technology | 5174S; RRID: AB_10622025 |
| FLAG | Sigma Aldrich | F1804; RRID: AB_262044 |
| Bacterial and virus strains | ||
| Lentiviral expression vector | Addgene | RRID: Addgene_128055 |
| Neomycin lentiviral expression vector | Addgene | RRID: Addgene_139449 |
| Tetracycline inducible lentiviral expression vector | Addgene | RRID: Addgene_162823 |
| Chemicals, peptides, and recombinant proteins | ||
| FSC | TaKaRa | #631106 |
| Human GM-CSF | R&D Systems | 215-GM |
| DAPI | Sigma-Aldrich | D9542 |
| Annexin V | BioLegend | 640920 |
| RIPA buffer | Cell Signaling Technology | N/A |
| Intercept Blocking Buffer | LI-COR | N/A |
| Critical commercial assays | ||
| Ligation Sequencing Kit | Oxford Nanopore Technologies | SQK-LSK110 SQK-LSK114 |
| LongAmp Taq 2X Master Mix | New England BioLaboratories | M0287S |
| Chromium 3’ (v.3.1 chemistry) | 10x Genomics | N/A |
| SPRI beads | Beckman Coulter Life Science | B23317 |
| MycoAlert Mycoplasma Detection Kit | Lonza | LT07–701 |
| MycoAlert Assay Control Set | Lonza | LT07–518 |
| True-Stain Monocyte Blocker | BioLegend | Cat#422302; RRID: AB_2818986 |
| Deposited data | ||
| scRNAseq CH01–02, CH04, MDS01–06 and AML01A-B (See Table S1), raw (FASTQ) and processed (gene matrix counts, barcodes, features, and isoform junction counts) samples. | This paper | GEO: GSE204845 EGA: EGAS00001007402 |
| Human reference GRCh38 (GENCODE v32/Ensembl 98) | 10x Genomics | https://support.10xgenomics.com/single-cell-gene-expression/software/release-notes/build#GRCh38_2020A |
| MSigDB C2 curated gene sets | GSEA | RRID: SCR_016863; https://www.gsea-msigdb.org/gsea/msigdb/human/collection_details.jsp#C2 |
| Human transcript reference GRCh38.p12 (v31) | GENCODE | RRID: SCR_014966; https://www.gencodegenes.org/human/release_31.html |
| Experimental models: Cell lines | ||
| TF-1 | ATCC | CRL-2003; RRID: CVCL_0559 |
| TF1-Cas9 BAX and BAK DKO cells | This paper | N/A |
| Oligonucleotides | ||
| Used in GoT and cDNA ONT sequencing; KO experiments (see Table S1) | This paper | N/A |
| Software and algorithms | ||
| Cell Ranger (v.3.1.0) | 10x Genomics | RRID: SCR_017344; https://support.10xgenomics.com/single-cell-gene-expression/software/release-notes/3-1 |
| Seurat (v.3.1) | Stuart et al.134 | RRID: SCR_016341; https://github.com/satijalab/seurat/releases/tag/v3.1.0 |
| Monocle3 (v.1.0) | Cao et al.135 | RRID: SCR_018685; https://github.com/cole-trapnell-lab/monocle3 |
| IronThrone (v.2.1) | Nam et al.133 | https://github.com/landau-lab/GoT-IronThrone |
| lme4 (v.1.2–1) | Bates et al. | RRID: SCR_015654; https://github.com/lme4/lme4 |
| dsb (v.0.1.0) | Mulè et al.136 | https://github.com/niaid/dsb |
| Guppy (v.3.0.6 – 4.0.11) | NanoporeTech | RRID: SCR_023196; https://github.com/nanoporetech/pyguppyclient |
| SiCeLoRe (v.1.0) | Lebrigand et al.67 | RRID: SCR_018550; https://github.com/ucagenomix/sicelore |
| minimap2 (v.2.17) | Heng Li137 | RRID: SCR_018550; https://github.com/lh3/minimap2/releases/tag/v2.17 |
| SAMtools (v.1.9) | Danecek et al.138 | RRID: SCR_002105; https://github.com/samtools/samtools/releases/tag/1.9 |
| umi-tools (v.1.1.2) | Smith et al.139 | RRID: SCR_017048; https://github.com/CGATOxford/UMI-tools/releases/tag/1.1.2 |
| InferCNV (v.1.4.0) | Tickle et al.140 | RRID: SCR_021140; https://github.com/broadinstitute/infercnv |
| CONICSmat (v.0.0.0.1) | Müller etal.141 | https://github.com/diazlab/CONICS |
| FLAMES (v.1.3.4) | Tian et al.68 | https://github.com/OliverVoogd/FLAMES |
| IsoQuant (v.3.1.1) | Prjibelski et al.76 | https://github.com/ablab/IsoQuant/releases/tag/v3.1.1 |
| SQANTI3 (v.5.1.1) | Tardaguila et al.142 | https://github.com/ConesaLab/SQANTI3 |
| SUPPA2 (v.2.3) | Trincado et al.143 | https://github.com/comprna/SUPPA |
| DRIMSeq (v.1.22.0) | Nowicka and Robinson144 | https://bioconductor.org/packages/release/bioc/html/DRIMSeq.html |
| ONT-Splice (v.1.0.0) | This paper | https://doi.org/10.5281/zenodo.8084364;https://github.com/landau-lab/ONT-sc-splice |
Experimental model and subject details
Human subjects
The study was approved by the local ethics committee and by the Institutional Review Board (IRB) of Weill Cornell Medicine, University of Manchester, and Dana Farber Cancer Institute, conducted in accordance with the Declaration of Helsinki protocol. Cryopreserved mononuclear cells isolated from bone marrow biopsies from myelodysplastic syndrome patients with SF3B1 mutations were retrieved from Memorial Sloan Kettering and University of Manchester. Additionally, cryopreserved G-CSF mobilized stem cell grafts (without additional mobilizing agents such as plerixafor or cyclophosphamide) from CH patients with SF3B1 mutations were retrieved from the Dana Farber Cancer Institute and the Weizmann Institute of Science (Table S1). To confirm the absence of additional genetic mutations, CH samples were sequenced using a previously described panel135 that includes myeloma driver mutations as well as CH-specific mutations. All samples underwent ultra-low pass whole genome sequencing, rejecting the presence of tumor contamination. Cryopreserved mononuclear cells and grafts were thawed and stained using standard procedures. Cells were first incubated with Human FcX blocking solution (Biolegend, #422302) and then incubated with the surface antibody CD34-PE-Vio770 (clone AC136, lot #5180718070, dilution 1:50, Miltenyi Biotec) and DAPI (Sigma-Aldrich) for 10 minutes at 4°C. Cells were then sorted for DAPI-negative, CD34+ cells using BD Influx at the Weill Cornell Medicine flow cytometry core.
Cell lines and tissue culture
TF-1 human erythroleukemia cell line was purchased from ATCC. All TF-1 generated cell lines were maintained in RPMI + 10% FCS or RPMI + tetracycline-free FCS (TaKaRa #631106) with 2ng/mL recombinant human GM-CSF (R&D Systems; 215-GM) unless otherwise noted. All cell lines were cultured at 37°C and 5% CO2 in the presence of penicillin (100 U/mL) and streptomycin (100 μg/mL). All cell lines were Mycoplasma-free and routinely tested by Antibody and Bioresource Core at MSKCC (MycoAlert Mycoplasma Detection Kit, Lonza, LT07–701; MycoAlert Assay Control Set, Lonza, LT07–518).
Generation of cell lines, virus packaging, and transduction
TF-1 Cas9 stably expressing cells were generated utilizing a lentiviral expression vector from Addgene (#108100) after puromycin mammalian antibiotic selection marker was exchanged for blasticidin. 3 sgRNAs targeting human BAX and 3 sgRNAs targeting human BAK1 were cloned into a dsRED lentiviral expression vector (Addgene #128055) or neomycin lentiviral expression vector (#139449), respectively. Each sgRNA was tested individually and in combination to identify TF-1 Cas9 cells with the best knockout of human BAX and BAK1. TF-1 Cas9 BAX and BAK DKO cells were generated by transducing TF-1 Cas9 cells with dsRED lentiviral expression vector with sgRNA CGAGTGTCTCAAGCGCATCG targeting human BAX and neomycin lentiviral expression vector with sgRNA CATGAAGTCGACCACGAAGC targeting human BAK1. Cells were selected by flow sorting for dsRED or by mammalian antibiotic selection with neomycin (2mg/mL). 3xFLAG tagged BAX isoforms alpha (NM_138761.4) beta (NM_004324.4) and omega (also known as transcript 1, NM_001291428.2), were cloned into a tetracycline inducible lentiviral expression vector (Addgene #162823) and selected with puromycin (10μg/mL). For cloning, vectors were PCR amplified and inserts were generated by gBlock (IDT) followed by Gibson Assembly. Lentiviral supernatants were produced by transfecting HEK293T cells with lentiviral constructs and packaging plasmids pVSVG and psPAX2 using PEI. Virus supernatants were collected and used for transduction in the presence of polybrene (4μg/mL).
Cytokine depletion assay
TF-1 Cas9 DKO BAX isoform cells were washed twice with RPMI 10% FCS without GM-CSF. Cells were then plated in triplicate in a 24 well plate in the presence or absence of doxycycline (1ug/ml). Cells were stained with annexin V (BioLegend 640920)/DAPI (Sigma Aldrich D9542) and assessed for apoptosis by flow cytometry.
Western blots
For western blot analysis, cells were lysed with RIPA buffer (Cell Signaling Technology) containing protease/phosphatase inhibitor cocktail (Sigma Aldrich). Protein concentration was measured using the BCA Protein Assay Kit (Pierce). Equivalent amounts of each sample were loaded on 4–12% Bis-Tris gels (Invitrogen), transferred to 0.2μm PVDF membrane, and blotted with Intercept Blocking Buffer (Li-Cor). The following antibodies were used for western blot analysis: BAX (Santa Cruz Biotechnology sc-7480), BAK1 (ThermoFisher, MA5-36225), GFP (Cell Signaling Technology, 2555S), GAPDH 1:5000 (Cell Signaling Technology 5174S), FLAG 1:100 (Sigma Aldrich, F1804). All primary antibodies were diluted to final concentration of 1:1,000 in Intercept Blocking Buffer (Li-Cor) unless otherwise noted.
Method details
GoT-Splice with CITE-seq
GoT-Splice with CITE-seq integrates Genotyping of Transcriptomes (GoT) with both long-read single-cell transcriptome profiling (with Oxford Nanopore Technologies [ONT]) and proteogenomics (with CITE-seq). GoT was performed as previously described15. For samples without CITE-seq, CD34+ cells were sorted, and RNA was prepared for sequencing following the standard 10x Genomics Chromium 3’ (v.3.1 chemistry) protocol and according to manufacturer’s recommendations for the generation of scRNA-seq libraries (Figure 1a). For GoT-Splice samples that were processed with CITE-seq, prior to sorting, cells were blocked with FcX block for 15 minutes prior to being stained with Total-SeqA antibodies for 30 minutes on ice (see Table S2 for list of antibodies used). The standard 10x Genomics Chromium 3’ (v.3.1 chemistry) and CITE-seq protocols35,36 were carried out according to manufacturer’s recommendations for the generation of scRNA-seq and ADT libraries (Figure 1a). At the cDNA amplification step in the 10x Genomics protocol, 1 μL of 1 μM spike-in primer (5’-GATCCTCGTCCTCATTGAACCGC-3’) was added to increase the yield of SF3B1 cDNA and 1 μL of 0.2 μM ADT PCR additive primer (5’ – CCTTGGCACCCGAGAATTCC – 3’) was added to amplify ADT. After cDNA amplification and a double-sided cleanup with SPRI beads to separate cDNA and ADT fractions, the ADT fraction was amplified for 10 cycles with SI-PCR oligo (10x Genomics) and TruSeq Small RNA RPI-x (Illumina) primers to index the samples. SPRI was used to clean up the ADT final products. In both samples in which CITE-seq was conducted and not conducted, cDNA was allocated for gene expression library creation (standard 10x protocol; 25% of cDNA), targeted genotyping (10% of cDNA), and ONT sequencing with biotin enrichment (10 ng of cDNA). Any remaining cDNA was stored. For locus-specific amplification (GoT), two serial PCRs were performed with nested reverse primers, based on the SF3B1 mutation of interest. For mutations upstream of K700E, (5’-GATCCTCGTGGTCATTGAACCGC-3’ and 5’-CACCCGAGAATTCCAGGCTACTATGATCTCTACCATGAGACCTG-3’) and, for K700E mutations, (5’-GTGCAAAAGCAAGAAGTCCT-3’ and 5’-CACCCGAGAATTCCATGAACATGGTCTTGTGGATGAG-3’) were used as reverse primers. These reverse primers and the generic forward SI-PCR amplify the site of interest from the cDNA template (10 PCR cycles each). The second locus-specific reverse primers contain a partial Illumina TruSeq Small RNA read 2 handle and a locus-specific region to allow SF3B1 specific priming. The SI-PCR oligo (10x Genomics) anneals to the partial Illumina TruSeq read 1 sequence, preserving the cell barcode (CB) and unique molecule identifier (UMI). After these rounds of amplification and SPRI purification to remove unincorporated primers, a third PCR was performed with a generic forward PCR primer (P5_generic, 5’ – AATGATACGGCGACCACCGAGATCTACAC – 3’) to retain the CB and UMI together with an RPI-x primer (Illumina) to complete the P7 end of the library and add a sample index (6 PCR cycles).Gene expression, ADT, and SF3B1 amplicon libraries were pooled to receive 25,000, 5,000, and 5,000 reads per cell, respectively, during Illumina sequencing. The cycle settings were as follows: 28 cycles for read 1, 90 cycles for read 2, 10 cycles for i7, and 10 cycles for i5 sample index. To examine splicing patterns broadly in the whole transcriptome, full-length cDNA was sequenced using the Oxford Nanopore Technologies sequencing on PromethION and GridION flow cells. To enrich for transcripts that contain CBs and UMIs and decrease the presence of PCR artifacts, on-bead PCR with a biotinylated primer selecting for an adapter upstream of the CB was completed67 (Figure 2a). In brief, 10 ng of full-length cDNA was amplified with LongAmp master mix (NEB) and TSO (5’-NNNAAGCAGTGGTATCAACGCAGAG-3’) and biotinylated read 1 (5’-/5Biosg/AAAAACTACACGACGCTCTTCCGATCT-3’) primers for 5 cycles. M270 streptavidin beads (ThermoFisher) were washed with 1X SSPE buffer, resuspended in 5X SSPE buffer and incubated with PCR amplicon after clean-up with 0.8X SPRI beads. After a 15-minute incubation, the beads were washed with 1X SSPE and 10 mM Tris-HCl (pH 8) resuspended in PCR master mix, and further amplified with LongAmp master mix, TSO and read 1 (5’ – NNNCTACACGACGCTCTTCCGATCT – 3’) primers for 5 cycles. After cleanup with SPRI, 100–300 ng of each full-length cDNA library was sequenced on one PromethION or GridION flow cell with SQK-LSK110.
GoT in U2AF1 was performed with a similar protocol to the described above, targeting the U2AF1 S34F mutation using a cDNA spiked primer to enrich for the transcript (5’ - GCCTCCATCTTCGGCACCGAGA - 3’) and 2 PRC rounds (PCR0 - Forward: 5’-GCCTCCATCTTCGGCACCGAGA-3’ PCR0 – Reverse: 5’- CTACACGACGCTCTTCCGATCT -3’ and PCR1 - Forward: 5’-CACCCGAGAATTCCAGCATGTCGTCATGGAGACAGGTGC-3’ PCR1 - Reverse: 5’-AATGATACGGCGACCACCGAGATCTACACTCTTTCCCTACACGACGCTC -3’) with the same specifications as SF3B1. The full-length GoT library was sequenced on a MinION flow cell with SQK-LSK114.
ScRNA-seq Illumina data processing, alignment, clustering, and cell-type classification
10x Illumina data were processed using Cell Ranger (v.3.1.0) with default parameters and reads were aligned to the human reference sequence GRCh38. For all samples, the Seurat package (v.3.1) was used to perform QC filtering, and unbiased clustering of CD34+ sorted cells136. As an overview, for each sample dataset, cells with number of UMIs (nCount_RNA) <1,000 or nCount_RNA > 3 s.d. above the mean nCount_RNA value, number of unique genes (nFeature_RNA) > 3 s.d. above the mean nFeature_RNA value and mitochondrial gene percentage (perc.mito) > 20% were filtered. Using the SCTransform function, each dataset was log normalized using the default scale factor of 10,000, scaled and potential confounders (such as nCount_RNA, perc.mito and S phase and G2M phase gene expression scores) were regressed out of the data. SCTransform also identified the top 3,000 variable genes found in each dataset that are used for integration. Before clustering, the individual datasets were integrated based on disease status (i.e. primary MDS samples, MDS01-03, were integrated together, MDS validation samples, MDS04-06, from patient treated with growth factors at the time of biopsy were integrated together and then the CH samples, CH01-02, were integrated together) and underwent batch correction within Seurat which implements canonical correlation analysis (CCA) and the principles of mutual nearest neighbors (MMN)137. For integration, 30 canonical vectors were used for the CCA in the FindIntegrationAnchors function, and 30 principal components were used for the anchor weightings step in the IntegrateData function (as recommended in Seurat). Next, a principal component analysis (PCA) was performed using the variable genes of the integrated dataset and the JackStraw method was used to determine statistically significant principal components (PCs) to be used as inputs into the UMAP algorithm for cluster visualization. Clustering was performed with the FindNeighbors (using only significant PCs) and the FindClusters (resolution = 2) functions which rely on the k-nearest neighbors (KNN) algorithm to identify cell clusters. Unique clusters were manually assigned based on differentially expressed genes identified with the FindAllMarkers function which looked only at genes found in at least 25% of cells in either of the two input comparison groups and only returned results for genes with at least a 0.25 log transformed fold change between groups. More specifically, cluster annotations were made according to the differential expression of canonical lineage marker genes identified in previous single-cell RNA-seq data of normal hematopoietic progenitor cells37 (Table S1). Clusters with similar increased expression of these canonical markers were merged to form the main progenitor subsets: HSPCs, IMPs, NPs, MkPs, MEP, EPs, Pre-Bs and E/B/Ms in the primary MDS, MDS validation and CH cohort as well as Mono, MonoDCs, DCs, B cells and T cells in MDS and MDS validation. Finally, pseudotime analysis was performed using the Monocle3 R package with recommended parameters (v.0.2.1)138.
IronThrone GoT for processing targeted amplicon sequences and performing mutation calling
Genotyping of single cells was carried out with the IronThrone (v.2.1) pipeline as previously described15,134. In brief, individual amplicon reads were assessed for the appropriate structure (i.e., presence of the primer sequence and the expected sequence between the primer and given mutation site) and all reads were assessed for a matching cell barcode to the list generated from the 10x paired GEX dataset. A Levenshtein distance of 0.1 was allowed for all sequence matching and collapsing steps and only UMIs with a minimum of 2 supporting reads were retained for final genotyping. Following UMI collapse, genotype assignment of individual UMIs was conducted as described previously with majority rule of supporting reads for wildtype or mutant status (using a 0.7 PCR read ratio, above which the majority of PCR reads must be for a UMI to be called definitively). Rare UMIs that did not pass this threshold were removed as ambiguous. Additionally, to remove reads that result from PCR recombination, UMIs in the amplicon library that match UMIs of non-SF3B1 genes in the gene expression library were discarded (as described in the IronThrone GoT pipeline)15,134. Finally, given the heterozygous nature of these SF3B1 mutations, each single cell was assigned as either mutant (MUT) or wildtype (WT) as follows: cells with at least 1 mutant UMI were assigned as MUT cells and cells with 0 mutant UMIs and at least 1 wildtype UMI were assigned as WT. As benchmarking, the SF3B1 genomic regions of interest that were used for GoT were examined in each matching GEX library to determine how many UMIs were able to successfully capture the targeted sequence in conventional 10x data and, in all cases, less UMIs were captured in the GEX library (Figure S2b, S6e). While the genotyping information is derived from transcribed molecules alone and may be affected by whether transcripts from wildtype versus mutant alleles were expressed and/or captured, the fraction of MUT cells as determined by GoT using all cells with at least 1 UMI yielded similar values to those determined by bulk DNA exon sequencing (Figure S2a). Despite this, we systematically applied specific approaches to exclude the effect of this confounder (that is, the expression level of the target gene) on the conclusions of other downstream analyses. First, to rule out the possibility that higher SF3B1 expression results in a greater ability to detect mutant alleles, and thereby in a higher mutant-cell frequency, we downsampled all cells to a single amplicon UMI before mutation calling when conducting the mutant-cell frequency analyses. Then, for the remaining of our downstream analyses between SF3B1 mutant and wildtype cells (except for the differential gene expression and gene set enrichment analyses in CH due to low fraction of mutated cells, which decreases the likelihood of misclassifying mutant as wildtype), we took the more conservative approach considering only genotyped cells with two or more genotyping amplicon UMIs.
Mutant cell frequency
The frequency of mutant cells, as determined by GoT, was assessed as previously performed in Nam et al.134. Firstly, we used only cells with at least 1 UMI and only considered cell types with at least 300 genotyped cells. To account for the potential confounding effect of a heterozygous mutation as well as variable SF3B1 expression, we performed amplicon UMI down-sampling to 1 UMI per genotyped cell prior to mutation calling for calculating MUT cell frequencies. An equal number of cells from each sample within the MDS cohort, were subsampled randomly for the integrated data to ensure equal representation from each patient. Genotyping amplicon UMIs were downsampled (x100 iterations) to 1 UMI per cell and MUT cell frequency was determined for each progenitor cluster for either the integrated dataset or individual samples. This frequency was then divided by the total mutant cell frequency across all progenitor subsets for each of the iterations. Linear mixed effects analysis was performed using the lme4 package (v.1.2–1). Progenitor identity was defined as the fixed effect, and for random effects, we used intercepts for individual patients (subjects) and iterative downsampling. P-values were obtained by likelihood ratio tests of the full model with the fixed effect against the model without the fixed effect139.
Differential gene expression and gene set enrichment
The differential gene expression analysis (DGEA) comparing WT and MUT cells and gene set enrichment analysis (GSEA) were performed as done in Nam et al.134. In brief, for each cohort we used a within-sample permutation test for the analysis of each progenitor cell subtype. To ensure equal representation from each patient, we downsampled the total number of mutated and wildtype cells to the same number across all patients. The observed log2 fold change values were calculated comparing the MUT versus WT cells for the tested genes. The tested genes included the top 2,000 most variable genes (excluding mitochondrial genes) which were filtered for those expressed in at least 10% of either group (MUT versus WT), for each progenitor subtype. Next, the WT and MUT labels were shuffled over 100,000 iterations, within each patient, and fold change values were re-calculated to create a background distribution. P-values were calculated per gene as a percent of permutations whose absolute fold change values were more extreme than the absolute value of the observed fold change (Table S3, 5). Hypergeometric test for GSEA of the integrated differentially expressed genes (P-value < 0.05, log2(fold change) > 0.1) was performed using the Cluster Profile package (v.0.1.9). FDR multiple hypothesis testing correction was performed. MSigDB C2 curated gene sets were included in the analyses (Table S3, 5).
ADT processing
CITE-seq was performed on the primary MDS cohort (for samples MDS02-03) and as mentioned above, the 10x Illumina ADT data was processed using Cell Ranger (v.3.1.0) with default parameters and counts were generated for each marker in the CITE-seq panel (Table S2). After using the Seurat package (v.3.1) for QC filtering, and unbiased clustering of the CD34+ sorted cells based on RNA data, ADT data was also normalized using centered log-ratio (CLR) normalization, scaled and the expression of various ADT markers was used in confirming the cell-type assignment of different progenitor subsets. For benchmarking purposes, Seurat’s Weighted Nearest Neighbor (WNN) Analysis was also performed, which is a multi-modal analysis that integrates both RNA and ADT data when performing cell clustering. This was used to compare to the clustering output when using the KNN algorithm that relies on RNA data alone (Figure S1h). For the WNN analysis, cells were filtered and integrated using SCTransform (as described above). The RNA data was logNormalized and the ADT data was run through CLR normalization and the RunPCA function for dimensionality reduction was also run independently on each modality. Next, the FindMultiModalNeighbors function was used which for each cell, calculates its closest neighbors in the dataset based on a weighted combination of RNA and ADT similarities. This constructs a WNN graph that was visualized with the RunUMAP function. The cell-type assignments generated from the initial clustering (with RNA data alone) were then projected onto this new UMAP for comparison (Figure S1h).
Denoised scaled by background normalization (DSB) filtering and differential protein expression
We used the dsb package140 (v.0.1.0) as an alternative form of normalization for the ADT protein expression values. Normalized values were applied for selection filtering of ADT markers for which the true signal was above the background noise levels, within the captured cell-contained droplets. dsb discriminates between background noise by differentiating between empty droplets (containing ambient mRNA and antibody but no cell) and true cell-containing droplets. The background matrix was defined from the comparison of the raw feature barcode matrices from the 10x sequencing output versus the processed filtered feature barcode matrix results generated from running Cell Ranger (see Methods above). The final output filters out empty droplets and retains only true cell-containing droplets based on the 10x cell calling algorithm. As such, the matrix of background noise is generated by subtracting out the positive cell containing droplets found in the filtered matrices from the negative empty droplets in the raw matrices. Furthermore, with an additional filter requiring the removal of drops with protein library size > 1.5 and number of genes < 80 was applied to refine the background noise signal. Normalization was performed using the DSBNormalizeProtein function omitting isotype controls and denoised counts. The dsb normalized values were defined as the number of standard deviations above the background noise and antibodies were then filtered, keeping only those with a dsb normalized expression value of > 2 in at least 1 cell-type (Table S2). When performing the differential protein expression analysis across our patient samples, we used an iterative downsampling (x1,000) approach that, at each iteration, randomly samples an equal number of SF3B1mut and SF3B1wt cells from each patient sample before calculating the median log10FC of protein expression between SF3B1mut / SF3B1wt cells. This was done to ensure equal representation of genotyped cells from each patient. To calculate the median log10FC of SF3B1mut / SF3B1wt cells, we first modified the Seurat’s FindMarker function to calculate the median instead of the mean expression, a measure that is more robust to outlier values. Then, for each downsampled object we obtained a table containing the log10FC of each antibody per cell-type. log10FC matrices are combined by taking the median across the downsampled iterations, resulting in the median log10FC values. Statistical significance was assessed by performing permutation tests (x10,000) within each patient sample matrix. (Figure 1f) shows normalized ADT expression across cell-types, using the maximum expression.
ScRNA-seq ONT long-read sequencing data processing, alignment, junction calling and annotation
Guppy (v.3.0.6 – 4.0.11) was used for base calling FAST5 files output from ONT sequencing. We then filtered for only reads containing a polyA tail within 100 base pairs of either 5’ or 3’ end using the ǸanoporeReadScanner-0.5.jar` within the SiCeLoRe-1.0 workflow. Due to the low number of genotyped cells (139) with two or more genotyping amplicon UMIs, MDS01 was excluded from all downstream splicing analyses. Filtered reads are aligned to the primary human genome, assembly GRCh38.p12 using minimap2 (v.2.17). Minimap2 was used with the `-ax splicè flag to prioritize annotated splice junctions. Additionally, we made use of the `--junc-bed` option, to increase alignment scores for those splice junctions found in the reference junction bed file. For our reference junctions, we used splice junctions from single-cell SMART-seq2 data from human CD34+ cells obtained from a CH sample with no SF3B1 mutation. Additionally, we used `--secondary=nò to suppress multi-mappings. In preparation to identify the cell barcodes and UMIs present in the long-read sequencing, we used the ÌlluminaParser-1.0.jar` in SiCeLoRe to parse the cell barcodes and UMIs present in the complementary short-read sequencing library. We continued to use SiCeLoRe to tag the aligned BAM files with cell barcodes and UMIs identified in the short-read library and generate consensus sequences for each unique cell barcode and UMI combination. Consensus sequences were used to create a gene by cell count matrix. For all other steps, we used the default parameters set by SiCeLoRe-1.0, following the workflow found at https://github.com/ucagenomix/sicelore. Intron-junction calling is then performed on consensus sequence BAM files, adapted from the method used in the LeafCutter pipeline for short-read RNA-seq data72,141. In brief, the intron-junction calling pipeline utilizes the pysam.fetch() function and iterates through each transcript in the BAM file, noting its cell barcode (CB) tag as well as the coordinates of each intron-junction for that transcript. On iterating through the BAM file, counts for the usage of each unique intron-junction and the corresponding CB are recorded. This ultimately generates an Intron-Junction x Cell Barcode count matrix for the given BAM file. Each intron-junction is then identified using annotations available in the GENCODE GRCh38.p12 v31 basic annotation reference file as canonical 3’, canonical 5’, alternative 3’, alternative 5’. This outputs a metadata file with annotations for each junction corresponding to the junctions of the Intron-Junction x Cell Barcode count matrix. The metadata included the 3’ and 5’ sites defining each junction, the distance from the canonical 3’ or 5’ site end for each start and end site, and the classification of each site. Additionally, junctions that share the same 3’ or 5’ splice site are classified into “junction clusters”, providing a cluster coverage which is used in subsequent analyses, such as for calculating the percent spliced in values of different splicing events. Alternative 3’ and 5’ junctions were further broken down into alternative and cryptic based on the distance the junction was from the canonical splice site. If the alternative splice site was within 100 base pairs of the canonical splice site, it was classified as a cryptic splice site. Given the intron-centric approach of the pipeline, each event could be classified as either annotated, alternative 3’, alternative 5’, a cryptic 3’ splice site, a cryptic 5’ splice site or an exon-skipping event (see Methods below for exon-skipping annotation; Table S4, 6).
Junction calling and annotation of short-read sequencing data and comparison to long-read sequencing
Using SAMtools (v.1.9, the post-aligned short-read sequencing BAM file (see Methods above) was filtered to include only reads from the filtered cell barcodes (CB) selected through Cell Ranger, to remove all non-primary alignments and reads mapping to multiple genes. Next, using umi-tools (v.1.1.2) we ran umi-tools group with the `–per-cell flag`, cell barcode and UMI pairs with only one supporting read were filtered out and umi-tools dedup was used to remove all duplicate reads. Intron junction calling and annotation was performed as described above. To compare the junction recovery across the transcript region, we used the Ensembl annotation database (v.104) to generate a transcript reference and filtered the database to include only protein coding transcripts as well as those with a transcript support level = 1 (i.e., those representing the most well supported transcript for that gene). From here, we calculated the distance of a junction from the end of its transcript by calculating the distance between the 3’ end of that junction to the furthermost 3’ junction end (which is at the 3’ end of the transcript). This was done to avoid any measurement biases due to long UTR annotations.
Copy number variation analysis
The InferCNV package (v.1.4.0)142 was used to analyze the single cell dataset for any duplications or deletions of entire chromosomes or large chromosome fragments. Briefly, by comparing expression levels of genes annotated by chromosomal position (using the CONICSmat package v.0.0.0.1143) to a set of reference cells (in this case, a one-versus-rest comparison of cells by patient of origin), a heatmap of relative expression can be generated and used to identify regions with significantly increased or decreased expression. We removed the few genes for which alternative positions have been reported (<2% of genes). We ran the InferCNV workflow with recommended parameters, using the i6 6-state Hidden Markov model (Figure S6f).
Differential transcript usage
All alternative 3’ junctions were filtered to only include those that contained at least 5 total reads. To identify differentially used transcripts between SF3B1mut and SF3B1wt cells, junction reads were then pseudobulked based on mutation status across all MDS patients or all CH patients. We then computed the log10(odds ratio) of the likelihood of each junction being observed in the MUT cells over the WT cells. The genotype labels of each of the cells was permuted 100,000 times and we then repeated pseudobulking and computation of the log(odds ratio) of each junction. Permutations of the genotype label were patient aware, so the mutant cell frequency across patients was unchanged for each permutation. The P-value was determined based on the likelihood of seeing the observed odds ratio in comparison to the null distribution of the permuted odds ratios for each junction. The same testing was done within each cell-type to identify the differentially used junctions between SF3B1mut and SF3B1wt cells within a specific cell-type. We classified junctions as differentially spliced events if they had P-value < 0.05 and delta percent spliced in (dPSI) of >= 2 (a positive dPSI here represents a splicing event more highly used in the SF3B1mut population of cells). To observe the usage of these differentially spliced cryptic 3’ events (P-value < 0.05 and dPSI >= 2) across the continuum of erythroid maturation as opposed to within discrete cellular states, erythroid lineage MUT cells (HSPCs, IMPs, MEPs, and EPs) were ordered from least to most differentiated, grouped into bins and the MUT cell PSI for each cryptic event was calculated per bin (Figure 4a, 6d). Specifically, in the primary MDS cohort (Figure 4a), 6301 SF3B1mut cells were ordered by the expression of the erythroid marker CD71 (obtained from CITE-seq) and a bin size of 3000 SF3B1mut cells, sliding by 300 SF3B1mut cells at each step, was used to capture the continuous change in the usage of the different cryptic 3’ junctions via the MUT cell PSI measurements per bin. The variance in the usage of each cryptic 3’ event was measured by calculating the range of PSIs across all the bins along the continuum and only cryptic junctions that had a PSI range of at least 2 and average coverage across all bins of 10 reads were considered. This approach was taken to focus on cryptic events that had a variable signal and that were also well supported. In CH (Figure 6d), 1,020 MUT cells were ordered by pseudotime and a bin size of 600 SF3B1mut cells, sliding by 60 SF3B1mut cells at each step, was used to capture the MUT cell PSI per bin. Similarly, only cryptic junctions that had a PSI range of at least 2 and average coverage of 10 reads were considered.
For the BAX cryptic event (Figure 6e), to directly compare the per bin PSI values across all 3 cohorts (MDS, MDS validation and CH) we adjusted the bin and window sizes across the cohorts to ensure the same number of final bins for each cohort. To achieve this, we took the following approach: MDS - MUT cells ordered by CD71 expression, window size of 3750 SF3B1mut cells, sliding by 375 SF3B1mut cells, MDS validation: cells ordered by pseudotime, window size of 580 SF3B1mut cells, sliding by 58 SF3B1mut cells, CH: cells ordered by pseudotime, window size of 600 SF3B1mut cells, sliding by 60 SF3B1mut cells. To note, for each of the sliding window analyses, only MUT cells with at least 2 genotyping amplicon UMIs were considered.
Exon skipping and nonsense-mediated decay (NMD) annotations
To identify exon skipping events, for each gene in the GENCODE GRCh38.p12 v31 basic annotation reference file we determined its main functional isoform (as those that belong to the APPRIS database and carry the “appris_princial” tags) to compare to the transcript isoforms generated in our data. With this, for a given gene, each identified intron junction within our data was compared to the reference and labeled as an “exon_skip” if it excluded any of the exons present in the reference. The number of exons skipped was also recorded. To identify NMD inducing alternative splicing events, we also developed a pipeline that inspects each intron junction in the Intron-Junction x Cell Barcode count matrix and detects the presence of premature termination codons (PTCs) and frameshift events induced because of alternative splicing. In brief, this is done by grabbing the entire nucleotide sequence of a particular isoform noting the position of the last exon-exon junction, finding the position of the first start codon and from there, phasing along the triplets of nucleotides of that given sequence string. By following the known rules of NMD, each intron junction was further annotated as being (i) NMD-inducing (which would lead to NMD of its associated transcript) or (ii) NMD-neutral. Specifically, the 50-nucleotide rule was followed such that an event is labeled NMD-inducing if a PTC is introduced greater than 50 nucleotides away from the last exon-exon junction or NMD-neutral if a PTC is introduced within 50 nucleotides of the transcript’s last exon-exon junction. Finally, Intron-junctions were labeled to cause frameshifts if the total number of nucleotides involved in an alternative 3’ or 5’ splicing event was not divisible by 3.
Motif enrichment analysis
High quality cryptic 3’ junctions (MUT read coverage > 3, PSI >= 2, junction cluster read coverage > 20 across at least 2 junction clusters) were obtained from the junction quantification matrix from samples MDS05-06. Each of these cryptic 3’ splice sites were then paired to a corresponding canonical junction, requiring both, canonical and cryptic junctions, to be part of the same splicing cluster (as described above). Flanking sequences, 50 nucleotides upstream and 10 nucleotides downstream of the 3’ splice site were obtained from the two junction sets and used to calculate position weight matrices (PWM). For each position, a log odds ratio enrichment for each nucleotide was calculated using Fisher’s exact test, comparing the cryptic 3’ splice site nucleotide composition against the canonical. Reported positions were filtered according to their enrichment significance (P-value < 0.05).
Isoform tool comparison
Given that full-length isoform tools provide transcript-level descriptions rather than local events like GoT-Splice (e.g., exon skipping or cryptic splice sites), the comparison to FLAMES68 and IsoQuant76 was performed at the local level, overlapping junctions responsible to define the local splicing changes. For this analysis, samples of the discovery cohort (MDS02-03) were used. First, FASTQ files were processed in the FLAMES (v.1.3.4) multi-sample scRNA-seq pipeline with standard parameters and using the same genome references than in GoT-Splice (described above). In parallel, collapsed BAM files resulting from the SiCeLoRe pipeline (see description above), were used as input for IsoQuant (v.3.1.1) in two steps: first all samples were run together, using the ǹanoporè data type input, generating an unified isoform annotation (in GTF format) and subsequently, each sample was processed individually to generate isoform per cell barcode matrices, using the previously created GTF as reference, which includes new isoforms detected across all the samples. To extract the junction annotations and assess quality of the recovered transcript annotations, SQANTI3144 (v.5.1.1) QC script was applied, with default parameters, to the GTF isoform annotations produced by FLAMES and IsoQuant. Local splicing events (cryptic splice sites and exon skipping) in the filtered SQANTI3 GTF annotations were then produced with the SUPPA2145 (v.2.3) `generateEvents` option. PSI values were estimated following a similar approach to the one described in SUPPA2, briefly, PSI values reflect a ratio between the read counts corresponding to isoforms that include a particular event divided by the total isoforms over a particular region (isoforms that do not include the event + isoforms including the events). To identify MUT versus WT isoform proportion changes we merged the sample transcript per cell count matrices obtained in FLAMES or IsoQuant and using DRIMSeq146 (v.1.22.0) we filtered for a minimal gene expression of 5, minimal transcript expression of 2 and gene expressed in a minimum of 2 cells and performed a likelihood ratio test (via the dmTest function). Isoforms with FDR adjusted P-value < 0.05 and change in proportion > 0.25 were considered as significantly changed. Estimation of a splicing aberration bias in the significantly changed isoforms was determined by overlapping the isoforms with cryptic and alternative 3’ ss annotated with GoT-Splice.
Quantification and statistical analysis
Categorical variables were compared using the hypergeometric test or Fisher’s Exact test. Continuous variables were compared using the Mann-Whitney U test, Student’s t-test, non-parametric permutation test or Kolmogorov–Smirnov test, as appropriate. P-values were adjusted for multiple comparisons by Benjamini-Hochberg FDR adjustment procedure. All P-values are two-sided and considered significant at the 0.05 level unless otherwise noted. To add further stringency and confidence to the results, we have independently analyzed a distinct cohort of samples (validation cohort) and specifically focused on reporting results that passed a statistical cutoff of 0.2 for FDR adjusted P-values in both cohorts. We report genes with FDR adjusted P-value < 0.05 in either cohort in Table S4 and S6.
Supplementary Material
Highlights.
GoT-Splice profiles single-cell genotype, expression, surface markers, and splicing.
SF3B1mut cells show lineage skewing and stage-specific mis-splicing in MDS.
SF3B1mut-specific isoform Bax-ω may provide MDS anti-apoptotic advantage.
In CH, SF3B1mut cells display erythroid lineage bias and mirror MDS mis-splicing.
Acknowledgments
The work was enabled by the Weill Cornell Flow Cytometry Core. R.F.S. is supported by an American Society of Hematology Research Training Award for Fellows. N.D. is supported by a F30 Predoctoral Fellowship from the NHLBI of the National Institutes of Health (F30HL156496) and by a Medical Scientist Training Program grant from the National Institute of General Medical Sciences of the National Institutes of Health under award number T32GM007739 to the Weill Cornell/Rockefeller/Sloan Kettering Tri-Institutional MD-PhD Program. R.C. is supported by Lymphoma Research Foundation and Marie Skłodowska-Curie fellowships. D.A.K. is supported by NSF CAREER award DBI2146398. D.H.W. is supported by the Oglesby Charitable Trust. O.A.-W. is supported by a Break Through Cancer award. F.G. is supported by an American Society of Hematology Scholar Award (200264–02), Princess Margaret Cancer Foundation, and J. P. Bickell Foundation. D.A.L. is supported by the Burroughs Wellcome Fund Career Award for Medical Scientists, Valle Scholar Award, Leukemia Lymphoma Scholar Award, and the Mark Foundation Emerging Leader Award. This work was supported by the National Heart Lung and Blood Institute (R01HL157387-01A1 and R01HL128239), the National Cancer Institute (R01s CA242020, R01 CA251138, P50 254838 and R33 CA267219), the Edward P. Evans MDS Foundation, a Tri-Institutional Stem Cell Initiative award and the National Human Genome Research Institute, Center of Excellence in Genomic Science (RM1HG011014). This work received research support from Oxford Nanopore Technologies.
Declaration of interests
F.G. serves as a consultant for S2 Genomics Inc. X.D., J.B., A.W.D., S.H., S.J., E.H. are employees of Oxford Nanopore Technologies Inc and are shareholders and/or share option holders. I.M.G. serves on the advisory or consulting board of Bristol Myers Squibb, Takeda, Janssen, Sanofi, Novartis, Amgen, Celgene, Cellectar, Pfizer, Menarini Silicon Biosystems, Oncopeptides, The Binding Site, GlazoSmithKlein, AbbVie, Adaptive, and 10x Genomics. O.A.-W. has served as a consultant for H3B Biomedicine, Foundation Medicine Inc, Merck, Pfizer, and Janssen, and is on the Scientific Advisory Board of Envisagenics Inc and AIChemy; O.A.-W. has received prior research funding from H3B Biomedicine and LOXO Oncology unrelated to the current manuscript. D.A.L. has served as a consultant for Abbvie, AstraZeneca and Illumina, and is on the Scientific Advisory Board of Mission Bio, Pangea, Alethiomics, and C2i Genomics; D.A.L. has received prior research funding from BMS, 10x Genomics, Ultima Genomics, and Illumina unrelated to the current manuscript.
Inclusion and diversity
We support inclusive, diverse, and equitable conduct of research. One or more of the authors of this paper self-identifies as an underrepresented ethnic minority in their field of research or within their geographical location. One or more of the authors of this paper self-identifies as a member of the LGBTQIA+ community. One or more of the authors of this paper self-identifies as living with a disability. One or more of the authors of this paper received support from a program designed to increase minority representation in their field of research.
Footnotes
Publisher's Disclaimer: This is a PDF file of an article that has undergone enhancements after acceptance, such as the addition of a cover page and metadata, and formatting for readability, but it is not yet the definitive version of record. This version will undergo additional copyediting, typesetting and review before it is published in its final form, but we are providing this version to give early visibility of the article. Please note that, during the production process, errors may be discovered which could affect the content, and all legal disclaimers that apply to the journal pertain.
Table S1. Cohorts and gene sets, related to Figure 1 and STAR Methods.
Summary of MDS and CH samples clinical history and mutational status, previously published gene sets/modules used for gene signatures of hematopoietic differentiation, and list of oligonucleotides used in this study.
Table S2. Antibodies and protein expression, related to Figure 1.
Panel of Total-SeqA antibodies used in performing CITE-seq on the primary MDS cohort (MDS01-03), and differential protein expression analysis in the primary MDS cohort between mutant and wildtype cells in each CD34+ hematopoietic progenitor cell subtypes, performed via permutation testing.
Table S3. MDS differential gene expression analysis, related to Figure 1.
Differential gene expression (DGE) analysis in the primary MDS cohort (MDS01–03) for EPs, and gene set enrichment analysis (GSEA) of differentially expressed genes in MDS SF3B1mut EPs, followed by FDR P-value correction, performed against the Reactome collection gene sets to test for the overrepresentation of these gene sets in the differentially up-regulated genes.
Table S4. Analysis of differential splicing events, related to Figure 3.
Comparison of MDS vs. CLL alternative splicing events, Differential splice junction usage in the primary MDS cohort between all mutant and wildtype cells and within each CD34+ hematopoietic progenitor cell subtype, performed via permutation testing, with nonsense-mediated decay and frameshift annotations; differential splice junction usage in the MDS validation cohort (MDS04-06) between all mutant and wildtype cells and within each CD34+ hematopoietic progenitor cell subtype, performed via permutation testing, with nonsense-mediated decay and frameshift annotations.
Table S5. CH differential gene expression analysis, related to Figure 5.
DGE analysis in the CH cohort (CH01-02) for HSPCs, and GSEA of differentially expressed genes in CH SF3B1mut HSPCs, followed by FDR P-value correction, performed against the Reactome collection gene sets to test for the overrepresentation of these gene sets in the differentially up-regulated genes.
Table S6. Differential splice junction usage in CH, related to Figure 6.
Differential splice junction usage in CH (CH01-02) between all mutant and wildtype cells and within each CD34+ hematopoietic progenitor cell subtype, performed via permutation testing, with nonsense-mediated decay and frameshift annotations.
REFERENCES
- 1.Abelson S, Collord G, Ng SWK, Weissbrod O, Mendelson Cohen N, Niemeyer E, Barda N, Zuzarte PC, Heisler L, Sundaravadanam Y, et al. (2018). Prediction of acute myeloid leukaemia risk in healthy individuals. Nature 559, 400–404. 10.1038/s41586-018-0317-6. [DOI] [PMC free article] [PubMed] [Google Scholar]
- 2.Desai P, Mencia-Trinchant N, Savenkov O, Simon MS, Cheang G, Lee S, Samuel M, Ritchie EK, Guzman ML, Ballman KV, et al. (2018). Somatic mutations precede acute myeloid leukemia years before diagnosis. Nat Med 24, 1015–1023. 10.1038/s41591-018-0081-z. [DOI] [PMC free article] [PubMed] [Google Scholar]
- 3.Teixeira VH, Pipinikas CP, Pennycuick A, Lee-Six H, Chandrasekharan D, Beane J, Morris TJ, Karpathakis A, Feber A, Breeze CE, et al. (2019). Deciphering the genomic, epigenomic, and transcriptomic landscapes of pre-invasive lung cancer lesions. Nat Med 25, 517–525. 10.1038/s41591-018-0323-0. [DOI] [PMC free article] [PubMed] [Google Scholar]
- 4.Watson CJ, Papula AL, Poon GYP, Wong WH, Young AL, Druley TE, Fisher DS, and Blundell JR (2020). The evolutionary dynamics and fitness landscape of clonal hematopoiesis. Science 367, 1449–1454. 10.1126/science.aay9333. [DOI] [PubMed] [Google Scholar]
- 5.Xie M, Lu C, Wang J, McLellan MD, Johnson KJ, Wendl MC, McMichael JF, Schmidt HK, Yellapantula V, Miller CA, et al. (2014). Age-related mutations associated with clonal hematopoietic expansion and malignancies. Nat Med 20, 1472–1478. 10.1038/nm.3733. [DOI] [PMC free article] [PubMed] [Google Scholar]
- 6.Genovese G, Kähler AK, Handsaker RE, Lindberg J, Rose SA, Bakhoum SF, Chambert K, Mick E, Neale BM, Fromer M, et al. (2014). Clonal Hematopoiesis and Blood-Cancer Risk Inferred from Blood DNA Sequence. New England Journal of Medicine 371, 2477–2487. 10.1056/NEJMoa1409405. [DOI] [PMC free article] [PubMed] [Google Scholar]
- 7.Jaiswal S, Fontanillas P, Flannick J, Manning A, Grauman PV, Mar BG, Lindsley RC, Mermel CH, Burtt N, Chavez A, et al. (2014). Age-Related Clonal Hematopoiesis Associated with Adverse Outcomes. New England Journal of Medicine 371, 2488–2498. 10.1056/NEJMoa1408617. [DOI] [PMC free article] [PubMed] [Google Scholar]
- 8.Shlush LI, Zandi S, Mitchell A, Chen WC, Brandwein JM, Gupta V, Kennedy JA, Schimmer AD, Schuh AC, Yee KW, et al. (2014). Identification of pre-leukaemic haematopoietic stem cells in acute leukaemia. Nature 506, 328–333. 10.1038/nature13038. [DOI] [PMC free article] [PubMed] [Google Scholar]
- 9.Mustjoki S, and Young NS (2021). Somatic Mutations in “Benign” Disease. New England Journal of Medicine 384, 2039–2052. 10.1056/NEJMra2101920. [DOI] [PubMed] [Google Scholar]
- 10.Martincorena I, Roshan A, Gerstung M, Ellis P, Loo PV, McLaren S, Wedge DC, Fullam A, Alexandrov LB, Tubio JM, et al. (2015). High burden and pervasive positive selection of somatic mutations in normal human skin. Science 348, 880–886. 10.1126/science.aaa6806. [DOI] [PMC free article] [PubMed] [Google Scholar]
- 11.Yokoyama A, Kakiuchi N, Yoshizato T, Nannya Y, Suzuki H, Takeuchi Y, Shiozawa Y, Sato Y, Aoki K, Kim SK, et al. (2019). Age-related remodelling of oesophageal epithelia by mutated cancer drivers. Nature 565, 312–317. 10.1038/s41586-018-0811-x. [DOI] [PubMed] [Google Scholar]
- 12.Yizhak K, Aguet F, Kim J, Hess JM, Kübler K, Grimsby J, Frazer R, Zhang H, Haradhvala NJ, Rosebrock D, et al. (2019). RNA sequence analysis reveals macroscopic somatic clonal expansion across normal tissues. Science 364. 10.1126/science.aaw0726. [DOI] [PMC free article] [PubMed] [Google Scholar]
- 13.Martincorena I, Fowler JC, Wabik A, Lawson ARJ, Abascal F, Hall MWJ, Cagan A, Murai K, Mahbubani K, Stratton MR, et al. (2018). Somatic mutant clones colonize the human esophagus with age. Science 362, 911–917. 10.1126/science.aau3879. [DOI] [PMC free article] [PubMed] [Google Scholar]
- 14.Tirosh I, Izar B, Prakadan SM, Wadsworth MH, Treacy D, Trombetta JJ, Rotem A, Rodman C, Lian C, Murphy G, et al. (2016). Dissecting the multicellular ecosystem of metastatic melanoma by single-cell RNA-seq. Science 352, 189–196. 10.1126/science.aad0501. [DOI] [PMC free article] [PubMed] [Google Scholar]
- 15.Nam AS, Kim K-T, Chaligne R, Izzo F, Ang C, Taylor J, Myers RM, Abu-Zeinah G, Brand R, Omans ND, et al. (2019). Somatic mutations and cell identity linked by Genotyping of Transcriptomes. Nature 571, 355–360. 10.1038/s41586-019-1367-0. [DOI] [PMC free article] [PubMed] [Google Scholar]
- 16.Chaligne R, Gaiti F, Silverbush D, Schiffman JS, Weisman HR, Kluegel L, Gritsch S, Deochand SD, Gonzalez Castro LN, Richman AR, et al. (2021). Epigenetic encoding, heritability and plasticity of glioma transcriptional cell states. Nat Genet 53, 1469–1479. 10.1038/s41588-021-00927-7. [DOI] [PMC free article] [PubMed] [Google Scholar]
- 17.Puram SV, Tirosh I, Parikh AS, Patel AP, Yizhak K, Gillespie S, Rodman C, Luo CL, Mroz EA, Emerick KS, et al. (2017). Single-Cell Transcriptomic Analysis of Primary and Metastatic Tumor Ecosystems in Head and Neck Cancer. Cell 171, 1611–1624.e24. 10.1016/j.cell.2017.10.044. [DOI] [PMC free article] [PubMed] [Google Scholar]
- 18.Baryawno N, Przybylski D, Kowalczyk MS, Kfoury Y, Severe N, Gustafsson K, Kokkaliaris KD, Mercier F, Tabaka M, Hofree M, et al. (2019). A Cellular Taxonomy of the Bone Marrow Stroma in Homeostasis and Leukemia. Cell 177, 1915–1932.e16. 10.1016/j.cell.2019.04.040. [DOI] [PMC free article] [PubMed] [Google Scholar]
- 19.Neftel C, Laffy J, Filbin MG, Hara T, Shore ME, Rahme GJ, Richman AR, Silverbush D, Shaw ML, Hebert CM, et al. (2019). An Integrative Model of Cellular States, Plasticity, and Genetics for Glioblastoma. Cell 178, 835849.e21. 10.1016/j.cell.2019.06.024. [DOI] [PMC free article] [PubMed] [Google Scholar]
- 20.Oren Y, Tsabar M, Cuoco MS, Amir-Zilberstein L, Cabanos HF, Hütter J-C, Hu B, Thakore PI, Tabaka M, Fulco CP, et al. (2021). Cycling cancer persister cells arise from lineages with distinct programs. Nature 596, 576–582. 10.1038/s41586-021-03796-6. [DOI] [PMC free article] [PubMed] [Google Scholar]
- 21.Nam AS, Chaligne R, and Landau DA (2021). Integrating genetic and non-genetic determinants of cancer evolution by single-cell multi-omics. Nat Rev Genet 22, 3–18. 10.1038/s41576-020-0265-5. [DOI] [PMC free article] [PubMed] [Google Scholar]
- 22.Rodriguez-Meira A, Buck G, Clark S-A, Povinelli BJ, Alcolea V, Louka E, McGowan S, Hamblin A, Sousos N, Barkas N, et al. (2019). Unravelling Intratumoral Heterogeneity through High-Sensitivity Single-Cell Mutational Analysis and Parallel RNA Sequencing. Molecular Cell 73, 1292–1305.e8. 10.1016/j.molcel.2019.01.009. [DOI] [PMC free article] [PubMed] [Google Scholar]
- 23.Gaiti F, Chaligne R, Gu H, Brand RM, Kothen-Hill S, Schulman RC, Grigorev K, Risso D, Kim K-T, Pastore A, et al. (2019). Epigenetic evolution and lineage histories of chronic lymphocytic leukaemia. Nature 569, 576–580. 10.1038/s41586-019-1198-z. [DOI] [PMC free article] [PubMed] [Google Scholar]
- 24.Haferlach T, Nagata Y, Grossmann V, Okuno Y, Bacher U, Nagae G, Schnittger S, Sanada M, Kon A, Alpermann T, et al. (2014). Landscape of genetic lesions in 944 patients with myelodysplastic syndromes. Leukemia 28, 241–247. 10.1038/leu.2013.336. [DOI] [PMC free article] [PubMed] [Google Scholar]
- 25.Yoshida K, Sanada M, Shiraishi Y, Nowak D, Nagata Y, Yamamoto R, Sato Y, Sato-Otsubo A, Kon A, Nagasaki M, et al. (2011). Frequent pathway mutations of splicing machinery in myelodysplasia. Nature 478, 64–69. 10.1038/nature10496. [DOI] [PubMed] [Google Scholar]
- 26.Papaemmanuil E, Gerstung M, Malcovati L, Tauro S, Gundem G, Van Loo P, Yoon CJ, Ellis P, Wedge DC, Pellagatti A, et al. (2013). Clinical and biological implications of driver mutations in myelodysplastic syndromes. Blood 122, 3616–3627. 10.1182/blood-2013-08-518886. [DOI] [PMC free article] [PubMed] [Google Scholar]
- 27.Inoue D, Bradley RK, and Abdel-Wahab O (2016). Spliceosomal gene mutations in myelodysplasia: molecular links to clonal abnormalities of hematopoiesis. Genes Dev 30, 989–1001. 10.1101/gad.278424.116. [DOI] [PMC free article] [PubMed] [Google Scholar]
- 28.Papaemmanuil E, Cazzola M, Boultwood J, Malcovati L, Vyas P, Bowen D, Pellagatti A, Wainscoat JS, Hellstrom-Lindberg E, Gambacorti-Passerini C, et al. (2011). Somatic SF3B1 Mutation in Myelodysplasia with Ring Sideroblasts. New England Journal of Medicine 365, 1384–1395. 10.1056/NEJMoa1103283. [DOI] [PMC free article] [PubMed] [Google Scholar]
- 29.Darman RB, Seiler M, Agrawal AA, Lim KH, Peng S, Aird D, Bailey SL, Bhavsar EB, Chan B, Colla S, et al. (2015). Cancer-Associated SF3B1 Hotspot Mutations Induce Cryptic 3’ Splice Site Selection through Use of a Different Branch Point. Cell Rep 13, 1033–1045. 10.1016/j.celrep.2015.09.053. [DOI] [PubMed] [Google Scholar]
- 30.Obeng EA, Chappell RJ, Seiler M, Chen MC, Campagna DR, Schmidt PJ, Schneider RK, Lord AM, Wang L, Gambe RG, et al. (2016). Physiologic Expression of Sf3b1K700E Causes Impaired Erythropoiesis, Aberrant Splicing, and Sensitivity to Therapeutic Spliceosome Modulation. Cancer Cell 30, 404–417. 10.1016/j.ccell.2016.08.006. [DOI] [PMC free article] [PubMed] [Google Scholar]
- 31.Dalton WB, Helmenstine E, Walsh N, Gondek LP, Kelkar DS, Read A, Natrajan R, Christenson ES, Roman B, Das S, et al. (2019). Hotspot SF3B1 mutations induce metabolic reprogramming and vulnerability to serine deprivation. J Clin Invest 129, 4708–4723. 10.1172/JCI125022. [DOI] [PMC free article] [PubMed] [Google Scholar]
- 32.Pellagatti A, Armstrong RN, Steeples V, Sharma E, Repapi E, Singh S, Sanchi A, Radujkovic A, Horn P, Dolatshad H, et al. (2018). Impact of spliceosome mutations on RNA splicing in myelodysplasia: dysregulated genes/pathways and clinical associations. Blood 132, 1225–1240. 10.1182/blood-2018-04-843771. [DOI] [PMC free article] [PubMed] [Google Scholar]
- 33.Lee SC-W, North K, Kim E, Jang E, Obeng E, Lu SX, Liu B, Inoue D, Yoshimi A, Ki M, et al. (2018). Synthetic Lethal and Convergent Biological Effects of Cancer-Associated Spliceosomal Gene Mutations. Cancer Cell 34, 225241.e8. 10.1016/j.ccell.2018.07.003. [DOI] [PMC free article] [PubMed] [Google Scholar]
- 34.Lieu YK, Liu Z, Ali AM, Wei X, Penson A, Zhang J, An X, Rabadan R, Raza A, Manley JL, et al. (2022). SF3B1 mutant-induced missplicing of MAP3K7 causes anemia in myelodysplastic syndromes. PNAS 119. 10.1073/pnas.2111703119. [DOI] [PMC free article] [PubMed] [Google Scholar]
- 35.Stoeckius M, Hafemeister C, Stephenson W, Houck-Loomis B, Chattopadhyay PK, Swerdlow H, Satija R, and Smibert P (2017). Simultaneous epitope and transcriptome measurement in single cells. Nature Methods 14, 865–868. 10.1038/nmeth.4380. [DOI] [PMC free article] [PubMed] [Google Scholar]
- 36.Mimitou EP, Cheng A, Montalbano A, Hao S, Stoeckius M, Legut M, Roush T, Herrera A, Papalexi E, Ouyang Z, et al. (2019). Multiplexed detection of proteins, transcriptomes, clonotypes and CRISPR perturbations in single cells. Nat Methods 16, 409–412. 10.1038/s41592-019-0392-0. [DOI] [PMC free article] [PubMed] [Google Scholar]
- 37.Velten L, Haas SF, Raffel S, Blaszkiewicz S, Islam S, Hennig BP, Hirche C, Lutz C, Buss EC, Nowak D, et al. (2017). Human haematopoietic stem cell lineage commitment is a continuous process. Nat Cell Biol 19, 271–281. 10.1038/ncb3493. [DOI] [PMC free article] [PubMed] [Google Scholar]
- 38.Ong S-M, Teng K, Newell E, Chen H, Chen J, Loy T, Yeo T-W, Fink K, and Wong S-C (2019). A Novel, FiveMarker Alternative to CD16–CD14 Gating to Identify the Three Human Monocyte Subsets. Frontiers in Immunology 10, 1761. 10.3389/fimmu.2019.01761. [DOI] [PMC free article] [PubMed] [Google Scholar]
- 39.Buus TB, Herrera A, Ivanova E, Mimitou E, Cheng A, Herati RS, Papagiannakopoulos T, Smibert P, Odum N, and Koralov SB Improving oligo-conjugated antibody signal in multimodal single-cell analysis. eLife 10, e61973. 10.7554/eLife.61973. [DOI] [PMC free article] [PubMed] [Google Scholar]
- 40.De La Garza A, Cameron RC, Gupta V, Fraint E, Nik S, and Bowman TV (2019). The splicing factor Sf3b1 regulates erythroid maturation and proliferation via TGFβ signaling in zebrafish. Blood Adv 3, 2093–2104. 10.1182/bloodadvances.2018027714. [DOI] [PMC free article] [PubMed] [Google Scholar]
- 41.Huang Y, Hale J, Wang Y, Li W, Zhang S, Zhang J, Zhao H, Guo X, Liu J, Yan H, et al. (2018). SF3B1 deficiency impairs human erythropoiesis via activation of p53 pathway: implications for understanding of ineffective erythropoiesis in MDS. J Hematol Oncol 11, 19. 10.1186/s13045-018-0558-8. [DOI] [PMC free article] [PubMed] [Google Scholar]
- 42.Shubinsky G, and Schlesinger M (1997). The CD38 Lymphocyte Differentiation Marker: New Insight into Its Ectoenzymatic Activity and Its Role as a Signal Transducer. Immunity 7, 315–324. 10.1016/S1074-7613(00)80353-2. [DOI] [PubMed] [Google Scholar]
- 43.Triana S, Vonficht D, Jopp-Saile L, Raffel S, Lutz R, Leonce D, Antes M, Hernández-Malmierca P, OrdoñezRueda D, Ramasz B, et al. (2021). Single-cell proteo-genomic reference maps of the hematopoietic system enable the purification and massive profiling of precisely defined cell states. Nat Immunol 22, 1577–1589. 10.1038/s41590021-01059-0. [DOI] [PMC free article] [PubMed] [Google Scholar]
- 44.McKenzie JL, Gan OI, Doedens M, and Dick JE (2007). Reversible cell surface expression of CD38 on CD34positive human hematopoietic repopulating cells. Exp Hematol 35, 1429–1436. 10.1016/j.exphem.2007.05.017. [DOI] [PubMed] [Google Scholar]
- 45.Chung SS, Eng WS, Hu W, Khalaj M, Garrett-Bakelman FE, Tavakkoli M, Levine RL, Carroll M, Klimek VM, Melnick AM, et al. (2017). CD99 is a Therapeutic Target on Disease Stem Cells in Myeloid Malignancies. Sci Transl Med 9, eaaj2025. 10.1126/scitranslmed.aaj2025. [DOI] [PMC free article] [PubMed] [Google Scholar]
- 46.Kingwell K (2017). CD99 marks malignant myeloid stem cells. Nat Rev Drug Discov 16, 166–166. 10.1038/nrd.2017.31. [DOI] [PubMed] [Google Scholar]
- 47.Tusi BK, Wolock SL, Weinreb C, Hwang Y, Hidalgo D, Zilionis R, Waisman A, Huh JR, Klein AM, and Socolovsky M (2018). Population Snapshots Predict Early Hematopoietic and Erythroid Hierarchies. Nature 555, 54–60. 10.1038/nature25741. [DOI] [PMC free article] [PubMed] [Google Scholar]
- 48.Signer RAJ, Magee JA, Salic A, and Morrison SJ (2014). Haematopoietic stem cells require a highly regulated protein synthesis rate. Nature 509, 49–54. 10.1038/nature13035. [DOI] [PMC free article] [PubMed] [Google Scholar]
- 49.Khajuria RK, Munschauer M, Ulirsch JC, Fiorini C, Ludwig LS, McFarland SK, Abdulhay NJ, Specht H, Keshishian H, Mani DR, et al. (2018). Ribosome Levels Selectively Regulate Translation and Lineage Commitment in Human Hematopoiesis. Cell 173, 90–103.e19. 10.1016/j.cell.2018.02.036. [DOI] [PMC free article] [PubMed] [Google Scholar]
- 50.Stevens BM, Khan N, D’Alessandro A, Nemkov T, Winters A, Jones CL, Zhang W, Pollyea DA, and Jordan CT (2018). Characterization and targeting of malignant stem cells in patients with advanced myelodysplastic syndromes. Nat Commun 9, 3694. 10.1038/s41467-018-05984-x. [DOI] [PMC free article] [PubMed] [Google Scholar]
- 51.van Galen P, Mbong N, Kreso A, Schoof EM, Wagenblast E, Ng SWK, Krivdova G, Jin L, Nakauchi H, and Dick JE (2018). Integrated Stress Response Activity Marks Stem Cells in Normal Hematopoiesis and Leukemia. Cell Rep 25, 1109–1117.e5. 10.1016/j.celrep.2018.10.021. [DOI] [PubMed] [Google Scholar]
- 52.Ajore R, Raiser D, McConkey M, Jöud M, Boidol B, Mar B, Saksena G, Weinstock DM, Armstrong S, Ellis SR, et al. (2017). Deletion of ribosomal protein genes is a common vulnerability in human cancer, especially in concert with TP53 mutations. EMBO Mol Med 9, 498–507. 10.15252/emmm.201606660. [DOI] [PMC free article] [PubMed] [Google Scholar]
- 53.Dutt S, Narla A, Lin K, Mullally A, Abayasekara N, Megerdichian C, Wilson FH, Currie T, Khanna-Gupta A, Berliner N, et al. (2011). Haploinsufficiency for ribosomal protein genes causes selective activation of p53 in human erythroid progenitor cells. Blood 117, 2567–2576. 10.1182/blood-2010-07-295238. [DOI] [PMC free article] [PubMed] [Google Scholar]
- 54.Fumagalli S, Ivanenkov VV, Teng T, and Thomas G (2012). Suprainduction of p53 by disruption of 40S and 60S ribosome biogenesis leads to the activation of a novel G2/M checkpoint. Genes Dev 26, 1028–1040. 10.1101/gad.189951.112. [DOI] [PMC free article] [PubMed] [Google Scholar]
- 55.Bursac S, Brdovcak MC, Donati G, and Volarevic S (2014). Activation of the tumor suppressor p53 upon impairment of ribosome biogenesis. Biochimica et Biophysica Acta (BBA) - Molecular Basis of Disease 1842, 817–830. 10.1016/j.bbadis.2013.08.014. [DOI] [PubMed] [Google Scholar]
- 56.Pellagatti A, Marafioti T, Paterson JC, Barlow JL, Drynan LF, Giagounidis A, Pileri SA, Cazzola M, McKenzie ANJ, Wainscoat JS, et al. (2010). Induction of p53 and up-regulation of the p53 pathway in the human 5q−syndrome. Blood 115, 2721–2723. 10.1182/blood-2009-12-259705. [DOI] [PubMed] [Google Scholar]
- 57.Ebert BL, Pretz J, Bosco J, Chang CY, Tamayo P, Galili N, Raza A, Root DE, Attar E, Ellis SR, et al. (2008). Identification of RPS14 as a 5q- syndrome gene by RNA interference screen. Nature 451, 335–339. 10.1038/nature06494. [DOI] [PMC free article] [PubMed] [Google Scholar]
- 58.Mills EW, and Green R (2017). Ribosomopathies: There’s strength in numbers. Science 358, eaan2755. 10.1126/science.aan2755. [DOI] [PubMed] [Google Scholar]
- 59.Caldon CE, and Musgrove EA (2010). Distinct and redundant functions of cyclin E1 and cyclin E2 in development and cancer. Cell Division 5, 2. 10.1186/1747-1028-5-2. [DOI] [PMC free article] [PubMed] [Google Scholar]
- 60.Toledo F, and Wahl GM (2007). MDM2 and MDM4: p53 regulators as targets in anticancer therapy. Int J Biochem Cell Biol 39, 1476–1482. 10.1016/j.biocel.2007.03.022. [DOI] [PMC free article] [PubMed] [Google Scholar]
- 61.Perry ME (2010). The Regulation of the p53-mediated Stress Response by MDM2 and MDM4. Cold Spring Harb Perspect Biol 2, a000968. 10.1101/cshperspect.a000968. [DOI] [PMC free article] [PubMed] [Google Scholar]
- 62.Gilkes DM, Chen L, and Chen J (2006). MDMX regulation of p53 response to ribosomal stress. The EMBO Journal 25, 5614–5625. 10.1038/sj.emboj.7601424. [DOI] [PMC free article] [PubMed] [Google Scholar]
- 63.Le Goff S, Boussaid I, Floquet C, Raimbault A, Hatin I, Andrieu-Soler C, Salma M, Leduc M, Gautier E-F, Guyot B, et al. (2021). p53 activation during ribosome biogenesis regulates normal erythroid differentiation. Blood 137, 89–102. 10.1182/blood.2019003439. [DOI] [PubMed] [Google Scholar]
- 64.Dolatshad H, Pellagatti A, Fernandez-Mercado M, Yip BH, Malcovati L, Attwood M, Przychodzen B, Sahgal N, Kanapin AA, Lockstone H, et al. (2015). Disruption of SF3B1 results in deregulated expression and splicing of key genes and pathways in myelodysplastic syndrome hematopoietic stem and progenitor cells. Leukemia 29, 1092–1103. 10.1038/leu.2014.331. [DOI] [PMC free article] [PubMed] [Google Scholar]
- 65.Liu Z, Yoshimi A, Wang J, Cho H, Chun-Wei Lee S, Ki M, Bitner L, Chu T, Shah H, Liu B, et al. (2020). Mutations in the RNA Splicing Factor SF3B1 Promote Tumorigenesis through MYC Stabilization. Cancer Discov 10, 806–821. 10.1158/2159-8290.CD-19-1330. [DOI] [PMC free article] [PubMed] [Google Scholar]
- 66.Wyman D, Balderrama-Gutierrez G, Reese F, Jiang S, Rahmanian S, Forner S, Matheos D, Zeng W, Williams B, Trout D, et al. (2020). A technology-agnostic long-read analysis pipeline for transcriptome discovery and quantification 10.1101/672931. [DOI] [Google Scholar]
- 67.Lebrigand K, Magnone V, Barbry P, and Waldmann R (2020). High throughput error corrected Nanopore single cell transcriptome sequencing. Nat Commun 11, 4025. 10.1038/s41467-020-17800-6. [DOI] [PMC free article] [PubMed] [Google Scholar]
- 68.Tian L, Jabbari JS, Thijssen R, Gouil Q, Amarasinghe SL, Voogd O, Kariyawasam H, Du MRM, Schuster J, Wang C, et al. (2021). Comprehensive characterization of single-cell full-length isoforms in human and mouse with long-read sequencing. Genome Biology 22, 310. 10.1186/s13059-021-02525-6. [DOI] [PMC free article] [PubMed] [Google Scholar]
- 69.Tang AD, Soulette CM, van Baren MJ, Hart K, Hrabeta-Robinson E, Wu CJ, and Brooks AN (2020). Full-length transcript characterization of SF3B1 mutation in chronic lymphocytic leukemia reveals downregulation of retained introns. Nat Commun 11, 1438. 10.1038/s41467-020-15171-6. [DOI] [PMC free article] [PubMed] [Google Scholar]
- 70.Hardwick SA, Hu W, Joglekar A, Fan L, Collier PG, Foord C, Balacco J, Lanjewar S, Sampson MM, Koopmans F, et al. (2022). Single-nuclei isoform RNA sequencing unlocks barcoded exon connectivity in frozen brain tissue. Nat Biotechnol, 1–11. 10.1038/s41587-022-01231-3. [DOI] [PMC free article] [PubMed] [Google Scholar]
- 71.Pervouchine DD, Knowles DG, and Guigó R (2013). Intron-centric estimation of alternative splicing from RNA-seq data. Bioinformatics 29, 273–274. 10.1093/bioinformatics/bts678. [DOI] [PMC free article] [PubMed] [Google Scholar]
- 72.Li YI, Knowles DA, Humphrey J, Barbeira AN, Dickinson SP, Im HK, and Pritchard JK (2018). Annotation-free quantification of RNA splicing using LeafCutter. Nat Genet 50, 151–158. 10.1038/s41588-017-0004-9. [DOI] [PMC free article] [PubMed] [Google Scholar]
- 73.Vaquero-Garcia J, Barrera A, Gazzara MR, González-Vallinas J, Lahens NF, Hogenesch JB, Lynch KW, and Barash Y (2016). A new view of transcriptome complexity and regulation through the lens of local splicing variations. eLife 5, e11752. 10.7554/eLife.11752. [DOI] [PMC free article] [PubMed] [Google Scholar]
- 74.Shiozawa Y, Malcovati L, Gallì A, Sato-Otsubo A, Kataoka K, Sato Y, Watatani Y, Suzuki H, Yoshizato T, Yoshida K, et al. (2018). Aberrant splicing and defective mRNA production induced by somatic spliceosome mutations in myelodysplasia. Nat Commun 9, 3649. 10.1038/s41467-018-06063-x. [DOI] [PMC free article] [PubMed] [Google Scholar]
- 75.Mupo A, Seiler M, Sathiaseelan V, Pance A, Yang Y, Agrawal AA, Iorio F, Bautista R, Pacharne S, Tzelepis K, et al. (2017). Hemopoietic-specific Sf3b1-K700E knock-in mice display the splicing defect seen in human MDS but develop anemia without ring sideroblasts. Leukemia 31, 720–727. 10.1038/leu.2016.251. [DOI] [PMC free article] [PubMed] [Google Scholar]
- 76.Prjibelski AD, Mikheenko A, Joglekar A, Smetanin A, Jarroux J, Lapidus AL, and Tilgner HU (2023). Accurate isoform discovery with IsoQuant using long reads. Nat Biotechnol. 10.1038/s41587-022-01565-y. [DOI] [PMC free article] [PubMed] [Google Scholar]
- 77.Wang L, Brooks AN, Fan J, Wan Y, Gambe R, Li S, Hergert S, Yin S, Freeman SS, Levin JZ, et al. (2016). Transcriptomic Characterization of SF3B1 Mutation Reveals Its Pleiotropic Effects in Chronic Lymphocytic Leukemia. Cancer Cell 30, 750–763. 10.1016/j.ccell.2016.10.005. [DOI] [PMC free article] [PubMed] [Google Scholar]
- 78.Ramabadran R, Wang JH, Reyes JM, Guzman AG, Gupta S, Rosas C, Brunetti L, Gundry MC, Tovy A, Long H, et al. (2023). DNMT3A-coordinated splicing governs the stem state switch towards differentiation in embryonic and haematopoietic stem cells. Nat Cell Biol 25, 528–539. 10.1038/s41556-023-01109-9. [DOI] [PMC free article] [PubMed] [Google Scholar]
- 79.Banaszak LG, Giudice V, Zhao X, Wu Z, Gao S, Hosokawa K, Keyvanfar K, Townsley DM, Gutierrez-Rodrigues F, Fernandez Ibanez MDP, et al. (2018). Abnormal RNA splicing and genomic instability after induction of DNMT3A mutations by CRISPR/Cas9 gene editing. Blood Cells Mol Dis 69, 10–22. 10.1016/j.bcmd.2017.12.002. [DOI] [PMC free article] [PubMed] [Google Scholar]
- 80.Thomas JD, Polaski JT, Feng Q, De Neef EJ, Hoppe ER, McSharry MV, Pangallo J, Gabel AM, Belleville AE, Watson J, et al. (2020). RNA isoform screens uncover the essentiality and tumor-suppressor activity of ultraconserved poison exons. Nat Genet 52, 84–94. 10.1038/s41588-019-0555-z. [DOI] [PMC free article] [PubMed] [Google Scholar]
- 81.Che Y, and Fu L (2020). Aberrant expression and regulatory network of splicing factor-SRSF3 in tumors. J Cancer 11, 3502–3511. 10.7150/jca.42645. [DOI] [PMC free article] [PubMed] [Google Scholar]
- 82.Biancon G, Joshi P, Zimmer JT, Hunck T, Gao Y, Lessard MD, Courchaine E, Barentine AES, Machyna M, Botti V, et al. (2022). Precision analysis of mutant U2AF1 activity reveals deployment of stress granules in myeloid malignancies. Molecular Cell 82, 1107–1122.e7. 10.1016/j.molcel.2022.02.025. [DOI] [PMC free article] [PubMed] [Google Scholar]
- 83.Jones M, Osawa G, Regal JA, Weinberg DN, Taggart J, Kocak H, Friedman A, Ferguson DO, Keegan CE, and Maillard I (2014). Hematopoietic stem cells are acutely sensitive to Acd shelterin gene inactivation. J. Clin. Invest 124, 353–366. 10.1172/JCI67871. [DOI] [PMC free article] [PubMed] [Google Scholar]
- 84.Bergot T, Lippert E, Douet-Guilbert N, Commet S, Corcos L, and Bernard DG (2020). Human Cancer-Associated Mutations of SF3B1 Lead to a Splicing Modification of Its Own RNA. Cancers 12, 652. 10.3390/cancers12030652. [DOI] [PMC free article] [PubMed] [Google Scholar]
- 85.Abdulhay NJ, Fiorini C, Verboon JM, Ludwig LS, Ulirsch JC, Zieger B, Lareau CA, Mi X, Roy A, Obeng EA, et al. (2019). Impaired human hematopoiesis due to a cryptic intronic GATA1 splicing mutation. Journal of Experimental Medicine 216, 1050–1060. 10.1084/jem.20181625. [DOI] [PMC free article] [PubMed] [Google Scholar]
- 86.Ling T, Crispino JD, Zingariello M, Martelli F, and Migliaccio AR (2018). GATA1 insufficiencies in primary myelofibrosis and other hematopoietic disorders: consequences for therapy. Expert Review of Hematology 11, 169–184. 10.1080/17474086.2018.1436965. [DOI] [PMC free article] [PubMed] [Google Scholar]
- 87.Pietras EM, Warr MR, and Passegué E (2011). Cell cycle regulation in hematopoietic stem cells. J Cell Biol 195, 709–720. 10.1083/jcb.201102131. [DOI] [PMC free article] [PubMed] [Google Scholar]
- 88.Chung J, Chen C, and Paw BH (2012). Heme Metabolism and Erythropoiesis. Curr Opin Hematol 19, 156–162. 10.1097/MOH.0b013e328351c48b. [DOI] [PMC free article] [PubMed] [Google Scholar]
- 89.Dzierzak E, and Philipsen S (2013). Erythropoiesis: Development and Differentiation. Cold Spring Harb Perspect Med 3, a011601. 10.1101/cshperspect.a011601. [DOI] [PMC free article] [PubMed] [Google Scholar]
- 90.Moore KS, and von Lindern M (2018). RNA Binding Proteins and Regulation of mRNA Translation in Erythropoiesis. Front Physiol 9, 910. 10.3389/fphys.2018.00910. [DOI] [PMC free article] [PubMed] [Google Scholar]
- 91.Wong JJ-L, Ritchie W, Ebner OA, Selbach M, Wong JWH, Huang Y, Gao D, Pinello N, Gonzalez M, Baidya K, et al. (2013). Orchestrated intron retention regulates normal granulocyte differentiation. Cell 154, 583–595. 10.1016/j.cell.2013.06.052. [DOI] [PubMed] [Google Scholar]
- 92.Edwards CR, Ritchie W, Wong JJ-L, Schmitz U, Middleton R, An X, Mohandas N, Rasko JEJ, and Blobel GA (2016). A dynamic intron retention program in the mammalian megakaryocyte and erythrocyte lineages. Blood 127, e24–e34. 10.1182/blood-2016-01-692764. [DOI] [PMC free article] [PubMed] [Google Scholar]
- 93.Chen L, Kostadima M, Martens JHA, Canu G, Garcia SP, Turro E, Downes K, Macaulay IC, Bielczyk-Maczynska E, Coe S, et al. (2014). Transcriptional diversity during lineage commitment of human blood progenitors. Science 345, 1251033. 10.1126/science.1251033. [DOI] [PMC free article] [PubMed] [Google Scholar]
- 94.Asimomitis G, Deslauriers AG, Kotini AG, Bernard E, Esposito D, Olszewska M, Spyrou N, Arango Ossa JE, Mortera-Blanco T, Koche RP, et al. (2022). Patient-specific MDS-RS iPSCs define the mis-spliced transcript repertoire and chromatin landscape of SF3B1-mutant HSPCs. Blood Advances, bloodadvances.2021006325. 10.1182/bloodadvances.2021006325. [DOI] [PMC free article] [PubMed] [Google Scholar]
- 95.Chiabrando D, Mercurio S, and Tolosano E (2014). Heme and erythropoieis: more than a structural role. Haematologica 99, 973–983. 10.3324/haematol.2013.091991. [DOI] [PMC free article] [PubMed] [Google Scholar]
- 96.Malcovati L, Stevenson K, Papaemmanuil E, Neuberg D, Bejar R, Boultwood J, Bowen DT, Campbell PJ, Ebert BL, Fenaux P, et al. (2020). SF3B1-mutant MDS as a distinct disease subtype: a proposal from the International Working Group for the Prognosis of MDS. Blood 136, 157–170. 10.1182/blood.2020004850. [DOI] [PMC free article] [PubMed] [Google Scholar]
- 97.Clough CA, Pangallo J, Sarchi M, Ilagan JO, North K, Bergantinos R, Stolla MC, Naru J, Nugent P, Kim E, et al. (2022). Coordinated missplicing of TMEM14C and ABCB7 causes ring sideroblast formation in SF3B1-mutant myelodysplastic syndrome. Blood 139, 2038–2049. 10.1182/blood.2021012652. [DOI] [PMC free article] [PubMed] [Google Scholar]
- 98.Conte S, Katayama S, Vesterlund L, Karimi M, Dimitriou M, Jansson M, Mortera-Blanco T, Unneberg P, Papaemmanuil E, Sander B, et al. (2015). Aberrant splicing of genes involved in haemoglobin synthesis and impaired terminal erythroid maturation in SF3B1 mutated refractory anaemia with ring sideroblasts. Br J Haematol 171, 478–490. 10.1111/bjh.13610. [DOI] [PMC free article] [PubMed] [Google Scholar]
- 99.Brogna S, and Wen J (2009). Nonsense-mediated mRNA decay (NMD) mechanisms. Nat Struct Mol Biol 16, 107–113. 10.1038/nsmb.1550. [DOI] [PubMed] [Google Scholar]
- 100.Hug N, Longman D, and Cáceres JF (2016). Mechanism and regulation of the nonsense-mediated decay pathway. Nucleic Acids Res 44, 1483–1495. 10.1093/nar/gkw010. [DOI] [PMC free article] [PubMed] [Google Scholar]
- 101.Moore KS, and Lindern M (2018). RNA Binding Proteins and Regulation of mRNA Translation in Erythropoiesis. Front Physiol 9, 910. 10.3389/fphys.2018.00910. [DOI] [PMC free article] [PubMed] [Google Scholar]
- 102.Kurosaki T, Popp MW, and Maquat LE (2019). Quality and quantity control of gene expression by nonsense-mediated mRNA decay. Nat Rev Mol Cell Biol 20, 406–420. 10.1038/s41580-019-0126-2. [DOI] [PMC free article] [PubMed] [Google Scholar]
- 103.Supek F, Lehner B, and Lindeboom RGH (2021). To NMD or Not To NMD: Nonsense-Mediated mRNA Decay in Cancer and Other Genetic Diseases. Trends in Genetics 37, 657–668. 10.1016/j.tig.2020.11.002. [DOI] [PubMed] [Google Scholar]
- 104.Nickless A, Bailis JM, and You Z (2017). Control of gene expression through the nonsense-mediated RNA decay pathway. Cell Biosci 7, 26. 10.1186/s13578-017-0153-7. [DOI] [PMC free article] [PubMed] [Google Scholar]
- 105.Leeksma AC, Derks IAM, Kasem MH, Kilic E, de Klein A, Jager MJ, van de Loosdrecht AA, Jansen JH, Navrkalova V, Faber LM, et al. (2021). The Effect of SF3B1 Mutation on the DNA Damage Response and Nonsense-Mediated mRNA Decay in Cancer. Front Oncol 10, 609409. 10.3389/fonc.2020.609409. [DOI] [PMC free article] [PubMed] [Google Scholar]
- 106.Testa U (2004). Apoptotic mechanisms in the control of erythropoiesis. Leukemia 18, 1176–1199. 10.1038/sj.leu.2403383. [DOI] [PubMed] [Google Scholar]
- 107.Zhou M, Demo SD, McClure TN, Crea R, and Bitler CM (1998). A Novel Splice Variant of the Cell Death-promoting Protein BAX*. Journal of Biological Chemistry 273, 11930–11936. 10.1074/jbc.273.19.11930. [DOI] [PubMed] [Google Scholar]
- 108.Van de Casteele M, Kefas BA, Ling Z, Heimberg H, and Pipeleers DG (2002). Specific Expression of Bax-ω in Pancreatic β-Cells Is Down-Regulated by Cytokines before the Onset of Apoptosis. Endocrinology 143, 320–326. 10.1210/endo.143.1.8574. [DOI] [PubMed] [Google Scholar]
- 109.Lindsten T, Ross AJ, King A, Zong WX, Rathmell JC, Shiels HA, Ulrich E, Waymire KG, Mahar P, Frauwirth K, et al. (2000). The combined functions of proapoptotic Bcl-2 family members bak and bax are essential for normal development of multiple tissues. Mol Cell 6, 1389–1399. 10.1016/s1097-2765(00)00136-2. [DOI] [PMC free article] [PubMed] [Google Scholar]
- 110.Blombery P, Lew TE, Dengler MA, Thompson ER, Lin VS, Chen X, Nguyen T, Panigrahi A, Handunnetti SM, Carney DA, et al. (2022). Clonal hematopoiesis, myeloid disorders and BAX-mutated myelopoiesis in patients receiving venetoclax for CLL. Blood 139, 1198–1207. 10.1182/blood.2021012775. [DOI] [PubMed] [Google Scholar]
- 111.Moujalled DM, Brown FC, Chua CC, Dengler MA, Pomilio G, Anstee NS, Litalien V, Thompson E, Morley T, MacRaild S, et al. (2023). Acquired mutations in BAX confer resistance to BH3-mimetic therapy in acute myeloid leukemia. Blood 141, 634–644. 10.1182/blood.2022016090. [DOI] [PubMed] [Google Scholar]
- 112.Kitamura T, Tange T, Terasawa T, Chiba S, Kuwaki T, Miyagawa K, Piao YF, Miyazono K, Urabe A, and Takaku F (1989). Establishment and characterization of a unique human cell line that proliferates dependently on GM-CSF, IL-3, or erythropoietin. J Cell Physiol 140, 323–334. 10.1002/jcp.1041400219. [DOI] [PubMed] [Google Scholar]
- 113.Fu NY, Sukumaran SK, Kerk SY, and Yu VC (2009). Baxbeta: a constitutively active human Bax isoform that is under tight regulatory control by the proteasomal degradation mechanism. Mol Cell 33, 15–29. 10.1016/j.molcel.2008.11.025. [DOI] [PubMed] [Google Scholar]
- 114.Steensma DP, Bejar R, Jaiswal S, Lindsley RC, Sekeres MA, Hasserjian RP, and Ebert BL (2015). Clonal hematopoiesis of indeterminate potential and its distinction from myelodysplastic syndromes. Blood 126, 9–16. 10.1182/blood-2015-03-631747. [DOI] [PMC free article] [PubMed] [Google Scholar]
- 115.Malcovati L, Gallì A, Travaglino E, Ambaglio I, Rizzo E, Molteni E, Elena C, Ferretti VV, Catricalà S, Bono E, et al. (2017). Clinical significance of somatic mutation in unexplained blood cytopenia. Blood 129, 3371–3378. 10.1182/blood-2017-01-763425. [DOI] [PMC free article] [PubMed] [Google Scholar]
- 116.Mian SA, Rouault-Pierre K, Smith AE, Seidl T, Pizzitola I, Kizilors A, Kulasekararaj AG, Bonnet D, and Mufti GJ (2015). SF3B1 mutant MDS-initiating cells may arise from the haematopoietic stem cell compartment. Nat Commun 6, 10004. 10.1038/ncomms10004. [DOI] [PMC free article] [PubMed] [Google Scholar]
- 117.Fabre MA, de Almeida JG, Fiorillo E, Mitchell E, Damaskou A, Rak J, Orrù V, Marongiu M, Chapman MS, Vijayabaskar MS, et al. (2022). The longitudinal dynamics and natural history of clonal haematopoiesis. Nature 606, 335–342. 10.1038/s41586-022-04785-z. [DOI] [PMC free article] [PubMed] [Google Scholar]
- 118.Mortera-Blanco T, Dimitriou M, Woll PS, Karimi M, Elvarsdottir E, Conte S, Tobiasson M, Jansson M, Douagi I, Moarii M, et al. (2017). SF3B1-initiating mutations in MDS-RSs target lymphomyeloid hematopoietic stem cells. Blood 130, 881–890. 10.1182/blood-2017-03-776070. [DOI] [PMC free article] [PubMed] [Google Scholar]
- 119.Miles LA, Bowman RL, Merlinsky TR, Csete IS, Ooi AT, Durruthy-Durruthy R, Bowman M, Famulare C, Patel MA, Mendez P, et al. (2020). Single-cell mutation analysis of clonal evolution in myeloid malignancies. Nature 587, 477–482. 10.1038/s41586-020-2864-x. [DOI] [PMC free article] [PubMed] [Google Scholar]
- 120.Rodriguez-Meira A, O’Sullivan J, Rahman H, and Mead AJ (2020). TARGET-Seq: A Protocol for High-Sensitivity Single-Cell Mutational Analysis and Parallel RNA Sequencing. STAR Protocols 1, 100125. 10.1016/j.xpro.2020.100125. [DOI] [PMC free article] [PubMed] [Google Scholar]
- 121.Rodriguez-Meira A, Norfo R, Wen WX, Chédeville AL, Rahman H, O’Sullivan J, Wang G, Louka E, Kretzschmar WW, Paterson A, et al. (2022). Deciphering TP53 mutant Cancer Evolution with Single-Cell Multi-Omics. 2022.03.28.485984. 10.1101/2022.03.28.485984. [DOI] [PMC free article] [PubMed] [Google Scholar]
- 122.Magee JA, and Signer RAJ (2021). Developmental Stage-Specific Changes in Protein Synthesis Differentially Sensitize Hematopoietic Stem Cells and Erythroid Progenitors to Impaired Ribosome Biogenesis. Stem Cell Reports 16, 20–28. 10.1016/j.stemcr.2020.11.017. [DOI] [PMC free article] [PubMed] [Google Scholar]
- 123.Iskander D, Wang G, Heuston EF, Christodoulidou C, Psaila B, Ponnusamy K, Ren H, Mokhtari Z, Robinson M, Chaidos A, et al. (2021). Single-cell profiling of human bone marrow progenitors reveals mechanisms of failing erythropoiesis in Diamond-Blackfan anemia. Science Translational Medicine 13, eabf0113. 10.1126/scitranslmed.abf0113. [DOI] [PubMed] [Google Scholar]
- 124.Stahl M, Menghrajani K, Derkach A, Chan A, Xiao W, Glass J, King AC, Daniyan AF, Famulare C, Cuello BM, et al. (2021). Clinical and molecular predictors of response and survival following venetoclax therapy in relapsed/refractory AML. Blood Advances 5, 1552–1564. 10.1182/bloodadvances.2020003734. [DOI] [PMC free article] [PubMed] [Google Scholar]
- 125.Zhang H, Nakauchi Y, Köhnke T, Stafford M, Bottomly D, Thomas R, Wilmot B, McWeeney SK, Majeti R, and Tyner JW (2020). Integrated analysis of patient samples identifies biomarkers for venetoclax efficacy and combination strategies in acute myeloid leukemia. Nat Cancer 1, 826–839. 10.1038/s43018-020-0103-x. [DOI] [PMC free article] [PubMed] [Google Scholar]
- 126.Wang H, Guo M, Wei H, and Chen Y (2023). Targeting p53 pathways: mechanisms, structures, and advances in therapy. Sig Transduct Target Ther 8, 1–35. 10.1038/s41392-023-01347-1. [DOI] [PMC free article] [PubMed] [Google Scholar]
- 127.Moura PL, Mortera-Blanco T, Hofman IJF, Todisco G, Kretzschmar WW, Björklund A-C, Creignou M, Hagemann-Jensen M, Ziegenhain C, Granados DC, et al. (2023). Erythroid differentiation intensifies RNA mis-splicing in SF3B1-mutant myelodysplastic syndromes with ring sideroblasts. 2023.04.11.536355. 10.1101/2023.04.11.536355. [DOI] [PMC free article] [PubMed] [Google Scholar]
- 128.Marasco LE, and Kornblihtt AR (2022). The physiology of alternative splicing. Nat Rev Mol Cell Biol, 1–13. 10.1038/s41580-022-00545-z. [DOI] [PubMed] [Google Scholar]
- 129.Bonnal SC, López-Oreja I, and Valcárcel J (2020). Roles and mechanisms of alternative splicing in cancer — implications for care. Nat Rev Clin Oncol 17, 457–474. 10.1038/s41571-020-0350-x. [DOI] [PubMed] [Google Scholar]
- 130.Seiler M, Peng S, Agrawal AA, Palacino J, Teng T, Zhu P, Smith PG, Cancer Genome Atlas Research Network, Buonamici S, and Yu L (2018). Somatic Mutational Landscape of Splicing Factor Genes and Their Functional Consequences across 33 Cancer Types. Cell Rep 23, 282–296.e4. 10.1016/j.celrep.2018.01.088. [DOI] [PMC free article] [PubMed] [Google Scholar]
- 131.Yoshida K, and Ogawa S (2014). Splicing factor mutations and cancer. WIREs RNA 5, 445–459. 10.1002/wrna.1222. [DOI] [PubMed] [Google Scholar]
- 132.Ogawa H, Horitani K, Izumiya Y, and Sano S (2022). Somatic Mosaicism in Biology and Disease. Annual Review of Physiology 84, 113–133. 10.1146/annurev-physiol-061121-040048. [DOI] [PMC free article] [PubMed] [Google Scholar]
- 133.Youssoufian H, and Pyeritz RE (2002). Mechanisms and consequences of somatic mosaicism in humans. Nat Rev Genet 3, 748–758. 10.1038/nrg906. [DOI] [PubMed] [Google Scholar]
- 134.Nam AS, Dusaj N, Izzo F, Murali R, Myers RM, Mouhieddine TH, Sotelo J, Benbarche S, Waarts M, Gaiti F, et al. (2022). Single-cell multi-omics of human clonal hematopoiesis reveals that DNMT3A R882 mutations perturb early progenitor states through selective hypomethylation. Nat Genet, 1–13. 10.1038/s41588-022-01179-9. [DOI] [PMC free article] [PubMed] [Google Scholar]
- 135.Mouhieddine TH, Sperling AS, Redd R, Park J, Leventhal M, Gibson CJ, Manier S, Nassar AH, Capelletti M, Huynh D, et al. (2020). Clonal hematopoiesis is associated with adverse outcomes in multiple myeloma patients undergoing transplant. Nat Commun 11, 2996. 10.1038/s41467-020-16805-5. [DOI] [PMC free article] [PubMed] [Google Scholar]
- 136.Hafemeister C, and Satija R (2019). Normalization and variance stabilization of single-cell RNA-seq data using regularized negative binomial regression. Genome Biology 20, 296. 10.1186/s13059-019-1874-1. [DOI] [PMC free article] [PubMed] [Google Scholar]
- 137.Stuart T, Butler A, Hoffman P, Hafemeister C, Papalexi E, Mauck WM, Hao Y, Stoeckius M, Smibert P, and Satija R (2019). Comprehensive Integration of Single-Cell Data. Cell 177, 1888–1902.e21. 10.1016/j.cell.2019.05.031. [DOI] [PMC free article] [PubMed] [Google Scholar]
- 138.Cao J, Spielmann M, Qiu X, Huang X, Ibrahim DM, Hill AJ, Zhang F, Mundlos S, Christiansen L, Steemers FJ, et al. (2019). The single-cell transcriptional landscape of mammalian organogenesis. Nature 566, 496–502. 10.1038/s41586-019-0969-x. [DOI] [PMC free article] [PubMed] [Google Scholar]
- 139.Bolker BM, Brooks ME, Clark CJ, Geange SW, Poulsen JR, Stevens MHH, and White J-SS (2009). Generalized linear mixed models: a practical guide for ecology and evolution. Trends in Ecology & Evolution 24, 127–135. 10.1016/j.tree.2008.10.008. [DOI] [PubMed] [Google Scholar]
- 140.Mulè MP, Martins AJ, and Tsang JS (2022). Normalizing and denoising protein expression data from droplet-based single cell profiling. Nat Commun 13, 2099. 10.1038/s41467-022-29356-8. [DOI] [PMC free article] [PubMed] [Google Scholar]
- 141.Vaquero-Garcia J, Norton S, and Barash Y (2018). LeafCutter vs. MAJIQ and comparing software in the fast moving field of genomics. 463927. 10.1101/463927. [DOI] [Google Scholar]
- 142.Tickle T, Tirosh I, Georgescu C, Brown M, and Haas B (2022). infercnv: Infer Copy Number Variation from Single-Cell RNA-Seq Data. 10.18129/B9.bioc.infercnv. [DOI] [Google Scholar]
- 143.Müller S, Cho A, Liu SJ, Lim DA, and Diaz A (2018). CONICS integrates scRNA-seq with DNA sequencing to map gene expression to tumor sub-clones. Bioinformatics 34, 3217–3219. 10.1093/bioinformatics/bty316. [DOI] [PMC free article] [PubMed] [Google Scholar]
- 144.Tardaguila M, de la Fuente L, Marti C, Pereira C, Pardo-Palacios FJ, Del Risco H, Ferrell M, Mellado M, Macchietto M, Verheggen K, et al. (2018). SQANTI: extensive characterization of long-read transcript sequences for quality control in full-length transcriptome identification and quantification. Genome Res 28, 396–411. 10.1101/gr.222976.117. [DOI] [PMC free article] [PubMed] [Google Scholar]
- 145.Trincado JL, Entizne JC, Hysenaj G, Singh B, Skalic M, Elliott DJ, and Eyras E (2018). SUPPA2: fast, accurate, and uncertainty-aware differential splicing analysis across multiple conditions. Genome Biol 19, 40. 10.1186/s13059-018-1417-1. [DOI] [PMC free article] [PubMed] [Google Scholar]
- 146.Nowicka M, and Robinson MD (2016). DRIMSeq: a Dirichlet-multinomial framework for multivariate count outcomes in genomics. F1000Res 5, 1356. 10.12688/f1000research.8900.2. [DOI] [PMC free article] [PubMed] [Google Scholar]
Associated Data
This section collects any data citations, data availability statements, or supplementary materials included in this article.
Supplementary Materials
Data Availability Statement
The processed single cell RNA-Seq data are available through the NCBI Gene Expression Omnibus (GEO) and are publicly available as of the date of publication. Accession numbers are listed in the key resources table. De-identified patient FASTQ files have been deposited at the European Genome–phenome Archive (EGA) and accession numbers are listed in the key resources table. They are available upon request if access is granted.
All original code has been deposited at GitHub and Zenodo and is publicly available as of the date of publication. DOIs are listed in the Key Resources Table.
Any additional information required to reanalyze the data reported in this paper is available from the lead contact upon request.
KEY RESOURCES TABLE
| REAGENT or RESOURCE | SOURCE | IDENTIFIER |
|---|---|---|
| Antibodies | ||
| CITE-seq ADTs (see Table S2) | BioLegend TotalSeq-A | N/A |
| CD34-PE-Vio770 | Miltenyi Biotec | clone AC136; RRID: AB_2660374 |
| BAX | Santa Cruz Biotechnology | sc-7480; RRID: AB_626729 |
| BAK | Thermo Fisher | MA5–36225; RRID: AB_2884059 |
| GFP | Cell Signaling Technology | 2555S; RRID: AB_10692764 |
| GAPDH | Cell Signaling Technology | 5174S; RRID: AB_10622025 |
| FLAG | Sigma Aldrich | F1804; RRID: AB_262044 |
| Bacterial and virus strains | ||
| Lentiviral expression vector | Addgene | RRID: Addgene_128055 |
| Neomycin lentiviral expression vector | Addgene | RRID: Addgene_139449 |
| Tetracycline inducible lentiviral expression vector | Addgene | RRID: Addgene_162823 |
| Chemicals, peptides, and recombinant proteins | ||
| FSC | TaKaRa | #631106 |
| Human GM-CSF | R&D Systems | 215-GM |
| DAPI | Sigma-Aldrich | D9542 |
| Annexin V | BioLegend | 640920 |
| RIPA buffer | Cell Signaling Technology | N/A |
| Intercept Blocking Buffer | LI-COR | N/A |
| Critical commercial assays | ||
| Ligation Sequencing Kit | Oxford Nanopore Technologies | SQK-LSK110 SQK-LSK114 |
| LongAmp Taq 2X Master Mix | New England BioLaboratories | M0287S |
| Chromium 3’ (v.3.1 chemistry) | 10x Genomics | N/A |
| SPRI beads | Beckman Coulter Life Science | B23317 |
| MycoAlert Mycoplasma Detection Kit | Lonza | LT07–701 |
| MycoAlert Assay Control Set | Lonza | LT07–518 |
| True-Stain Monocyte Blocker | BioLegend | Cat#422302; RRID: AB_2818986 |
| Deposited data | ||
| scRNAseq CH01–02, CH04, MDS01–06 and AML01A-B (See Table S1), raw (FASTQ) and processed (gene matrix counts, barcodes, features, and isoform junction counts) samples. | This paper | GEO: GSE204845 EGA: EGAS00001007402 |
| Human reference GRCh38 (GENCODE v32/Ensembl 98) | 10x Genomics | https://support.10xgenomics.com/single-cell-gene-expression/software/release-notes/build#GRCh38_2020A |
| MSigDB C2 curated gene sets | GSEA | RRID: SCR_016863; https://www.gsea-msigdb.org/gsea/msigdb/human/collection_details.jsp#C2 |
| Human transcript reference GRCh38.p12 (v31) | GENCODE | RRID: SCR_014966; https://www.gencodegenes.org/human/release_31.html |
| Experimental models: Cell lines | ||
| TF-1 | ATCC | CRL-2003; RRID: CVCL_0559 |
| TF1-Cas9 BAX and BAK DKO cells | This paper | N/A |
| Oligonucleotides | ||
| Used in GoT and cDNA ONT sequencing; KO experiments (see Table S1) | This paper | N/A |
| Software and algorithms | ||
| Cell Ranger (v.3.1.0) | 10x Genomics | RRID: SCR_017344; https://support.10xgenomics.com/single-cell-gene-expression/software/release-notes/3-1 |
| Seurat (v.3.1) | Stuart et al.134 | RRID: SCR_016341; https://github.com/satijalab/seurat/releases/tag/v3.1.0 |
| Monocle3 (v.1.0) | Cao et al.135 | RRID: SCR_018685; https://github.com/cole-trapnell-lab/monocle3 |
| IronThrone (v.2.1) | Nam et al.133 | https://github.com/landau-lab/GoT-IronThrone |
| lme4 (v.1.2–1) | Bates et al. | RRID: SCR_015654; https://github.com/lme4/lme4 |
| dsb (v.0.1.0) | Mulè et al.136 | https://github.com/niaid/dsb |
| Guppy (v.3.0.6 – 4.0.11) | NanoporeTech | RRID: SCR_023196; https://github.com/nanoporetech/pyguppyclient |
| SiCeLoRe (v.1.0) | Lebrigand et al.67 | RRID: SCR_018550; https://github.com/ucagenomix/sicelore |
| minimap2 (v.2.17) | Heng Li137 | RRID: SCR_018550; https://github.com/lh3/minimap2/releases/tag/v2.17 |
| SAMtools (v.1.9) | Danecek et al.138 | RRID: SCR_002105; https://github.com/samtools/samtools/releases/tag/1.9 |
| umi-tools (v.1.1.2) | Smith et al.139 | RRID: SCR_017048; https://github.com/CGATOxford/UMI-tools/releases/tag/1.1.2 |
| InferCNV (v.1.4.0) | Tickle et al.140 | RRID: SCR_021140; https://github.com/broadinstitute/infercnv |
| CONICSmat (v.0.0.0.1) | Müller etal.141 | https://github.com/diazlab/CONICS |
| FLAMES (v.1.3.4) | Tian et al.68 | https://github.com/OliverVoogd/FLAMES |
| IsoQuant (v.3.1.1) | Prjibelski et al.76 | https://github.com/ablab/IsoQuant/releases/tag/v3.1.1 |
| SQANTI3 (v.5.1.1) | Tardaguila et al.142 | https://github.com/ConesaLab/SQANTI3 |
| SUPPA2 (v.2.3) | Trincado et al.143 | https://github.com/comprna/SUPPA |
| DRIMSeq (v.1.22.0) | Nowicka and Robinson144 | https://bioconductor.org/packages/release/bioc/html/DRIMSeq.html |
| ONT-Splice (v.1.0.0) | This paper | https://doi.org/10.5281/zenodo.8084364;https://github.com/landau-lab/ONT-sc-splice |