

Abstract
Introduction
Hypothyroidism is a rare and possible cause of hyponatremia. However, the clinical epidemiology and risk of mortality (ROM) when they coexist still remain elusive.
Objectives
We assessed the epidemiology and ROM among index patients with coexisting hypothyroidism and hyponatremia via a national population database.
Patients and methods
This retrospective cohort study utilized Taiwan’s National Health Insurance program database. Distributions of definite sociodemographic factors were analyzed. The annual incidence among the overall group and sex-subgroups was investigated. In addition, potential factors influencing the ROM were also evaluated.
Results
Of 4,549,226 patients from 1998 to 2015, a total of 3,140 index patients with concurrent hypothyroidism and hyponatremia were analyzed. The incidence rate increased tenfold from 1998 to 2015; average annual incidence rate was 174. Among the total participants, 57.1% were women; mean age was 72.6 ± 14.7 years and 88.8% were aged > 55 years. Although average length of stay (LOS) was 13.1 ± 15.4 days, the mortality group had significantly longer LOS than that in the survival group (12.9 days vs 22.2 days). Old age, catastrophic illness, cardiac dysrhythmia, and low hospital hierarchy were independent predictors of hospital mortality. The optimal LOS cutoff value for ROM prediction was 16 days. Index patients with LOS > 16 days increased ROM by 2.3-fold.
Conclusions
Coexistent hypothyroidism and hyponatremia is rare, although the incidence increased gradually. Factors influencing the ROM, such as old age, underlying catastrophic status, cardiac dysrhythmia, hospital hierarchy, and LOS should be considered in clinical care.
Supplementary Information
The online version contains supplementary material available at 10.1186/s12889-023-16791-5.
Keywords: Hypothyroidism, Hyponatremia, Mortality, Length of stay
Introduction
Hypothyroidism has been reported to be associated with severe hyponatremia, which can contribute to a high mortality rate [1, 2]. The main mechanisms of hypothyroidism causing profound hyponatremia included decreased cardiac output and reduced capacity of free water excretion due to increased antidiuretic hormone (ADH) levels [3–5]. A recent study found that hypothyroidism-induced hyponatremia is rather rare and probably occurs only in patients with severe hypothyroidism and myxedema coma [3]; however, distinct electrolyte dysregulation poses the risk of permanent or fatal neurologic sequelae in hospitalized patients. Thus, a comprehensive investigation of the epidemiology of coexistent hypothyroidism and hyponatremia is extremely important, not only to increase knowledge of this rare nephron-endocrinological disease, but also to investigate mortality predictors in such patients.
Patients with hyponatremia have a high risk of readmission and increased length of hospital stay (LOS), which emphasizes the clinical importance and public health impact of hyponatremia [6]. In addition, acute severe hyponatremia might contribute to serious neurological consequences due to cerebral edema, and it could be lethal if not recognized early as a concurrent curable disease [7]. The direct costs of treating hyponatremia in the USA range between $1.6 billion and $3.6 billion annually; [8] hospital costs per patient are $3000 higher in patients with hyponatremia than in those with normonatremia [9]. Although it is well known that the treatment of hyponatremia represents a significant healthcare burden worldwide, epidemiological studies of coexistent hypothyroidism are limited, especially in Asia. Crucially, prompt recognition of the risk of mortality (ROM) that might decrease the medical costs of hyponatremia in the inpatient setting could also minimize the burden associated with the concomitant disease. [8, 10–12]
To explicitly unravel this issue, we conducted a nationwide population-based study which aimed to comprehensively assess the epidemiology and ROM among patients with coexisting hypothyroidism and hyponatremia.
Methods
Data sources
The National Health Insurance (NHI) program began in Taiwan in 1995 and covers more than 99% of the entire population, with approximately 23 million beneficiaries [13]. This retrospective cohort study was conducted using inpatient files from the Taiwan NHI Research Database (NHIRD). Diagnostic codes based on the ICD-9-CM were retrieved from NHIRD [13, 14]. The ICD-9-CM codes of interested analytic diagnoses were included in the study group, such as hypo-osmolality and/or hyponatremia (ICD-9-CM 276.1) and unspecified acquired hypothyroidism (ICD-9-CM 244.9). In addition, patients with either known or newly diagnosed hypothyroidism were both eligible to be enrolled in this study. Other detailed information of the ICD-9-CM codes used in this study is provided in eTable 1 in the Supplement.
Ethical considerations
The NHIRD encrypts patients’ personal information for privacy and provides researchers with anonymous identification numbers associated with relevant claim information, including patients’ sex, dates of birth, medical services utilized, and prescriptions. Since all identifying personal information was stripped from the secondary files before analysis, patient consent was not required for accessing the NHIRD. The Ethics Committee of the Institutional Review Board of Tri-Service General Hospital, National Defense Medical Center approved this study (TSGHIRB No. B-111–17).
Study design and population
Inpatients simultaneously diagnosed with hyponatremia and hypothyroidism from January 1, 1998 to December 31, 2015 were selected from the NHIRD. Data from the “detailed documents of hospitalization medical expenses” and “registry for contracted medical facilities” were extracted from the NHIRD. The index date was defined as the date when the patients were first diagnosed with hypothyroidism or hyponatremia. The exclusion criteria were as follows: (1) hypothyroidism before the index date; (2) hyponatremia before tracking; (3) hyponatremia but without hypothyroidism and vice-versa; (4) unknown age; (5) unknown sex.
Covariates
We examined sociodemographic factors, including age, monthly income, season, location of residence, urbanization level, and hospital level. The monthly income in terms of New Taiwan Dollars (NTD) was divided into two groups, namely < 18,000 (low-income) and ≥ 18,000 (not low-income). The impact of four seasons (spring, summer, autumn, and winter) on the epidemiology of hyponatremia and/or hypothyroidism was investigated. Patients living in different areas of Taiwan, including northern, middle, southern, and eastern Taiwan, as well as the outlet islands, were compared. The patients’ habitats were categorized into four urbanization levels from the highest (1) to the lowest (4) according to the population of the region (level 1: population more than 1,250,000; level 2: population more than 500,000 but less than 1,250,000; level 3: population more than 100,000 but less than 500,000; level 4: population less than 100,000). Three levels for hospitals where the patients sought medical attention were considered, namely medical centers, regional hospitals, and local hospitals.
Comorbidities
The baseline comorbidity history included diabetes mellitus (DM; ICD‐9‐CM 250), disorders of adrenal glands (ICD‐9‐CM 255), endocrine dysfunction (ICD‐9‐CM 258.1), hypertension (HTN; ICD‐9‐CM 401–405), ischemic heart disease (IHD; ICD‐9‐CM 410–414), heart failure (HF; ICD‐9‐CM 428), chronic kidney disease (CKD; ICD‐9‐CM 585), chronic obstructive pulmonary disease (COPD; ICD‐9‐CM 490–496), asthma (ICD‐9‐CM 493), mental disorders (ICD‐9‐CM 290–319), diseases of the nervous system (ICD‐9‐CM 320–389), cardiac dysrhythmias (ICD‐9‐CM 427), benign prostatic hypertrophy (BPH; ICD‐9‐CM 600.00), cardiomyopathy (ICD‐9‐CM 425), sickle-cell disease (ICD‐9‐CM 282.60), and liver cirrhosis (ICD‐9‐CM 571). These comorbidities were included in the models as categorical variables.
Main outcome measures
All participants with hypothyroidism were followed from the index date until the onset of hyponatremia, as recorded in the NHIRD. Distributions of definite sociodemographic factors, including age, residential geographic area, inpatient season, catastrophic illness (with, without), and low-income household (with, without) were analyzed. The annual incidence for the overall group and sex-subgroups was investigated. In addition, the potential factors influencing the ROM were thoroughly evaluated among survival and mortality groups.
Statistical analyses
The chi-square test was used to analyze differences between the categorical variables. Fisher’s exact test was used to evaluate differences between the survival and mortality groups. Continuous variables were compared using a one-way analysis of variance. Logistic regression model analysis was used to assess the odds ratio (OR) of mortality in index patients after adjusting for appropriate covariates, and the data were expressed as adjusted OR with a 95% confidence interval (CI). All statistical analyses were performed using SPSS software v.22.0 (SPSS, Chicago, IL), and P < 0.05 was considered to be statistically significant.
Results
Study population
Among the 4,549,226 hospitalized patients (eFigure 1), we identified 354,134 patients with a diagnosis of hypo-osmolality/hyponatremia from 1998 to 2015 in Taiwan (eTable 2). Among them, 3,142 study participants (0.89%) were simultaneously diagnosed to have developed hypothyroidism. After excluding patients with unknown age and sex, 3,140 index patients were finally analyzed (eFigure 1). During the period of 18 years, the average incidence was 174 affected patients per year.
Demographic characteristics of the study population
In patients with coexisting hypothyroidism and hyponatremia, the proportion of females was greater than that of males (57.1% vs 42.8%). The mean age of study participants was 72.6 ± 14.7 years, and the proportion of patients aged > 55 years was 88.9% (Table 1). The proportion of patients from low-income households was 2.4%. The proportion of patients with a catastrophic illness was 15.3% [15]. Although no difference in the hospitalization rate was noted among the four seasons, a higher proportion of patients were living in northern Taiwan (39.9%) and the city (76.1%, levels 1 and 2). Regarding the medical care system, a higher proportion of patients sought medical treatment at a regional hospital (45.8%). Patients with surgery accounted for 4.27%, the average hospital LOS was 13.1 ± 15.4 days, and medical expenses were 58 211 NTD on average.
Table 1.
Characteristics of index patients with coexistent hypothyroidism and hyponatremia
| Characteristics | Total | Survive | Mortality | P-value | |||
|---|---|---|---|---|---|---|---|
| n | % | n | % | n | % | ||
| Overall | 3,140 | 3,069 | 97.74 | 71 | 2.26 | ||
| Gender | 0.717 | ||||||
| Male | 1,346 | 42.87 | 1,314 | 42.82 | 32 | 45.07 | |
| Female | 1,794 | 57.13 | 1,755 | 57.18 | 39 | 54.93 | |
| Age (yrs) | 72.58 ± 14.73 | 72.42 ± 14.77 | 79.71 ± 10.48 | <0.001 | |||
| Age group (yrs) | 0.013 | ||||||
| 0–4 | 9 | 0.29 | 9 | 0.29 | 0 | 0.00 | |
| 5–14 | 13 | 0.41 | 13 | 0.42 | 0 | 0.00 | |
| 15–24 | 13 | 0.41 | 13 | 0.42 | 0 | 0.00 | |
| 25–34 | 44 | 1.40 | 44 | 1.43 | 0 | 0.00 | |
| 35–44 | 66 | 2.10 | 66 | 2.15 | 0 | 0.00 | |
| 45–54 | 205 | 6.53 | 204 | 6.65 | 1 | 1.41 | |
| 55–64 | 417 | 13.28 | 411 | 13.39 | 6 | 8.45 | |
| 65–74 | 731 | 23.28 | 717 | 23.36 | 14 | 19.72 | |
| 75–84 | 1,093 | 34.81 | 1,068 | 34.80 | 25 | 35.21 | |
| ≧85 | 549 | 17.48 | 524 | 17.07 | 25 | 35.21 | |
| Low-income | 0.575 | ||||||
| Without | 3,064 | 97.58 | 2,994 | 97.56 | 70 | 98.59 | |
| With | 76 | 2.42 | 75 | 2.44 | 1 | 1.41 | |
| Catastrophic illness | <0.001 | ||||||
| Without | 2,660 | 84.71 | 2,613 | 85.14 | 47 | 66.20 | |
| With | 480 | 15.29 | 456 | 14.86 | 24 | 33.80 | |
| DM | 0.515 | ||||||
| Without | 2,628 | 83.69 | 2,566 | 83.61 | 62 | 87.32 | |
| With | 512 | 16.31 | 503 | 16.39 | 9 | 12.68 | |
| Disorders of adrenal glands | 0.225 | ||||||
| Without | 2,699 | 85.96 | 2,634 | 85.83 | 65 | 91.55 | |
| With | 441 | 14.04 | 435 | 14.17 | 6 | 8.45 | |
| Endocrine dysfunction | 0.879 | ||||||
| Without | 3,139 | 99.97 | 3,068 | 99.97 | 71 | 100.00 | |
| With | 1 | 0.03 | 1 | 0.03 | 0 | 0.00 | |
| HTN | <0.001 | ||||||
| Without | 2,513 | 80.03 | 2,445 | 79.67 | 68 | 95.77 | |
| With | 627 | 19.97 | 624 | 20.33 | 3 | 4.23 | |
| IHD | 0.802 | ||||||
| Without | 2,943 | 93.73 | 2,877 | 93.74 | 66 | 92.96 | |
| With | 197 | 6.27 | 192 | 6.26 | 5 | 7.04 | |
| HF | 0.068 | ||||||
| Without | 2,955 | 94.11 | 2,892 | 94.23 | 63 | 88.73 | |
| With | 185 | 5.89 | 177 | 5.77 | 8 | 11.27 | |
| CKD | 0.555 | ||||||
| Without | 3,001 | 95.57 | 2,934 | 95.60 | 67 | 94.37 | |
| With | 139 | 4.43 | 135 | 4.40 | 4 | 5.63 | |
| COPD | 0.376 | ||||||
| Without | 2,883 | 91.82 | 2,820 | 91.89 | 63 | 88.73 | |
| With | 257 | 8.18 | 249 | 8.11 | 8 | 11.27 | |
| Asthma | 0.395 | ||||||
| Without | 3,109 | 99.01 | 3,038 | 98.99 | 71 | 100.00 | |
| With | 31 | 0.99 | 31 | 1.01 | 0 | 0.00 | |
| Mental disorders | 0.321 | ||||||
| Without | 2,945 | 93.79 | 2,876 | 93.71 | 69 | 97.18 | |
| With | 195 | 6.21 | 193 | 6.29 | 2 | 2.82 | |
| Disorder of thyroid | - | ||||||
| Without | 3,140 | 100.00 | 3,069 | 100.00 | 71 | 100.00 | |
| With | 0 | 0.00 | 0 | 0.00 | 0 | 0.00 | |
| Diseases of the nervous system | 0.796 | ||||||
| Without | 2,755 | 87.74 | 2,692 | 87.72 | 63 | 88.73 | |
| With | 385 | 12.26 | 377 | 12.28 | 8 | 11.27 | |
| Cardiac dysrhythmias | 0.022 | ||||||
| Without | 2,985 | 95.06 | 2,922 | 95.21 | 63 | 88.73 | |
| With | 155 | 4.94 | 147 | 4.79 | 8 | 11.27 | |
| BPH | 0.625 | ||||||
| Without | 3,097 | 98.63 | 3,026 | 98.60 | 71 | 100.00 | |
| With | 43 | 1.37 | 43 | 1.40 | 0 | 0.00 | |
| Cardiomyopathy | 0.761 | ||||||
| Without | 3,136 | 99.87 | 3,065 | 99.87 | 71 | 100.00 | |
| With | 4 | 0.13 | 4 | 0.13 | 0 | 0.00 | |
| Sickle-cell disease | - | ||||||
| Without | 3,140 | 100.00 | 3,069 | 100.00 | 71 | 100.00 | |
| With | 0 | 0.00 | 0 | 0.00 | 0 | 0.00 | |
| Liver cirrhosis | 0.627 | ||||||
| Without | 3,092 | 98.47 | 3,021 | 98.44 | 71 | 100.00 | |
| With | 48 | 1.53 | 48 | 1.56 | 0 | 0.00 | |
| Operations on bone marrow and spleen | 0.792 | ||||||
| Without | 3,137 | 99.90 | 3,066 | 99.90 | 71 | 100.00 | |
| With | 3 | 0.10 | 3 | 0.10 | 0 | 0.00 | |
| Season | 0.306 | ||||||
| Spring (Mar-May) | 729 | 23.22 | 713 | 23.23 | 16 | 22.54 | |
| Summer (Jun-Aug) | 762 | 24.27 | 745 | 24.28 | 17 | 23.94 | |
| Autumn (Sep-Nov) | 812 | 25.86 | 799 | 26.03 | 13 | 18.31 | |
| Winter (Dec-Feb) | 837 | 26.66 | 812 | 26.46 | 25 | 35.21 | |
| Location | 0.448 | ||||||
| Northern Taiwan | 1,254 | 39.94 | 1,227 | 39.98 | 27 | 38.03 | |
| Middle Taiwan | 785 | 25.00 | 764 | 24.89 | 21 | 29.58 | |
| Southern Taiwan | 937 | 29.84 | 916 | 29.85 | 21 | 29.58 | |
| Eastern Taiwan | 149 | 4.75 | 148 | 4.82 | 1 | 1.41 | |
| Outlets islands | 15 | 0.48 | 14 | 0.46 | 1 | 1.41 | |
| Urbanization level | 0.184 | ||||||
| 1 (The highest) | 986 | 31.40 | 969 | 31.57 | 17 | 23.94 | |
| 2 | 1,403 | 44.68 | 1,372 | 44.71 | 31 | 43.66 | |
| 3 | 199 | 6.34 | 195 | 6.35 | 4 | 5.63 | |
| 4 (The lowest) | 552 | 17.58 | 533 | 17.37 | 19 | 26.76 | |
| Level of care | <0.001 | ||||||
| Hospital center | 1,164 | 37.07 | 1,148 | 37.41 | 16 | 22.54 | |
| Regional hospital | 1,437 | 45.76 | 1,407 | 45.85 | 30 | 42.25 | |
| Local hospital | 539 | 17.17 | 514 | 16.75 | 25 | 35.21 | |
| Surgery | 0.769 | ||||||
| Without | 3,006 | 95.73 | 2,937 | 95.70 | 69 | 97.18 | |
| With | 134 | 4.27 | 132 | 4.30 | 2 | 2.82 | |
| Length of stay (days) | 13.14 ± 15.41 | 12.93 ± 14.52 | 22.25 ± 36.24 | <0.001 | |||
| Length of days groups | 0.010 | ||||||
| ≦30 | 2,899 | 92.32 | 2,840 | 92.54 | 59 | 83.10 | |
| > 30 | 241 | 7.68 | 229 | 7.46 | 12 | 16.90 | |
| Medical cost (NT$) | 58,211.36 ± 91,002.51 | 56,972.80 ± 88,847.38 | 111,748.15 ± 149,710.89 | <0.001 | |||
| Repeated inpatient | 0.370 | ||||||
| Without | 2,731 | 86.97 | 2,672 | 87.06 | 59 | 83.10 | |
| With | 409 | 13.03 | 397 | 12.94 | 12 | 16.90 | |
p-value (categorical variable: Chi-square test/Fisher’s exact test; continuous variable: t-test)
Demographic characteristics between survival and mortality subgroups
The index patients were classified into survival (n = 3,069) and mortality (n = 71) subgroups (Table 1). In particular, there was a significant difference in age between these two groups (72.4 years vs 79.1 years; P < 0.001). Moreover, patients aged < 45 years were not observed in the mortality group. The proportion of those experiencing catastrophic illness was significantly higher in the mortality group (14.9% vs 33.8%). Although the proportion of the survival group having HTN (20.3%) was significantly higher than that of the mortality group, the latter had an increased proportion of cardiac dysrhythmia (4.8% vs 11.3%; P = 0.022). Considering the hospital hierarchy, the proportion of patients seeking medical treatment at a local hospital (lowest level) was higher in the mortality group (16.8% vs 35.2%, P < 0.001). Compared to the survival group, the mortality group had a significantly longer LOS (12.9 days vs 22.2 days; P < 0.001) and the distinct proportions of LOS > 30 days (7.5% vs 16.9%, P = 0.010). In addition, the mortality group had significantly higher expenditures (56,972 NTD vs 111,748 NTD; P < 0.001).
Risk of mortality in index patients stratified by covariates
Patients aged ≥ 85 years had a higher ROM than those aged 45–84 years after adjusting for the variables listed in Table 2 (all P < 0.05), indicating that old age might be a contributory factor in the mortality of patients with coexisting hypothyroidism and hyponatremia. In addition, the ROM due to catastrophic illness was 3.9 times more than that of non-catastrophic illness (P < 0.001). Notably, the index patients with underlying HTN depicted decreased ROM (0.2-fold, P = 0.007), but those with cardiac dysrhythmia showed 2.1 times increased ROM than those without (P = 0.078). After adjusting for variables, comorbidities such as DM, disorders of adrenal glands, endocrine dysfunction, IHD, HF, CKD, COPD, asthma, mental disorders, diseases of the nervous system, BPH, cardiomyopathy, sickle-cell disease, and liver cirrhosis did not contribute to the ROM.
Table 2.
Logistic regression analysis of factors influencing mortality among index patients
| Variables | Crude OR | 95% CI | 95% CI | P-value | Adjusted OR | 95% CI | 95% CI | P-value |
|---|---|---|---|---|---|---|---|---|
| Gender | ||||||||
| Male | 1.096 | 0.683 | 1.759 | 0.704 | 0.908 | 0.547 | 1.508 | 0.709 |
| Female | Reference | Reference | ||||||
| Age group (yrs) | ||||||||
| 0–4 | 0.000 | - | - | 0.999 | 0.000 | - | - | 0.999 |
| 5–14 | 0.000 | - | - | 0.999 | 0.000 | - | - | 0.999 |
| 15–24 | 0.000 | - | - | 0.999 | 0.000 | - | - | 0.999 |
| 25–34 | 0.000 | - | - | 0.998 | 0.000 | - | - | 0.997 |
| 35–44 | 0.000 | - | - | 0.997 | 0.000 | - | - | 0.997 |
| 45–54 | 0.103 | 0.014 | 0.763 | 0.026 | 0.074 | 0.010 | 0.576 | 0.013 |
| 55–64 | 0.306 | 0.124 | 0.753 | 0.010 | 0.231 | 0.088 | 0.606 | 0.003 |
| 65–74 | 0.409 | 0.211 | 0.795 | 0.008 | 0.356 | 0.175 | 0.726 | 0.005 |
| 75–84 | 0.491 | 0.279 | 0.863 | 0.013 | 0.445 | 0.246 | 0.803 | 0.007 |
| ≧85 | Reference | Reference | ||||||
| Low-income | 300 | |||||||
| Without | Reference | Reference | ||||||
| With | 0.570 | 0.078 | 4.160 | 0.580 | 0.821 | 0.101 | 6.637 | 0.853 |
| Catastrophic illness | ||||||||
| Without | Reference | Reference | ||||||
| With | 2.926 | 1.772 | 4.832 | <0.001 | 3.912 | 2.170 | 7.052 | <0.001 |
| DM | ||||||||
| Without | Reference | Reference | ||||||
| With | 0.741 | 0.366 | 1.500 | 0.404 | 0.989 | 0.472 | 2.073 | 0.977 |
| Disorders of adrenal glands | ||||||||
| Without | Reference | Reference | ||||||
| With | 0.559 | 0.241 | 1.298 | 0.176 | 0.865 | 0.359 | 2.085 | 0.746 |
| Endocrine dysfunction | ||||||||
| Without | Reference | Reference | ||||||
| With | 0.000 | - | - | 0.999 | 0.000 | - | - | 0.999 |
| HTN | ||||||||
| Without | Reference | Reference | ||||||
| With | 0.173 | 0.054 | 0.551 | 0.003 | 0.198 | 0.061 | 0.640 | 0.007 |
| IHD | ||||||||
| Without | Reference | Reference | ||||||
| With | 1.135 | 0.452 | 2.851 | 0.787 | 1.029 | 0.395 | 2.679 | 0.953 |
| HF | ||||||||
| Without | Reference | Reference | ||||||
| With | 2.075 | 0.979 | 4.397 | 0.057 | 1.620 | 0.733 | 3.581 | 0.233 |
| CKD | ||||||||
| Without | Reference | Reference | ||||||
| With | 1.298 | 0.466 | 3.611 | 0.618 | 1.438 | 0.495 | 4.181 | 0.505 |
| COPD | ||||||||
| Without | Reference | Reference | ||||||
| With | 1.438 | 0.681 | 3.035 | 0.340 | 1.041 | 0.469 | 2.307 | 0.922 |
| Asthma | ||||||||
| Without | Reference | Reference | ||||||
| With | 0.000 | - | - | 0.998 | 0.000 | - | - | 0.998 |
| Mental disorders | ||||||||
| Without | Reference | Reference | ||||||
| With | 0.432 | 0.105 | 1.775 | 0.244 | 0.453 | 0.107 | 1.914 | 0.281 |
| Diseases of the nervous system | ||||||||
| Without | Reference | Reference | ||||||
| With | 0.907 | 0.431 | 1.907 | 0.796 | 1.054 | 0.486 | 2.286 | 0.893 |
| Cardiac dysrhythmias | ||||||||
| Without | Reference | Reference | ||||||
| With | 2.524 | 1.187 | 5.365 | 0.016 | 2.066 | 0.921 | 4.636 | 0.078 |
| BPH | ||||||||
| Without | Reference | Reference | ||||||
| With | 0.000 | - | - | 0.998 | 0.000 | - | - | 0.998 |
| Cardiomyopathy | ||||||||
| Without | Reference | Reference | ||||||
| With | 0.000 | - | - | 0.999 | 0.000 | - | - | 0.999 |
| Sickle-cell disease | ||||||||
| Without | Reference | Reference | ||||||
| With | - | - | - | - | - | - | - | - |
| Liver cirrhosis | ||||||||
| Without | Reference | Reference | ||||||
| With | 0.000 | - | - | 0.998 | 0.000 | - | - | 0.997 |
| Operations on bone marrow and spleen | ||||||||
| Without | Reference | Reference | ||||||
| With | 0.000 | - | - | 0.999 | 0.000 | - | - | 0.999 |
| Season | ||||||||
| Spring (Mar-May) | Reference | Reference | ||||||
| Summer (Jun-Aug) | 1.017 | 0.510 | 2.028 | 0.962 | 0.925 | 0.453 | 1.890 | 0.831 |
| Autumn (Sep-Nov) | 0.725 | 0.346 | 1.518 | 0.394 | 0.694 | 0.324 | 1.487 | 0.347 |
| Winter (Dec-Feb) | 1.372 | 0.727 | 2.590 | 0.329 | 1.409 | 0.730 | 2.719 | 0.307 |
| Location | Multicollinearity with urbanization level | |||||||
| Northern Taiwan | Reference | Multicollinearity with urbanization level | ||||||
| Middle Taiwan | 1.249 | 0.701 | 2.225 | 0.450 | Multicollinearity with urbanization level | |||
| Southern Taiwan | 1.042 | 0.585 | 1.855 | 0.889 | Multicollinearity with urbanization level | |||
| Eastern Taiwan | 0.307 | 0.041 | 2.276 | 0.248 | Multicollinearity with urbanization level | |||
| Outlets islands | 3.246 | 0.412 | 25.578 | 0.264 | Multicollinearity with urbanization level | |||
| Urbanization level | ||||||||
| 1 (The highest) | 0.492 | 0.254 | 0.955 | 0.036 | 0.739 | 0.341 | 1.604 | 0.445 |
| 2 | 0.634 | 0.355 | 1.132 | 0.123 | 0.848 | 0.452 | 1.593 | 0.609 |
| 3 | 0.575 | 0.193 | 1.713 | 0.321 | 0.689 | 0.224 | 2.124 | 0.517 |
| 4 (The lowest) | Reference | Reference | ||||||
| Level of care | ||||||||
| Medical center | 0.287 | 0.152 | 0.541 | <0.001 | 0.344 | 0.162 | 0.734 | 0.006 |
| Regional hospital | 0.438 | 0.255 | 0.752 | 0.003 | 0.529 | 0.295 | 0.948 | 0.032 |
| Local hospital | Reference | Reference | ||||||
| Surgery | ||||||||
| Without | Reference | Reference | ||||||
| With | 0.645 | 0.156 | 2.659 | 0.544 | 0.766 | 0.177 | 3.310 | 0.721 |
| Length of stay (days) | 1.018 | 1.010 | 1.026 | <0.001 | 1.009 | 0.998 | 1.020 | 0.099 |
| Medical cost (NT$) | 1.000 | 1.000 | 1.000 | 0.001 | Multicollinearity with length of days | |||
| Repeated inpatient | ||||||||
| Without | Reference | Reference | ||||||
| With | 1.369 | 0.729 | 2.569 | 0.328 | 0.980 | 0.452 | 2.127 | 0.959 |
Adjusted OR: Adjusted Odds Ratio; CI confidence interval
Adjusted OR: adjusted all variables listed in the above table
Nagelkerke R-square of adjusted model = 0.160
Location of inpatients had multicollinearity with urbanization level
Medical cost had multicollinearity with length of days
Although urbanization did not precipitate the ROM, the patients cared for in local hospitals posed a higher ROM than those in regional hospitals or hospital centers (P = 0.006 and P = 0.032, respectively). Furthermore, the factors regarding LOS and medical costs did not increase the ROM after adjusting for variables.
The changing trend of incidence rate among index patients
eFigure 2 shows the trend of the occurrence among index patients during the follow-up period. Overall, the incidence rate of index patients increased approximately tenfold from 0.14 per 105 population in 1998 to 1.46 per 105 population in 2015 (Table 3). Regarding sex, the incidence in female patients increased 8.5-fold from 0.18 per 105 population in 1998 to 1.54 per 105 population in 2015. Even though the incidence rate in male patients increased by 13.7-fold between 1998 and 2015, the changing trend of incidence rate was steadily higher in females than males during the follow-up period.
Table 3.
Trend of the incidence rate of index patients
| Overall | Male | Female | |||||||
|---|---|---|---|---|---|---|---|---|---|
| Year | Inpatients | Mid-year population | Rate (per 105) | Inpatients | Mid-year population | Rate (per 105) | Inpatients | Mid-year population | Rate (per 105) |
| 1998 | 30 | 21,928,591 | 0.14 | 11 | 11,243,408 | 0.10 | 19 | 10,685,183 | 0.18 |
| 1999 | 35 | 22,092,387 | 0.16 | 13 | 11,312,728 | 0.11 | 22 | 10,779,659 | 0.20 |
| 2000 | 58 | 22,276,672 | 0.26 | 20 | 11,392,050 | 0.18 | 38 | 10,884,622 | 0.35 |
| 2001 | 67 | 22,405,568 | 0.30 | 27 | 11,441,651 | 0.24 | 40 | 10,963,917 | 0.36 |
| 2002 | 92 | 22,520,776 | 0.41 | 38 | 11,485,409 | 0.33 | 54 | 11,035,367 | 0.49 |
| 2003 | 102 | 22,604,550 | 0.45 | 42 | 11,515,062 | 0.36 | 60 | 11,089,488 | 0.54 |
| 2004 | 118 | 22,689,122 | 0.52 | 45 | 11,541,585 | 0.39 | 73 | 11,147,537 | 0.65 |
| 2005 | 134 | 22,770,383 | 0.59 | 50 | 11,562,440 | 0.43 | 84 | 11,207,943 | 0.75 |
| 2006 | 158 | 22,876,527 | 0.69 | 66 | 11,591,707 | 0.57 | 92 | 11,284,820 | 0.82 |
| 2007 | 177 | 22,958,360 | 0.77 | 72 | 11,608,767 | 0.62 | 105 | 11,349,593 | 0.93 |
| 2008 | 198 | 23,037,031 | 0.86 | 86 | 11,626,351 | 0.74 | 112 | 11,410,680 | 0.98 |
| 2009 | 227 | 23,119,772 | 0.98 | 98 | 11,636,734 | 0.84 | 129 | 11,483,038 | 1.12 |
| 2010 | 240 | 23,162,123 | 1.04 | 109 | 11,635,225 | 0.94 | 131 | 11,526,898 | 1.14 |
| 2011 | 268 | 23,224,912 | 1.15 | 118 | 11,645,674 | 1.01 | 150 | 11,579,238 | 1.30 |
| 2012 | 279 | 23,315,822 | 1.20 | 121 | 11,673,319 | 1.04 | 158 | 11,642,503 | 1.36 |
| 2013 | 297 | 23,373,517 | 1.27 | 128 | 11,684,674 | 1.10 | 169 | 11,688,843 | 1.45 |
| 2014 | 318 | 23,433,753 | 1.36 | 142 | 11,697,971 | 1.21 | 176 | 11,735,782 | 1.50 |
| 2015 | 342 | 23,492,074 | 1.46 | 160 | 11,712,047 | 1.37 | 182 | 11,780,027 | 1.54 |
| Overall | 3,140 | 411,281,940 | 0.76 | 1,346 | 208,006,802 | 0.65 | 1,794 | 203,275,138 | 0.88 |
The annual percentage change (APC) was significantly noted in both sexes (male APC = 15.84, P < 0.001; female APC = 12.86, P < 0.001). Overall APC was 14.11, which also showed statistical significance (P < 0.001) (data not shown).
The trend of the mortality rate and cut-off value of LOS
In males, the peak mortality rate of index patients was 7.14% in 2003, and mildly increased mortality was noted from 2008 to 2013 (eTable 3 and Fig. 1). In contrast, female patients had the highest mortality rate of 4.43% in 2012 and a steady mortality rate between 2012 and 2015. In addition, the trend of the overall mortality rate was similar to that of the female mortality rate.
Fig. 1.

Trend of proportional mortality in index patients. Trend test (Joinpoint regression): Total: increase significantly, APC (Annual percentage change) = 7.79, P = 0.038. Male: increase slightly, APC = 157.32, P = 0.113. Female: increase significantly, APC = 239.34, P = 0.031
Using the receiver operating characteristic (ROC) curve, we demonstrated that the optimal cut-off value (CoV) of LOS to predict the increased ROM was 16 days. The area under the ROC curves were 0.658 (95% CI: 0.579–0.736; P = 0.026) (eTable 4 and Fig. 2). In addition, index patients with long hospital LOS of > 16 days showed 2.3-fold increased ROM (≤ 16 days: 1.74%; > 16 days: 4.02%) (eTable 5).
Fig. 2.
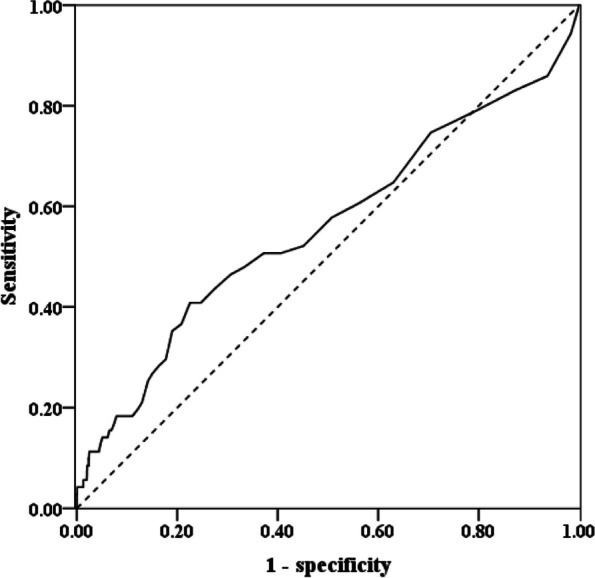
The optimal CoV of LOS to predict mortality by ROC curve. AUC (Area under the curve) = 0.658, 95% CI: 0.579—0.736, P = 0.026. The fitness cut-point of LOS: 16 days. CoV: cut-off value; LOS: length of hospital stay; ROC: receiver operating characteristic
Discussion
Summary of important results
To our knowledge, this is the first nationwide population-based study investigating the epidemiology of coexisting hypothyroidism and hyponatremia. Our results showed that < 1% of hyponatremia in patients was caused by hypothyroidism, and the average incidence was < 200 index patients per year, echoing the notion of rare coexistence. Females and those aged > 55 years accounted for the majority of index patients. Besides old age, clinical parameters such as underlying catastrophic illness, cardiac dysrhythmia, and treatment at a local hospital increased the ROM. Notably, the optimal CoV of LOS to predict the high ROM was first elucidated in this study, and the hospital LOS of > 16 days increased the ROM by 2.3-fold. Despite uncommon concurrence, the overall incidence rate of index patients increased approximately tenfold within 18 years. In accordance with thyroid dysfunction being common in women [16], the changing trend of incidence rate was steadily higher in females than males. The trend of the overall mortality rate was also similar to that of the female mortality rate. Taken together, our study not only increases the knowledge of epidemiology between hypothyroidism and hyponatremia but also clarifies the ROM parameters in these two concomitant diseases.
Rare concurrence and low annual incidence
It has been reported that the frequency of hyponatremia was not different between adults with hypothyroidism and euthyroid controls [17] as well as between infants with congenital hypothyroidism and age-matched controls [18]. Recently, Krebs et al. reported that the prevalence of hyponatremia in patients with hypothyroidism was only 5.58%, and the association between thyroid function and serum sodium (Na+) concentrations was very weakly positive [16], suggesting that patients with hypothyroidism having moderate to severe hyponatremia often exhibited other underlying diseases concerning low Na+ values. Likewise, our large computerized database also confirmed this rarity of concurrence. In contrast, hypothyroidism-induced hyponatremia may be attributed to multiple mechanisms such as the combination of compartmental redistribution and water retention dilution of serum electrolytes (eg, increased ADH levels) [19] as well as a chronic dietary salt deficit [20]. Moreover, assessment of hyponatremia relies on estimating fluid volume, and this might be problematic because differentiating hypovolemia from euvolemia could sometimes be difficult in clinical practice [21]. Due to these constraints, the estimated prevalence of hyponatremia varies from 4 to 35%, given the diverse study designs [22, 23]. Even though the aforementioned difficulty led to the poor unraveling of the precise prevalence and the pathogenesis of hypothyroidism underpinning hyponatremia, our study took advantage of a large-scale study population to reduce recall and selection bias, demonstrating the uncommon concomitance and low annual incidence.
Predictors of ROM in index patients
Despite the infrequent concurrence, hyponatremia per se is the most common electrolyte disorder for acute or chronic illnesses, commonly affecting older individuals [24, 25]. Furthermore, hyponatremia is associated with increased mortality and adverse outcomes, and it may also be deteriorated by hypothyroidism [20, 22]. Nevertheless, studies investigating the parameters of ROM among patients with the coexistence of hyponatremia and hypothyroidism are limited, especially in Asia. From this viewpoint, our results constructively show that the factors accentuating ROM in these patients include old age, catastrophic illness, cardiac dysrhythmia, and medical management in low hierarchical hospitals. Moreover, arrhythmia rather than HTN is an important factor of ROM. In support of this finding, Yilmaz et al. have reported that hyponatremia is independently associated with the occurrence of atrial fibrillation [26], which has a predilection for cardiac death.
Increased overall annual incidence with female predominance
A previous study revealed that no sex predilection exists for hyponatremia, but hyponatremic symptoms are more likely to occur in young women [27]. In addition, thyroid disease is 10 times more common in females than in males [28, 29]. In accordance with the thyroid disorder, our study showed that the female index patients had a higher incidence rate than male patients, and the trend of the overall mortality rate was similar to that of the female mortality rate. Furthermore, the number of index patients became obvious since 2009, which might imply the increased recognition of concurrent hypothyroidism and hyponatremia [3, 16, 30–32]. Wolf et al. reported that co-occurrence of hyponatremia and hypothyroidism was not likely to be causal because, in patients with serum Na+ levels < 130 mmol/L, hyponatremia could not be attributed to impaired thyroid function [16]. In contrast, a retrospective cross-sectional study showed that the prevalence of overt hypothyroidism was significantly higher as the severity of hyponatremia progressed [31]. Although hypothyroidism has historically been implicated in the development of hyponatremia [33], this paradigm has been challenged, and it has been suggested that the link might merely be an association [30, 34]. Although our results showed an increased trend of annual incidence and the propensity for female patients when two diseases coexisted, the fact of < 200 index patients per year might also indicate that the causality was less likely. However, a large-scale prospective study is still necessary to clarify the issue as to whether this is a true causal relationship or mere coincidence.
Strengths and limitations
This study had certain limitations. Firstly, socioeconomic (eg, educational level, occupation) and environmental factors, as well as biochemistry and endocrine parameters (eg, serum electrolyte, thyroid hormones/antibodies, and ADH), were not available in the NHIRD [35], thus it was unable to evaluate the severity of hypothyroidism or hyponatremia according to serum sodium, T3, T4, free T4, and thyroid-stimulating hormone levels. Secondly, this retrospective study lacked information regarding imaging and medical management during hospitalization, which may interfere with the analysis of mortality outcomes. Thirdly, some medical history associated with potential alternative causes and superimposed factors of hyponatremia, such as side effects of medication, concomitant underlying disease (proximal tubular dysfunction), or other endocrine disorders (adrenal insufficiency), were lacking in the present study [16]. Despite these limitations, there is probably complete ascertainment of the diagnoses of hypothyroidism and hyponatremia using the highly representative computerized data file for each individual from the NHIRD (comprehensive population coverage), resulting in less possibility of recall and selection bias [13].
Conclusions
Hypothyroidism or hyponatremia per se is a common disease; however, their concurrence is rare, despite increasing annual incidence recently. In clinical care, factors such as old age, underlying catastrophic status, cardiac arrhythmia, low hospital hierarchy, and longer LOS significantly increased the ROM among the index patients. Our study findings have implications in improving the quality of care in geriatric patients. Early recognition of mortality predictors and optimal management of hypothyroidism behind severe hyponatremia is pivotal to prevent subsequent deleterious consequences of hyponatremia.
Supplementary Information
Additional file 1: eFigure 1. Flowchart for study patient selection from the NHIRD. eFigure 2. Trend of the incidence rate in index patients. eTable 1. Abbreviation and ICD-9-CM. eTable 2. Proportional of unspecified acquired hypothyroidism among hyposmolality/hyponatremia.eTable 3. Trend of proportional mortality in index patients. eTable 4. Sensitivity and specificity of ROC curve of LOS. eTable 5. The optimal CoV of LOS to predict mortality by ROC curve.
Acknowledgements
Not applicable.
Authors’ contributions
C.M. Lin had full access to all data in the study and takes responsibility for the integrity of the data and the accuracy of the data analysis.Concept and design: C.M. Lin, W.C. Chien.Acquisition, analysis, or interpretation of data: C.C. Liu, C.H. Chung, Y.C. Chen, F.C. Kuo, H.H. Fang, C.Y. Cheng, Y.X. Ding, C.H. Tien.Drafting of the manuscript: C.H. Chu.Critical revision of the manuscript for important intellectual content: All authors.Statistical analysis: C.H. Chung.Administrative, technical, or material support: C.H. Chu.Supervision: C.M. Lin.
Funding
This work was supported in part by grants from the National Science and Technology Council (grant number MOST 107–2314-B-016–064-MY3, MOST 110–2314-B-016–016-MY3, and NSTC 112-2314-B-016-032-MY3), the Research Fund of Tri-Service General Hospital (grand number TSGH-E-110187, TSGH-E-111196, TSGH-B-111018, and TSGH-E-112197), and the Teh-Tzer Study Group for Human Medical Research Foundation (grand number B1081003).
The funding organizations had no role in the design and conduct of the study; collection, management, analysis, and interpretation of the data; preparation, review or approval of the manuscript; and decision to submit the manuscript for publication.
Availability of data and materials
Data collected for the study and presented herein will be made available to others. Data will be organised in a data dictionary, and participant data will be de-identified. Related study documents, including the study protocol, and statistical analysis plan, will also be available. Data requests should be sent by email to the corresponding author (ming.sandra@msa.hinet.net).
Declarations
Ethics approval and consent to participate
The whole study was conducted in accordance with the ethical standards of the institutional and/or national research committee and with the 1964 Helsinki declaration and its later amendments or comparable ethical standards. The NHIRD encrypts patients’ personal information for privacy and provides researchers with anonymous identification numbers associated with relevant claim information, including patients’ sex, dates of birth, medical services utilized, and prescriptions. Since all identifying personal information was stripped from the secondary files before analysis, patient consent was not required for accessing the NHIRD. The Ethics Committee of the Institutional Review Board of Tri-Service General Hospital, National Defense Medical Center approved this study (TSGHIRB No. B-111–17).
Consent for publication
Not applicable.
Competing interests
The authors declare no competing interests.
Footnotes
Publisher’s Note
Springer Nature remains neutral with regard to jurisdictional claims in published maps and institutional affiliations.
References
- 1.Pettinger WA, Talner L, Ferris TF. Inappropriate secretion of antidiuretic hormone due to myxedema. N Engl J Med. 1965;272:3624. doi: 10.1056/NEJM196502182720707. [DOI] [PubMed] [Google Scholar]
- 2.Diker-Cohen T, Rozen-Zvi B, Yelin D, et al. Endocrinopathy-induced euvolemic hyponatremia. Intern Emerg Med. 2018;13:679–688. doi: 10.1007/s11739-018-1872-4. [DOI] [PubMed] [Google Scholar]
- 3.Liamis G, Filippatos TD, Liontos A, Elisaf MS. Management of endocrine disease: hypothyroidism-associated hyponatremia: mechanisms, implications and treatment. Eur J Endocrinol. 2017;176:R15–R20. doi: 10.1530/EJE-16-0493. [DOI] [PubMed] [Google Scholar]
- 4.Holmes EW, Jr, DiScala VA. Studies on the exaggerated natriuretic response to a saline infusion in the hypothyroid rat. J Clin Invest. 1970;49:1224–1236. doi: 10.1172/JCI106336. [DOI] [PMC free article] [PubMed] [Google Scholar]
- 5.Hanna FW, Scanlon MF. Hyponatraemia, hypothyroidism, and role of arginine-vasopressin. Lancet. 1997;350:755–756. doi: 10.1016/S0140-6736(05)62563-9. [DOI] [PubMed] [Google Scholar]
- 6.Al Mawed S, Pankratz VS, Chong K, Sandoval M, Roumelioti ME, Unruh M. Low serum sodium levels at hospital admission: Outcomes among 2.3 million hospitalized patients. PLoS One. 2018;13:e0194379. 10.1371/journal.pone.0194379 [DOI] [PMC free article] [PubMed]
- 7.Wall CR. Myxedema coma: diagnosis and treatment. Am Fam Physician. 2000;62:2485–2490. [PubMed] [Google Scholar]
- 8.Boscoe A, Paramore C, Verbalis JG. Cost of illness of hyponatremia in the United States. Cost Eff Resour Alloc. 2006;4:10. doi: 10.1186/1478-7547-4-10. [DOI] [PMC free article] [PubMed] [Google Scholar]
- 9.Corona G, Giuliani C, Parenti G, et al. The economic burden of hyponatremia: systematic review and meta-analysis. Am J Med. 2016;129:823–35.e4. doi: 10.1016/j.amjmed.2016.03.007. [DOI] [PubMed] [Google Scholar]
- 10.Seifert J, Letmaier M, Greiner T, et al. Psychotropic drug-induced hyponatremia: results from a drug surveillance program-an update. J Neural Transm (Vienna) 2021;128:1249–1264. doi: 10.1007/s00702-021-02369-1. [DOI] [PMC free article] [PubMed] [Google Scholar]
- 11.Jonklaas J, Bianco AC, Bauer AJ, et al. Guidelines for the treatment of hypothyroidism: prepared by the American thyroid association task force on thyroid hormone replacement. Thyroid. 2014;24:1670–1751. doi: 10.1089/thy.2014.0028. [DOI] [PMC free article] [PubMed] [Google Scholar]
- 12.Inouye SK, Studenski S, Tinetti ME, Kuchel GA. Geriatric syndromes: clinical, research, and policy implications of a core geriatric concept. J Am Geriatr Soc. 2007;55:780–791. doi: 10.1111/j.1532-5415.2007.01156.x. [DOI] [PMC free article] [PubMed] [Google Scholar]
- 13.Wu TY, Majeed A, Kuo KN. An overview of the healthcare system in Taiwan. London J Prim Care (Abingdon) 2010;3:115–119. doi: 10.1080/17571472.2010.11493315. [DOI] [PMC free article] [PubMed] [Google Scholar]
- 14.Iezzoni L. Using Administrative Diagnostic Data to Assess the Quality of Hospital Care: Pitfalls and Potential of ICD-9-CM. Int J Technol Assess Health Care. 1990;6(2):272–281. doi: 10.1017/S0266462300000799. [DOI] [PubMed] [Google Scholar]
- 15.Iglehart JK. Medicare's new benefits: "catastrophic" health insurance. N Engl J Med. 1989;320:329–335. doi: 10.1056/nejm198902023200536. [DOI] [PubMed] [Google Scholar]
- 16.Wolf P, Beiglbock H, Smaijs S, et al. Hypothyroidism and hyponatremia: rather coincidence than causality. Thyroid. 2017;27:611–615. doi: 10.1089/thy.2016.0597. [DOI] [PubMed] [Google Scholar]
- 17.Croal BL, Blake AM, Johnston J, Glen AC, O'Reilly DS. Absence of relation between hyponatraemia and hypothyroidism. Lancet. 1997;350:1402. doi: 10.1016/S0140-6736(05)65181-1. [DOI] [PubMed] [Google Scholar]
- 18.Asami T, Uchiyama M. Sodium handling in congenitally hypothyroid neonates. Acta Paediatr. 2004;93:22–24. doi: 10.1080/08035250310007259. [DOI] [PubMed] [Google Scholar]
- 19.Kimura T. Potential mechanisms of hypothyroidism-induced hyponatremia. Intern Med. 2000;39:1002–1003. doi: 10.2169/internalmedicine.39.1002. [DOI] [PubMed] [Google Scholar]
- 20.Ioannou P, Panagiotakis S, Tsagkaraki E, et al. Increased mortality in elderly patients admitted with hyponatremia: a prospective cohort study. J Clin Med. 2021;10:3059. doi: 10.3390/jcm10143059. [DOI] [PMC free article] [PubMed] [Google Scholar]
- 21.Roumelioti ME, Glew RH, Khitan ZJ, et al. Fluid balance concepts in medicine: principles and practice. World J Nephrol. 2018;7:1–28. doi: 10.5527/wjn.v7.i1.1. [DOI] [PMC free article] [PubMed] [Google Scholar]
- 22.Wald R, Jaber BL, Price LL, Upadhyay A, Madias NE. Impact of hospital-associated hyponatremia on selected outcomes. Arch Intern Med. 2010;170:294–302. doi: 10.1001/archinternmed.2009.513. [DOI] [PubMed] [Google Scholar]
- 23.Verbalis JG, Goldsmith SR, Greenberg A, et al. Diagnosis, evaluation, and treatment of hyponatremia: expert panel recommendations. Am J Med. 2013;126:S1–42. doi: 10.1016/j.amjmed.2013.07.006. [DOI] [PubMed] [Google Scholar]
- 24.Lu DY, Cheng HM, Cheng YL, et al. Hyponatremia and worsening sodium levels are associated with long-term outcome in patients hospitalized for acute heart failure. J Am Heart Assoc. 2016;5:e002668. doi: 10.1161/JAHA.115.002668. [DOI] [PMC free article] [PubMed] [Google Scholar]
- 25.Filippatos TD, Makri A, Elisaf MS, Liamis G. Hyponatremia in the elderly: challenges and solutions. Clin Interv Aging. 2017;12:1957–1965. doi: 10.2147/CIA.S138535. [DOI] [PMC free article] [PubMed] [Google Scholar]
- 26.Cavusoglu Y, Kaya H, Eraslan S, Yilmaz MB. Hyponatremia is associated with occurrence of atrial fibrillation in outpatients with heart failure and reduced ejection fraction. Hellenic J Cardiol. 2019;60:117–121. doi: 10.1016/j.hjc.2018.03.006. [DOI] [PubMed] [Google Scholar]
- 27.Kheetan M, Ogu I, Shapiro JI, Khitan ZJ. Acute and chronic hyponatremia. Front Med (Lausanne) 2021;8:693738. doi: 10.3389/fmed.2021.693738. [DOI] [PMC free article] [PubMed] [Google Scholar]
- 28.Manji N, Carr-Smith JD, Boelaert K, et al. Influences of age, gender, smoking, and family history on autoimmune thyroid disease phenotype. J Clin Endocrinol Metab. 2006;91:4873–4880. doi: 10.1210/jc.2006-1402. [DOI] [PubMed] [Google Scholar]
- 29.Chiovato L, Magri F, Carlé A. Hypothyroidism in context. Where we’ve been and where we’re going. Adv Ther. 2019; 36(Suppl 2):47–58. 10.1007/s12325-019-01080-8 [DOI] [PMC free article] [PubMed]
- 30.Pantalone KM, Hatipoglu BA. Hyponatremia and the thyroid. Causality or association? J Clin Med. 2014;4:32–6. 10.3390/jcm4010032 [DOI] [PMC free article] [PubMed]
- 31.Nagata T, Nakajima S, Fujiya A, Sobajima H, Yamaguchi M. Prevalence of hypothyroidism in patients with hyponatremia: a retrospective cross-sectional study. PLoS One. 2018;13:e0205687. doi: 10.1371/journal.pone.0205687. [DOI] [PMC free article] [PubMed] [Google Scholar]
- 32.Chaudhary N, Warraich F, Warraich Z, Warraich S, Anwer F. Effect of optimal thyroid replacement therapy on chronic hyponatremia with focused review of the evidence, mechanisms, and clinical implications. Cureus. 2019;11:e5813. doi: 10.7759/cureus.5813. [DOI] [PMC free article] [PubMed] [Google Scholar]
- 33.Agathis NT, Libman IM, Moritz ML. Hyponatremia due to severe primary hypothyroidism in an infant. Front Pediatr. 2015;3:96. doi: 10.3389/fped.2015.00096. [DOI] [PMC free article] [PubMed] [Google Scholar]
- 34.Warner MH, Holding S, Kilpatrick ES. The effect of newly diagnosed hypothyroidism on serum sodium concentrations: a retrospective study. Clin Endocrinol (Oxf) 2006;64:598–599. doi: 10.1111/j.1365-2265.2006.02489.x. [DOI] [PubMed] [Google Scholar]
- 35.Macaron C, Famuyiwa O. Hyponatremia of hypothyroidism: Appropriate suppression of antidiuretic hormone levels. Arch Intern Med. 1978;138:820–822. doi: 10.1001/archinte.1978.03630290100035. [DOI] [PubMed] [Google Scholar]
Associated Data
This section collects any data citations, data availability statements, or supplementary materials included in this article.
Supplementary Materials
Additional file 1: eFigure 1. Flowchart for study patient selection from the NHIRD. eFigure 2. Trend of the incidence rate in index patients. eTable 1. Abbreviation and ICD-9-CM. eTable 2. Proportional of unspecified acquired hypothyroidism among hyposmolality/hyponatremia.eTable 3. Trend of proportional mortality in index patients. eTable 4. Sensitivity and specificity of ROC curve of LOS. eTable 5. The optimal CoV of LOS to predict mortality by ROC curve.
Data Availability Statement
Data collected for the study and presented herein will be made available to others. Data will be organised in a data dictionary, and participant data will be de-identified. Related study documents, including the study protocol, and statistical analysis plan, will also be available. Data requests should be sent by email to the corresponding author (ming.sandra@msa.hinet.net).