

Abstract
The fraction of sp3-hybridized carbons (Fsp3) and the fraction of stereogenic carbons (FCstereo) are two widely employed scores of molecular complexity with strong links to biologically relevant features. However, they do not comprehensively express molecular topology, and they often do not match the chemical intuition of complexity. We propose the spacial score (SPS) as an empirical scoring system that builds upon the principle underlying Fsp3 and FCstereo and expresses the spacial complexity of a compound in a uniform manner on a highly granular scale. The size-normalized SPS (nSPS) can differentiate distributions of natural products and synthetic compounds and is applicable in the analysis of biological activity data. Analysis of the ChEMBL database revealed general trends of increasing selectivity and potency with increasing nSPS. SPS can also be used advantageously in planning and analysis of synthesis programs for direct comparison of chemical transformations and intermediates in reaction sequences.
Introduction
For the objective comparison of small structures, several indicators and descriptors have been devised which aim to express various characteristics of compounds, such as physicochemical properties, shape, topology, and total molecular complexity. Such indicators may be invaluable in synthesis planning and analysis of compound libraries.1 Complexity descriptors attempt to translate intuitive qualitative features describing a property into quantitative measures, and both individual intuitive features and complexity descriptors have their own biases. Additionally, a relationship between molecular complexity and biological activity was initially indicated by the theoretical model of Hann et al.2 and the experiments performed by Kuntz et al.,3 highlighting the importance of complexity indicators in medicinal chemistry. Thus, complexity metrics that not only match chemical intuition but also correlate to biological outcomes, such as target selectivity, are of particular value to the drug discovery community.
Two informative and powerful indicators of molecular shape complexity are the fraction of sp3-hybridized carbons (Fsp3) and the fraction of stereogenic carbons (FCstereo). The Fsp3 index, as defined by Lovering et al.,4 is a size-normalized measure where the number of sp3 carbons is divided by the total number of carbons in a given organic molecule:
| 1 |
Lovering et al. suggested that a higher fraction of saturation in molecules results in the coverage of more diverse structural space and improved potential to identify compounds with spacial complementarity matching the pockets of target proteins. An increase in Fsp3 can result in a higher architectural complexity of molecules without an increase in the number of heavy atoms by allowing access to a larger number of isomers and broader conformational diversity. It was proposed that a potential improvement in the three-dimensionality of molecules caused by an increase in saturation of the skeleton could result in greater selectivity and a decrease in off-target interactions. Thus, Lovering et al. showed a clear trend where compounds with a higher Fsp3 are more likely to succeed in advancing from the discovery stage to clinical trials and ultimately to yield marketed drugs.4 Subsequently, Lovering demonstrated that the promiscuity of compounds in different assays decreased as a function of Fsp3.5 This finding was later confirmed, and a trend of improvement in protein binding selectivity and frequency for compounds with higher proportions of sp3 carbons was recorded.6−8 As increasing specificity and selectivity typically reduce the likelihood of toxicity due to the minimization of off-target effects,9 an increase in Fsp3 of synthesized compounds could also result in a general reduction of toxicity.5
FCstereo is a size-independent score, defined as the number of stereogenic carbons divided by the total number of all carbons (eq 2). In the context of the FCstereo indicator, the stereogenic carbons are assumed to be carbons which are connected to four different groups:
| 2 |
Clemons et al.6 found that protein-binding frequency and selectivity increased for small molecules with intermediate proportions of stereogenic carbons, in comparison to compounds with very low and high stereogenic content, indicating FCstereo as an important score for consideration in designing screening libraries. These selectivity results are also supported by other reports noting an improvement of selectivity with the increase in stereochemical complexity.7,8
Various 3D descriptors correlate well with compound selectivity, observed solubility, and clinical success.7 However, a major drawback of calculating 3D descriptors is the necessity for accurate prediction of molecular conformations, which can pose a significant computational challenge and cost for the analysis of larger compound libraries.
A number of elaborate scoring systems has also been devised to express topological and total molecular complexity.10−23 However, arguably, the most popular general scoring system for molecular complexity has been introduced by Bertz,10 considering both the topological features of a molecular skeleton through the C(η) score calculated for subgraphs of a molecular graph and its elemental content via the C(E) component accounting for the presence of heteroatoms. The Bertz total molecular complexity index CT is then simply calculated through summation of the topological and the elemental diversity scores, where CT = C(η) + C(E). The Bertz complexity index is used as a molecular complexity measure for compound evaluation by Pubchem, a popular public repository of chemical information.24,25 Another exemplary complexity scoring system based on connectivity of subgraphs was proposed by Bonchev,11 resulting in two complexity indices, TC and TC1.
Complexity measures based on the analysis of substructures include, for instance, the empirical and intuitive system devised by Whitlock,16 which takes into consideration the number of alicyclic rings, non-aromatic unsaturations, heteroatoms, and stereogenic centers. Here the complexity score S is a sum of the appropriately weighted numbers of given components with no regard for the skeletal connectivity. A very similar approach and modification of Whitlock’s complexity system was presented by Barone and Chanon,17 who in their scoring index additionally account for the number of substituents and ring sizes. Complexity metrics based on other features include the score of Allu and Oprea18 relying on atomic electronegativities and bond parameters or the metric of von Korff and Sander19 calculating a fractal dimension of a molecule. Complexity focusing on the molecular shape can also be described by the Kappa shape indices through a comparison of the analyzed molecule to the extreme shapes for a structure with the same number of atoms.20 The Kappa indices are calculated with respect to a fully linear and fully connected structure, as well as to a star-shaped scaffold. The disadvantage of the Kappa scoring system is the necessity for comparison of different indices, which can be inconvenient for the analysis of larger molecular libraries.
Recently, Böttcher21 tried to overcome many shortcomings of the existing scoring systems and devised a new approach based on substructure analysis, intended for expression of the total molecular complexity. The Böttcher score Cm is inspired by the Shannon entropy and defines molecular complexity in an additive manner by the consideration of atomic connectivity, the number of valence electrons for atoms, heteroatom diversity, stereogenicity, and molecular symmetry. It has generated significant interest, resulting in a rapid increase in its popularity since its introduction, notably by the organic synthesis community.26−32 Considering the general interest in this scoring system and apparent improvement over the alternative complexity measures, we explored whether the Böttcher complexity score may also serve as a descriptor that could correlate compound complexity with biological activity and selectivity. In this case, it might be employed to rationalize trends observed in the biological analysis of our in-house compound libraries. However, initial analysis using total and size-normalized scores indicated that, although the Böttcher complexity index is intuitive and very applicable in a chemical context, there seems to be no or at best only very limited correlation to biological compound activity and selectivity (see the Supporting Information). In light of the recent report by Méndez-Lucio and Medina-Franco8 investigating the relationship between different complexity measures and selectivity, we concluded that scores such as the Bertz molecular complexity also do not seem to be broadly applicable in a biological context.
Considering the already proven correlation between Fsp3 and FCstereo indicators and biologically relevant characteristics of compounds, we now propose a new empirical scoring system termed the spacial score (SPS). [Note: The term “spacial” is the British English spelling of the word “spatial” in American English. Both words originate from the Latin word “spatium”, which translates to “space”.] The SPS builds and improves upon the individual Fsp3 and FCstereo indicators by uniformly expressing spacial complexity on a highly granular scale for convenient ranking of and comparison between molecules. Furthermore, the SPS is an easy-to-calculate index that does not require information about the 3D conformation of a molecule and, when normalized, correlates to biologically relevant properties, including selectivity and potency.
Results and Discussion
The SPS is based on four molecular parameters that we consider significant, i.e., an atom hybridization term (h), a stereoisomeric term (s), a non-aromatic ring term (r), and the number of heavy-atom neighbors (n). By design, the score does not account for heteroatom diversity, as it is not intended to capture the total molecular complexity. The terms are calculated for each heavy atom in a molecule and are then summed across the whole structure according to eq 3, where the symbol i denotes the heavy-atom index in a molecule. The total score value is intended to increase with an increase in the relative complexity of the skeletal arrangements.
| 3 |
The h term accounts for the conformational degrees of freedom. h equals 3, 2, and 1 for sp3-, sp2-, and sp-hybridized atoms, respectively, and h is assumed to be 4 for any other type of hybridization, such as spxdy and sdx in transition metals. Thus, the term h is directly related to Fsp3, for which typically a saturated compound with a high content of sp3 carbons receives a higher score than a similar unsaturated structure. SPS also accounts for the stereogenicity of an atom, where (pseudo)stereogenic tetrahedral carbons and atoms involved in a double bond with possible E and Z isomers are assigned s = 2, and otherwise the term is equal to 1. The stereoisomeric term s is thus strongly related to FCstereo. The value of the ring term r is 2 for all atoms being a part of a non-aromatic ring system. Atoms which are part of an aromatic ring or linear structure are scored with r = 1. The different score for non-aromatic compounds reflects that corresponding elements typically have more spatially intriguing features and conformations. Finally, the score accounts for the number of heavy-atom neighbors of the atom under consideration. For example, an atom with bonds to two heavy atoms has n = 2, and an atom with connections to three heavy atoms is assigned n = 3. The branching of the molecular skeleton is accounted for by squaring the n term.
Table 1 shows the scoring system for atoms of a representative small molecule. The possible value range of SPS starts at 0 and has no upper limit. However, in order for the SPS to be directly comparable among diverse structures, molecular size needs to be taken into consideration. The SPS can be easily and reliably normalized with respect to size by dividing the total score by the total number of heavy atoms (a) in a given molecule, and the resulting normalized score is referred to as nSPS (eq 4). The SPS and nSPS computations were implemented as a Python script based on the RDKit software,33 calculating the scores using simplified molecular-input line-entry system (SMILES) as input.34
| 4 |
The SPS and nSPS were compared to the frequently used complexity indices Fsp3, FCstereo, Böttcher complexity score Cm, Bertz total molecular complexity CT, and Whitlock score S. The results for a set of representative compounds are shown in Table 2. Fsp3 and FCstereo are straightforward indicators and therefore can often return the lowest possible score of 0, even for molecules with considerable topological complexity. Fsp3 can also often yield the highest score of 1 for simple structures (Figure S1). Additionally, a significant portion of small molecules does not have any stereogenic carbons, resulting in FCstereo scores of 0. Four different reference sets were curated and used for analysis, i.e., experimental and approved drugs from the DrugBank (DrugBank),35 the Enamine Advanced Screening Collection (Enamine, representing a commercial screening collection optimized for Lipinski’s rule of five),36 natural products extracted from the ChEMBL database (ChEMBL NPs, representing bioactive natural products),37 and dark chemical matter (DCM, representing compounds that do not show activity in >100 biological and biochemical assays).38 The results show that 56% of all structures have 1 or more stereogenic carbons and, consequently, 44% of the molecules have an FCstereo score of 0 (Figure S2). Thus, FCstereo is not an ideal indicator for comparisons and ranking among a significant number of compounds in such libraries. Unsurprisingly, Fsp3 and FCstereo indicators do not directly encapsulate many topological features, such as the extent of skeletal branching or the presence of rings (see Table 2), and thus, they are not comprehensive measures of complexity.
Table 1. Illustration of SPS Partial Scores for Every Atomic Index in the Depicted Small Moleculea.
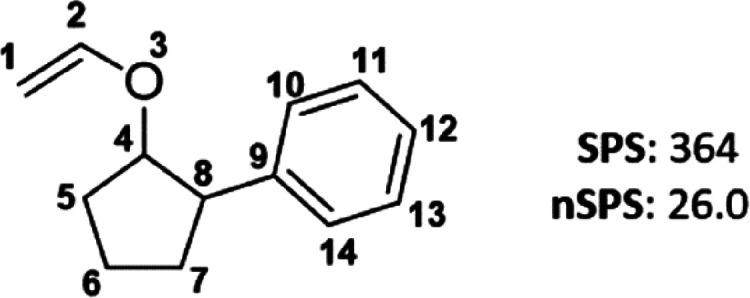

The total SPS calculated for the compound is 364, and the nSPS is equal to 26.0. Abbreviations: i, atom index; h, hybridization term; s, stereoisomeric term; r, non-aromatic ring term; n, heavy-atom neighbors.
Table 2. Comparison of SPS and nSPS with Scores Obtained with Common Topological and Total Complexity Indicators for Exemplary Small Organic Moleculesa.

Abbreviations: Cm, Böttcher complexity score; CT, Bertz total molecular complexity; HA, heavy atoms; S, Whitlock score.
In contrast, complexity scores like S, CT, or Cm are intended to comprehensively express the total molecular complexity. The Whitlock measure S does not differentiate well between compounds containing a smaller number of features and is indifferent toward many important topological features, including branching and ring sizes. On the other hand, the CT index expresses a number of topological nuances, but this scoring system is limited, for instance, by not taking chirality into account. Additionally, a very strong correlation between log10 of CT scores and molecular weight has been reported (Spearman’s rank correlation coefficient equal to 0.98).39Cm appears to score compounds in a more intuitive manner, easily distinguishing between linear, branched, saturated, and unsaturated compounds with consideration for symmetry and elemental diversity. This complexity index, however, puts an emphasis on the presence of heteroatoms, as can be exemplified by comparison of n-hexane (size-normalized Cm by accounting for number of heavy atoms: Cm/HA = 2.2) with n-amyl bromide (Cm/HA = 6.3) or between more elaborate compounds such as rivaroxaban (Cm/HA = 15.9; compound 15 in Table 2) and cholesterol (Cm/HA = 11.4; compound 16 in Table 2). The nSPS has also been compared to the interpretation of the Allu and Oprea scoring system18 by Voršilák and Svozil, relying on atomic electronegativities and bond parameters (Figure S3).,40 The analysis showed no considerable correlation between the two scoring methods.
SPS and nSPS are indifferent to the elemental constitution of molecules (compare compounds 2 and 3 in Table 2) and penalize unsaturation (compare 1 and 3), unless it contributes to the isomeric diversity (compound 5). Branched and non-aromatic cyclic molecules are awarded higher scores than linear structures (e.g., compare compounds 3 and 4, as well as 2 and 12), and stereogenic atoms are stressed (compound 7). Comparison of the nSPS of cholesterol (46.5) to the nSPS of rivaroxaban (19.4; Table 2), as well as various molecules at different nSPS ranges (Figures S4 and S5), matches the general intuition concerning the intricacy of spatial arrangements in these molecules. We also calculated and compared Fsp3, FCstereo, and nSPS for each of the synthesized compounds in the total synthesis of (−)-bilobalide by Demoret et al.,26 further substantiating our conclusion regarding the intuitive nature of the new scoring system and combined improvement over Fsp3 and FCstereo as individual descriptors (Figure 1).
Figure 1.

A) Overview of the total synthesis of (−)-bilobalide performed by Demoret et al.26B)Fsp3, FCstereo, and nSPS calculated for the structures in the total synthesis of (−)-bilobalide.
Assessment of Pearson correlation coefficients of nSPS with basic molecular descriptors for a collection of representative molecules from the DrugBank, Enamine, ChEMBL NP, and DCM reference sets revealed that, as designed, the score is highly correlated with Fsp3 (0.68) and FCstereo (0.83) and negatively correlated with the size-normalized number of aromatic rings (−0.62; Figure 2A). Further analysis showed that, in order to reach high nSPS, compounds need to have high Fsp3 scores; however, high Fsp3 scores do not necessarily translate to large nSPS values (Figure S6A). Similarly, not all compounds with high FCstereo are complex, as determined based on the corresponding nSPS, and molecules with FCstereo = 0 can also have elaborate topology, as discussed above (Figure S6B). No correlation with the size-normalized approximate surface area (ASA),41 number of hydrogen bond donors and acceptors, estimated clogP values,42 and quantitative estimate of drug-likeness (QED) was observed.43 However, we noted a significant correlation (0.69) with natural product-likeness (NP-likeness),44 as well as a moderate degree of correlation (0.4) with the plane of best fit (PBF) score (Figure 2).45 The relationship with the PBF score, although not significantly stronger than what is observed for Fsp3 and FCstereo, is interesting, as calculations of PBF are normally computationally demanding due to the necessity to accurately predict the representative 3D conformations of the investigated molecules.
Figure 2.

A) Correlation heatmap constructed based on the analysis of 12 000 representative organic molecules selected in equal proportions from DrugBank, Enamine, ChEMBL NP, and DCM data sets. The values shown are calculated Pearson correlation coefficients between descriptors. B) Kernel distribution estimation plot (KDE) depicting the distribution of Fsp3 for different data sets. C) KDE for FCstereo for different compound classes. D) KDE plot of calculated nSPS values for different data sets. Abbreviations: ASA, approximate surface area; DCM dark chemical matter; HA, heavy atoms; NPs, natural products; PBF, plane of best fit; QED, quantitative estimate of drug-likeness.
Fsp3, FCstereo, and nSPS were calculated for comparison for all compounds from the different data sets (Figure 2B–D). Interestingly, we observed that a high proportion of the DCM compound collection shows relatively low nSPS, with a median score of 14.3. DrugBank gave a relatively high overlap with DCM, with a median score of 14.4; however, its distribution also showed a very long tail, with the maximum nSPS values reaching 66.4. Compounds from the Enamine collection had a higher median nSPS than DCM and DrugBank molecules that was equal to 18.2. There is a general chemical intuition that NPs produced via biosynthetic cascades are typically more complex than synthetic molecules produced via chemical reactions.46−51 In line with this intuition, ChEMBL NPs have a very high nSPS median value (28.0) and a relatively broad distribution (maximum nSPS of 76.0) relative to the other reference sets. The wide range of nSPS values for NPs expresses their rich structural diversity, which includes such simple molecules like salicylic and cinnamic acids but also extends to more intricate compounds such as morphine or strychnine. We also analyzed a representative subset of the GDB-17 enumerated compound library, containing molecules with up to 17 atoms of C, N, O, S, and halogens. The GDB-17 set is known to be rich in non-aromatic cyclic structures, compounds with a high proportion of quaternary centers and stereoisomers. The shapes of the compounds from this set also have been shown to significantly populate the third dimension.52 The GDB-17 subset has a similar distribution of the nSPS values as the analyzed NPs. The median score is 36.2 units and confirms the very high complexity of the set, where the most complex structures are found to have nSPS of over 100. Despite its more structurally holistic approach, nSPS still conserves the characteristic distinction between the distributions of synthetic compounds and NPs as it is seen for FCstereo. An analogous analysis employing size-normalized Cm scores could not differentiate the reference compound sets (Figure S11). The relatively high FCstereo and Fsp3 values of NPs may explain the significant correlation of nSPS to the NP-likeness score.
In order to determine if the nSPS scores are related to the general trends in compound activity and selectivity, and how those trends relate to Fsp3 and FCstereo, we analyzed the ChEMBL database, selecting only for molecules tested in assays with the highest confidence score. Retention of the assay outcomes with the highest confidence score assured that the used results are accurate and the target assignments represent the actual targets. Compound activity was assessed based on the averaged available pChEMBL values for a given molecule. The pChEMBL value is a negative log of concentration–response activity such as IC50, EC50, Ki, or Kd. The analyzed structures were classified as compounds with low (average pChEMBL ≤ 5.3), medium (5.3 < average pChEMBL < 6.5), or high activity (average pChEMBL ≥ 6.5).
Compounds were further assigned into three complexity levels, depending on the considered scoring system. Based on Fsp3 index, molecules were classified using score thresholds of 0.3 and 0.6, and based on FCstereo, using thresholds of 0.0 and 0.25. The selected FCstereo classification values also matched the categorization values used previously by Clemons et al.6 Compounds were assumed to have low nSPS when the score was below 11.2 (25th percentile of the analyzed ChEMBL compounds) or high nSPS with the value above 17.7 (75th percentile).
The analysis revealed that molecules with medium or high Fsp3 (above 0.3) tend to have higher activity in assays than compounds with high unsaturation (Figure S7A). We also observed that structures with medium values of FCstereo have the highest proportion of high compound activity (54%) compared to compounds with either no stereogenic carbons or compounds with high values of FCstereo (Figure S7B). The differences in activity between molecule bins with low, medium, and high nSPS values are highly conspicuous. Low nSPS is associated with a high proportion of low-activity compounds (39%) and a low proportion of highly active compounds (28%). The proportion of highly active structures increases for the molecules with medium nSPS (45%) and reaches a majority (55%) for structures with high nSPS. Compounds with high nSPS also have a low proportion of structures with low activity in assays (23%; Figure 3A). Further data analysis of the relationship between activity and nSPS revealed that, on average, the highest activity is achieved by compounds with nSPS values between ca. 20 and 40 (Figure 3B). A further increase in nSPS appears to be generally non-advantageous for compound potency and is analogous to the findings of Clemons et al.6 for highly complex molecules characterized by high FCstereo. Thus, a molecular complexity in the nSPS range of 20–40 appears to be generally a “necessary but not sufficient” condition to obtain a ligand with an optimal assay activity. The average compound activity for different nSPS ranges has also been compared to the distribution of average molecular weights (Figure S8). Although generally low molecular weights correspond to low nSPS, the averaged weights appear to remain relatively constant (ca. 400–500) for compounds with nSPS above 10 units.
Figure 3.

A) Proportions of high, medium, and low activity in ChEMBL assays for compounds at three ranges of nSPS. B) Relationship between nSPS and pChEMBL values, where compounds are grouped into bins according to their nSPS values. Average pChEMBL values are calculated for each bin, where each bin contains at least 10 compounds. The number of compounds in each bin in the top panel represents the number of molecules in the bins of the bottom panel. C) ROC plot for the ability of Fsp3, FCstereo, and nSPS systems to discriminate between compounds with high and low-to-moderate potency in ChEMBL assays. AUC = 0.5 indicates no discriminatory ability (dashed diagonal line).
A similar analysis was conducted for trends in target selectivity using compounds in the ChEMBL database. In order to render the analysis more reliable, the target selectivity analysis was performed only for compounds with the average pChEMBL > 5.3, thus excluding all weakly active compounds. By analogy to the classification used by Clemons et al.6 and Kombo et al.,7 the compounds were binned as highly selective (binding to only 1 protein), partially selective (binding 2–5 proteins), or promiscuous (binding 6 or more proteins). Compounds with higher values of Fsp3 (>0.3) as well as FCstereo (>0.0) show a notable increase in the proportion of highly selective binders and a significant decrease in the proportion of promiscuous molecules (Figure S9). As in the case of the compound activity, the compounds with a moderate FCstereo range have a higher proportion of selective and lower proportion of promiscuous structures than compounds assigned a high FCstereo value. The obtained results for Fsp3 and FCstereo are in agreement with previous reports.6−8 Structures with low nSPS have a relatively high proportion of promiscuity (12%) and a low proportion of highly selective compounds (47%). Molecules with medium nSPS have a decreased proportion of promiscuous compounds (6%) and increased proportion of compounds with only 1 binder (58%). Although the bin with the high nSPS values does not have a higher proportion of highly selective compounds, its fraction of promiscuous structures decreases to below 4% (Figure 4A). A closer investigation of the relationship between selectivity and nSPS indicated that there is a decreasing trend in the average number of binding proteins with an increase in the nSPS values up to 20. It thus seems that the most optimal nSPS values for target selectivity are 20 and above (Figure 4B).
Figure 4.

A) Proportions of number of targets for compounds at three ranges of nSPS, based on the ChEMBL data. B) Relationship between nSPS and the number of targets, where compounds are grouped into bins according to their nSPS values. The average number of bound proteins is calculated for each bin, where each bin contains at least 10 compounds. Numbers of compounds in each bin in the top panel represent the number of molecules in the bins of the bottom panel. C) ROC plot for the ability of Fsp3, FCstereo, and nSPS systems to discriminate between promiscuous and more target selective compounds. AUC = 0.5 indicates no discriminatory ability (dashed diagonal line).
The predictive powers of Fsp3, FCstereo, and nSPS were assessed with respect to compound potency and promiscuity using receiver operating characteristic curves (ROC) and calculated area under the curve (AUC). We tested how well these indicators perform in terms of binary classification into compounds with high and medium-to-low potency (Figure 3C), as well as into promiscuous and selective molecules (Figure 4C) in comparison to random choice (AUC = 0.5). nSPS gave the best AUC of 0.61 with respect to potency, whereas Fsp3 and FCstereo each achieved AUC = 0.58. Similar performance was achieved for the classification with respect to promiscuity, where nSPS, Fsp3, and FCstereo gave AUC = 0.60, 0.62, and 0.59, respectively. Although these results do not express high diagnostic ability, the positive performance of the assessed indicators is considerable and proves that nSPS has at least the same or better relation to potency and selectivity than the highly popular Fsp3 and FCstereo metrics.
The analysis was continued by examining the average nSPS separately for experimental, investigational, and approved drugs in the 2023 structure sets provided by DrugBank.35 The experimental set contains compounds in the discovery and pre-discovery phases exhibiting drug-like properties, and the investigational data set comprises the drugs that reached clinical trials, while the approved drug set contains compounds that have been accepted for commercialization. The average nSPS values are similar and relatively high for all three sets. The lowest average nSPS of 18.2 was found for the experimental set. The investigational set has a slightly increased average nSPS of 19.3 units, whereas the approved drug set has the highest average nSPS of 20. We also performed analysis of the drugs approved by the FDA between 1951 and 2021, as summarized by Scott et al.29 Overall, the averages of Fsp3, FCstereo, and nSPS values do not appear to have changed appreciably over the years and show no apparent increasing or decreasing trends (Figure S10). The average nSPS of the approved drugs in this time period is relatively high and equals 21 units. The average nSPS values for the approved drugs seem to correspond well with the optimal nSPS range found for the compound potency and selectivity in the ChEMBL data set. Thus, for compounds intended for biological investigations and in the absence of any other indications, it appears that molecules with nSPS values in the range of 20–40 units will be particularly promising. As indicated by the statistical model of Hann et al.,2 and further discussed by Schuffenhauer et al.,53 there appears to be a trade-off between the probability of a random compound to have a measurable affinity to a target and the probability of finding a useful interaction with that target. Highly complex ligands may have a high affinity and selectivity for a target when a match is found, but the chance of a very complex and target-fitting molecule being present in a screening deck is relatively low. Hann et al. thus suggested that there is an optimal complexity range that allows us to obtain ligands complex enough to have a measurable binding affinity and good selectivity, but not too complex to have a very high likelihood of mismatch with the binding site. Thus, we suggest that, in the case of small libraries intended for screening of random scaffolds against a macromolecular target, the nSPS values should not be increased significantly over 20 units due to the increasing probability of a mismatch with the binding site for the higher scores. We recommend that the full, optimal nSPS range of 20–40 units is explored only in the case of high-throughput screening campaigns involving large numbers of compounds where the potential biological benefits of highly complex structures outweigh the difficulty in finding the hit.
Similarly to the Böttcher complexity index, the un-normalized SPS can also be applied for the assessment of spacial modifications occurring during generalized chemical transformations. The difference in SPS (ΔSPS) between the product and the starting material(s) for a particular reaction type can be easily calculated and used for comparison and ranking of contributions to spacial changes between different chemical reactions (Table 3).
Table 3. Changes in SPS between Products and Starting Materials for Exemplary Chemical Reactions (R Group ≠ H).

Conclusions
Considering the high importance and widespread use of Fsp3 and FCstereo indicators in medicinal chemistry and their link to biologically relevant compound features, we propose a new scoring system that not only combines the benefits of both Fsp3 and FCstereo but also overcomes shortcomings caused by their simplistic nature. SPS and its size-normalized version nSPS provide a more granular evaluation for a diverse range of structures than Fsp3 and FCstereo, retaining strong correlation to both indicators but also explicitly accounting for such topological features as ring sizes and skeletal branching. Thus, the normalized spacial score appears to reflect more the chemist’s intuitive assessment of complexity regarding spacial arrangements in molecules. Furthermore, the nSPS is applicable in a biological context. Analysis of ChEMBL compounds showing activities in assays revealed trends of generally increasing selectivity and potency with increasing nSPS values. At very high nSPS values above 40, the impact on activity strength became unfavorable. The average nSPS of the FDA-approved drugs over the past seven decades was over 20 units and does not have a general rising or falling trend. Based on the observed results, in the absence of any known contradictions, we recommend to select for compounds with nSPS in the range of 20–40, which could potentially maximize the ligand potency and target selectivity, remembering that an increase in the average molecular complexity can have a negative impact on the assay hit rate. In addition, SPS can be used in the context of synthesis planning and analysis by directly comparing different chemical transformations and their impact on spacial arrangements and molecular complexity in the resulting products’ molecular structures.
Experimental Section
General Methods
The cheminformatics data analysis was performed using Python 3.8 and was based on RDKit software version 2021.09.3.33 Python script preparation and data analysis were done in Visual Studio Code version 1.64.2 (Microsoft Corporation, USA) using a virtual environment in conda, package, and environment manager, version 4.10.3. Data processing and analysis was performed with the help of NumPy (version 1.21.5), Pandas (version 1.3.5), and scikit-learn (version 1.0.1) packages. All presented plots were prepared with Matplotlib (version 3.5.1) and Seaborn (version 0.11.2). The Python script used to calculate SPS and nSPS based on SMILES has been made publicly available and can be accessed through the GitHub repository: https://github.com/frog2000/Spacial-Score. The Böttcher complexity scores were calculated using a modified Python script, originally developed by the Forli group,26 and modified by us to also account for the E/Z isomers, as described by Böttcher.21 The updated script, merged into the master branch, is available directly from the GitHub repository of the Forli group: https://github.com/forlilab/bottchscore. The Allu and Oprea complexity scores were calculated using a Python implementation by Voršilák and Svozil.40 The script is available from the GitHub repository: https://github.com/lich-uct/nonpher.
Data Sets
Described data analysis was performed using several external data sets: experimental (6K compounds), investigational (4K compounds), and approved drugs (2K) from Drugbank, as well as combined experimental and approved drugs from DrugBank (8K compounds), Enamine advanced screening collection (527K compounds), NPs extracted from ChEMBL database version 29 (42K compounds), and compounds from the DCM set provided by Wassermann et al.38 (139K compounds), ChEMBL database version 30 (718K compounds after filtering), the GDB-17 compound set (randomly selected 100K compounds),52 and the FDA-approved compound set provided by Scott et al.29 (1112 entries).
The selection of NPs from ChEMBL 29 was conducted exactly as previously described by Grigalunas and colleagues.54
Data Preparation
DrugBank, Enamine, DCM, and all ChEMBL compounds containing at least two heavy atoms were standardized by desalting the input structures, neutralizing charges, performing SMILES canonicalization, and deduplication. The script used for the standardization is available from https://github.com/mpimp-comas/2022_grigalunas_smo_anta (python_scripts). NPs from ChEMBL 29 were additionally deglycosylated as previously described by Grigalunas et al.54
The ChEMBL-based analysis concerning compound potency and selectivity was performed on molecules with an associated assay ‘confidence_score’ of 9. The compound filtering was performed using an appropriate SQL query with MySQL (version 8.0.27) relational database management system (see Supporting Information) from the full ChEMBL 30 locally installed database. The resulting data were loaded into the Pandas dataframe and merged with previously standardized SMILES for the compounds in the ChEMBL 30 database, joining the entries based on the ChEMBL ID for the compound. The entries which did not contain pChEMBL values or standardized SMILES were removed. All available pChEMBL values for the entries with the same target ID and the ChEMBL compound ID were averaged, allowing us to obtain a mean pChEMBL value across all performed assays for a specific compound interacting with a specific target. Duplicated entries for the same compound with the same target ID were then removed. The number of proteins that given a compound bound was based on the total number of entries with the same ChEMBL compound ID but different target IDs. The compounds in the Pandas dataframe were then deduplicated by the ChEMBL compound IDs, and this prepared dataframe was used for the analysis of a compound’s potency and target selectivity.
Analysis of Compound Potency and Selectivity
The ChEMBL compounds were divided into three groups for each considered scoring system. For Fsp3 the following bins were used: Fsp3 ≤ 0.3, 0.3 < Fsp3 < 0.6, and Fsp3 ≥ 0.6. For FCstereo: FCstereo = 0.0, 0.0 < FCstereo < 0.3, and FCstereo ≥ 0.3. For nSPS: nSPS ≤ 11.22 (25th percentile), 11.22 < nSPS < 17.68, and nSPS ≥ 17.68 (75th percentile). Compounds within each Fsp3, FCstereo, and nSPS class were further grouped as low (average pChEMBL ≤ 5.3), medium (5.3 < average pChEMBL < 6.5), or high potency (average pChEMBL ≥ 6.5), noting the percentage of each potency group within each complexity class. A similar process was followed for the investigation of compound selectivity, but here only molecules with average pChEMBL > 5.3 were considered. Compounds within each Fsp3, FCstereo, and nSPS class were further grouped as highly selective (1 known target), moderately selective (2–5 known targets), or promiscuous (6 or more known targets), also noting the percentage of each selectivity group within each complexity class.
Subsequently, the compounds were grouped based on their complexity index into bins where each bin had at least 10 members. Average pChEMBL values and average numbers of targets were calculated for each complexity bin, and then the average values were plotted against the complexity bins for nSPS. The number of compounds populating each bin was also recorded.
ROC curves and AUC values were generated using scikit-learn package, where the discriminatory abilities of nSPS, Fsp3, and FCstereo to distinguish between either promiscuous/non-promiscuous compounds or high/medium-low compound potency were assessed.
Analogous analyses were performed based on size-normalized Böttcher complexity scores (see Supporting Information).
Analysis of Correlations
Pearson correlations of SPS and nSPS with Fsp3, FCstereo, and molecular descriptors were calculated for a combined set of 12 000 unique compounds, where 3000 structures were sampled from each of the following data sets: DrugBank, Enamine, DCM, and NPs from ChEMBL. The PBF score was calculated for each molecule as an average for 10 representative 3D conformations generated using ETKDG version 3 as implemented in RDKit.55 NP-likeness and QED were calculated as previously described by Grigalunas et al.54 All remaining molecular descriptors were calculated based on the methods available from RDKit.
Analysis of the FDA-Approved Compounds
FDA-approved compounds between 1951 and 2021 were assessed, calculating nSPS, Fsp3, and FCstereo for each structure. Average complexity index values and standard deviations were calculated for molecules approved in each year.
Glossary
Abbreviations Used
- ASA
approximate surface area
- AUC
area under the curve
- Cm
Böttcher complexity score
- CT
Bertz total molecular complexity score
- DCM
dark chemical matter
- FCstereo
fraction of stereogenic carbons
- Fsp3
fraction of sp3-hybridized carbons
- HA
heavy atom
- nSPS
normalized spacial score
- NP
natural product
- QED
quantitative estimate of drug-likeness
- PBF
plane of best fit
- ROC
receiver operating characteristic
- S
Whitlock score
- SPS
spacial score
Supporting Information Available
The Supporting Information is available free of charge at https://pubs.acs.org/doi/10.1021/acs.jmedchem.3c00689.
Structures and complexity scores for selected organic molecules (S1, S4, S5); histogram of FCstereo scores for compounds in the reference sets (S2); 2D-histograms comparing distribution of nSPS with Fsp3, FCstereo and the complexity score by Allu and Oprea (S3, S6); potency and selectivity results for compounds at different complexity levels (S7, S9, S12); relationship between nSPS, pChEMBL values and molecular weights (S8); changes of nSPS, Fsp3 and FCstereo for FDA-approved drugs between 1951 and 2021 (S10); distributions of Böttcher complexity scores for reference compound sets (S11); ROC for potency and selectivity based on Böttcher complexity scores (S13); and SQL query for compound selection from ChEMBL30 database (PDF)
Author Present Address
⊥ GSK Medicines Research Centre, Gunnels Wood Road, SG1 2NY Stevenage, U.K
Open access funded by Max Planck Society.
The authors declare no competing financial interest.
Supplementary Material
References
- Saldívar-González F. I.; Medina-Franco J. L. Chemoinformatics Approaches to Assess Chemical Diversity and Complexity of Small Molecules. Small Mol. Drug Discovery Methods, Mol. Appl. 2020, 83–102. 10.1016/B978-0-12-818349-6.00003-0. [DOI] [Google Scholar]
- Hann M. M.; Leach A. R.; Harper G. Molecular Complexity and Its Impact on the Probability of Finding Leads for Drug Discovery. J. Chem. Inf. Comput. Sci. 2001, 41 (3), 856–864. 10.1021/ci000403i. [DOI] [PubMed] [Google Scholar]
- Kuntz I. D.; Chen K.; Sharp K. A.; Kollman P. A. The Maximal Affinity of Ligands. Proc. Natl. Acad. Sci. U. S. A. 1999, 96 (18), 9997–10002. 10.1073/pnas.96.18.9997. [DOI] [PMC free article] [PubMed] [Google Scholar]
- Lovering F.; Bikker J.; Humblet C. Escape from Flatland: Increasing Saturation as an Approach to Improving Clinical Success. J. Med. Chem. 2009, 52 (21), 6752–6756. 10.1021/jm901241e. [DOI] [PubMed] [Google Scholar]
- Lovering F. Escape from Flatland 2: Complexity and Promiscuity. Medchemcomm 2013, 4 (3), 515–519. 10.1039/c2md20347b. [DOI] [Google Scholar]
- Clemons P. A.; Bodycombe N. E.; Carrinski H. A.; Wilson J. A.; Shamji A. F.; Wagner B. K.; Koehler A. N.; Schreiber S. L. Small Molecules of Different Origins Have Distinct Distributions of Structural Complexity That Correlate with Protein-Binding Profiles. Proc. Natl. Acad. Sci. U. S. A 2010, 107 (44), 18787–18792. 10.1073/pnas.1012741107. [DOI] [PMC free article] [PubMed] [Google Scholar]
- Kombo D. C.; Tallapragada K.; Jain R.; Chewning J.; Mazurov A. A.; Speake J. D.; Hauser T. A.; Toler S. 3D Molecular Descriptors Important for Clinical Success. J. Chem. Inf. Model. 2013, 53 (2), 327–342. 10.1021/ci300445e. [DOI] [PubMed] [Google Scholar]
- Méndez-Lucio O.; Medina-Franco J. L. The Many Roles of Molecular Complexity in Drug Discovery. Drug Discovery Today 2017, 22 (1), 120–126. 10.1016/j.drudis.2016.08.009. [DOI] [PubMed] [Google Scholar]
- Wang X.; Greene N. Comparing Measures of Promiscuity and Exploring Their Relationship to Toxicity. Mol. Inform. 2012, 31 (2), 145–159. 10.1002/minf.201100148. [DOI] [PubMed] [Google Scholar]
- Bertz H. S. The First General Index of Molecular Complexity. J. Am. Chem. Soc. 1981, 103 (12), 3599–3601. 10.1021/ja00402a071. [DOI] [Google Scholar]
- Bonchev D. Overall Connectivities/Topological Complexities: A New Powerful Tool for QSPR/QSAR. J. Chem. Inf. Comput. Sci. 2000, 40 (4), 934–941. 10.1021/ci990120u. [DOI] [PubMed] [Google Scholar]
- Rücker G.; Rücker C. Walk Counts, Labyrinthicity, and Complexity of Acyclic and Cyclic Graphs and Molecules. J. Chem. Inf. Comput. Sci. 2000, 40 (1), 99–106. 10.1021/ci9900579. [DOI] [PubMed] [Google Scholar]
- Randić M.; Plavšić D. Characterization of Molecular Complexity. Int. J. Quantum Chem. 2003, 91 (1), 20–31. 10.1002/qua.10343. [DOI] [Google Scholar]
- von Korff M.; Sander T.. About Complexity and Self-Similarity of Chemical Structures in Drug Discovery. Chaos and Complex Systems; Springer: Berlin, Heidelberg, 2013; pp 301–306. 10.1007/978-3-642-33914-1_39. [DOI] [Google Scholar]
- Proudfoot J. R. Molecular Complexity and Retrosynthesis. J. Org. Chem. 2017, 82 (13), 6968–6971. 10.1021/acs.joc.7b00714. [DOI] [PubMed] [Google Scholar]
- Whitlock H. W. On the Structure of Total Synthesis of Complex Natural Products. J. Org. Chem. 1998, 63 (22), 7982–7989. 10.1021/jo9814546. [DOI] [Google Scholar]
- Barone R.; Chanon M. A New and Simple Approach to Chemical Complexity. Application to the Synthesis of Natural Products. J. Chem. Inf. Comput. Sci. 2001, 41 (2), 269–272. 10.1021/ci000145p. [DOI] [PubMed] [Google Scholar]
- Allu T. K.; Oprea T. I. Rapid Evaluation of Synthetic and Molecular Complexity for in Silico Chemistry. J. Chem. Inf. Model. 2005, 45 (5), 1237–1243. 10.1021/ci0501387. [DOI] [PubMed] [Google Scholar]
- von Korff M.; Sander T. Molecular Complexity Calculated by Fractal Dimension. Sci. Rep. 2019, 9 (1), 1–8. 10.1038/s41598-018-37253-8. [DOI] [PMC free article] [PubMed] [Google Scholar]
- Hall L. H.; Kier L. B.. The Molecular Connectivity Chi Indexes and Kappa Shape Indexes in Structure-Property Modeling. In Reviews in Computational Chemistry; Lipkowitz K. B., Boyd D. B., Eds.; VCH: New York, 1991; Vol. 2, pp 367–422. 10.1002/9780470125793.ch9. [DOI] [Google Scholar]
- Böttcher T. An Additive Definition of Molecular Complexity. J. Chem. Inf. Model. 2016, 56 (3), 462–470. 10.1021/acs.jcim.5b00723. [DOI] [PubMed] [Google Scholar]
- Randic M. Characterization of Molecular Branching. J. Am. Chem. Soc. 1975, 97 (23), 6609–6615. 10.1021/ja00856a001. [DOI] [Google Scholar]
- Luzanov A. V.; Babich E. N. Quantum-Chemical Quantification of Molecular Complexity and Chirality. J. Mol. Struct. THEOCHEM 1995, 333 (3), 279–290. 10.1016/0166-1280(94)03944-G. [DOI] [Google Scholar]
- Kim S.; Thiessen P. A.; Bolton E. E.; Chen J.; Fu G.; Gindulyte A.; Han L.; He J.; He S.; Shoemaker B. A.; Wang J.; Yu B.; Zhang J.; Bryant S. H. PubChem Substance and Compound Databases. Nucleic Acids Res. 2016, 44 (D1), D1202–D1213. 10.1093/nar/gkv951. [DOI] [PMC free article] [PubMed] [Google Scholar]
- Kim S.; Chen J.; Cheng T.; Gindulyte A.; He J.; He S.; Li Q.; Shoemaker B. A.; Thiessen P. A.; Yu B.; Zaslavsky L.; Zhang J.; Bolton E. E. PubChem in 2021: New Data Content and Improved Web Interfaces. Nucleic Acids Res. 2021, 49 (D1), D1388–D1395. 10.1093/nar/gkaa971. [DOI] [PMC free article] [PubMed] [Google Scholar]
- Demoret R. M.; Baker M. A.; Ohtawa M.; Chen S.; Lam C. C.; Khom S.; Roberto M.; Forli S.; Houk K. N.; Shenvi R. A. Synthetic, Mechanistic, and Biological Interrogation of Ginkgo Biloba Chemical Space En Route to (−)-Bilobalide. J. Am. Chem. Soc. 2020, 142 (43), 18599–18618. 10.1021/jacs.0c08231. [DOI] [PMC free article] [PubMed] [Google Scholar]
- Singh M.; Gaskins B.; Johnson D. R.; Elles C. G.; Boskovic Z. Synthesis of Cycloheptatriene-Containing Azetidine Lactones. J. Org. Chem. 2022, 87 (22), 15001–15010. 10.1021/acs.joc.2c00367. [DOI] [PMC free article] [PubMed] [Google Scholar]
- Crossley S. W. M.; Tong G.; Lambrecht M. J.; Burdge H. E.; Shenvi R. A. Synthesis of (−)-Picrotoxinin by Late-Stage Strong Bond Activation. J. Am. Chem. Soc. 2020, 142 (26), 11376–11381. 10.1021/jacs.0c05042. [DOI] [PMC free article] [PubMed] [Google Scholar]
- Scott K. A.; Ropek N.; Melillo B.; Schreiber S. L.; Cravatt B. F.; Vinogradova E. V. Stereochemical Diversity as a Source of Discovery in Chemical Biology. Curr. Res. Chem. Biol. 2022, 2 (May), 100028. 10.1016/j.crchbi.2022.100028. [DOI] [Google Scholar]
- Reddy D. S.; Novitskiy I. M.; Kutateladze A. G. Maximizing Step-Normalized Increases in Molecular Complexity: Formal [4 + 2+2 + 2] Photoinduced Cyclization Cascade to Access Polyheterocycles Possessing Privileged Substructures. Angew. Chem. 2022, 134 (4), 1–7. 10.1002/ange.202112573. [DOI] [PubMed] [Google Scholar]
- Landwehr E. M.; Baker M. A.; Oguma T.; Burdge H. E.; Kawajiri T.; Shenvi R. A. Concise Syntheses of GB22, GB13, and Himgaline by Cross-Coupling and Complete Reduction. Science 2022, 375 (6586), 1270–1274. 10.1126/science.abn8343. [DOI] [PMC free article] [PubMed] [Google Scholar]
- Reddy D. S.; Novitskiy I. M.; Kutateladze A. G. Complexity-Building Photoinduced Cascade Involving Csp2-Csp3Coupling of Aromatic Amides via [2 + 2] Reactivity of ESIPT-Generated o-Azaxylylenes. Org. Lett. 2023, 25, 1131–1135. 10.1021/acs.orglett.3c00092. [DOI] [PubMed] [Google Scholar]
- RDKit: Open-Source Cheminformatics. https://www.rdkit.org.
- Weininger D. SMILES, a Chemical Language and Information System. 1. Introduction to Methodology and Encoding Rules. J. Chem. Inf. Model. 1988, 28 (1), 31–36. 10.1021/ci00057a005. [DOI] [Google Scholar]
- Wishart D. S.; Feunang Y. D.; Guo A. C.; Lo E. J.; Marcu A.; Grant J. R.; Sajed T.; Johnson D.; Li C.; Sayeeda Z.; Assempour N.; Iynkkaran I.; Liu Y.; MacIejewski A.; Gale N.; Wilson A.; Chin L.; Cummings R.; Le Di.; Pon A.; Knox C.; Wilson M. DrugBank 5.0: A Major Update to the DrugBank Database for 2018. Nucleic Acids Res. 2018, 46 (D1), D1074–D1082. 10.1093/nar/gkx1037. [DOI] [PMC free article] [PubMed] [Google Scholar]
- Lipinski C. A.; Lombardo F.; Dominy B. W.; Feeney P. J. Experimental and Computational Approaches to Estimate Solubility and Permeability in Drug Discovery and Development Settings. Adv. Drug Delivery Rev. 1997, 23 (1–3), 3–25. 10.1016/S0169-409X(96)00423-1. [DOI] [PubMed] [Google Scholar]
- Gaulton A.; Bellis L. J.; Bento A. P.; Chambers J.; Davies M.; Hersey A.; Light Y.; McGlinchey S.; Michalovich D.; Al-Lazikani B.; Overington J. P. ChEMBL: A Large-Scale Bioactivity Database for Drug Discovery. Nucleic Acids Res. 2012, 40 (D1), 1100–1107. 10.1093/nar/gkr777. [DOI] [PMC free article] [PubMed] [Google Scholar]
- Wassermann A. M.; Lounkine E.; Hoepfner D.; Le Goff G.; King F. J.; Studer C.; Peltier J. M.; Grippo M. L.; Prindle V.; Tao J.; Schuffenhauer A.; Wallace I. M.; Chen S.; Krastel P.; Cobos-Correa A.; Parker C. N.; Davies J. W.; Glick M. Dark Chemical Matter as a Promising Starting Point for Drug Lead Discovery. Nat. Chem. Biol. 2015, 11 (12), 958–966. 10.1038/nchembio.1936. [DOI] [PubMed] [Google Scholar]
- Ellerker M. E.; Diab S.; Gerogiorgis D. I.. A Multiparametric Analysis of Molecular Complexities vs. Economic Data towards the Continuous Pharmaceutical Manufacturing (CPM) of Antibiotics; Elsevier Masson SAS, 2018; Vol. 43. 10.1016/B978-0-444-64235-6.50191-1. [DOI] [Google Scholar]
- Voršilák M.; Svozil D. Nonpher: Computational Method for Design of Hard-to-Synthesize Structures. J. Cheminform. 2017, 9 (1), 1–7. 10.1186/s13321-017-0206-2. [DOI] [PMC free article] [PubMed] [Google Scholar]
- Labute P. A Widely Applicable Set of Descriptors. J. Mol. Graph. Model. 2000, 18 (4–5), 464–477. 10.1016/S1093-3263(00)00068-1. [DOI] [PubMed] [Google Scholar]
- Wildman S. A.; Crippen G. M. Prediction of Physicochemical Parameters by Atomic Contributions. J. Chem. Inf. Comput. Sci. 1999, 39 (5), 868–873. 10.1021/ci990307l. [DOI] [Google Scholar]
- Bickerton G. R.; Paolini G. V.; Besnard J.; Muresan S.; Hopkins A. L. Quantifying the Chemical Beauty of Drugs. Nat. Chem. 2012, 4 (2), 90–98. 10.1038/nchem.1243. [DOI] [PMC free article] [PubMed] [Google Scholar]
- Ertl P.; Roggo S.; Schuffenhauer A. Natural Product-Likeness Score and Its Application for Prioritization of Compound Libraries. J. Chem. Inf. Model. 2008, 48 (1), 68–74. 10.1021/ci700286x. [DOI] [PubMed] [Google Scholar]
- Firth N. C.; Brown N.; Blagg J. Plane of Best Fit: A Novel Method to Characterize the Three-Dimensionality of Molecules. J. Chem. Inf. Model. 2012, 52 (10), 2516–2525. 10.1021/ci300293f. [DOI] [PMC free article] [PubMed] [Google Scholar]
- Heathcock C. H. Nature Knows Best: An Amazing Reaction Cascade Is Uncovered by Design and Discovery. Proc. Natl. Acad. Sci. U. S. A. 1996, 93 (25), 14323–14327. 10.1073/pnas.93.25.14323. [DOI] [PMC free article] [PubMed] [Google Scholar]
- Thomas G. L.; Johannes C. W. Natural Product-like Synthetic Libraries. Curr. Opin. Chem. Biol. 2011, 15 (4), 516–522. 10.1016/j.cbpa.2011.05.022. [DOI] [PubMed] [Google Scholar]
- Lachance H.; Wetzel S.; Kumar K.; Waldmann H. Charting, Navigating, and Populating Natural Product Chemical Space for Drug Discovery. J. Med. Chem. 2012, 55 (13), 5989–6001. 10.1021/jm300288g. [DOI] [PubMed] [Google Scholar]
- Grabowski K.; Schneider G. Properties and Architecture of Drugs and Natural Products Revisited. Curr. Chem. Biol. 2007, 1 (1), 115–127. 10.2174/2212796810701010115. [DOI] [Google Scholar]
- Stratton C. F.; Newman D. J.; Tan D. S. Cheminformatic Comparison of Approved Drugs from Natural Product versus Synthetic Origins. Bioorg. Med. Chem. Lett. 2015, 25 (21), 4802–4807. 10.1016/j.bmcl.2015.07.014. [DOI] [PMC free article] [PubMed] [Google Scholar]
- King J. R.; Edgar S.; Qiao K.; Stephanopoulos G. Accessing Nature’s Diversity through Metabolic Engineering and Synthetic Biology. F1000Research 2016, 5 (May), 397. 10.12688/f1000research.7311.1. [DOI] [PMC free article] [PubMed] [Google Scholar]
- Ruddigkeit L.; Van Deursen R.; Blum L. C.; Reymond J. L. Enumeration of 166 Billion Organic Small Molecules in the Chemical Universe Database GDB-17. J. Chem. Inf. Model. 2012, 52 (11), 2864–2875. 10.1021/ci300415d. [DOI] [PubMed] [Google Scholar]
- Schuffenhauer A.; Brown N.; Selzer P.; Ertl P.; Jacoby E. Relationships between Molecular Complexity, Biological Activity, and Structural Diversity. J. Chem. Inf. Model. 2006, 46 (2), 525–535. 10.1021/ci0503558. [DOI] [PubMed] [Google Scholar]
- Grigalunas M.; Burhop A.; Zinken S.; Pahl A.; Gally J. M.; Wild N.; Mantel Y.; Sievers S.; Foley D. J.; Scheel R.; Strohmann C.; Antonchick A. P.; Waldmann H. Natural Product Fragment Combination to Performance-Diverse Pseudo-Natural Products. Nat. Commun. 2021, 12 (1), 1–11. 10.1038/s41467-021-22174-4. [DOI] [PMC free article] [PubMed] [Google Scholar]
- Riniker S.; Landrum G. A. Better Informed Distance Geometry: Using What We Know to Improve Conformation Generation. J. Chem. Inf. Model. 2015, 55 (12), 2562–2574. 10.1021/acs.jcim.5b00654. [DOI] [PubMed] [Google Scholar]
Associated Data
This section collects any data citations, data availability statements, or supplementary materials included in this article.