

Abstract
Background:
Commonly encountered nontraumatic, moderate noise is increasingly implicated in anxiety; however, the neural substrates underlying this process remain unclear.
Objectives:
We investigated the neural circuit mechanism through which chronic exposure to moderate-level noise causes anxiety-like behaviors.
Methods:
Mice were exposed to chronic, moderate white noise [85 decibel (dB) sound pressure level (SPL)], 4 h/d for 4 wk to induce anxiety-like behaviors, which were assessed by open field, elevated plus maze, light-dark box, and social interaction tests. Viral tracing, immunofluorescence confocal imaging, and brain slice patch-clamp recordings were used to characterize projections from auditory brain regions to the lateral amygdala. Neuronal activities were characterized by in vivo multielectrode and fiber photometry recordings in awake mice. Optogenetics and chemogenetics were used to manipulate specific neural circuitry.
Results:
Mice chronically (4 wk) exposed to moderate noise (85 dB SPL, 4 h/d) demonstrated greater neuronal activity in the lateral amygdala (LA), and the LA played a critical role in noise-induced anxiety-like behavior in these model mice. Viral tracing showed that the LA received monosynaptic projections from the medial geniculate body (MG) and auditory cortex (ACx). Optogenetic excitation of the or circuits acutely evoked anxiety-like behaviors, whereas their chemogenetic inactivation abolished noise-induced anxiety-like behavior. Moreover, mice chronically exposed to moderate noise were more susceptible to acute stress, with more neuronal firing in the LA, even after noise withdrawal.
Discussion:
Mice exposed to 4 wk of moderate noise (85 dB SPL, 4 h/d) demonstrated behavioral and physiological differences compared to controls. The neural circuit mechanisms involved greater excitation from glutamatergic neurons of the MG and ACx to LA neurons under chronic, moderate noise exposure, which ultimately promoted anxiety-like behaviors. Our findings support the hypothesis that nontraumatic noise pollution is a potentially serious but unrecognized public health concern. https://doi.org/10.1289/EHP12532
Introduction
Noise is prevalent in urbanized and industrialized modern societies and has been associated with severe, adverse effects on both auditory and nonauditory systems in observational1,2 and rodent studies.3–5 There is evidence in rodents that exposure to high noise levels [ decibels (dB) sound pressure level (SPL)] could not only damage the auditory periphery but also degrade central auditory processing, further leading to hearing disorders such as tinnitus and neuropsychiatric diseases such as anxiety and depression.6–8 Although moderate noise levels ( dB SPL) may pose a public health concern, humans commonly experience such noises in industrial or vocational settings, and traffic.9–12 Moreover, moderate noise did not change hearing sensitivity in rats13,14 but might effect learning and memory in rats,15 insulin resistance in male mice,16 and dysbiosis in the microbiome–gut–brain axis in mice.17 Experience-dependent plasticity of the central auditory system has been observed in developing and adult animals.15,18,19 Still, the effect of chronic, nontraumatic, moderate-level noise exposure on emotional behaviors remains largely unexplored.
The neural substrate for anxiety evoked by long-term daily exposure to moderate noise is enigmatic, and the connections between the auditory and limbic systems have been implicated in seminal investigations.3,20–23 Studies have found that the amygdala, a brain structure of the limbic system, played a critical role in modulating the expression and maintenance of emotional responses in human24 and mice.25 Researchers have extensively investigated reciprocal projections between the auditory system and the amygdala in the context of learned fear in rats20,26 and mice,27 although few studies have yet addressed the involvement of these connections in noise-related anxiety. Neuronal activities in the amygdala were closely linked to anxiety-related behaviors in rats.28 Optogenetic excitation of amygdala neurons29,30 or projections to distinct targets,31,32 such as the hippocampus,31 elicited anxiety-related behaviors in mice. A similar anxiogenic effect was also observed following optogenetic activation of synaptic inputs to the amygdala in mice.33 However, the precise cell type–specific organization and the function (or functions) of the projection from the auditory system to the amygdala in chronic moderate-level noise-induced anxiety remain unknown.
In this study, to establish a model of chronic, moderate (nontraumatic) noise-evoked anxiety, mice were exposed to white noise (85 dB SPL, 4 h/d) for 4 wk. The noise exposure protocol was based on the recommended limit of 85 dBA (A-weighted decibel) for 8 h/d by the National Institute of Occupational Safety and Health (NIOSH)34 and a survey that showed noise levels in some industrial trades35 and environments (including roads36) are not lower than 85 dB SPL. Four hours thus represented the minimum exposure time for those working or living close to heavy traffic37 or in typical conditions commonly encountered in nightclubs or concerts.2,38 This study used white noise because it contains all frequencies across the audible spectrum and has been commonly used in laboratory experiments to mimic environmental noise.16,39,40 Similar protocols (85–90 dB SPL, 4–12 h/d, 21–56 d) have been used to examine the effects of noise on sleep41 and stress hormones42 in rats and insulin resistance43 and immunity44 in mice. Our previous discovery of acute, white noise–evoked mouse escape implied that sudden noise may be linked to negative emotion.45 The open-field (OFT) and elevated plus maze (EPM) tests were used to investigate the effects of long-term noise on anxiety-like behaviors. These exploration-based approach-avoidance conflict tests are based on the opposing tendencies of approach vs. avoidance to potentially dangerous areas in rodents46,47 and reflect similar behaviors observed in humans with anxiety disorders, including avoidance of potentially dangerous situations.47,48
To understand the underlying circuit mechanism, viral tracing, immunofluorescence confocal imaging, and brain slice patch-clamp recordings were used to characterize projections from auditory brain regions to the lateral amygdala; in vivo multielectrode and fiber photometry recordings were used to investigate neuronal activity in awake mice; and optogenetics and chemogenetics were used to artificially manipulate specific neural circuitry. Deciphering the circuit mechanism for noise-evoked anxiety could facilitate a better understanding of the impacts of nontraumatic noise on emotional health.
Methods
Animals
C57BL/6J mice (purchased from Charles River Laboratories) 8–10 wk of age were used in most experiments unless otherwise specified, and Gad2-Cre mice 8 wk of age (purchased from Jackson Laboratories) were only used for brain slice recordings and optogenetic stimulation to investigate the amygdala microcircuit. Because female mice are intrinsically more variable than male mice, male mice were used in the current study. Mice were placed in a colony with 3–5 mice per cage in a stable environment ( ambient temperature) with free access to standard lab mouse pellet food and water on a 12-h light/dark cycle (lights on from 0700 hours to 1900 hours). All experimental protocols were approved by Animal Care Committee of the University of Science and Technology of China (USTC).
Chronic Noise Exposure
The mice were placed in a soundproof chamber (interior size: ; illumination: 100 Lux) with adequate ventilation in two cages (five mice per cage) and provided with food and water ad libitum. The noise was generated in Adobe Audition 3.2, amplified (RX-V359; Yamaha), and presented via a free-field speaker (CP-75A; Shanghai Chuangmu Technology Co. Ltd.).49 The speaker was placed above the mice cages to deliver daily 4–h 85 dB SPL white noise (frequency range of 1 to ) for 4 wk ( mice in total). To examine whether similar behavioral outcomes were also observed in the animal model of noise-induced trauma, another noise exposure protocol that was the same as previously reported,50 in which mice were continuously exposed to narrowband noise ( at 104 dB SPL, 24 h/d) for 8 d ( mice), was used. The noise was measured in decibels using a sound-level meter (AWA-5661-A; Aihua). Mice were returned to the animal breeding room after noise exposure, and control mice received the same manipulations in the soundproof chamber but without noise stimulation ( mice/group).
Auditory Brainstem Response (ABR) Recording
ABR recordings were used to evaluate hearing sensitivity after 4-wk white noise exposure () or 8-d narrowband noise exposure () in noise-exposed and control mice. Tucker-Davis Technologies System 3 hardware (Medusa Pre-Amps, RZ6 Multi I/O Processor, MF1 multifield magnetic speaker) and software (BioSigRZ 5.7) were used for sound delivery and ABR recordings. Acoustic stimuli were transmitted through an open-field magnetic speaker (MF1; Tucker-Davis Technologies). Click-pips (5-ms full-cycle sine waves) were used as auditory stimuli, with 10-dB intensity steps from 10 to 90 dB SPL. To collect sound-evoked bioelectrical potentials, three needle electrodes were subcutaneously inserted in the contralateral ear (reference), the vertex of the head (ground), and the test ear (active) of isoflurane-anesthetized mice. Hearing thresholds were determined as the lowest sound intensity for evoking an ABR waveform in which wave I could be visually discerned. A temperature controller (RWD Life Science) was used to maintain the animals’ body temperatures at 36°C, and the animals’ eyes were covered with ophthalmic ointment for moisture.
Stereotaxic Surgery and Virus Injection
Stereotaxic brain injection was conducted on the mice anesthetized by an intraperitoneal injection of pentobarbital () and mounted on a stereotactic frame (RWD Life Science). The animals’ body temperatures were maintained at 36°C throughout the surgery and virus injections with a heating pad. Based on mouse brain atlas coordinates, a small craniotomy was drilled above the target brain region. A volume of of the virus was delivered into the target areas at a rate of through a glass micropipette with a tip size of in diameter connected to a Hamilton microliter syringe, which is controlled by a microinjection syringe pump (UMP3T-1; World Precision Instruments). After injection, the pipette was rested at the injection site for an additional 5 min before withdrawal to avoid backflow of the virus. Ointment was applied to the eyes of the mice for moisture throughout the experiment. The coordinates were defined as dorso-ventral (DV) from the brain surface, anterior-posterior (AP) from bregma, and medio-lateral (ML) from the midline (in mm).
For retrograde tracing, the lateral amygdala (LA) (AP, ; ML, ; DV, ) was injected with AAV2/2Retro-hSyn-eGFP-WPRE-pA (rAAV2/2-EGFP, viral genome (vg) per milliliter, ; Taitool Bioscience) ( mice) that could infect the axon terminals and was transported retrogradely to the soma for enhanced green fluorescent protein (EGFP) expression. Three weeks later, mice were transcardially perfused to harvest the brains for immunostaining by using antibodies for glutamate and GABA in brain slices containing the auditory cortex (ACx) ( slices/group) and/or the medial geniculate body (MG) ( slices/group).
To simultaneously visualize the LA neurons innervated by the ACx and the MG, the anterograde trans-synaptic virus AAV2/1-hSyn-Cre-WPRE-pA (, ; Taitool Bioscience) and AAV2/1-hSyn-Flpo-WPRE-pA (, ; Taitool) was injected into the ACx and MG, respectively; and the Flpo-dependent (AAV-fDIO-EYFP, , ; BrainVTA) and Cre-dependent (AAV-DIO-mCherry, , ; BrainVTA) were co-injected into the ipsilateral LA (AP, ; ML, ; DV, ). The mice () were then returned to their home cages to allow for viral expression. After a waiting period of 3 wk, the mice were sacrificed, and the brains were removed for cryosection to visualize the EYFP and mCherry fluorescence signals ( slices/group) in the LA.
For optogenetic activation of the or circuits, the (, AAV2/9, ; BrainVTA) virus was injected into the ACx () or MG () of C57 mice ( mice/group). The optical fiber with a diameter of (FOC-C-W-200-1.25-0.37-4.0; Newdoon Technology Co., Ltd.) was subsequently implanted above the LA. The optic fiber ferrule was firmly secured with dental cement for connecting the laser generator. For chemogenetics, (, AAV2/9, , ; BrainVTA) virus was injected into the LA for selective activation of LA glutamatergic neurons ( mice). To selectively silence ACx and MG projection terminals at the LA, the (, AAV2/9, ; BrainVTA) virus was infused into the ACx () and MG () ( mice). The cannula was implanted at the LA, affixed with dental cement at the skull, and capped for later local application of clozapine N-oxide (CNO; Sigma). The (, AAV2/9, ; BrainVTA) virus was used as the control ( mice/group). All virus was bilaterally injected through two craniotomies over the target regions to achieve the maximal effect for optogenetic and chemogenetic behavioral experiments. Unless otherwise stated, all viruses were packaged by BrainVTA Company. Virus aliquots were frozen at for long-term storage, and an aliquot was taken out and stored at 4°C for immediate use. All animals were transcardially perfused with ice-cold 0.9% saline followed by ice-cold 4% paraformaldehyde (PFA) dissolved in phosphate buffer (). The isolation of the brains and the preparation of brain slices are described in the “Methods” subsection titled “Immunohistochemistry and Imaging”. A confocal microscope (LSM880; Zeiss) captured images with fluorescence signals. A brief description of each virus used in these experiments is provided in Excel format in Excel Table S5. Animals with missed injections were excluded from further analysis, as reported in Excel Table S6.
Optogenetic and Chemogenetic Manipulations
For optogenetic manipulation, experimenters handled mice for 3 d before behavioral tests. Mice were transferred to the testing room on the day of the experiment and acclimated for . The mice were isoflurane-anesthetized for attaching the chronically implanted optical fibers to a laser generator (Shanghai Fiblaser) with the fiber optic cable and sleeves. Then the mice were allowed to recover for at least 30 min in their home cages. A Master-8 pulse stimulator (AMPI) was used to trigger the laser generator to emit blue light (, , 15-ms pulses, ) for selective activation of the ACx or MG ( mice/group) projection terminals at the LA or the LA ( mice). The control mice received the same stimulation ( mice/group). In chemogenetics, for systemic ligand administration, mice under isoflurane anesthesia were intraperitoneally given a dose of CNO (; Sigma) or saline 30 min before behavioral testing; for local ligand application, CNO (, ; Sigma) was perfused through the drug cannula connecting to a Hamilton microliter syringe, which is controlled by a microinjection syringe pump (UMP3T-1; World Precision Instruments) in mice under brief isoflurane anesthesia ( mice/group). After all behavioral tests, mice were killed to confirm the sites for virus injection and optical fibers. Data from mice with incorrect injection or placement were excluded from further analysis.
Local Drug Infusion
A catheter ( in diameter; RWD) was chronically implanted at brain areas of interest, including LA (AP, ; ML, ; DV, ), ACx (AP, ; ML, with a 12° angle; DV, ), and MG (AP, ; ML, ; DV, ), in anesthetized mice mounted in a stereotaxic apparatus. The implant was firmly cemented to the mouse skull and capped until drug application. An internal stainless-steel injector was connected to the guide cannula with a diameter of for locally infusing CNO (, ; Sigma), muscimol (, ; Sigma) or saline into the LA ( mice/group), and muscimol or saline into the ACx ( mice/group) or MG ( mice/group) at a flow rate of using a syringe (Hamilton) and an infusion pump. The injector was gently withdrawn 2 min after infusion, and about 30 min later, the behavioral tests were conducted. After completing all behavioral tests, the site for the implanted catheter was also confirmed. Data from mice with incorrect placement were excluded from further analysis.
In Vivo Multielectrode Electrophysiology in Head-Fixed Mice
The mice under isoflurane anesthesia were placed in the stereotaxic frame, and a custom-made headpost was cemented on the skull ( mice/group). The headpost was firmly attached to a holder for head fixation. The mice were trained to habituate the fixation apparatus and to run freely on a circular plexiglass plate (diameter: ). One day before the first multielectrode recordings, the mice were anesthetized with isoflurane, and a craniotomy was performed in isoflurane-anesthetized mice above the LA sealed with KWIK-SIL silicone adhesive (World Precision Instruments) until the recording experiments. On the day of the recordings, the adhesive was removed to expose the craniotomy on the head-fixed mice. A 16-channel silicon probe (two shanks spacing in , electrode site spacing in ; Jiangsu Boen Medical Technology) was remotely controlled and lowered into the LA by a single-axis micromanipulator (S-IVM-1500P; Scientifica). The electrodes were allowed to rest for at least 20 min before recording. Spike signals were amplified and stored using a Neurostudio amplifier and Neurostudio data acquisition software (Great Think Medical Technology). Spike sorting was performed with a sorting method involving the T-Dis E-M algorithm built-in Offline Sorter 4 (Plexon). The firing rates of sorted units were calculated using Neuroexplorer 5 (Nex Technologies).
In Vivo Fiber Photometry Recordings
Fiber photometry was used to record calcium signals ( mice/group). Specifically, an injection of (, AAV2/9, ; , BrainVTA) virus and the implantation of an optical fiber ( OD, 0.37; NA, Newdoon) were performed at the LA. The mice were allowed to recover for at least 3 wk before fiber photometry recording. A mono fiber optic patch cord (MFO-1x2-F-W1.25-200-0.37-100; Inper Ltd.) connected to a fiber photometry system (INPER-C1-3C, Inper Ltd.) was attached to the implanted fiber optic cannula. To record GCaMP6m fluorescence signals, LED light was bandpass filtered (), collimated, reflected by dichroic mirrors, focused using a and then delivered at a power of at the tip of the fiber optic cannula. The emitted fluorescence from GCaMP6m was bandpass filtered () and focused on the sensor of a CMOS camera. The end of the fiber was imaged at a frame rate of 60 fps with InperSignal software, and the mean fluorescence value of the ROI at the end-face of the fiber was calculated using InperPlot 1.0 software. To serve as an isosbestic control channel, LED light was bandpass filtered () and delivered alternately with LED light. GCaMP6m fluorescence intensity was recorded before, during, and after sound stimulation. The changes in fluorescence () were calculated by the equation of , and the signals at 5 s before noise stimulation were set as the baseline [F0(t)]. All heat maps and averaged signal traces with shaded areas representing the standard error of the mean were generated in InperPlot software (Inper Technology).
In Vitro Electrophysiological Recordings
Mice were anesthetized with pentobarbital sodium (2% w/v, i.p.) and then intracardially perfused with a ice-cold carbogenated modified N-methyl-D-glucamine artificial cerebrospinal fluid (NMDG ACSF) that included (in mM) 93 NMDG, 1.2 , 2.5 KCl, 20 N-2-hydroxyethylpiperazine-N-2-ethanesulfonic acid (HEPES), 30 , 5 Na-ascorbate, 2 thiourea, 25 glucose, 0.5 , 10 , and 3 Na-pyruvate (GSH). The mice were decapitated, and the removed brain was glued to the vibratome bed plate. The coronal slices () containing the LA, the ACx, or the MG were sectioned at in ice-cold NMDG ACSF (VT1200s; Leica). The slices were then incubated in NMDG ACSF at 33°C for 12 min before being transferred to HEPES ACSF containing (in mM) 92 NaCl, 2.5 KCl, 20 HEPES, 30 , 1.2 , 25 glucose, 5 Na-ascorbate, 3 Na-pyruvate, 2 , 2 , 2 thiourea, and 3 GSH at 28°C for at least 1 h. Slices were transferred to a recording chamber (RC-27; Warner Instruments) and constantly perfused with carbogenated recording solution ( NaCl, KCl, 3 HEPES, , , glucose, , and ) at a rate of at 32°C, which was maintained by an in-line solution heater (TC-344B; Warner Instruments). The pH of all ACSF was set to 7.3–7.4, the osmolarity to , and bubbled continuously with 95% .
An infrared-sensitive CCD (charge-coupled device) camera with a lens (BX51WI; Olympus) was used for whole-cell patch-clamp recordings to visualize the neurons. Patch pipettes () were filled with internal solution containing (in mM) 130 K-gluconate, 5 KCl, 2 , 10 HEPES, 0.6 EGTA, 0.3 Na-GTP, and (pH: 7.2–7.3, osmolarity: ) and pulled from borosilicate glass capillaries (VitalSense Scientific Instruments) on a horizontal micropipette puller (P1000; Sutter Instruments). The neurons were held at or in voltage-clamp mode to record membrane currents and at 0 pA in current-clamp mode to record action potential firings or membrane potentials ( cells/group).
For recording light-evoked postsynaptic responses, blue light was generated through a laser generator (Shanghai Fiblaser Technology) and delivered through an optical fiber ( in diameter; Inper) placed above the target region of the brain slice. For recording disynaptic light-evoked PSC, the neurons were held at to get a biphasic current consisting of an inward excitatory postsynaptic current (EPSC) followed by an outward inhibitory postsynaptic current (IPSC). To dissect the LA microcircuit, light-evoked IPSCs were recorded in glutamatergic neurons of Gad2-Cre mice with LA injection of (AAV-DIO-ChR2, , ; BrainCase) and (AAV-CaMKII-EYFP, , ; BrainVTA). For recording miniature excitatory postsynaptic currents, neurons were held at a holding potential of in the ACSF containing tetrodotoxin (TTX, ) and picrotoxin (PTX, ). For recording miniature inhibitory postsynaptic currents, neurons were held at a holding potential of in the ACSF containing TTX () and 6,7-dinitroquinoxaline-2,3(1H,4H)-dione (DNQX, ). To obtain light-induced monosynaptic currents, TTX () and 4-aminopyridine (4-AP; ) were added to the bath solution. The signals were acquired with a Multiclamp 700B amplifier and an Axon 1550B digitizer, low-pass filtered at , digitized at , and analyzed with Clampfit 11 software (Molecular Devices). The data were acquired from the recordings with a series resistance of . The recording was immediately terminated if the series resistance changed beyond 20%. TTX was purchased from Hebei Aquatic Science and Technology Development Company.
Immunohistochemistry and Imaging
The mice were deeply anesthetized with pentobarbital sodium (, i.p.) and then transcardially perfused with saline and 4% (wt/vol) paraformaldehyde (PFA). Afterward, the brains were carefully removed and postfixed in 4% PFA at 4°C overnight. Followed by brain cryoprotection in 30% (w/v) sucrose, coronal slices () were sectioned on a cryostat (Leica CM1860) and used for immunofluorescence. The collected slices ( mice/group) were preserved at in a cryoprotectant solution consisting of phosphate-buffered saline (PBS), 20% ethylene glycol (v/v), and 30% glycerol (v/v) for further imaging or staining. For immunofluorescence staining, the brain slices were washed three times with PBS and then blocked with 10% donkey serum in PBS with 5% Triton X-100 for 1.5 h at room temperature. The slices were then incubated with specific primary antibody with 3% donkey serum and Triton X-100 for 24 h at 4°C, followed by another incubation of the corresponding fluorophore-conjugated secondary antibody for 1.5 h at room temperature. The primary antibodies included antibodies for GABA (1:500, A2052, Rabbit; Sigma-Aldrich), glutamate (1:500, G5562, Rabbit, Sigma-Aldrich) and c-Fos (1:500, 226003, Rabbit, Synaptic Systems), and the secondary antibodies include Alexa fluor 488-anti-Rabbit secondary antibody (1:500, A21206; Invitrogen), Alexa fluor 594-anti-Rabbit secondary antibody (1:500, A21207; Invitrogen) and Alexa fluor 647-anti-Rabbit secondary antibody (1:500, A31573; Invitrogen). Subsequently, the brain slices were counterstained with DAPI (1:1,000; Sigma-Aldrich) for 2 min, washed three times and then mounted and coverslipped for imaging. Fluorescence signals of the slices were visualized and imaged using the confocal microscopes (LSM880 and LSM980; ZEISS) and analyzed by ImageJ (National Institutes of Health). For counting fluorescence-positive cells, a threshold was applied to 8-bit grayscale images. The threshold was set within 10% of the average intensity, and cells at or above the threshold are considered fluorescence-positive.
Behavioral Tests
Noise exposure was conducted in a separate room from the behavioral testing room and animal breeding room; all rooms had the same ambient noise level (45 dB SPL). Chronic noise-exposed mice subjected to noise withdrawal were placed in the animal breeding room for 4 wk. The open-field test (OFT) and elevated plus maze tests were performed on the same batch of mice, whereas the rotarod, light-dark box, and social interaction tests were performed on a separate batch of mice. The behaviors in the OFT and elevated plus maze test were typically recorded for 5 min to reduce habituation. After each usage, the experimenters completely wiped the apparatus with 75% ethanol to remove odor cues. In experiments to examine their susceptibility to acute noise exposure, all chronic noise-exposed mice or control were subjected to 4-wk noise withdrawal, and then their behaviors were tested before and after 2-h noise exposure.
OFT.
An open-field apparatus () consists of a center square () and a peripheral area surrounded by high walls. The mouse was placed in one corner of the apparatus lit at 10 Lux and allowed to explore for 5 min freely, and the moving trajectory was video-recorded. Mice that spend more time close to the walls are considered more “anxious” than those who spend more time in the center.51 In optogenetics, the behaviors in two 5-min episodes of baseline and blue light (, 15-ms pulses, ) were recorded to evaluate the effect of optical stimulations on anxiety-like behavior. The time spent in the center zone and total travel distance were calculated offline by EthoVision XT software (Noldus) to measure anxiety-like behavior ( mice/group).
Elevated plus maze test.
An elevated plus maze apparatus lit at 10 Lux consists of a plus-shaped maze above the floor with two closed arms (), open arms (), and a center area (); the closed arms and open arms are orthogonal to each other. The mouse was placed in the center area, facing a closed arm, and allowed to explore for 5 min freely. The moving trajectory was recorded using a video camera placed above the apparatus ( mice/group). Less time spent in the open arms is interpreted as increased anxiety.52 In optogenetics, behaviors in two 5-min episodes of baseline and blue light (, 15-ms pulses, ) were recorded to evaluate the effect of optical stimulations on anxiety-like behavior. EthoVision XT software (Noldus) calculated the time spent in the open arms to measure anxiety-like behavior offline.
Light–dark box.
The light–dark boxes comprised a light chamber and a dark chamber of equal size (). A wall with an open gate () separated the chambers, allowing free exploration of either chamber. The mice were placed in the light chamber and allowed to freely explore the apparatus for 15 min ( mice/group). The travel paths were videotaped and analyzed offline with EthoVision XT software (Noldus). The amount of time spent in each chamber was calculated.
Social interaction.
The apparatus consists of an open field () and a transparent cylinder ( in height, in diameter) positioned at the middle bottom of one of the open field’s walls. Each mouse was placed in the center zone during testing, and the total distances traveled were videotaped for 5 min with an empty transparent cylinder ( mice/group). Following that, a stranger mouse was introduced into the transparent cylinder and recorded for another 5 min. All behaviors were analyzed offline using EthoVision XT software (Noldus). The area for social interaction was defined, and the social interaction index was calculated by dividing the amount of time spent on social interactions in the second 5 min by the amount of time spent on social interactions in the first 5 min.
Rotarod test.
Rotarod tests were used to assess locomotor ability: Mice were gently placed on a rotatable rod (LE8205; Panlab) that was accelerated from 4 to over 5 min ( mice/group). The time from the start of the rotation to the mouse falling in each trial was recorded as the latency to fall. On the test day, each mouse received three trials.
Statistical Analysis
GraphPad Prism 8.0.2 (Graph Pad Software) was used for statistical analysis and graph plotting. The normality of data was checked with the Shapiro-Wilk test. Two-tailed unpaired Student’s t-test was conducted for two-group comparison. For comparison among more than two groups, two-way analysis of variance (ANOVA) was used to evaluate the statistical significance, followed by the Bonferroni post hoc test for multiple comparisons between groups. Mann-Whitney U-test was used for data with nonnormal distributions. Statistical power analysis for behavioral data was performed by using G*power3.53 All numerical data were reported as the error of the mean (SEM). Significance levels were indicated as *, **, ***.
Results
Characterization of the Hearing and Behavioral Effects of Chronic Moderate Noise Exposure
To explore the relationship between chronic moderate-level noise exposure and anxiety, we exposed mice to white noise daily (85 dB SPL, 4 h/d for 4 wk) in a soundproof chamber (Figure 1A; Figure S1A). The auditory brainstem responses (ABR) to clicks were measured after completion of noise exposure, and we found no difference in ABR threshold between noise-exposed and control groups (Figure 1B,C). Then, two well-validated paradigms, including the OFT and the EPM,54 were used to examine anxiety-like behaviors. We observed that noise-exposed mice spent less time in the center of the OFT (Figure 1D,E) and the open arms of the EPM (Figure 1D,F) in comparison with control mice not exposed to white noise. This noise-induced, anxiety-like behavior developed progressively, appearing in the third week and stabilizing for the remainder of the experimental period (Figure 1E,F). No significant differences in total travel distance (Figure 1G–I) were found between noise-exposed and control mice. In addition, the light–dark box and social interaction tests showed that, in comparison with control mice, noise-exposed mice preferred the dark side in the former test (Figure 1J,K) and spent less time interacting with stranger mice in the latter (Figure 1L,M). In addition, noise-exposed mice showed no difference from control mice in latency to fall in rotarod tests (Figure S1B) or body weight during the experimental period (Figure S1D). Notably, anxiety-like behaviors were also observed in mice with noise-induced trauma ( narrowband noise, 104 dB SPL for 8 d, 24 h/d) (Figure S1E-I). Based on these findings that a 4-wk regimen of daily exposure to nontraumatic white noise could induce anxiety-like behaviors, this anxiety-induction protocol was used in all subsequent experiments, unless otherwise stated.
Figure 1.
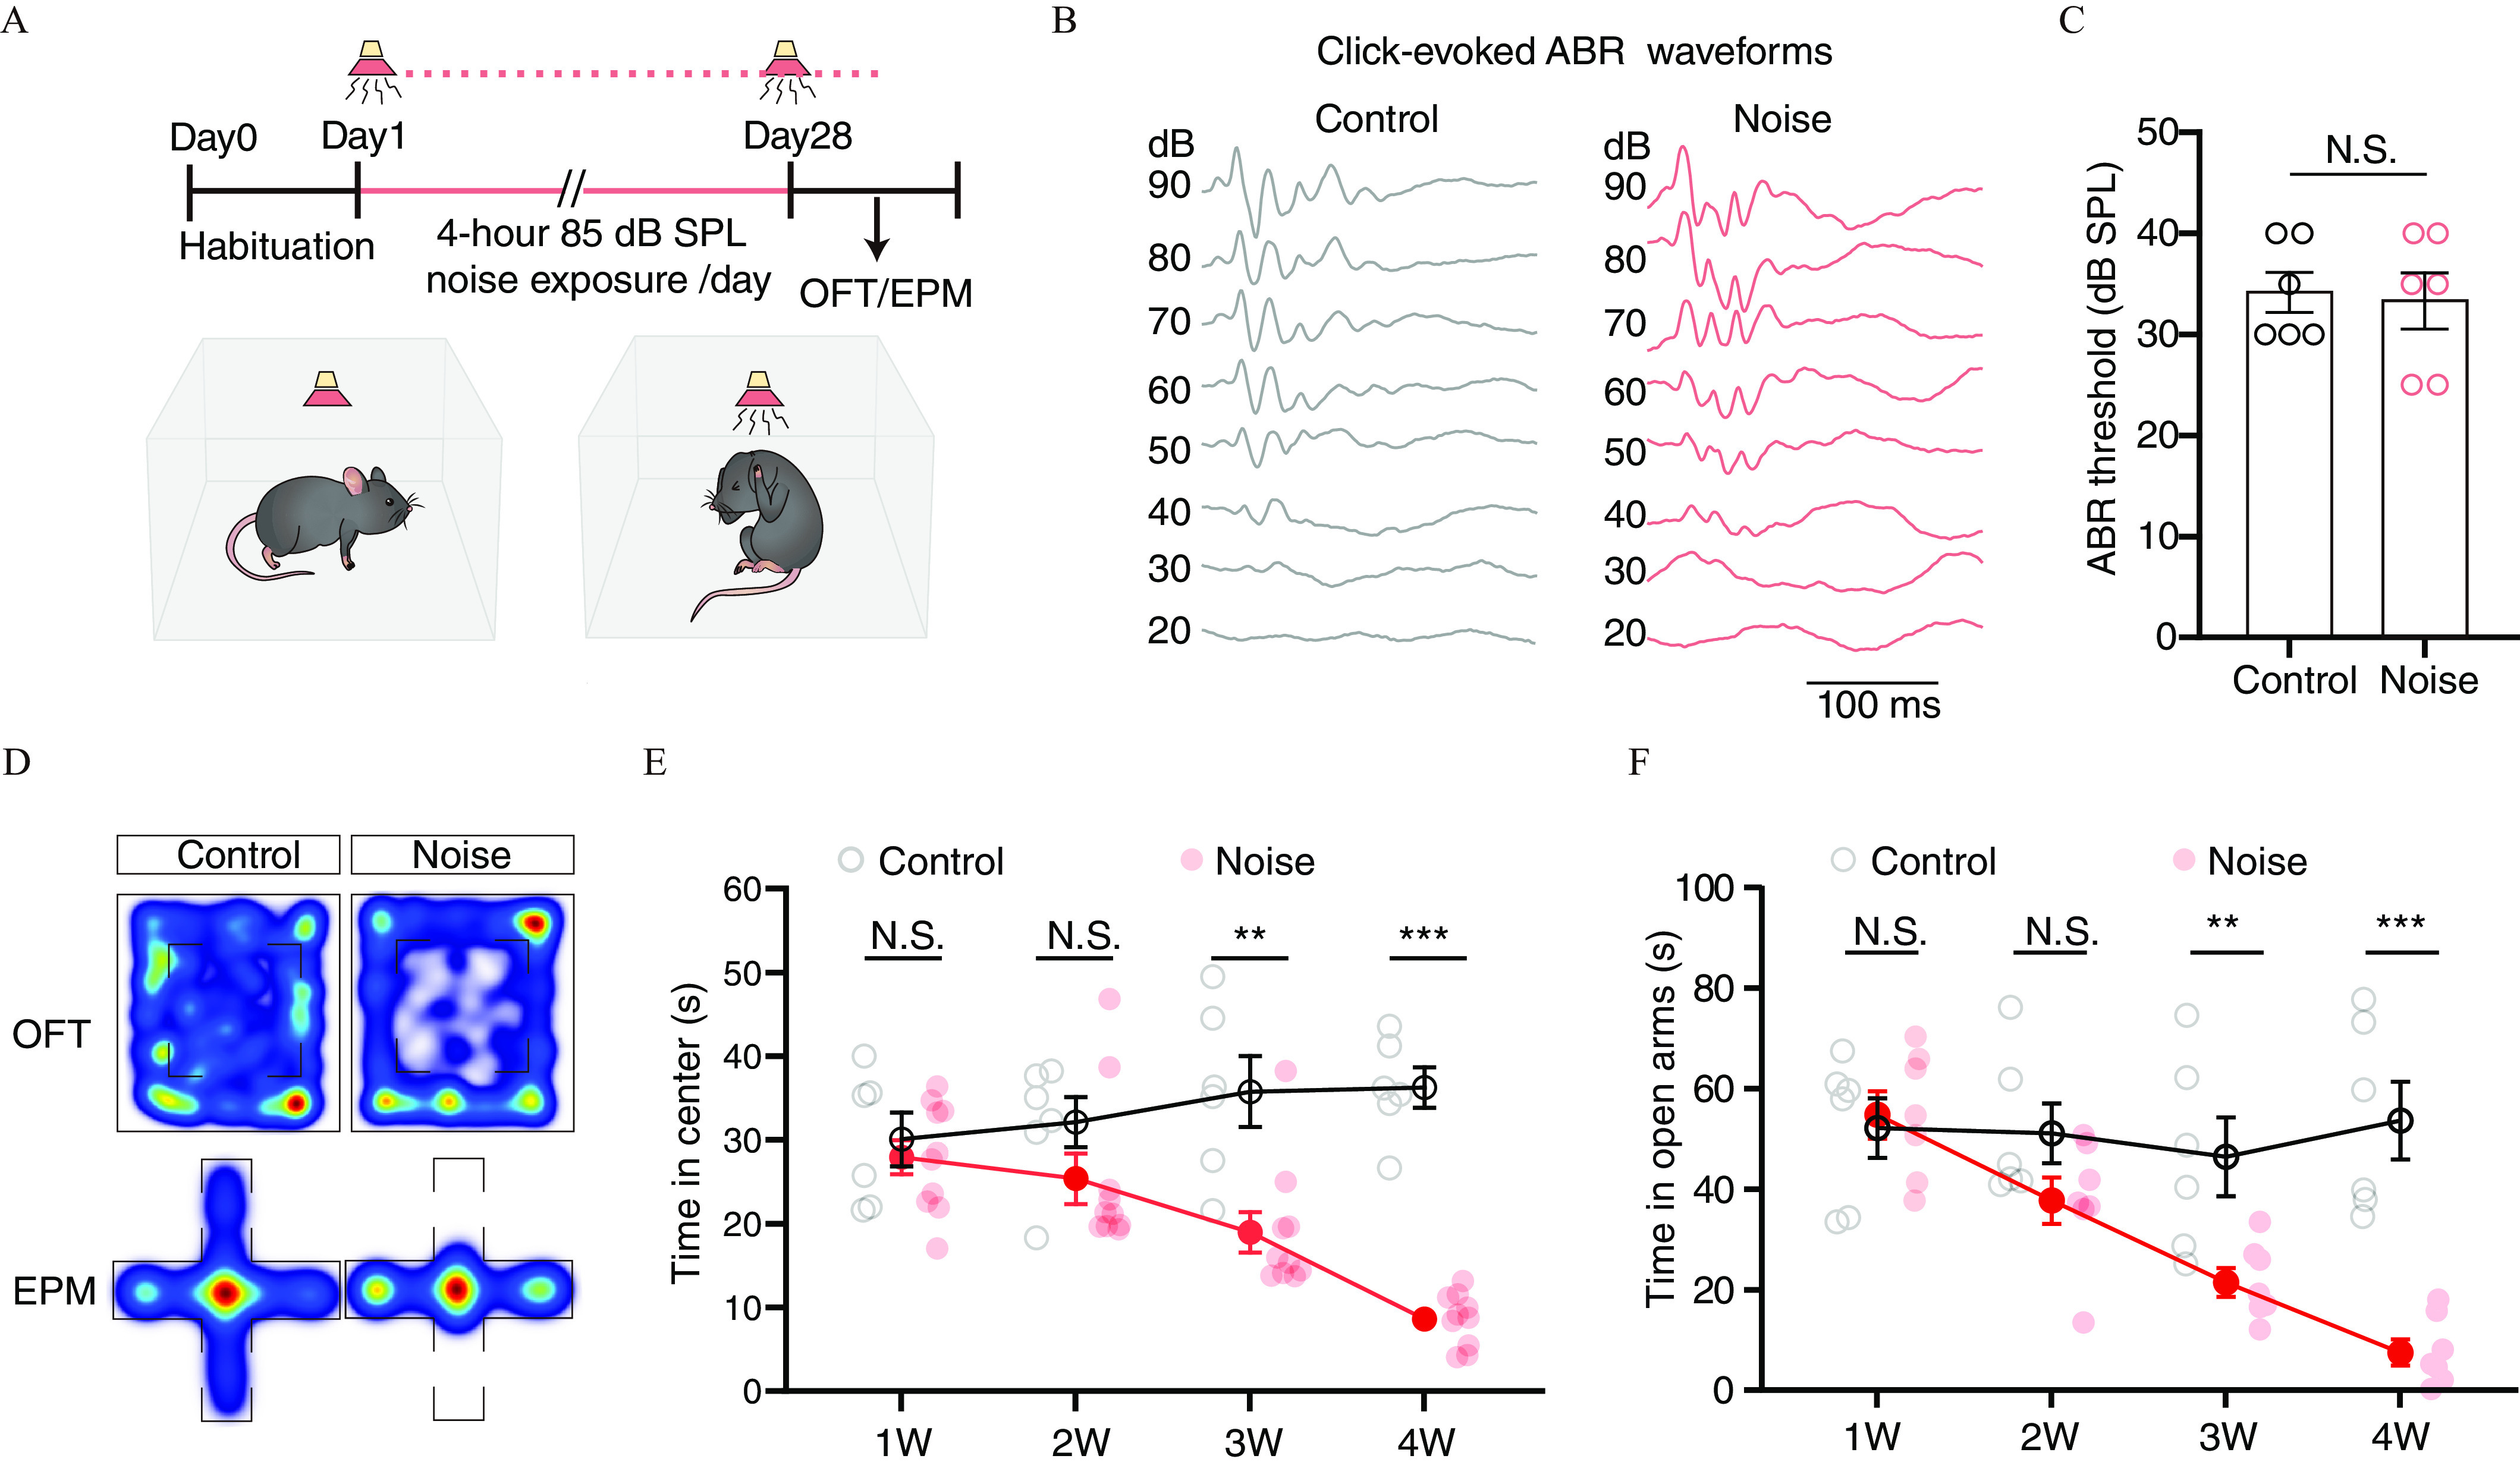

Experimental overview, auditory brainstem response and behavioral outcomes in mice exposed to white noise for 4 wk. The mice were exposed to 85 dB SPL white noise for 4 wk (4 h/d), and auditory brainstem responses were used to determine the hearing sensitivity, and OFT and EPM tests were used to examine anxiety-like behaviors. (A) Timeline for noise exposure and behavioral tests (top) and schematic for noise exposure in a sound-proof chamber (bottom). (B) Representative waveforms for ABR evoked by click stimuli at different sound pressure levels in 10 dB steps. (C) Summarized data for click-evoked ABR thresholds (, ). (D) The representative heatmaps for moving trajectory in OFT (top) and EPM (bottom). (E and F) Summarized data for time spent in the center of the OFT (E, 1W, , ; 2W, , ; 3W, , ; 4W, , ), and in the open arms of the EPM (F, 1W, , ; 2W, , ; 3W, , ; 4W, , ) at different time points of noise exposure. (G) Representative path tracks in OFT (top) and EPM (bottom). (H and I) Summarized data for the total travel distance in the OFT (H, 1W, , ; 2W, , ; 3W, , ; 4W, , ), and the EPM (I, 1W, , ; 2W, , ; 3W, , ; 4W, , ) at different time points during the four treatment period. (J and K) Representative heatmaps of track paths in light–dark box test (J) and summarized data for time spent in the dark side (K, , ). (L and M) Representative heatmaps of track paths in the social interaction tests (L) and summarized data for interaction time with stranger mice (M, , ). The data are expressed as the . **; ***. Two-way ANOVA analysis for (H) and (I). Unpaired Student’s t-test for 1W and 4 W in (E), (F), (H), (I), (K) and (M). Mann-Whitney U-test for (C), 2W and 3W in (E), and (F). For (C) control mice, 6 noise mice. For (E) control mice, 10 noise mice. For (F) control mice, 7 noise mice. For (H) control mice, 10 noise mice. For (I) control mice, 7 noise mice. For (K) control mice, 10 noise mice. For (M) control mice, 10 noise mice. The numerical data underlying this figure are shown in Excel Tables S1–S2. Note: ABR, auditory brainstem response; ANOVA, analysis of variance; dB, decibel; EPM, elevated plus maze; NS, not significant; OFT, open-field tests; SEM, standard error of the mean; SPL, sound pressure level.
Electrophysiological and Behavioral Effects of Chemically Inactivating the Lateral Amygdala in Noise-Exposed Mice
To examine for potential links between the auditory and limbic systems, c-Fos staining was conducted. In addition to the medial geniculate body (MG) and auditory cortex (ACx), the lateral amygdala of mice exposed to a short-duration noise (5 s, 85 dB SPL) displayed marked enrichment for c-Fos–positive cells, indicative of activation (Figure S2A,B). To test whether the LA participates in noise-induced anxiety, we probed differences in LA neuronal activity of 4-wk noise-exposed mice in comparison with control mice. Given that the large majority () of LA neurons are glutamatergic,55 we focused on these principal output neurons. First, LA glutamatergic neurons were transfected with AAV-GCaMP6m under the control of the ( protein kinase II ) promoter (Figure 2A,B). Fiber photometry recordings in free-moving mice revealed that the sound-evoked calcium signal was noticeably larger in noise-exposed mice than in controls (Figure 2C,D). Then, multielectrode recordings were used to characterize neuronal activity of head-fixed moving mice at single-cell resolution. This experiment showed that spontaneous firing in the LA was considerably higher in noise-exposed mice than that in control animals (Figure 2E,F). Moreover, whole-cell recordings revealed that the frequency of miniature excitatory postsynaptic currents (mEPSCs) was also higher than that in control mice (Figure 2G–I), whereas the frequency and amplitude of miniature inhibitory postsynaptic currents (mIPSCs) were significantly lower (Figure 2J–L), suggesting that an imbalance between excitation and inhibition in the LA could be related to more LA neuronal activities in noise-exposed mice.
Figure 2.


Calcium signals, spontaneous firing, synaptic transmission in the LA of noise-exposed mice, and behavioral effects of LA chemical inactivation. In vivo fiber photometry, silicon probe extracellular recordings, and in vitro brain slice patch-clamp recordings were used to investigate the LA neuronal activity and synaptic transmission. Observations of elevated excitability in the LA led us to investigate whether blocking LA activity could abolish noise-evoked anxiety-like behaviors. (A) Schematic for fiber photometry recording in the LA. (B) Schematic (top) and typical image (bottom) of AAV-GCaMP6m viral injection and optical fiber implantation in the LA. Scale bars: . (C) Heatmap of GCaMP6m calcium signals evoked by white noise (100-ms duration, 85 dB SPL). (D) Averaged traces for of GCaMP6m signals. (E) Schematic for extracellular recordings using a silicon probe in head-fixed mice. (F) Representative voltage traces (top) and summarized data (bottom) of spontaneous firings recorded in the LA (, ). (G) Sample current traces of mEPSCs recorded in LA neurons of control and noise-treated mice. (H and I) Summarized data for the frequency (H, , ) and amplitude (I, , ) of the mEPSCs. (J) Sample current traces of mIPSCs recorded in LA neurons of control and noise-treated mice. (K and L) Summarized data for the frequency (K, , ) and amplitude (L, , ) of the mIPSCs. (M) Representative image of a coronal brain slice showing cannula tracks above the LA (top) and the timeline for noise exposure, chemical inactivation, and behavioral tests. Scale bars: . (N and O) Typical voltage traces recorded in the LA following local application of muscimol or saline (N) and summarized data for spontaneous firing rates in naive mice (O, saline vs. muscimol, , ; Baseline vs. saline, , ). (P–R) Summarized data for time spent in center (P, , ) and total travel distance (Q, , ) in the OFT, and time in open arms of EPM (R, , ) in noise-exposed mice treated with muscimol or saline. The data are expressed as the . *; **; ***. Unpaired t-test for (H), (I), (K), (L); Baseline vs. saline in (O), (P), (Q), and (R). Mann-Whitney U-test for (F) and saline vs. muscimol in (O). For (F) control cells, 32 noise cells. For (H) control cell, 14 noise cells. For (I) control cells, 14 noise cells. For (K) control cells, 9 noise cells; For (L) control cells, 9 noise cells. For (O) baseline cells, 11 saline cells, 11 muscimol cells. For (P) saline mice, 9 muscimol mice. For (Q) saline mice, 9 muscimol mice. For (R) saline mice, 10 muscimol mice. The numerical data underlying this figure are shown in Excel Tables S1–S3. Note: AAV, adeno-associated virus; ANOVA, analysis of variance; CaMKII, calcium-calmodulin (CaM)-dependent protein kinase II; dB SPL, decibel sound pressure level; EPM, elevated plus maze; GCaMP6m, green fluorescent protein-based genetically encoded calcium indicator; LA, lateral amygdala; , lateral amygdala glutamatergic neurons; mEPSC, miniature excitatory postsynaptic currents; mIPSCs, miniature inhibitory postsynaptic currents; OFT, open-field tests; NS, not significant; SEM, standard error of the mean.
To further investigate the role of the LA in noise-induced anxiety, we used bilateral perfusion of muscimol (Figure 2M) to locally suppress spontaneous firing in LA neurons (Figure 2N,O). Noise-exposed mice treated with muscimol spent more time in the center during the OFT and more time in open arms in the EPM than noise-exposed mice treated with saline (Figure 2P–R; Figure S3). To test whether LA neurons were alone sufficient to mediate noise-induced anxiety, we selectively activated LA glutamatergic neurons () by infusing the LA of mice with channelrhodopsin-2 (ChR2) virus () (Figure 3A,B). Mice with injections spent less time spent in the center of the OFT (Figure 3C) and open arms of the EPM (Figure 3D) than control mice following optical excitation of the LA. Chemogenetic activation of neurons by bilateral injection with virus () further corroborated these results (Figure 3E–H), indicating that artificial activation of the LA could acutely produce anxiety-like behaviors. These results suggested that neurons were sufficient and necessary for noise-evoked anxiety in the current model system.
Figure 3.

Electrophysiological recording and behavioral tests in mice with optogenetic or chemogenetic activation of the LA. To investigate the role of the LA in noise-evoked anxiety, neuronal activity in the LA was optogenetically or chemogenetically activated by direct injection of the LA with AAV-CaMKII-ChR2 or AAV-CaMKII-hM4Di viruses in C57 BL/6 mice. Brain slice recordings were used to validate the expression of each transfected virus, and anxiety-like behaviors were examined by OFT and EPM tests following optogenetic or chemogenetic manipulation of the LA. (A) Schematic for viral injection and optogenetics (top) and a typical image showing the optical fiber track above the mCherry-expressing LA (bottom). Scale bars: . (B) Sample traces of action potentials evoked by light (blue bars) recorded in ChR2-positive LA neurons in acute brain slices. (C and D) Summarized data for time spent in the center (C, interaction, , ; main effect of light, , ) of the OFT and in the open arms of the EPM (D, interaction, , ; main effect of light, , ) before (pre) and during (light) light stimulation. (E) Schematic for bilateral viral injection for chemogenetic experiments. (F) Change in membrane potential in response to CNO perfusion ( interaction, , ; main effect of virus, , ). (G and H) Summarized data for time spent in the center (G, interaction, , ; main effect of drug, , ) of the OFT and in the open arms of the EPM (H, interaction, , ; main effect of drug, , ) in mice treated with CNO or saline. The data are expressed as the . **; ***. Two-way ANOVA with Bonferroni post hoc analysis for (C), (D), (F), (G), and (H). For (C) mCherry mice, 12 ChR2 mice. For (D) mCherry mice, 10 ChR2 mice. For (F) mCherry cells, 4 hM3Dq cells. For (G) mCherry mice, 6 hM3Dq mice. For (H) mCherry mice, 6 hM3Dq mice. The numerical data underlying this figure are shown in Excel Tables S1 and S3. Note: AAV, adeno-associated virus; ANOVA, analysis of variance; ChR2, channelrhodopsin-2; CNO, clozapine-N-oxide; EPM, elevated plus maze; hM3Dq, human M3 muscarinic receptor; LA, lateral amygdala; OFT, open-field tests; NS, not significant; Pre, before light stimulation; SEM, standard error of the mean.
Morphological and Functional Dissection of the Auditory Inputs to the LA
In light of this pivotal role of the LA in noise-induced anxiety-like behaviors, we mapped inputs to the LA using a retrograde tracing strategy (Figure 4A,B). Injection of retroAAV expressing EGFP (retroAAV-EGFP) into the LA led to EGFP-positive neurons projecting into multiple brain areas, such as the cerebral cortex, the hippocampus, and the thalamus (Figure S4). Among these regions, the MG and ACx belong to the nuclei responsible for processing auditory information (Figure 4C,F). EGFP-containing MG neurons could be visualized mainly in nonlemniscal thalamic nuclei, including the medial and dorsal subdivisions (Figure 4C), whereas EGFP-containing ACx neurons were primarily visualized in layers V and VI (Figure 4F), which was consistent with the notion that corticofugal projections originate from deep-layer neurons. Further immunofluorescence staining for glutamate or GABA confirmed that these EGFP-positive neurons in the MG and ACx were glutamatergic rather than GABAergic (Figure 4D,E,G,H).
Figure 4.


Viral tracing and patch-clamp recording for morphological and functional characterization of auditory inputs to the LA. Retrograde viral tracing at the LA was used to identify auditory brain regions with LA-projecting neurons, and anterograde viral tracing at these auditory nuclei was performed to morphologically confirm the connections; functional synapses were examined using electrophysiological recordings and optogenetic stimulation in brain slices. (A) Schematic of viral injection for retrograde tracing. (B) Representative image of a successful viral injection in the LA. Scale bars: . (C) Retrogradely traced neurons in the auditory thalamus. Scale bars: . (D) Cell type identification of traced EGFP-positive MG neurons; most traced neurons were immunoreactive to antibody against glutamate (top) but none to antibody against GABA (bottom). Scale bars: . (E) The percentage of glutamate and GABA neurons among the traced EGFP-positive MG neurons. (F) The retrogradely traced neurons in the temporal regions. Scale bars: . (G) Cell type identification of traced EGFP-positive ACx neurons; most traced neurons were immunoreactive to the antibody for glutamate (top) but few to the antibody for GABA (bottom). Scale bars: . (H) The percentage of glutamate-positive and GABA-positive neurons among the traced EGFP-positive ACx neurons. (I) Tracing strategy using a Cre-loxP system to dissect the circuit and an Flp-FRT system to dissect the circuit. (J) Representative images of anterogradely traced LA neurons (green, EYFP) postsynaptic to MG projection fibers and those (red, mCherry) postsynaptic to ACx fibers. Scale bars: . (K) Typical images showing predominant co-localization of traced fluorescent neurons with glutamate immunofluorescence signals but few co-localizations with GABA immunofluorescence signals in the LA. Scale bars: . (L) The percentage of EYFP-positive cells or mCherry-positive cells containing glutamate or GABA in the LA. (M) Schematic for whole-cell recordings combined with optogenetics. (N) Sample traces of action potentials (top, current-clamp mode) and postsynaptic currents (bottom, voltage-clamp mode) evoked by a series of light (blue bars) stimuli of fibers. (O) Schematic for whole-cell recordings combined with optogenetics. (P) Sample traces of action potentials (top, current-clamp mode) and postsynaptic currents (bottom, voltage-clamp mode) evoked by a series of light (blue bars) stimuli of fibers. (Q) Quantification of light-evoked EPSCs. (R) Sample current traces of light-evoked EPSCs recorded at a holding potential of and of light-evoked IPSCs recorded at a holding potential of by illuminating fibers (left), and quantification of the latency for light-evoked EPSCs and IPSCs (right, , ). The blue bar denotes light, and the arrowhead denotes the beginning of light-evoked postsynaptic currents. (S) Sample current traces of light-evoked EPSCs recorded at a holding potential of and of light-evoked IPSCs recorded at a holding potential of (left) generated by illuminating projection fibers, and quantification of the latency of light-evoked EPSCs and IPSCs (right, , ). The blue bar denotes light, and the arrowhead denotes the beginning of light-evoked postsynaptic currents. (T) Schematic diagram showing delivery of auditory monosynaptic excitation and di-synaptic inhibition to the LA. The data are expressed as the . ***. Unpaired Student’s t-test for (R) and (S). For (E) slices from 3 mice (glutamate), 6 slices from 3 mice (GABA). For (H) slices from 3 mice (glutamate), 9 slices from 3 mice (GABA). For (L) slices from 3 mice ( and ), 6 slices from 3 mice ( and ), 6 slices from 3 mice ( and ), 6 slices from 3 mice ( and ). For (Q) cells (), 14 cells (). For (R) cells (EPSC), 10 cells (IPSC). For (S) cells (EPSC), 10 cells (IPSC). The numerical data underlying this figure are shown in Excel Tables S3–S4. Note: AAV, adeno-associated virus; ACSF, artificial cerebrospinal fluid; ACx, auditory cortex; AMPARs, alpha-Amino-3-hydroxy-5-methyl-4-isoxazolepropionic acid receptors; Cre-loxP, cyclization recombinase- locus of X(cross)-over in P1; DAPI, 4′,6-diamidino-2-phenylindole; DNQX, 6,7-dinitroquinoxaline-2, 3-dione; EGFP, enhanced green fluorescent protein; EPM, elevated plus maze; EPSC, excitatory postsynaptic currents; EYFP, enhanced yellow fluorescent protein; Flp-FRT, flippase recombination enzyme-flp recognition target; GABA, gamma-aminobutyric acid; , gamma-aminobutyric acid type A receptors; Glu, glutamate; IPSCs, inhibitory postsynaptic currents; LA, lateral amygdala; MG, medial geniculate body; SEM, standard error of the mean; VH, holding potential.
Because MG and ACx are two major brain areas that transmit acoustic information to the LA,20 a combinational anterograde viral tracing was performed to visualize the convergence of these projections. An Flp-FRT system was employed to dissect the circuit, and the Cre-loxP system was used to detect the circuit. Specifically, AAV2/1-hSyn-Flpo-WPRE-pA and AAV2/1-hSyn-Cre-WPRE-pA were infused into the MG and ACx, respectively, followed by LA injection with a combination of viruses including and (Figure 4I). Flpo and Cre recombinases respectively expressed in the MG and ACx spread trans-synaptically into the LA and were visualized by AAV-fDIO-EYFP and AAV-DIO-mCherry. These results revealed that auditory cortical and thalamic inputs almost converged on the same LA neurons and that most of the targeted LA neurons were glutamatergic (Figure 4J–L).
We then sought to characterize functional connections between the LA and auditory brain regions by injection of virus into the MG or ACx (Figure S5A–D). Electrophysiological recordings in LA neurons showed that optical stimulation of ChR2-expressing MG projecting fibers elicited EPSCs or action potential firings, respectively. Similar optical stimulation of ACx projecting fibers resulted in the same effect in LA neurons (Figure 4M–Q). Because the selective AMPA receptor antagonist, DNQX, is known to block light-evoked EPSCs, we further dissected the LA microcircuit by recording di-synaptic light-evoked IPSCs. Outward currents that were equivalent to IPSCs, recorded at a holding potential of , had a longer latency than inward currents, which were equivalent to EPSCs recorded at a holding potential of (Figure 4R,S). When cells were held at , light-evoked biphasic postsynaptic currents displayed an inward current followed by an outward current (Figure S5E–L). In addition, the AAV-DIO-ChR2 virus was injected into the LA of Gad2-Cre mice to observe the optogenetic excitation of GABA interneurons. Light-evoked IPSCs were recorded in principal neurons of the LA (Figure S5M–O), thus supporting the hypothesis that LA neurons received excitatory inputs from the MG and ACx and inhibitory inputs from local GABA neurons (Figure 4T; Figure S5P).
Effects of Artificial Manipulation of and Circuits on Anxiety-Like Behaviors
To further examine the respective roles of the MG and ACx in noise-induced anxiety-like behaviors, we next investigated neuronal activities in the MG and ACx of noise-exposed mice. Fiber photometry and extracellular recordings revealed that noise-exposed mice had significantly higher sound-evoked calcium signals and spontaneous firing rates in both the MG and ACx than control mice. (Figure S6). Subsequently, we examined whether activation of these and circuits could produce anxiety-like behaviors by bilaterally injecting the MG with virus and implanting optical fibers above the LA to selectively activate projections (Figure 5A,B). As expected, mice with optical activation of ChR2-containing MG axon terminals () displayed anxiety-like behaviors in both OFT and EPM experiments (Figure 5C,D). Using the same strategy in the ACx, optogenetic activation of projections resulted in similar behavioral outcomes (Figure 5E–H). These results indicated that activation of the or circuits was sufficient to produce anxiety-like behaviors.
Figure 5.

Behavioral effects of optogenetic activation or chemogenetic inactivation of auditory inputs to the LA. Optogenetic activation was used to selectively excite auditory inputs to the LA to determine whether activating these inputs could mimic noise-evoked anxiety-like behaviors. Chemogenetic blocking was used to selectively silence auditory inputs to the LA during noise exposure to determine whether they were necessary for noise-evoked anxiety-like behavior. (A) Schematic for viral injection and optogenetics. (B) Typical images of the viral injection in the MG (left) and optical fiber track above the LA with ChR2-expressing MG fibers (right). Scale bars: . (C and D) Summarized data for time spent in the center of OFT (C, interaction, , ; main effect of light, , ) and time in the open arms of the EPM (D, interaction, , ; main effect of light, , ) before (pre) and during (light) light stimulation of fibers. (E) Schematic for viral injection and optogenetics. (F) Typical images of viral injection in the ACx (left) and optical fiber track above the LA with ChR2-experssing ACx fibers (right). Scale bars: . (G and H) Summarized data for time spent in the center of OFT (G, interaction, , ; main effect of light, , ) and time in the open arms of the EPM (H, interaction, , ; main effect of light, , ) before (pre) and during (light) light stimulation of fibers. (I) Timeline for chemogenetic experiments. (J–L) Summarized data for time spent in the center (J, , ) and total distance traveled (K, , ) in the OFT and time in the open arms of EPM (L, , ). The data are expressed as the . ***. Two-way ANOVA with Bonferroni post hoc analysis for (C), (D), (G), and (H). Unpaired t-test for (J), (K), and (L). For (C) mCherry mice, 12 ChR2 mice. For (D) mCherry mice, 12 ChR2 mice. For (G) mCherry mice, 12 ChR2 mice. For (H) mCherry mice, 10 ChR2 mice. For (J) mCherry mice, 8 hM4Di mice. For (K) mCherry mice, 8 hM4Di mice. For (L) mCherry mice, 8 hM4Di mice. The numerical data underlying this figure are shown in Excel Tables S1. Note: AAV, adeno-associated virus; ACx, auditory cortex; ANOVA, analysis of variance; CaM, calcium-calmodulin; CaMKII, CaM-dependent protein kinase II; ChR2, channelrhodopsin-2; CNO, clozapine-N-oxide; EPM, elevated plus maze; hM4, human M4 muscarinic; hM4Di, human M4 muscarinic receptor; LA, lateral amygdala; MG, medial geniculate body; NS, not significant; OFT, open-field tests; Pre, before light stimulation; SEM, standard error of the mean.
In light of our findings suggesting noise stimuli were transmitted into the LA through MG and ACx inputs, leading to maladaptive plasticity of the amygdala, we next examined whether either the MG or ACx was necessary to maintain anxiety-like behaviors after noise-evoked anxiety was established. Neither inactivation of the bilateral MG (Figure S7A–G) with muscimol, nor inactivation of the bilateral ACx (Figure S7H–N) in noise-exposed mice resulted in any obvious effects on anxiety-like behaviors in OFT and EPM experiments, suggesting that maladaptation of the LA was enough to produce noise-induced anxiety. However, it remained unclear whether selective inactivation of cortical and thalamic inputs to the LA during the noise exposure could prevent the development of anxiety-like behavior. To test this possibility, virus was bilaterally infused into the MG and ACx of mice with chronically implanted cannulas in the LA, and then CNO was locally applied to the LA through the cannula before daily noise exposure for 14 d, beginning on the 15th day of noise exposure (Figure 5I). No obvious anxiety-like behavior developed in these noise-exposed mice with hM4Di-expressing LA to suppress auditory inputs to the LA, notably different from anxiety-like behaviors observed in noise-exposed mice with mCherry-expressing LA (Figure 5J–L).
Behavioral Effects of Acute Noise Stimuli on Chronic Noise-Exposed Mice Subjected to 4 Wk of Noise Withdrawal
Next, we sought to determine whether chronic noise-exposed mice displayed higher susceptibility to acute noise exposure. After completing a 4-wk chronic noise-exposure regimen, mice were subjected to a 4-wk noise withdrawal period, after which mice spent similar time in the center of the OFT and in the open arms of the EPM, suggesting a lack of anxiety-like behavior in these mice (Figure 6A–C). Then, their anxiety-like behaviors were tested after acute noise exposure. An interesting finding is that reexposure to a single 2-h noise episode (85 dB SPL) elicited anxiogenic phenotypes in the OFT and EPM but not in control mice (Figure 6B,C). In vivo multichannel recordings revealed that the spontaneous firing rates of LA neurons were consistent with anxiety-like behavioral manifestations, with the spontaneous firing rates in LA neurons returning to baseline after the withdrawal period but significantly increasing after the 2-h noise exposure (Figure 6D,E). A similar anxiety-promoting effect was also observed in mice reexposed to a 2 h 75 dB SPL noise episode (Figure 6F,G). These cumulative results suggested that chronic noise exposure sensitized the mice to acute noise.
Figure 6.

Experimental overview, behavior, and electrophysiological effects of acute noise exposure in mice after 4 wk of noise withdrawal. All chronic noise-exposed mice or control were subjected to 4-wk noise withdrawal, and then their behaviors were tested before and after 2-h noise exposure to examine their susceptibility to acute noise exposure. Anxiety-like behaviors and elevated spontaneous neuronal firing in the LA were observed. (A) Timeline of the experimental protocol. (B and C) Summarized data for the time in the center of OFT (B, 8W, , ; 2-h 85 dB SPL, , ) and time in the open arms of EPM (C, interaction, , ; main effect of noise, , ) at the indicated time points. (D and E) Representative voltage traces of spontaneous firings recorded in the LA (D) and summarized data (E, interaction, , ; main effect of noise, , ). (F and G) Summarized data for time spent in the center of the OFT (F, , ), and time in the open arms of the EPM (G, , ) in recovered mice reexposed to 2-h 75 dB SPL noise. The data are expressed as the . *; **; ***. Mann-Whitney U-test for (B). Two-way ANOVA with Bonferroni post hoc analysis for (C) and (E). Unpaired Student’s t-test for (F) and (G). For (B) control mice, 10 noise mice. For (C) control mice, 10 noise mice. For (E) cells (8W control), 17 cells (8W noise), 15 cells (2h 85 dB control), 20 cells (2h 85 dB noise). For (F) control mice, 7 noise mice. For (G) control mice, 7 noise mice. The numerical data underlying this figure are shown in Excel Tables S1–2. Note: 8W, eighth week; ANOVA, analysis of variance; dB SPL, decibel sound pressure level; EPM, elevated plus maze; LA, lateral amygdala; OFT, open-field tests; SEM, standard error of the mean.
Discussion
This study defined the thalamoamygdalar and corticoamygdalar circuits through which anxiety-associated behavior was generated in mice under exposure to chronic, moderate noise. Central to these processes were circuit mechanisms that involve greater excitation from and neurons to LA neurons under chronic, moderate noise exposure, which ultimately appeared to prime anxiety-like behaviors.
As an emotion processing center, the amygdala is known to participate in several neuropsychiatric disorders, including anxiety.23,56,57 The amygdala circuitry that contributes to associative auditory fear learning has been extensively investigated,25,55,58–62 although to date no studies have examined the involvement of these circuits in noise-evoked anxiety. The basolateral amygdala (BLA) reportedly controlled stress-related anxiety behaviors. Enhanced activity of glutamatergic neurons63 and/or decreased activity of GABAergic neurons30 in the BLA could elicit anxiety-like behavior via BLA outputs to distinct brain targets, such as the hippocampus31 or central nucleus of the amygdala32 in mice. It should be noted that, as an interface for sensory information, the LA directly outputs to the BLA,58,64,65 and increased neuronal activity of the LA promoted anxiety in mice,66 possibly via the circuit.
Acute and chronic stresses are frequently associated with increased LA and BLA neuronal activities28,63,67,68 caused by altered synaptic plasticity.69,70 In vivo recordings in the current study showed that chronic noise exposure, which is a chronic stressor, could similarly increase spontaneous firing in the LA. Activation of synaptic inputs to the LA, such as projections from the midbrain ventral tegmental area to the LA, could acutely elicit anxiety-like behaviors in mice,71 in a manner resembling the auditory inputs to the LA in the current work. Our data, together with previous studies,72 thus indicate that acoustic signals are first sent to the LA and are then conveyed to downstream nuclei, such as the BLA.
Traumatic noise can lead to hearing loss and tinnitus due to damaged hair cells, interference with thalamocortical connectivity, and enhanced central gain,73–75 as well as mood disorders.7,39 One recent study showed that hippocampal synaptic plasticity contributed to hearing loss–related anxiety in mice.7 However, we frequently encounter nontraumatic noise from traffic, the workplace, or recreational music that does not produce traumatizing effects. Emerging evidence has demonstrated that moderate-level noise exposure caused reduced otoacoustic emissions in rodents,76,77 disrupted auditory information processing in rats,18,19,78 degraded cognition in rodents,4,15 and distorted mood in mice.79 Noise at 85 dB SPL was previously considered not harmful to hearing but did elicit anxiogenic phenotypes in our study. We thus proposed a model to illustrate how moderate-level noise elicits anxiety-like behaviors. In this model, under chronic moderate-level noise exposure, sound conveyed to the LA via the and circuits resulted in heightened LA activity. The LA is in a position to bridge the auditory system and emotion structures. The hyperactivity of the LA consequently produced anxiety-like behavior (Figure S8).
An interesting observation is that behaviorally recovered noise-exposed mice developed anxiety-like behavior in response to subsequent reexposure to 85 dB SPL noise, reminiscent of hypersensitivity in posttraumatic stress disorder patients.80 It is possible that noise exposure might sensitize the amygdala through synaptic elements,63 with the remodeled amygdala prone to overexcitation by acute or novel stressors. Moreover, noise could cause inflammation in the auditory cortex through tumor necrosis factor secreted from microglia in mice,6 implying that microglia-mediated inflammation could play a role in producing anxiety, which deserves further investigation.81,82
Increasing noise levels associated with social modernization can negatively affect human quality of life. Although this work investigates the neural mechanism underlying noise-induced anxiety in mice, the mechanism in humans is far more complex. Our findings thus promote awareness of nontraumatic noise pollution as a potentially serious but unrecognized public health concern.
Supplementary Material
Acknowledgments
The authors thank Q. Yan and Y. Huang for administrative and technical assistance.
This work is supported by the National Key Research and Development Program of China (STI2030-Major Projects 2021ZD0203100), National Natural Science Foundation of China (32025017 and 732121002), CAS Project for Young Scientists in Basic Research (YSBR-013), Plans for Major Provincial Science & Technology Projects (202303a07020002), Natural Science Foundation of Anhui Province (2208085MC56), Natural Science Research of Anhui Provincial Education Department (2022AH040075), and the Innovative Research Team of High-Level Local Universities in Shanghai.
All data are available in the main text or the supplementary materials.
References
- 1.Takacs JD, Forrest TJ, Basura GJ. 2017. Noise exposure alters long-term neural firing rates and synchrony in primary auditory and rostral belt cortices following bimodal stimulation. Hear Res 356:1–15, PMID: , 10.1016/j.heares.2017.07.004. [DOI] [PubMed] [Google Scholar]
- 2.Basner M, Babisch W, Davis A, Brink M, Clark C, Janssen S, et al. 2014. Auditory and non-auditory effects of noise on health. Lancet 383(9925):1325–1332, PMID: , 10.1016/S0140-6736(13)61613-X. [DOI] [PMC free article] [PubMed] [Google Scholar]
- 3.Kraus KS, Canlon B. 2012. Neuronal connectivity and interactions between the auditory and limbic systems. Effects of noise and tinnitus. Hear Res 288(1–2):34–46, PMID: , 10.1016/j.heares.2012.02.009. [DOI] [PubMed] [Google Scholar]
- 4.Jafari Z, Kolb BE, Mohajerani MH. 2018. Chronic traffic noise stress accelerates brain impairment and cognitive decline in mice. Exp Neurol 308:1–12, PMID: , 10.1016/j.expneurol.2018.06.011. [DOI] [PubMed] [Google Scholar]
- 5.Hayes SH, Manohar S, Majumdar A, Allman BL, Salvi R. 2019. Noise-induced hearing loss alters hippocampal glucocorticoid receptor expression in rats. Hear Res 379:43–51, PMID: , 10.1016/j.heares.2019.04.013. [DOI] [PMC free article] [PubMed] [Google Scholar]
- 6.Wang W, Zhang LS, Zinsmaier AK, Patterson G, Leptich EJ, Shoemaker SL, et al. 2019. Neuroinflammation mediates noise-induced synaptic imbalance and tinnitus in rodent models. PLoS Biol 17(6):e3000307, PMID: , 10.1371/journal.pbio.3000307. [DOI] [PMC free article] [PubMed] [Google Scholar]
- 7.Pak S, Choi G, Roy J, Poon CH, Lee J, Cho D, et al. 2022. Altered synaptic plasticity of the longitudinal dentate gyrus network in noise-induced anxiety. iScience 25(6):104364, PMID: , 10.1016/j.isci.2022.104364. [DOI] [PMC free article] [PubMed] [Google Scholar]
- 8.Manohar S, Chen GD, Ding D, Liu L, Wang J, Chen YC, et al. 2022. Unexpected consequences of Noise-Induced hearing loss: impaired hippocampal neurogenesis, memory, and stress. Front Integr Neurosci 16:871223, PMID: , 10.3389/fnint.2022.871223. [DOI] [PMC free article] [PubMed] [Google Scholar]
- 9.Hammer MS, Swinburn TK, Neitzel RL. 2014. Environmental noise pollution in the United States: developing an effective public health response. Environ Health Perspect 122(2):115–119, PMID: , 10.1289/ehp.1307272. [DOI] [PMC free article] [PubMed] [Google Scholar]
- 10.van Dijk FJ, Souman AM, de Vries FF. 1987. Non-auditory effects of noise in industry. VI. A final field study in industry. Int Arch Occup Environ Health 59(2):133–145, PMID: , 10.1007/BF00378491. [DOI] [PubMed] [Google Scholar]
- 11.Passchier-Vermeer W, Passchier WF. 2000. Noise exposure and public health. Environ Health Perspect 108 Suppl 1(suppl 1):123–131, PMID: , 10.1289/ehp.00108s1123. [DOI] [PMC free article] [PubMed] [Google Scholar]
- 12.Munzel T, Kroller-Schon S, Oelze M, Gori T, Schmidt FP, Steven S, et al. 2020. Adverse cardiovascular effects of traffic noise with a focus on nighttime noise and the new WHO noise guidelines. Annu Rev Public Health 41:309–328, PMID: , 10.1146/annurev-publhealth-081519-062400. [DOI] [PubMed] [Google Scholar]
- 13.Eggermont JJ. 2017. Effects of long-term non-traumatic noise exposure on the adult central auditory system. Hearing problems without hearing loss. Hear Res 352:12–22, PMID: , 10.1016/j.heares.2016.10.015. [DOI] [PubMed] [Google Scholar]
- 14.Mannstrom P, Kirkegaard M, Ulfendahl M. 2015. Repeated moderate noise exposure in the rat–an early adulthood noise exposure model. J Assoc Res Otolaryngol 16(6):763–772, PMID: , 10.1007/s10162-015-0537-5. [DOI] [PMC free article] [PubMed] [Google Scholar]
- 15.Zhang Y, Zhu M, Sun Y, Tang B, Zhang G, An P, et al. 2021. Environmental noise degrades hippocampus-related learning and memory. Proc Natl Acad Sci USA 118(1):e2017841117, PMID: , 10.1073/pnas.2017841117. [DOI] [PMC free article] [PubMed] [Google Scholar]
- 16.Liu L, Wang F, Lu H, Cao S, Du Z, Wang Y, et al. 2016. Effects of noise exposure on systemic and tissue-level markers of glucose homeostasis and insulin resistance in male mice. Environ Health Perspect 124(9):1390–1398, PMID: , 10.1289/EHP162. [DOI] [PMC free article] [PubMed] [Google Scholar]
- 17.Cui B, Su D, Li W, She X, Zhang M, Wang R, et al. 2018. Effects of chronic noise exposure on the microbiome-gut-brain axis in senescence-accelerated prone mice: implications for Alzheimer’s disease. J Neuroinflammation 15(1):190, PMID: , 10.1186/s12974-018-1223-4. [DOI] [PMC free article] [PubMed] [Google Scholar]
- 18.Zhou X, Merzenich MM. 2012. Environmental noise exposure degrades normal listening processes. Nat Commun 3:843, PMID: , 10.1038/ncomms1849. [DOI] [PubMed] [Google Scholar]
- 19.Lau C, Zhang JW, McPherson B, Pienkowski M, Wu EX. 2015. Long-term, passive exposure to non-traumatic acoustic noise induces neural adaptation in the adult rat medial geniculate body and auditory cortex. Neuroimage 107:1–9, PMID: , 10.1016/j.neuroimage.2014.11.048. [DOI] [PubMed] [Google Scholar]
- 20.Romanski LM, LeDoux JE. 1992. Equipotentiality of thalamo-amygdala and thalamo-cortico-amygdala circuits in auditory fear conditioning. J Neurosci 12(11):4501–4509, PMID: , 10.1523/JNEUROSCI.12-11-04501.1992. [DOI] [PMC free article] [PubMed] [Google Scholar]
- 21.LeDoux JE, Farb C, Ruggiero DA. 1990. Topographic organization of neurons in the acoustic thalamus that project to the amygdala. J Neurosci 10(4):1043–1054, PMID: , 10.1523/JNEUROSCI.10-04-01043.1990. [DOI] [PMC free article] [PubMed] [Google Scholar]
- 22.Calhoon GG, Tye KM. 2015. Resolving the neural circuits of anxiety. Nat Neurosci 18(10):1394–1404, PMID: , 10.1038/nn.4101. [DOI] [PMC free article] [PubMed] [Google Scholar]
- 23.Janak PH, Tye KM. 2015. From circuits to behaviour in the amygdala. Nature 517(7534):284–292, PMID: , 10.1038/nature14188. [DOI] [PMC free article] [PubMed] [Google Scholar]
- 24.Chen S, Tan Z, Xia W, Gomes CA, Zhang X, Zhou W, et al. 2021. Theta oscillations synchronize human medial prefrontal cortex and amygdala during fear learning. Sci Adv 7(34):eabf4198, PMID: , 10.1126/sciadv.abf4198. [DOI] [PMC free article] [PubMed] [Google Scholar]
- 25.Bukalo O, Pinard CR, Silverstein S, Brehm C, Hartley ND, Whittle N, et al. 2015. Prefrontal inputs to the amygdala instruct fear extinction memory formation. Sci Adv 1(6):e1500251, PMID: , 10.1126/sciadv.1500251. [DOI] [PMC free article] [PubMed] [Google Scholar]
- 26.Nabavi S, Fox R, Proulx CD, Lin JY, Tsien RY, Malinow R. 2014. Engineering a memory with LTD and LTP. Nature 511(7509):348–352, PMID: , 10.1038/nature13294. [DOI] [PMC free article] [PubMed] [Google Scholar]
- 27.Lee Y, Oh JP, Han JH. 2021. Dissociated role of thalamic and cortical input to the lateral amygdala for consolidation of long-term fear memory. J Neurosci 41(46):9561–9570, PMID: , 10.1523/JNEUROSCI.1167-21.2021. [DOI] [PMC free article] [PubMed] [Google Scholar]
- 28.Rosenkranz JA, Venheim ER, Padival M. 2010. Chronic stress causes amygdala hyperexcitability in rodents. Biol Psychiatry 67(12):1128–1136, PMID: , 10.1016/j.biopsych.2010.02.008. [DOI] [PMC free article] [PubMed] [Google Scholar]
- 29.Siuda ER, Al-Hasani R, McCall JG, Bhatti DL, Bruchas MR. 2016. Chemogenetic and optogenetic activation of galphas signaling in the basolateral amygdala induces acute and social anxiety-like states. Neuropsychopharmacology 41(8):2011–2023, PMID: , 10.1038/npp.2015.371. [DOI] [PMC free article] [PubMed] [Google Scholar]
- 30.Luo ZY, Huang L, Lin S, Yin YN, Jie W, Hu NY, et al. 2020. Erbin in amygdala parvalbumin-positive neurons modulates anxiety-like behaviors. Biol Psychiatry 87(10):926–936, PMID: , 10.1016/j.biopsych.2019.10.021. [DOI] [PubMed] [Google Scholar]
- 31.Felix-Ortiz AC, Beyeler A, Seo C, Leppla CA, Wildes CP, Tye KM. 2013. BLA to vHPC inputs modulate anxiety-related behaviors. Neuron 79(4):658–664, PMID: , 10.1016/j.neuron.2013.06.016. [DOI] [PMC free article] [PubMed] [Google Scholar]
- 32.Tye KM, Prakash R, Kim SY, Fenno LE, Grosenick L, Zarabi H, et al. 2011. Amygdala circuitry mediating reversible and bidirectional control of anxiety. Nature 471(7338):358–362, PMID: , 10.1038/nature09820. [DOI] [PMC free article] [PubMed] [Google Scholar]
- 33.Liu WZ, Huang SH, Wang Y, Wang CY, Pan HQ, Zhao K, et al. 2023. Medial prefrontal cortex input to basolateral amygdala controls acute stress-induced short-term anxiety-like behavior in mice. Neuropsychopharmacology 48(5):734–744, PMID: , 10.1038/s41386-022-01515-x. [DOI] [PMC free article] [PubMed] [Google Scholar]
- 34.NIOSH (National Institute for Occupational Safety and Health). Noise and Occupational Hearing Loss. https://www.cdc.gov/niosh/topics/noise/ [accessed 16 March 2023].
- 35.Kock S, Andersen T, Kolstad HA, Kofoed-Nielsen B, Wiesler F, Bonde JP. 2004. Surveillance of noise exposure in the Danish workplace: a baseline survey. Occup Environ Med 61(10):838–843, PMID: , 10.1136/oem.2004.012757. [DOI] [PMC free article] [PubMed] [Google Scholar]
- 36.Li BG, Tao S, Dawson RW. 2002. Evaluation and analysis of traffic noise from the main urban roads in Beijing. Appl Acoust 63(10):1137–1142, 10.1016/S0003-682X(02)00024-5. [DOI] [Google Scholar]
- 37.Caciari T, Rosati MV, Casale T, Loreti B, Sancini A, Riservato R, et al. 2013. Noise-induced hearing loss in workers exposed to urban stressors. Sci Total Environ 463–464:302–308, PMID: , 10.1016/j.scitotenv.2013.06.009. [DOI] [PubMed] [Google Scholar]
- 38.Gourevitch B, Edeline JM, Occelli F, Eggermont JJ. 2014. Is the din really harmless? Long-term effects of non-traumatic noise on the adult auditory system. Nat Rev Neurosci 15(7):483–491, PMID: , 10.1038/nrn3744. [DOI] [PubMed] [Google Scholar]
- 39.Zhvania M, Gogokhia N, Tizabi Y, Japaridze N, Pochkidze N, Lomidze N, et al. 2020. Behavioral and neuroanatomical effects on exposure to white noise in rats. Neurosci Lett 728:134898, PMID: , 10.1016/j.neulet.2020.134898. [DOI] [PubMed] [Google Scholar]
- 40.Manukyan AL, Grigoryan AS, Hunanyan LS, Harutyunyan HA, Manukyan MV, Mkrtchyan VS, et al. 2020. Alfa2-adrenoblockers attenuate the elevated plasma cholesterol, anxiety levels and restore impaired spatial memory of rats under the chronic noise exposure. Sci Total Environ 740:140390, PMID: , 10.1016/j.scitotenv.2020.140390. [DOI] [PubMed] [Google Scholar]
- 41.Bosquillon de Jenlis A, Del Vecchio F, Delanaud S, Gay-Queheillard J, Bach V, Pelletier A. 2019. Impacts of subchronic, high-level noise exposure on sleep and metabolic parameters: a juvenile rodent model. Environ Health Perspect 127(5):57004, PMID: , 10.1289/EHP4045. [DOI] [PMC free article] [PubMed] [Google Scholar]
- 42.Konkle ATM, Keith SE, McNamee JP, Michaud D. 2017. Chronic noise exposure in the spontaneously hypertensive rat. Noise Health 19(90):213–221, PMID: , 10.4103/nah.NAH_15_17. [DOI] [PMC free article] [PubMed] [Google Scholar]
- 43.Liu L, Huang Y, Fang C, Zhang H, Yang J, Xuan C, et al. 2018. Chronic noise-exposure exacerbates insulin resistance and promotes the manifestations of the type 2 diabetes in a high-fat diet mouse model. PLoS One 13(3):e0195411, PMID: , 10.1371/journal.pone.0195411. [DOI] [PMC free article] [PubMed] [Google Scholar]
- 44.Zheng KC, Ariizumi M. 2007. Modulations of immune functions and oxidative status induced by noise stress. J Occup Health 49(1):32–38, PMID: , 10.1539/joh.49.32. [DOI] [PubMed] [Google Scholar]
- 45.Wang H, Chen J, Xu X, Sun WJ, Chen X, Zhao F, et al. 2019. Direct auditory cortical input to the lateral periaqueductal gray controls sound-driven defensive behavior. PLoS Biol 17(8):e3000417, PMID: , 10.1371/journal.pbio.3000417. [DOI] [PMC free article] [PubMed] [Google Scholar]
- 46.Cryan JF, Holmes A. 2005. The ascent of mouse: advances in modelling human depression and anxiety. Nat Rev Drug Discov 4(9):775–790, PMID: , 10.1038/nrd1825. [DOI] [PubMed] [Google Scholar]
- 47.Crawley JN. 1985. Exploratory behavior models of anxiety in mice. Neurosci Biobehav Rev 9(1):37–44, PMID: , 10.1016/0149-7634(85)90030-2. [DOI] [PubMed] [Google Scholar]
- 48.Sato T. 2005. The internal conflict model: a theoretical framework for integration. Humanist Psychol 33(1):33–44, 10.1207/s15473333thp3301_4. [DOI] [Google Scholar]
- 49.Zhou W, Ye C, Wang H, Mao Y, Zhang W, Liu A, et al. 2022. Sound induces analgesia through corticothalamic circuits. Science 377(6602):198–204, PMID: , 10.1126/science.abn4663. [DOI] [PMC free article] [PubMed] [Google Scholar]
- 50.Chen GD, Sheppard A, Salvi R. 2016. Noise trauma induced plastic changes in brain regions outside the classical auditory pathway. Neuroscience 315:228–245, PMID: , 10.1016/j.neuroscience.2015.12.005. [DOI] [PMC free article] [PubMed] [Google Scholar]
- 51.Kraeuter AK, Guest PC, Sarnyai Z. 2019. The open field test for measuring locomotor activity and anxiety-like behavior. Methods Mol Biol 1916:99–103, PMID: , 10.1007/978-1-4939-8994-2_9. [DOI] [PubMed] [Google Scholar]
- 52.Walf AA, Frye CA. 2007. The use of the elevated plus maze as an assay of anxiety-related behavior in rodents. Nat Protoc 2(2):322–328, PMID: , 10.1038/nprot.2007.44. [DOI] [PMC free article] [PubMed] [Google Scholar]
- 53.Faul F, Erdfelder E, Lang AG, Buchner A. 2007. G*power 3: a flexible statistical power analysis program for the social, behavioral, and biomedical sciences. Behav Res Methods 39(2):175–191, PMID: , 10.3758/bf03193146. [DOI] [PubMed] [Google Scholar]
- 54.Carola V, D’Olimpio F, Brunamonti E, Mangia F, Renzi P. 2002. Evaluation of the elevated plus-maze and open-field tests for the assessment of anxiety-related behaviour in inbred mice. Behav Brain Res 134(1–2):49–57, PMID: , 10.1016/s0166-4328(01)00452-1. [DOI] [PubMed] [Google Scholar]
- 55.Duvarci S, Pare D. 2014. Amygdala microcircuits controlling learned fear. Neuron 82(5):966–980, PMID: , 10.1016/j.neuron.2014.04.042. [DOI] [PMC free article] [PubMed] [Google Scholar]
- 56.Tovote P, Fadok JP, Luthi A. 2015. Neuronal circuits for fear and anxiety. Nat Rev Neurosci 16(6):317–331, PMID: , 10.1038/nrn3945. [DOI] [PubMed] [Google Scholar]
- 57.Sydnor VJ, Cieslak M, Duprat R, Deluisi J, Flounders MW, Long H, et al. 2022. Cortical-subcortical structural connections support transcranial magnetic stimulation engagement of the amygdala. Sci Adv 8(25):eabn5803, PMID: , 10.1126/sciadv.abn5803. [DOI] [PMC free article] [PubMed] [Google Scholar]
- 58.LeDoux JE, Cicchetti P, Xagoraris A, Romanski LM. 1990. The lateral amygdaloid nucleus: sensory interface of the amygdala in fear conditioning. J Neurosci 10(4):1062–1069, PMID: , 10.1523/JNEUROSCI.10-04-01062.1990. [DOI] [PMC free article] [PubMed] [Google Scholar]
- 59.Choi DI, Kim J, Lee H, Kim JI, Sung Y, Choi JE, et al. 2021. Synaptic correlates of associative fear memory in the lateral amygdala. Neuron 109(17):2717–2726.e3, PMID: , 10.1016/j.neuron.2021.07.003. [DOI] [PubMed] [Google Scholar]
- 60.Johansen JP, Hamanaka H, Monfils MH, Behnia R, Deisseroth K, Blair HT, et al. 2010. Optical activation of lateral amygdala pyramidal cells instructs associative fear learning. Proc Natl Acad Sci USA 107(28):12692–12697, PMID: , 10.1073/pnas.1002418107. [DOI] [PMC free article] [PubMed] [Google Scholar]
- 61.Li WG, Wu YJ, Gu X, Fan HR, Wang Q, Zhu JJ, et al. 2021. Input associativity underlies fear memory renewal. Natl Sci Rev 8(9):nwab004, PMID: , 10.1093/nsr/nwab004. [DOI] [PMC free article] [PubMed] [Google Scholar]
- 62.Yang Y, Liu DQ, Huang W, Deng J, Sun Y, Zuo Y, et al. 2016. Selective synaptic remodeling of amygdalocortical connections associated with fear memory. Nat Neurosci 19(10):1348–1355, PMID: , 10.1038/nn.4370. [DOI] [PubMed] [Google Scholar]
- 63.Rau AR, Chappell AM, Butler TR, Ariwodola OJ, Weiner JL. 2015. Increased basolateral amygdala pyramidal cell excitability may contribute to the anxiogenic phenotype induced by chronic early-life stress. J Neurosci 35(26):9730–9740, PMID: , 10.1523/JNEUROSCI.0384-15.2015. [DOI] [PMC free article] [PubMed] [Google Scholar]
- 64.Smith Y, Pare D. 1994. Intra-amygdaloid projections of the lateral nucleus in the cat: PHA-L anterograde labeling combined with postembedding GABA and glutamate immunocytochemistry. J Comp Neurol 342(2):232–248, PMID: , 10.1002/cne.903420207. [DOI] [PubMed] [Google Scholar]
- 65.Krettek JE, Price JL. 1978. A description of the amygdaloid complex in the rat and cat with observations on intra-amygdaloid axonal connections. J Comp Neurol 178(2):255–280, PMID: , 10.1002/cne.901780205. [DOI] [PubMed] [Google Scholar]
- 66.An S, Wang J, Zhang X, Duan Y, Xu Y, Lv J, et al. 2021. αCaMKII in the lateral amygdala mediates PTSD-like behaviors and NMDAR-Dependent LTD. Neurobiol Stress 15:100359, PMID: , 10.1016/j.ynstr.2021.100359. [DOI] [PMC free article] [PubMed] [Google Scholar]
- 67.Guadagno A, Wong TP, Walker CD. 2018. Morphological and functional changes in the preweaning basolateral amygdala induced by early chronic stress associate with anxiety and fear behavior in adult male, but not female rats. Prog Neuropsychopharmacol Biol Psychiatry 81:25–37, PMID: , 10.1016/j.pnpbp.2017.09.025. [DOI] [PubMed] [Google Scholar]
- 68.Correll CM, Rosenkranz JA, Grace AA. 2005. Chronic cold stress alters prefrontal cortical modulation of amygdala neuronal activity in rats. Biol Psychiatry 58(5):382–391, PMID: , 10.1016/j.biopsych.2005.04.009. [DOI] [PubMed] [Google Scholar]
- 69.Padival M, Quinette D, Rosenkranz JA. 2013. Effects of repeated stress on excitatory drive of basal amygdala neurons in vivo. Neuropsychopharmacology 38(9):1748–1762, PMID: , 10.1038/npp.2013.74. [DOI] [PMC free article] [PubMed] [Google Scholar]
- 70.Song C, Zhang WH, Wang XH, Zhang JY, Tian XL, Yin XP, et al. 2017. Acute stress enhances the glutamatergic transmission onto basoamygdala neurons embedded in distinct microcircuits. Mol Brain 10(1):3, PMID: , 10.1186/s13041-016-0283-6. [DOI] [PMC free article] [PubMed] [Google Scholar]
- 71.Morel C, Montgomery SE, Li L, Durand-de Cuttoli R, Teichman EM, Juarez B, et al. 2022. Midbrain projection to the basolateral amygdala encodes anxiety-like but not depression-like behaviors. Nat Commun 13(1):1532, PMID: , 10.1038/s41467-022-29155-1. [DOI] [PMC free article] [PubMed] [Google Scholar]
- 72.Feng H, Su J, Fang W, Chen X, He J. 2021. The entorhinal cortex modulates trace fear memory formation and neuroplasticity in the mouse lateral amygdala via cholecystokinin. Elife 10:e69333, PMID: , 10.7554/eLife.69333. [DOI] [PMC free article] [PubMed] [Google Scholar]
- 73.Vianney-Rodrigues P, Auerbach BD, Salvi R. 2019. Aberrant thalamocortical coherence in an animal model of tinnitus. J Neurophysiol 121(3):893–907, PMID: , 10.1152/jn.00053.2018. [DOI] [PMC free article] [PubMed] [Google Scholar]
- 74.Hayes SH, Schormans AL, Sigel G, Beh K, Herrmann B, Allman BL. 2021. Uncovering the contribution of enhanced central gain and altered cortical oscillations to tinnitus generation. Prog Neurobiol 196:101893, PMID: , 10.1016/j.pneurobio.2020.101893. [DOI] [PubMed] [Google Scholar]
- 75.Zhang JS, Kaltenbach JA, Wang J, Kim SA. 2003. Fos-like immunoreactivity in auditory and nonauditory brain structures of hamsters previously exposed to intense sound. Exp Brain Res 153(4):655–660, PMID: , 10.1007/s00221-003-1612-4. [DOI] [PubMed] [Google Scholar]
- 76.Zhao DL, Sheppard A, Ralli M, Liu X, Salvi R. 2018. Prolonged low-level noise exposure reduces rat distortion product otoacoustic emissions above a critical level. Hear Res 370:209–216, PMID: , 10.1016/j.heares.2018.08.002. [DOI] [PMC free article] [PubMed] [Google Scholar]
- 77.Yin D, Ren L, Li J, Shi Y, Duan Y, Xie Y, et al. 2020. Long-term moderate noise exposure enhances the medial olivocochlear reflex. Auris Nasus Larynx 47(5):769–777, PMID: , 10.1016/j.anl.2020.03.008. [DOI] [PubMed] [Google Scholar]
- 78.Lau C, Pienkowski M, Zhang JW, McPherson B, Wu EX. 2015. Chronic exposure to broadband noise at moderate sound pressure levels spatially shifts tone-evoked responses in the rat auditory midbrain. Neuroimage 122:44–51, PMID: , 10.1016/j.neuroimage.2015.07.065. [DOI] [PubMed] [Google Scholar]
- 79.Dong Y, Zhou Y, Chu X, Chen S, Chen L, Yang B, et al. 2016. Dental noise exposed mice display depressive-like phenotypes. Mol Brain 9(1):50, PMID: , 10.1186/s13041-016-0229-z. [DOI] [PMC free article] [PubMed] [Google Scholar]
- 80.Kessler RC, Sonnega A, Bromet E, Hughes M, Nelson CB. 1995. Posttraumatic stress disorder in the national comorbidity survey. Arch Gen Psychiatry 52(12):1048–1060, PMID: , 10.1001/archpsyc.1995.03950240066012. [DOI] [PubMed] [Google Scholar]
- 81.Zheng ZH, Tu JL, Li XH, Hua Q, Liu WZ, Liu Y, et al. 2021. Neuroinflammation induces anxiety- and depressive-like behavior by modulating neuronal plasticity in the basolateral amygdala. Brain Behav Immun 91:505–518, PMID: , 10.1016/j.bbi.2020.11.007. [DOI] [PubMed] [Google Scholar]
- 82.Munshi S, Loh MK, Ferrara N, DeJoseph MR, Ritger A, Padival M, et al. 2020. Repeated stress induces a pro-inflammatory state, increases amygdala neuronal and microglial activation, and causes anxiety in adult male rats. Brain Behav Immun 84:180–199, PMID: , 10.1016/j.bbi.2019.11.023. [DOI] [PMC free article] [PubMed] [Google Scholar]
Associated Data
This section collects any data citations, data availability statements, or supplementary materials included in this article.