

Abstract
The recruitment of cells with effector functions into the tumor microenvironment holds potential for delaying cancer progression. We show that subsets of human CD28-effector CD8 T cells, CCR7– CD45RO+ effector memory, and CCR7– CD45RO– effector memory RA phenotypes, express the chemerin receptor CMKLR1 and bind chemerin via the receptor. CMKLR1-expressing human CD8 effector memory T cells present gene, protein, and cytotoxic features of NK cells. Active chemerin promotes chemotaxis of CMKLR1-expressing CD8 effector memory cells and triggers activation of the α4β1 integrin. In an experimental prostate tumor mouse model, chemerin expression is downregulated in the tumor microenvironment, which is associated with few tumor-infiltrating CD8+ T cells, while forced overexpression of chemerin by mouse prostate cancer cells leads to an accumulation of intra-tumor CD8+ T cells. Furthermore, α4 integrin blockade abrogated the chemerin-dependent recruitment of CD8+ T effector memory cells into implanted prostate tumors in vivo. The results identify a role for chemerin:CMKLR1 in defining a specialized NK-like CD8 T cell, and suggest the use of chemerin-dependent modalities to target effector CMKLR1-expressing T cells to the tumor microenvironment for immunotherapeutic purposes.
Keywords: T cell trafficking, chemerin, CMKLR1, chemoattractant, immune oncology, integrin
Graphical abstract
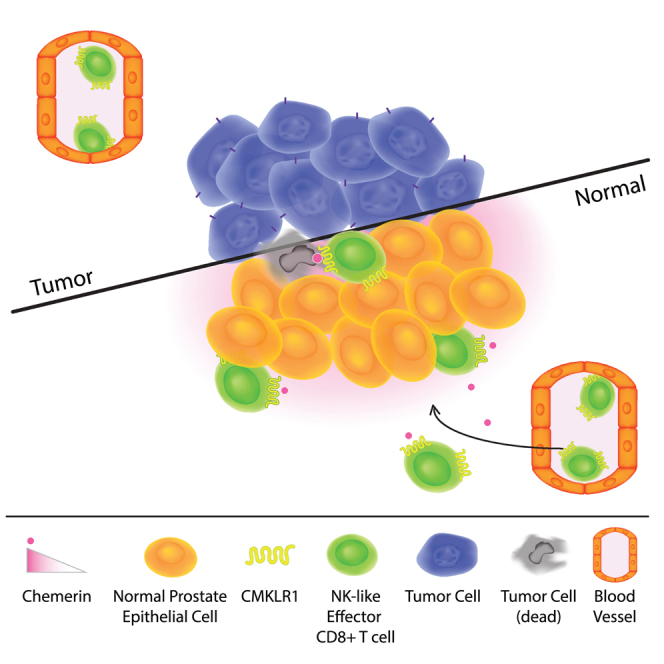
Zabel and colleagues identified a novel role for chemerin chemoattractant receptor CMKLR1 in defining a specialized NK-like CD8 T cell, and suggest the use of chemerin-dependent modalities to target CMKLR1-expressing effector T cells to the tumor microenvironment for immunotherapeutic purposes.
Introduction
Chemerin (retinoic acid receptor responder 2 [RARRES2]) is a multifunctional protein with chemotactic and metabolic properties. Human chemerin is secreted in the blood as a functionally inert 163-amino acid precursor (prochemerin, or Chem163S).1 Proteolytic cleavage of prochemerin by proteases results in shorter isoforms with various biological activities. The truncated variant Chem157S has been described as the most potent chemotactic chemerin isoform2 in contrast to the chemotactically inactive Chem155A3,4 variant. Upon binding to the chemerin chemokine-like receptor 1 (CMKLR1), active chemerin is known to trigger the directed migration of effector cells with innate immune functions such as plasmacytoid dendritic cells (pDCs),5 natural killer (NK) cells,6 and macrophages.7
We and others have shown that expression of chemerin in the tumor microenvironment regulates tumor growth, at least in part by CMKLR1-dependent recruitment of effector cells. In human and mouse, RARRES2 is often downregulated in tumor tissues compared with normal tissue8; and, in breast cancer and melanoma, reduced chemerin expression in tumors correlates with poor prognosis. Using the EMT6 mouse model of breast carcinoma, we previously showed that forced chemerin expression by tumor cells increases the recruitment of NK cells and CD8 T cells within the TME, while NK or CD8 T cell depletion accelerates tumor growth.9 However, the mechanism responsible for the increased infiltration of protective CD8 T cells into the TME has not been defined: because CMKLR1 expression by CD8 T cells had not been appreciated, we speculated that the enhanced CD8 response might be secondary to CMKLR1-dependent NK cell recruitment.
We now report the discovery of a specialized CMKLR1-expressing CD8 effector population in human and mouse. Using publicly available datasets of single-cell RNA sequencing (scRNA-seq), we identified selective CMKLR1 expression in rare CD8 and CD4 T cells in human blood and tumor tissues. We show that active but not inactive chemerin isoforms bind subsets of CD28– but not CD28+ CD8 effector memory/effector memory RA (EM/EMRA) (CD3+ CD8+ CCR7– CD45RO+/−), defining a CD8 effector enriched for NK cell genes and enhanced in tumor killing ability compared with CD28– CD8 EMRA. Chemerin triggers integrin activation and chemotaxis of the unique effector CD8 T cell, similar to its effects on NK cells. In vivo α4 integrin antibody blockade abolished chemerin-dependent recruitment of CD8+ TEM into tumors, confirming that chemerin and α4 work along the same pathway to enhance tumor infiltration by CD8+ T cells. Thus, our findings reveal an unexpected role for chemerin:CMKLR1 in the migratory program of a specialized NK-like effector CD8 T cell with promising anti-tumor potential.
Results
Expression of CMKLR1 on subsets of highly differentiated effector T cells
Forced expression of chemerin by tumor cells in the EMT6 mouse model of breast carcinoma increased the recruitment of NK cells, and perhaps more surprisingly CD8 T cells in the TME.9 We analyzed T cell scRNA-seq datasets of peripheral blood, tumor tissues, and normal adjacent tissues from patients with liver10 or lung11 cancer to assess the gene expression profile of CMKLR1 on T cell subsets. When comparing across cancer types, we found CMKLR1 specifically expressed by two clusters characterized by high levels of CX3CR1 that represent populations of EMRA CD8+ (Figure 1A). CMKLR1 was also expressed by CD8+ EM/EMRA cells in blood and normal adjacent liver and lung tissue (Figure 1A). CMKLR1 was not expressed in clusters characterized by high expression levels of transcription factor lymphoid enhancer binding factor 1 (LEF1) that represent populations of naive CD8+ T cells, nor in clusters characterized by high expression levels of layilin (LAYN) that represent populations of exhausted CD8+ T cells (Figure 1A). PDCD1 (which encodes exhaustion marker PD1) was specifically expressed by exhausted CD8+ T cells in liver and lung tumor tissue as anticipated, which validated the analysis strategy as PD1 is well characterized to be upregulated in this population12 (Figure 1A). Similar to CMKLR1, killer cell lectin-like receptor D1 (KLRD1) was expressed on EM/EMRA but not naive CD8+ T cells.
Figure 1.

scRNA-seq and flow cytometry analyses reveal CD8 subsets expressing CMKLR1
(A) Analysis of publicly available single-cell gene expression data from human CD8+ T cells (liver10; lung11). Boxplots showing expression of PDCD1, KLRD1, and CMKLR1 in naive (C01_LEF1), exhausted (C04_LAYN), and effector memory or effector memory RA (EM/EMRA, C03_CX3CR1) CD8+ T cells from blood, tumor tissue, or normal tissue of liver or lung cancer patients. (B) Flow cytometry of CX3CR1 and CMKLR1 immunostaining in subsets of human PBMC-derived CD8 effector memory (EM, CD45RO+ CCR7–), effector memory RA (EMRA, CD45RO– CCR7–), central memory (CM, CD45RO+ CCR7+), or naive (N, CD45RO– CCR7+). (C) The percentage of CMKLR1+ cells within CX3CR1+ (pos) and CX3CR1– (neg) effector memory (EM) and effector memory RA (EMRA) is shown. (D and E) Flow cytometry of CX3CR1 and CMKLR1 immunostaining in subsets of CD27+ CD28+, CD27– CD28+, CD27+ CD28–, or CD27– CD28– CD8 EM (D) or EMRA (B, D, and E). (Left) Shown are representative gating strategy and histograms for CX3CR1 and CMKLR1 in each CD8 subset. (Right) For each subset, the percentage of positive cells for CX3CR1 or CMKLR1 immunostaining is shown. Shown are pooled data (mean ± SEM) from n = 2 experiments with 5 donors total. ∗p ≤ 0.05, ∗∗p ≤ 0.01, ∗∗∗∗p ≤ 0.0001 by ANOVA (one-way with Tukey or Sidak’s post-hoc) comparing EMRA vs. CM or N (B), the indicated comparisons in (C), or CD28– subsets against CD28+ subsets (D and E) for both CX3CR1 and CMKLR1.
We also assessed CMKLR1 expression on differentiated CD4+ T cell subsets in the liver and lung cancer datasets by scRNA-seq analysis. CMKLR1 was expressed by CD4+ EM/EMRA cells in tumor tissue, blood and normal adjacent liver and lung tissues (Figure S1A). CMKLR1 was not expressed in clusters characterized by high expression levels of chemokine receptor CCR7, which represent populations of naive CD4+ T cells, nor in clusters characterized by high expression levels of granulysin (GNLY), which represent populations of exhausted CD8+ T cells (Figure S1A). PDCD1 was specifically expressed by exhausted CD4+ T cells in liver and lung tumor tissue as expected (Figure S1A). KLRD1 was expressed on EM/EMRA but not naive CD8+ T cells (Figure S1A). Together, these data demonstrate selective CMKLR1 expression on non-exhausted subsets of CD8+ and CD4+ EM/EMRA T cells present in the blood, normal adjacent tissues, and tumor tissues from liver and lung cancer patients.
Immunofluorescence staining confirmed cell surface expression of CMKLR1 on CD3+ CD8+ CCR7– CD45RO+ EM and, more importantly, CD3+ CD8+ CCR7– CD45RO− EMRA T cells, the vast majority of which co-expressed CX3CR1 (>85%, Figure 1B). CMKLR1 was significantly co-expressed with CX3CR1 on both EM and EMRA CD8+ T cells, with almost no CMKLR1 staining on CX3CR1– cells, and significantly more CX3CR1+ EMRA cells expressed CMKLR1 than CX3CR1+ EM cells (Figure 1C). Naive and central memory CD8 T cells stained negative for CX3CR1 and CMKLR1. Highly differentiated CD8 T cells lose cell surface expression of the co-stimulatory receptors CD27 and CD28.13 Staining for CD27 and CD28 revealed that CD28–, but not CD28+ CD8 TEM and TEMRA, display CX3CR1 and CMKLR1 at the cell surface (Figures 1D and 1E). Of all TEM and TEMRA, the most terminally differentiated CD27 and CD28 double-negative cells were CX3CR1 positive and the vast majority expressed CMKLR1. CMKLR1 was also expressed on CD4+ EMRA and to a lesser extent on CD4+ EM but not naive or central memory CD4+ T cells (Figure S1B). Similar to CD8+ EM/EMRA, CMKLR1 was expressed on CD4+ CD28– EM (Figure S1C) and CD4+ CD28– EMRA (Figure S1D). Together, the data identify for the first time CMKLR1 expression on populations of circulating effector lymphocytes other than NK cells.
Given that CD8+ but not CD4+ T cells were required for suppressed tumor growth associated with forced overexpression of chemerin in an experimental model of breast cancer,9 we focused our studies on CD8+ EMRA T cells.
CMKLR1-expressing CD8 TEMRA/TEM population binds chemerin
CMKLR1 attractant ligand chemerin has multiple isoforms of different activities generated by proteolytic cleavage of its C-terminal domain.1 Full-length chemerin, Chem163S in humans, binds CMKLR1 but is functionally weak in terms of chemoattraction or calcium signaling. The truncated Chem156F and Chem157S isoforms are biologically active and trigger chemotaxis, while Chem155A is inactive/dead. We developed fluorescently labeled versions of full-length (hChem163AF647 and mChem162AF488), active (hChem157 AF647 and mChem156AF488), and inactive (hChem155AF647 and mChem154AF488) chemerin to test the functionality of the CMKLR1 receptor on TEM and TEMRA cells. Full-length and active chemerin, but not inactive chemerin, binds to subsets of human blood circulating TEM and TEMRA (Figure 2A). Consistent with CMKLR1 expression, chemerin bound CD28–, but not CD28+, TEM and TEMRA cells (Figures 2B and 2C, respectively). Increasing concentrations of unlabeled chemerin potently competed with tracer chemerin (hChem157 AF647) in competition binding assays on human T cells (IC50 < 1 nM, Figure 2D). Active chemerin also binds to a similar mouse subset of circulating CD3+ CD8+ CD62L− CD44+ EM T cells but not naive and central memory T cells (Figure 2E). We found no binding of active chemerin to TEM cells genetically deficient in CMKLR1, confirming that chemerin T cell binding was via CMKLR1.
Figure 2.

CMKLR1-dependent binding of chemerin to CD8 EM/EMRA
(A–C) Percentage of positive cells inactive Chem155AF647, active Chem157AF647, or full-length Chem163AF647 human chemerin immunostaining of human PBMC-derived CD8 subsets (A), CD8 EM subsets (B), and CD8 EMRA subsets (C). Shown are pooled data (mean ± SEM) from two experiments with n = 4 donors in total. Groups were compared by two-way ANOVA with Dunnett’s multiple comparisons test. ∗∗∗p ≤ 0.001, ∗∗∗∗p ≤ 0.0001. (D) Competitive binding of chemerin to human blood CD3+ T cells. Chem157AF647 tracer was incubated with the indicated concentrations of unlabeled Chem157 and PBMC, and the fraction bound to CD3+ T cells was determined by flow cytometry. (E) Flow cytometry of mChem156AF488 immunostaining of CD8 naive (CD44– CD62L–), central memory (CM, CD44+ CD62L+), and effector memory T cells (TEM, CD44+ CD62L–) isolated from wild-type (WT) or CMKLR1-deficient mice. A representative gating strategy and histogram overlay are shown. (F) Mononuclear cells from blood and anterior prostate tissue were isolated from male prostate tumor-bearing TRAMP+/− mice aged 24–28 weeks and stained with mChem156AF488 and CD45+ CD3– CD19– NK1.1+ (NK cells) or CD45+ CD19– CD3+ CD4– CD8+ CD44+ CD62L– (CD8 TEM) cells. Representative histogram overlays are shown. Bar graph depicts the frequency of chemerin+ cells within CD8 TEM and NK cell subsets, mean ± SEM, n ≥ 8 mice. ∗∗p ≤ 0.01 by t test. (G) Chemerin (RARRES2) RNA expression by quantitative reverse-transcriptase polymerase chain reaction (qRT-PCR) in prostate tissue isolated from male prostate tumor-bearing TRAMP+/− mice and age-matched C57BL/6 as controls. RARRES2 expression was normalized to GAPDH for each sample and displayed relative to control/normal prostate across the dataset; mean ± SEM; ∗p < 0.05 by Student’s t test; n = 4). Human chemerin (RARRES2) mRNA expression (transcripts per million) (H) or DNA methylation (displayed as beta value ranging from 0 (unmethylated) to 1 (fully methylated)) (I) in prostate adenocarcinoma compared with normal prostate tissue by UALCAN analysis of TCGA data; box-whisker plots; p value by Student’s t test. (J) Correlation between human chemerin (RARRES2) expression and CMKLR1 (left) or CD8a (right) in localized prostate adenocarcinoma by cBioPortal analysis (n = 494 samples). Spearman correlation coefficient and p values shown. (K) Human prostate tumors expressing high levels of chemerin (RARRES2) are enriched for CD8+ CMKLR1+ T effector cells (Teff). Bar plots show proportions of patients whose tumors are identified to be enriched in CD8+ CMKLR1+, CD8+ CMKLR1–, or neither of these (other). Enrichment of CD8+ populations is defined as enrichment of gene signatures defining CD8+ T cells via gene set variation analysis (GSVA). CMKLR1+ vs. CMKLR1– and chemerin-low vs. -high defined by the median expression of each of these genes among the patient samples. ∗p = 0.04 by hypergeometric test for enrichment of the CD8+ CMKLR1+ gene signature in chemerin-high prostate tumors. N = 9 chemerin-low and n = 9 chemerin-high prostate tumor samples. (L) CD8+ T cell prostate tumor infiltration. TRAMP-C1 tumor cells harboring vector control (VC) or chemerin-overexpressing (chemerin OE) vector mixed with VC in a ratio of 50:50 (mix) were implanted subcutaneously into C57BL/6 male mice. At 9–11 weeks post-inoculation, tumors were resected, and tumor-infiltrating lymphocytes (TILs) were isolated. Flow cytometry was used to identify CD8+ T cells (CD45+ CD19– CD3+ CD4– CD8+) among TILs. Bar graph depicts the frequency of CD8+ T cells as percent of total live single CD45+ cells detected in the TIL from each mouse. The data are pooled from two independent experiments with n ≥ 5 mice per group in each experiment; mean ± SEM; ∗p < 0.05 by Student’s t test.
Given the conserved expression of CMKLR1 on human and mouse blood EM CD8+ T cells under normal conditions, we next asked if CMKLR1+ T cells were present in the circulation upon tumor challenge. In mice bearing spontaneous prostate tumors, chemerin-binding CD8 TEM and NK cells were present in the blood; however, these cells were largely excluded from the tumor (Figure 2F). Furthermore, chemerin expression was significantly reduced in TRAMP prostate tumors compared with normal prostate tissue (Figure 2G). This is consistent with our previous report that chemerin expression in primary or metastatic prostate cancer tissue was significantly lower than in normal human prostate by RNA microarray.8 Additional analysis of RNA-seq data in The Cancer Genome Atlas (TCGA) datasets by the University of Alabama Birmingham Cancer Data Analysis (UALCAN) portal14 further supports that chemerin is significantly downregulated in prostate tumors compared with normal tissue (Figure 2H). As methylation of CpG positions in chemerin DNA is associated with reduced expression,15 we used the UALCAN portal to assess chemerin methylation status in prostate cancer. Chemerin DNA in prostate tumors was significantly more methylated than normal prostate controls (Figure 2I).
It is possible that chemerin downregulation in the TME may contribute to tumor immune evasion. Indeed, chemerin expression by prostate tumors significantly correlated with both CMKLR1 expression and CD8 expression by Spearman analysis of prostate tumor gene expression in the PanCancer Atlas TCGA dataset16 by cBioPortal analysis (Figure 2J). Furthermore, by gene set variation analysis (GSVA) of prostate tumor RNA-seq data,17 tumors expressing high levels of chemerin were significantly enriched for CD8+ CMKLR1+ T cell effectors (Figure 2K). Finally, we asked if chemerin overexpression by tumor cells would lead to an increase in tumor-infiltrating CD8+ T cells. Indeed, the frequency of CD8+ T cells was significantly increased among tumor-infiltrating lymphocytes (TILs) in mice implanted with TRAMP-C1 prostate cancer cells overexpressing chemerin compared with empty vector controls (Figure 2L). Together, the data show that active chemerin binds to CD28– EM CD8 T cells; chemerin-binding CD8+ T cells circulate in tumor-bearing mice; chemerin expression is suppressed in both human and mouse prostate tumor microenvironments, which correlates with reduced tumor CMKLR1+ CD8+ gene expression signatures; and that chemerin overexpression by prostate tumor cells increases intratumor CD8+ T cell accumulation in vivo.
CMKLR1+ CD8+ EMRA T cell transcriptional, immunophenotypic, and functional profiling identifies distinct NK cell-like features and cytotoxic activity
We reasoned that the ability to bind chemerin may be a key trafficking-related feature of a specialized subset of effector T cells. We further reasoned that the functional capabilities of these cells may be distinct from other near-neighbor chemerin non-binding lymphocytes. We therefore performed RNA-seq analysis of FACS-sorted chemerin binding vs. non-binding CD8+ EMRA T cells from human blood. Compared with chemerin non-binding cells, chemerin binding CD8+ EMRA T cells had higher expression of several NK cell-associated molecules, such as natural killer cell granule protein 7 (NKG7), killer cell lectin-like receptor D1 (KLRD1), and CD56/NCAM1 (Figures 3A and 3B). They also had upregulated levels of cytotoxicity-associated effector molecules, such as granzyme B (GZMB), serine protease 23 (PRSS23), and perforin (PRF1) (Figures 3A and 3B). Chemerin-binding CD8+ EMRA T cells had decreased expression of cell proliferation and adhesion-associated molecules Myc (required for T cell growth and proliferation18), IL7R (essential for T cell survival19), and CXCR6 (essential for survival and expansion of effector-like cytotoxic T cells in the TME20), which is consistent with their more-terminally differentiated phenotype compared with chemerin non-binding T cells. By gene ontology (GO) term analysis, chemerin-binding CD8 EMRA were significantly enriched in genes associated with tumor cell defense, NK cell chemotaxis cytokine-mediated signaling, and MHC protein binding (Figure S2A). Chemerin non-binding CD8+ EMRA T cells had significantly higher expression of chemokine receptors CCR5, CCR6, CCR7, CCR8, and CXCR5, perhaps implying a larger role for CMKLR1 in directing the trafficking of CD8+ CD28– EMRA (Figures 3A and 3B). As anticipated from the flow cytometry studies in Figure 1, chemerin-binding cells expressed much higher levels of CMKLR1 and CX3CR1 and much lower levels of CD28 (Figures 3A and 3B).
Figure 3.

CMKLR1-expressing CD8 EMRA display transcriptomic, immunophenotypic, and cytotoxic features of NK cells
(A) Transcriptomic analysis of human blood CD8+ EMRA T cells. Transcripts from FACS-sorted chemerin binding and chemerin non-binding CD8+ EMRA were analyzed by RNA-seq. Highly differentially expressed transcripts are displayed in a volcano plot form. Each dot represents a different gene plotted to show the fold difference between the two group means (chemerin binding and chemerin non-binding) vs. p value for three donors, with significantly differentially expressed genes (DEGs) with at least a 2-fold difference in expression and adjusted p value <0.05 colored red. (B) Heatmap display of selected genes out of the 409 significant DEGs sorted by activity groups. Gene expression counts were rlog-transformed for visualization and are colored from blue (low expression) to red (high expression). (C) Flow cytometry of CD16, CD57, CD158, CD94, and CD56 immunostaining in subsets of NK cells, CD8 T naive and EMRA divided into CD27/CD28 subsets as shown in Figure 1. (Left) For each subset, the percentage of positive cells for each marker is shown. Shown are pooled data (mean ± SEM) from n = 3 experiments with six to nine donors in total. (Right) Representative histogram overlays are shown. (D) Flow cytometry of hChem157AF647 and PD1 immunostaining on CD8+ CD27– CD28– EMRA T cell subsets. Pooled data (left) and a representative dot plot are shown. The pooled data represent the mean ± SEM from n = 2 experiments with four donors in total. (E–G) Cell surface expression of CD107a (E) and intracellular IFN-γ (F) in cell-sorted populations of CD8 EMRA T cells positive (CMKLR1+) or negative (CMKLR1–) for CMKLR1 cocultured with K562 cells at an effector-to-target ratio (E:T) of 2:1. Shown are pooled data (mean ± SEM) from n = 3 experiments. For each experiment, the percentage of CD107a or IFN-γ-positive cells is set to 100 for the CMKLR1–group, and the data for the CMKLR1+ group are shown as a percentage of the CMKLR1–control group. (G) Tumor target (K562) killing by sorted populations of CMKLR1+ and CMKLR1– CD8+ EMRA T cells. Shown are pooled data (mean ± SEM) from n = 4 different donors. Groups were compared by two-way ANOVA with Dunnett’s multiple comparisons test (C) or two-tailed Student’s t test (D–F) or one-tailed t test (G) ∗p ≤ 0.05, ∗∗p ≤ 0.01, ∗∗∗p ≤ 0.001, ∗∗∗∗p ≤ 0.0001. For (D), Dixon’s Q test was used to remove one outlier (99% confidence; outlier marked with “x” symbol).
Given the RNA-seq data and recent identification of CD8+ CD27– CD28– T cells as NK-like cells,21 we compared the cell surface expression of NK receptors (NKRs) between the CD8 TEMRA CD27/CD28 subpopulations and highly cytotoxic CD56dim NK cells. We stained for the prototypical CD56 (neural cell adhesion molecule [NCAM]) NK cell marker, the Fc receptor CD16 (FcγRIII), the senescence marker CD57, the CD94 lectin (KLRD1), and the inhibitory receptor CD158 (KIR2DL1). We found all these markers to be exclusive to CD28– TEMRA. Strikingly, the expression pattern for these markers of the CMKLR1-expressing CD27– CD28– TEMRA closely mimicked NK cells (Figure 3C), suggesting higher NKR recognition mechanisms and innate-like activity for these cells. Among the CD27– CD28– TEMRA, we also assessed the expression of exhaustion marker PD1. The frequency of chemerin binding PD1– cells was significantly higher than the frequency of chemerin-binding PD1+ cells, indicating that most of the chemerin-binding CD27– CD28– TEMRA have a non-exhausted phenotype (Figure 3D).
To further explore the innate-like killing activity of CMKLR1-expressing TEMRA, we performed degranulation with sorted CMKLR1+ vs. CMKLR1– CD28– TEMRA. Based on CD107a expression,22 CMKLR1+ TEMRA killed MHC class I-deficient human erythroleukemic K562 cells more efficiently than CMKLR1– cells (Figure 3E). We also detected higher intracellular IFN-γ levels in CMKLR1-expressing TEMRA compared with non-expressing cells (Figure 3F). We observed similar phenotypes in CMKLR1+ TEM (Figure S3). Finally, CD8+ CMKLR1+ TEMRA were more effective at killing K562 tumor targets compared with CMKLR1– comparators by direct assessment of induced K562 cell death (Annexin V and PI staining) (Figure 3F). Together, the data show that CMKLR1 define a population of effector T cells with NK-like cytotoxic functions.
CMKLR1+ CD8 T cells migrate toward active but not dead chemerin
In addition to its cytotoxic properties and capacity to bind CMKLR1, we tested the ability of active chemerin (Chem157) to induce CMKLR1+ TEMRA migration in Transwell-based chemotaxis assay. Active chemerin triggered significant migration of CD8 TEMRA compared with dead chemerin (Figure 4A). While there was a trend for CD8 TEM migration to active chemerin, it did not reach statistical significance, and CMKLR1-naive and central memory CD8 cells failed to migrate to active chemerin (Figure 4A). All four T cell subsets migrated to positive control chemokine CXCL12, confirming their migratory capacity (Figure S4A). Among CD8 TEMRA, active chemerin induced migration of CMKLR1-expressing CD28– cells, but not CD28+ cells (Figure 4B), both of which migrated to positive control chemokine CXCL12 (Figure S4B). Consistent with its inability to bind CMKLR1, dead chemerin (Chem155) did not induce the migration of CMKLR1-expressing CD28– CD8 T cells (Figure 4B). We observed a similar phenotype with CD28+ and CD28– TEM cells (Figures S4C and S4D). The data suggest that active chemerin selectively induced the chemotaxis of CMKLR1-expressing CD8 TEM/EMRA.
Figure 4.

CMKLR1+ CD8 EMRA T cells migrate toward active but not dead chemerin
Migration of CD8 subsets (A) or CD8 EMRA CD28– or CD28+ subsets (B) in response to active human chemerin (Chem157AF647) (A) or dead chemerin (Chem155AF647) (B). Shown are pooled data (mean ± SEM) from two experiments with n = 3–4 donors in total. For each donor and subset, results are shown as a percentage of the absolute migrating cell number in absence of chemerin in the bottom chamber. ∗p ≤ 0.05 by one-tailed t tests comparing EMRA subset migration to active vs. dead chemerin (1 and 10 nM) (A) or by comparing CD28+ vs. CD28– subset migration to 10 nM chemerin (B); non-significant p values of interest are also shown.
Active chemerin triggers activation of the α4 integrin in CMKLR1-expressing CD8 T cells
Cell-cell recognition in the vasculature is a critical step of inflammation and leukocyte recruitment. Chemoattractants induce lymphocyte adhesion to the vasculature by triggering an increase in the affinity of an integrin to its ligand.23 Given that chemerin promoted adhesion of CMKLR1-expressing macrophages to the α4β1 ligands vascular cell adhesion protein 1 and fibronectin,24 we reasoned that chemerin might increase the affinity of the α4β1 integrin expressed by TEM/EMRA for its ligand. We used the α4-specific LDV peptide conjugated to fluorescein isothiocyanate (LDV-FITC)25 to measure the modulation of α4β1 affinity change upon chemerin stimulation. We stained human CD8 T cells with antibodies to identify TEM/EMRA cell subsets by flow cytometry. We stimulated cells pre-incubated with LDV-FITC with either divalent manganese cation (Mn2+) taken as a positive control used for normalization of the data, CXCL12 as a potent chemokine control, or the chemerin constructs. Immediately after stimulation with active chemerin we measured an important change in the intensity of the LDV-FITC signal in CMKLR1-expressing CD28– TEMRA but not in CD28+ cells (Figures 5A, 5B, and 5D). The response with active chemerin peaked at 1 nM. At that concentration, active chemerin and CXCL12 triggered a similar α4β1 integrin activation in CD28– TEMRA, while dead chemerin resulted in total lack of signal (Figure 5C). We observed a similar phenotype with TEM cells (Figures S4E–S4H). Together, the data identify chemerin as a potent activator of integrin α4β1 on CMKLR1-expressing CD8 TEMRA/EM.
Figure 5.

Active chemerin triggers activation of the α4 integrin in CMKLR1+ CD8 EMRA T cells
Flow cytometry analyses of LDV-FITC binding to CD28– (A and B) or CD28+ (C and D) EMRA upon stimulation with human Chem155AF647, Chem157AF647, or CXCL12. For each sample, the median fluorescence intensity (MFI) of the LDV-FITC staining was calculated per 10 s bins, and data expressed as a percentage of the maximal MFI recorded upon manganese stimulation, taken as a positive control. Shown are pooled data (mean ± SEM) from four experiments with n = 6 donors in total. Groups were compared by two-way ANOVA with Tukey’s multiple comparisons test. ∗∗∗∗p ≤ 0.0001; ns, not significant.
In vivo neutralization of α4 integrin blocks chemerin-dependent recruitment of CD8+ TEM into prostate tumors
We next asked if α4 integrin plays a role in chemerin-mediated CD8+ TEM accumulation in prostate tumors in vivo. We implanted mice with either chemerin-overexpressing or vector control TRAMP-C1 tumor cells and then treated the animals with either α4 integrin neutralizing mAb (clone PS/2) or isotype control. Chemerin overexpression significantly increased the frequency of CD8+ TEM among leukocytes in the tumor compared with vector control tumors (Figure 6). This effect was abolished by treatment with anti-α4 neutralizing mAb (Figure 6). We therefore conclude that chemerin and α4 integrin work cooperatively to recruit CD8+ TEM into prostate tumors.
Figure 6.

α4 integrin blockade inhibits chemerin-dependent recruitment of CD8+ TEM into prostate tumors in vivo
TRAMP-C1 tumor cells harboring vector control (VC) or chemerin-overexpressing (chemerin OE) vector were implanted subcutaneously into C57BL/6 male mice. Once tumors reached palpable sizes, mice received four intraperitoneal injections of anti-α4 integrin mAb or control IgG, 4 days apart. Mice were euthanized 4 days after final antibody injection and tumors were analyzed for TIL CD8+ TEM cells (CD45+ CD19– CD3+ CD4– CD8+ CD62L– CD44+) by flow cytometry. Bar graph depicts the frequency of CD8+ TEM cells as percent of total live single CD45+ cells detected in the TIL from each mouse. n = 5–9 mice per group; mean ± SEM; ∗p < 0.05, ∗∗p < 0.01 by ANOVA.
Discussion
We report a previously unappreciated expression of chemerin receptor CMKLR1 on subsets of EM CD8 T cells displaying NK-like transcriptional profiles, surface markers/cytolytic molecules, and killer functions. Until this study, we and others had only identified CMKLR1 expression and chemerin responsiveness at the protein level on pDCs, NK cells, and macrophages among leukocytes. Here, we showed that bioactive chemerin is both a functional α4β1 integrin activator and chemoattractant for CMKLR1+ CD8+ EM/EMRA lymphocyte subsets and therefore capable of regulating their systemic positioning (extravasation from blood into tissues) and/or intra-tissue localization. Indeed, in mice bearing chemerin-overexpressing prostate tumors, treatment with α4 integrin neutralizing antibody blocked chemerin-dependent recruitment of CD8+ TEM into tumors. This result confirms that chemerin and integrin α4 work cooperatively in vivo to enhance tumor infiltration by CD8+ T cells with NK-like anti-tumor killer activity.
The role and function of populations of CD8 T cells negative or low for CD28 has been controversial. Some studies suggested that CD28– CD8 T cells are subsets of regulatory T cells with immunosuppressive properties26; others suggested that loss of CD28 was associated with immunosenescence.13 We found that chemerin binding CD28– CD8 T cells expressed low levels of master regulatory T cell transcription factor FoxP3 (Figure S2B) and displayed robust non-senescent NK cell-like cytolytic activity (e.g., degranulation, IFN-γ production, K562 target killing; Figures 3E–3G). In addition to the increased gene expression of non-senescent, non-exhaustion-related cytotoxicity effectors such as granzyme B, serine protease 23, and perforin, chemerin-binding TEM cells expressed higher levels of candidate immune checkpoint receptor GPR56 (Figure 3B). GPR56 was recently reported to be selectively expressed by cytolytic and/or pre-exhausted CD8 TILs.27 Our results further align with a recent paper characterizing the in vivo expansion of CD28– CD8+ T cells with NK-like properties following CMV viremia28; an older report describing increased cytolytic activity in CD28– CD8+ T cells in HIV+ persons29; and a paper reporting high perforin levels in CMV-specific CD28– CD8+ T cells.30 Overall, these findings reflect the heterogeneity of CD8+ T cells and further underline the importance of leukocyte trafficking receptors in defining functionally distinct lymphocyte subsets.
We hypothesize that chemerin expression in the TME drives the recruitment of leukocytes with tumor cell-killing capabilities such as CMKLR1+ NK cells and CD8+ TEM cells as part of routine cancer immune surveillance. Many tumor cells downregulate MHC class I to evade T cell-dependent anti-tumor immunity; however, this sensitizes the tumor cells to killing by CMKLR1+ NK cells. Tumor cells that retain MHC class I would be protected against NK cell cytotoxicity; however, they would be susceptible to killing via CMKLR1+ CD8+ T cell effector. Thus, immune surveillance by both CMKLR1+ NK cells and CD8+ TEM cells provide maximal immune security to detect and suppress cancer cell growth.
Chemerin downregulation in the TME may provide an additional mechanism by which tumors can evade detection and killing by anti-tumor leukocytes. DNA modification via methylation at CpG sites can regulate gene expression by altering transcription factor binding. Decreased chemerin DNA methylation was associated with increased serum chemerin protein levels in mothers with gestational diabetes,31 and with increased chemerin mRNA expression in skin collected from infants born to mothers who smoked during pregnancy.32 On the other hand, increased methylation of CpG sites in the chemerin promoter region −252 to +258 led to reduced chemerin mRNA transcription in a 3T3-L1 adipocyte precursor reporter cell line.15 Chemerin hypermethylation also led to reduced gene expression in adrenocortical carcinoma cell lines, which was reversed upon treatment with a DNA methyltransferase inhibitor.33 Given the sensitivity of chemerin to regulation by DNA methylation, chemerin hypermethylation may provide a key method for gene silencing in tumors where chemerin is downregulated.34 Our analysis of human prostate adenocarcinoma aligns with this hypothesis, as we report that chemerin RNA expression is suppressed while chemerin DNA methylation is increased in prostate tumor tissue vs. normal controls (Figures 2H and 2I).
The results define chemerin:CMKLR1 as a pathway for regulation of T cell adhesion and migration and show that it selectively impacts NK-like CD8 T cells armed with tumor cell-killing capabilities. We hypothesize that therapies designed to enhance chemerin in tumors may redirect circulating CMKLR1+ immune effector lymphocytes into tumors and provide an effective immunotherapeutic intervention. In patients with liver or lung cancer (Figure 1A), and in prostate tumor-bearing mice (Figure 2F), circulating CMKLR1+ CD8 and NK cell effectors are available for tumor recruitment (Figure 2F), and chemerin overexpression by prostate cancer cells significantly enhanced intra-tumor CD8+ T cell accumulation (Figure 2H). In terms of numbers of available endogenous effector cells that could be recruited to a tumor, based on an estimate of ∼4 × 10¹⁰ CD8+ T cells in an adult human,35 the frequency of EMRA cells among CD8+ T cells (∼15%), and the frequency of CMKLR1+ cells among EMRA cells (∼40%), there would be ∼2.4 × 10⁹ CMKLR1+ NK-like CD8+ T cells available. For comparison, the median dose of CAR T cells infused in clinical trials is 1.5 × 10⁸, and most dose escalation studies range from 1 × 10⁶ to 1 × 10936; for Provenge, prostate cancer patients receive a minimum dose of 5 × 10⁷ antigen-presenting cells as part of the vaccination.37 The number of available endogenous CMKLR1+ CD8+ EMRA cells therefore compares favorably with current FDA-approved immune cell transfer cancer treatments. As outlined above, the unique phenotype of CMKLR1+ CD8 effectors includes expression of CD94, an immune checkpoint receptor that suppresses NK cell cytotoxicity when engaged by its ligand HLA-E. It is intriguing to speculate that monalizumab therapy targeting CD94 may unleash their cytolytic activity, contributing to anti-tumor immunity.38 Indeed, a combination strategy suggested by the results presented here of chemerin-driven recruitment and immune check point antagonism of recruited CD8 T cell effectors may provide an optimal avenue for enhanced cancer treatment.
Materials and methods
Mice
C57BL/6 wild-type (WT) and C57BL/6-Tg(TRAMP)8247Ng/J (transgenic adenocarcinoma of the mouse prostate [TRAMP]) mice were purchased from The Jackson Laboratory. CMKLR1 knockout (KO) mice were obtained from Deltagen and fully backcrossed (nine generations) onto the C57BL/6 background.39 Animal experiments were conducted in accordance with approved Veterans Affairs, National Institutes of Health, and Institutional Animal Care and Use Committee guidelines.
Chemerin constructs
Human and mouse active chemerin generation—recombinant human active chemerin (UniProt entry Q99969; residues 21–157) and recombinant mouse active chemerin (UniProt entry Q9DD06; residues 21–156) were cloned into a proprietary mammalian expression vector and produced by expression of hIgG1 monovalent Fc-TEV-chemerin fusions constructs in transiently transfected HEK293F cells (Lifetech). Expression was performed with a temperature drop to 28°C during production phase. Cultures were harvested by centrifugation (30 min, 3,000 rpm) and clarified by 0.2 μm filtration. The monoFc fusions were affinity purified using Protein A (MabSelect SuRe; Cytiva, formerly GE Healthcare Life Sciences, Pittsburgh, PA). The Protein A eluates were buffer exchanged to 20 mM Tris, 150 mM NaCl (pH 8.0) to prepare for TEV protease treatment. The Fc-TEV-chemerin fusions were cleaved using 50 μg TEV protease (produced in-house) per mg of Fc protein with overnight incubation at 25°C. Chemerin was purified from the mixture using passive Protein A and Ni-NTA resin (QIAGEN) to remove the monoFc and His-tagged TEV protease, respectively. Preparative size-exclusion chromatography (Superdex 75 pg, Cytiva) was performed to remove aggregation. Identity and samples purity was determined by QTOF mass spectrometry, aSEC-MALS, and SDS-PAGE.
Analysis of publicly available single-cell RNA-seq data
Single-cell gene expression data from human T cells were generated previously (liver10; lung11). Raw gene expression counts and cell-type classifications were accessed via the Gene Expression Omnibus (GEO): GSE98638 (liver); GEO: GSE99254 (lung). The data were processed as described previously.40 In brief, raw gene expression count data normalization and variable gene identification was performed using the scran package.41 Imputed expression values were calculated using the MAGIC (Markov affinity-based graph imputation of cells) algorithm42 and optimized parameters (t = 2, k = 9, ka = 3) and plotted using the JMP Pro v.16.
GSVA analysis of prostate cancer RNA-seq data
We reanalyzed previously published RNA-seq data from 18 prostate cancer patients.17 Raw gene read counts were obtained and renormalized as transcript per million and subsequently used in a GSVA analysis43 to identify tumors enriched in individual gene sets defining CD8+ cells. Genes used to identify CD8+ CMKLR1+ were CD3E, CD8A, CD8B, CX3CR1, KLRD1, and NCAM1. Genes used to identify CD8+ CMKLR1– were CD3E, CD8A, CD8B, CD28, and GZMK. In addition, CMKLR1 expression level stratified by median expression was used to confirm and assign CMKLR1 status to the CD8+ enriched population.
Analyses of RNA-seq
Approximately 100,000 chemerin-binding and non-binding blood CD8+ EMRA T cells were sorted from three donors by flow cytometry. RNA library preparations and sequencing reactions were conducted at Azenta US (South Plainfield, NJ). Ultra-low input RNA sequencing library was prepared by using SMART-Seq HT kit for full-length cDNA synthesis and amplification (Takara, San Jose, CA), and Illumina Nextera XT (Illumina, San Diego, CA) library was used for sequencing library preparation. In brief, cDNA was fragmented, and adaptor was added using transposase, followed by limited-cycle PCR to enrich and add index to the cDNA fragments. The sequencing library was validated on the Agilent TapeStation (Agilent Technologies, Palo Alto, CA) and quantified by using Qubit 2.0 Fluorometer (Thermo Fisher Scientific, Waltham, MA) as well as by qPCR (KAPA Biosystems, Wilmington, MA). The sequencing libraries were multiplexed and clustered on a flowcell. After clustering, the flowcell was loaded on the Illumina HiSeq instrument according to manufacturer’s instructions. The samples were sequenced using a 2 × 150 paired end (PE) configuration. Image analysis and base calling were conducted by the HiSeq Control Software (HCS). Raw sequence data (.bcl files) generated from Illumina HiSeq were converted into fastq files and de-multiplexed using Illumina’s bcl2fastq 2.17 software. One mis-match was allowed for index sequence identification. After investigating the quality of the raw data, sequence reads were trimmed to remove possible adapter sequences and nucleotides with poor quality using Trimmomatic v.0.36. The trimmed reads were mapped to the Homo sapien reference genome available on ENSEMBL using the STAR aligner v.2.5.2b. BAM files were generated as a result of this step. Unique gene hit counts were calculated by using feature Counts from the Subread package v.1.5.2. Only unique reads that fell within exon regions were counted. After extraction of gene hit counts, the gene hit counts table was used for downstream differential expression analysis. Using DESeq2, a comparison of gene expression between the groups of samples was performed. The Wald test was used to generate p values and lg2 fold changes. Genes with adjusted p values <0.05 and absolute log2 fold changes >1 were called as differentially expressed genes for each comparison. EnrichR software was used for GO term enrichment analysis and GO terms with adjusted p values <0.05 were deemed significant.
Human PBMC isolation and CD8 T cell purification
Leukoreduction System (LRS) chambers were obtained from the Stanford Blood Center. PBMCs were isolated by density gradient (Histopaque 1077) from LRS chambers. CD8+ T cells were isolated from PBMCs using negative selection (Stem Cells) kits according to the manufacturer’s instructions.
FACS staining for chemerin and cell surface markers
Purified hu-CD8 T cells were stained with fluorescently labeled antibodies against CD3-AF700 (UCHT1, BD Pharmingen), CD4-BV786 (RPA-T4, BioLegend), CD8a-BV650 (RPA-T8, BioLegend), CD56-PE/BV711 (NCAM16.2, BD Bioscience), CD45RO-BV605 (UCHL1, BioLegend), CCR7-PerCpCy5.5 (150503, BD Pharmingen), CD27-BV711 (LG.3A10, BioLegend), and CD28-PeCF594 (CD28.2, BD Horizon). In some experiments, human CD8 T cells were additionally stained with fluorescently labeled antibodies against CX3CR1-BV421 (2A9-1, BioLegend), CMKLR1-PE (84939, R&D Systems), CD16-BUV737 (3G8, BD Bioscience), CD57-PE-Cy7 (QA17A04, BioLegend), CD158-PE (HP-MA4, BioLegend), CD94-APC/Fire750 (DX22, BioLegend), PD1-PE-Cy7 (EH12.2H7, BioLegend), or CD107a-APC (H4A3, BD Bioscience). The dead cells were excluded by staining with 4′,6-diamidino-2-phenylindole (DAPI) or the LIVE/DEAD Fixable Aqua dye (Invitrogen). Samples were acquired on a Fortessa flow cytometer (BD Biosciences) using FACSDiva Software (BD Biosciences; v.8.0.1) and were analyzed using FlowJo (BD Biosciences; 10.3).
Mouse blood leukocyte isolation and flow cytometry
Mouse blood was removed post mortem via the inferior vena cava and incubated with 2% Dextran (Mr 450,000–650,000, Sigma) for 45 min at 37°C to settle RBCs. Remaining RBCs were lysed in RBC lysis buffer (Sigma). Blood cells were incubated with the A488-MonoFc-mChemerin156 construct for 45 min at 37°C followed by staining with the following antibodies for 30 min at 4°C; BUV737 anti-mCD45 (clone 30-F1 1), BV421 anti-mCD3e (clone 145-2C11), AF700 anti-mCD8 (clone 53–6.7), APC-Cy7 anti-mCD4 (clone GK1.5), BV650 anti-mNK1.1 (clone PK136), BV 711 anti-mCD44 (clone IM7), PeCy7 anti-mCD62l (clone Mel-14), BV510 CD19 (clone 6D5), and PerCpCy5.5 CD11b (clone M1/70). For CMKLR1 detection, cells were stained with BZ18639 for 30 min at 4°C followed by rat anti-mIgG1-PE secondary for 30 min at 4°C.
Binding competition studies
PBMCs were purified from human Trima residuals (Blood Centers of the Pacific) and resuspended in RPMI supplemented with 10% FBS. PBMCs were rested overnight at 37°C in a tissue culture incubator. At the start of the assay, PBMCs were resuspended in 0.2% bovine serum albumin (BSA) and 2 million cells were plated in each well of a 96-well V-bottom plate. An immunophenotyping panel of antibodies against cell surface markers including CD3, CD56, and CD16 were added to each well. All antibodies were used at a 1:50 final dilution. A competitive binding assay was carried out, concurrent to staining for cell surface markers: 8 nM of A647-labeled human chemerin was added to each well. Binding of A647-labeled chemerin was challenged by an 11-point, 3-fold dilution series of unlabeled chemerin, ranging from 16 pM to 1,000 nM. PBMCs were incubated for 1 h in dark on ice. PBMCs were washed 3 times in PBS + 0.2% BSA and then fixed using 0.5% PFA. Data was collected on a BD LSR Fortessa and analyzed using FlowJo software.
TRAMP prostate tumor-infiltrating leukocyte isolation and flow cytometry
Male mice hemizygous for the TRAMP gene and WT mice aged 25 weeks were euthanized and perfused with 30 mL PBS. The anterior prostate was removed, mashed through a steel mesh, and the resulting cell pellet was stained and analyzed by flow cytometry (as described for blood cells). Experiments with TRAMP-C1 subcutaneous tumors were performed in 8- to 10-week-old male C57BL/6 WT mice. Mice were implanted s.c. with 3 × 10⁶ TRAMP-C1 (in RPMI), harboring control vector (VC) or chemerin-overexpressing vector mixed with VC in a ratio of 1:1. Chemerin-overexpressing TRAMP-C1 generally fail to grow tumors in WT C57BL/6 mice, so we added this mix group to analyze the effects of chemerin on TILs. At 9–11 weeks post-implantation, tumors were resected, and single-cell preparations of TILs were made by mechanically disrupting and enzymatically digesting tumors using gentleMACS (Miltenyi Biotec). The digestion medium contained collagenase IV and dispase II (1 mg/mL each; Thermo Fisher Scientific) in DMEM medium. The cells were stained and analyzed by flow cytometry. In brief, cells were lysed in RBC lysis buffer (Sigma), stained with Zombie Aqua Fixable Viability dye (BioLegend) for 25 min at room temperature, followed by staining with the following antibodies for 30 min at 4°C: APC/Cy7 anti-mCD45 (clone 30-F11), FITC anti-mCD3 (clone 17A2), BV785 anti-mCD8 (clone 53–6.7), BUV395 anti-mCD4 (clone GK1.5), and BV605 CD19 (clone 6D5). For α4 integrin blockade studies, once tumors reached palpable sizes, mice received four intraperitoneal injections (250 μg in 0.1 mL PBS) of anti-α4 integrin mAb or control IgG, 4 days apart. Mice were euthanized 4 days after final antibody injection and tumors were analyzed for TIL CD8+ TEM cells by flow cytometry.
Real-time RT-PCR
For mRNA expression studies, prostate tumor or control prostate tissues were collected from male prostate tumor-bearing TRAMP+/− mice (24–28 weeks old) and age-matched healthy C57BL/6 WT mice, respectively. Tissues were fixed in formalin and RNA was isolated using a GenElute FFPE RNA Purification Kit (Sigma) as per the manufacturer’s guidelines. RNA quality and concentrations were determined using NanoDrop 2000 (Thermo Fisher Scientific). ReadyScript cDNA synthesis mix (Sigma) was used to convert RNA to cDNA via the manufacturer’s protocol. cDNA was amplified with iTaq Universal SYBR Green Supermix (Bio-Rad) via the manufacturer’s protocol using mouse Rarress2 (5′ CCAAGAGATCGGTGTGGACAG 3′, 5′ CGGCTTTTTCCAGTCCTTCTTGG 3′) and Gapdh (5′ CATGGCCTTCCGTGTTCCTA 3′, 5′ GCGGCACGTCAGATCA 3′) primers. A StepOnePlus Real-Time PCR System (Thermo Fisher Scientific) was used to quantify mRNA expression via the 2−ΔΔCt analysis method. Rarress2 expression was normalized to Gapdh for each sample individually and then normalized to the mean of the control group across the dataset.
Detection of chemerin expression in TRAMP-C1 by ELISA
Chemerin expression in stably overexpressing TRAMP-C1 (chemerin OE) or VC cells was determined by ELISA (R&D Systems) as per the manufacturer’s instructions. In brief, 2.5 × 10⁶ cells were plated in RPMI medium supplemented with 10% fetal bovine serum, penicillin, streptomycin, and glutamine (RPMI complete; Thermo Fisher Scientific) in a 10-cm tissue culture plate and incubated at 37°C with 5% CO2 for 48 h. Cell culture supernatants were collected and filtered before using in ELISA. Chemerin concentrations in each sample were measured against a standard curve with known concentrations of chemerin. Chemerin-overexpressing TRAMP-C1 had significantly higher chemerin expression (1.180 ± 0.019 ng/mL) compared with VC (0.045 ± 0.013 ng/mL), mean ± SEM; ∗p < 0.01 by t test, n = 6 wells each.
Chemotaxis studies
Purified hu-CD8 T cells (100,000–500,000) were added to Transwell inserts (5 μM pore) in 100 μL chemotaxis medium (RPMI 1640 plus 0.5% BSA). Test samples were added to the bottom well in 600 μL chemotaxis medium. Chemotaxis plates were incubated for 2 h at 37°C, then inserts were removed, and the cells of the lower chamber were stained for flow cytometry analysis, and counting beads were added to calculate absolute cell numbers.
LDV-FITC experiments
Purified hu-CD8 T cells were stained with fluorescently labeled antibodies against CD3, CD4, CD8, CD56, CD45RO, CCR7, CD27, and CD28. After cell surface staining, cells were placed at 37°C for 15–20 min in HBSS containing calcium/magnesium and 4 nM LDV-FITC. Immediately prior to flow cytometry acquisition, each sample were stained with DAPI for dead cells exclusion and analyzed for 30 s prior to addition of 1 mM Mn2+, Chem157, Chem155, CXCL12, or VC buffer (PBS) and acquisition for an additional 2 min. For each sample, the median fluorescence intensity (MFI) of the LDV-FITC staining was calculated per 10-s bin, and data expressed as a percentage of the maximal MFI for the manganese sample, taken as a positive control.
Cytotoxic assay—CD107a degranulation and IFN-γ stain
Purified hu-CD8 T cells were stained with fluorescently labeled antibodies against CD3, CD8, CD45RO, CCR7, CD28, and CMKLR1. Cells were stained with DAPI for dead cells exclusion and sorted for live CMKLR1+ and CMKLR1– CD8+ TEM and live CMKLR1+ and CMKLR1– CD8+ TEMRA. Freshly sorted T cells were incubated at 37°C for 5 h with K562 cells (effector-to-target ratio of 2:1) with APC-conjugated CD107a antibody. Brefeldin A and Monensin (1 μg mL−1 each) were added for the final 4 h of incubation. In some conditions, T cells were incubated without target cells. At the end of the incubation, cells were stained with the LIVE/DEAD Fixable Aqua dye (Invitrogen), followed by cell surface staining (same as above), fixed using 1% paraformaldehyde (Invitrogen) in PBS for 5 min at 4°C, permeabilized in 1× permeabilization buffer from Invitrogen for 30 min at 4°C, stained for IFN-γ in 1× permeabilization buffer overnight at 4°C, and analyzed by flow cytometry.
Cytotoxicity assay—K562 tumor cell killing
Purified hu-CD8 T cells were stained with fluorescently labeled antibodies against CD3, CD8, CD45RO, and CCR7, as well as with the A647-MonoFc-huChemerin157 construct. Cells were stained with DAPI for dead cell exclusion and sorted for live “CMKLR1+” (chemerin binding) and “CMKLR1–” (chemerin nonbinding) CD8+ TEMRA cells, and live CD8+ naive T cells using the BD FACSAria III cell sorter. NK cells were enriched from PBMCs using a negative selection kit (Stem Cell Technologies) according to the manufacturer’s instructions. Freshly sorted T cell subsets and enriched NK cells were incubated at 37°C for 3 h with K562 cells (effector-to-target ratio of 20:1) in complete medium (RPMI supplemented with 1% penicillin/streptomycin, 1% nonessential amino acid, 1% sodium pyruvate, 50 μM 2-ME, 10% FBS, and 1% L-glutamine). At the end of the incubation, cells were stained with Annexin V-FITC (Thermo Fisher Scientific) according to the manufacturer’s instructions and propidium iodide (1 μg/mL), acquired by flow cytometry using a BD LSRFortessa Cell Analyzer, and analyzed using FlowJo software. Tumor cells were differentiated from effector cells based on distinct forward and side scatter properties.
Data and code availability
Raw and processed RNA-seq data are available via GEO: GSE219255.
Acknowledgments
This work was supported by the Pfizer Centers for Therapeutic Innovation program and NIH grants R37AI047822 and R01 AI130471 and award I01 BX-002919 from the Department of Veterans Affairs to E.C.B.; by the Swiss National Sciences Foundation grants P2GEP3_162055 and P300PA_174365 to R.B.; B.A.Z. was supported by Merit Review award no. I01BX004115 from the United States Department of Veterans Affairs Biomedical Laboratory R&D (BLR&D) Service and by the Regents of the University of California Tobacco Related Disease Research Program (TRDRP) grant T32IP5349. K.B. was supported by NIH F32 CA200103.
Author contributions
R.B., E.W., E.C.B., and B.A.Z. designed the experiments and wrote the manuscript. R.B., M.L., N.H.-M., M.A.S., and E.W. performed the research. R.B., M.L., N.H.-M., K.B., Y.H., M.A.S., H.X.D., R.K.P., E.W., E.C.B., and B.A.Z. analyzed the data.
Declaration of interests
The authors declare no competing interests.
Footnotes
Supplemental information can be found online at https://doi.org/10.1016/j.ymthe.2023.08.015.
Supplemental information
References
- 1.Zabel B.A., Kwitniewski M., Banas M., Zabieglo K., Murzyn K., Cichy J. Chemerin regulation and role in host defense. Am. J. Clin. Exp. Immunol. 2014;3:1–19. [PMC free article] [PubMed] [Google Scholar]
- 2.Yamaguchi Y., Du X.Y., Zhao L., Morser J., Leung L.L. Proteolytic cleavage of chemerin protein is necessary for activation to the active form, Chem157S, which functions as a signaling molecule in glioblastoma. J. Biol. Chem. 2011;286:39510–39519. doi: 10.1074/jbc.M111.258921. [DOI] [PMC free article] [PubMed] [Google Scholar]
- 3.Guillabert A., Wittamer V., Bondue B., Godot V., Imbault V., Parmentier M., Communi D. Role of neutrophil proteinase 3 and mast cell chymase in chemerin proteolytic regulation. J. Leukoc. Biol. 2008;84:1530–1538. doi: 10.1189/jlb.0508322. [DOI] [PubMed] [Google Scholar]
- 4.Wittamer V., Gregoire F., Robberecht P., Vassart G., Communi D., Parmentier M. The C-terminal nonapeptide of mature chemerin activates the chemerin receptor with low nanomolar potency. J. Biol. Chem. 2004;279:9956–9962. doi: 10.1074/jbc.M313016200. [DOI] [PubMed] [Google Scholar]
- 5.Zabel B.A., Silverio A.M., Butcher E.C. Chemokine-like receptor 1 expression and chemerin-directed chemotaxis distinguish plasmacytoid from myeloid dendritic cells in human blood. J. Immunol. 2005;174:244–251. doi: 10.4049/jimmunol.174.1.244. [DOI] [PubMed] [Google Scholar]
- 6.Skrzeczynska-Moncznik J., Stefanska A., Zabel B.A., Kapinska-Mrowiecka M., Butcher E.C., Cichy J. Chemerin and the recruitment of NK cells to diseased skin. Acta. Biochim. Pol. 2009;56:355–360. [PMC free article] [PubMed] [Google Scholar]
- 7.Zabel B.A., Ohyama T., Zuniga L., Kim J.Y., Johnston B., Allen S.J., Guido D.G., Handel T.M., Butcher E.C. Chemokine-like receptor 1 expression by macrophages in vivo: regulation by TGF-beta and TLR ligands. Exp. Hematol. 2006;34:1106–1114. doi: 10.1016/j.exphem.2006.03.011. [DOI] [PubMed] [Google Scholar]
- 8.Pachynski R.K., Zabel B.A., Kohrt H.E., Tejeda N.M., Monnier J., Swanson C.D., Holzer A.K., Gentles A.J., Sperinde G.V., Edalati A., et al. The chemoattractant chemerin suppresses melanoma by recruiting natural killer cell antitumor defenses. J. Exp. Med. 2012;209:1427–1435. doi: 10.1084/jem.20112124. [DOI] [PMC free article] [PubMed] [Google Scholar]
- 9.Pachynski R.K., Wang P., Salazar N., Zheng Y., Nease L., Rosalez J., Leong W.I., Virdi G., Rennier K., Shin W.J., et al. Chemerin Suppresses Breast Cancer Growth by Recruiting Immune Effector Cells Into the Tumor Microenvironment. Front. Immunol. 2019;10:983. doi: 10.3389/fimmu.2019.00983. [DOI] [PMC free article] [PubMed] [Google Scholar]
- 10.Zheng C., Zheng L., Yoo J.K., Guo H., Zhang Y., Guo X., Kang B., Hu R., Huang J.Y., Zhang Q., et al. Landscape of Infiltrating T Cells in Liver Cancer Revealed by Single-Cell Sequencing. Cell. 2017;169:1342–1356.e16. doi: 10.1016/j.cell.2017.05.035. [DOI] [PubMed] [Google Scholar]
- 11.Guo X., Zhang Y., Zheng L., Zheng C., Song J., Zhang Q., Kang B., Liu Z., Jin L., Xing R., et al. Global characterization of T cells in non-small-cell lung cancer by single-cell sequencing. Nat. Med. 2018;24:978–985. doi: 10.1038/s41591-018-0045-3. [DOI] [PubMed] [Google Scholar]
- 12.Verdon D.J., Mulazzani M., Jenkins M.R. Cellular and Molecular Mechanisms of CD8(+) T Cell Differentiation, Dysfunction and Exhaustion. Int. J. Mol. Sci. 2020;21 doi: 10.3390/ijms21197357. [DOI] [PMC free article] [PubMed] [Google Scholar]
- 13.Huff W.X., Kwon J.H., Henriquez M., Fetcko K., Dey M. The Evolving Role of CD8(+)CD28(-) Immunosenescent T Cells in Cancer Immunology. Int. J. Mol. Sci. 2019;20 doi: 10.3390/ijms20112810. [DOI] [PMC free article] [PubMed] [Google Scholar]
- 14.Chandrashekar D.S., Bashel B., Balasubramanya S.A.H., Creighton C.J., Ponce-Rodriguez I., Chakravarthi B.V.S.K., Varambally S. UALCAN: A Portal for Facilitating Tumor Subgroup Gene Expression and Survival Analyses. Neoplasia. 2017;19:649–658. doi: 10.1016/j.neo.2017.05.002. [DOI] [PMC free article] [PubMed] [Google Scholar]
- 15.Kwiecien K., Brzoza P., Bak M., Majewski P., Skulimowska I., Bednarczyk K., Cichy J., Kwitniewski M. The methylation status of the chemerin promoter region located from - 252 to + 258 bp regulates constitutive but not acute-phase cytokine-inducible chemerin expression levels. Sci. Rep. 2020;10 doi: 10.1038/s41598-020-70625-7. [DOI] [PMC free article] [PubMed] [Google Scholar]
- 16.Hoadley K.A., Yau C., Hinoue T., Wolf D.M., Lazar A.J., Drill E., Shen R., Taylor A.M., Cherniack A.D., Thorsson V., Akbani R., et al. Cell-of-Origin Patterns Dominate the Molecular Classification of 10,000 Tumors from 33 Types of Cancer. Cell. 2018;173:291–304.e6. doi: 10.1016/j.cell.2018.03.022. [DOI] [PMC free article] [PubMed] [Google Scholar]
- 17.Subudhi S.K., Vence L., Zhao H., Blando J., Yadav S.S., Xiong Q., Reuben A., Aparicio A., Corn P.G., Chapin B.F., et al. Neoantigen responses, immune correlates, and favorable outcomes after ipilimumab treatment of patients with prostate cancer. Sci. Transl. Med. 2020;12 doi: 10.1126/scitranslmed.aaz3577. [DOI] [PubMed] [Google Scholar]
- 18.Wang R., Dillon C.P., Shi L.Z., Milasta S., Carter R., Finkelstein D., McCormick L.L., Fitzgerald P., Chi H., Munger J., Green D.R. The transcription factor Myc controls metabolic reprogramming upon T lymphocyte activation. Immunity. 2011;35:871–882. doi: 10.1016/j.immuni.2011.09.021. [DOI] [PMC free article] [PubMed] [Google Scholar]
- 19.Jacobs S.R., Michalek R.D., Rathmell J.C. IL-7 is essential for homeostatic control of T cell metabolism in vivo. J. Immunol. 2010;184:3461–3469. doi: 10.4049/jimmunol.0902593. [DOI] [PMC free article] [PubMed] [Google Scholar]
- 20.Di Pilato M., Kfuri-Rubens R., Pruessmann J.N., Ozga A.J., Messemaker M., Cadilha B.L., Sivakumar R., Cianciaruso C., Warner R.D., Marangoni F., et al. CXCR6 positions cytotoxic T cells to receive critical survival signals in the tumor microenvironment. Cell. 2021;184:4512–4530.e22. doi: 10.1016/j.cell.2021.07.015. [DOI] [PMC free article] [PubMed] [Google Scholar]
- 21.Pereira B.I., De Maeyer R.P.H., Covre L.P., Nehar-Belaid D., Lanna A., Ward S., Marches R., Chambers E.S., Gomes D.C.O., Riddell N.E., et al. Sestrins induce natural killer function in senescent-like CD8(+) T cells. Nat. Immunol. 2020;21:684–694. doi: 10.1038/s41590-020-0643-3. [DOI] [PMC free article] [PubMed] [Google Scholar]
- 22.Aktas E., Kucuksezer U.C., Bilgic S., Erten G., Deniz G. Relationship between CD107a expression and cytotoxic activity. Cell. Immunol. 2009;254:149–154. doi: 10.1016/j.cellimm.2008.08.007. [DOI] [PubMed] [Google Scholar]
- 23.Campbell J.J., Hedrick J., Zlotnik A., Siani M.A., Thompson D.A., Butcher E.C. Chemokines and the arrest of lymphocytes rolling under flow conditions. Science. 1998;279:381–384. doi: 10.1126/science.279.5349.381. [DOI] [PubMed] [Google Scholar]
- 24.Hart R., Greaves D.R. Chemerin contributes to inflammation by promoting macrophage adhesion to VCAM-1 and fibronectin through clustering of VLA-4 and VLA-5. J. Immunol. 2010;185:3728–3739. doi: 10.4049/jimmunol.0902154. [DOI] [PubMed] [Google Scholar]
- 25.Chigaev A., Zwartz G., Graves S.W., Dwyer D.C., Tsuji H., Foutz T.D., Edwards B.S., Prossnitz E.R., Larson R.S., Sklar L.A. Alpha4beta1 integrin affinity changes govern cell adhesion. J. Biol. Chem. 2003;278:38174–38182. doi: 10.1074/jbc.M210472200. [DOI] [PubMed] [Google Scholar]
- 26.Vuddamalay Y., van Meerwijk J.P.M. CD28(-) and CD28(low)CD8(+) Regulatory T Cells: Of Mice and Men. Front. Immunol. 2017;8:31. doi: 10.3389/fimmu.2017.00031. [DOI] [PMC free article] [PubMed] [Google Scholar]
- 27.Bilemjian V., Vlaming M.R., Álvarez Freile J., Huls G., De Bruyn M., Bremer E. The Novel Immune Checkpoint GPR56 Is Expressed on Tumor-Infiltrating Lymphocytes and Selectively Upregulated upon TCR Signaling. Cancers (Basel) 2022;14 doi: 10.3390/cancers14133164. [DOI] [PMC free article] [PubMed] [Google Scholar]
- 28.Pickering H., Sen S., Arakawa-Hoyt J., Ishiyama K., Sun Y., Parmar R., Ahn R.S., Sunga G., Llamas M., Hoffmann A., et al. CMV Systems Immunobiology Group NK and CD8+ T cell phenotypes predict onset and control of CMV viremia after kidney transplant. JCI Insight. 2021;6 doi: 10.1172/jci.insight.153175. [DOI] [PMC free article] [PubMed] [Google Scholar]
- 29.Vingerhoets J.H., Vanham G.L., Kestens L.L., Penne G.G., Colebunders R.L., Vandenbruaene M.J., Goeman J., Gigase P.L., De Boer M., Ceuppens J.L. Increased cytolytic T lymphocyte activity and decreased B7 responsiveness are associated with CD28 down-regulation on CD8+ T cells from HIV-infected subjects. Clin. Exp. Immunol. 1995;100:425–433. doi: 10.1111/j.1365-2249.1995.tb03717.x. [DOI] [PMC free article] [PubMed] [Google Scholar]
- 30.Appay V., Nixon D.F., Donahoe S.M., Gillespie G.M., Dong T., King A., Ogg G.S., Spiegel H.M., Conlon C., Spina C.A., et al. HIV-specific CD8(+) T cells produce antiviral cytokines but are impaired in cytolytic function. J. Exp. Med. 2000;192:63–75. doi: 10.1084/jem.192.1.63. [DOI] [PMC free article] [PubMed] [Google Scholar]
- 31.Fatima S.S., Rehman R., Muhammad J.S., Martins R., Mohammed N., Khan U. Association of chemerin gene promoter methylation in maternal blood and breast milk during gestational diabetes. J. Dev. Orig. Health Dis. 2022;13:108–114. doi: 10.1017/S2040174421000118. [DOI] [PubMed] [Google Scholar]
- 32.Reynolds L.J., Chavan N.R., DeHoff L.B., Preston J.D., Maddox H.F., O'Brien J.M., Armstrong D.A., Marsit C.J., Pearson K.J. Smoking during pregnancy increases chemerin expression in neonatal tissue. Exp. Physiol. 2019;104:93–99. doi: 10.1113/EP087307. [DOI] [PMC free article] [PubMed] [Google Scholar]
- 33.Liu-Chittenden Y., Jain M., Gaskins K., Wang S., Merino M.J., Kotian S., Kumar Gara S., Davis S., Zhang L., Kebebew E. RARRES2 functions as a tumor suppressor by promoting beta-catenin phosphorylation/degradation and inhibiting p38 phosphorylation in adrenocortical carcinoma. Oncogene. 2017;36:3541–3552. doi: 10.1038/onc.2016.497. [DOI] [PMC free article] [PubMed] [Google Scholar]
- 34.Shin W.J., Zabel B.A., Pachynski R.K. Mechanisms and Functions of Chemerin in Cancer: Potential Roles in Therapeutic Intervention. Front. Immunol. 2018;9:2772. doi: 10.3389/fimmu.2018.02772. [DOI] [PMC free article] [PubMed] [Google Scholar]
- 35.Coulie P.G., Karanikas V., Lurquin C., Colau D., Connerotte T., Hanagiri T., Van Pel A., Lucas S., Godelaine D., Lonchay C., et al. Cytolytic T-cell responses of cancer patients vaccinated with a MAGE antigen. Immunol. Rev. 2002;188:33–42. doi: 10.1034/j.1600-065x.2002.18804.x. [DOI] [PubMed] [Google Scholar]
- 36.Hartmann J., Schüßler-Lenz M., Bondanza A., Buchholz C.J. Clinical development of CAR T cells-challenges and opportunities in translating innovative treatment concepts. EMBO Mol. Med. 2017;9:1183–1197. doi: 10.15252/emmm.201607485. [DOI] [PMC free article] [PubMed] [Google Scholar]
- 37.Anassi E., Ndefo U.A. Sipuleucel-T (provenge) injection: the first immunotherapy agent (vaccine) for hormone-refractory prostate cancer. P T. 2011;36:197–202. [PMC free article] [PubMed] [Google Scholar]
- 38.Andre P., Denis C., Soulas C., Bourbon-Caillet C., Lopez J., Arnoux T., Blery M., Bonnafous C., Gauthier L., Morel A., et al. Anti-NKG2A mAb Is a Checkpoint Inhibitor that Promotes Anti-tumor Immunity by Unleashing Both T and NK Cells. Cell. 2018;175:1731–1743.e1713. doi: 10.1016/j.cell.2018.10.014. [DOI] [PMC free article] [PubMed] [Google Scholar]
- 39.Graham K.L., Zabel B.A., Loghavi S., Zuniga L.A., Ho P.P., Sobel R.A., Butcher E.C. Chemokine-like receptor-1 expression by central nervous system-infiltrating leukocytes and involvement in a model of autoimmune demyelinating disease. J. Immunol. 2009;183:6717–6723. doi: 10.4049/jimmunol.0803435. [DOI] [PMC free article] [PubMed] [Google Scholar]
- 40.Brulois K., Rajaraman A., Szade A., Nordling S., Bogoslowski A., Dermadi D., Rahman M., Kiefel H., O'Hara E., Koning J.J., et al. A molecular map of murine lymph node blood vascular endothelium at single cell resolution. Nat. Commun. 2020;11:3798. doi: 10.1038/s41467-020-17291-5. [DOI] [PMC free article] [PubMed] [Google Scholar]
- 41.Lun A.T.L., Bach K., Marioni J.C. Pooling across cells to normalize single-cell RNA sequencing data with many zero counts. Genome Biol. 2016;17:75. doi: 10.1186/s13059-016-0947-7. [DOI] [PMC free article] [PubMed] [Google Scholar]
- 42.van Dijk D., Sharma R., Nainys J., Yim K., Kathail P., Carr A.J., Burdziak C., Moon K.R., Chaffer C.L., Pattabiraman D., et al. Recovering Gene Interactions from Single-Cell Data Using Data Diffusion. Cell. 2018;174:716–729.e27. doi: 10.1016/j.cell.2018.05.061. [DOI] [PMC free article] [PubMed] [Google Scholar]
- 43.Hänzelmann S., Castelo R., Guinney J. GSVA: gene set variation analysis for microarray and RNA-seq data. BMC Bioinformatics. 2013;14:7. doi: 10.1186/1471-2105-14-7. [DOI] [PMC free article] [PubMed] [Google Scholar]
Associated Data
This section collects any data citations, data availability statements, or supplementary materials included in this article.
Supplementary Materials
Data Availability Statement
Raw and processed RNA-seq data are available via GEO: GSE219255.