Abstract
Although chimeric antigen receptor (CAR) T cells have altered the treatment landscape for B cell malignancies, the risk of on-target, off-tumour toxicity has hampered their development for solid tumours because most target antigens are shared with normal cells1,2. Researchers have attempted to apply Boolean-logic gating to CAR T cells to prevent toxicity3–5; however, a truly safe and effective logic-gated CAR has remained elusive6. Here we describe an approach to CAR engineering in which we replace traditional CD3ζ domains with intracellular proximal T cell signalling molecules. We show that certain proximal signalling CARs, such as a ZAP-70 CAR, can activate T cells and eradicate tumours in vivo while bypassing upstream signalling proteins, including CD3ζ. The primary role of ZAP-70 is to phosphorylate LAT and SLP-76, which form a scaffold for signal propagation. We exploited the cooperative role of LAT and SLP-76 to engineer logic-gated intracellular network (LINK) CAR, a rapid and reversible Boolean-logic AND-gated CAR T cell platform that outperforms other systems in both efficacy and prevention of on-target, off-tumour toxicity. LINK CAR will expand the range of molecules that can be targeted with CAR T cells, and will enable these powerful therapeutic agents to be used for solid tumours and diverse diseases such as autoimmunity7 and fibrosis8. In addition, this work shows that the internal signalling machinery of cells can be repurposed into surface receptors, which could open new avenues for cellular engineering.
CAR T cells have revolutionized the treatment of B cell malignancies, but progress has been limited in using these cells to treat solid tumours1,2. Lineage-derived B-cell-restricted antigens such as CD19 can be safely targeted with CAR T cells because depletion of B cells is not life threatening. This is not the case for solid tumours, in which most overexpressed surface targets are also present on vital, normal tissues, creating the potential for on-target, off-tumour toxicity2. Thus, there is a dearth of antigens that can be safely targeted with CAR T cells for solid tumours9. As CARs are engineered to become even more potent and effective at recognizing low levels of antigen, the likelihood of on-target, off-tumour toxicity will further increase10,11. Thus, methods to apply Boolean logic to CAR T cells, endowing them with the ability to discriminate between normal and cancerous tissues, are essential to successfully target a large number of solid tumours.
Despite an intense focus on engineering more-effective receptors12,13, CARs that are used today are very similar to the first iterations generated 30 years ago14–16. Almost all CARs contain a CD3ζ endodomain, the master switch (so-called ‘Signal 1’) for initiating the T cell signalling cascade16,17. Iterations and improvements have focused on the addition of ‘Signal 2’ (costimulatory domains)18 and ‘Signal 3’ (cytokine receptors)19, or on endowing cells with an ability to resist a suppressive tumour microenvironment20 or T cell exhaustion21. Other than manipulating the number of immunoreceptor tyrosine-based activation motifs (ITAMs) contained in the CD3ζ chain10,22,23, few attempts have been made to alter Signal 1 in CAR constructs.
The reliance on CD3ζ (or other ITAM-containing molecules) in CAR constructs has hampered the ability to apply Boolean-logic gating to CAR T cells because ligation of the CAR alone triggers T cell activation. One method that has been used to overcome this limitation is splitting CD3ζ and costimulatory domains into CARs with different specificities so that maximal activity is only achieved when both targets are ligated (SPLIT CAR)3. However, CD3ζ-only constructs are capable of killing cells and have mediated on-target, off-tumour toxicity in clinical trials24,25. A more recently engineered system, SynNotch, uses a transcriptional circuit in which recognition of a first antigen drives expression of a traditional CD3ζ-based CAR with specificity for a second target antigen4. While elegantly designed, this system does not escape the potential for on-target, off-tumour toxicity of bystander normal tissue once the CD3ζ CAR is expressed because the gene circuit is not immediately reversed6.
Here, we asked whether CARs use the same basic cellular signalling circuitry as the native T cell receptor (TCR). Although we found that most proximal signalling molecules are necessary for CAR T cell activity, we also show that some molecules, such as ZAP-70 and PLCγ1, are sufficient themselves to initiate CAR T cell signalling, bypassing the need for CD3ζ. Motivated by this finding, we drew on an understanding of T cell signalling networks to engineer a true Boolean-logic AND-gated CAR T cell through the pairing of LAT and SLP-76. This is, to our knowledge, the first system that is capable of restricting CAR T cell activity to the encounter of two antigens in a direct, instantaneous and reversible manner.
CARs are dependent on TCR machinery
Although all clinically validated CAR constructs contain CD3ζ, the master switch of activity for the TCR16, it is unknown whether CARs depend on the same proximal signalling networks as have been defined for the native TCR26 (Extended Data Fig. 1a). We used CRISPR–Cas9 to individually knockout five proximal signalling molecules (LCK, FYN, ZAP-70, LAT and SLP-76) in primary human T cells expressing the CD19-4-1BBζ CAR contained in tisagenlecleucel (Fig. 1a–c and Extended Data Fig. 1b), and measured degranulation (CD107a) and cytokine production (IL-2, tumour necrosis factor (TNF) and interferon-γ (IFNγ)) in response to antigen encounter (Fig. 1d,e and Extended Data Fig. 1c). Whereas FYN was expendable for CAR T cell function, in line with its overlapping role with LCK27 and dispensability for T cell development28,29, knockout of LCK, ZAP-70, LAT or SLP-76 resulted in a near total ablation of CAR activity (Fig. 1b–e and Extended Data Fig. 1c). Similar results were observed for the CD19-CD28ζ CAR contained in axicabtagene ciloleucel, although the dependence on LCK, LAT or SLP-76 was somewhat reduced relative to CD19-4-1BBζ, possibly owing to an ability of CD28 to trigger PLCγ1 outside of the canonical TCR pathway30 (Extended Data Fig. 1d–h). Together, these data indicate that CARs largely rely on the same proximal signalling networks that have been previously described for the native TCR.
Fig. 1 |. Proximal signalling molecules are necessary to propagate CAR T cell activation.
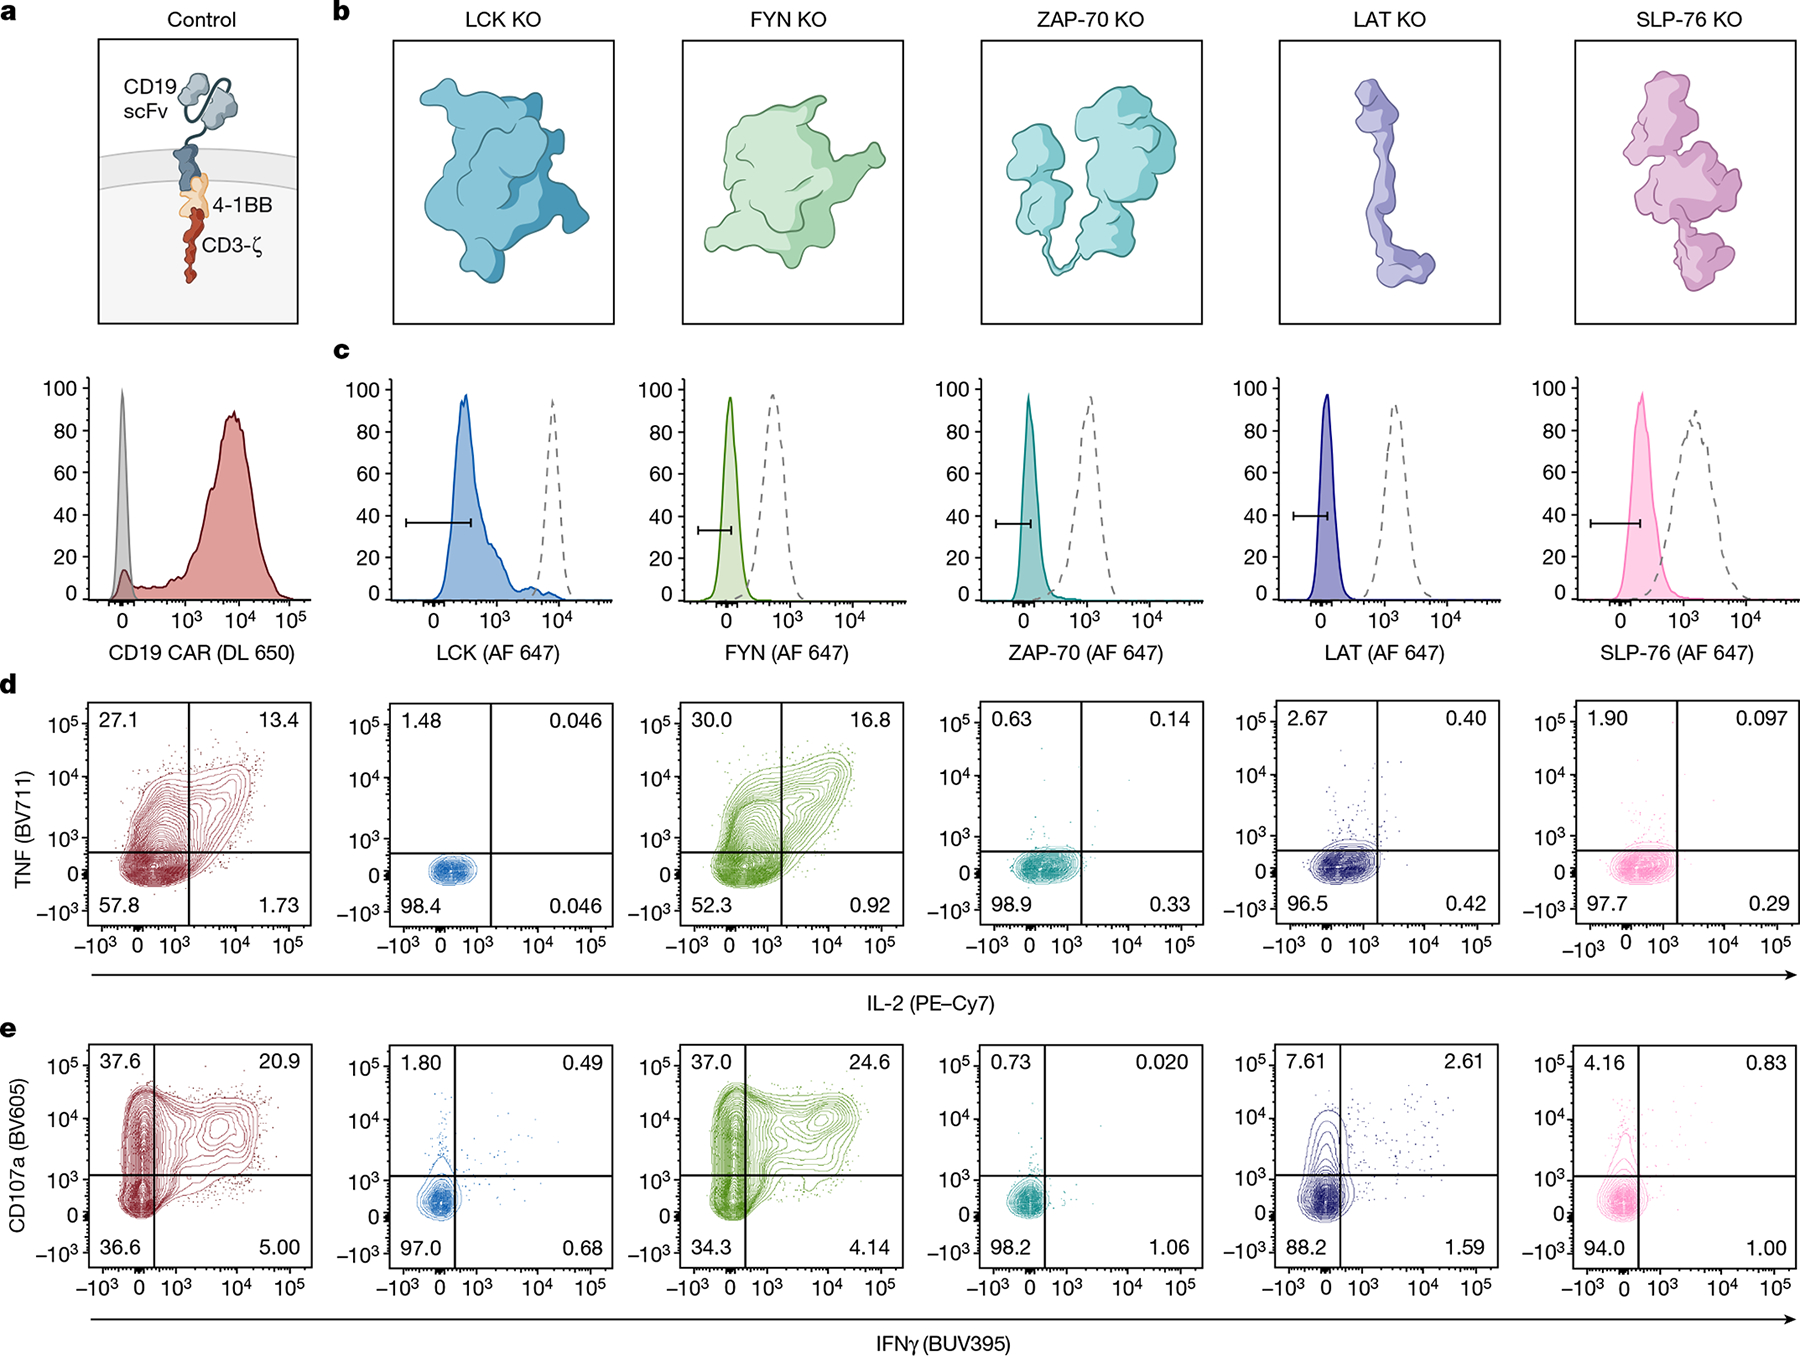
a, Schematic (top) and flow cytometric CAR expression (bottom) for unedited CD19-4-1BBζ CAR T cells. b, Schematics of the 5 proximal signalling molecules targeted for CRISPR–Cas9-mediated knockout (KO) in CD19-4-1BBζ CAR T cells. c, Flow cytometric plots showing knockout efficiencies for the proximal signalling molecules illustrated in b. Dashed peaks represent the protein expression levels in unedited control cells. d,e, After CRISPR–Cas9-mediated knockout of the proximal signalling molecules depicted in b, CD19-4-1BBζ CAR T cells were stimulated with Nalm6 tumour cells. Flow cytometric data are shown for TNF × IL-2 (d) and CD107a × IFNγ (e) in the knockout populations designated in c. Data in a–e are representative of three independent experiments performed with different blood donors.
Downstream molecules can replace CAR-CD3ζ
Having defined a set of proximal signalling molecules that are necessary for CAR T cell functionality, we next asked whether any proximal signalling molecules themselves might be sufficient to induce T cell effector functions. We expressed 6 proximal signalling molecules (LCK, FYN, ZAP-70, LAT, SLP-76 and PLCγ1) as CARs by tethering them to a transmembrane (TM) domain and a CD19-specific scFv (Fig. 2a). Apart from LAT, these signalling molecules are natively located in the cytoplasm and do not contain a TM domain, but did express as TM receptors when integrated into CARs (Fig. 2b). Expression of a ZAP-70 CAR was only possible when the molecule included the kinase domain and interdomain B (IDB)31, a linker contained in the native molecule, but not the SH2 domains (ZAP-70KIDB; Extended Data Fig. 1i–j). CD19 CARs bearing endodomains derived from ZAP-70 and PLCγ1 generated a robust IL-2 response after antigen encounter, whereas those that contained LCK, FYN, LAT or SLP-76 endodomains did not (Fig. 2c). We observed similar findings with CARs recognizing HER2, although the activity of the HER2-PLCγ1 CAR may have been limited owing to poor expression (Fig. 2d and Extended Data Fig. 1k). Thus, some proximal signalling molecules are sufficient to initiate and propagate T cell activity and can be redeployed in surface receptors.
Fig. 2 |. Proximal signalling molecules are sufficient to propagate CAR T cell activation.
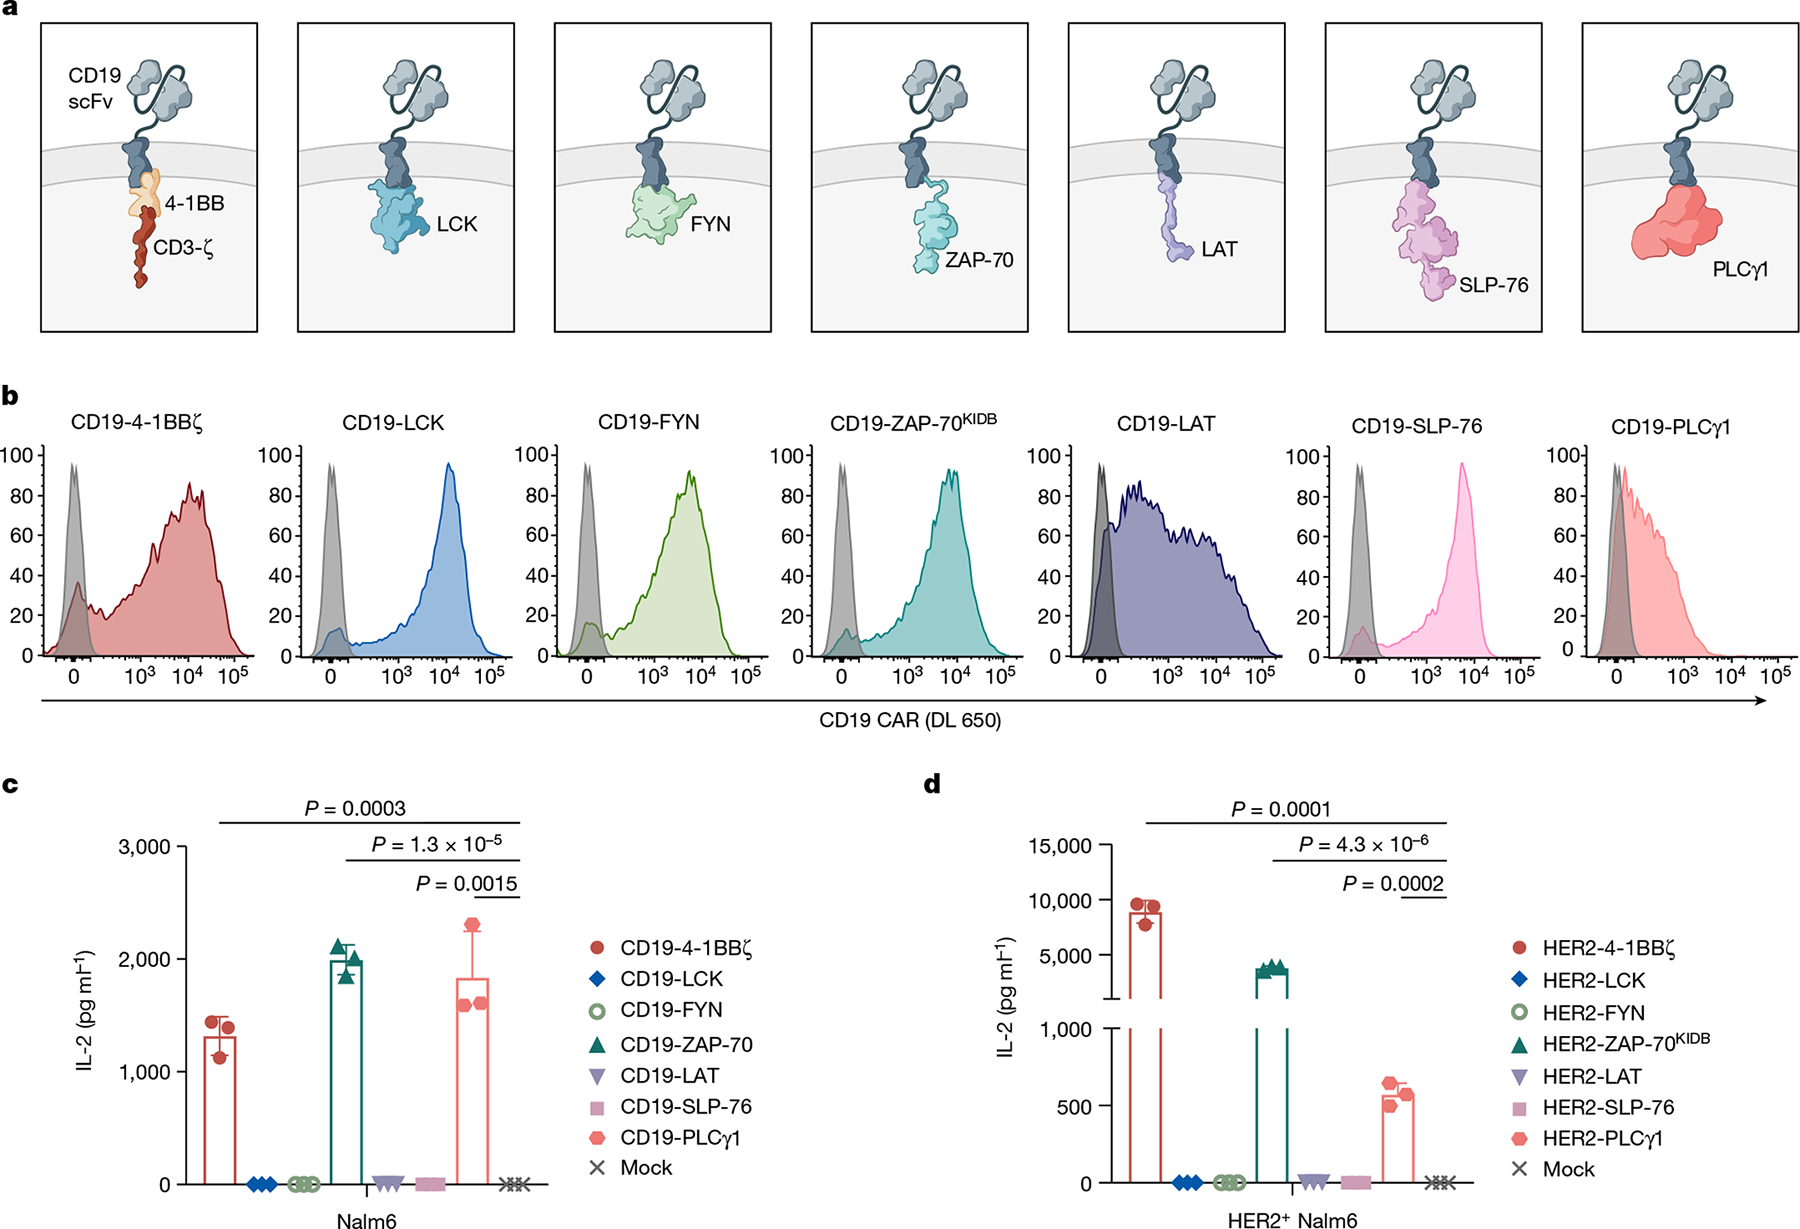
a–c, Schematics (a), CAR expression (b) and in vitro activity (c) of CD19-targeting CARs with proximal signalling endodomains. CARs incorporated full-length (LCK, FYN, SLP-76 and PLCγ1), intracellular (LAT), or truncated (ZAP-70KIDB; see Extended Data Fig. 1i–j) domains. In vitro activity was assessed by measurement of IL-2 by enzyme-linked immunosorbent assay (ELISA) in the supernatant after co-culturing CAR T cells with CD19+ tumour cells (Nalm6). Data are mean ± s.d of three experimental replicates. Representative of three independent experiments performed with different blood donors. P values were determined by unpaired t-test (two-tailed). d, IL-2 secretion (as measured by ELISA) by HER2-targeting proximal signalling CARs after co-culture with HER2+ Nalm6 tumour cells. Mean ± s.d. of three experimental replicates. Representative of four independent experiments with different blood donors. P values were determined by unpaired t-test (two-tailed).
ZAP-70 CARs mediate robust activity in vivo
To investigate the utility of proximal signalling molecule CARs, we generated ZAP-70 CARs that recognize CD19, HER2, GD2 and B7-H3. We found that the expression of canonical T cell exhaustion markers on ZAP-70 CAR T cells was significantly reduced when scFvs that drive antigen-independent tonic signalling, such as GD2 and B7-H3, were used32,33 (Fig. 3a,b and Extended Data Fig. 2a). Consistent with this result, GD2-ZAP-70 T cells exhibited a significant decrease in antigen-independent production of IFNγ (Extended Data Fig. 2b).
Fig. 3 |. ZAP-70 CARs bypass upstream signalling elements and can exhibit enhanced anti-tumour activity.
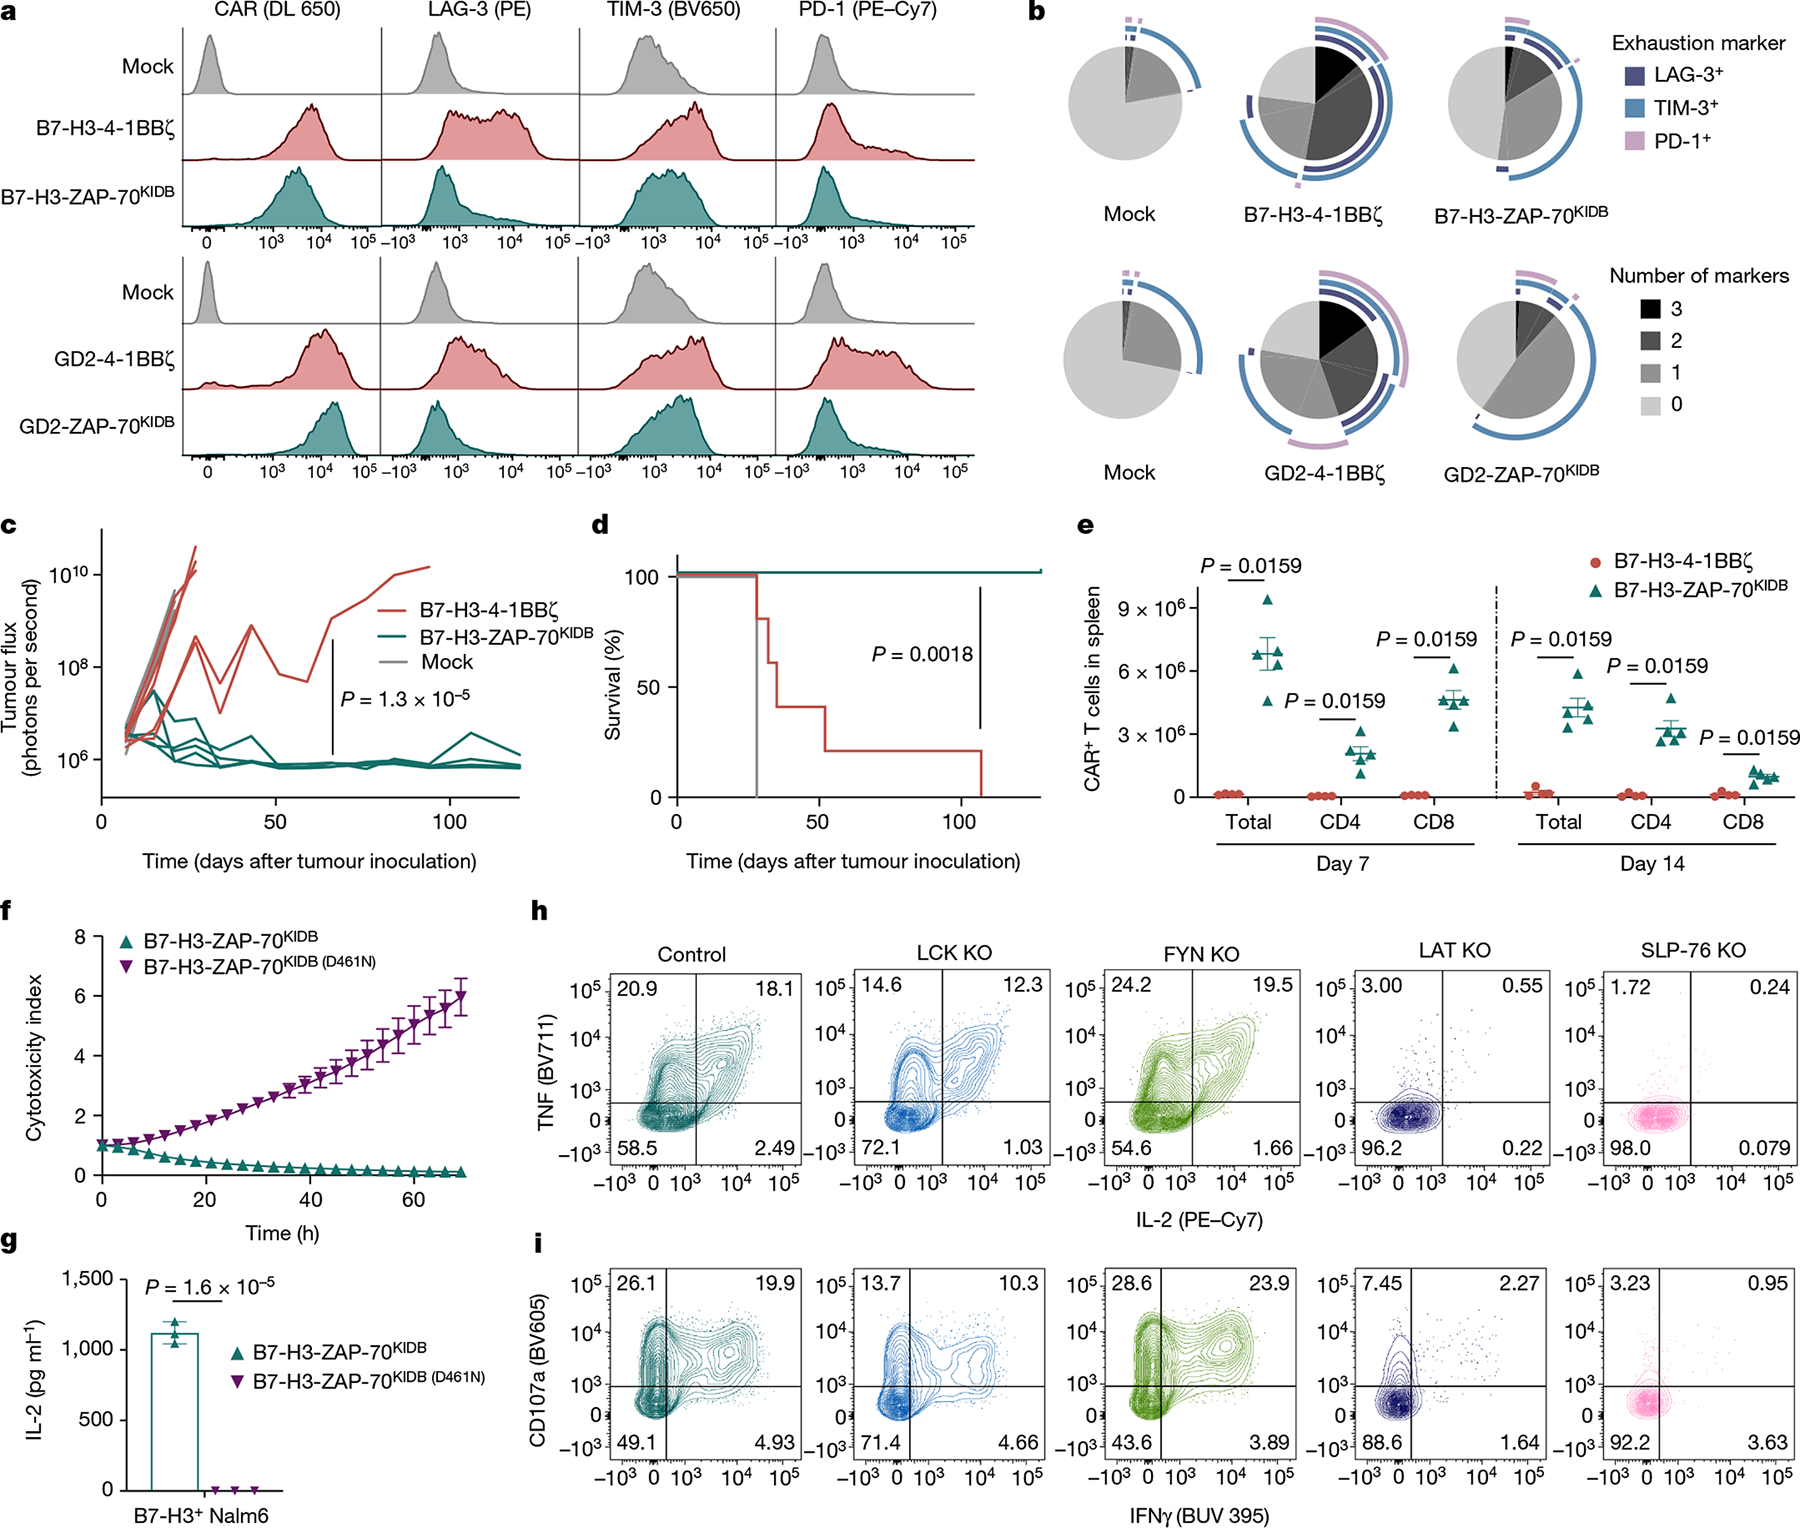
a, Representative flow cytometric plots of CAR, LAG-3, TIM-3 and PD-1 expression for T cells bearing B7-H3 or GD2-specific CARs containing 4-1BBζ or ZAP-70KIDB endodomains (day 10 after T cell activation). b, SPICE (Simplified Presentation of Incredibly Complex Evaluations) analysis plots from data shown in a. c,d, NSG mice bearing CHLA-255-luciferase xenografts were treated intravenously on day 7 after tumour inoculation with 3 × 10⁶ B7-H3-4-1BBζ or B7-H3-ZAP-70KIDB CAR T cells. c, Quantification of tumour progression for each individual mouse as measured by flux values acquired by bioluminescence imaging (BLI). d, Survival curves for mice bearing tumours shown in c. Performed with n = 5 mice per group. e, Absolute number of CAR T cells recovered from the spleens of CHLA-255-bearing mice on days 7 and 14 after treatment with 1 × 10⁷ B7-H3-4-1BBζ or B7-H3-ZAP-70KIDB CAR T cells on day 7 after tumour inoculation. Mean ± s.e.m. for n = 5 mice (B7-H3-ZAP-70KIDB) or n = 4 mice (B7-H3-4-1BBζ) per group per time point. Experiment was performed once at two time points. f, Tumour cell killing of B7-H3+ Nalm6 cells co-cultured with B7-H3-ZAP-70KIDB (with or without the D461N mutation) CAR T cells at a 1:1 effector to target (E:T) ratio. g, IL-2 secretion by B7-H3-ZAP-70KIDB (with or without the D461N mutation) CAR T cells after co-culture with B7-H3+ Nalm6 cells. h,i, After CRISPR–Cas9-mediated knockout of the indicated proximal signalling molecules, B7-H3-ZAP-70KIDB CAR T cells were stimulated with B7-H3+ Nalm6 tumour cells. Flow cytometric data are shown for TNF × IL-2 (h) and CD107a × IFNγ (i) in the knockout populations designated in Extended Data Fig. 5e. Data in h,i are representative of three experiments performed with two different blood donors. Unless otherwise noted, data are mean ± s.d. of three experimental replicates and representative of three experiments with different blood donors. Statistical comparisons were performed using repeated-measures one-way ANOVA (c), log-rank test (d), Mann–Whitney test (two-tailed) (e) or unpaired t-test (two-tailed) (g).
Although in vitro IL-2 production and tumour cell killing did not meaningfully differ between ZAP-70- and CD3ζ-based GD2 or B7-H3 CARs (Extended Data Fig. 2c,d), B7-H3-ZAP-70 CARs eradicated tumours in a xenograft model of metastatic neuroblastoma in which B7-H3-4-1BBζ CARs were capable of only transient tumour control (Fig. 3c,d). This enhanced anti-tumour activity was accompanied by substantially increased expansion and persistence of ZAP-70 CAR T cells (Fig. 3e and Extended Data Fig. 2e,f). Mice that were treated with B7-H3-ZAP-70 CARs were protected from tumour rechallenge in an antigen-specific manner, providing evidence that ZAP-70 CAR T cells have the capacity for memory formation (Extended Data Fig. 2g,h).
Other receptor architectures have also been shown to increase the efficacy of CAR T cells. We compared the B7-H3-ZAP-70 CAR to a conventional CAR with a CD28 costimulatory domain (shown to enhance potency34) as well as both first- and second-generation CARs with only one active ITAM domain in the ζ chain (shown to calibrate activation levels to balance effector function and memory formation23) (Extended Data Fig. 2i). In an aggressive orthotopic xenograft model of osteosarcoma, B7-H3-ZAP-70 outperformed these alternative architectures, suggesting that the construct provides a distinct advantage (Extended Data Fig. 2j).
To better characterize the improved functionality of ZAP-70 CARs, we compared B7-H3-ZAP-70 and B7-H3-4-1BBζ CARs by single-cell RNA sequencing (scRNA-seq) at baseline and 6 hours after tumour challenge. Before stimulation, ZAP-70 CAR T cells showed a distinct profile characterized by reduced exhaustion-associated gene expression and enhanced memory-associated gene expression compared to B7-H3-4-1BBζ, which is consistent with the notion that ZAP-70 CARs exhibit less tonic signalling (Extended Data Fig. 3a–e). After tumour challenge, both CARs induced T cell effector transcriptional programs, but the expression of certain effector genes (PRDM1, TBX21 and GZMB) was higher in the ZAP-70 CAR (Extended Data Fig. 3a,f). We also compared the phosphorylation of key proximal (PLCγ1 and SLP-76), distal (AKT and ERK) and nuclear (NF-κB and JUN) signalling proteins. GD2-ZAP-70 CAR T cells exhibited a substantially reduced baseline phosphorylation of signalling proteins compared to either GD2-4-1BBζ or GD2-CD28ζ CARs, but similar levels of phosphorylation after stimulation to either GD2 CAR or the clinically validated CD19-4-1BBζ CAR (Extended Data Fig. 4a,b). These data show that proximal-signalling-based CARs are capable of mediating robust anti-tumour activity in vivo and may be advantageous when used with scFvs that cause a high degree of tonic signalling.
ZAP-70 CARs bypass upstream CD3ζ and LCK
We then asked whether the activity of the ZAP-70 CAR is dependent on CD3ζ or other ITAMs found in the native TCR. CRISPR–Cas9-mediated knockout of either CD3ζ (CD247) or the TRAC locus in ZAP-70 CAR T cells did not reduce IL-2 production when challenged with tumour cells (Extended Data Fig. 5a,b), indicating that TCR ITAM domains are not required to initiate ZAP-70 CAR T cell signalling. To understand the mechanism by which the ZAP-70 CAR propagates T cell signalling, we introduced a mutation that interrupts its kinase activity35 (D461N), and found that this abrogated both tumour cell killing and IL-2 production (Fig. 3f,g and Extended Data Fig. 5c). Furthermore, knockout of the downstream targets of ZAP-70, LAT or SLP-76, also abrogated most ZAP-70 CAR T cell activity, whereas knockout of the upstream molecules LCK or FYN did not (Fig. 3h,i and Extended Data Fig. 5d–f). Thus, ZAP-70 CARs rely on the activity of their kinase domain on downstream molecules and, unlike CD3ζ-based CARs, can activate independently of members of the SRC kinase family.
Pairing LAT and SLP-76 enables AND gating
Endogenous ZAP-70 is known to phosphorylate LAT and SLP-76, which then form a scaffold for PLCγ1 and other signalling molecules to propagate downstream effector functions36 (Extended Data Fig. 1a). Given that both ZAP-70 and PLCγ1 CARs are sufficient to promote T cell activation, and that the ZAP-70 CAR is dependent on the presence of LAT and SLP-76, we hypothesized that we could similarly initiate T cell activity by clustering LAT and SLP-76 CARs to form a synthetic scaffold (Fig. 4a). Although T cells expressing either a CD19-LAT CAR or a HER2-SLP-76 CAR did not produce IL-2 in response to antigen encounter, T cells that were co-transduced with both CARs robustly responded to dual antigen encounter (Fig. 4b). This stood in contrast to all other combinations of other inactive proximal signalling CARs (LCK, FYN, SLP-76 and LAT), none of which responded to dual antigen encounter (Extended Data Fig. 6a,b).
Fig. 4 |. LAT and SLP-76 CARs bypass upstream signalling elements to function together as a Boolean-logic AND gate.
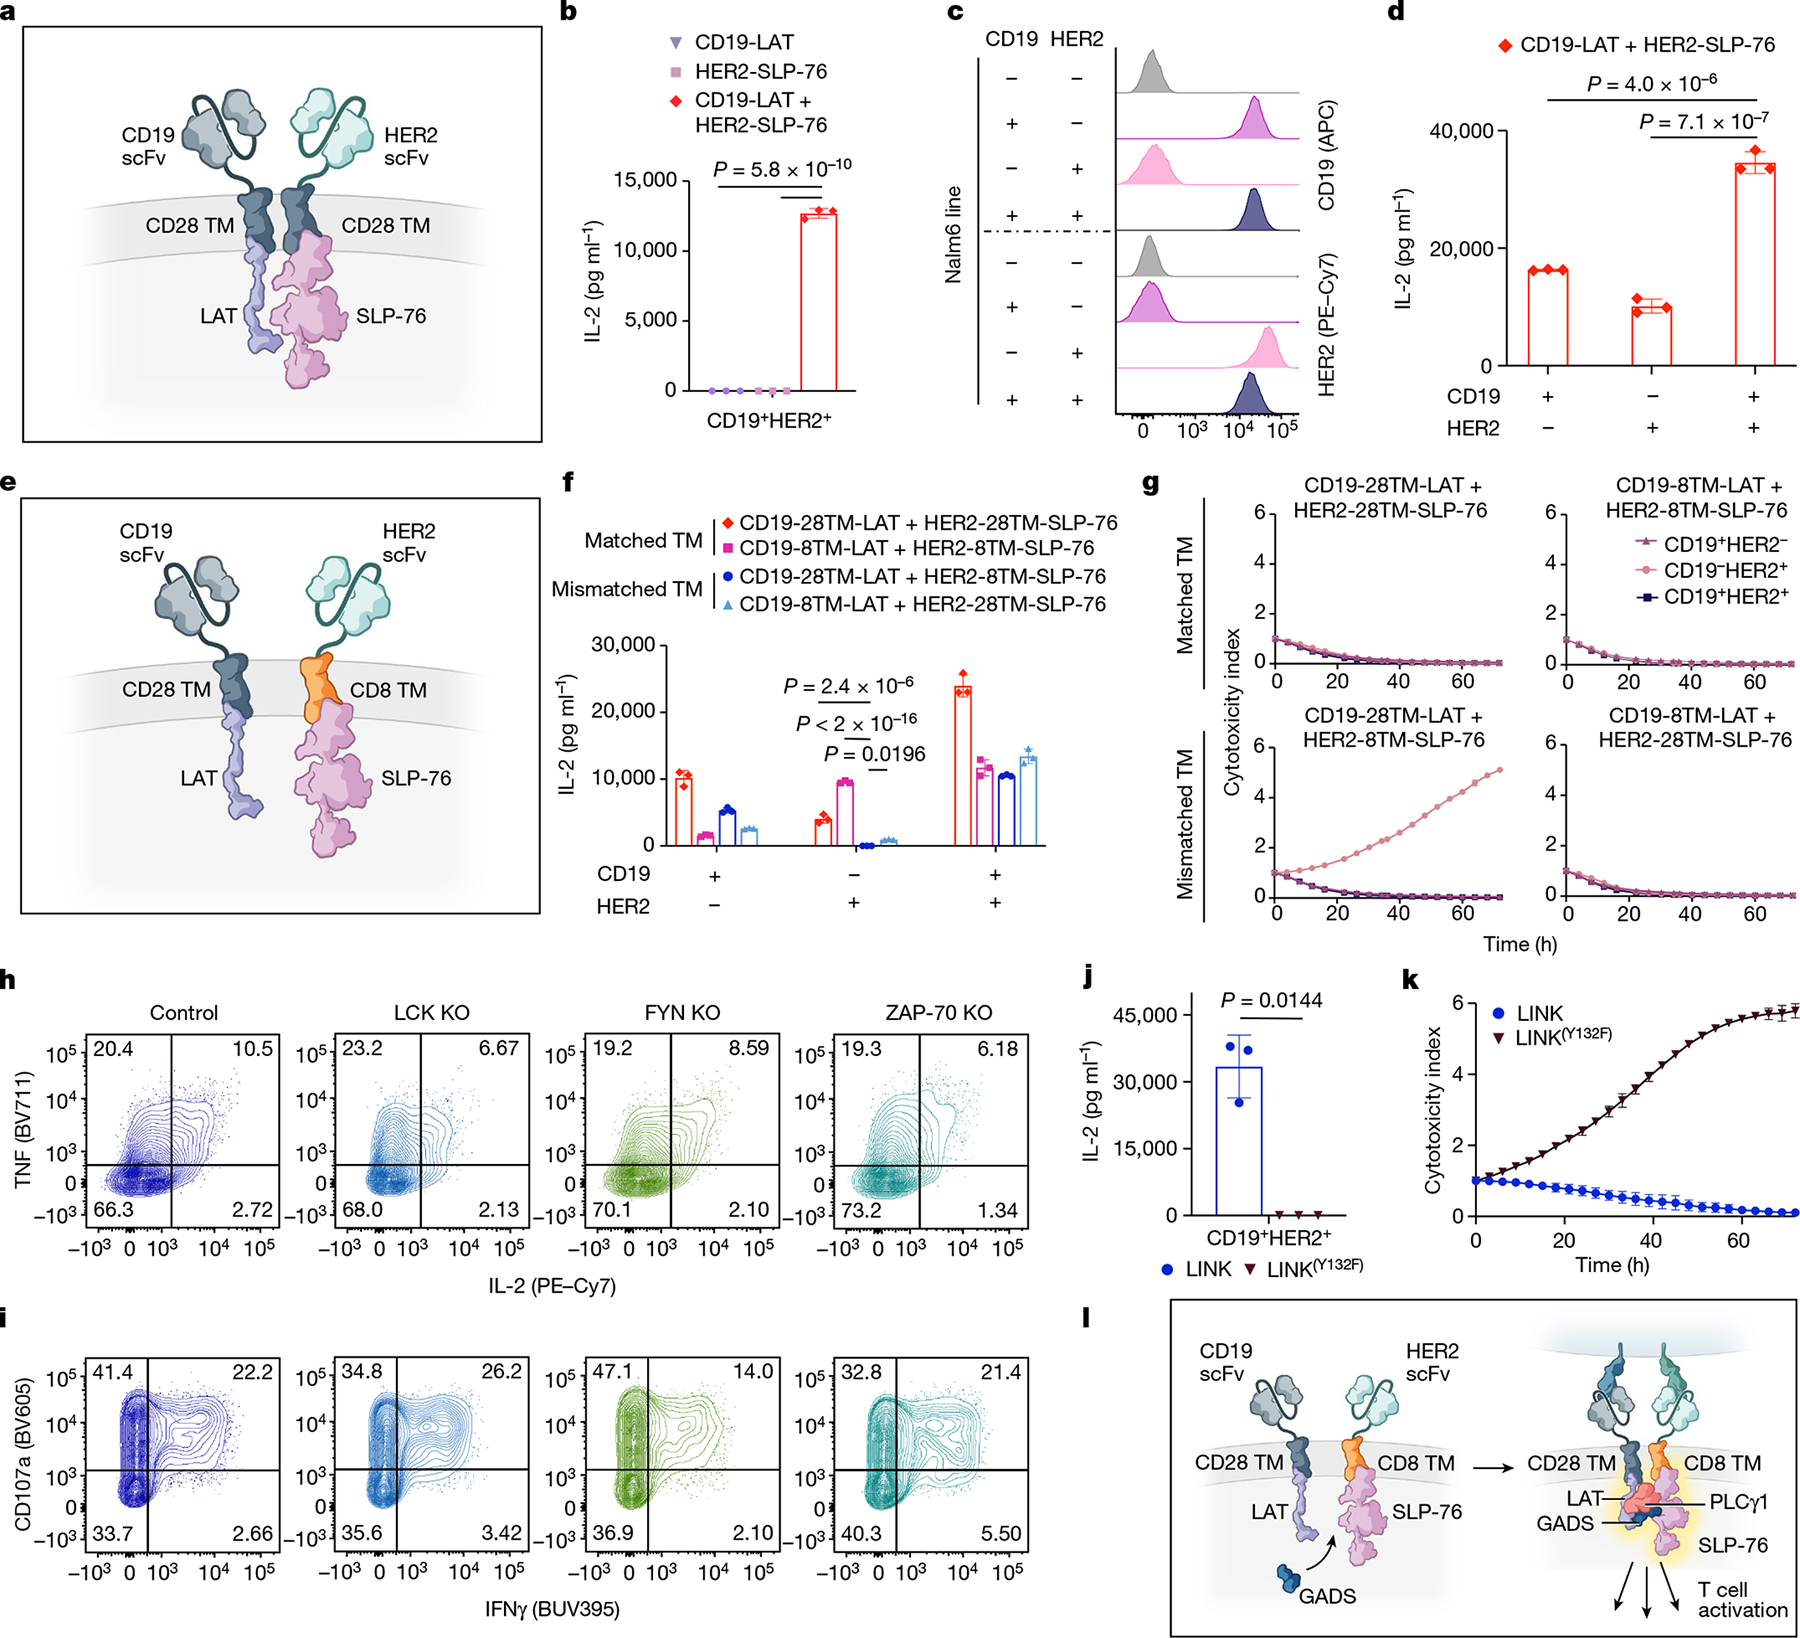
a, Schematic of LAT and SLP-76 CARs co-expressed on one T cell. b, Secretion of IL-2 by CD19-LAT, HER2-SLP-76 or CD19-LAT + HER2-SLP-76 CAR T cells after co-culture with CD19+HER2+ Nalm6 cells (CD19+HER2+). Representative of eight independent experiments. c, Flow cytometry plots of CD19 and HER2 expression on engineered Nalm6 lines. d, IL-2 secretion by CD19-LAT + HER2-SLP-76 CAR T cells after co-culture with cells from c. Representative of eight independent experiments. e, Schematic of LAT and SLP-76 CARs with mismatched hinge–TM domains co-expressed on one T cell. f, Secretion of IL-2 by CD19-LAT + HER2-SLP-76 CAR T cells with the indicated TM regions after co-culture with cells from c. Representative of three independent experiments. g, Killing of cell lines shown in c co-cultured with CD19-LAT + HER2-SLP-76 CAR T cells with the indicated TM regions at a 1:1 E:T ratio. Representative of three independent experiments. h,i, After CRISPR–Cas9-mediated knockout of the indicated proximal signalling molecules, LINK (CD19-28TM-LAT + HER2-8TM-SLP-76) CAR T cells were stimulated with CD19+HER2+ Nalm6. Flow cytometric data are shown for TNF × IL-2 (h) and CD107a × IFNγ (i) in the knockout populations designated in Extended Data Fig. 6i. Data in h,i are representative of two independent experiments. j, Secretion of IL-2 by CD19-28TM-LAT + HER2-8TM-SLP-76 (±LAT(Y132F) mutation) CAR T cells after co-culture with CD19+HER2+ Nalm6. Representative of four independent experiments. k, Killing of CD19+HER2+ Nalm6 cells co-cultured with CD19-28TM-LAT + HER2-8TM-SLP-76 (± LAT(Y132F) mutation) CAR T cells at a 1:1 E:T ratio. Representative of four independent experiments. l, Schematic of the potential mechanism of LINK CAR activity. Unless otherwise noted, data are mean ± s.d. of three experimental replicates. Statistical comparisons were performed using one-way ANOVA with correction for multiple comparisons (b,d,f) and unpaired t-test (two-tailed) (j). All replicates used different blood donors.
Given their ability to respond to dual-antigen-expressing cells, paired LAT and SLP-76 CARs appeared to have the potential for Boolean-logic AND gating, in which the activity of CAR T cells depends on the encounter of two distinct antigens, increasing their potential specificity. However, although T cells that were co-transduced with CD19-LAT and HER2-SLP-76 CARs responded to dual antigen encounter, they also showed some degree of ‘leakiness,’ responding also to tumour cells that expressed only one antigen (CD19 or HER2) (Fig. 4c,d). Leakiness increases the risk of toxicity, owing to the recognition of normal tissue expressing only one of the target antigens.
As both the LAT and the SLP-76 component CARs contained a CD28 hinge–TM domain, we hypothesized that these might homodimerize, bringing both CARs to the immune synapse even when only one is engaged. Alternating the TM domains between the constructs (CD28 and CD8; Fig. 4e and Extended Data Fig. 6c) reduced some of the single-antigen activity, especially when T cells encountered HER2, the cognate antigen for the SLP-76 CAR (Fig. 4f). The most promising combination (CD19-28TM-LAT + HER2-8TM-SLP-76) did not kill tumour cells that expressed only HER2, but maintained some leaky activity, killing tumour cells that expressed only CD19 (Fig. 4g). We termed this combination logic-gated intracellular network (LINK) CAR and undertook further engineering to enhance its specificity. To reduce potential hetero- and homodimerization, we mutated the cysteine residues in the CD28 TM domain on the LAT CAR (2CA; Extended Data Fig. 6d,e), which resulted in a further reduction in single-antigen leakiness, but did not prevent the killing of tumour cells expressing only CD19 (Extended Data Fig. 6f,g).
Targeted mutations ensure specificity
Given the persistent leakiness in the LINK platform, we undertook mechanistic studies to help guide our engineering approach. Knockout of ZAP-70, LCK or FYN did not substantially abrogate T cell activity, indicating that LINK CARs bypass the upstream members of the proximal signalling cascade (Fig. 4h,i and Extended Data Fig. 6h–j). Furthermore, mutation of the tyrosine residue in LAT that is required for the recruitment of PLCγ1 (Y132F)37,38 abrogated the activity of LINK CAR T cells (Fig. 4j,k and Extended Data Fig. 6k), showing that downstream recruitment of PLCγ1 is essential for its function.
In native T cells, LAT and SLP-76 do not interact directly, but through adaptor molecules from the GRB2 family, such as GADS38,39. We hypothesized that the LAT and SLP-76 CARs come together through association with GADS (or other members of the GRB2 family) to form a scaffold for PLCγ1 (Fig. 4l), and that this association may also occur in the absence of dual antigen ligation, causing leakiness. Therefore, we deleted the GADS-binding sites in both the LAT (del171-233)38 and SLP-76 (del224-244)40 CARs (Fig. 5a). When combined with the CD28 hinge–TM 2CA mutation detailed above (Extended Data Fig. 7a,b), these targeted deletions resulted in a true AND-gate system, in which cytokine production (Fig. 5b) and tumour cell killing (Fig. 5c), as well as T cell degranulation and activation (Fig. 5d and Extended Data Fig. 7c), were largely eliminated except in response to dual antigen encounter. Targeted mutations of the tyrosine residues in LAT that interrupt its interaction with GADS (Y171F/Y191F)38,41 had a similar effect to the GADS truncations (Extended Data Fig. 7d,e), further verifying the importance of the LAT–GADS interaction for effective engineering of the LINK CAR. The LINK system also maintains its efficacy when both components target the same antigen (CD19; Extended Data Fig. 7f).
Fig. 5 |. Targeted mutations establish LINK CAR specificity.
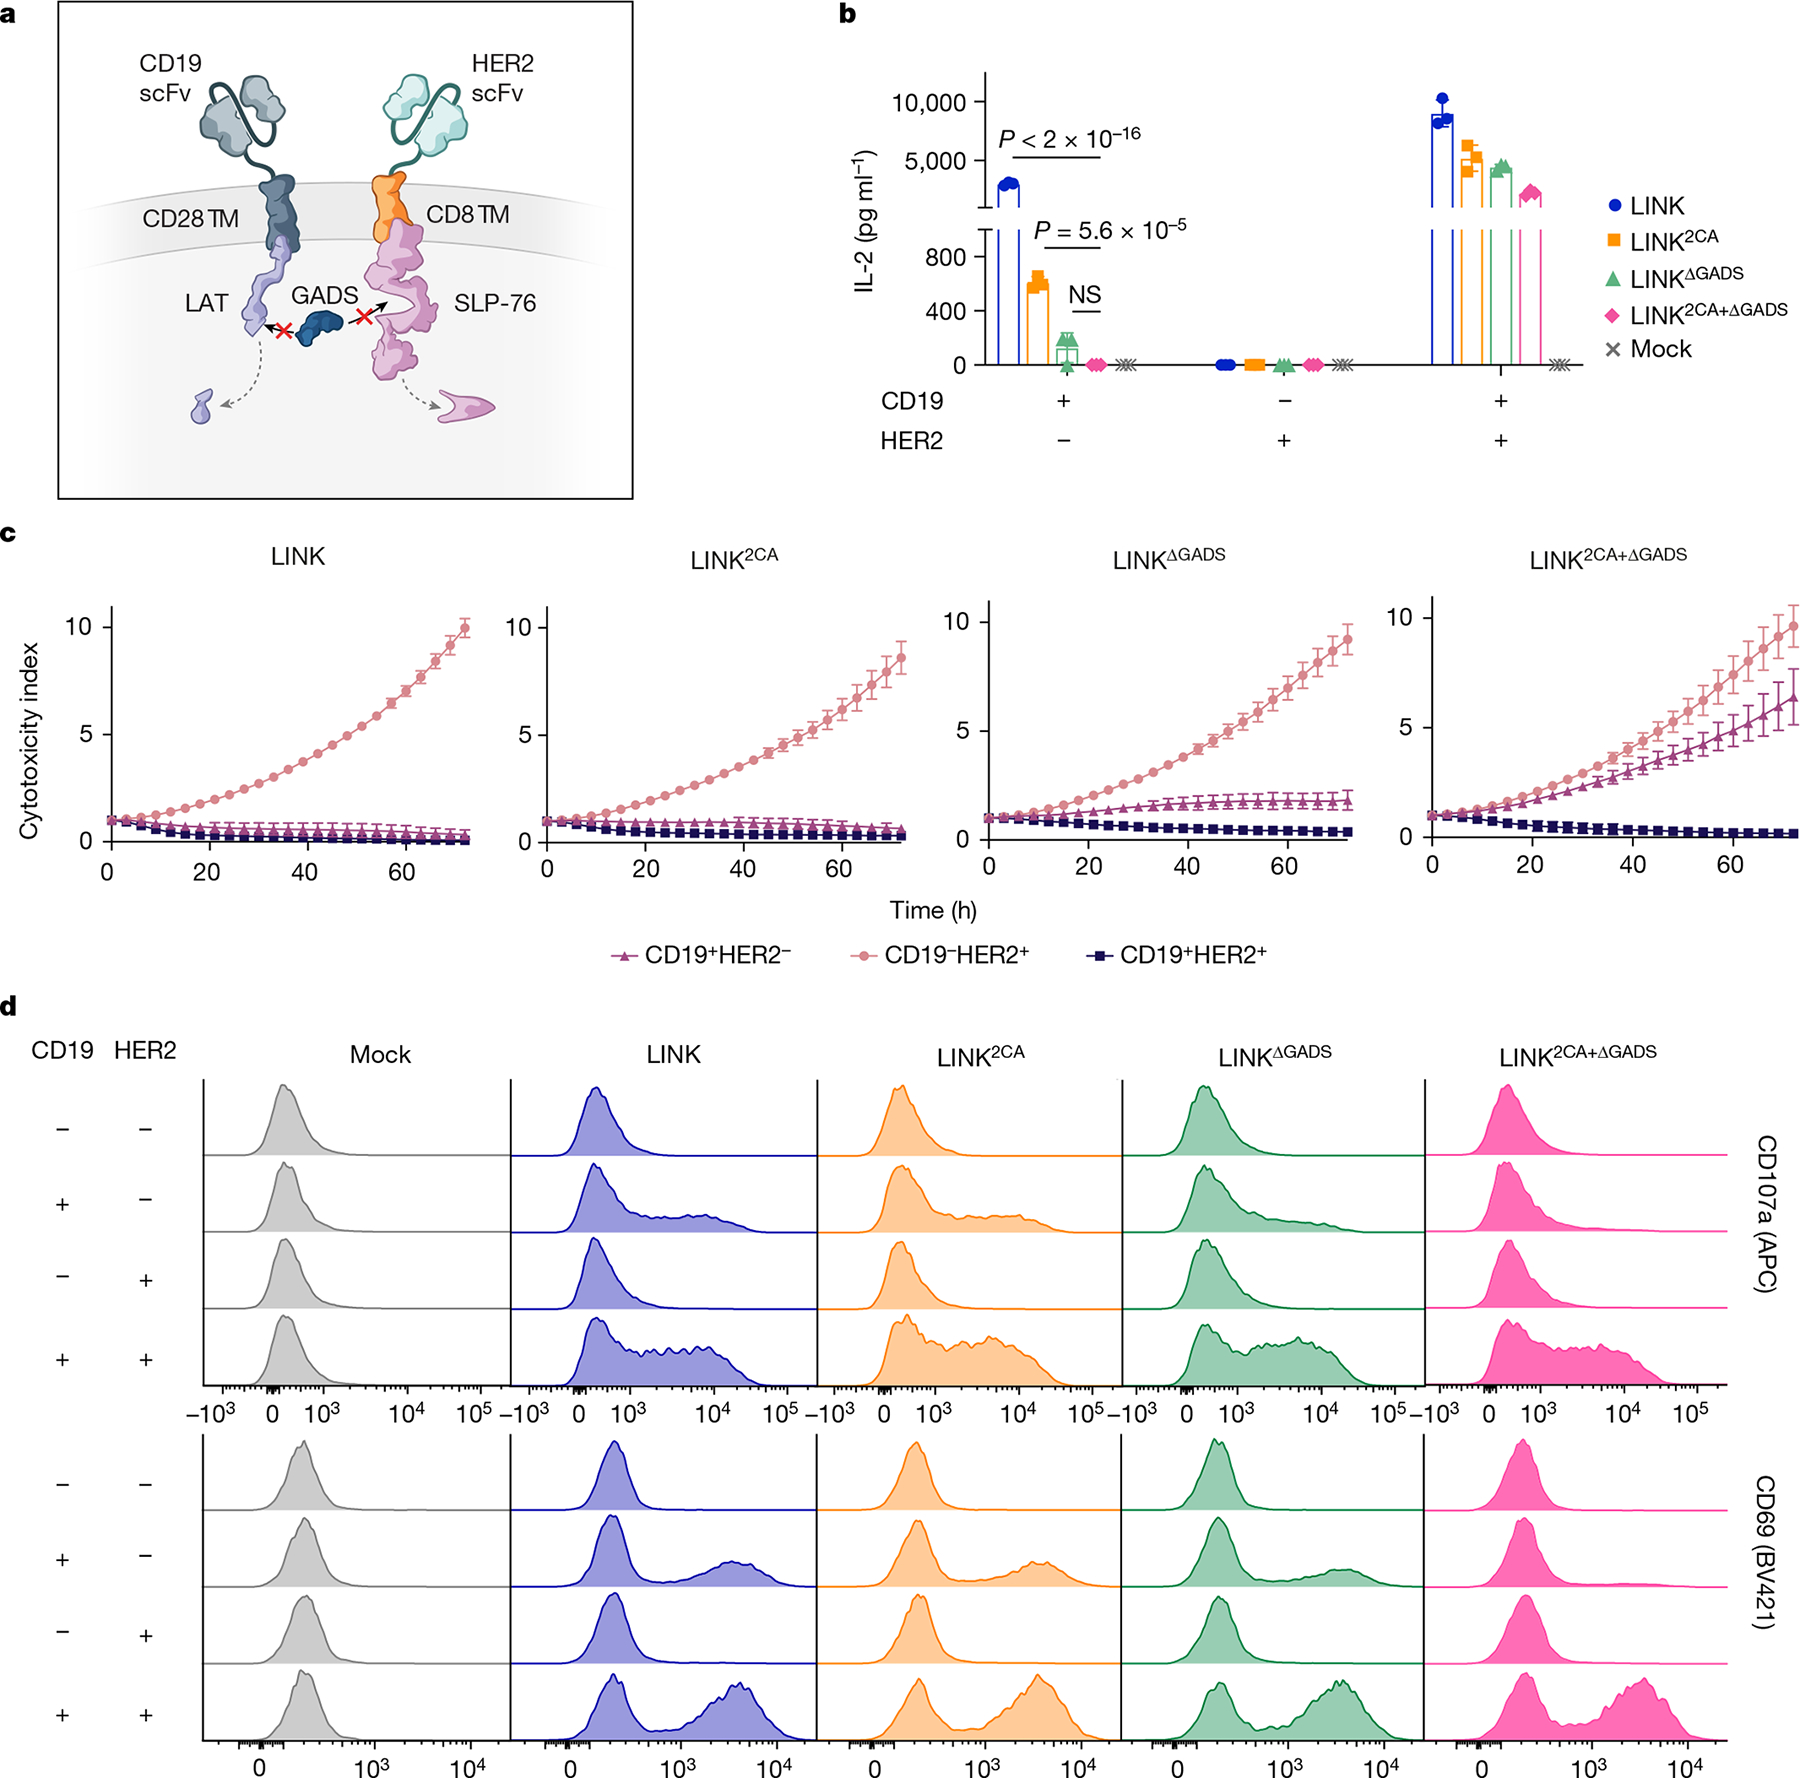
a, Schematic of the deletion of the GADS-binding regions in LAT and SLP-76 CAR endodomains. b–d, IL-2 secretion (b), tumour cell killing (1:1 E:T) (c) and flow cytometric plots of T cell degranulation (CD107a, top) and activation (CD69, bottom) (d) for the indicated LINK CAR T cells after co-culture with the cell lines shown in Fig. 4c. Data in b,c are mean b1x s.d. of three experimental replicates. Data in b–d are representative of five independent experiments with four blood donors. Statistical comparisons were performed using one-way ANOVA with correction for multiple comparisons. NS, not significant.
LINK CAR prevents on-target, off-tumour toxicity
To test the in vivo efficacy and specificity of the LINK CAR, we used a model of on-target, off-tumour toxicity mediated by a ROR1-specific CAR that recognizes both human and mouse ROR1 with a similar affinity6,42. On-target, off-tumour recognition of ROR1 expressed on mouse lung tissues by CAR T cells causes toxicity, manifested by rapid weight loss and death42 (Extended Data Fig. 8a–c).
Using isogenic cell lines (Extended Data Fig. 8d), we confirmed the in vitro activity and dual antigen specificity of ROR1-and-CD19-targeted LINK CARs (Extended Data Fig. 8e,f), then proceeded to test multiple LINK CAR iterations in vivo. Mice bearing ROR1+CD19+ Nalm6 xenografts were inoculated with ROR1-and-CD19-targeted CAR T cells. Because we observed greater leakiness from the LAT CAR components in early LINK CAR iterations, we first tested LINK CARs with specificity for ROR1 on LAT and CD19 on SLP-76. Similar to the conventional ROR1-CD28ζ CAR, the ROR1-CD28TM-LAT + CD19-CD8TM-SLP-76 CAR (LINK) mediated on-target toxicity, as evidenced by rapid weight loss and death. Mice that received ROR1-CD28TM2CA-LAT + CD19-CD8TM-SLP-76 CAR (LINK2CA) survived for longer, but toxicity manifested after several weeks. However, LINK CARs in which the GADS interaction sites were deleted (either ROR1-CD28TM-LATΔGADS + CD19-CD8TM-SLP-76ΔGADS (LINKΔGADS) or ROR1-CD28TM2CA-LATΔGADS + CD19-CD8TM-SLP-76ΔGADS (LINK2CA+ΔGADS)) mediated complete tumour cell clearance without any evidence of on-target, off-tumour toxicity (Fig. 6a–c). The LINK system maintained its anti-tumour activity even at lower doses of CAR T cells, with a comparable efficacy to conventional CD28ζ and 4-1BBζ CD19 CARs (Extended Data Fig. 8g,h). Similar to the ZAP-70 CAR, the LINK CAR system showed enhanced persistence after treatment compared to conventional CARs, outperforming even the CD19-4-1BBζ CAR that is well known for persistence in the clinic43 (Extended Data Fig. 8i). T cell memory and differentiation state as assessed by surface expression of CD62L and CD45RA did not significantly differ between LINK and conventional CAR T cells (Extended Data Fig. 8j–k).
Fig. 6 |. LINK CAR mediates tumour eradication while preventing on-target, off-tumour toxicity.
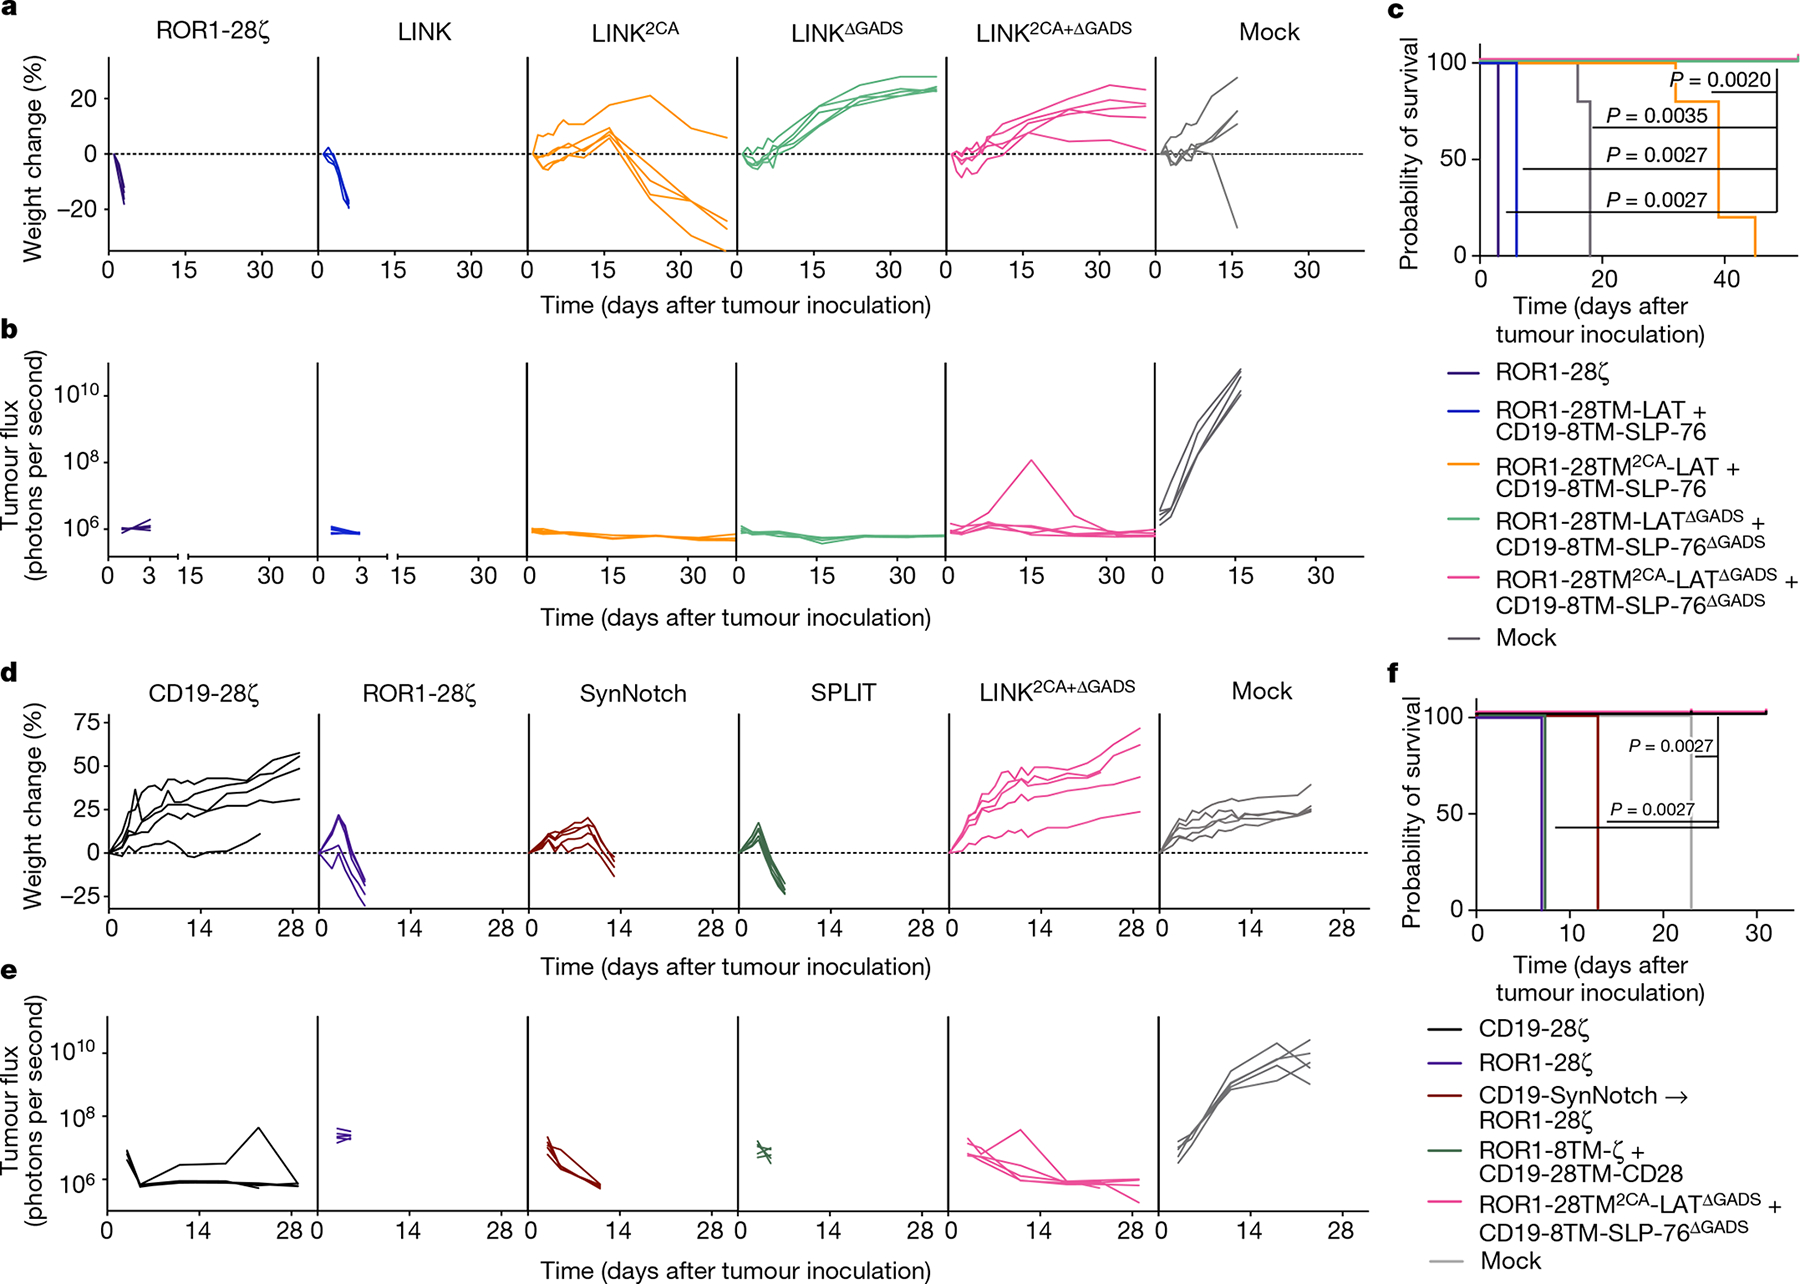
a–c, NSG mice bearing ROR1+CD19+Nalm6-luciferase were treated with 6 × 10⁶ of the indicated CAR+ T cells on day 1 after tumour engraftment. a, Weight of individual mice over time plotted as a percentage of the weight on day 0. b, Quantification of tumour progression for each individual mouse as measured by flux values acquired with BLI. c, Survival curves for mice bearing tumours shown in a,b. Data in a–c are representative of three independent experiments with two different donors; n = 5 mice per group per experiment. In one of three experiments, the LINK2CA mice did not lose enough weight to meet the criteria for euthanasia. d–f, NSG mice bearing ROR1+CD19+Nalm6-luciferase were treated with 8 × 10⁶ of the indicated CAR+ T cells and logic-gated CAR T cell systems (including SPLIT (ROR1-8TM-ζ + CD19-28TM-CD28) and SynNotch (CD19-SynNotch → ROR1-CD28ζ)) on day 3 after tumour engraftment. d, Weight of individual mice over time plotted as a percentage of the weight on day 0. e, Quantification of tumour progression for each individual mouse as measured by flux values acquired with BLI. f, Survival curves for mice bearing tumours shown in d,e. The experiment in d–f was performed once with n = 5 mice per group and was repeated with another donor with all groups except CD19-CD28ζ (Extended Data Fig. 10e–g). Statistical comparisons were performed using log-rank test (c,f).
We reversed the orientations of the CARs (now with ROR1 specificity on SLP-76 and CD19 on LAT) and found that even in this orientation, preventing ROR1-mediated toxicity required the use of an optimized LINK CAR (CD19-CD28TM2CA-LATΔGADS + ROR1-CD8TM-SLP-76ΔGADS; Extended Data Fig. 9a–d). To demonstrate that the LINK system can simultaneously protect distinct normal tissues that express individual target antigens, we tested ROR1-CD28TM2CA-LATΔGADS + CD19-CD8TM-SLP-76ΔGADS (LINK2CA+ΔGADS) after engrafting normal B cells from the same human blood donor in NSG mice. ROR1-CD28ζ CAR T cells caused the death of mice due to on-target, off-tumour toxicity, whereas CD19-CD28ζ CAR T cells mediated the elimination of both malignant and normal B cells. By contrast, LINK-treated mice were cured of their disease and maintained B cell engraftment without evidence of toxicity (Extended Data Fig. 9e–h).
LINK outperforms other logic-gated CARs
There have been several previous attempts in the literature to generate AND-gate CAR T cells. These include a ‘SPLIT’ CAR system, in which the CD3ζ and costimulatory domains are split into CARs with different specificities3, as well as gene circuits such as the SynNotch system4. In the SynNotch system, in response to encounter of a first antigen (antigen A), a synthetic Notch receptor releases a transcription factor that then drives the expression of a traditional cytolytic CAR with specificity for a second antigen (antigen B). Thus, SynNotch cells are primed by antigen A to recognize and kill cells that express antigen B. Although this system is designed to program transcriptional responses in T cells, it is not a true AND gate because cells that are primed by antigen A can then attack any tissue expressing antigen B (Extended Data Fig. 10a). Previous work has shown that SynNotch does not prevent on-target, off-tumour toxicity in mouse models6.
We compared our LINK CAR to both SynNotch (CD19-SynNotch → ROR1-CD28ζ) and SPLIT (ROR1-CD8TM-ζ + CD19-CD28TM-CD28) CARs (Extended Data Fig. 10b) in the same toxicity model. We confirmed that the SynNotch system was appropriately primed by encounter of CD19 to express the ROR1-CD28ζ CAR (Extended Data Fig. 10c). In the presence of CD19+ROR1+ tumour cells, SynNotch T cells mediated unwanted bystander killing of CD19−ROR1+ cells, whereas the LINK system eradicated double-positive tumour cells only, sparing single-antigen-positive cells (Extended Data Fig. 10d).
In vivo, the SynNotch CAR mediated significant on-target, off-tumour toxicity, which was similar to that observed with a traditional ROR1-CD28ζ CAR, albeit slightly delayed (Fig. 6d–f). The SPLIT CAR system also resulted in on-target, off-tumour toxicity and the death of mice with one T cell donor—although with another, the CAR was ineffective in controlling the tumour, providing evidence of the strong link between efficacy and toxicity for this architecture (Fig. 6d–f and Extended Data Fig. 10e–g). By contrast, LINK2CA+ΔGADS CAR T cells mediated complete tumour control without any signs of on-target, off-tumour toxicity, similar to conventional CD19 CAR T cells (Fig. 6d–f). Thus, the LINK CAR platform is capable of specific and effective anti-tumour activity while preventing fatal on-target, off-tumour toxicity.
Discussion
CAR T cells have become an essential tool in the treatment of B cell malignancies and are a curative, life-saving therapy for many individuals1,2,43–45. However, the development of CAR T cells for treating solid tumours has been slow and marked by failures46. One major obstacle is the dearth of tumour-specific targets that are not shared with vital, normal tissues9,47. Although CARs can sometimes provide a therapeutic window between tumours expressing very high levels of antigen and normal cells expressing the same target at lower levels48,49, as more potent CAR T cells are engineered, more frequent on-target, off-tumour toxicity is likely to emerge in clinical studies.
We have generated Boolean-logic AND-gate CAR T cells by co-opting the LAT–SLP-76 scaffold that is required for T cell signalling. By taking advantage of native T cell signalling biology, we were able to achieve a highly specific and portable system for restricting T cell responses to dual antigen encounter. Several other AND-gate CAR systems have been engineered, including SynNotch4 and SPLIT CAR3, but as shown by others6 and in our data, these have shortcomings in specificity or efficacy in vivo. Two additional AND-gate systems that require the co-administration of foreign proteins to redirect CAR T cells on the basis of antigen expression have been proposed and tested in vitro (LOCKR50 and SUPRA CAR51). Small-protein therapeutics are technically challenging to administer in the clinic owing to their pharmacokinetics and may have a limited ability to effectively penetrate tissues. Furthermore, completely synthetic proteins are potentially immunogenic. By contrast, the signalling components of the LINK CAR are fully human and the system can be readily engineered to any specificity in a modular manner. Identification of ideal AND-gate targets is a growing field in oncology52,53, and this system is poised to alter the landscape of molecules that can be safely targeted with CAR T cells. Further work using patient samples and single-cell technologies53,54 will be necessary to identify safe and effective targets for LINK CAR T cells.
We engineered LINK CARs after observing that intracellular, proximal signalling molecules such as ZAP-70 and PLCγ1 can function as signalling domains in synthetic TM receptors. Proximal signalling CARs bypass upstream components of the TCR machinery, but transcriptional and phosphoproteomic analyses indicate that their downstream signalling networks are similar to CARs that use CD3ζ. Previously, researchers found that the protein tyrosine kinase SYK could also be repurposed into CAR-like chimeric molecules to kill tumour cells in vitro, but that ZAP-70-based CARs were largely ineffective55,56. The difference in functionality from our ZAP-70KIDB CAR may be due to exclusion of the self-inhibitory SH2 domains57. Together, this work shows that synthetic receptors can repurpose cytosolic kinases and other signalling machinery to control intracellular processes—an approach that may also be applicable to other cell types.
Certain proximal signalling CARs show advantages in our models, including reduced tonic signalling and T cell exhaustion as well as increased expansion and persistence. It is possible that some ZAP-70 CARs outperform CD3ζ CARs because of reduced tonic signalling and exhaustion32 or more finely calibrated signal strength23, and/or by evading inhibitory ligands and regulatory mechanisms in T cells that are focused on molecules such as LCK or CD3ζ itself58. Future work will more directly define the basis for enhanced ZAP-70 CAR activity and assess whether the same advantages hold true for LINK and PLCγ1 CARs. CD3ζ CAR T cell functionality is limited when the target antigen density is low, presenting opportunities for tumour immune escape through antigen remodelling10,11,59. We expect similar susceptibilities for the LINK CAR system, but systematic work is required to understand the antigen-density thresholds for each component of this system, which are likely to differ for individual antigens and binding molecules.
In summary, we have engineered a toolbox of CARs using proximal signalling molecules that exhibit enhanced functionality and specificity, including a robust system for instantaneous and reversible Boolean-logic AND gating that outperforms previously published systems. By repurposing cytosolic molecules into CARs, we can control cellular activity in a highly functional but unanticipated manner. Our tools offer scientists and physicians the ability to control and enhance CAR T cell functionality in the clinic. These advances could have a broad impact, not only in the field of cancer immunotherapy, but also as researchers extend CAR T cells to autoimmune diseases and develop new classes of cellular therapies.
Online content
Any methods, additional references, Nature Portfolio reporting summaries, source data, extended data, supplementary information, acknowledgements, peer review information; details of author contributions and competing interests; and statements of data and code availability are available at https://doi.org/10.1038/s41586-023-05778-2.
Methods
Construction of CAR constructs
All DNA constructs were visualized using SnapGene software (Dot-matics). CD19-4-1BBζ, HER2-4-1BBζ, B7-H3-4-1BBζ and GD2-4-1BBζ CAR constructs were previously described10,32,33. CAR constructs were generated with a mix of restriction enzyme and In-Fusion HD Cloning (Takara Bio) using codon-optimized gBlocks purchased from Integrated DNA Technologies. All CARs were cloned into MSGV1 retroviral vectors unless otherwise indicated. For LCK, FYN, ZAP-70 and SLP-76 CARs, the full-length proteins were codon optimized. For LAT CARs, the intracellular sequence of LAT (residues 28–262 according to UniProt notation) was similarly codon optimized and cloned. To generate CD19-ZAP-70Kinase and CD19-ZAP-70KIDB CARS, segments of ZAP-70 comprising the interdomain B and kinase domain regions (residues 255–600) or the kinase domain only (residues 338–600) were used. Mutations and deletions in these CARs were introduced by In-Fusion cloning on PCR fragments. All mutations and truncations in the LAT CAR have been numbered as they were previously described in the literature37, 38, 41.
In generating LAT and SLP-76 CARs that simultaneously target CD19, detection tags were added at the N terminus before the anti-CD19 scFv and after the signal sequence by In-Fusion Cloning to allow separate detection of LAT (2×HA) and SLP-76 (VSV-g) CARs.
The ROR1 scFv was derived from a humanized clone F antibody (US Patent 20200405759A1), generated as a gBlock and cloned into CAR backbones. A VSV-g tag was added to the ROR1 scFv at the N terminus after the signal sequence by In-Fusion Cloning to improve the detection of ROR1-targeting CARs by flow cytometry. SPLIT CARs were generated by separating CD3ζ and CD28 domains into separate CARs using PCR and In-Fusion cloning.
The CD19 SynNotch construct was generated by PCR-amplifying the CD19 scFv, Notch extracellular domain, Notch TM domain, GAL4 and VP64 from Addgene plasmid 79125 and cloning the product into the MSGV1 vector.
The SynNotch-inducible ROR1-CD28ζ construct was generated through insertion of a DNA sequence, from 5′ to 3′, encoding GAL4 UAS response elements from Addgene plasmid 79123, a minimal CMV promoter, GM-CSF leader sequence, VSV-g tag, ROR1-CD28ζ CAR, woodchuck hepatitis virus post-transcriptional regulatory element (WPRE), EF1α promoter and mTagBFP2 into a lentiviral backbone plasmid (System Biosciences TR012PA).
All constructs were verified by DNA sequencing (Elim Biopharmaceuticals). Amino acid sequences for all constructs are listed in Supplementary Table 1.
Generation of cell lines
The Nalm6-GFP Luciferase B-ALL cell line was obtained from S. Grupp; it had been originally commercially obtained from the American Type Culture Collection (ATCC). CHLA-255 was obtained from R. Seeger; 143B and 293T from ATCC; and 293GP by the NCI Surgery Branch. The generation of B7-H3+, HER2+, GD2+ and ROR1+ Nalm6 lines as well as CD19KO Nalm6 has been previously described21,33,42,60. All tumour cell lines were cultured in complete RPMI medium supplemented with 10% fetal bovine serum (FBS), 10 mM HEPES, 2 mM GlutaMAX, 100 U ml−1 penicillin and 100 μg ml−1 streptomycin (Gibco).
To generate isogenic Nalm6-GL cell lines expressing CD19, HER2 and ROR1, Nalm6 cells were virally transduced with retroviral or lentiviral vectors encoding cDNA for the antigen of interest. Expression was verified by flow cytometry, and cells were sorted by fluorescence-activated cell sorting (FACS) on Stanford FACS Core Shared FACSAria cytometers (BD Biosciences). Cell lines were sorted to obtain matching target expression between lines. Some cell lines were single-cell cloned.
To assess bystander killing by logic-gated CAR T cells, Nalm6 cells were transduced with TdTomato (red fluorescence), then either transduced with ROR1 to generate a ROR1+CD19+ fluorescent line, or electroporated with Cas9 and CD19-targeting sgRNAs to generate a ROR1−CD19− line. Cell lines were sorted to ensure purity and comparable antigen density. CD19 sgRNA target sequences (5′ to 3′): CACAGCGTTATCTCCCTCTG, CTGTGCTGCAGTGCCTCAAG.
All cell lines used were authenticated by short tandem repeat (STR) fingerprinting (Labcorp). Nalm6 lines were frequently validated by flow cytometry. All cell lines tested negative for mycoplasma using the MycoAlert Mycoplasma Detection Kit (Lonza).
Production of retroviral and lentiviral supernatant
Retroviral supernatant was generated by transient transfection of 293GP cells, as previously described32. In brief, 6 × 10⁶–7 × 10⁶ 293GP cells were added to 100 mm poly-d-lysine-coated plates in complete DMEM medium supplemented with 10% FBS, 10 mM HEPES, 2 mM GlutaMAX, 100 U ml−1 penicillin and 100 μg ml−1 streptomycin (Gibco). The following day, cells were transfected with 9 μg vector plasmid and 4.5 μg RD114 with Lipofectamine 2000 (Invitrogen) in Opti-MEM medium (Gibco). The medium was replaced after 24 h and collected at the 48-h and 72-h time points. Viral supernatant was used fresh or frozen at −80 °C for later use.
Lentiviral supernatant was generated as previously described60. In brief, 6 × 10⁶–7 × 10⁶ 293T cells were added to 100 mm poly-d-lysine-coated plates in complete DMEM medium supplemented with 10% FBS, 10 mM HEPES, 2 mM GlutaMAX, 100 U ml−1 penicillin and 100 μg ml−1 streptomycin (Gibco). The following day, cells were co-transfected with 9 μg vector plasmid, 9 μg pRSV-Rev, 9 μg pMDLg/pRRe and 3.5 μg pMD2.G with Lipofectamine 2000 (Invitrogen) in Opti-MEM medium (Gibco). The medium was replaced after 24 h and collected at the 48-h and 72-h time points. Viral supernatant was used fresh or frozen at −80 °C for later use.
Isolation of PBMCs and T cells
Healthy donor buffy coats, leukopaks or Leukocyte Reduction System (LRS) chambers were obtained through the Stanford Blood Center under an institutional review board (IRB)-exempt protocol. Peripheral blood mononuclear cells (PBMCs) were isolated using Ficoll-Paque Plus (GE Healthcare, 17–1440) density gradient centrifugation according to the manufacturer’s instructions and cryopreserved with CryoStor CS10 freeze medium (Sigma-Aldrich) in 1 × 10⁷–5 × 10⁷ cell aliquots. In some experiments, T cells were isolated using the RosetteSep Human T Cell Enrichment Cocktail (Stem Cell Technologies) according to the manufacturer’s protocol.
Transduction and culture of CAR T cells
CAR T cells were generated and cultured as previously described60. In brief, cryopreserved PBMCs or T cells were thawed on day 0 and cultured with Human T-Activator anti-CD3/anti-CD28 Dynabeads (Gibco) at a 3:1 bead:cell ratio in AIM-V medium (Gibco) supplemented with 5% FBS, 10 mM HEPES, 2 mM GlutaMAX, 100 U ml−1 penicillin, 100 μg ml−1 streptomycin and 100 IU ml−1 recombinant human IL-2 (Peprotech).
Retroviral and lentiviral transductions were performed on days 3 and 4 after activation on retronectin (Takara)-coated non-tissue culture treated plates. Wells were coated with 1 ml of 25 μg ml−1 retronectin in phosphate-buffered saline (PBS) overnight, then blocked with 2% BSA in PBS for 15 minutes before transduction. One millilitre of thawed or fresh retroviral supernatant per CAR construct was added and plates were then centrifuged at 3,200 rpm at 32 °C for 2–3 h. Viral supernatant was discarded and 0.5 × 10⁶ T cells were added to each well in 1 ml of complete AIM-V medium.
On day 5 after activation, anti-CD3/anti-CD28 beads were magnetically removed, and CAR T cells were maintained in culture with AIM-V medium changes every two to three days at a density of 0.3 × 10⁶ cells per ml.
CRISPR–Cas9-mediated knockout of proximal signalling molecules
Proximal signalling molecule expression was disrupted with CRISPR–Cas9-mediated gene disruption. sgRNA for TRAC was previously described10. All other sgRNAs were designed using the Knockout Design Tool (Synthego). The sgRNA target sequences (5′ to 3′) used were:
LCK: CTTCAAGAACCTGAGCCGCA
FYN: TGGAGGTCACACCGAAGCTG, AGAAGCAACAAAACTGACGG
ZAP70: CAGTGCCTGCGCTCGCTGGG, CCTGAAGCTGGCGGGCATGG
LAT: CACACACAGTGCCATCAACA, CGTTTGAACTGGATGCCCCT
LCP2 (SLP-76): AATAGTCAGCAAGGCTGTCG, GAAGAAGTACCACATCGATG
TRAC: GAGAATCAAAATCGGTGAAT
CD247 (CD3ζ): AGCAGAGTTTGGGATCCAGC, GAATGACACCATAGATGAAG
Editing was performed on T cells after Dynabead removal five days after T cell activation. T cells were resuspended in P3 buffer (0.75 × 10⁶–1 × 10⁶ cells per 18 μl P3) from the P3 Primary Cell 4D-Nucleofector X Kit S (Lonza). Then, 10 μg μl−1 Alt-R S.p. Cas9 Nuclease V3 and Nuclease-free Duplex Buffer (IDT) were mixed in a 1:2 ratio; the ensuing mixture was then incubated at a 1:1 ratio with 120 pmol sgRNA for approximately 10 min. Eighteen microlitres of cells were mixed with 2 μl of sgRNA:Cas9 ribonucleoprotein complexes, then electroporated in 16-well cuvette strips using the E0–115 program. CAR T cells were quickly transferred into 200 μl of compete AIM-V medium and allowed to incubate at 37 °C for 24 h before being moved to larger volumes and cultured as described above. For knockouts conducted using multiple sgRNAs, each sgRNA was incubated with a Cas9 and Duplex mix at a 1:1 ratio separately, then 2 μl of each mix was added to 18 μl of cells in P3 buffer (if two sgRNAs were used, the final volume was 22 μl). Knockout efficiency was assessed by intracellular flow cytometry after expansion of the edited cells (as below).
Flow cytometry
Cells were washed with FACS buffer (2% FBS in PBS) before staining. Staining was performed in FACS buffer for 20 min at 4 °C. In certain experiments, 1× Fixable Viability Dye eFluor 780 (eBioscience) was also added to the staining mix. Cells were then washed once with FACS buffer and analysed on a BD Fortessa. FACSDiva software (BD) was used for data collection and FlowJo software (BD) was used for data analysis.
T cells were assessed for CAR expression on the same day they were used for in vitro and in vivo assays. CD19-targeting CARs were detected using the anti-CD19 CAR idiotype antibody provided by L. Cooper61. GD2-targeting CARs were detected using the 1A7 anti-14G2a idiotype antibody obtained from the National Cancer Institute (1:400 dilution). HER2, B7-H3 and human and mouse ROR1-targeting CARs were detected using human HER2-Fc, B7-H3-Fc and human or mouse ROR1-Fc recombinant proteins (R&D Systems, 1:400). Idiotype antibodies and Fc-proteins were fluorophore-conjugated using DyLight 650 or DyLight 488 Microscale Antibody Labeling Kits (Invitrogen). CAR scFvs with extracellular VSV-g or 2×HA tags were detected with anti-VSV-g (polyclonal, FITC, Abcam, 1:100) and anti-HA.11 (APC, Clone 16B12, BioLegend, 1:100) antibodies.
The following antibodies were used for lymphocyte staining:
CD69 (BV421, clone FN50, BioLegend, 1:100), CD107a (BV605 or APC, clone H4A3, BioLegend, 1:100), CD4 (BUV 737 or BUV 395, clone SK3, BD Biosciences, 1:100), CD8 (BUV 805, clone SK1, BD Biosciences, 1:100), CD3 (BUV 496, clone UCHT1, BD Biosciences, 1:100), CD45 (PerCP–Cy5.5, clone HI30, Invitrogen, 1:100), PD-1 (PE–Cy7, clone EH12.2H7, BioLegend, 1:50), TIM-3 (BV510 or BV650, clone F38-2E2, BioLegend, 1:50), LAG-3 (PE, clone 3DS223H, Invitrogen, 1:50), CD62L (BV605, clone DREG-56, BD Biosciences, 1:100), CD45RA (BV711, clone HI100, BD Biosciences, 1:100), CD20 (APC, clone 2H7, BioLegend, 1:100), IgG1 κ isotype (PE, clone 11711, R&D Systems, 1:50), IgG1 κ isotype (PE–Cy7, clone MOPC-21, BioLegend, 1:50) and IgG1 κ isotype (BV650, clone MOPC-21, BioLegend, 1:50).
The following antibodies were used for tumour cell staining:
CD19 (APC, clone HIB19, BioLegend, 1:50), HER2 (PE–Cy7, clone 24D2, BioLegend, 1:50) and ROR1 (PE–Cy7, clone 2A2, BioLegend, 1:50).
SPICE plots were generated by calculating LAG-3, TIM-3 and PD-1 positive CAR T cell populations on FlowJo and importing into SPICE software62.
Representative gating strategies for flow cytometric assays are shown in Supplementary Fig. 1.
Intracellular protein staining and intracellular cytokine assays
Staining was performed following the manufacturer’s protocol for the Foxp3/Transcription Factor Staining Buffer Set (eBioscience). A fixable viability dye was added (eFluor 780, eBioscience) and relevant extracellular markers were stained before the fixation step. After fixation and permeabilization, cells were stained with 0.1 μg per 100,000 cells of anti-LCK, anti-FYN, anti-ZAP-70, anti-LAT and anti-SLP-76 antibodies. Isotype controls were used for gating.
For intracellular cytokine assays, CAR T cells (day 18 after activation) were incubated with target cells at a 1:1 ratio for 5 h in the presence of 1× Monensin (eBioscience) and 0.75 μl anti-CD107a antibody per test. Following stimulation, the staining buffer set protocol was performed. After permeabilization, anti-cytokine antibodies were added at 0.75 μl per condition.
The following antibodies were used for intracellular staining:
LCK (Alexa Fluor 647, clone Lck-01, BioLegend, 1:500), FYN (Alexa Fluor 647, clone FYN-01, Novus Biologicals, 1:800), ZAP-70 (Alexa Fluor 647, clone A16043B, BioLegend, 1:100), LAT (Alexa Fluor 647, clone 661002, R&D Systems, 1:200), SLP-76 (Alexa Fluor 647, clone H3, BD Biosciences, 1:6.25), CD247 (Alexa Fluor 647, clone 6B10.2, BD Biosciences, 1:200), IgG1 κ isotype (Alexa Fluor 647, clone MOPC-21, BioLegend, 1:100), IgG2a κ isotype (Alexa Fluor 647 clone MOPC-173, BioLegend, 1:25), IgG2b κ isotype (Alexa Fluor 647, clone MPC-11, BioLegend, 1:500), IL-2 (PE–Cy7, clone MQ1-17H12, BioLegend, 1:133), IFNγ (BUV 395, clone B27, BD Biosciences, 1:133) and TNF (BV711, clone MAb11, BioLegend, 1:133).
Cytotoxicity assays
CAR+ T cells (day 10 after activation) were co-cultured with 50,000 tumour cells at the specified E:T ratios in complete RPMI medium on 96-well flat-bottom plates. Co-cultures were incubated at 37 °C and imaged with an Incucyte S3 Live-Cell Analysis System (Sartorius) for approximately 72 h. The basic analyser feature on the Incucyte S3 software was used to quantify killing of GFP+ tumour cells by measuring the Total Green Object Integrated Intensity over time. Cytotoxicity index was calculated as the percentage of Total Green Object Integrated Intensity at a specific time point divided by the Total Green Object Integrated Intensity at time 0.
To assess the killing of bystander cells by LINK and SynNotch CAR T cells, 50,000 ROR1+CD19− Nalm6-GL cells (green) and 50,000 ROR1−CD19− or ROR1+CD19+ Nalm6-TdTomato cells (red) were co-cultured with 50,000 CAR+ T cells (1:1:1 effector to target 1 to target 2 ratio) in 24-well flat-bottom plates. An Incucyte was used to quantify the killing of both GFP+ and TdTomato+ tumour cells by measuring the Total Green Object and Red Object Integrated Intensities over time, as described above.
Cytokine assays
A total of 1 × 10⁵ CAR+ T cells (day 10 after activation) were co-cultured with tumour cells in a 1:1 E:T ratio in complete RPMI medium and incubated at 37 °C for approximately 24 h. For cells stimulated with anti-CD3/anti-CD28 DynaBeads (Gibco), beads were added to cells at a 3:1 bead:cell ratio. For cells stimulated with plate-bound protein, human or mouse ROR1-fc recombinant protein (R&D Systems) was reconstituted in PBS and applied to a 96-well flat-bottom plate at appropriate concentrations, incubated at 4 °C for 24 h then washed once with PBS before cells were added. After stimulation, the supernatants were collected and IL-2 or IFNγ were measured by ELISA following the manufacturer’s protocol (BioLegend). Absorbances were measured with a Synergy H1 Hybrid Multi-Mode Reader with Gen5 software (BioTek).
T cell activation assays
For activation assays assessing CD69 and CD107a expression, 1 × 10⁵ CAR T cells (day 10 after activation) were co-cultured with single CD19+, HER2+ or CD19+HER2+ leukaemia cells at 1:1 E:T ratios in complete RPMI medium at 37 °C for 4 h in the presence of 0.75 μl anti-CD107a antibody and 1× monensin (eBioscience). Cells were then washed with cold FACS buffer and staining was performed as described above.
Western blots and densitometric analysis
GD2-targeting CAR T cells were stimulated with 1A7 anti-14G2a idiotype-coated beads at a 4:1 bead:cell ratio for 5-, 15- and 45-min time points at 37 °C. Cells were washed twice with ice-cold PBS, then pelleted and flash-frozen on dry ice for storage at −80 °C. To coat beads with antibody, 50 μg of 1A7 anti-idiotype antibody was biotinylated using the Biotin-XX Microscale Protein Labeling Kit (Invitrogen) according to the manufacturer’s protocol. Streptavidin M-450 Dynabeads (Invitrogen) were magnetically separated from buffer solution and washed once with PBS, then incubated with biotinylated antibody (2.5 μg antibody per 6 × 10⁷ beads) in PBS for 10 min. Labelled beads were then magnetically separated from the mixture again and resuspended in PBS at 6 × 10⁵ beads per μl. Antibody-coated beads were made fresh for stimulations.
Whole-cell protein lysates were obtained in nondenaturing buffer (150 mmol l−1 NaCl, 50 mmol l−1 Tris pH 8, 1% NP-10 and 0.25% sodium deoxycholate) supplemented with a phosphatase and protease inhibitor cocktail (78440, Thermo Fisher Scientific). Protein concentrations were estimated by Bio-Rad DC colorimetric protein assay (5000111). Immunoblotting was performed by loading 10 μg of protein onto 10% PAGE gels followed by transfer to PVF membranes. Signals were detected by enhanced chemiluminescence (Pierce) or with the Odyssey imaging system (LI-COR). For quantitative comparisons between different membranes, all samples were run in parallel gels, washed and incubated in the same tray with each primary or secondary antibody and developed simultaneously. Densitometric analyses of immunoblot signals were performed using ImageJ v.1.53K (NIH). Intensities of phospho-protein bands were normalized to that of each correspondent total protein. Fold change in band intensity was calculated relative to unstimulated sample.
The following primary antibodies were used: phospho-PLCγ1 Ser1248 (D25A9, Cell Signaling), PLCγ1 (D9H10, Cell Signaling), phospho-SLP-76 Ser376 (D9D6E, Cell Signaling), SLP-76 (polyclonal, Cell Signaling), phospho-AKT Ser473 (Polyclonal, Cell Signaling), AKT (40D4, Cell Signaling), Phospho-ERK1/2 Thr202/Tyr204 (Polyclonal, Cell Signaling), ERK1/2 (Polyclonal, Cell Signaling), Phospho-c-JUN Ser73 (D47G9, Cell Signaling), Phospho-NF-κB Ser536 (93H1, Cell Signaling) and NF-κB (D14E12, Cell Signaling).
scRNA-seq
B7-H3-targeting CAR T cells were incubated with or without B7-H3+ Nalm6 for 6 h at a 1:1 E:T ratio, then stained for CD45 and CAR. CAR+ T cells were gated as GFP−, CD45+ and CAR+, then purified using a BD FAC-SAria cell sorter. Approximately 60,000 live cells per stimulation condition were collected for each T cell donor (3 donors total); donors were then pooled in each condition. Libraries for scRNA-seq were generated using the 10X Chromium Controller and the Chromium Single Cell 5′ Library Construction Kit according to the manufacturer’s instructions. In brief, the suspended cells were loaded on a Chromium controller Single-Cell Instrument to generate single-cell Gel Bead-In-Emulsions (GEMs) followed by reverse transcription and sample indexing using a C1000 Touch Thermal cycler with 96-Deep Well Reaction Module (Bio-Rad). After breaking the GEMs, the barcoded cDNA was purified and amplified, followed by fragmenting, A-tailing and ligation with adaptors. Finally, PCR amplification was performed to enable sample indexing and enrichment of scRNA-seq libraries. The final libraries were quantified using a Qubit dsDNA HS Assay kit (Invitrogen) and a High Sensitivity DNA chip run on a Bioanalyzer 2100 system (Agilent). The 10X scRNA-seq libraries were sequenced as recommended by the manufacturer (approximately 25,000 reads per cell) on a Nova-seq 6000 using an S4 flow cell. Raw sequencing reads were demultiplexed using CellRanger mkfastq and aligned to the host reference genome using CellRanger v.6.0. Three donors were mixed per condition and demultiplexed using mitochondrial DNA genotypes using the mgatk v.0.6.2 software63. Downstream analyses, including cell-type identification, differential gene expression analyses and visualizations were conducted using Seurat v.4.0 (ref. 64).
In vivo xenograft models
All animal studies were carried out according to Stanford Institutional Animal Care and Use Committee-approved protocols. Immunodeficient NOD-scid IL2Rgnull (NSG, NOD.Cg-PrkdcscidIl2rgtm1Wjl/SzJl) mice were purchased from The Jackson Laboratory or bred in house. Mice were housed at 22 °C and 50% humidity with a 12-h light–12-h dark cycle. Four-to-ten-week-old male or female mice were inoculated intravenously with 1 × 10⁶ CHLA-255 cells 7 days before T cell injection or 1 × 10⁶ ROR1+CD19+Nalm6-GL cells 1–3 days before T cell injection in 200 μl PBS. For rechallenge experiments, mice were inoculated with B7-H3+Nalm6-luciferase or WT Nalm6-luciferase leukaemia lines on day 30 after CHLA-255 engraftment (day 23 after CAR T cell injection) and monitored by bioluminescence. For the 143B osteosarcoma model, 1 × 10⁶ tumour cells in 100 μl PBS were injected into the hind leg of the mouse 13 days before T cell injection. In all models, mice were randomized to ensure even tumour burden between experimental and control groups before treatment.
CAR T cells were injected intravenously on day 10 after activation: CHLA-255-bearing mice received 3 × 10⁶ (for efficacy and survival experiments) or 1 × 10⁷ (for proliferation and persistence experiments) CAR+ T cells; 143B-bearing mice received 1 × 10⁷ CAR+ T cells; and ROR+Nalm6-bearing mice received 6 × 10⁶–8 × 10⁶ (for efficacy and toxicity assessment experiments) or 3 × 10⁶ (for lower-dose test) CAR+ T cells. For SPLIT CARs, dosing was based on the CD3ζ CAR. For LINK CARs, dosing was based on the double-positive population given the lack of activity of the SLP-76 or LAT CARs alone. For SynNotch, dosing was based on the population that was positive for both the SynNotch receptor (CD19 CAR positive) and the ROR1-CAR-response element (BFP positive). Total T cell doses were not normalized between conditions. Leukaemia and neuroblastoma model mice were monitored for disease progression once or twice a week using BLI with an IVIS imaging system (Perkin Elmer) and LivingImage software (Perkin Elmer). Some experiments were imaged on both IVIS and LAGO (using Aura software, Spectral Instruments Imaging) imaging systems; in these cases, flux values were normalized to no tumour controls (which differed slightly for each machine). For CHLA-255 models, mice were humanely euthanized when they showed morbidity or developed palpable solid tumour masses. For leukaemia models, mice were humanely euthanized when they showed morbidity or exhibited hind-leg paralysis. For the ROR1-CAR on-target and off-tumour toxicity model, mice were weighed frequently and humanely euthanized if their weight rapidly dropped by 20%, or if they exhibited considerable signs of distress (hunched posture, impaired mobility, rough coat or shivering). Tumour sizes in the 143B osteosarcoma model were measured with digital calipers twice per week. Tumour area was calculated by multiplication of two-dimensional tumour measurements (width × depth). Mice were euthanized if width or depth measurements exceeded 17.5 mm.
No sample size calculations were performed for in vivo experiments. Group sizes were determined by experience with well-established, previously published models10, 21. Mice were randomized before T cell infusion to ensure equal mean tumour burden. The technician performing T cell and tumour cell intravenous injections was blinded to the treatments and expected outcomes. All in vivo experimental source data are displayed in Supplementary Table 2.
Assessment of T cell expansion and memory markers in vivo
To assess CAR T cell expansion in vivo, mice were euthanized at the one- and two-week time points after T cell infusion. Spleens and bone marrow were collected, counted and stained for CD4, CD8, human CD4 and CAR. T cells were gated as GFP− and human CD45+. The percentages of CAR+ cells and total cell counts were used to calculate the absolute number of T cells present in the spleen. To assess CAR T cell persistence and memory in vivo, mice were euthanized approximately four weeks after T cell infusion. Spleens were collected, counted and stained for CD4, CD8, human CD45, CAR, CD45RA and CD62L.
Assessment of B cell on-target, off-tumour toxicity in vivo
Healthy donor LRS chambers were obtained through the Stanford Blood Center under an IRB-exempt protocol. T and B cells were isolated separately using RosetteSep Human T Cell and B Cell Enrichment Cocktails (Stem Cell Technologies) according to the manufacturer’s protocol. B cells were injected intravenously into NSG mice at a dose of 2 × 10⁶ cells in 200 μl PBS, followed by administration of 1 × 10⁶ ROR1+CD19+Nalm6-GL cells four days later. CAR T cells were then administered three days after tumour inoculation. T and B cells originated from the same donor to prevent allogeneic killing of B cells. Control mice were treated with T cells expressing a truncated, non-signalling CD19 CAR. Three groups of mice that each received B and T cell infusions from different donors were euthanized on days 8, 9 or 14 after CAR T cell infusion, and spleens were collected, counted and stained for human CD45, CD3 and CD20. B cells were gated as GFP−, CD3−, human CD45+ and CD20+. The percentages of B cells and total cell counts were used to calculate the absolute number of B cells present in the spleen.
Statistical analysis
Statistical analyses were performed with Excel v.16.64 (Microsoft), GraphPad Prism v.9.3.1 (GraphPad) or R v.4.2.2 (R Core Team). Unless otherwise noted, analyses testing for significant differences between groups were conducted with unpaired two-tailed t-tests (when comparing two groups) or a one-way ANOVA with Dunnett’s test for multiple comparisons (when comparing more than two groups). In vivo survival curves were compared with the log-rank Mantel–Cox test. In vivo tumour growth was compared with a repeated-measures ANOVA with correction for multiple comparisons. In vivo T cell proliferation and persistence were compared using the two-tailed Mann–Whitney test. P values of less than 0.05 were considered statistically significant. For scRNA-seq analysis, exhaustion and memory modules were compared with the two-tailed Mann–Whitney test. Differentially expressed genes were defined by a Benjamini–Hochberg adjusted P value < 0.01 and abs(logFC) > 0.5 from Seurat’s FindMarkers function (two-sided Wilcoxon signed rank test).
Reporting summary
Further information on research design is available in the Nature Portfolio Reporting Summary linked to this article.
Data availability
All new CAR sequences are available in Supplementary Table 1. CAR constructs will be made available through Material Transfer Agreements when possible. The scRNA-seq datasets have been deposited in the NCBI Gene Expression Omnibus (GEO) and are accessible through the GEO series accession number GSE216286.
Extended Data
Extended Data Fig. 1 |. Required proximal signalling molecules for CD19-4-1BBζ and CD19-CD28ζ CAR signalling.
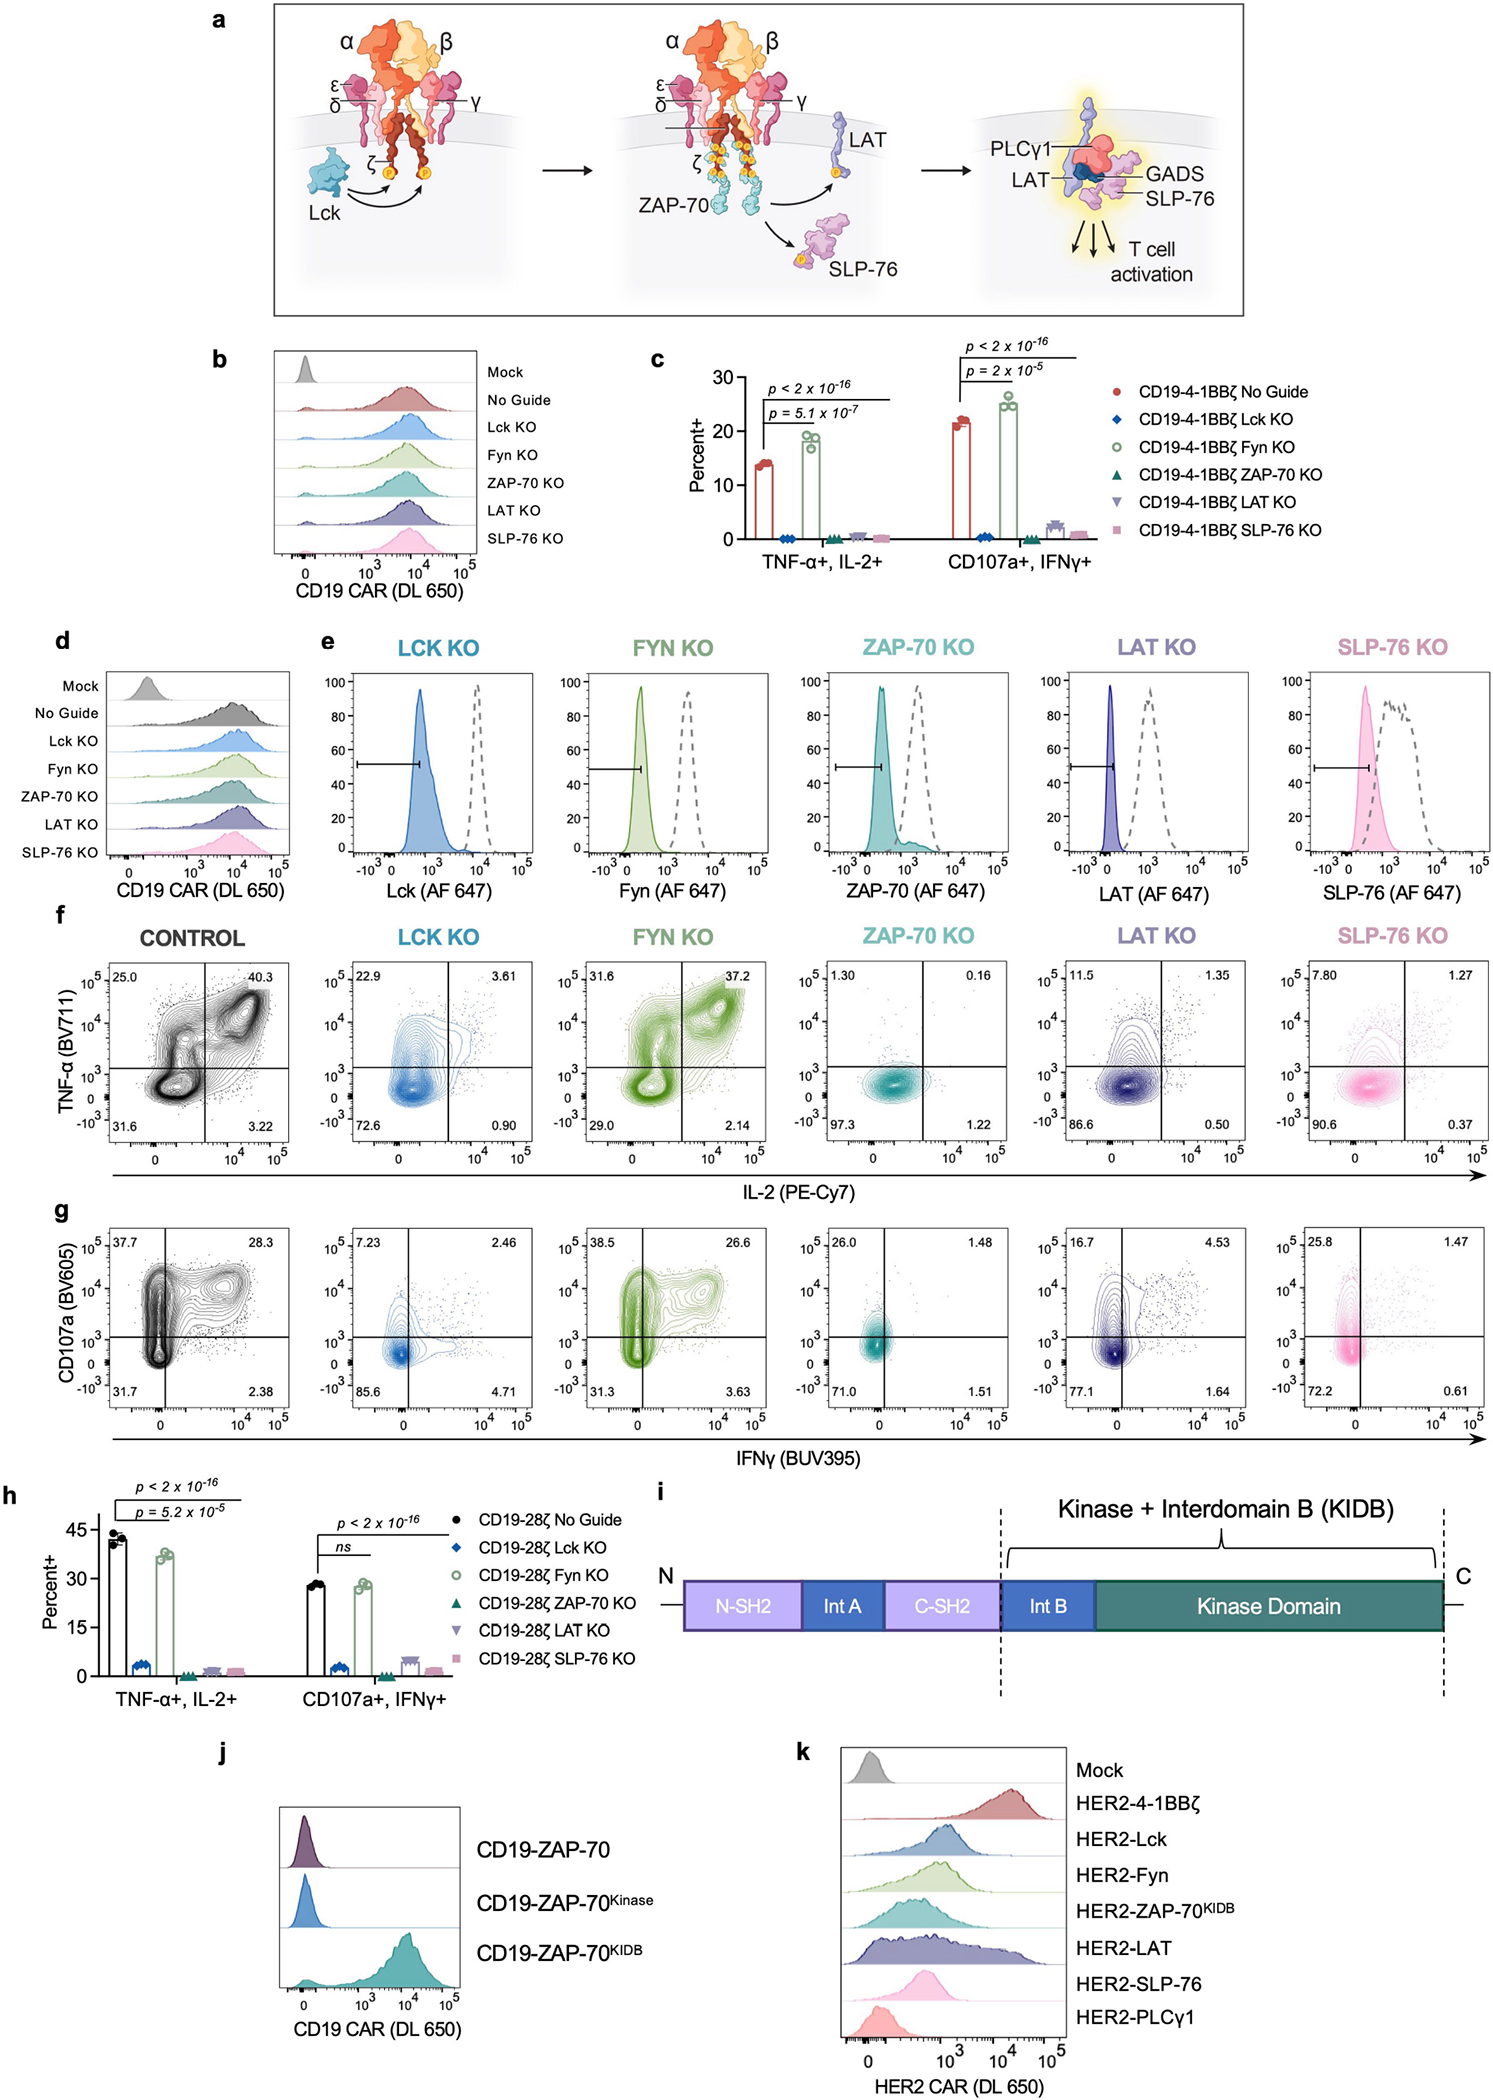
a, Schematic illustrating the TCR signalling pathway wherein LCK phosphorylates ITAM motifs in CD3ζ, creating a binding site for ZAP-70. ZAP-70 is then activated and phosphorylates adaptor proteins LAT and SLP-76. LAT and SLP-76 then form a scaffold for the recruitment of PLCγ1 and other downstream effector molecules that initiate T cell activation. b, Flow cytometric data exhibiting CD19-4-1BBζ CAR expression in unedited and edited T cells prior to stimulation. c, Quantification of TNF+IL-2+ and CD107a+IFNγ+ populations in edited CD19-4-1BBζ CAR T cells as shown in Fig. 1d,e. Baseline measurements from the unstimulated controls were subtracted from stimulated conditions. Shown are mean values ± s.d. of three experimental replicates. Data is representative of 3 independent experiments with different blood donors. Groups were compared using one-way ANOVA with correction for multiple comparisons (p < 2 × 10⁻¹⁶ for no guide vs LCK KO, no guide vs ZAP-70 KO, no guide vs LAT KO, and no guide vs SLP-76 KO). d, Flow cytometric data exhibiting CD19-CD28ζ CAR expression in unedited and edited T cells prior to stimulation. e, Flow cytometric plots demonstrating knockout efficiencies for proximal signalling molecules in CAR T cells shown in d. f,g, After CRISPR/Cas9-mediated knockout of the indicated proximal signalling molecules, CD19-CD28ζ CAR T cells were stimulated with Nalm6 tumour cells. Shown is flow cytometric data of TNF × IL-2 (f) and CD107a × IFNγ (g) in knockout populations designated in e. h, Quantification of TNF+IL-2+ and CD107a+IFNγ+ populations in edited CD19-CD28ζ CAR T cells as shown in f,g. Baseline measurements from the unstimulated controls were subtracted from stimulated conditions. Shown are mean values ± s.d. of three experimental replicates. The experiment shown in f-h was performed one time. Groups were compared using one-way ANOVA with correction for multiple comparisons (p < 2 × 10⁻¹⁶ for no guide vs LCK KO, no guide vs ZAP-70 KO, no guide vs LAT KO, and no guide vs SLP-76 KO). i, Schematic illustrating the protein domains of ZAP-70; dashed lines indicate the Kinase + Interdomain B (KIDB) region contained in the ZAP-70KIDB CAR. j, Flow cytometric data exhibiting expression of CD19-ZAP-70, CD19-ZAP-70Kinase, and CD19-ZAP-70KIDB CARs. k, Flow cytometric data exhibiting expression of HER2-targeting proximal signalling CARs.
Extended Data Fig. 2 |. ZAP-70 CAR T cells show potent in vitro and in vivo activity.
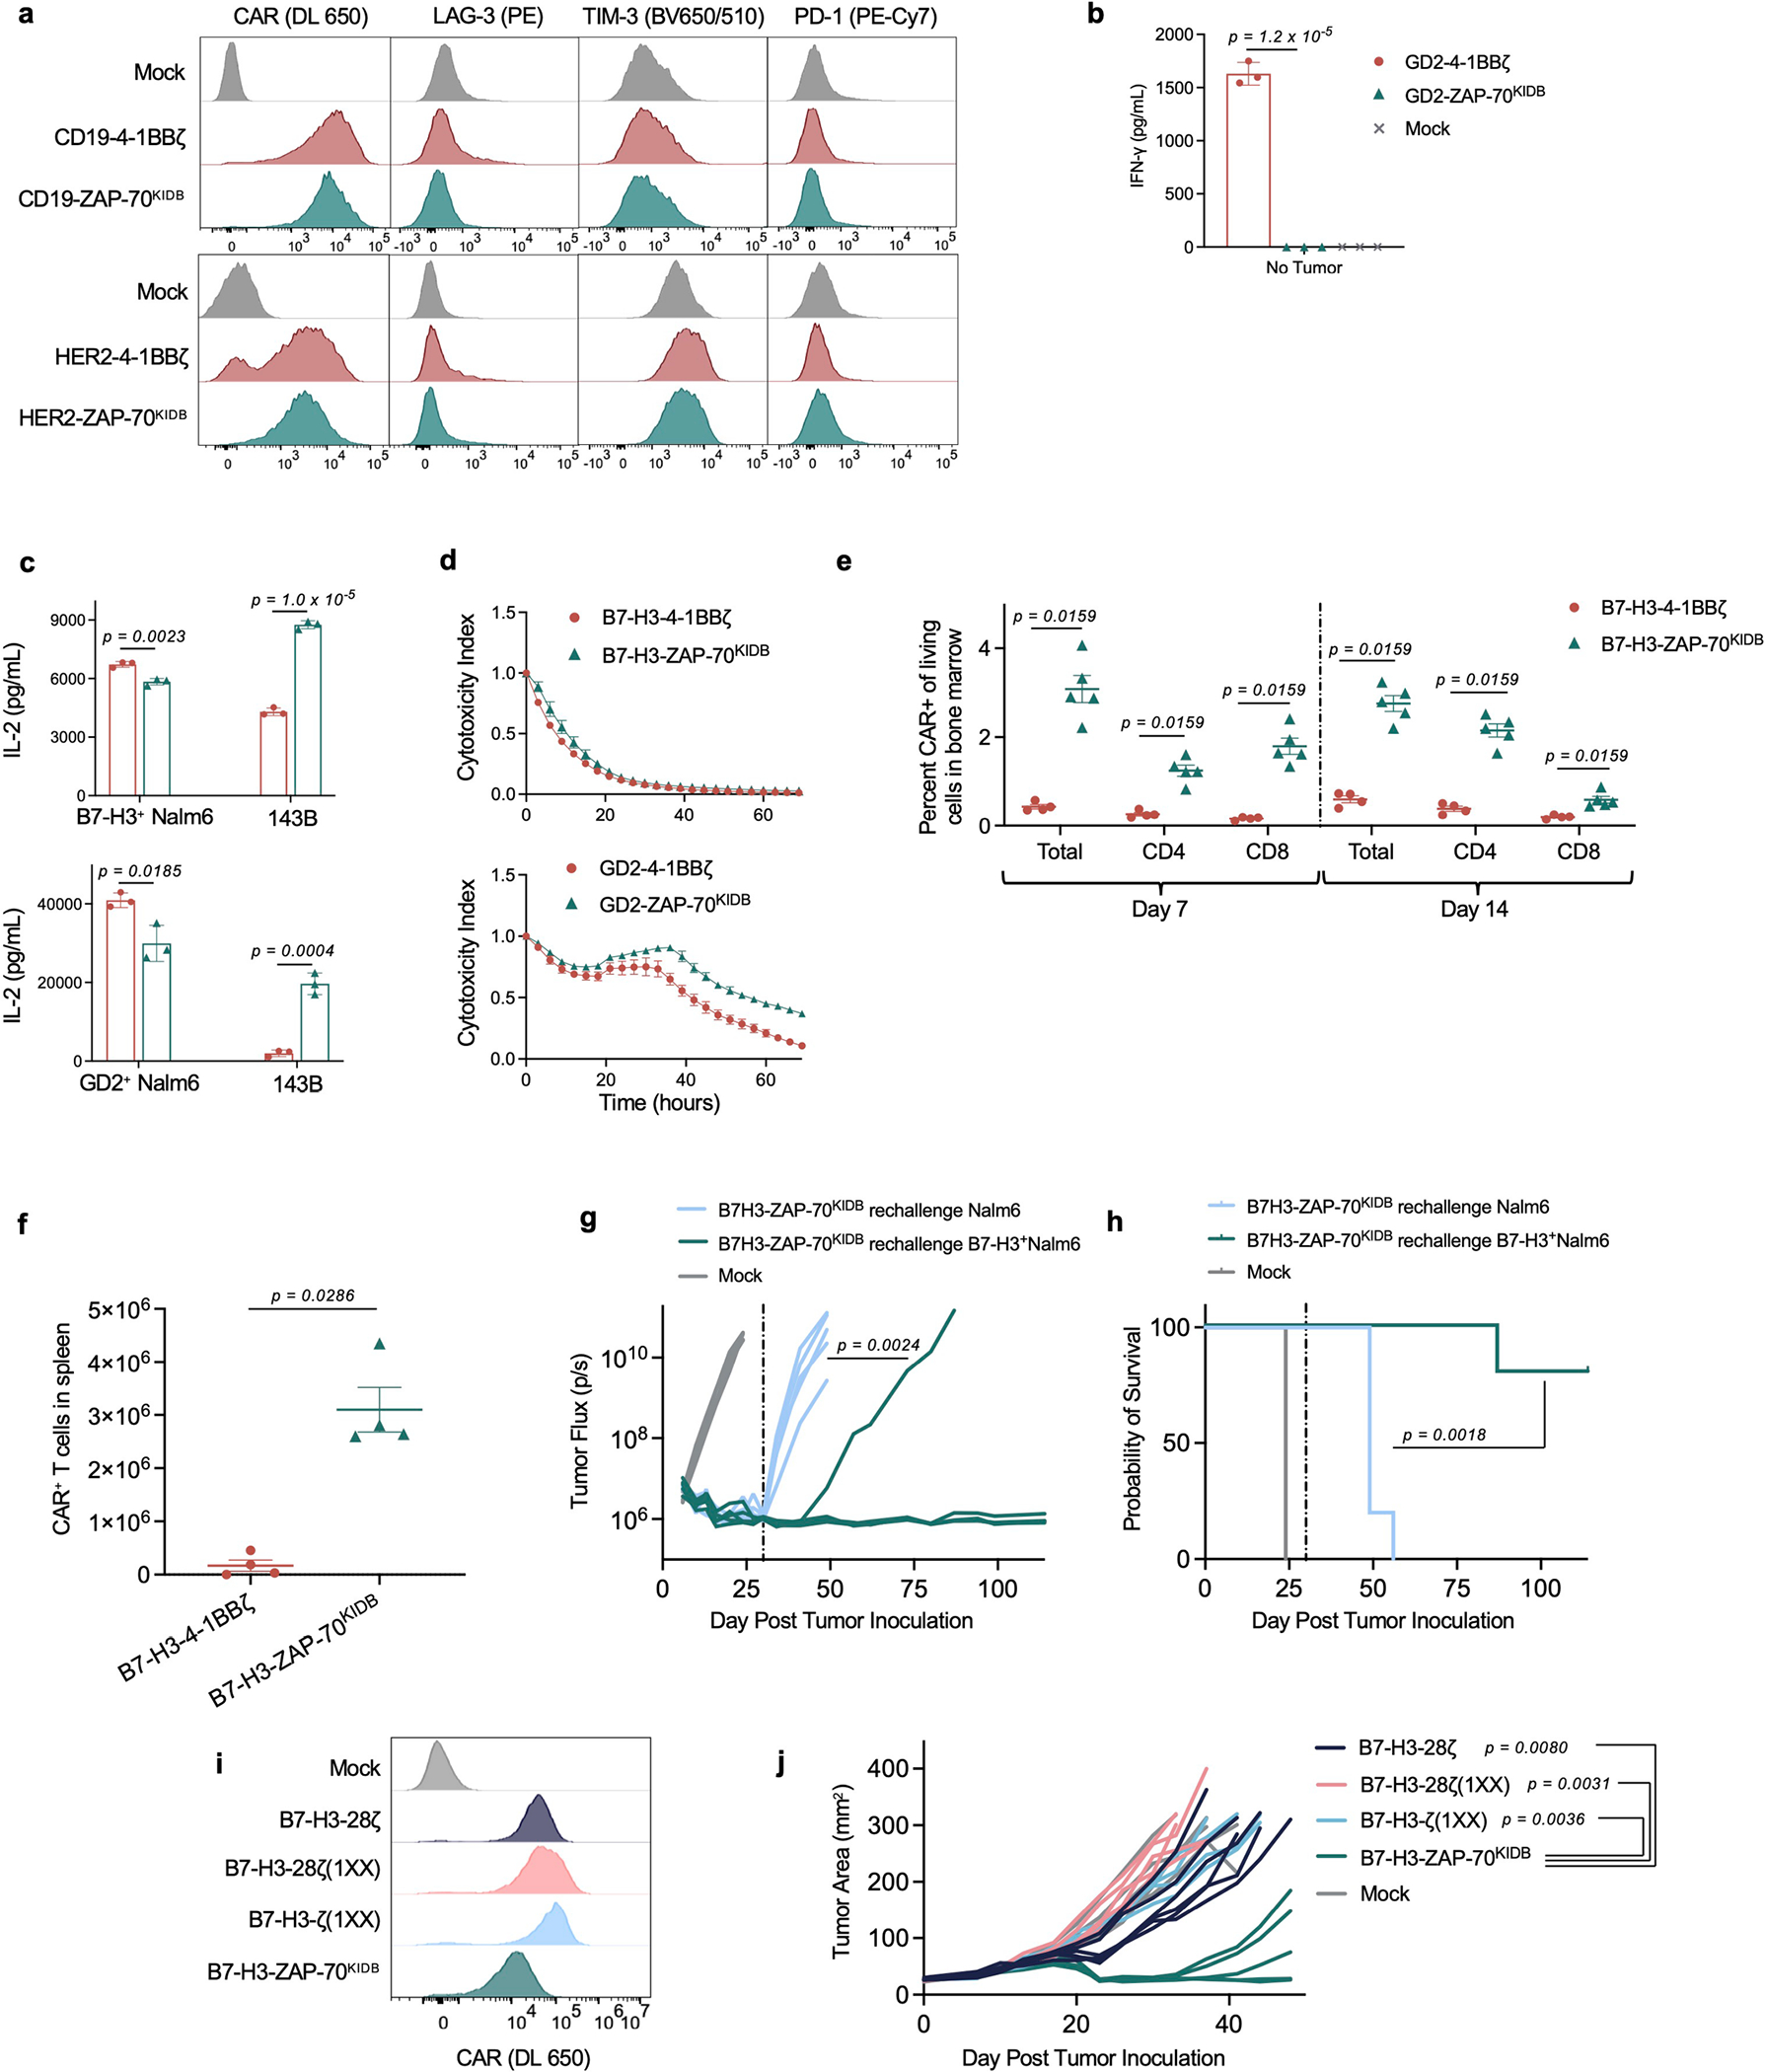
a, Representative flow cytometric plots of CAR, LAG-3, TIM-3, and PD-1 expression for T cells bearing CD19 or HER2-specific CARs containing 4-1BBζ or ZAP-70KIDB endodomains (day 10 after T cell activation). Representative of three experiments with different blood donors. b, IFNγ secretion (as measured by ELISA) by GD2-4-1BBζ and GD2-ZAP-70KIDB CAR T cells following 24-h culture in the absence of target cells. Shown are mean values ± s.d. of three experimental replicates. Representative of three experiments with different blood donors. Groups were compared with the unpaired t-test (two-tailed). c, IL-2 secretion by B7-H3 or GD2-specific CAR T cells containing ZAP-70KIDB or 4-1BBζ endodomains following co-culture with Nalm6 cells expressing B7-H3/GD2 or 143B osteosarcoma cells. Shown are mean values ± s.d. of three experimental replicates. Representative of four independent experiments with different blood donors. Groups were compared with the unpaired t-test (two-tailed). d, Tumour cell killing of GFP+ human neuroblastoma CHLA-255 cells co-cultured with B7-H3 or GD2-specific CAR T cells containing ZAP-70KIDB or 4-1BBζ endodomains at a 1:1 ratio of T cells to tumour cells. Shown are mean values ± s.d. of three experimental replicates. Representative of four independent experiments with different blood donors. e, Percent CAR+ T cells recovered from the bone marrow of CHLA-255-bearing mice on days 7 and 14 after treatment with 1 × 10⁷ B7-H3-4-1BBζ or B7-H3-ZAP-70KIDB CAR T cells 7 days after tumour inoculation. Shown are mean values ± s.e.m. for n = 5 mice (B7-H3-ZAP-70KIDB) or n = 4 mice (B7-H3-4-1BBζ) per group per time point. Experiment was performed once at two time points. Groups were compared with the Mann–Whitney test (two-tailed). f, Absolute number of CAR T cells recovered from the spleens of CHLA-255-bearing mice on day 28 after treatment with 1 × 10⁷ B7-H3-4-1BBζ or B7-H3-ZAP-70KIDB CAR T cells. Shown are mean values ± s.e.m. for n = 4 mice. Experiment was performed once. Groups were compared with the Mann–Whitney test (two-tailed). g,h, NSG mice bearing CHLA-255-luciferase xenografts were treated intravenously with 3 × 10⁶ B7-H3-ZAP-70KIDB CAR T cells on day 7 post CHLA-255 engraftment, then rechallenged with B7-H3+Nalm6-luciferase or WT B7-H3−Nalm6-luciferase leukaemia lines on day 30 post initial tumour engraftment (dashed vertical line). g, Quantification of tumour progression for each individual mouse as measured by flux values acquired by BLI. h, Survival curves for mice bearing tumours shown in g. Experiment was performed once with n = 5 mice per group. Tumour growth in g was compared between groups using repeated measures one-way ANOVA with correction for multiple comparisons and survival in h was compared with the log-rank test. i, Flow cytometric plots of CAR expression on B7-H3-CD28ζ, B7-H3-CD28ζ(1XX), B7-H3-ζ(1XX), or B7-H3-ZAP-70KIDB CAR T cells (day 10 after T cell activation). j, NSG mice bearing 143B osteosarcoma xenografts were treated intravenously with 1 × 10⁷ B7-H3-CD28ζ, B7-H3-CD28ζ(1XX), B7-H3-ζ(1XX), or B7-H3-ZAP-70KIDB CAR T cells on day 13 post tumour inoculation. Tumours were measured at least twice weekly, and tumour area was calculated as the product of the tumour width and depth. Experiment was performed one time with n = 5 mice per group (n = 6 mice for B7-H3-CD28ζ, n = 4 mice for B7-H3-ζ(1XX)). Tumour growth curves were compared with repeated measures one-way ANOVA with correction for multiple comparisons.
Extended Data Fig. 3 |. ZAP-70KIDB CAR T cells show distinct transcriptomic profiles.
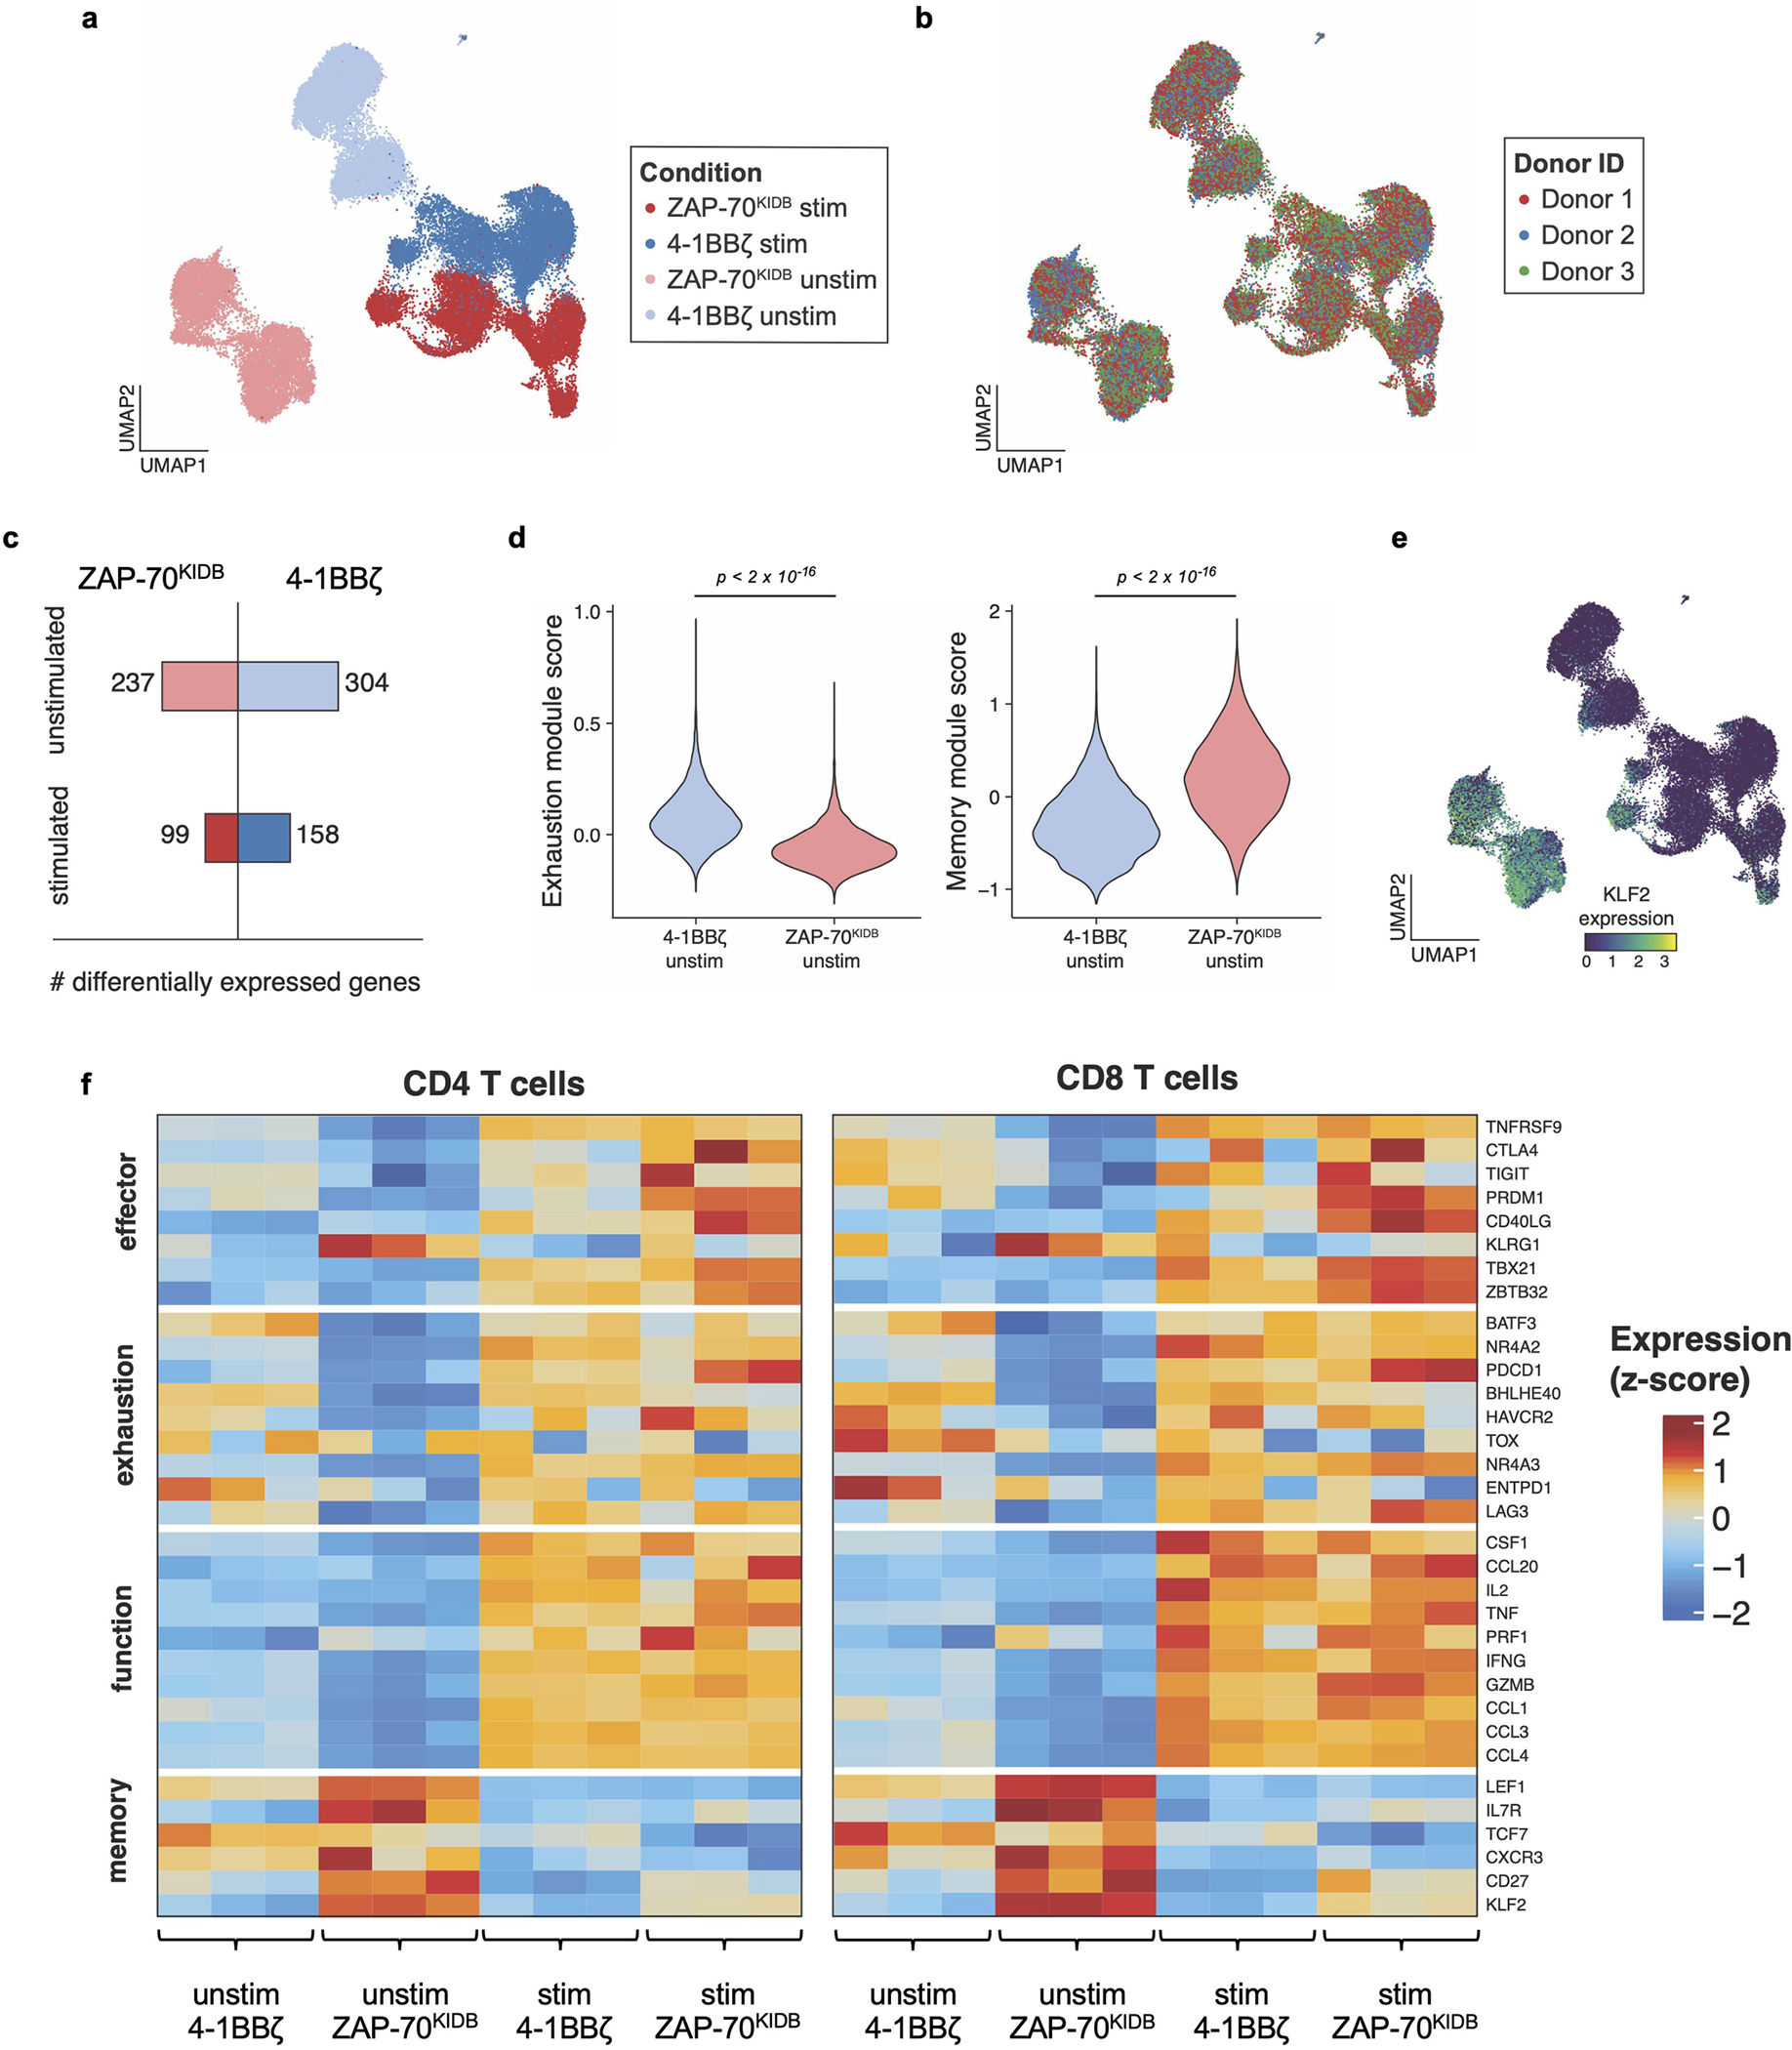
a, Uniform manifold approximation and projection (UMAP) embedding visualization showing overlaid B7-H3-4-1BBζ versus B7-H3-ZAP-70KIDB CAR T cells ± stimulation with B7-H3+Nalm6. b, UMAP embedding visualization showing an overlay annotating the three CAR T cell donors. c, Numbers of differentially expressed genes in B7-H3-4-1BBζ versus B7-H3-ZAP-70KIDB CAR T cells ± stimulation with B7-H3+Nalm6. Differentially expressed genes were defined by a Benjamini–Hochberg adjusted p-value < 0.01 and abs(logFC) > 0.5 from Seurat’s FindMarkers function (two-sided Wilcoxon signed rank test). d, Violin plots characterizing single-cell gene expression modules for T cell exhaustion (left panel; n = 61 genes) and T cell memory signature (right panel; n = 69 genes) in unstimulated B7-H3-4-1BBζ versus B7-H3-ZAP-70KIDB CAR T cells. Module scores were computed using the FindModuleScores function in Seurat. Comparisons were performed with the Mann–Whitney (two-tailed) test. e, UMAP embedding analysis showing KLF2 expression in overlaid B7-H3-4-1BBζ versus B7-H3-ZAP-70KIDB CAR T cells ± stimulation with B7-H3+Nalm6. f, Heat map exhibiting differentially expressed subsets of genes associated with T cell effector, exhaustion, function, and memory signalling pathways in B7-H3-4-1BBζ versus B7-H3-ZAP-70KIDB CAR T cells ± stimulation with B7-H3+Nalm6.
Extended Data Fig. 4 |. ZAP-70KIDB CAR T cells exhibit phosphorylation of key signalling molecules with reduced baseline activation.
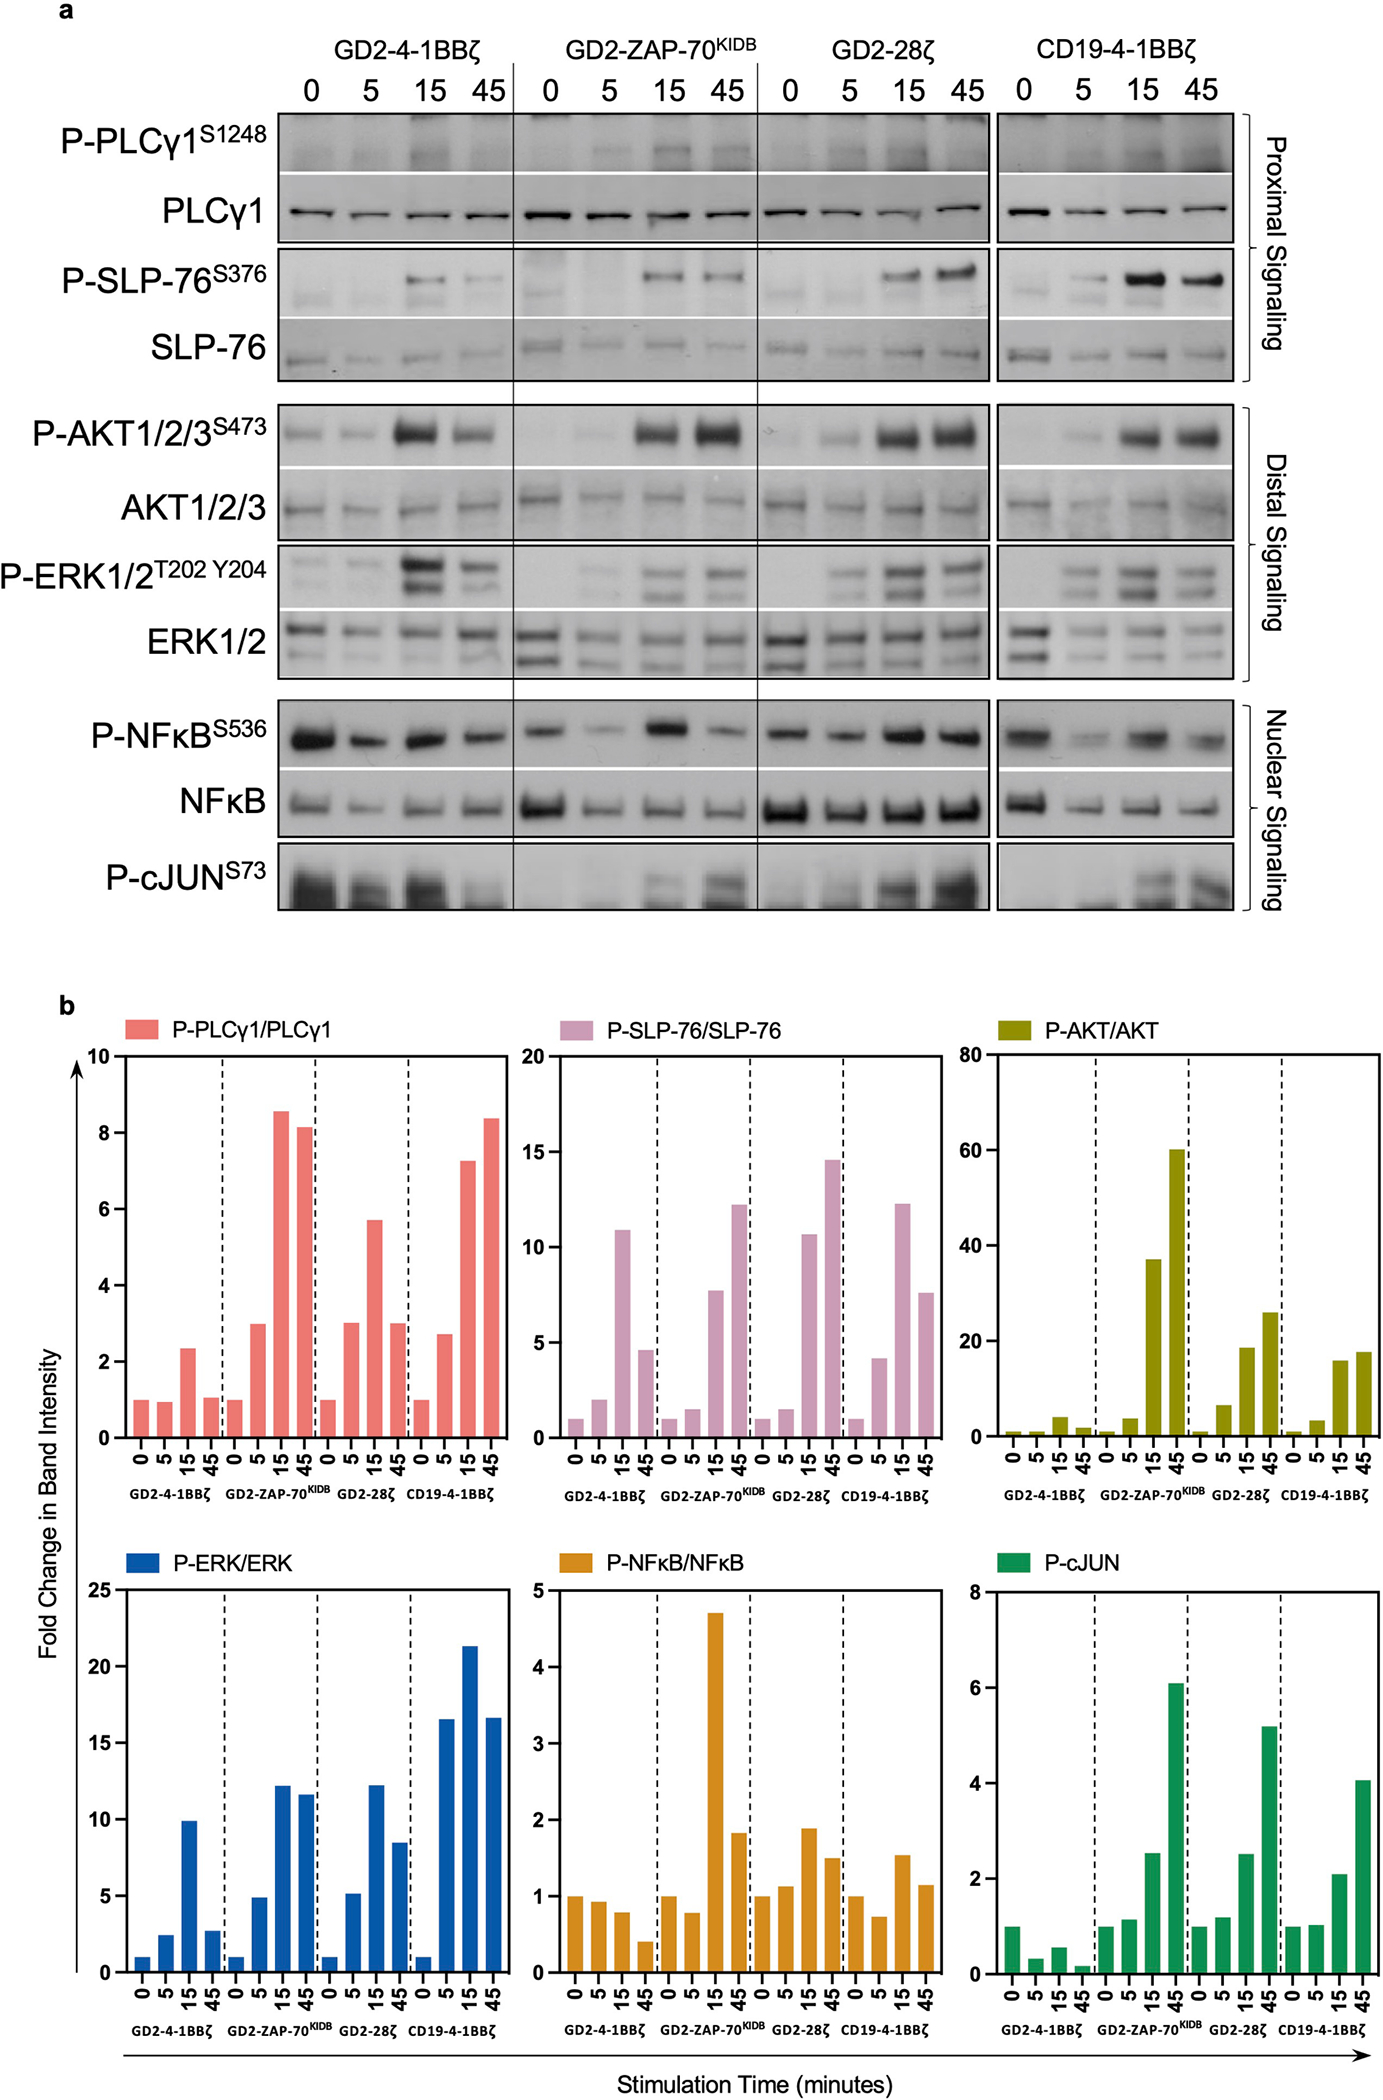
a,b, GD2-4-1BBζ, GD2-ZAP-70KIDB, GD2-CD28ζ and CD19-4-1BBζ CAR T cells were stimulated for 5, 15 or 45 min with anti-idiotype antibody-coated beads at a 4:1 bead to T cell ratio. a, Phospho-PLCg1S1248, total PLCg1, phospho-SLP-76S376, total SLP-76, phospho-AKT1/2/3S473, total AKT1/2/3, phospho-ERK1/2T202 Y204, total ERK1/2, phospho-NF-κBS536, total NF-κB, and phospho-c-JUNS73, were measured by western blot. b, Densitometric quantifications of phosphorylation levels observed in a, normalized to the unstimulated conditions. Intensities of phospho-protein bands were normalized to that of each correspondent total protein. Fold change in band intensity was calculated relative to unstimulated sample. Data in a and b is representative of two experiments with different blood donors. Uncropped data with molecular weight markers is displayed in Supplementary Fig. 2.
Extended Data Fig. 5 |. ZAP-70KIDB CARs depend on ZAP-70 kinase activity on LAT and SLP-76.
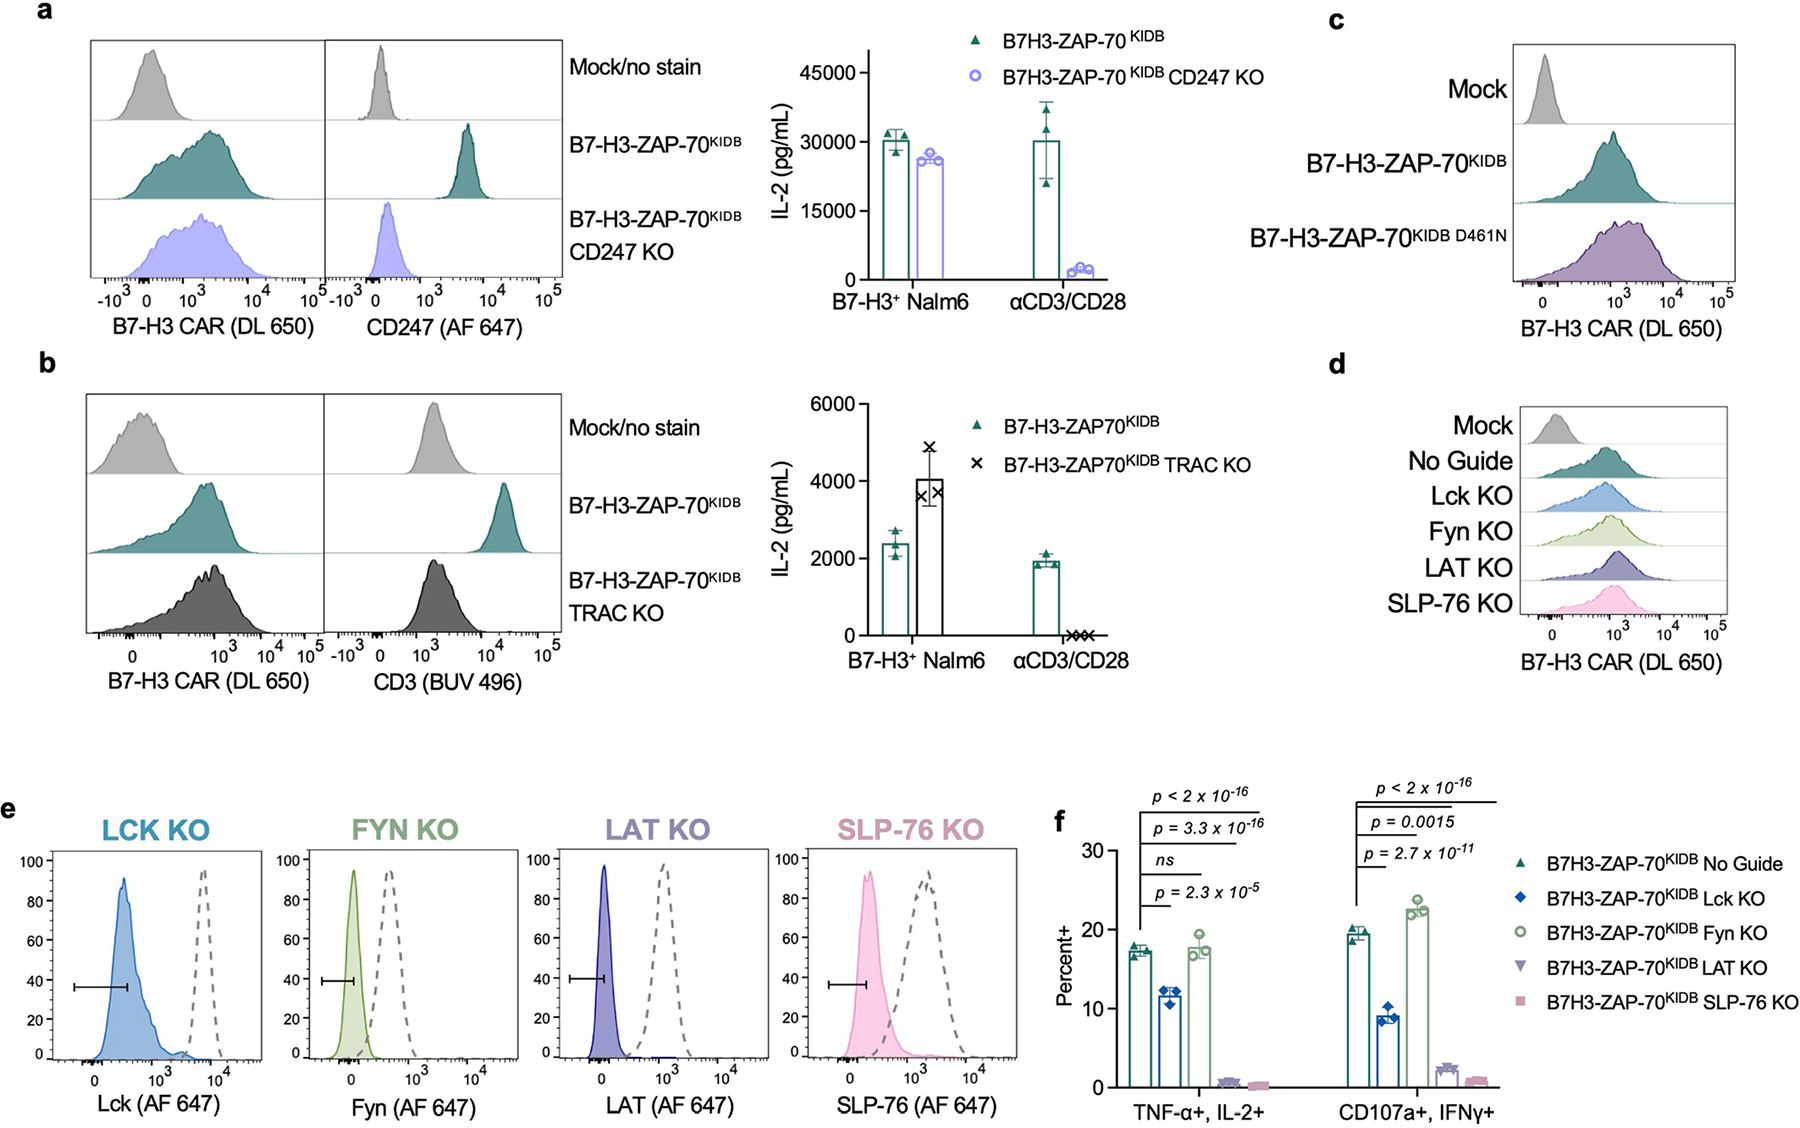
a, Flow cytometric data exhibiting surface CAR and intracellular CD247/CD3ζ expression of B7-H3-ZAP-70KIDB (± CD247 CRISPR–Cas9 knockout) (left panel), and IL-2 secretion (right panel) by B7-H3-ZAP-70KIDB (± CD247 knockout) CAR T cells following co-culture with B7-H3+Nalm6 cells or anti-CD3/anti-CD28 beads. Shown are mean values ± s.d. of three experimental replicates. Performed one time. b, Flow cytometric data exhibiting surface CAR and CD3 expression of B7-H3-ZAP-70KIDB (± TRAC knockout) (left panel), and IL-2 secretion (right panel) by B7-H3-ZAP-70KIDB (± TRAC knockout) CAR T cells following co-culture with B7-H3+Nalm6 cells or anti-CD3/anti-CD28 beads. Shown are mean values ± s.d. of three experimental replicates. Representative of two experiments with different blood donors. c, Flow cytometric data exhibiting the expression of B7-H3-ZAP-70KIDB CARs ± D461N mutation. d, Flow cytometric data exhibiting B7-H3-ZAP-70KIDB CAR expression in unedited and edited T cells prior to stimulation. e, Flow cytometric plots demonstrating knockout efficiencies for proximal signalling molecules in CAR T cells shown in d. f, Quantification of TNF+IL-2+ and CD107a+IFNγ+ populations as shown in Fig. 3h,i. Baseline measurements from the unstimulated controls were subtracted from the stimulated conditions. Shown are mean values ± s.d. of three experimental replicates. Representative of three experiments performed with two different blood donors. Groups were compared via one-way ANOVA with correction for multiple comparisons.
Extended Data Fig. 6 |. LAT and SLP-76 CARs jointly mediate T cell activation.
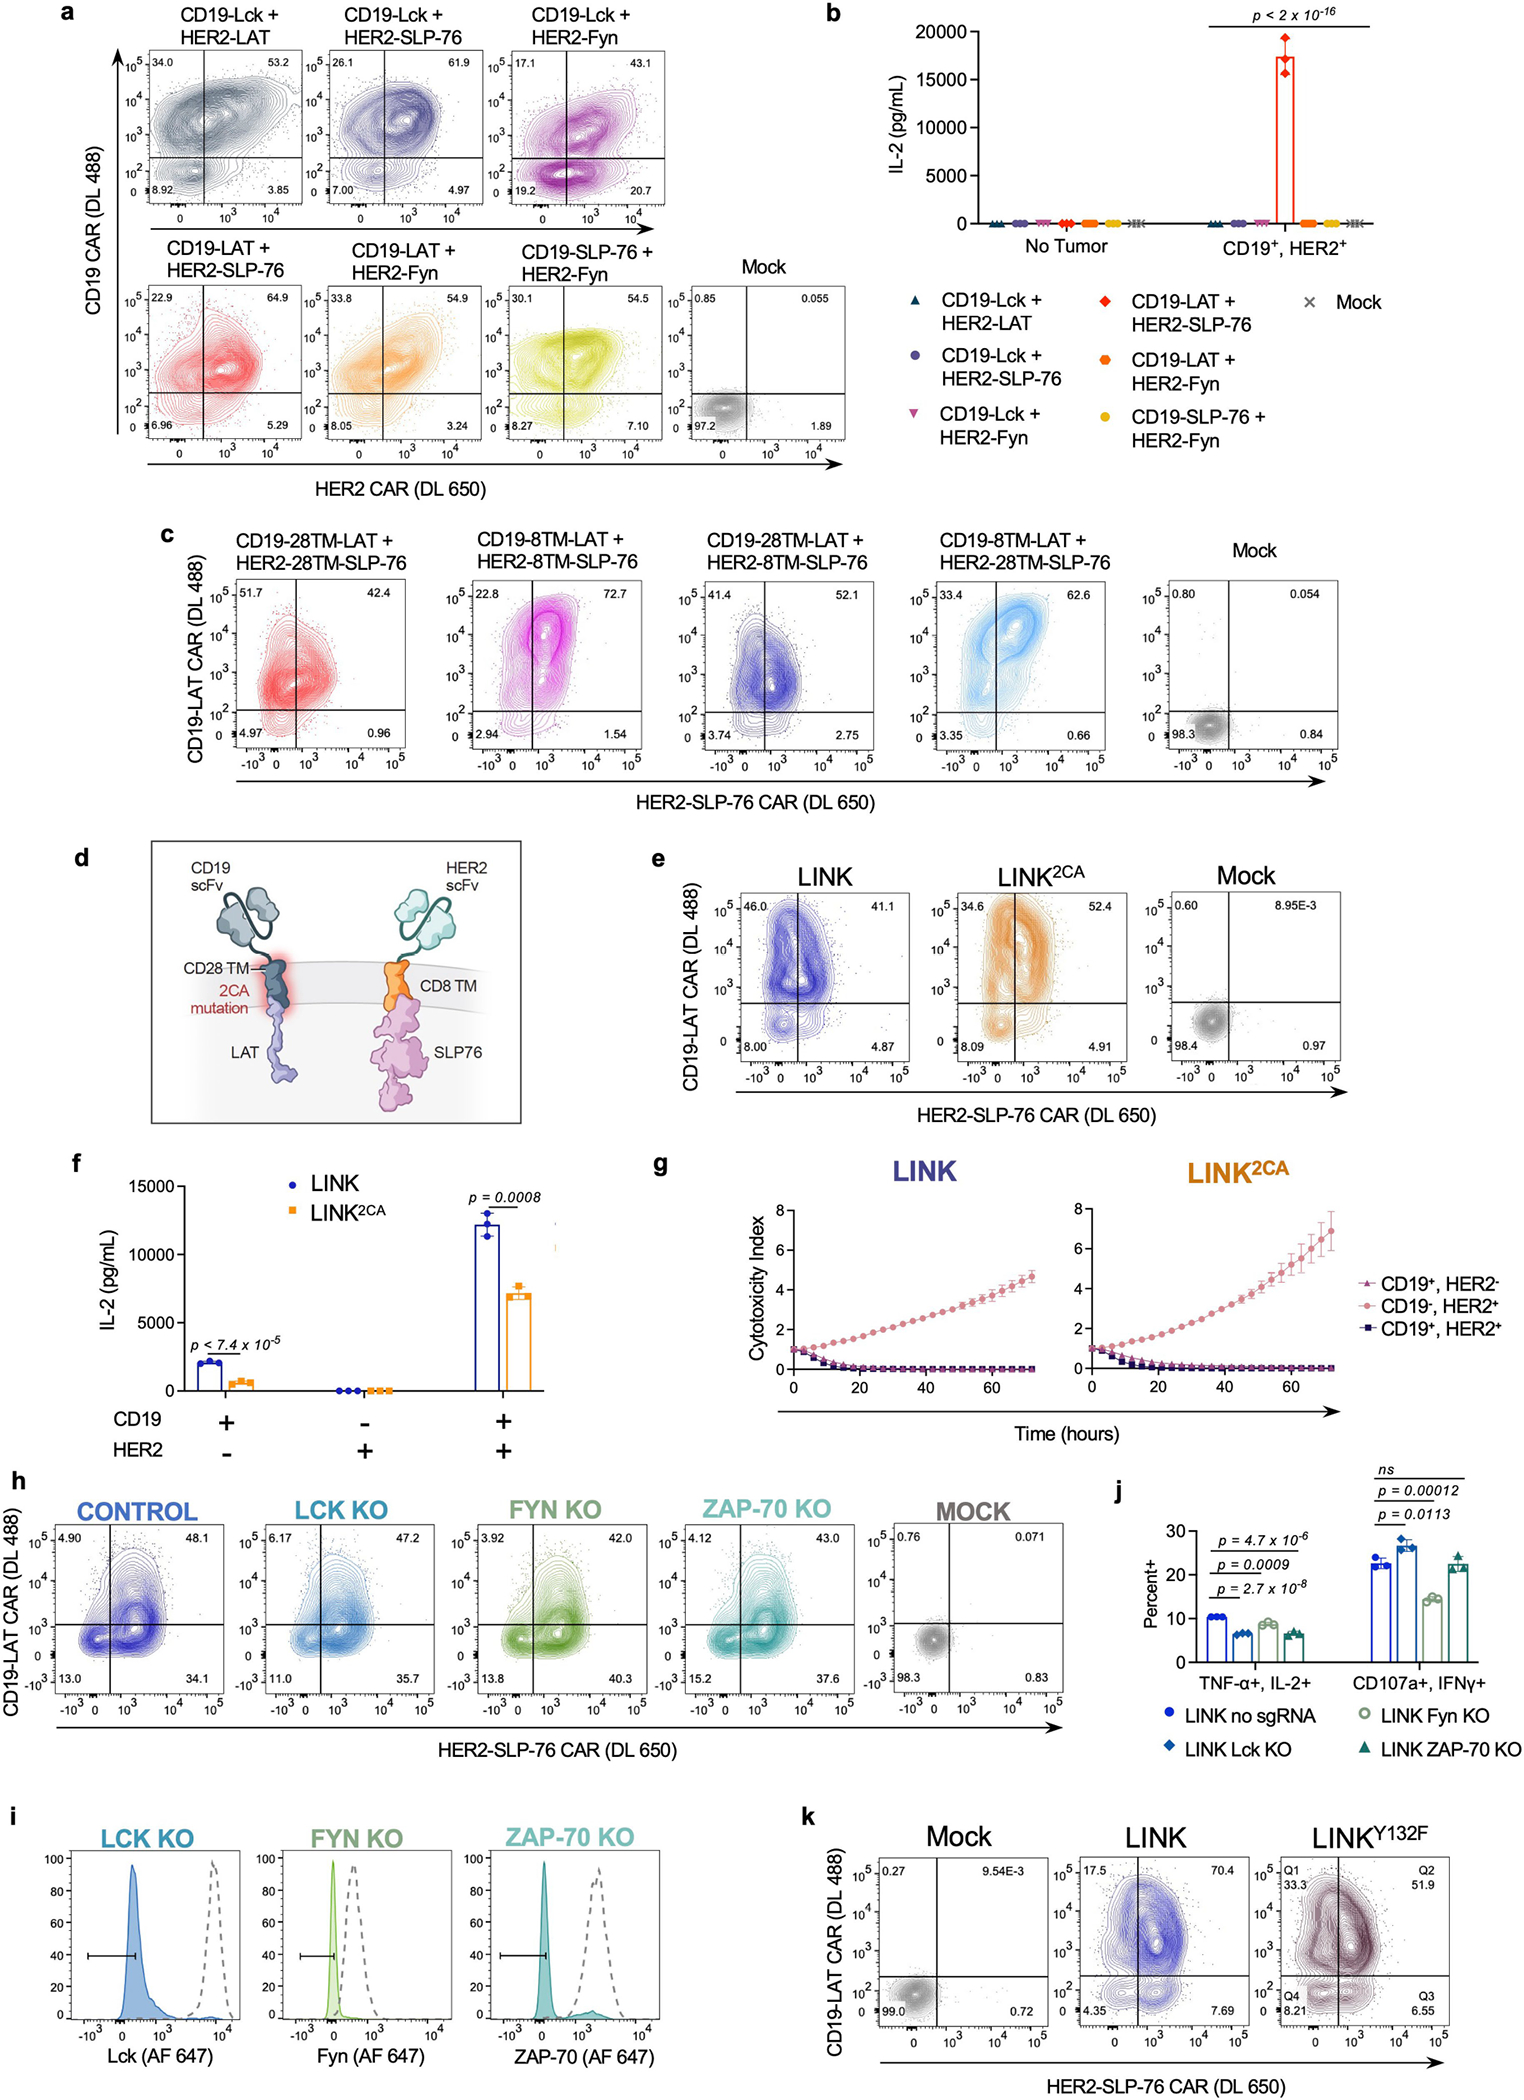
a, Flow cytometric data exhibiting CAR expression of co-transduced CD19 and HER2 proximal signalling CAR (LCK, FYN, LAT, and SLP-76) combinations. b, IL-2 secretion (as measured by ELISA) by T cells shown in a following co-culture with CD19+HER2+Nalm6 cells. Shown are mean values ± s.d. of three experimental replicates. Representative of four experiments performed with three different blood donors. Statistical comparisons performed with one-way ANOVA with correction for multiple comparisons (p < 2 × 10⁻¹⁶ for all comparisons to CD19-LAT + HER2-SLP-76). c, Flow cytometric expression of LAT and SLP-76 CARs on T cells utilized in Fig. 4f,g. d, Schematic illustrating incorporation of a dual Cysteine-to-Alanine (2CA) mutation in the CD28 hinge–TM domain of the LAT CAR component of the LINK system. e, Flow cytometric data exhibiting LINK CAR (±2CA mutation) expression. f,g, IL-2 secretion (f) and tumour cell killing (g) by LINK CAR T cells (±2CA mutation) following co-culture with indicated cell lines. Shown are mean values ± s.d. of three experimental replicates. Representative of eight independent experiments performed with five different blood donors. Comparisons in f performed with unpaired t-test (two-tailed). h, Flow cytometric data exhibiting LINK CAR (CD19-28TM-LAT + HER2-8TM-SLP-76) expression in unedited and edited T cells before stimulation with CD19+HER2+ Nalm6. i, Flow cytometric plots demonstrating knockout efficiencies for proximal signalling molecules in CAR T cells utilized in Fig. 4h,i. j, Quantification of TNF+IL-2+ and CD107a+IFNγ+ populations as shown in Fig. 4h,i. Baseline measurements from the unstimulated controls were subtracted from the stimulated conditions. Shown are mean values ± s.d. of three experimental replicates. Comparisons were performed via one-way ANOVA with correction for multiple comparisons. Representative of two independent experiments with different blood donors. k, Flow cytometric expression of LINK CAR (±LAT Y132F).
Extended Data Fig. 7 |. Disrupting GADS interactions eliminates LINK CAR leakiness.
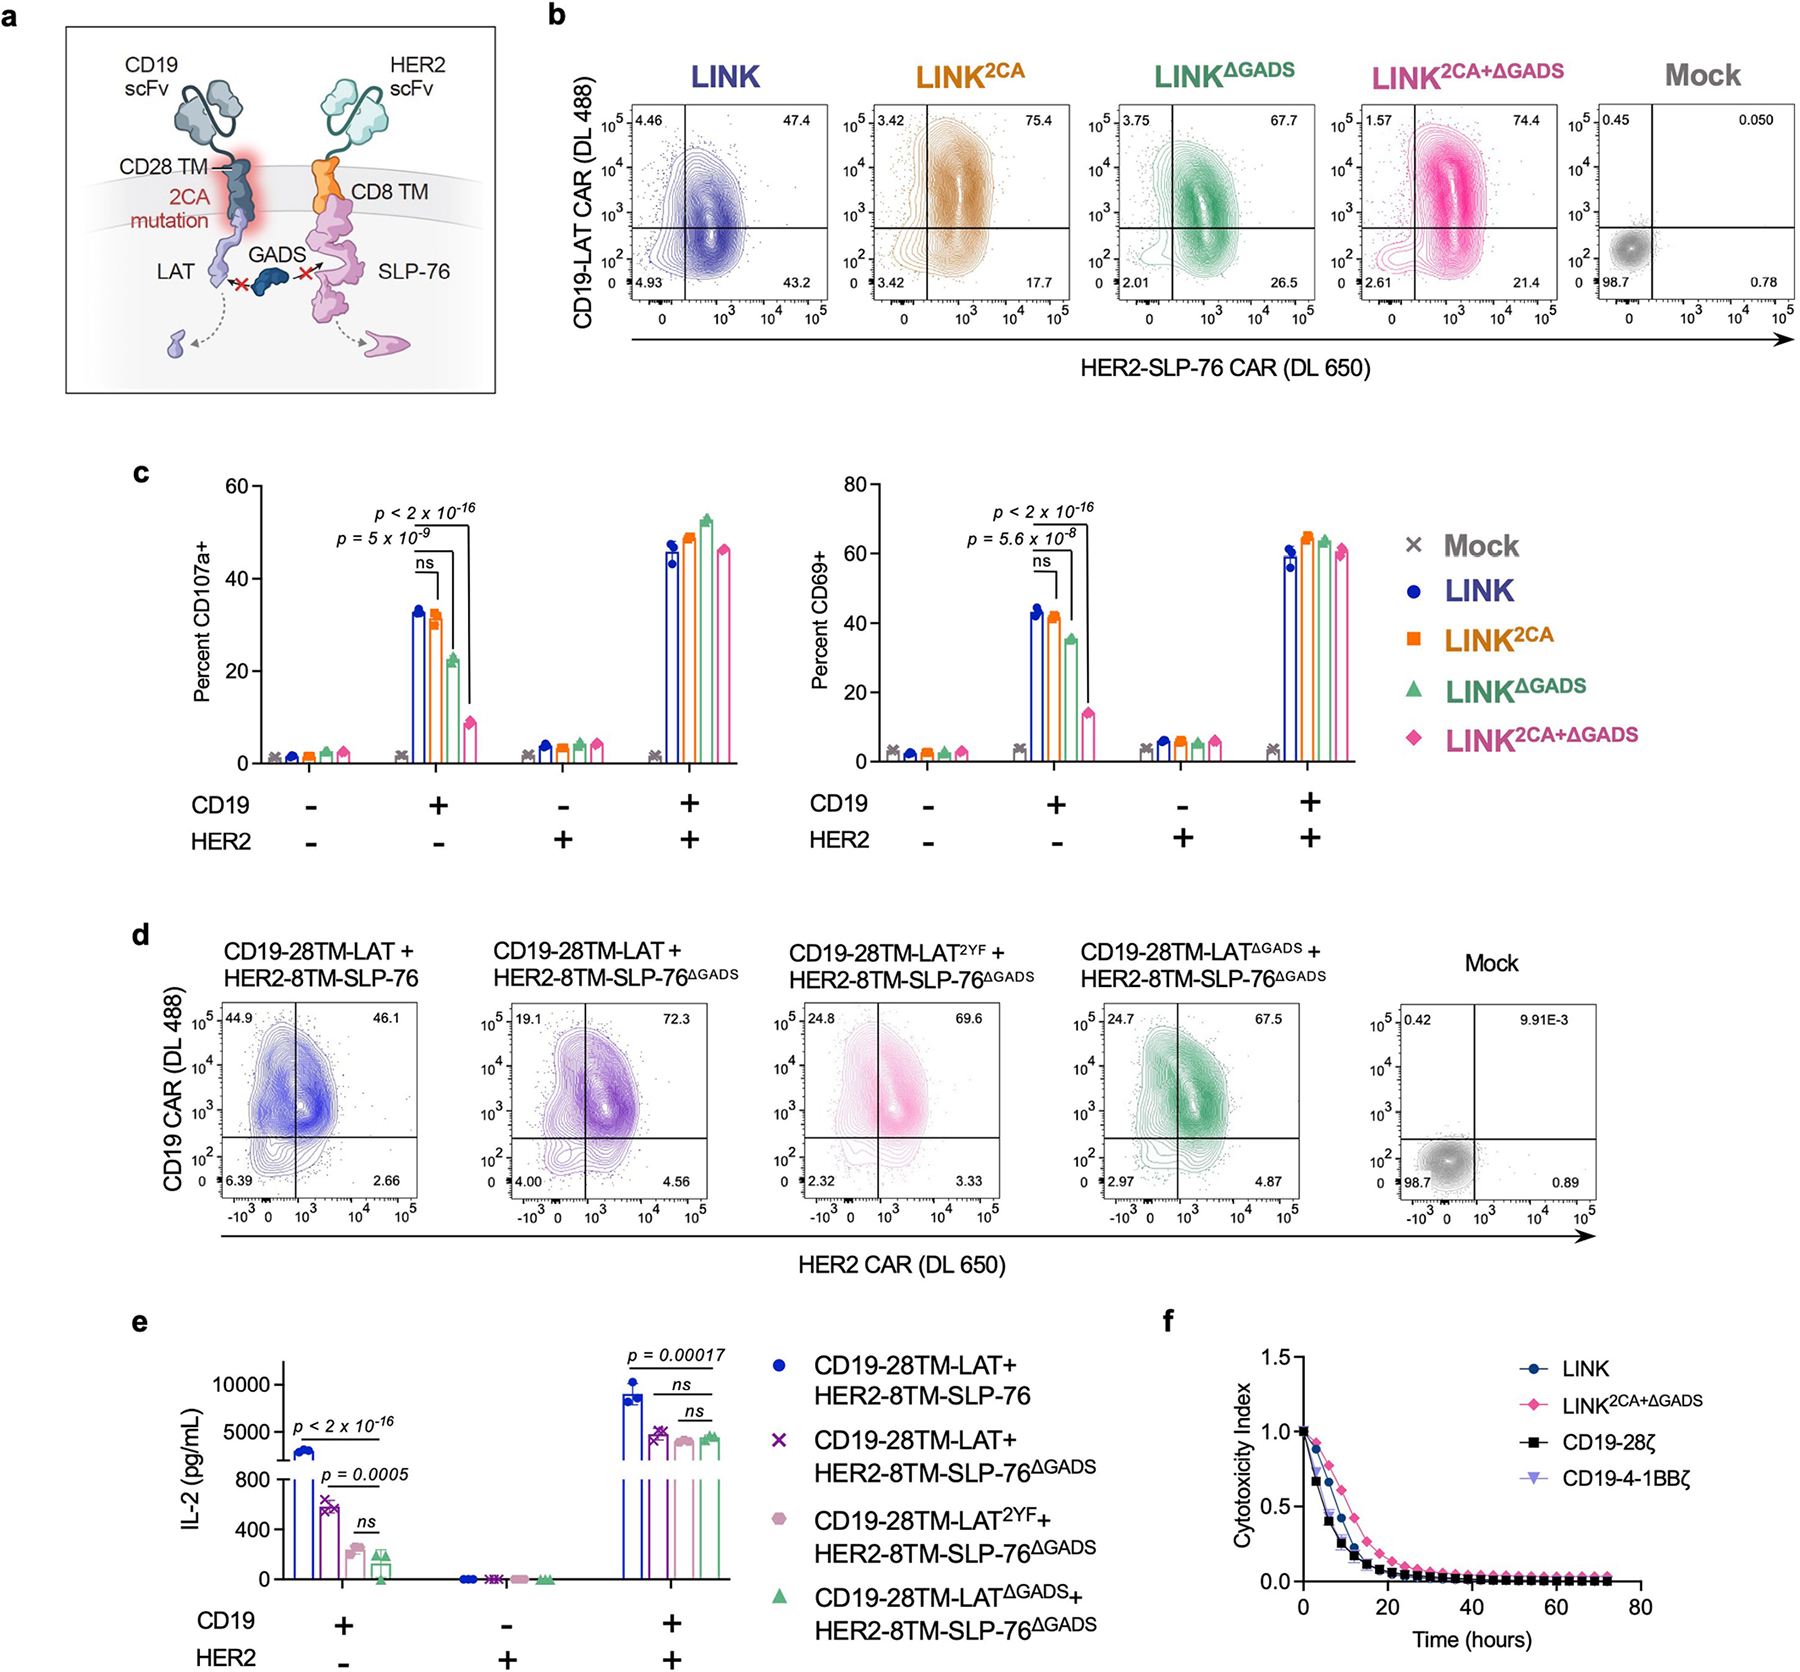
a, Schematic illustrating LINK CAR bearing both the Cysteine-to-Alanine (2CA) mutations and GADS-binding site deletions/truncations (ΔGADS). b, Flow cytometric expression of LINK CARs (±2CA, ±ΔGADS) on T cells utilized in Fig. 5b–d. c, Quantification of CD107a+ and CD69+ on indicated LINK CAR T cells following co-culture with indicated cell lines as shown in Fig. 5d. Representative of five independent experiments with four different blood donors. Shown are mean values ± s.d. of three experimental replicates. Comparisons were performed with one-way ANOVA with correction for multiple comparisons. d, Flow cytometric expression of LINK CAR T cells bearing either Y171F/Y191F point mutations (2YF) or deletion/truncation of the GADS-binding regions (ΔGADS). e, IL-2 secretion (as measured by ELISA) by indicated LINK CAR T cells following co-culture with indicated cell lines shown in Fig. 4c. Representative of two independent experiments with different blood donors. Shown are mean values ± s.d. of three experimental replicates. Note that data for CD19-28TM-LAT + HER2-8TM-SLP-76 and CD19-28TM-LATΔGADS + HER2-8TM-SLP-76ΔGADS conditions are identical to Fig. 5b. Comparisons were performed via one-way ANOVA with correction for multiple comparisons. f, Tumour cell killing of Nalm6 by CD19-CD28ζ, CD19–4-1BBζ, LINK (CD19-28TM-LAT + CD19-8TM-SLP-76), or LINK2CA+ΔGADS (CD19-28TM2CA-LATΔGADS + CD19-8TM-SLP-76ΔGADS) CAR T cells at a 1:1 ratio of T cells to tumour cells. Shown are mean values ± s.d. of three experimental replicates. Representative of three independent experiments with different blood donors.
Extended Data Fig. 8 |. Testing ROR1-targeting CARs in a model of on-target, off-tumour toxicity.
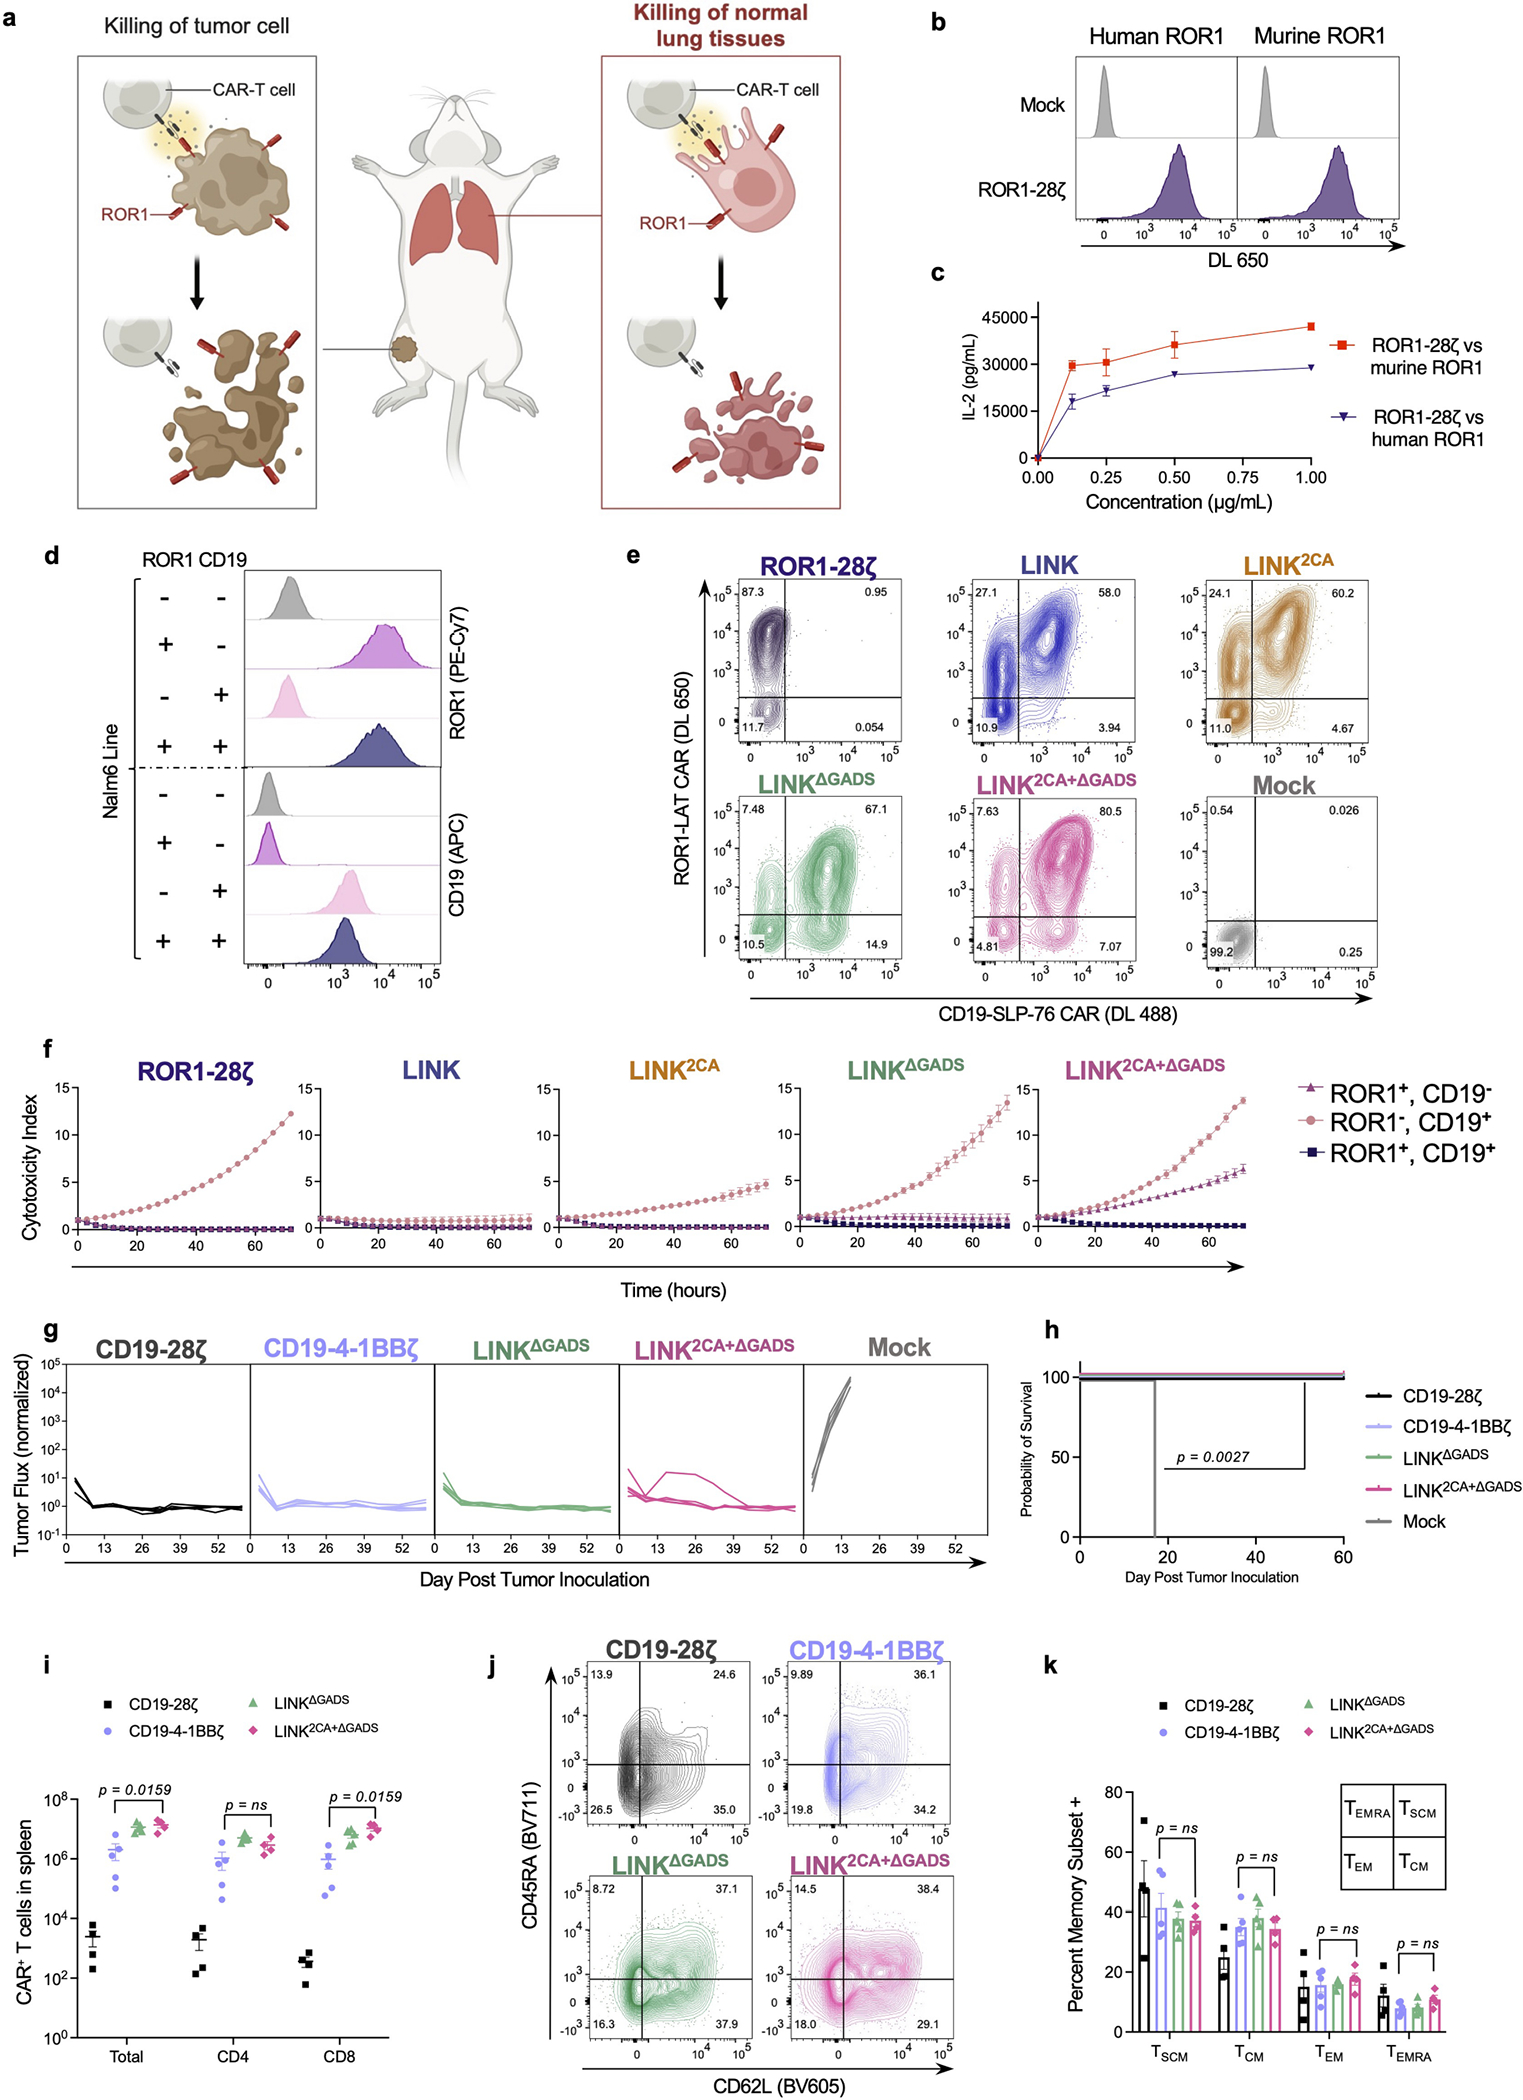
a, Schematic illustrating on-target, off-tumour toxicity in the lungs of tumour-bearing mice treated with ROR1 targeted CAR T cells. b, Flow cytometry plots exhibiting detection of ROR1-CD28ζ CAR on T cells with both recombinant human and mouse ROR1. c, IL-2 secretion (as measured by ELISA) by ROR1-CD28ζ CAR T cells after 24-h incubation with plate-bound human or mouse ROR1 protein at the indicated concentrations. Shown are mean values ± s.d. of three experimental replicates. Representative of three independent experiments with different blood donors. d, ROR1 and CD19 expression on single/double antigen positive Nalm6 lines used for experiments. e, Flow cytometric expression of ROR1-CD28ζ and indicated ROR1-and-CD19-targeted LINK CARs on T cells. f, Tumour cell killing of cell lines shown in d when co-cultured with the indicated CAR T cells at a 2:1 ratio of T cells to tumour cells. Shown are mean values ± s.d. of three experimental replicates. Representative of four independent experiments performed with two different blood donors. g,h, NSG mice bearing ROR1+CD19+Nalm6-luciferase were treated with 3 × 10⁶ CD19-CD28ζ, CD19–4-1BBζ, or indicated LINK CAR T cells 3 days after tumour inoculation. g, Quantification of tumour progression for each individual mouse as measured by flux values acquired by BLI, normalized to tumour-free mice. h, Survival curves for mice bearing tumours shown in g. Performed once with n = 5 mice per group. Comparisons performed by the log-rank test. i–k, NSG mice bearing ROR1+CD19+Nalm6-luciferase were treated with 8 × 10⁶ of the indicated CAR+ T cells three days after tumour inoculation. i, Absolute number of CAR+ T cells recovered from spleens on day 28 post treatment. j, Representative flow cytometric plots and k, quantification of CAR+ T central memory cells (TCM, CD45RA−CD62L+), T stem cell memory cells (TSCM, CD45RA+CD62L+), T effector memory cells (TEM, CD45RA−CD62L−), and T effector memory CD45RA+ cells (TEMRA, CD45RA+CD62L−) recovered from the spleens on day 28 post treatment. Data shown in i,k are mean values ± s.e.m. Performed one time with n = 5 mice (CD19–4-1BBζ and LINKΔGADS) or n = 4 mice (CD19-CD28ζ and LINK2CA+ΔGADS) per group. Comparisons made with the Mann–Whitney test (two-tailed).
Extended Data Fig. 9 |. Both the LAT and SLP-76 components of LINK CAR protect normal tissues expressing shared antigens.
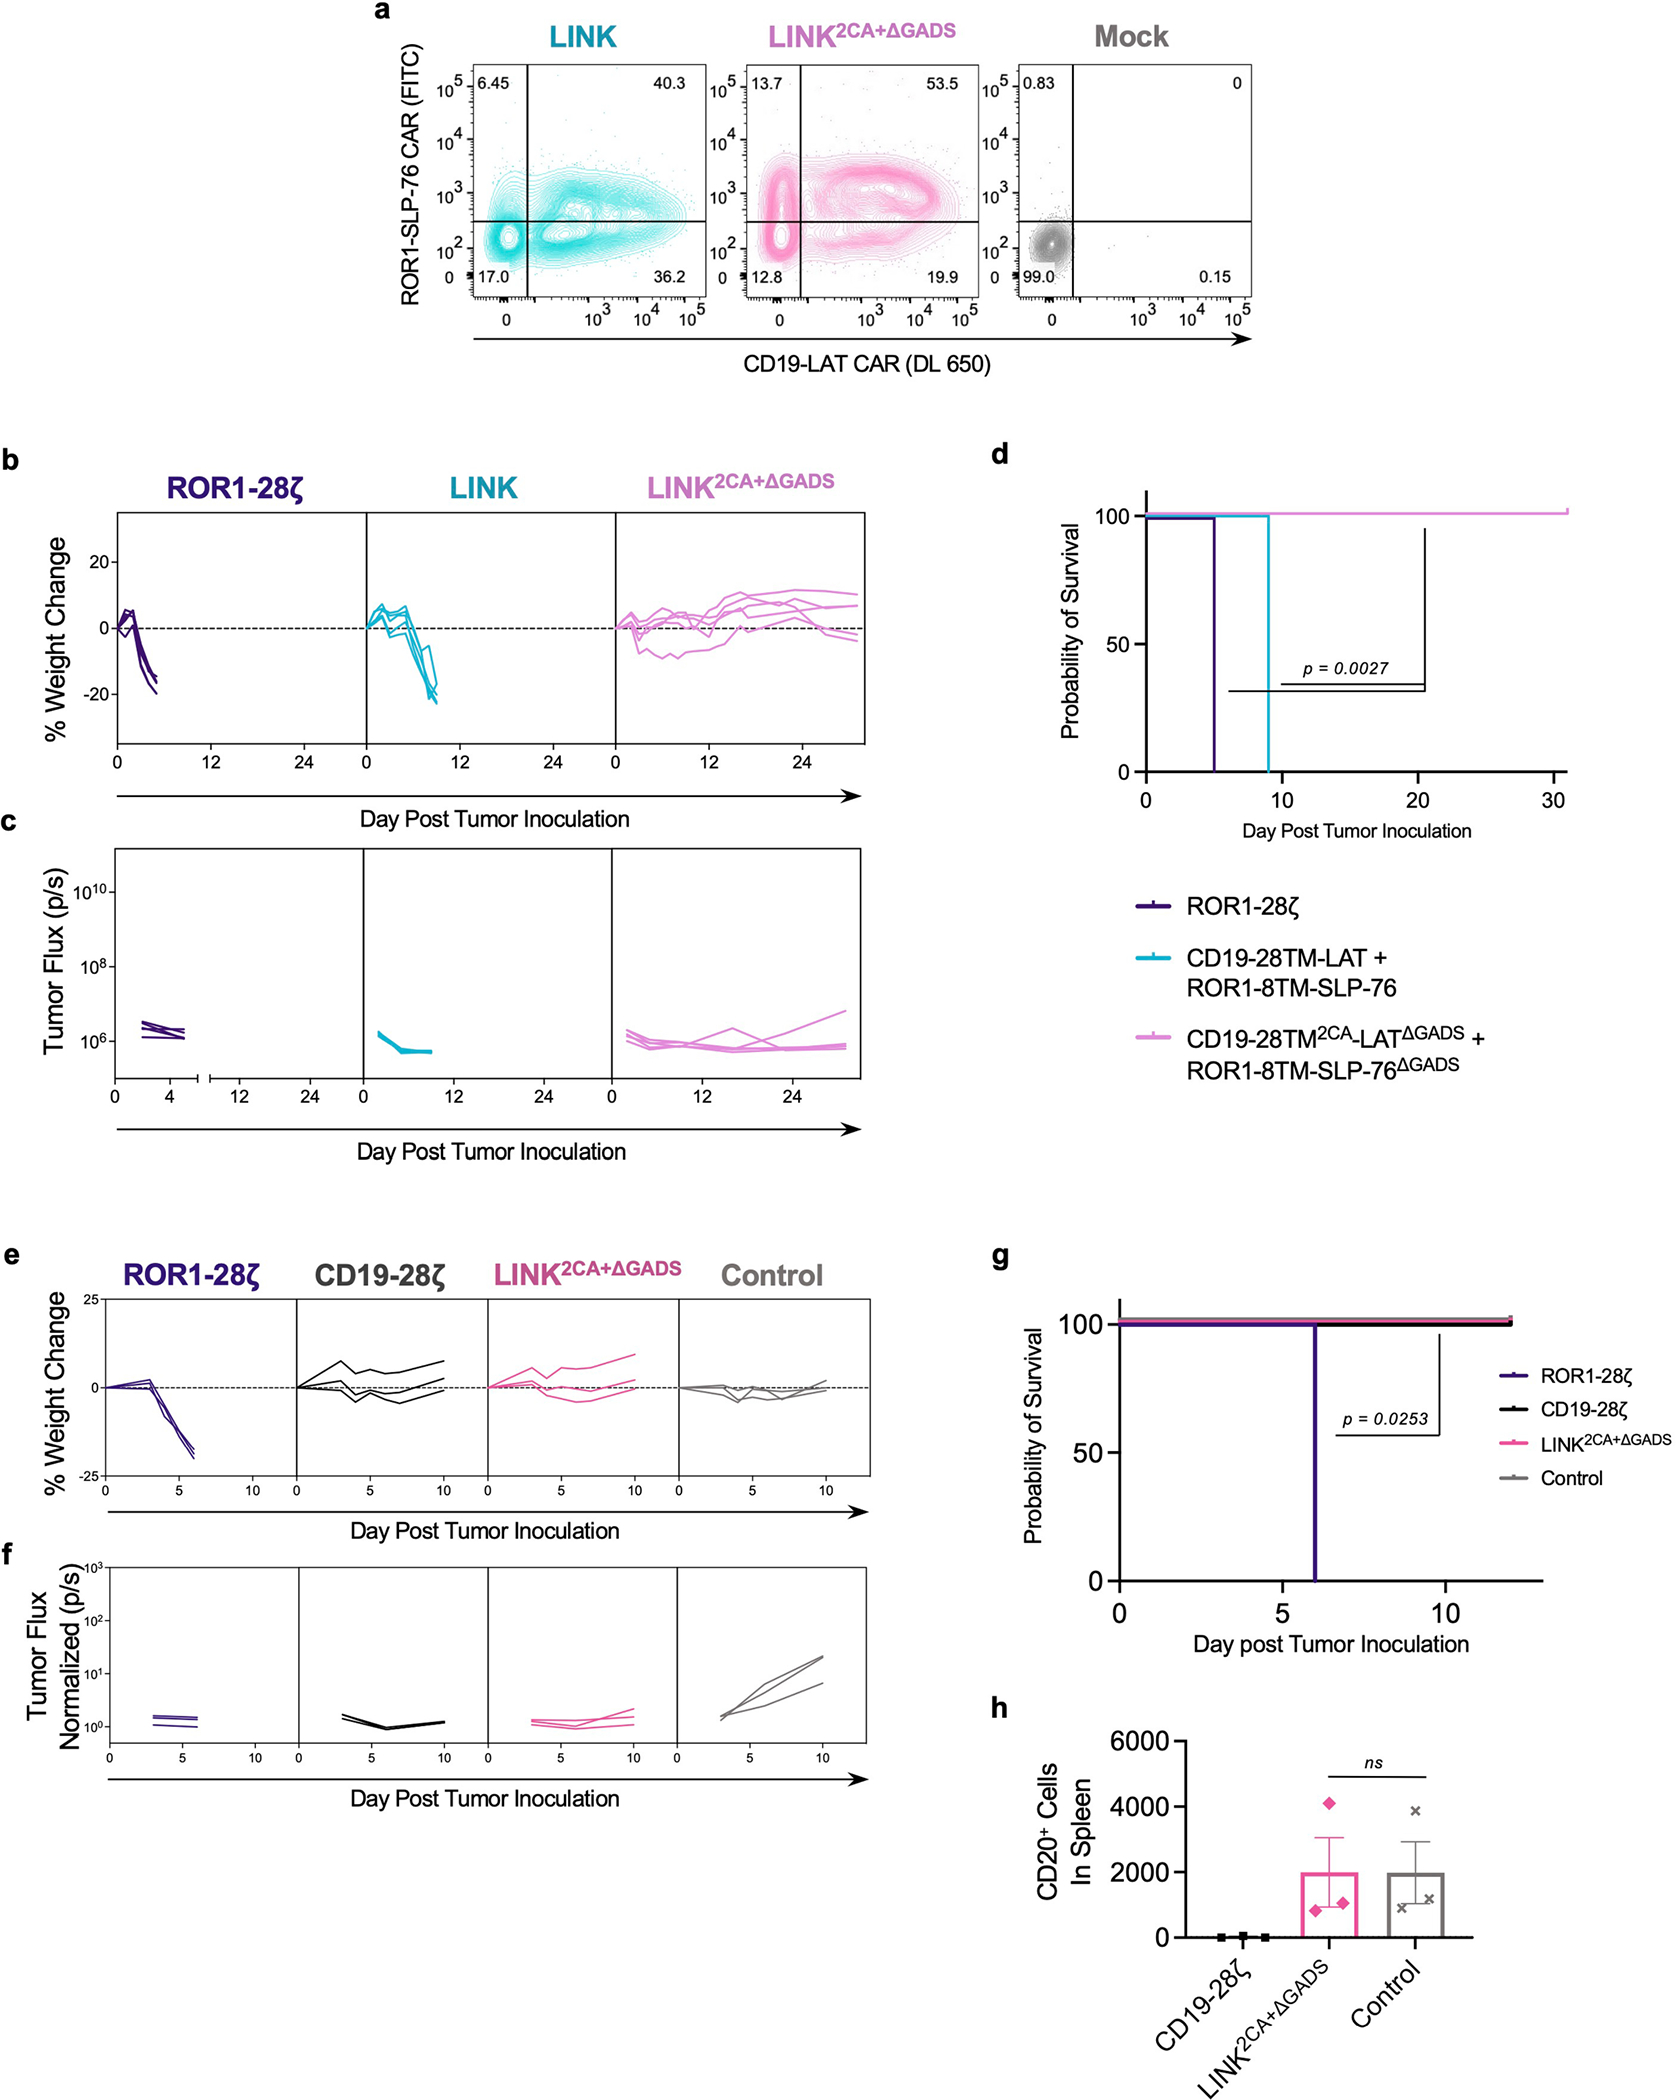
a, Flow cytometric expression of ROR1-and-CD19-targeted LINK CARs on T cells. b-d, NSG mice bearing ROR1+CD19+Nalm6-luciferase were treated with 8 × 10⁶ of the indicated LINK CAR T cells with the SLP-76 CAR bearing specificity for ROR1 on D+2 following tumour inoculation. b, Weights for individual mice over time plotted as a percentage of the weight on day 0. c, Quantification of tumour progression for each individual mouse as measured by flux values acquired by BLI. (d) Survival curves for mice bearing tumours shown in b,c. Comparisons were performed with the log-rank test. b–d was performed once with n = 5 mice per group. e–h, To assess on-target, off-tumour toxicity against normal B cells, NSG mice that had been intravenously injected with 2 × 10⁶ human B cells on D-7 and ROR1+CD19+Nalm6-luciferase cells on D-3 were infused with 8 × 10⁶ CD19-CD28ζ, LINK2CA+ΔGADS, or control (anti-CD19 scFv tethered to a CD8 hinge–TM with no signalling domain) CAR T cells from the same blood donor on D0. e, Weights for individual mice over time plotted as a percentage of the weight on day 0. f, Quantification of tumour progression for each individual mouse as measured by flux values acquired by BLI, normalized to tumour-free mice. g, Survival curves for mice bearing tumours shown in e-f. Comparisons performed by the log-rank test. h, Absolute number of CD20+ B cells recovered from the spleens of mice depicted in e-g on day 9 following treatment. Shown are mean values ± s.e.m. for n = 3 mice per group. Comparisons performed with the Mann–Whitney test (two-tailed). Data is representative of three different blood donors.
Extended Data Fig. 10 |. LINK CAR outperforms both the SynNotch and the SPLIT CAR system.
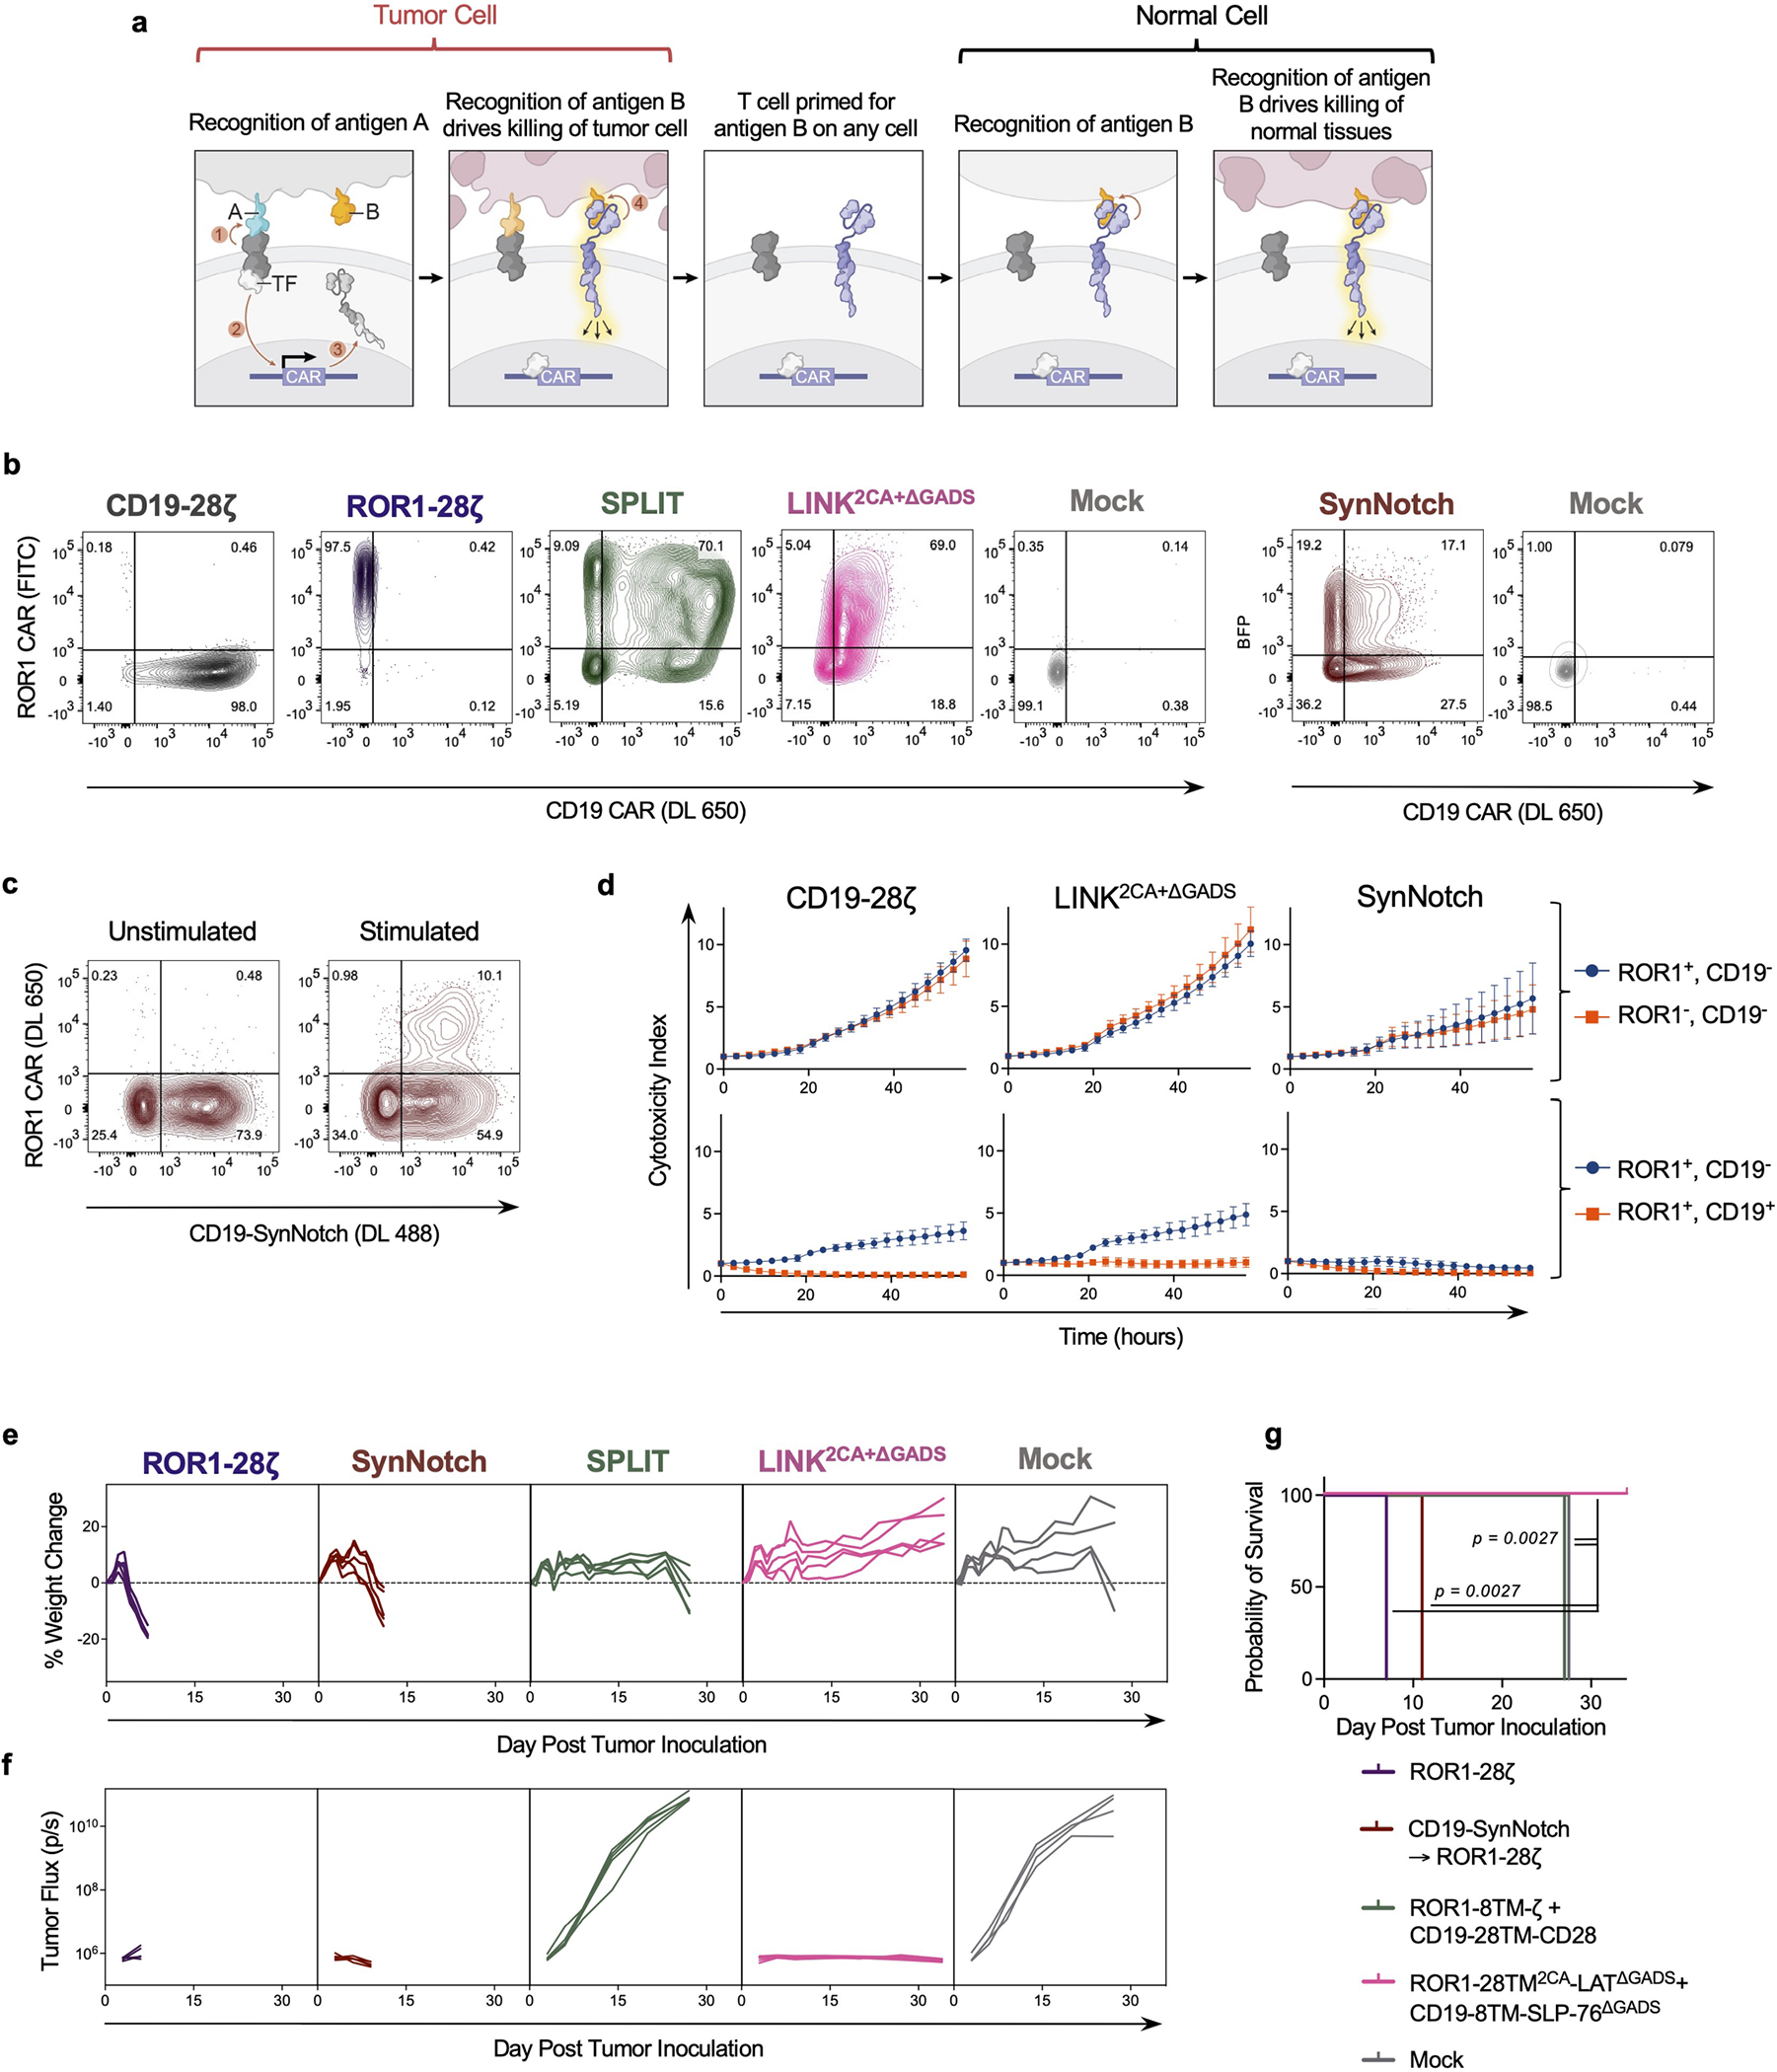
a, Schematic illustrating the potential for on-target, off-tumour toxicity for SynNotch CAR T cells. b, Flow cytometric expression of CD19-CD28ζ, ROR1-CD28ζ, ROR1-and-CD19-targeted LINK2CA+ΔGADS, SPLIT (ROR1-8TM-ζ + CD19-28TM-CD28), and SynNotch (CD19-SynNotch → ROR1-CD28ζ) CARs on T cells day 10 after activation. c, Inducible ROR1-CD28ζ CAR expression (detected with recombinant ROR1 protein) following stimulation through the CD19-SynNotch receptor after a 24-h co-culture with CD19+Nalm6. d, Killing of bystander ROR1+CD19− Nalm6-GFP either in the presence of ROR1−CD19− Nalm6-TdTomato (top panel) or ROR1+CD19+ Nalm6-TdTomato (bottom panel) by CD19-CD28ζ, LINK, or SynNotch CAR T cells on day 10 post T cell activation. Shown are mean values ± s.e.m. from four independent experiments with different blood donors. e–g, NSG mice bearing ROR1+CD19+Nalm6-luciferase were treated with 8 × 10⁶ of the indicated CAR+ T cells three days after tumour inoculation. e, Weights for individual mice over time plotted as a percentage of the weight on day 0. f, Quantification of tumour progression for each individual mouse as measured by flux values acquired by BLI. g, Survival curves for mice bearing tumours shown in e,f. Comparisons performed with the log-rank test. Note: e–g is a repeat with a different blood donor of the experiment shown in Fig. 6d–f but without the CD19-CD28ζ group. n = 5 mice per group (n = 4 mice for Mock).
Supplementary Material
Acknowledgements
This work was funded in part by the NIH Director’s New Innovator Award (DP2 CA272092 to R.G.M.), the Parker Institute for Cancer Immunotherapy (R.G.M., C.L.M., A.T.S., E.W.W. and C.L.) and a Lloyd J. Old STAR Award from the Cancer Research Insitute (A.T.S.). E.W.W. is supported by a Bridge Fellow Award from the Parker Institute for Cancer Immunotherapy. C.L. is supported by a Stanford Science Fellowship, a Parker Scholarship and NHGRI K99HG012579. We thank H. Chang for insightful comments, and SciStories (S. Knemeyer, V. Yeung and S. M. Suh) for providing the schematics (Figs. 1, 2, 4 and 5 and Extended Data Figs. 1, 6–8 and 10) and consulting on figure design.
Footnotes
Competing interests A.M.T., R.G.M., M.C.R., L.L. and C.L.M. are inventors on a pending patent application (PCT/US2022/017544, applicant: The Board of Trustees of the Leland Stanford Junior University) for the novel CARs described in this manuscript. R.G.M. and C.L.M. are co-founders of and hold equity in Link Cell Therapies. R.G.M., C.L.M. and L.L. are co-founders of and hold equity in Cargo Therapeutics (formerly Syncopation Life Sciences). C.L.M. is a co-founder of and holds equity in Lyell Immunopharma. R.G.M., L.L. and E.W.W. are consultants for and hold equity in Lyell Immunopharma. S.P.R. is a former employee of and holds equity in Lyell Immunopharma. R.G.M. is a consultant for NKarta, Arovella Pharmaceuticals, Innervate Radiopharmaceuticals, GammaDelta Therapeutics, Aptorum Group, Zai Labs, Immunai, Gadeta, FATE Therapeutics (DSMB) and Waypoint Bio. A.T.S. is a founder of Immunai and Cartography Biosciences and receives research funding from Allogene Therapeutics and Merck Research Laboratories. C.L. is a consultant for Cartography Biosciences. A.M.T. and M.C.R. are consultants for and hold equity in Link Cell Therapies. A.M.T. is a consultant for and holds equity in Cargo Therapeutics (formerly Syncopation Life Sciences). E.W.W. is a consultant for and holds equity in VISTAN Health and consults for Umoja Biopharma. The remaining authors declare no competing interests.
Additional information
Supplementary information The online version contains supplementary material available at https://doi.org/10.1038/s41586-023-05778-2.
Springer Nature or its licensor (e.g. a society or other partner) holds exclusive rights to this article under a publishing agreement with the author(s) or other rightsholder(s); author self-archiving of the accepted manuscript version of this article is solely governed by the terms of such publishing agreement and applicable law.
References
- 1.Majzner RG & Mackall CL Clinical lessons learned from the first leg of the CAR T cell journey. Nat. Med. 25, 1341–1355 (2019). [DOI] [PubMed] [Google Scholar]
- 2.June CH & Sadelain M Chimeric antigen receptor therapy. N. Engl. J. Med. 379, 64–73 (2018). [DOI] [PMC free article] [PubMed] [Google Scholar]
- 3.Kloss CC, Condomines M, Cartellieri M, Bachmann M & Sadelain M Combinatorial antigen recognition with balanced signaling promotes selective tumor eradication by engineered T cells. Nat. Biotechnol. 31, 71–75 (2013). [DOI] [PMC free article] [PubMed] [Google Scholar]
- 4.Roybal KT et al. Engineering T cells with customized therapeutic response programs using synthetic Notch receptors. Cell 167, 419–432 (2016). [DOI] [PMC free article] [PubMed] [Google Scholar]
- 5.Fedorov VD, Themeli M & Sadelain M PD-1- and CTLA-4-based inhibitory chimeric antigen receptors (iCARs) divert off-target immunotherapy responses. Sci. Transl Med. 5, 215ra172 (2013). [DOI] [PMC free article] [PubMed] [Google Scholar]
- 6.Srivastava S et al. Logic-gated ROR1 chimeric antigen receptor expression rescues T cell-mediated toxicity to normal tissues and enables selective tumor targeting. Cancer Cell 35, 489–503 (2019). [DOI] [PMC free article] [PubMed] [Google Scholar]
- 7.Maldini CR, Ellis GI & Riley JL CAR T cells for infection, autoimmunity and allotransplantation. Nat. Rev. Immunol. 18, 605–616 (2018). [DOI] [PMC free article] [PubMed] [Google Scholar]
- 8.Amor C et al. Senolytic CAR T cells reverse senescence-associated pathologies. Nature 583, 127–132 (2020). [DOI] [PMC free article] [PubMed] [Google Scholar]
- 9.Larson RC & Maus MV Recent advances and discoveries in the mechanisms and functions of CAR T cells. Nat. Rev. Cancer 21, 145–161 (2021). [DOI] [PMC free article] [PubMed] [Google Scholar]
- 10.Majzner RG et al. Tuning the antigen density requirement for CAR T-cell activity. Cancer Discov. 10, 702–723 (2020). [DOI] [PMC free article] [PubMed] [Google Scholar]
- 11.Salter AI et al. Comparative analysis of TCR and CAR signaling informs CAR designs with superior antigen sensitivity and in vivo function. Sci. Signal. 14, eabe2606 (2021). [DOI] [PMC free article] [PubMed] [Google Scholar]
- 12.Labanieh L, Majzner RG & Mackall CL Programming CAR-T cells to kill cancer. Nat. Biomed. Eng. 2, 377–391 (2018). [DOI] [PubMed] [Google Scholar]
- 13.Rafiq S, Hackett CS & Brentjens RJ Engineering strategies to overcome the current roadblocks in CAR T cell therapy. Nat. Rev. Clin. Oncol. 17, 147–167 (2020). [DOI] [PMC free article] [PubMed] [Google Scholar]
- 14.Eshhar Z, Waks T, Gross G & Schindler DG Specific activation and targeting of cytotoxic lymphocytes through chimeric single chains consisting of antibody-binding domains and the gamma or zeta subunits of the immunoglobulin and T-cell receptors. Proc. Natl Acad. Sci. USA 90, 720–724 (1993). [DOI] [PMC free article] [PubMed] [Google Scholar]
- 15.Romeo C & Seed B Cellular immunity to HIV activated by CD4 fused to T cell or Fc receptor polypeptides. Cell 64, 1037–1046 (1991). [DOI] [PubMed] [Google Scholar]
- 16.Irving BA & Weiss A The cytoplasmic domain of the T cell receptor zeta chain is sufficient to couple to receptor-associated signal transduction pathways. Cell 64, 891–901 (1991). [DOI] [PubMed] [Google Scholar]
- 17.Frank SJ et al. Structural mutations of the T cell receptor zeta chain and its role in T cell activation. Science 249, 174–177 (1990). [DOI] [PubMed] [Google Scholar]
- 18.Finney HM, Lawson AD, Bebbington CR & Weir AN Chimeric receptors providing both primary and costimulatory signaling in T cells from a single gene product. J. Immunol. 161, 2791–2797 (1998). [PubMed] [Google Scholar]
- 19.Pegram HJ et al. Tumor-targeted T cells modified to secrete IL-12 eradicate systemic tumors without need for prior conditioning. Blood 119, 4133–4141 (2012). [DOI] [PMC free article] [PubMed] [Google Scholar]
- 20.Kloss CC et al. Dominant-negative TGF-β receptor enhances PSMA-targeted human CAR T cell proliferation and augments prostate cancer eradication. Mol. Ther. 26, 1855–1866 (2018). [DOI] [PMC free article] [PubMed] [Google Scholar]
- 21.Lynn RC et al. c-Jun overexpression in CAR T cells induces exhaustion resistance. Nature 576, 293–300 (2019). [DOI] [PMC free article] [PubMed] [Google Scholar]
- 22.Zhao Y et al. A herceptin-based chimeric antigen receptor with modified signaling domains leads to enhanced survival of transduced T lymphocytes and antitumor activity. J. Immunol. 183, 5563–5574 (2009). [DOI] [PMC free article] [PubMed] [Google Scholar]
- 23.Feucht J et al. Calibration of CAR activation potential directs alternative T cell fates and therapeutic potency. Nat. Med. 25, 82–88 (2019). [DOI] [PMC free article] [PubMed] [Google Scholar]
- 24.Lamers CH et al. Treatment of metastatic renal cell carcinoma with CAIX CAR-engineered T cells: clinical evaluation and management of on-target toxicity. Mol. Ther. 21, 904–912 (2013). [DOI] [PMC free article] [PubMed] [Google Scholar]
- 25.Lamers CH et al. Treatment of metastatic renal cell carcinoma with autologous T-lymphocytes genetically retargeted against carbonic anhydrase IX: first clinical experience. J. Clin. Oncol. 24, e20–e22 (2006). [DOI] [PubMed] [Google Scholar]
- 26.Courtney AH, Lo WL & Weiss A TCR signaling: mechanisms of initiation and propagation. Trends Biochem. Sci. 43, 108–123 (2018). [DOI] [PMC free article] [PubMed] [Google Scholar]
- 27.Palacios EH & Weiss A Function of the Src-family kinases, Lck and Fyn, in T-cell development and activation. Oncogene 23, 7990–8000 (2004). [DOI] [PubMed] [Google Scholar]
- 28.Stein PL, Lee HM, Rich S & Soriano P pp59fyn mutant mice display differential signaling in thymocytes and peripheral T cells. Cell 70, 741–750 (1992). [DOI] [PubMed] [Google Scholar]
- 29.Yamakami K, Akao S, Wakabayashi K, Tadakuma T & Yoshizawa N Mice lacking protein tyrosine kinase fyn develop a T helper-type 1 response and resist Leishmania major infection. Environ. Health Prev. Med. 6, 132–135 (2001). [DOI] [PMC free article] [PubMed] [Google Scholar]
- 30.Ledbetter JA et al. CD28 ligation in T-cell activation: evidence for two signal transduction pathways. Blood 75, 1531–1539 (1990). [PubMed] [Google Scholar]
- 31.Zhao Q, Williams BL, Abraham RT & Weiss A Interdomain B in ZAP-70 regulates but is not required for ZAP-70 signaling function in lymphocytes. Mol. Cell. Biol. 19, 948–956 (1999). [DOI] [PMC free article] [PubMed] [Google Scholar]
- 32.Long AH et al. 4-1BB costimulation ameliorates T cell exhaustion induced by tonic signaling of chimeric antigen receptors. Nat. Med. 21, 581–590 (2015). [DOI] [PMC free article] [PubMed] [Google Scholar]
- 33.Majzner RG et al. CAR T cells targeting B7-H3, a pan-cancer antigen, demonstrate potent preclinical activity against pediatric solid tumors and brain tumors. Clin. Cancer Res. 25, 2560–2574 (2019). [DOI] [PMC free article] [PubMed] [Google Scholar]
- 34.Maher J, Brentjens RJ, Gunset G, Riviere I & Sadelain M Human T-lymphocyte cytotoxicity and proliferation directed by a single chimeric TCRζ/CD28 receptor. Nat. Biotechnol. 20, 70–75 (2002). [DOI] [PubMed] [Google Scholar]
- 35.Sugawara T et al. An improved retroviral gene transfer technique demonstrates inhibition of CD4−CD8− thymocyte development by kinase-inactive ZAP-70. J. Immunol. 161, 2888–2894 (1998). [PubMed] [Google Scholar]
- 36.Au-Yeung BB, Shah NH, Shen L & Weiss A ZAP-70 in signaling, biology, and disease. Annu. Rev. Immunol. 36, 127–156 (2018). [DOI] [PubMed] [Google Scholar]
- 37.Paz PE et al. Mapping the Zap-70 phosphorylation sites on LAT (linker for activation of T cells) required for recruitment and activation of signalling proteins in T cells. Biochem. J 356, 461–471 (2001). [DOI] [PMC free article] [PubMed] [Google Scholar]
- 38.Zhang W et al. Association of Grb2, Gads, and phospholipase C-γ1 with phosphorylated LAT tyrosine residues. effect of LAT tyrosine mutations on T cell angigen receptor-mediated signaling. J. Biol. Chem. 275, 23355–23361 (2000). [DOI] [PubMed] [Google Scholar]
- 39.Balagopalan L, Coussens NP, Sherman E, Samelson LE & Sommers CL The LAT story: a tale of cooperativity, coordination, and choreography. Cold Spring Harb. Perspect. Biol. 2, a005512 (2010). [DOI] [PMC free article] [PubMed] [Google Scholar]
- 40.Motto DG, Ross SE, Wu J, Hendricks-Taylor LR & Koretzky GA Implication of the GRB2-associated phosphoprotein SLP-76 in T cell receptor-mediated interleukin 2 production. J. Exp. Med. 183, 1937–1943 (1996). [DOI] [PMC free article] [PubMed] [Google Scholar]
- 41.Zhang W, Sloan-Lancaster J, Kitchen J, Trible RP & Samelson LE LAT: the ZAP-70 tyrosine kinase substrate that links T cell receptor to cellular activation. Cell 92, 83–92 (1998). [DOI] [PubMed] [Google Scholar]
- 42.Labanieh L et al. Enhanced safety and efficacy of protease-regulated CAR-T cell receptors. Cell 185, 1745–1763 (2022). [DOI] [PMC free article] [PubMed] [Google Scholar]
- 43.Maude SL et al. Tisagenlecleucel in children and young adults with B-cell lymphoblastic leukemia. N. Engl. J. Med. 378, 439–448 (2018). [DOI] [PMC free article] [PubMed] [Google Scholar]
- 44.Neelapu SS et al. Axicabtagene ciloleucel CAR T-cell therapy in refractory large B-cell lymphoma. N. Engl. J. Med. 377, 2531–2544 (2017). [DOI] [PMC free article] [PubMed] [Google Scholar]
- 45.Berdeja JG et al. Ciltacabtagene autoleucel, a B-cell maturation antigen-directed chimeric antigen receptor T-cell therapy in patients with relapsed or refractory multiple myeloma (CARTITUDE-1): a phase 1b/2 open-label study. Lancet 398, 314–324 (2021). [DOI] [PubMed] [Google Scholar]
- 46.Wagner J, Wickman E, DeRenzo C & Gottschalk S CAR T cell therapy for solid tumors: bright future or dark reality? Mol. Ther. 28, 2320–2339 (2020). [DOI] [PMC free article] [PubMed] [Google Scholar]
- 47.Fuca G, Reppel L, Landoni E, Savoldo B & Dotti G Enhancing chimeric antigen receptor T-cell efficacy in solid tumors. Clin. Cancer Res. 26, 2444–2451 (2020). [DOI] [PMC free article] [PubMed] [Google Scholar]
- 48.Hegde M et al. Tumor response and endogenous immune reactivity after administration of HER2 CAR T cells in a child with metastatic rhabdomyosarcoma. Nat. Commun. 11, 3549 (2020). [DOI] [PMC free article] [PubMed] [Google Scholar]
- 49.Majzner RG et al. GD2-CAR T cell therapy for H3K27M-mutated diffuse midline gliomas. Nature 603, 934–941 (2022). [DOI] [PMC free article] [PubMed] [Google Scholar]
- 50.Lajoie MJ et al. Designed protein logic to target cells with precise combinations of surface antigens. Science 369, 1637–1643 (2020). [DOI] [PMC free article] [PubMed] [Google Scholar]
- 51.Cho JH, Collins JJ & Wong WW Universal chimeric antigen receptors for multiplexed and logical control of T cell responses. Cell 173, 1426–1438 (2018). [DOI] [PMC free article] [PubMed] [Google Scholar]
- 52.MacKay M et al. The therapeutic landscape for cells engineered with chimeric antigen receptors. Nat. Biotechnol. 38, 233–244 (2020). [DOI] [PubMed] [Google Scholar]
- 53.Jing Y et al. Expression of chimeric antigen receptor therapy targets detected by single-cell sequencing of normal cells may contribute to off-tumor toxicity. Cancer Cell 39, 1558–1559 (2021). [DOI] [PubMed] [Google Scholar]
- 54.Parker KR et al. Single-cell analyses identify brain mural cells expressing CD19 as potential off-tumor targets for CAR-T immunotherapies. Cell 183, 126–142 (2020). [DOI] [PMC free article] [PubMed] [Google Scholar]
- 55.Kolanus W, Romeo C & Seed B T cell activation by clustered tyrosine kinases. Cell 74, 171–183 (1993). [DOI] [PubMed] [Google Scholar]
- 56.Fitzer-Attas CJ, Schindler DG, Waks T & Eshhar Z Harnessing Syk family tyrosine kinases as signaling domains for chimeric single chain of the variable domain receptors: optimal design for T cell activation. J. Immunol. 160, 145–154 (1998). [PubMed] [Google Scholar]
- 57.Deindl S et al. Structural basis for the inhibition of tyrosine kinase activity of ZAP-70. Cell 129, 735–746 (2007). [DOI] [PubMed] [Google Scholar]
- 58.Lee KM et al. Molecular basis of T cell inactivation by CTLA-4. Science 282, 2263–2266 (1998). [DOI] [PubMed] [Google Scholar]
- 59.Fry TJ et al. CD22-targeted CAR T cells induce remission in B-ALL that is naive or resistant to CD19-targeted CAR immunotherapy. Nat. Med. 24, 20–28 (2018). [DOI] [PMC free article] [PubMed] [Google Scholar]
- 60.Walker AJ et al. Tumor antigen and receptor densities regulate efficacy of a chimeric antigen receptor targeting anaplastic lymphoma kinase. Mol. Ther. 25, 2189–2201 (2017). [DOI] [PMC free article] [PubMed] [Google Scholar]
- 61.Jena B et al. Chimeric antigen receptor (CAR)-specific monoclonal antibody to detect CD19-specific T cells in clinical trials. PLoS ONE 8, e57838 (2013). [DOI] [PMC free article] [PubMed] [Google Scholar]
- 62.Roederer M, Nozzi JL & Nason MC SPICE: exploration and analysis of post-cytometric complex multivariate datasets. Cytometry A 79, 167–174 (2011). [DOI] [PMC free article] [PubMed] [Google Scholar]
- 63.Lareau CA et al. Massively parallel single-cell mitochondrial DNA genotyping and chromatin profiling. Nat. Biotechnol. 39, 451–461 (2021). [DOI] [PMC free article] [PubMed] [Google Scholar]
- 64.Hao Y et al. Integrated analysis of multimodal single-cell data. Cell 184, 3573–3587 (2021). [DOI] [PMC free article] [PubMed] [Google Scholar]
Associated Data
This section collects any data citations, data availability statements, or supplementary materials included in this article.
Supplementary Materials
Data Availability Statement
All new CAR sequences are available in Supplementary Table 1. CAR constructs will be made available through Material Transfer Agreements when possible. The scRNA-seq datasets have been deposited in the NCBI Gene Expression Omnibus (GEO) and are accessible through the GEO series accession number GSE216286.


