Abstract
RNA origami is a method for designing RNA nanostructures that can self-assemble through co-transcriptional folding with applications in nanomedicine and synthetic biology. However, to advance the method further, an improved understanding of RNA structural properties and folding principles is required. Here we use cryogenic electron microscopy to study RNA origami sheets and bundles at sub-nanometre resolution revealing structural parameters of kissing-loop and crossover motifs, which are used to improve designs. In RNA bundle designs, we discover a kinetic folding trap that forms during folding and is only released after 10 h. Exploration of the conformational landscape of several RNA designs reveal the flexibility of helices and structural motifs. Finally, sheets and bundles are combined to construct a multidomain satellite shape, which is characterized by individual-particle cryo-electron tomography to reveal the domain flexibility. Together, the study provides a structural basis for future improvements to the design cycle of genetically encoded RNA nanodevices.
The research field of RNA nanotechnology develops methods for the rational design of self-assembling RNA nanostructures for applications in nanomedicine1 and synthetic biology2,3. Inspired by the co-transcriptional folding of biological RNA molecules, we previously developed a single-stranded architecture (named RNA origami) by implementing RNA double-crossover (DX) and RNA kissing-loop (KL) motifs and showed that it was compatible with co-transcriptional folding in vitro4. RNA origami and similar architectures has, for example, been used to design structural RNA scaffolds to deliver siRNA for gene knockdown in cells5, to bind thrombin to function as an anti-coagulant6, to be expressed and folded in vivo7–9, and as protein scaffolds to regulate gene expression10,11. The RNA origami method has recently been improved with optimized structure and sequence design software12, but has mainly been characterized using methods in which the sample is adhered to a surface, such as atomic force microscopy or negative-stain transmission electron microscopy (NS-TEM). However, the forces keeping the RNA stuck to the surface in these methods can distort the solution structure of the RNA, and these methods are limited in the resolution of structural detail they can attain.
Cryogenic electron microscopy (cryo-EM) has been used to characterize RNA nanostructures, but generally have resulted in low-resolution maps that only provide a general sense of the global structure7,9,13–21. The field of cryo-EM has now advanced to the stage where a higher resolution can be readily achieved, and we have witnessed a recent surge in high-resolution RNA-only structures where the grooves of the RNA double helix are clearly resolved22–25 and a few cases where base pairs are resolved26–29. For DNA nanostructures, the shift in characterization tools from atomic force microscopy to cryo-EM-enabled three-dimensional (3D) characterization of larger and more complex DNA origami30 at increasing resolution31, in which the observed twisting and bending allowed for adjustments to the design parameters to control their global shape32. A similar endeavour needs to be done for RNA nanotechnology where the complexity of RNA tertiary motifs makes it even more difficult to design structures with ideal geometries.
Here we present a suite of RNA origami designs studied by cryo-EM and reconstructed to sub-nanometre resolution that allows us to build atomistic models, revealing the details of structural motifs used to compose the RNA origami architecture. Each of the presented structures were transcribed and natively purified, allowing us to study the co-transcriptionally folded products of RNA origami synthesis. However, the folding of RNA may not be immediately complete after transcription and further structural changes may occur due to the slow folding processes or purification conditions. For one RNA origami sample, we uncover a late maturation process where the RNA enters a kinetically trapped state after co-transcriptional folding that takes hours to escape and elucidate the structural transition using a combination of cryo-EM and small-angle X-ray scattering (SAXS). We further present a detailed analysis of the internal flexibility of RNA origami using 3D variability analysis of the cryo-EM data. Finally, we characterize the flexibility of large multidomain RNA origami structures by cryogenic electron tomography (cryo-ET). The structural and dynamic insights gained in the study will greatly improve the RNA design methods and facilitate future applications.
Design of RNA origami for cryo-EM analysis
Using our recently developed RNA origami automated design (ROAD) software12, we designed a panel of RNA origami structures for cryo-EM analysis (Fig. 1 and Supplementary Tables 1–9). The designs were carefully chosen to test the structural assumptions that we make in the RNA origami design, which has previously allowed us to achieve kilobase-sized nanoscaffolds, although at a decreasing yield for larger structures12. The first assumption is that a DX, with an integer number of full turns between the crossovers, forces the helices to be parallel—even though a single crossover found in natural RNA structures typically places two helical segments at an angle θ of ~45° (Fig. 1a,b)33. The second assumption is that a KL motif corresponds to 9 bp of A-form double helix and can be placed on a continuous helical segment between two crossovers. A third assumption is that the number of base pairs between two crossovers connecting three adjacent helices, named a dovetail (DT) seam4, dictates the angle φ between adjacent helices (Fig. 1c,d). Any deviation from these assumptions will cause distortions that will propagate throughout the structure and may limit the fidelity and yield of RNA origami designs.
Fig. 1 |. Principles for RNA origami design and folding.
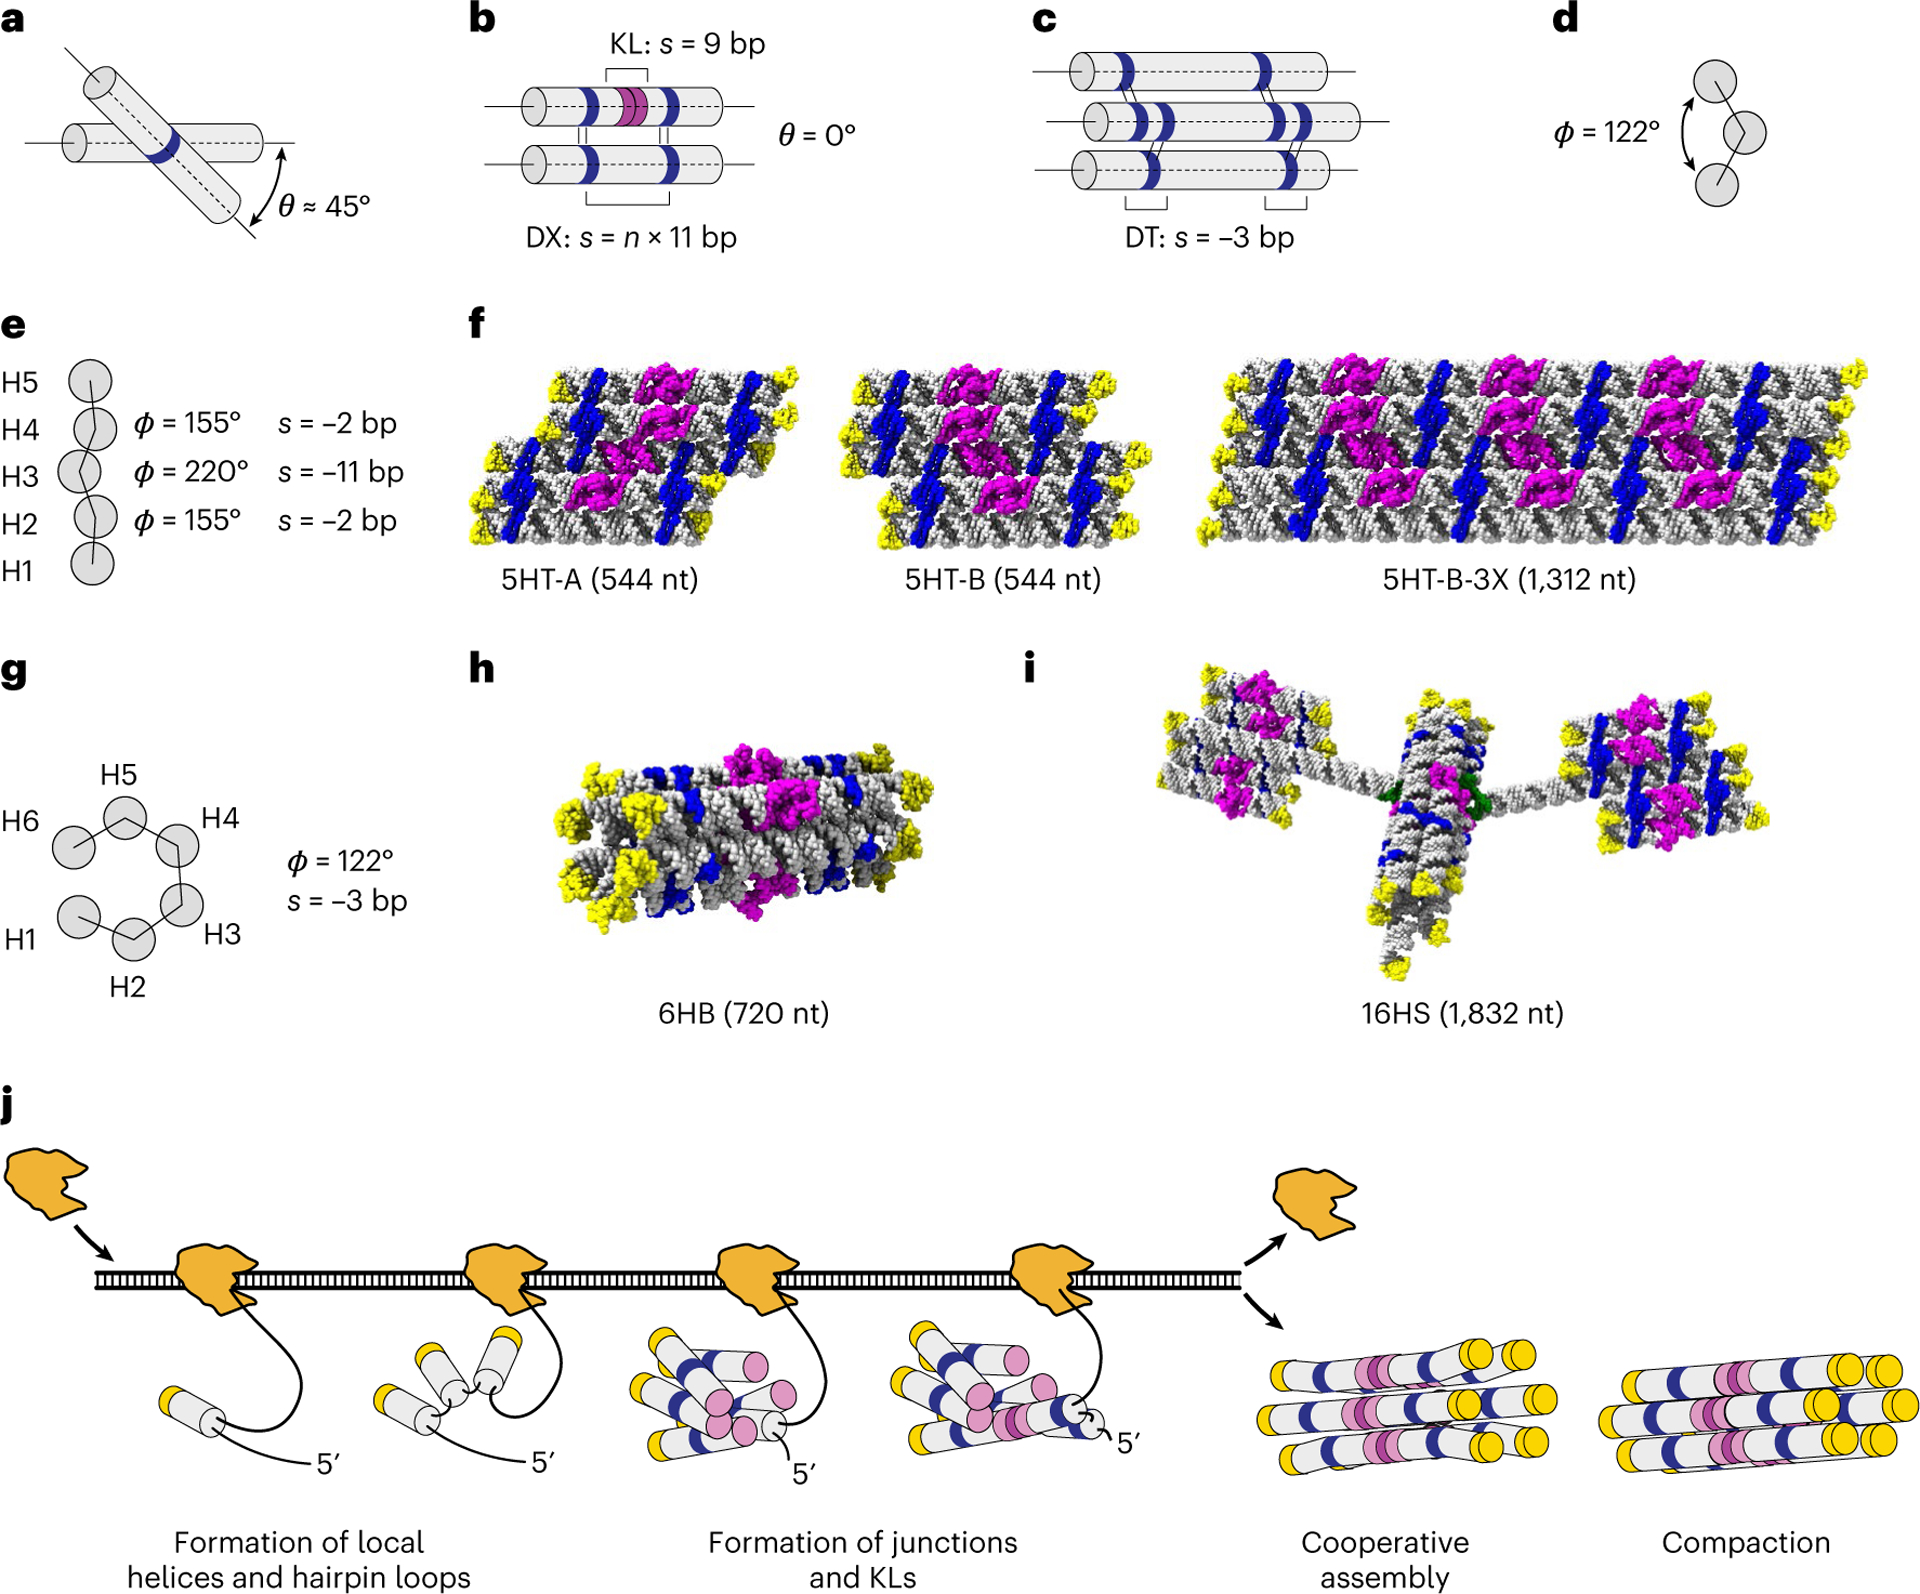
a, Depiction of the relaxed angle θ observed in natural anti-parallel crossovers. b, DX with strained θ angle of 0° used in RNA origami designs, where s refers to DX spacing in base pairs and n refers to the number of turns. c,d, Depiction of a −3 bp DT seam (c) and its effect on φ (d). e,f, Predicted φ angles for a designed 5HT building block (e) and molecular models of three designs (f). g–i, Predicted φ (g) for a 6HB (h) and 16HS (i) multidomain structure. In the molecular models, tetraloops are depicted in yellow; crossovers, blue; KLs, magenta; and bKLs, green. j, Hypothetical co-transcriptional folding and maturation by the compaction of a 6HB RNA origami. The A-form helix is shown as grey cylinders; tetraloops, yellow caps; junctions, blue rings; and KLs, purple circles.
Our point of departure is the five-helix tile (5HT) that has previously been shown to fold in high yield12. The 5HT-A design has five helices (H1–H5) connected with crossovers in a DT pattern of −2, +11 and −2 bp, which corresponds to φ of 155°, 220° and 155°, respectively (Fig. 1e,f). Ideally, moving a crossover position by increments of 11 bp should not affect φ. We test this by the 5HT-B design with a DT pattern of −2, −11 and −2 bp, where the DX between H3 and H4 is moved by 22 bp. A wider version of 5HT-B, called 5HT-B-3X, was used to test the global twist. To develop 3D shapes, we design six-helix bundles (6HB) by utilizing a −3-bp-seam pattern to orient the helices at a φ angle of 122°, resulting in an approximately hexagonal cross-section (Fig. 1g,h). Finally, we explore the use of a branched kissing-loop (bKL) module9 to combine two 5HTs and one 6HB, forming a distinctive 16-helix satellite (16HS) shape of 1,832 nucelotides (nt) (Fig. 1i), which represents our first multidomain RNA origami structure. The strand paths were chosen based on the folding path analysis12 and our current understanding of the hierarchical co-transcriptional folding and maturation process (Fig. 1j). All the designs were synthesized, transcribed, purified and imaged by cryo-EM, 3D reconstructed and modelled (Methods, Extended Data Fig. 1, Supplementary Figs. 1–14 and Supplementary Table 10).
Five-helix sheets with twists and bends
The cryo-EM reconstruction of the 5HT-A design reached an overall resolution of 4.1 Å with local resolutions up to 3.4 Å (Fig. 2a, Extended Data Fig. 2a and Supplementary Video 1), which allowed the building of a detailed structural model (Fig. 2b). The measurement of helical parameters show that the A-form helices have an average helical rise and twist of 2.7 Å and 33.2° per bp, which is close to the expected values of 2.8 Å and 32.7° per bp, respectively (Extended Data Fig. 2b–d). The 11 bp DTs are observed to be compressed (2.5 Å per bp), while the 2 bp DTs are observed to be more extended (3.1 Å per bp) and overtwisted (37.3° per bp), which can be explained by the proximity to crossovers with backbone gaps. In contrast, the 6 bp KL stacks are found to be compressed (2.5 Å per bp) and undertwisted (31.0° per bp). Compared with our designed model, we observed the bending of helices between crossovers and twisting at junctions. Although H1, H2 and H4 have curved helical axes, the central helix, H3, has two distinctive kinks at the most interior crossovers and is otherwise straight (Fig. 2b,c). The measurements of θ and φ angles show deviation from ideal values (Extended Data Fig. 3a–c). An overall left-handed twist between adjacent DT seams is observed (Fig. 2d, bottom) and measured to have an average τ angle of −28° (defined and measured in Extended Data Fig. 3a,d).
Fig. 2 |. Cryo-EM characterization of 5HT structures.
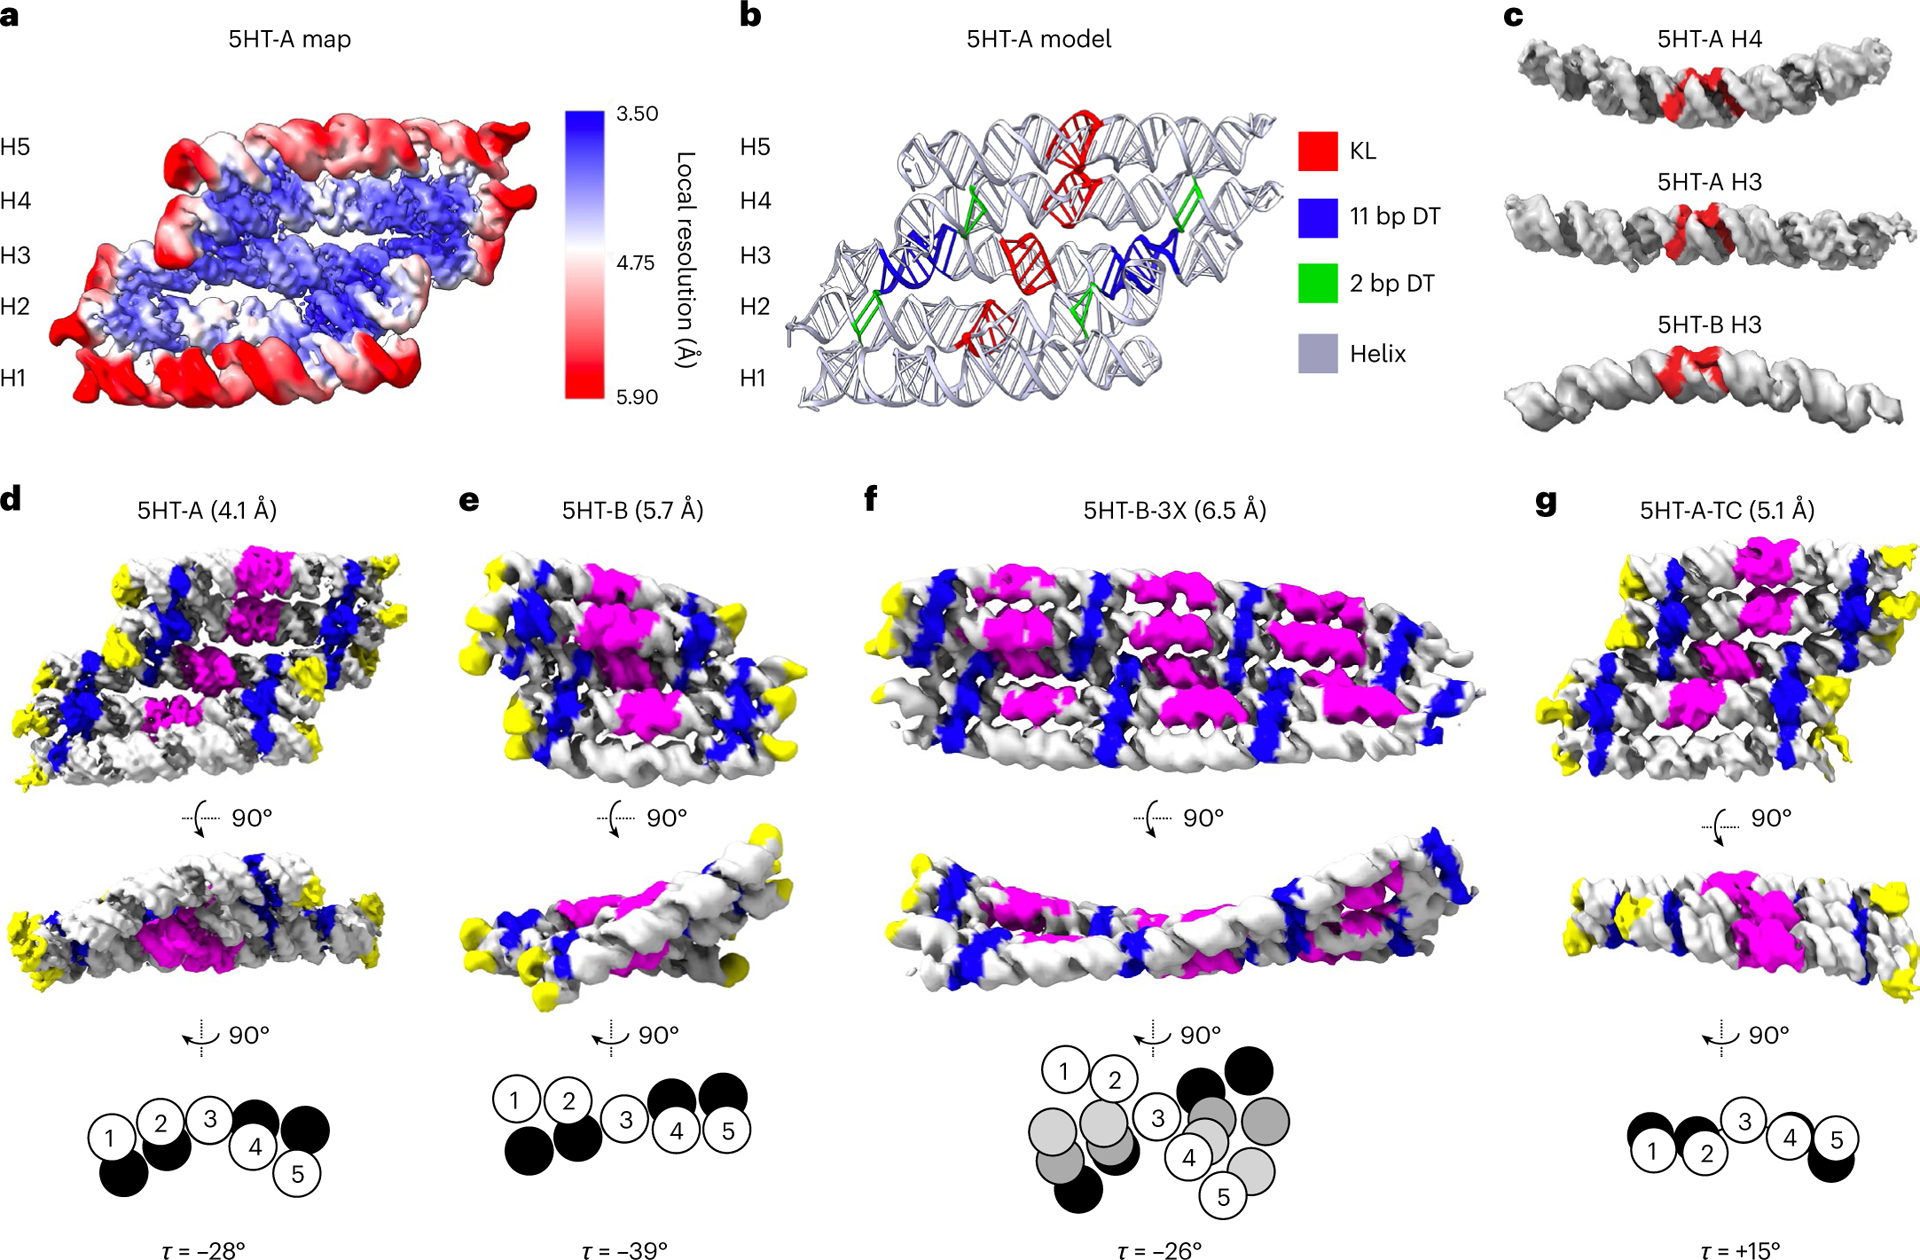
a, 5HT-A reconstruction based on the local refinement of the three central helices. The colour bar shows local resolution. b, Atomic model with colour annotation of the KL and DT helices. c, H4 from 5HT-A (top) and H3 from 5HT-B (bottom) show the most prominent bending; notably, they are bent in opposite directions with respect to the position of A1 and A2 from the KL motif, and H3 from 5HT-A (middle) is straight (A1, A2 and A3 positions are shown in red). d–g, Cryo-EM reconstructions for 5HT-A (d), 5HT-B (e), 5HT-B-3X (f) and 5HT-A-TC (g) shown in two views with the resolution indicated in brackets (top). The colouring has been applied to the maps through the motifs modelled into the map. The tetraloops are depicted in yellow; crossovers, blue; and KLs, magenta. The relative scale of the reconstructions can be estimated by the thickness of a helix, which is ~2 nm. Schematic showing the cross-section of H1–H5 at seam 1 (white) and other seams (black/greyscale) aligned on H3 with the calculated seam twist angle τ (bottom).
The slight change in the topology of 5HT-B resulted in a substantial difference in the alignment of helices (Fig. 2e). As an example, H3 appears bent (155°), compared with relatively straight H3 from 5HT-A (Fig. 2c). Since we redesign the KL sequence for each new structure that we make (to fully optimize the sequence), we hypothesized that the difference in bending could be dependent on KL sequence. To test this, we designed a second version (5HT-B-V2) with the same KL sequences as 5HT-A. The density maps reconstructed from the cryo-EM data for both 5HT-B and 5HT-B-V2 overlay well with each other (Extended Data Fig. 2e), suggesting that the KL sequence has a negligible effect on the structure of the RNA. Despite the different helical bends, 5HT-B was found to have a left-handed twist similar to 5HT-A, but with a larger τ of −39° (Fig. 2e, bottom). The structure of 5HT-B-3X was found to have an average τ of −26° (Fig. 2f), which suggests that this extended structure averages out the local deformations found in 5HT-B resulting in τ becoming more similar to 5HT-A. In addition to the twist, 5HT-B-3X was found to have a global bend that creates two distinct sides, one with more exposed surface area—which explains the preferential landing of larger RNA origami tiles that we previously observed by NS-TEM and atomic force microscopy12.
KL motif and twist correction
The local refinement of the 5HT-A KL motif at local resolutions up to 3.7 Å reveals distinct features compared with earlier KL structures determined by crystallography34–36 and nuclear magnetic resonance (NMR)37–39. The KL is composed of two bulged purines (A1 and A2), six nucleotides that form base pairs with a complementary KL and an unpaired purine (A3) (Fig. 3a). We find that A1 and A3 form a trans-Watson–Crick base pair that stacks between the stem and KL double helices on both sides of the KL dimer (Fig. 3b,c). A1 and A2 are not in the bulged-out conformation observed in crystal structures34–36; rather, the A2 nucleotides form a base stack within the major groove (Fig. 3d,e), further stabilized by hydrogen bonds from the NH2 group of one A2 to 2′OH of the other (Fig. 3f). Our model indicates that both A1 and A2 nucleotides adopt a C2′-endo sugar pucker on both sides of the KL dimer. Of the 41 KLs reconstructed from eight independent datasets (not counting the 12 KLs from 5HT-B-3X), we observe what appears to be bulged-out A1:A2 in three KLs of our maps (Extended Data Fig. 4). This variability in the formation of the A2:A2′ stack may be the result of sequence and local structural context.
Fig. 3 |. Tertiary structure of KL and crossover motifs.
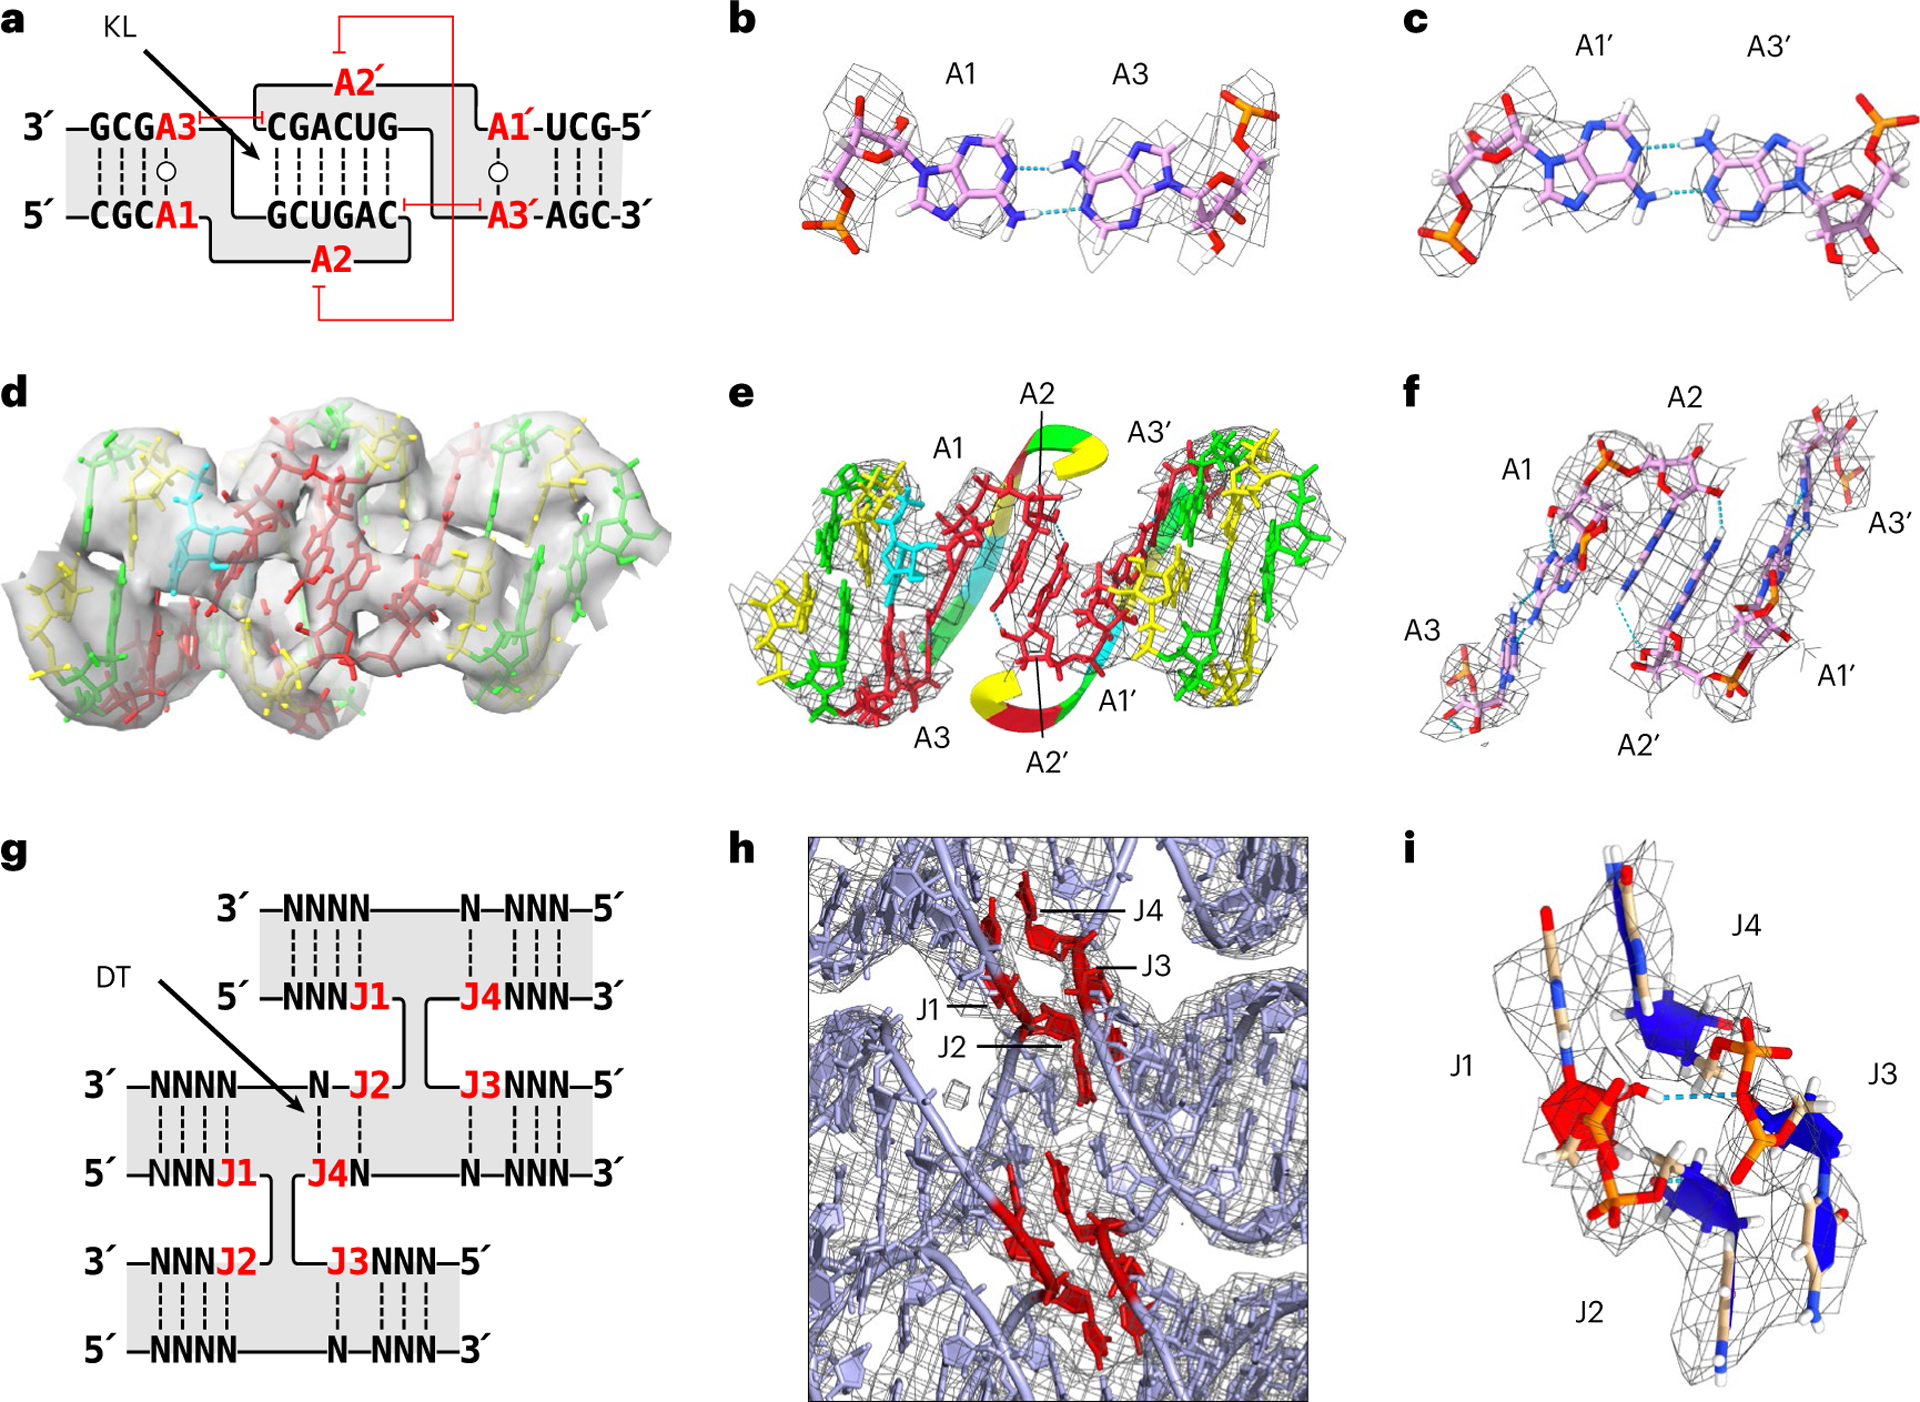
a, Secondary structure of the KL motif with the annotation of A1–A3. The capped red lines annotate stacking. b,c, Trans-Watson–Crick base pair of A1:A3 (b) and A1′:A3′ (c) from H3 KL are shown with the EM map as a mesh. d, A 3D model of KL3 of 5HT-A in the EM map. Nucleotides coloured by base (green, guanine; yellow, cytosine; red, adenine; blue, uracil). e, A 3D model of KL3 of 5HT-A showing the base stack of A2:A2′ across the major groove. The EM map is shown as a mesh around the displayed nucleotides. The 6 bp kissing nucleotides are ‘hidden’ to highlight the A2:A2′ base stack by displaying it as a ribbon and hiding the EM map mesh. f, Zoomed-in view of the A1:A3/A1’:A3’ base pairs and A2:A2′ base stack with the EM map shown as a mesh around the displayed nucleotides. g, Secondary structure of the crossover junction with annotation of J1–J4. Here J refers to junction nucleotides and are numbered from 5′ to 3′, and N represents any nucleotide. h, View of the crossover junctions between H1, H2 and H3 of 5HT-A shown with the EM map as a mesh. J1–J4 are highlighted in red. i, View of J1–J4 shown with the EM map as a mesh. C3′-endo nucleotides are coloured blue and C2′-endo nucleotides, red.
The central KL base-pair stack is found to be more compressed than expected (Extended Data Fig. 2d) and we find that a KL motif can be approximated as 8 bp of continuous A-form helix, whereas in our current designs, we approximate it as 9 bp (Extended Data Fig. 5). This observation agrees with recent X-ray studies on a synthetically constructed bKL motif that exhibited the same compression40. Based on this observation, we designed a twist-corrected version of 5HT-A, where we added an extra base pair in each KL-containing helix segment. The cryo-EM reconstruction had a more ideal shape (Fig. 2g) with a positive average seam twist τ of +15° (compared with −28° for 5HT-A) and average φ angles of 156° and 236°, which are close to the ideal values of 155° and 220°, respectively, as well as with less in-plane and out-of-plane θ bending (Extended Data Fig. 3). This demonstrates how cryo-EM-derived parameters can be used to iteratively optimize the RNA origami shapes.
Tertiary motif of crossover junctions
RNA origami uses crossover junctions that orient strands in an anti-parallel configuration, which is a rarity in natural RNA structures, where all the examples are further stabilized by tertiary interactions between the two helices, such as A-minor or G-minor motifs33. RNA origami further places multiple crossover junctions in close proximity (DT) to link several helices in parallel, which is also not found in natural RNA structures. The main concern here is the stability of these closely spaced four-way junctions, as they have as little as 2 bp holding them together in 5HT-A (Fig. 3g). However, the crossover junctions of 5HT-A reach the highest local resolution of 3.4 Å (Fig. 2a) and are thus one of the most rigid parts of RNA origami due to continuous base stacking across the junctions (Fig. 3h). The crossovers across multiple structures are found to have average θ angles of 11.3 ± 7.3°, and we observe an alternating pattern of θ angles compatible with out-of-plane bending (Extended Data Fig. 3b). An analysis of the crossovers of 5HT-A revealed that 9 out of 32 of the four-way junction nucleotides (J1–J4) adopt C2′-endo sugar pucker, one per crossover and one crossover with two (Fig. 3i). All the C2′-endo nucleotides are at the 5′ end of the strand entering the crossover (J1 and J3) and fall into the 1b rotameric classification41. The positioning of 2′OH in the C2′-endo nucleotides allows for a hydrogen-bond interaction with O3′ or O2P across the junction that could stabilize the crossover, reminiscent of the four-way junction in the hairpin ribozyme42. The four instances in 5HT-A of junctions with 2 bp DTs show remarkable similarity, indicating that their structure can be defined as a rigid module and used as a building block for future designs.
6HBs and a kinetic trap
The cryo-EM reconstruction of 6HB RNA (Fig. 4a) has average φ of 127°, close to the predicted value of 122°, and average τ of −22° compatible with the original 9 bp KL spacing used (Extended Data Fig. 3c,d). To stabilize 6HB, a second design was made by adding one crossover between H1 and H6 at the expense of one crossover between H5 and H6, resulting in H6 functioning as a clasp (6HBC; Supplementary Table 7 provides a blueprint). The cryo-EM reconstruction of 6HBC shows that H6 has θ of 45°, forming a bridge over the five other parallel helices (Fig. 4b) and maintaining similar τ of −24°. When using a variant of 6HBC with the same topology for protein-binding studies (6HBC-PBS, Supplementary Table 8), we observed that after extended periods of time at room temperature, the structure was found in an alternative conformation in which H6 is now more parallel to the adjacent helices with close to the ideal value of τ (Fig. 4c). To verify that this observation was not just a consequence of the protein-binding motifs, we froze the original 6HBC sample at an intermediary time point (8.5 h post-transcription start and 5.0 h post-purification) and obtained cryo-EM images from which we were able to reconstruct both conformers from a single dataset (Supplementary Figs. 8 and 9).
Fig. 4 |. Cryo-EM and SAXS characterization of 6HB structures.
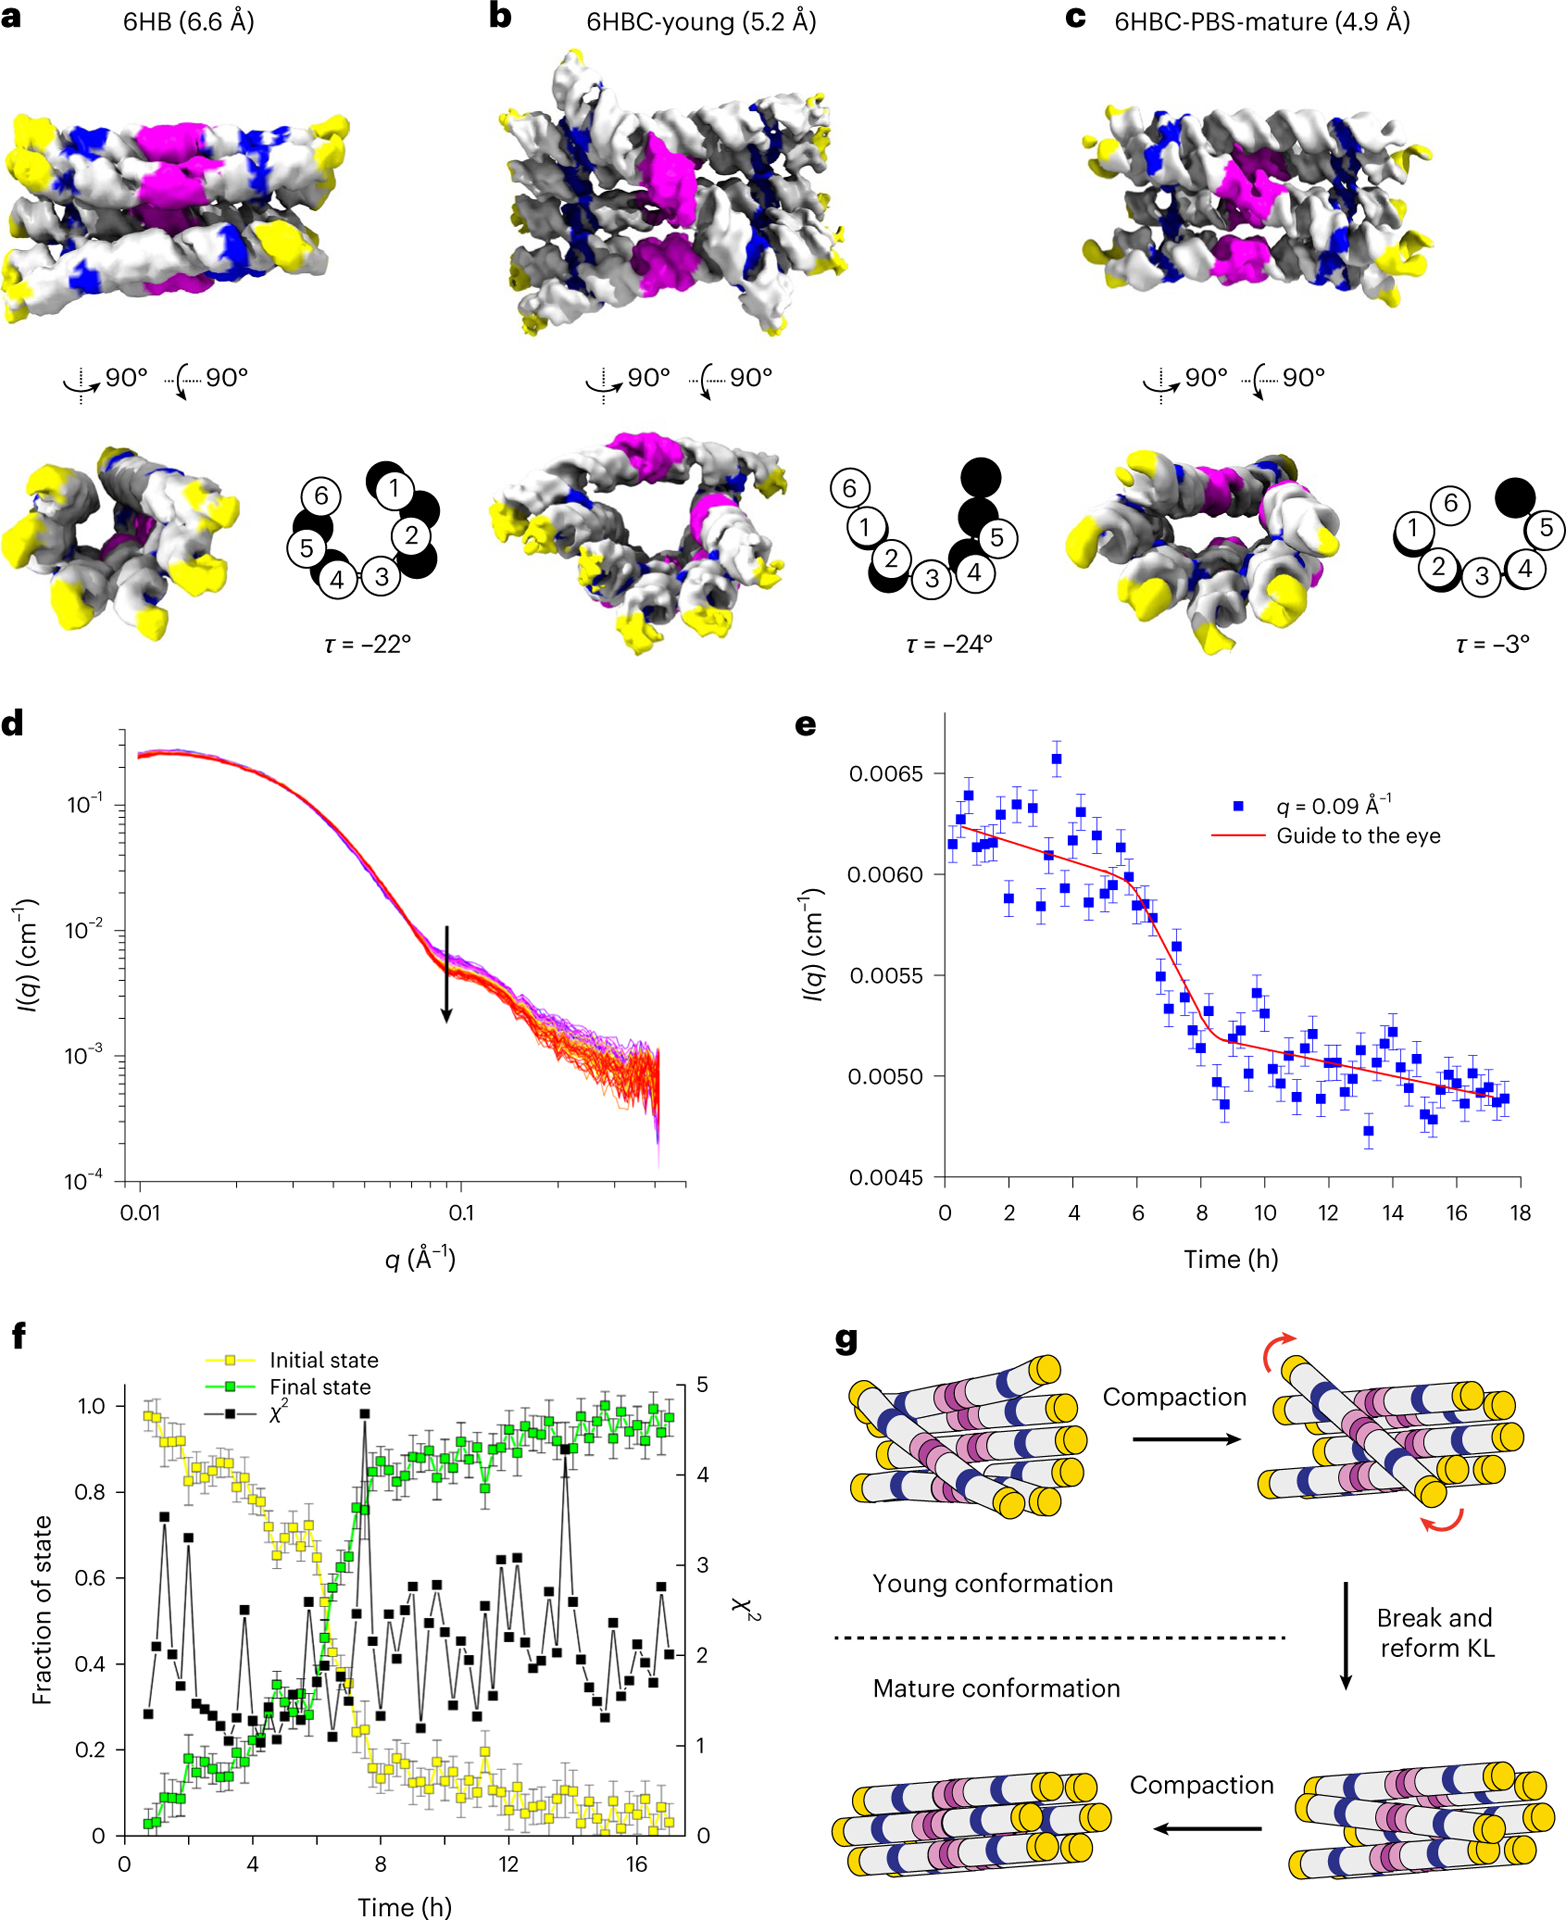
a–c, Cryo-EM reconstructions of 6HB (a), 6HBC-young (b) and 6HBC-PBS-mature (c) designs with the resolution indicated in brackets. The colour code is the same as in Fig. 2d–g. In c, the tetraloops were modelled into density in place of protein-binding domains. The schematic shows the cross-sections of H1–H6 at seam 1 (white) and seam 2 (black) as well as the seam twist angle τ. d, SAXS measurements on the 6HBC structure over time, where the black arrow shows the main change at q = 0.09 Å−1. e, Average intensity of seven points around q = 0.09 Å−1 plotted as a function of time. The error bars show the standard errors from counting statistics. The red line shows a general trend. f, Linear combination analysis of the experimental data for the initial and mature state. The error bars are obtained from least-squares fitting using weights related to the standard errors on the SAXS data. g, Schematic showing the compaction and transition between young and mature conformations. The red arrows show the rotation of clasp helices.
To better understand the transition, we used SAXS to follow the maturation of the purified 6HBC. The SAXS experiment was initiated 3 h and 45 min after transcription start (15 min post-purification) and was followed by taking 15 min data collection windows for 17.5 h. The SAXS data only vary within intermediate to high q, which is expected for an internal structural rearrangement (Fig. 4d), suggesting that we were able to purify the pseudo-stable 6HBC-young conformation and observe compaction of the structure. The average intensity of seven points around q = 0.09 Å−1 was plotted as a function of time and revealed a major structural transition happening from 6 to 8 h (approximately 10–12 h after transcription start) (Fig. 4e). The SAXS data were further analysed using the cryo-EM-based models for the young and mature conformers. The original models have χ2 for the fits of 9.99 and 6.12, which improve to 2.15 ± 0.20 and 1.92 ± 0.10, respectively, by subtle rigid-body movements (Extended Data Fig. 6a,b). The full time course of the SAXS data is effectively described by a linear combination of scattering from the start and end conformers, supporting a mainly two-stage transition, but this also suggests a gradual compaction before and after the transition (Fig. 4f). We suggest that the data represent a slow compaction of the young conformer, which gradually lowers the energy barrier for transition towards the mature conformer, resulting in a rather abrupt transition at 10–12 h after transcription start, followed by a further gradual compaction (Fig. 4e, red line).
Mechanism of kinetic trapping and release
The mechanism for late transition was suggested by the superposition of models of the two 6HBC conformers, which revealed that the A2/A2′ base stack in the KL of H6 changes position from being oriented towards the interior of the bundle to the exterior (Extended Data Fig. 6c). For the transition to occur, each half of the clasp helix must rotate 180° in opposite directions, which necessitates the transient breaking of the H6 KL interaction (Supplementary Video 2). Based on this structural mechanism, we propose a more detailed ‘maturation’ model (Fig. 4g). (1) The kinetic trap forms during the co-transcriptional folding process where the KL partners from H6 first connect when their respective crossovers are at their relaxed angle (~45°) and thus topologically blocks the bundle from further compacting. (2) The young conformation compacts through helical packing and puts force on the bridging KL interaction. (3) The KL interaction breaks, each KL rotates 180° in opposite directions and the KL interaction reforms. (4) After this release, the compaction through helical packing can proceed until a final compact state is reached. Several features of the mature structure indicate that it is thermodynamically more favourable. The φ, θ and τ angles observed in the mature structure are closer to those observed in 6HB without the clasp (Extended Data Fig. 3), hinting that the relaxation of these angles to their favoured value could provide an energetic driving force for structural transformation.
Since each individual RNA is transcribed and co-transcriptionally folded in a few seconds, the two-hour duration of the transition is most probably related to the duration of RNA production during the transcription reaction. This suggests that the kinetic trap of each molecule may have a more defined release time from being transcribed to the transition from young to mature conformation of approximately 10 h. The timing of the transition may be determined by the binding energy of the H6 KL, which suggests that the misfolded conformation may be avoided by either weakening the KL or introducing a transient anti-sense oligo that binds to the H6 KL to function as a chaperone. Further experiments will be needed to investigate the transition mechanism and to obtain a more detailed kinetic model. Kinetic traps are known to form as a result of the early formation of pseudo-knots that blocks later base pairs from forming and can be prevented by delaying the formation of the pseudo-knot43. In our case, no additional base pairs are formed after the release of the kinetic trap, but instead topological frustration in the form of internal strain is relieved. The observed trap is reminiscent of traps in ribosomal folding that require chaperones for remodelling late-assembly intermediates44 and a recent topological trap identified in the Tetrahymena thermophila group I ribozyme28,29.
Flexibility of RNA origami structures
From initial particle picking to final 3D reconstruction, we typically end up with only 10% of the initial particle picks in the best reconstruction. These discarded particles can be used to reconstruct 3D volumes with slight differences in the local conformation. Although they do not result in detailed reconstructions as the filtered particle stack, they are informative as to the structural dynamics in solution before plunge freezing. Using 3D variability analysis in cryoSPARC45, we can visualize the dynamics by classifying particles along a motion trajectory and then determining multiple structures from subsets of particles along this motion trajectory. We solved for three orthogonal principal modes of 3D variance within the 5HT-A and 6HBC datasets before 3D classification of the particles to include as many conformational variants as possible. The major source of variation is from the position of ends of the helices; this is unsurprising as these parts of the origami are unconstrained and are also the regions where we observed the lowest resolution in our refined reconstructions (Fig. 2a).
Another major source of variance—more noticeable in 5HT-A (Supplementary Video 3)—are the inter-helical φ angles; this variation manifests itself as a slight folding motion in 5HT-A. Measurements of these φ angles revealed a range of motion of up to 37° and an average of 14° for all φ angles within 5HT-A (Supplementary Table 11). The final major source of variance is the inter-helical θ angles, where measurements taken on 5HT-A reconstructions showed a range of motion of up to 18° and an average range of these angles spanning only 6° (Supplementary Table 12). One of the outcomes of this θ variability is the out-of-plane displacement of the KL. The most notable example of this is in the KL in H3 of 6HBC, where we observed a displacement of ~13 Å between the two extremes of the set of reconstructions (Supplementary Video 4). This analysis confirms the prevailing notion that RNA is a highly conformationally variable molecule and demonstrates the main sources of flexibility within our RNA origami. Even the most rigid parts of our 5HT-A tile that we were able to resolve to 3.4 Å local resolution have multiple conformations in solution, and the angles measured from our atomistic models only represent the average and most abundant conformations in our dataset.
Domain dynamics in RNA origami
Our final design is a satellite shape (16HS) composed of an extended 6HBC with ‘solar panels’ formed by shortened versions of 5HT-B, connected through bKLs with 34 bp stems (Fig. 1i and Supplementary Table 9). NS-TEM reveals recognizable 16HS shapes that appear to be flattened by interactions with the surface (Fig. 5a,b) and single-particle averaging yields two-dimensional (2D) classes with variable positions of solar panels and a closed and opened state of core 6HBC (Fig. 5c). The open state can be explained by a staggered crossover pattern used in the bottom part of the bundle (Supplementary Table 9) and/or the formerly identified kinetic folding trap in 6HBC designs (Fig. 4b). Templated reconstruction shows a favoured orientation of the panels similar to our theoretical model (Fig. 5d,e), which we speculate is caused by surface interactions with the carbon foil rigidifying the wings of the satellite in NS-TEM imaging. Cryo-EM micrographs collected at 50 e− Å–2 allowed the observation of branched particles with 6HB features (Fig. 5f,g), but image analysis failed to produce 2D class averages containing the core and both panels (Supplementary Fig. 15), which is expected for a highly flexible structure for which insufficient images are captured of each conformer to allow for classification.
Fig. 5 |. NS-TEM and cryo-ET characterization of 16HS structure.
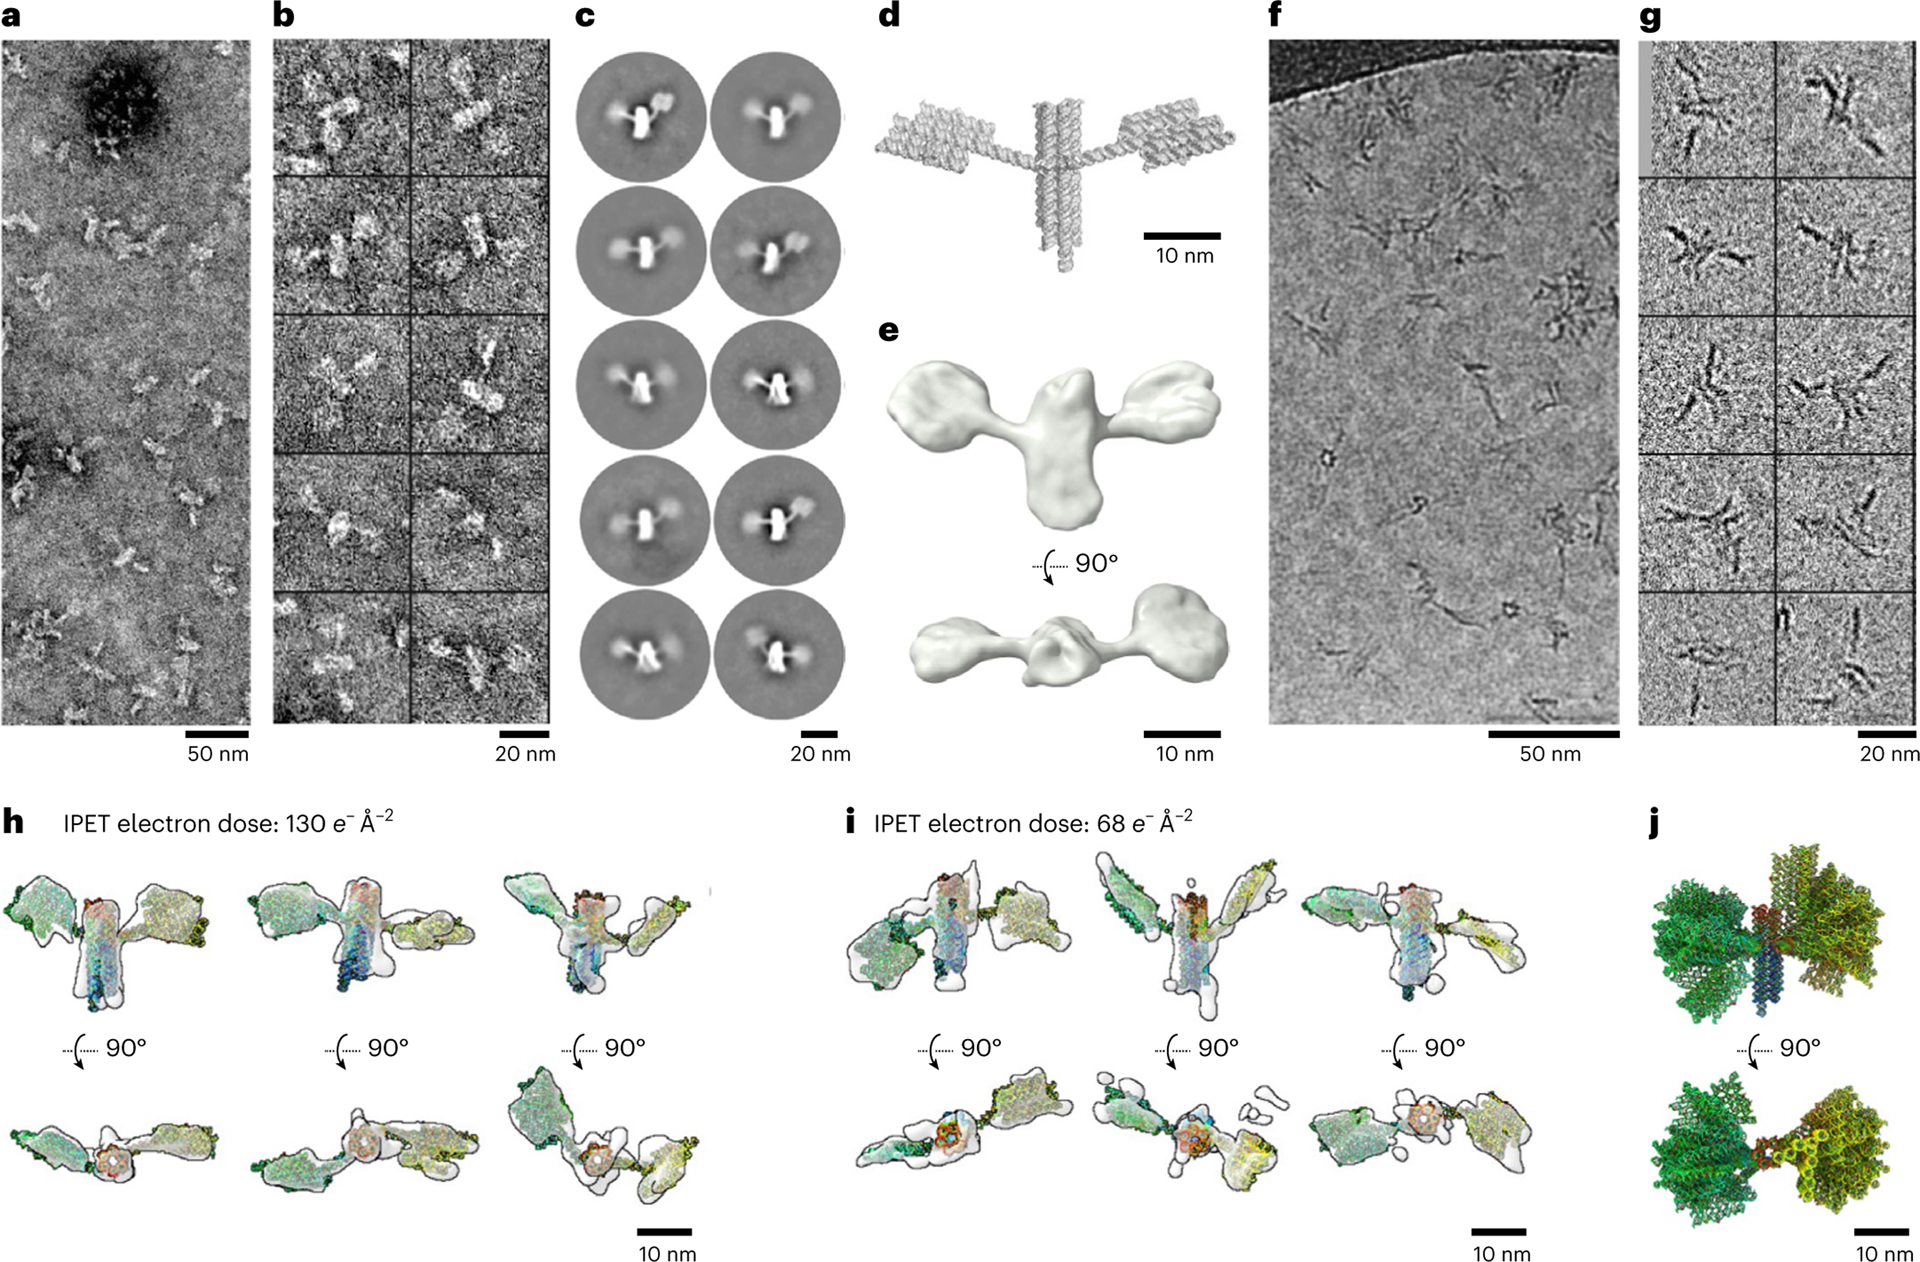
a, NS-TEM micrograph. b, Ten representative images of 16HS-shaped particles. c, Reference-free 2D class averages of particles. d, A 3D model of 16HS. e, Templated reconstruction of the satellite volume shown in perpendicular views. f, The cryo-TEM micrograph. g, Ten representative images of 6HB particles. h, Perpendicular views of three representative cryo-ET 3D reconstructions of individual particles imaged under the dose of 130 e− Å–2 with the fitted model shown in rainbow colours from the 5′ to 3′ end. i, Perpendicular views of another three representative cryo-ET 3D reconstructions of individual particles imaged under the dose of 68 e− Å–2 with the fitted model shown in rainbow colours from the 5′ to 3′ end. j, Superimposed 16-fitted models aligned on the basis of the central helical bundle, shown in two perpendicular views. The models are shown in rainbow colours from the 5′ to 3′ end.
To study the 3D conformation of individual satellite structures, we used cryo-ET. Based on testing the effect of electron dose on RNA particles (Extended Data Fig. 7), we conducted cryo-ET data acquisition under a total dose of 130 and 68 e− Å–2, respectively, and used the IMOD v. 4.9.9 software46 for the initial 3D reconstruction (Extended Data Fig. 8). Next, we employed the individual-particle electron tomography (IPET) protocol for a higher-resolution 3D reconstruction to reduce the effect from image distortion or deformation and the missing-wedge artefact47 from the limited tilt angle (Methods and Extended Data Fig. 9). A total of 16 individual-particle 3D density maps were reconstructed from the 130 and 68 e− Å–2 datasets and the three domains of the 16HS were rigid-body docked in the cryo-EM density map (Fig. 5h,i, Extended Data Fig. 10 and Supplementary Figs. 16–31). Even though the EM density maps for 68 e− Å–2 are slightly noisier than the maps for 130 e− Å–2, both maps are sufficient to show the domain spatial orientation and that the satellite adopts several different conformations. An overlay of the models shows the structure has variation in bKL angles in a range of ~150° and in the rotation of the 5HT component with respect to the core bundle (Fig. 5j). These models suggest that the 16HS domains are highly flexible in solution. Studying the domain flexibility of RNA nanostructures has not been done before, but several studies exist where cryo-ET has been used to study the 3D shape of DNA origami structures48–51. DNA origami has been demonstrated to function as extracellular markers for cryo-ET49. Similarly, RNA origami ‘satellites’ may serve as genetically expressible markers for cryo-ET to facilitate exploration and reporting from intracellular space.
Conclusions
In this study, we have gained an insight into the native hydrated structure of the RNA origami architecture by the design and characterization of five-helix sheets, 6HBs and a 16-helix multidomain structure. Our previous structural assumptions used to design RNA origami were challenged by the high-resolution cryo-EM data: the first assumption that a DX containing an integer number of full turns between crossovers will force the helices to be perfectly parallel turns out to be incorrect. In contrast, we found that crossovers constitute a unique structural motif connecting helices at a preferred angle of roughly 11.3° ± 7.3°. The second assumption that a KL corresponds to 9 bp of A-form helix and is a rigid 180° block irrespective of the KL sequence turns out to be mostly valid. KLs in all the models appear to share a similar conformation, but the motif corresponds more closely to 8 bp, which when corrected led to more ideal shapes. The third assumption that the number of base pairs between two crossovers connecting three adjacent helices dictates the angle φ between adjacent helices appears to be true, but only when the internal strain in the structure is reduced as in the twist-corrected 5HT-A-TC.
Our understanding of the co-transcriptional folding process was improved by the identification of a kinetic folding trap of the 6HBC that matures into a more thermodynamically favourable state. The identification of the release mechanism of the kinetic trap suggests that it can be avoided by decreasing the strength of long-range interactions during design. On the other hand, such timed-release mechanisms might be used to activate functional motifs in a timed or conditional manner. The SAXS data revealed slow compaction before and after the transition that is probably due to helix packing, which is an effect that also warrants further studies. In contrast to the numerous physical and chemical probing methods that have been used to study the folding of RNA44,52, our solution structure characterization reveals conformations and dynamics that would not be identifiable by other methods. It should be highlighted that we only study the products of co-transcriptional folding that have been exposed to purification and concentration steps before plunge freezing for cryo-EM. Studying the dynamics of the co-transcriptional folding process in unpurified in vitro transcription reactions or directly in cells will be more challenging, but may be achieved by using time-resolved cryo-EM and cryo-ET.
The main factor limiting the resolution of our cryo-EM reconstructions appears to be a continuous dynamic motion that is inherent in most RNA structures. Using 3D variability analysis, we identified the crossovers and helical termini as the main points of flexibility. The crossovers had the largest flexibility range for φ, resulting in a bending motion of sheets and bundles, whereas the θ angles had a narrower range since they are constrained by DX. The flexibility of the helical termini is of particular concern for the application of RNA origami as nanoscaffolds, since the flexibility will affect the precision by which we can position RNA elements such as aptamers for proteins or small molecules12. In future scaffold-design efforts, more rigid structures may be achieved by the use of shorter crossover distances, the addition of stabilizing motifs or the use of tensegrity architectures53. For multidomain RNA structures, we used cryo-ET to characterize the global shape of individual molecules in solution. This approach may allow the structural characterization of other flexible RNA molecules and intermediates of co-transcriptional folding.
Our study represents the first step of a promising design–build–test–learn cycle for the development of RNA nanostructures, which was achieved by high-quality structural feedback from high-resolution characterization using cryo-EM. The iterative design cycle will allow us to obtain more reliable RNA scaffolds and build advanced devices that combine fluorescent RNA aptamers54, dynamic RNA switches55 and RNA strand displacement56 to create the next generation of functional RNA nanostructures for use in synthetic biology and medicine. RNA nanostructures have several benefits for use as therapeutics such as low immunogenicity, tunable immunostimulatory properties and programmability57, but have traditionally been hierarchically assembled with multiple intermediate purification steps, resulting in low yield58. However, by using co-transcriptional folding to produce RNA nanostructures, we can take advantage of the high fidelity of coupled synthesis and self-assembly to enable the large-scale production of RNA medicine.
Methods
Design and production of RNA origami structures
RNA origami blueprints were designed as described previously12. Briefly, a 2D blueprint describing the desired base pairing and KL contacts is input into the revolver program from the ROAD software suite and hundreds of suggested sequences that could fulfil the requirements are found, and the sequence with the lowest ensemble diversity59 is then chosen and checked in NUPACK60 for potential alternate conformations.
The best candidate sequence is then ordered as double-stranded DNA for cloning into a modified pUC vector. Plasmids are sequenced to ensure no mutations are present. Plasmids for large-scale transcriptions are produced in DH5-alpha cells using the MaxiPrep kit from MACHEREY-NAGEL. Purified plasmid is then restriction digested overnight with BsaI (New England Biolabs), which cleaves the DNA such that the last template nucleotide is the 3′ end of our RNA origami. Plasmid is then purified by triple phenol chloroform extraction followed by ethanol precipitation. The linearized plasmid is then resuspended in RNase-free water and diluted to 0.5 mg ml–1.
Transcription reactions are set up in a transcription buffer containing 40 mM Tris–Cl (pH 8.0) at 37 °C, 1 mM spermidine, 0.001% Triton X-100, 100 mM DTT, 12 mM MgCl2, 8 mM NTP mix and 0.05 mg ml–1 template DNA. Transcriptions are started on the addition of in-house prepared T7 polymerase and transcription reactions are carried out for 3 h at 37 °C. Precipitated inorganic pyrophosphate is pelleted by centrifugation at 17,000g for 5 min at room temperature. The transcription reaction is then loaded onto a Superose 6 column (Cytiva) equilibrated with 25 mM HEPES buffer (pH 8.0), 50 mM KCl and 5 mM MgCl2. The major RNA peak is then collected and concentrated in 10-kDa-cutoff Amicon spin concentrators to the desired concentration.
Cryo-EM sample preparation
Ideal sample concentrations for the cryo-EM of RNA origami were found in the 2.5–3.0 mg ml–1 range, as determined by A260 measurements on a DeNovix DS-11 instrument. Initial difficulties obtaining samples in the holes of carbon-film grids were overcome by switching to all-gold grids. We used ProtoChips Au-FLAT 1.2/1.3 300 mesh grids for all the samples in this study. Grids were glow discharged for 45 s at 15 mA in a PELCO easiGlow immediately before sample application. Grids were plunge frozen using Leica GP2; the sample application chamber was kept at 100% humidity and 21 °C. Also, 3 μl of the sample was applied to the grid, which was then blotted with a manually calibrated stopping distance onto a double layer of Whatman no. 1 filter paper using a 4 s delay after application, 6 s of blot time and 0 s of delay after blotting before plunging into liquid ethane at –184 °C.
Cryo-EM data collection
Except for the 5HT-B and 6HBC-2 datasets, all the data were acquired at 300 keV on a Titan Krios G3i instrument (Thermo Fisher Scientific) equipped with a K3 camera (Gatan/Ametek) and energy filter operated in the energy-filtered transmission electron microscopy mode using a slit width of 20 eV. The 6HBC-2 and 5HT-B datasets were acquired on Titan Krios G1 equipped with Cs corrector and K2 camera (Gatan/Ametek). The data were collected over a defocus range of −0.5 to −2.0 μm with a targeted dose of 60 e− Å–2. Automated data collection was performed with EPU and the data saved as gain-normalized compressed TIFF files (K3) or MRC files (K2) with pixel sizes of 0.645 and 0.860 Å px–1, respectively.
Cryo-EM single-particle analysis and data processing
Except for the 5HT-B and 6HBC-2 datasets, all the data were processed using CS-Live to apply motion correction, contrast transfer function (CTF) fitting and initial particle picking61. The 5HT-B and 6HBC-2 datasets were pre-processed using Warp62. Typically, the refined 3D volume from CS-Live (or Warp) was used for a homogeneous refinement in cryoSPARC v. 3.2. Fifty 2D templates were created from this refined volume and templated particle picking was performed using these templates. Particles were then extracted at a pixel size of ~2.7 Å px–1 and three ab initio models were generated using a subset of 30,000 randomly selected particles. A heterogeneous refinement using the three ab initio models and all the extracted particles was then performed. At this point, we would have one or two junk classes and one or two classes resembling our RNA origami. A non-uniform homogeneous refinement63 would then be performed using the particles from the good 3D classes. The particles were then re-extracted with adjusted centring of the extraction box based on the aligned particle positions. If the Nyquist resolution was reached or close to being reached, we re-extracted the particles with a bigger box size and less Fourier cropping. These re-extracted particles and the mask from the previous homogeneous refinement were then used as input for a 3D variability analysis61, solving for three modes of variability at a filter resolution of 2 Å above the resolution attained from the previous homogeneous refinement.
We continued particle curation from this point using two to three classes of heterogeneous refinements with the same input volume. After each heterogeneous refinement, the highest-resolution class was used for a homogeneous refinement and then another round of heterogeneous refinement was performed until we reached a point of diminishing return where there was no difference in the heterogeneously refined classes, or until the resolution became worse due to a decreasing particle stack. We found that this method of particle curation produced the best overall maps. However, we were able to produce a map with better local resolution at the most variable KL from the 6HBC-mature dataset by selecting a subset of particles from the 3D variability analysis.
As the last step, we performed local refinement from the last homogeneous refinement, which improved the overall quality of the map as well as Fourier shell correlation (FSC). Local resolution estimation and filtering was also applied within cryoSPARC to adjust the sharpening of the maps and provide a visual representation of the local resolution of the maps. To further improve the best-resolved regions of 5HT-A, we created a mask that covered only the three central helices of the origami. A local refinement using this mask resulted in an overall resolution of 3.95 Å and improved density at the crossover and KL regions.
3D variability analysis
3DVA was performed in cryoSPARC using particle stacks from the first round of 3D classification. The classes that resembled the origami and not the junk classes were used as an input for 3DVA. The mask from the best class was used as an input for the 3DVA jobs and the filter resolution was set to 9 Å for the 6HBC analysis and 5 Å for the 5HT-A analysis. Expanding the mask and using higher and lower filter thresholds was attempted, but either did not perceptibly change the output or made it worse. For generating the videos, we used the simple and linear 3DVA display option to produce 20 frames from each variability component. These were then viewed as a vseries in ChimeraX oscillating from frames 0 to 19. For the measurement of φ and θ angles from 5HT-A, we performed the 3DVA display job in the intermediate mode to attain more robust reconstructions. To measure the φ angles, z-plane cross-sections were taken at the crossovers, the centre of each helix was located and the inter-helical angle determined using trigonometry. To measure the θ angles, we performed rigid-body docking with short A-form RNA helices using the fitmap tool in ChimeraX and then created a helical axis across the crossover junctions and measured their angles in ChimeraX.
Model building
The model was built in ChimeraX64–66. The NMR structure PDB:2d1b was truncated and fit into the KL regions of the cryo-EM volume as a starting template because a comparison of our reconstruction with the available KLs from the protein databank revealed the best cross-correlation with the NMR model of PDB:2d1b. One might argue that we are biasing our models. However, in the case of mature 6HB where we consistently observed extra density, our 2d1b input model changes to a bulged-out conformation on real-space refinement (RSR) or initialization of molecular dynamics flexible fitting (MDFF) simulations. Other helical components were generated for each helical segment using RNAbuild12, leaving free 5′ and 3′ ends at the crossover junctions, and then manually positioned into the cryo-EM volume. Once the helical placement was approximately correct, the individual components were joined using the ‘make bond’ command from the ISOLDE67 add-on to ChimeraX. The resulting PDB file was renumbered using the pdb-tools pdb-reres program68 and then the correctly numbered PDB file was sequence corrected in ChimeraX using the swapna command. This model was then passed through RSR in Phenix69–71 (using default parameters, our best-refined volume and the resolution supplied by the FSC curve at a cutoff of 0.143) to remove any severe clashes that ISOLDE could not handle. The models were then inspected in ChimeraX and subjected to further refinement using MDFF with VMD using ISOLDE67. A final round of RSR in Phenix was performed to optimize the backbone angles. The validation of the goodness of fit between the model and map were performed using the Phenix validation tool71–73. The Phenix RSR and ISOLDE MDFF had comparable cross-correlations to the EM maps, but the ISOLDE MDFF produced fewer severe clashes than the Phenix refinement tool, whereas Phenix produced more usual backbone rotamers at the expense of more clashes.
Measurements of structural parameters
Helical parameters were measured using the Curves+ v.2.6 software74,75. Helical fragments of interest were isolated from the PDB model and renumbered using pdb_reres. Each double-stranded segment was then input into the Curves+ program and the helical-rise, helical-twist, major-groove and minor-groove width parameters were extracted from the resulting LIS file. The helical parameters are listed in Extended Data Fig. 2d.
The crossover angles defined in Extended Data Fig. 3a were measured in PyMOL using both density map and fitted model shown in orthoscopic view. The crossover angle θ was measured by orienting the helices along the x axis with the junction nucleotides J1–J4 in a clockwise orientation running from 5′ to 3′. The junction is rotated by 90° about the x axis to have J2 and J3 on top. The helical axes are now estimated from the density map or the fitted model and the θ angle is measured. The measured θ angles are listed in Extended Data Fig. 3b.
The seam curvature angle φ was measured by orienting three helices connected by two crossovers that participate in a seam along the x axis with junction nucleotides J1–J4 of the two crossovers in a clockwise orientation. The seam was rotated by 90° about the y axis to view helices along the helical axis and have J1 and J2 on top. The centre of the helices is now estimated from the density map or fitted model in the region close to the crossover and the φ angle is measured as the angle between the three helix centres. The measured φ angles are listed in Extended Data Fig. 3c.
The seam twist angle τ was measured by orienting three helices connected by four crossovers that participate in two adjacent seams along the x axis with the junction nucleotides J1–J4 of the four crossovers in a clockwise orientation. The seams were rotated by 90° about the y axis to view helices along the helical axis and have J1 and J2 on top. The two crossovers of the bottom two helices are aligned based on the fitted model and the τ angle measured as the angle between this crossover and the two crossovers of the top two helices. The measured τ angles are listed in Extended Data Fig. 3d.
SAXS
The samples were measured in an in-house laboratory-based instrument called HyperSAXS76. The instrument is an optimized Bruker SAXS NanoStar with a Ga-metal jet from Excillum and home-built scatterless slits77. The RNA sample for SAXS experiments was transcribed for 3 h, followed by a 30 min size-exclusion chromatography purification and a 15 min delay before the first SAXS measurements were taken. The sample was continuously measured in 15 min frames for 17.5 h in total at 25 °C with a concentration of 0.57 mg ml–1. The buffer was measured beforehand for 0.5 h and subtracted from each frame and the data were converted to the absolute scale using a water sample measured at 20 °C using the SUPERSAXS software package78. All the SAXS data are plotted as a function of q, which is defined as q = (4πsin(θ))/λGa, where the scattering angle is defined as 2θ and λGa = 1.34 Å. The transition is visualized by plotting an average of seven data points around the value of q = 0.090 Å−1 (0.082–0.100 Å−1).
The intermediate frames were modelled as a linear combination of the initial and final frame to test if this two-state approximation could describe the data. We found that using the first and last frames for linear combinations, the χ2 values were not stable over time. Instead, the second and last frames were used, which produced low and stable χ2 values across the whole series that shows all the intermediate frames are well described by the two-state approximation. For time-resolved measurements, it is often necessary to discard the first frame, as there can be small effects from shearing when loading the sample through the tube or changes in temperature.
As all the intermediate frames can be effectively described by a linear combination of the initial and mature state, the entire time series can be described by modelling the initial and mature state. First, the wlsq_PDBx program79 was used to calculate the theoretical scattering curve of the cryo-EM-derived structures. These were fitted to the data with only the concentration and a constant background as the fitting parameters.
To improve the fits, Monte Carlo simulations were performed using the structures from cryo-EM. The six individual helixes were separated, and the long helix that kinked in the initial structure was separated in two parts, which gave a total of seven rigid structure elements that could move in relation to each other during the Monte Carlo simulations. The separation of structural elements was separately done using the cryo-EM structure of the initial or mature state. The simulations were run with a low penalty score for clashes to accommodate a broad flexibility of the structures. Ten simulations were run for the initial and mature structure. The Calc NSD program was used to determine the structure that best described the ensemble of the ten individual simulations. A χ2 value was calculated for each simulation and the average χ2 value is given by the standard deviation calculated from all the ten simulations.
NS-TEM
For a negative stain, the samples were diluted to a concentration of 0.03–0.10 mg ml–1. We used ultrathin carbon-film 400 mesh copper grids (CF400-Cu-UL) from Electron Microscopy Sciences for our NS-TEM work. The grids were glow discharged for 45 s at 25 mA using a PELCO easiGlow before sample application. Here 3 μl of the sample was applied to the carbon film for 1 min before side blotting on Whatman no. 1 filter paper and the immediate application of 3 μl of uranyl formate (5%) solution followed by immediate blotting and reapplication of uranyl formate for a total of three rounds of staining. The grids were then air dried for 10 min before imaging.
The images were acquired on Tecnai Spirit at 120 kV equipped with a TVIPS 4k camera with a pixel size of 1.54 Å px–1 using Leginon80 to automate the acquisition of data. The data were saved as 16-bit TIFF files and converted to the MRC format using EMAN281 before importing into cryoSPARC for image analysis. The micrographs were CTF corrected with patch CTF within cryoSPARC and curated to remove any bad images. Manual picking was performed for an initial 300 particles that were used to generate the templates for templated particle picking. Templated picking resulted in 70,000 particles that were extracted with a box size of 512 px downsampled to 128 px. The 2D classification into 50 classes produced a subset of 18,609 particles, where we could clearly identify the 6HB component and both 5HT wings of the satellite, as well as a single class where the 6HB had landed on its helical axis. These particles were further classified into 50 classes to reveal the conformational heterogeneity of the wing placement. Ab initio models lacked sufficient angular distribution of particles to properly reconstruct the 3D volume; therefore, a 3D template was supplied to enable a better-quality 3D reconstruction to be made.
Cryo-ET data acquisition and 3D reconstruction
The cryo-EM specimens of the RNA origami satellite were imaged by a Titan Krios G3i TEM instrument (Thermo Fisher Scientific) with a Gatan energy filter operated under 300 keV. The micrographs were acquired on a Gatan K3 direct electron detector operated in the correlated double sampling mode82 at a nominal magnification of ×42,000 (corresponding to 2.1 Å px–1) with a dose rate of 1.82 e− Å–2 s–1 and a defocus of ~2.5 μm. Each tilt image was exposed for 3.4 s. The tilt series were symmetrically acquired by SerialEM83 in a tilting range of ±50° with a tilting step of 5° and 10° under a total dose of 130 and 68 e− Å–2, respectively. The untilted images were acquired by a Titan Krios G2 TEM instrument at a nominal magnification of ×81,000 under an exposure time of 2.8 s with a total dose of 50 e− Å–2.
Motion correction was conducted by MotionCor2 v. 1.4.084. The tilt series of whole micrographs were initially aligned by using IMOD v. 4.9.946. The CTF was determined by the GCTF v. 1.06 software package85 and then corrected by TOMOCTF86. Additionally, to reduce image noise, the tilt series were further processed by a machine learning software called CSBDeep87, a median-filter process and a contrast-enhancement method. The reference-free 3D reconstruction of each individual particle of RNA origami satellite was conducted by the IMOD46 and IPET88 protocols. Using IMOD, the full-size tilt series after CTF correction was used for 3D reconstruction as a control. In IPET, the tilt series containing a single particle was extracted from the full-size tilt series. This allows us to perform a ‘focused’ 3D reconstruction, such that the reconstruction is less sensitive to image distortion, tilt axis variation with respect to tilt angle and tilt angle offset. Briefly, each targeted particle was first windowed and then extracted from the whole-micrograph tilt series into a small-size tilt series in the size of 256 × 256 px (2.1 Å px–1). To start the 3D reconstruction, an ab initio 3D map was generated as an initial model through backprojecting the small-size tilt series. During the iteration and refinement processes, a set of Gaussian low-pass filter, soft-boundary circular and particle-shaped masks were automatically generated and sequentially applied to the tilt series and projections of the references to increase their signal-to-noise ratio (SNR). To reduce the missing-wedge artefact caused by the limited tilt angle range, the final 3D map was submitted to a low-tilt tomographic 3D reconstruction method called LoTToR47. All the cryo-ET 3D reconstructions were low-pass filtered to 60 Å using EMAN89 and displayed by Chimera v. 1.1564. The resolution was estimated by three methods. (1) Frame-based analysis: the FSC data between two reconstructed 3D maps from two halves of the frames at each tilt angle were generated using the aligned-particle tilt series. The frequencies at which the FSC curve first falls to values of 0.500 and 0.143 were used to represent the resolution. (2) Tilt-angle-based analysis: the FSC data between the two reconstructed 3D maps from the two halves of the tilt series88 (based on their odd and even tilt index) were generated using IPET-aligned-particle tilt series. The frequencies at which the FSC curve first falls to a value of 0.500 and 0.143 were used to represent the resolution. (3) Data-to-model-based analysis: the FSC curve between the final cryo-ET reconstruction and fitting-model-generated density map was computed, and the frequencies at which the FSC curve fell below 0.5 was used as the estimated resolution. The density map of the fitting model was generated by pdb2mrc in EMAN89.
Although the resolution (~3 nm) of the reference-free cryo-ET 3D reconstructions of the RNA origami satellite is not sufficient to determine the secondary structure of each individual satellite, it is sufficient to shed some light on the domain orientations and positions. Sixteen density maps were used to build an initial satellite model. This model was used to show the flexibility in angle of bKL by the rigid-body docking of each domain into the 16 density maps. During this process, two bKL and one 6HBC of the RNA origami satellite model were separately translated and rotated to fit it to the target position in the density map. As a result, the achieved conformation of the RNA origami satellite had the same domain structure as the initial structure but differed in the relative position and orientation of domains.
Extended Data
Extended Data Fig. 1 |. Overview of RNA origami designs, cryo-EM reconstructions and atomic models used in the study.
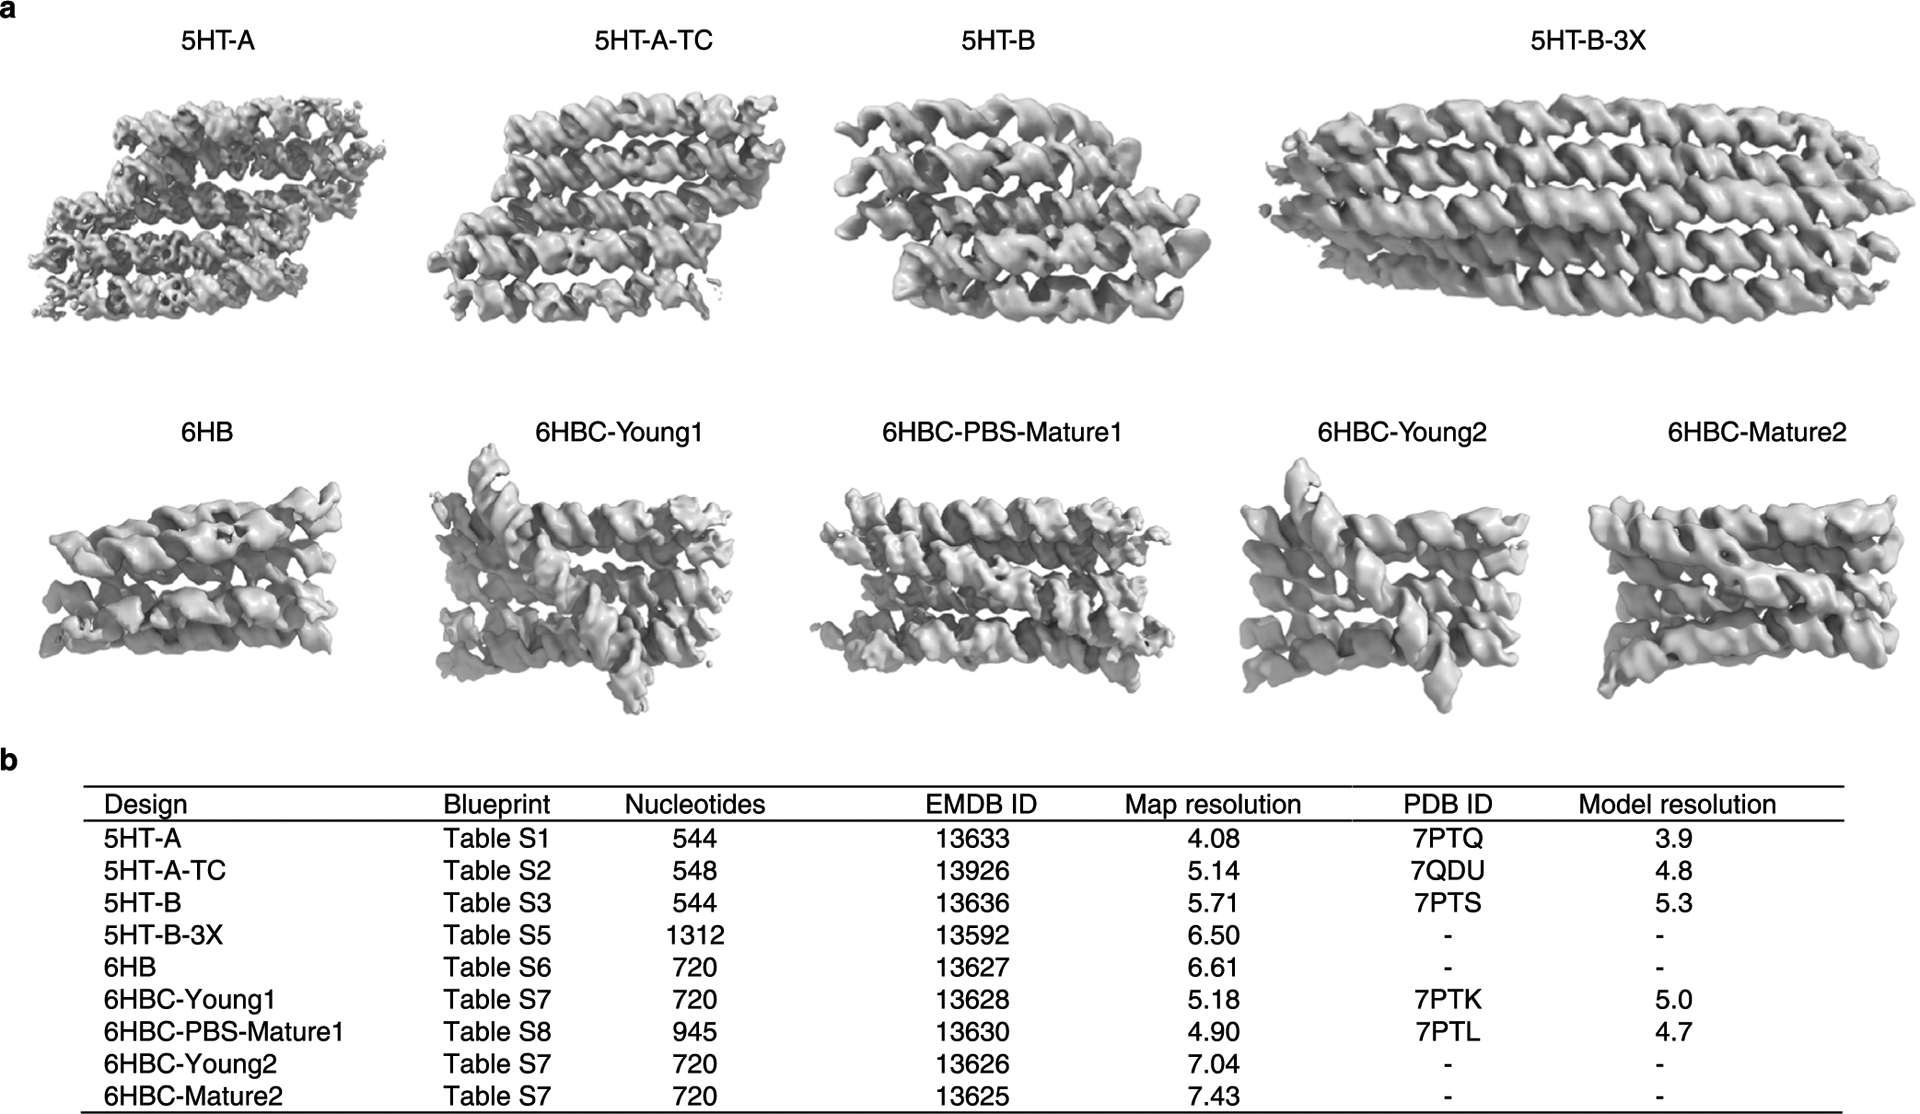
a, Example cryo-EM reconstructions for sheets (top row) and bundles (bottom row). b, Table listing RNA origami designs by name, blueprint, number of nucleotides, EMD ID, Gold-Standard Fourier Shell Correlation (GSFSC) for the reconstructions, PDB ID and model resolution (see Supplementary Table 10 for further details).
Extended Data Fig. 2 |. Reconstruction and model measurements of 5HT.
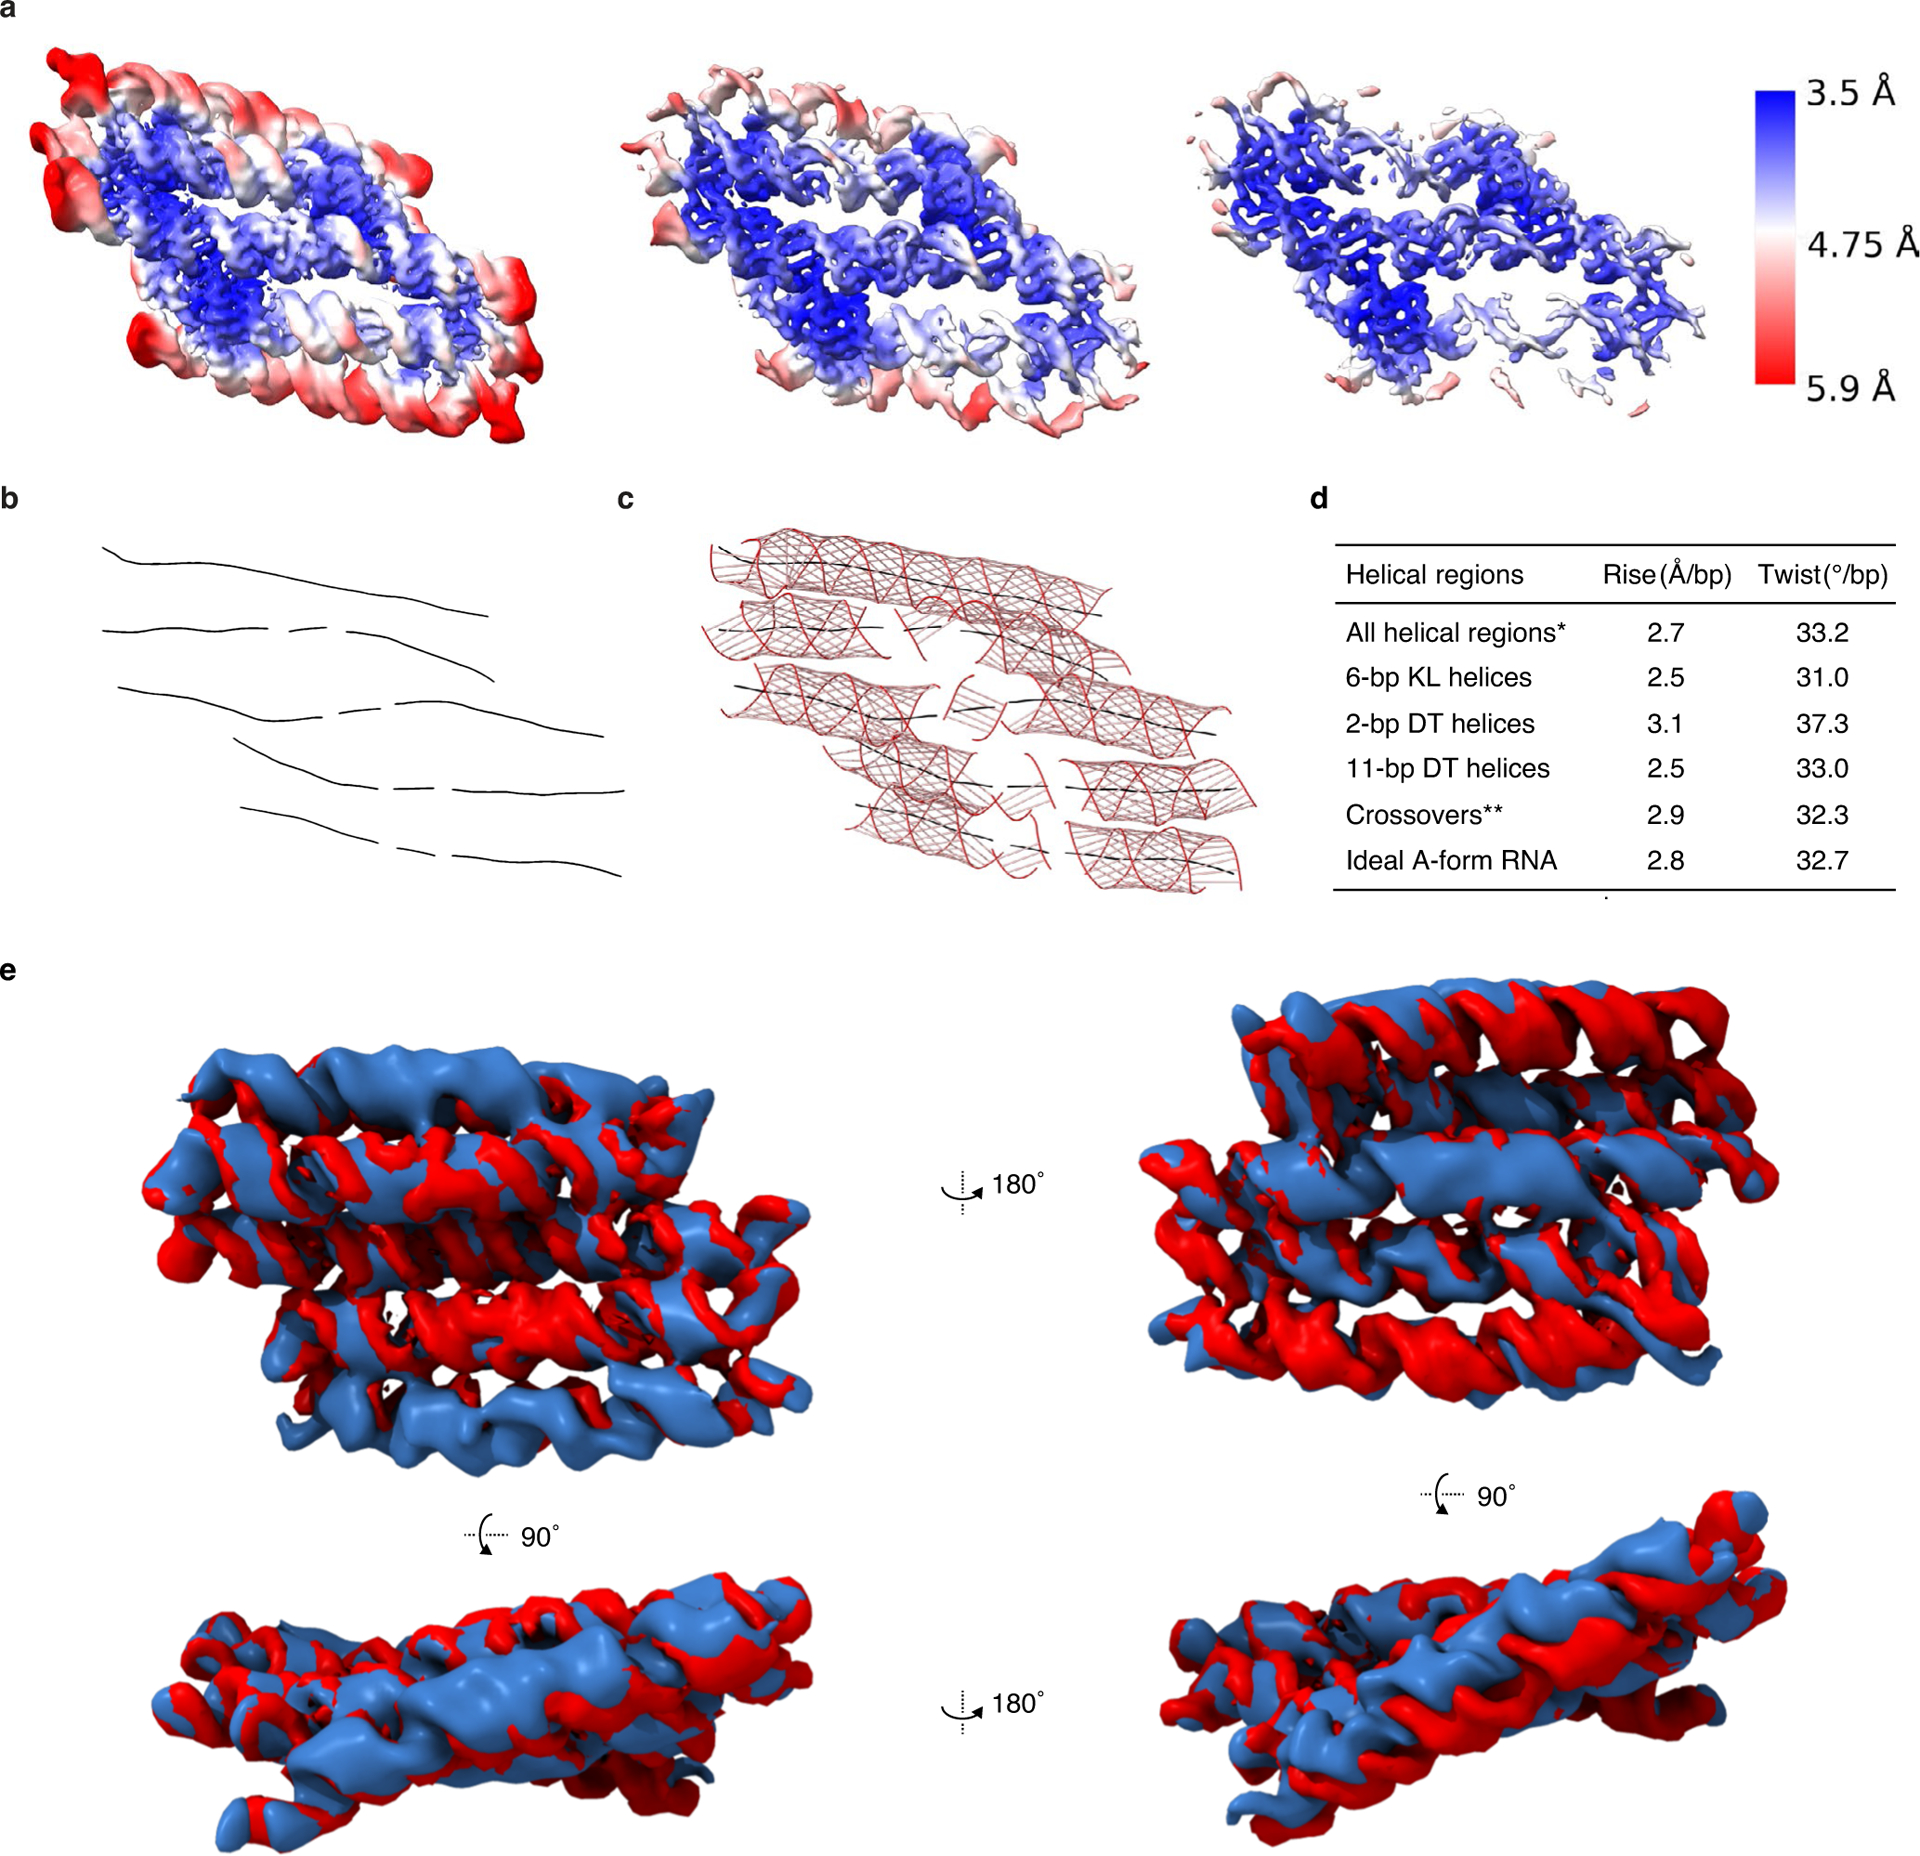
a, 5HT-A reconstruction based on local refinement of the 3 central helices shown at contour levels 0.344, 0.267 and 0.136 from left to right and colour coded by local resolution. b, Curves+ analysis of the 5HT-A model with helical axis shown as black lines. c, Curves+ analysis with backbone shown as red lines with major and minor groove measurements shown as grey lines. d, Tabulated data from Curves+ analysis of the helical components from the 5HT-A model. *All helical regions exclude KLs. **Crossover values are only based on the three central helices. e, Structural comparison of 5HT-B and 5HT-B-V2. Overlay of 5HT-B reconstructions with different kissing-loop sequences (blue is 5HT-B and red is 5HT-B-V2).
Extended Data Fig. 3 |. Definition and measurements of angles θ, φ and τ.
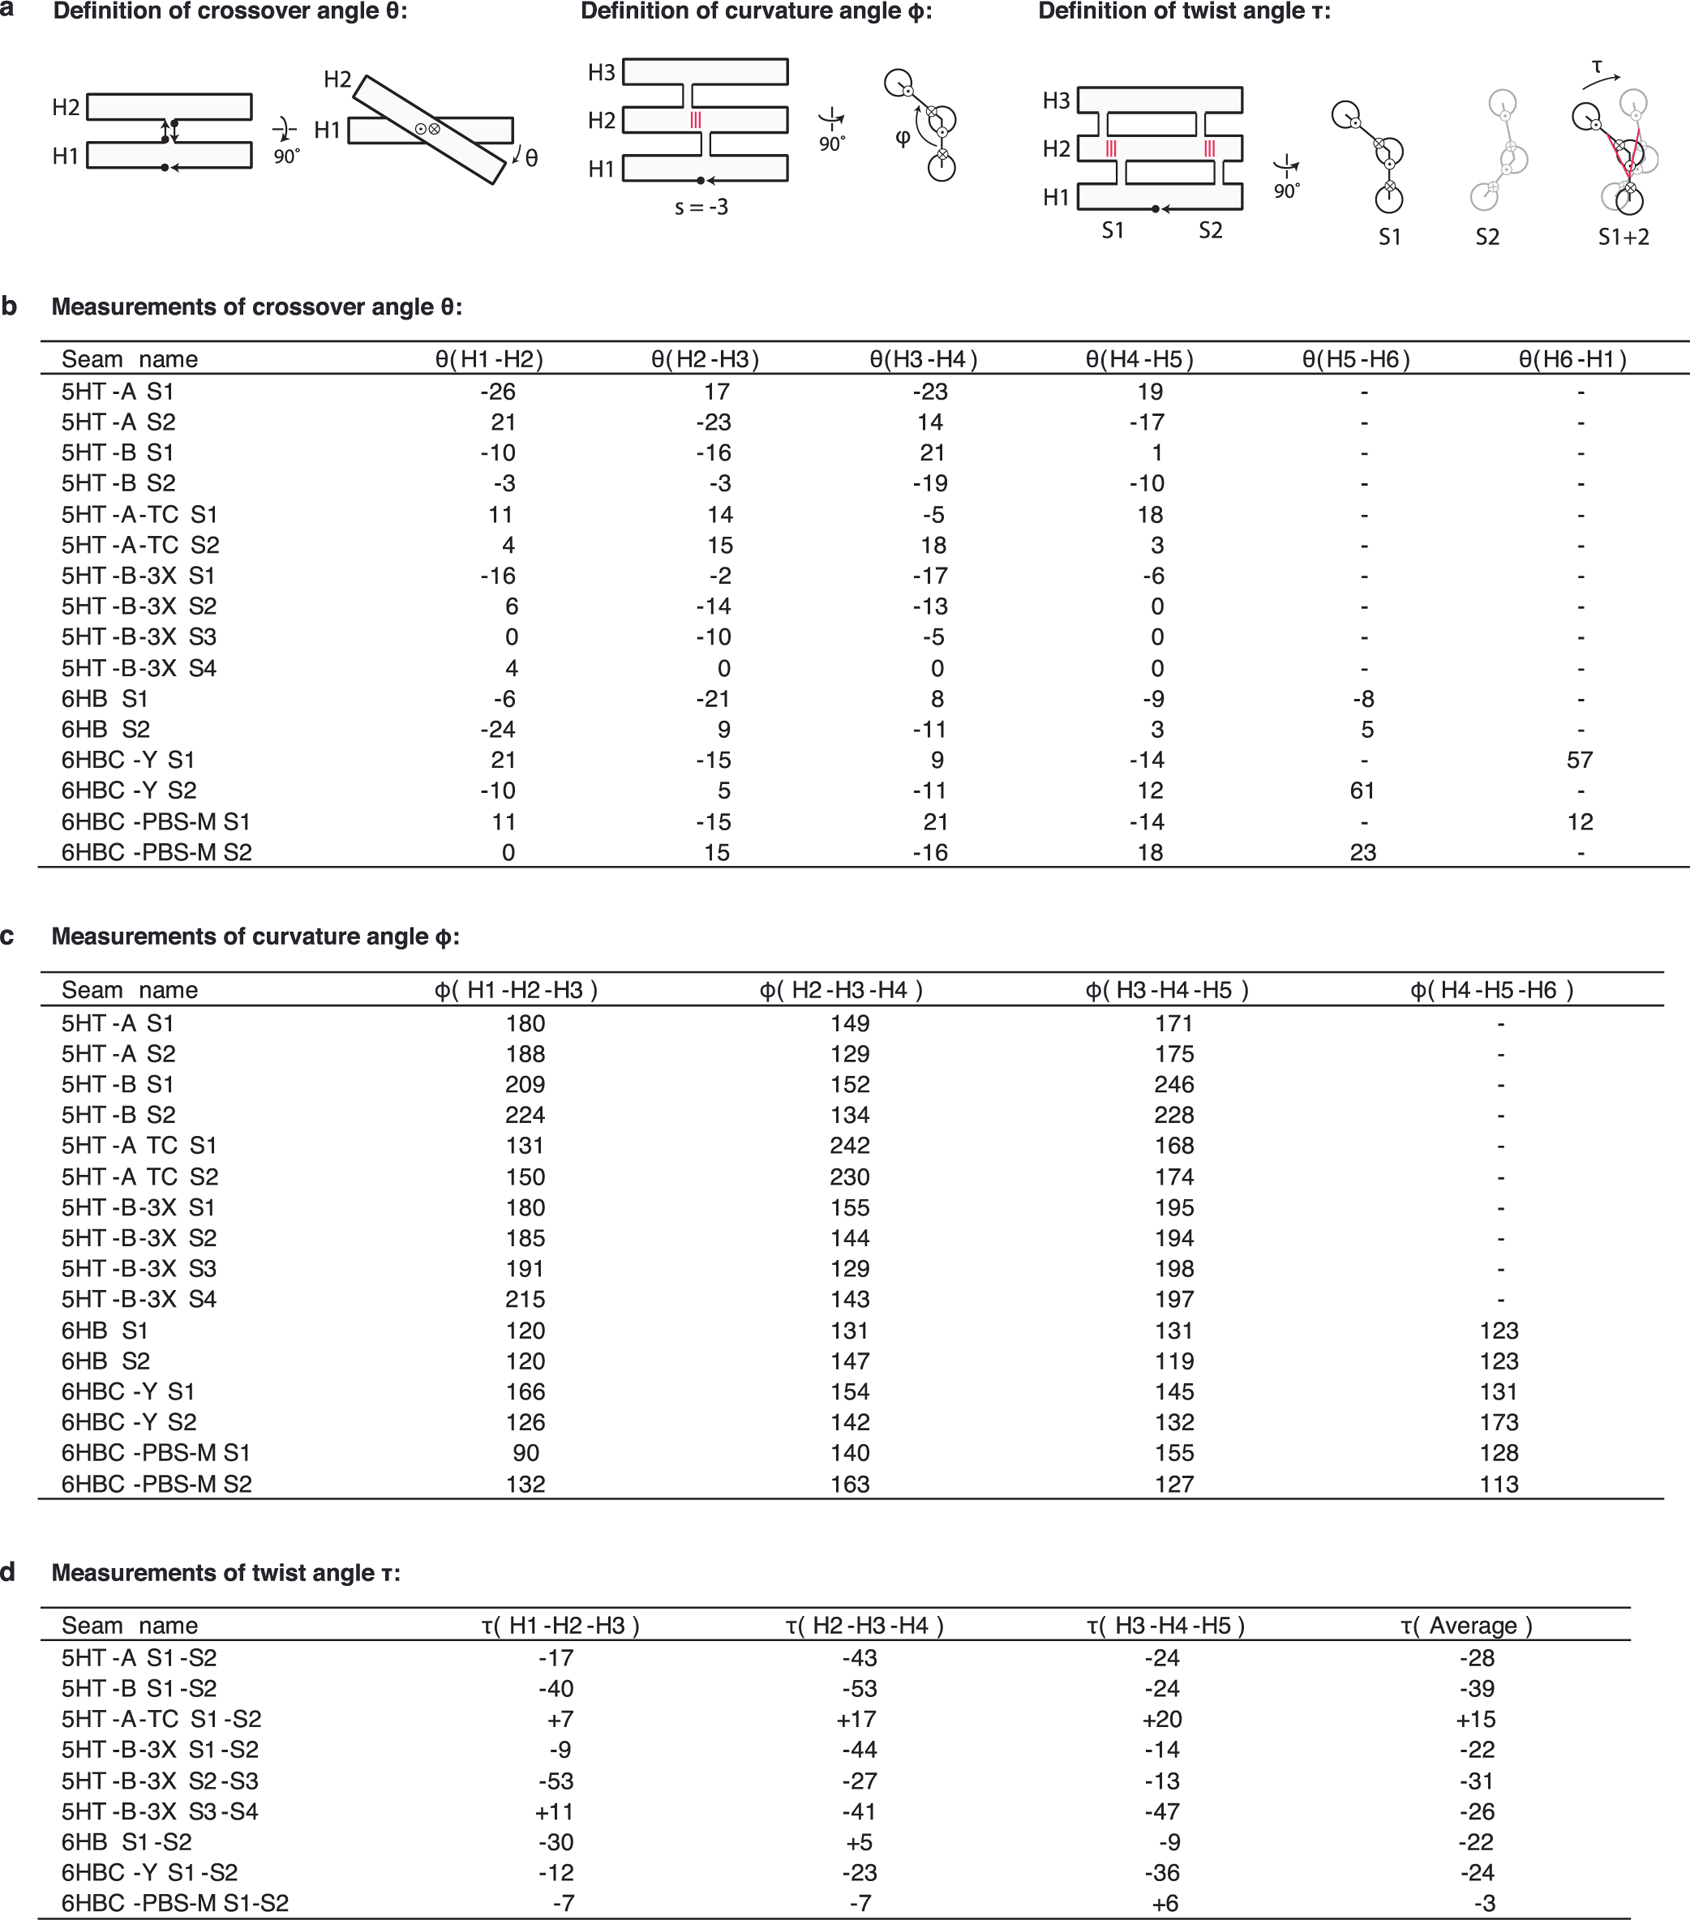
a, Schematics showing the definition of crossover angle θ, curvature angle φ and twist angle τ. Diagrams use arrows for 3′ and dots for 5′ when seen from side and circle with a dot for 3′ and circle with a cross for 5′ when seen from end. Direction of angles shown with arrow. Red lines indicate seam base pairs. The seams (S) and helices (H) are numbered from 5′ to 3′. b,c,d, Measurements of θ, φ and τ angles for different RNA origami designs, where angles are identified by seams and helices involved.
Extended Data Fig. 4 |. Comparison of KL regions and position of adenines.
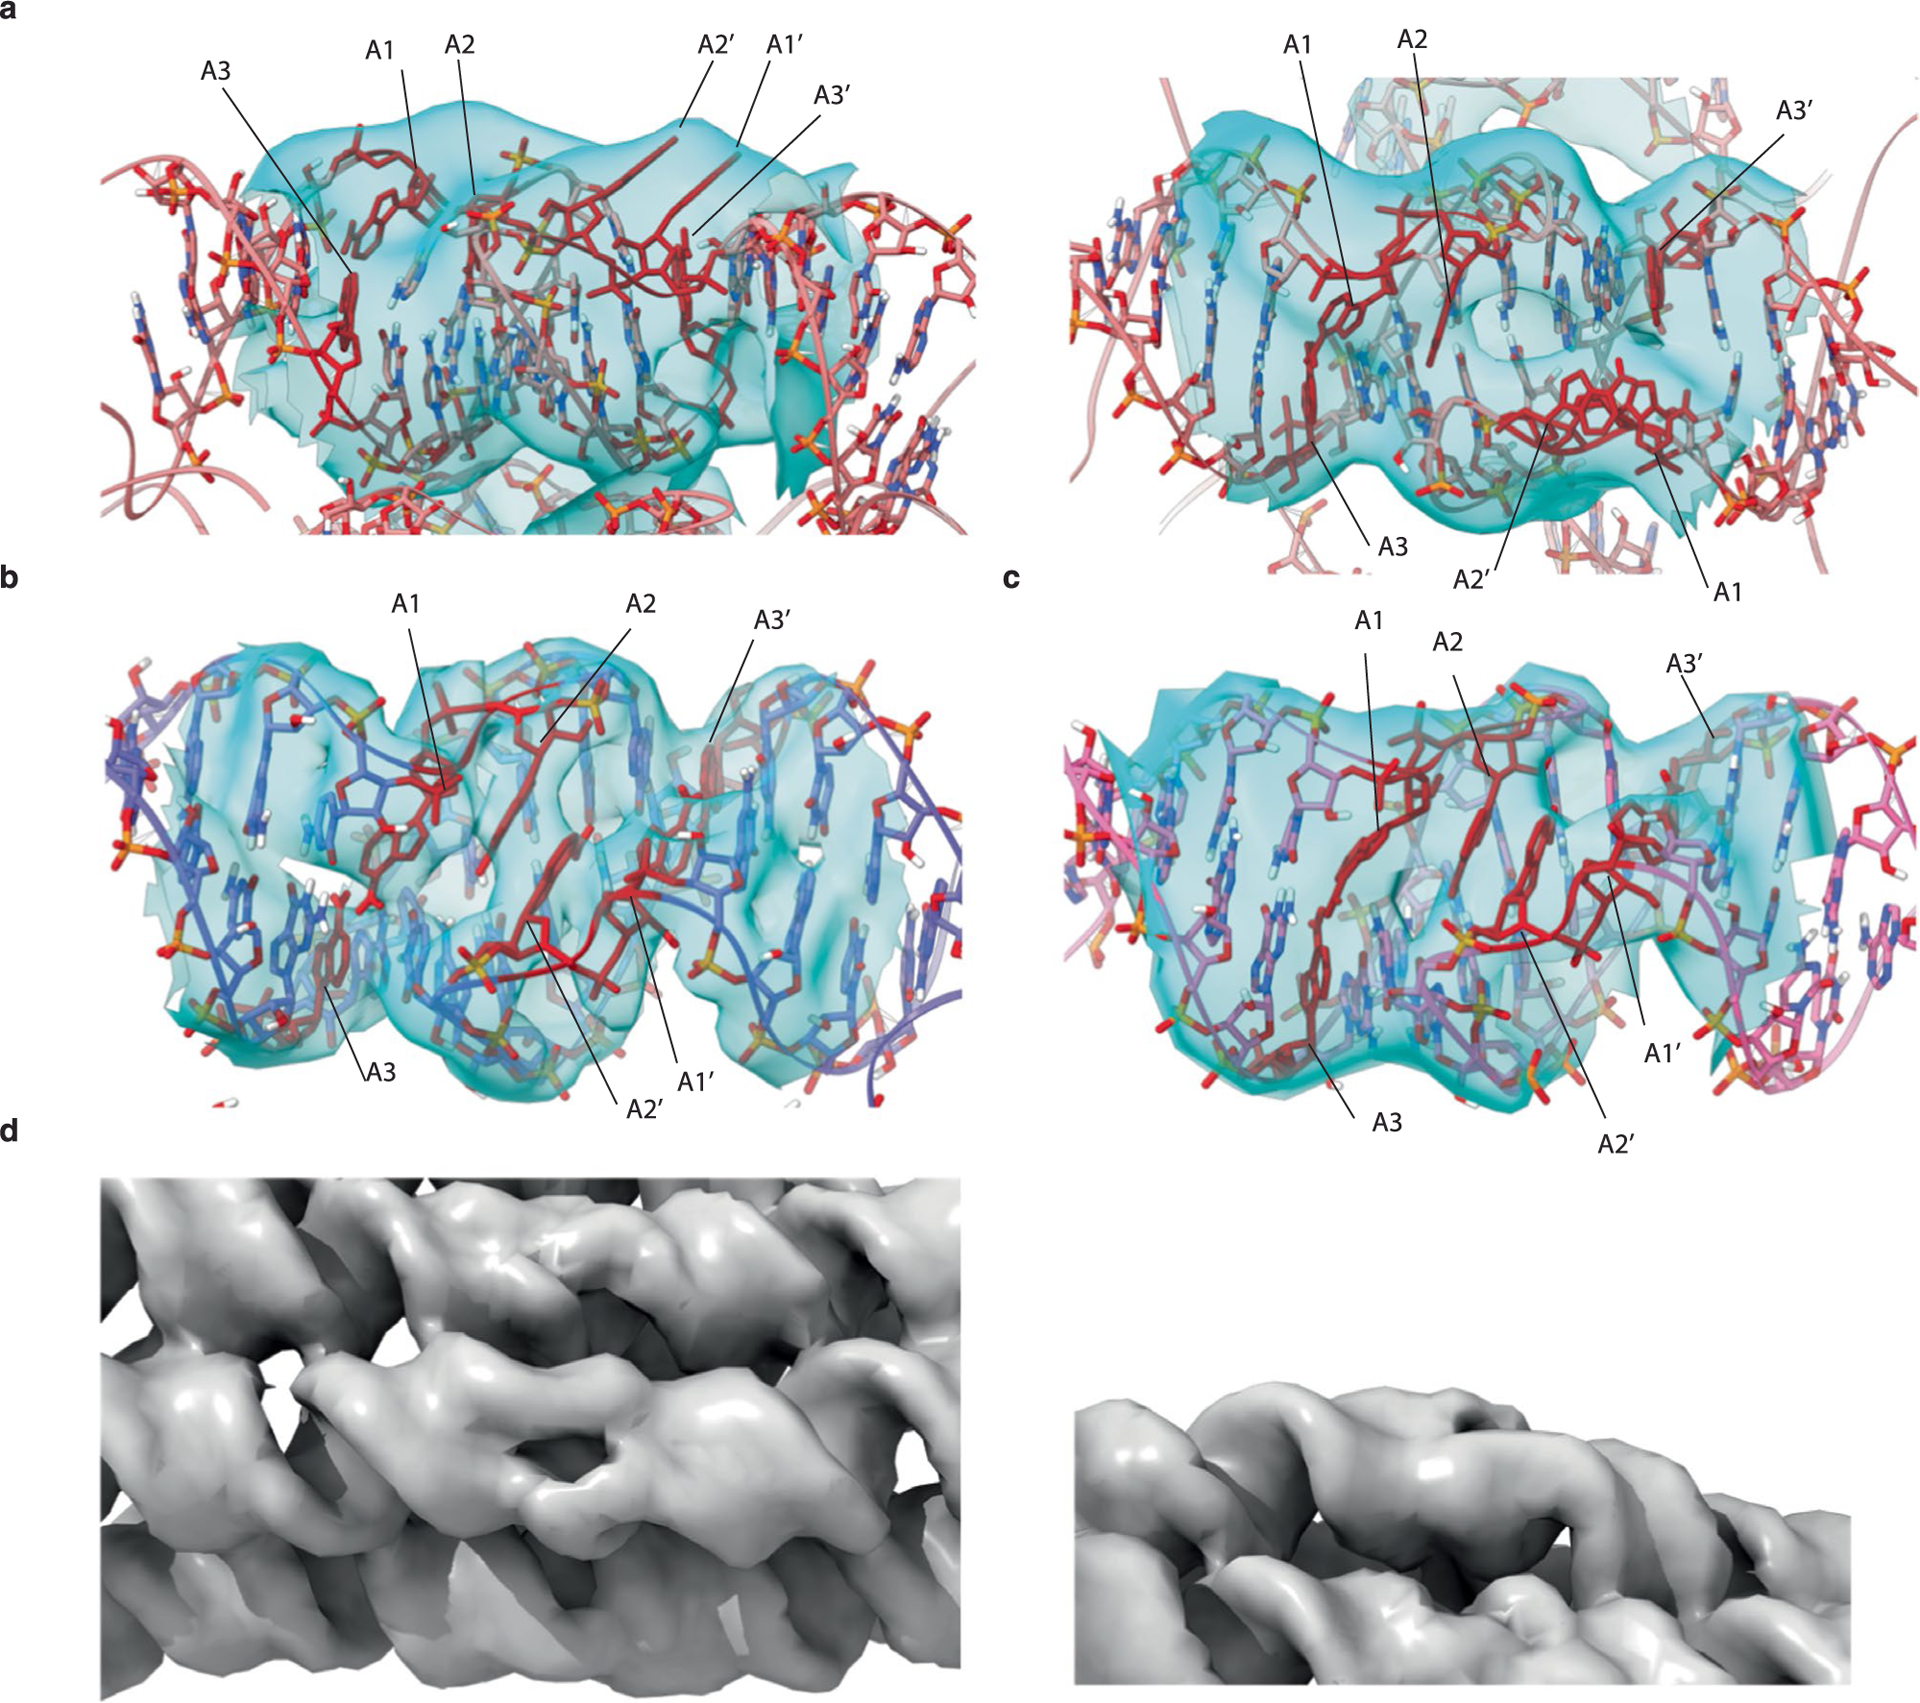
a, Two views of the instance of bulged-out adenines from our 6HBC-mature dataset. A notable protrusion is present where the adenines are modelled, and a clear lack of density is in the spot where density from base stacking adenines is observed in our highest resolution 5HT-A dataset b, and our lower resolution 5HT-B dataset, c. Adenines shown in red against coulomb potential map shown in cyan. d, A similar gap in density was observed in helix 3 of the 6HB no clasp reconstruction. Left image shows top view. Right image shows side view.
Extended Data Fig. 5 |. KL motif from X-ray crystallography and cryo-EM.
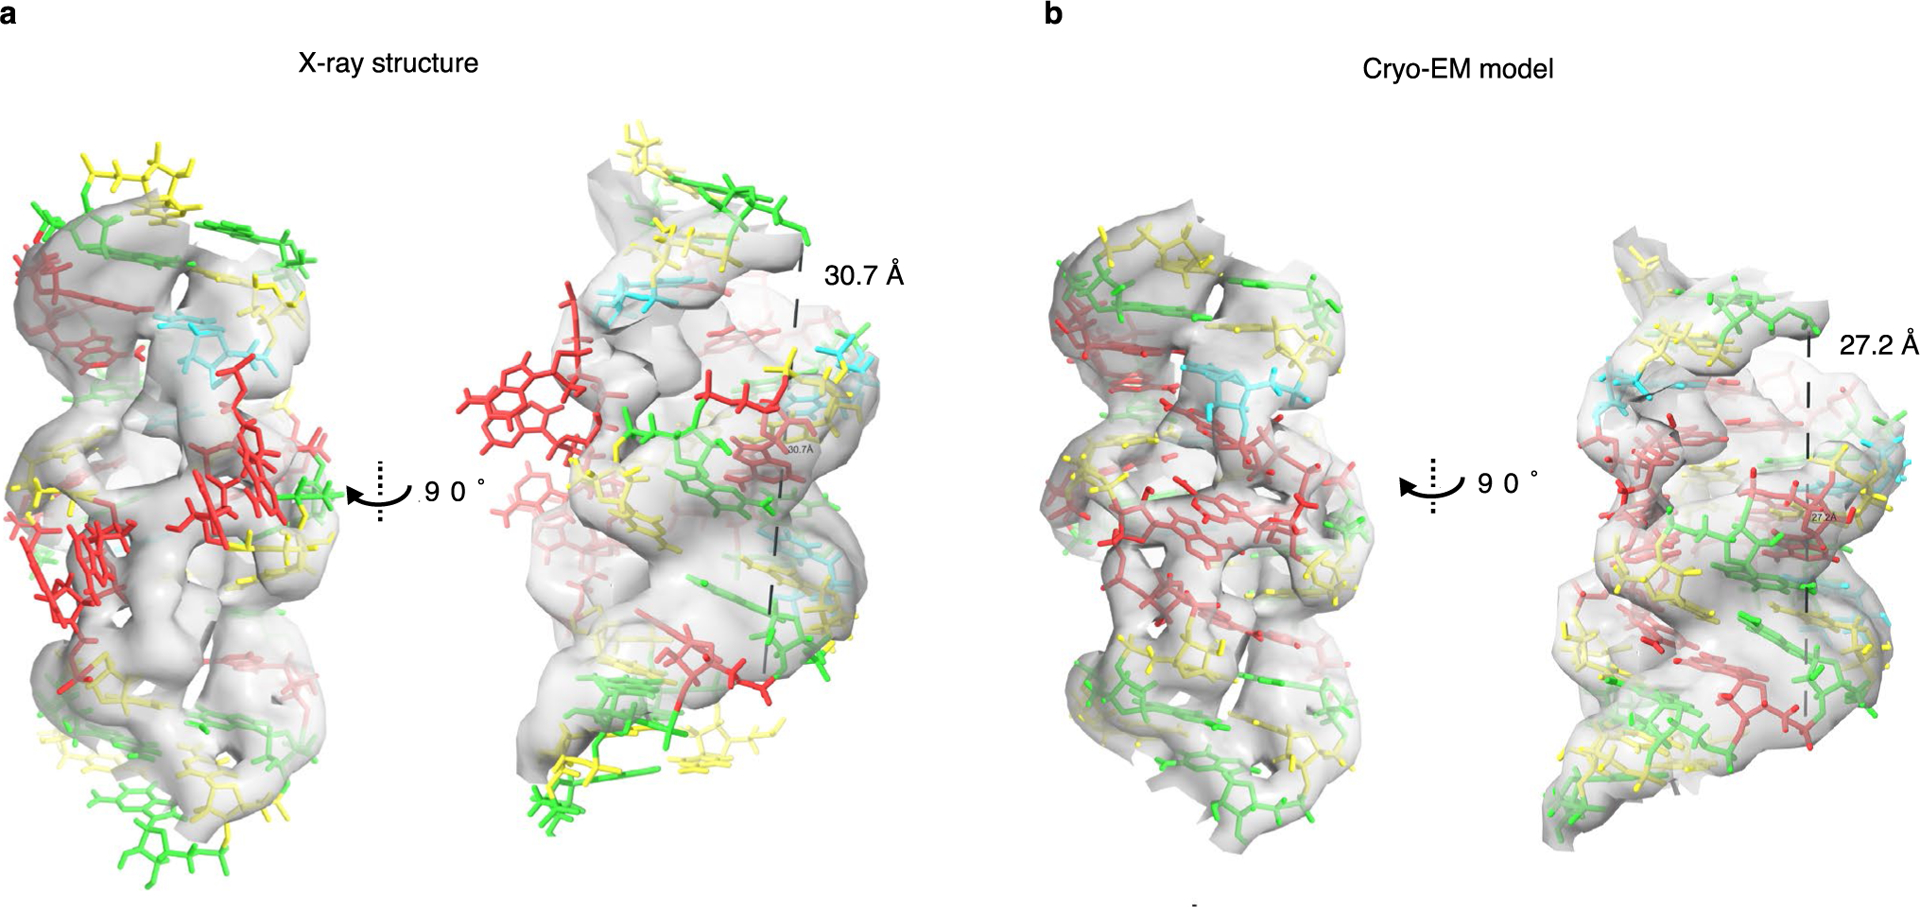
a, X-ray structure used for modelling RNA origami in silico and b, the model from our cryo-EM data. A line drawn between the phosphate of the first A in the KL motif and 3 nucleotides after the motif is parallel to the helical axis in the EM model, but tilted in the X-ray model. This, along with the P-P distance shows that the KL is compacted and underwound in the cryo-EM structure and can be approximated as 8 bp of A-form helix.
Extended Data Fig. 6 |. SAXS data and model fitting.
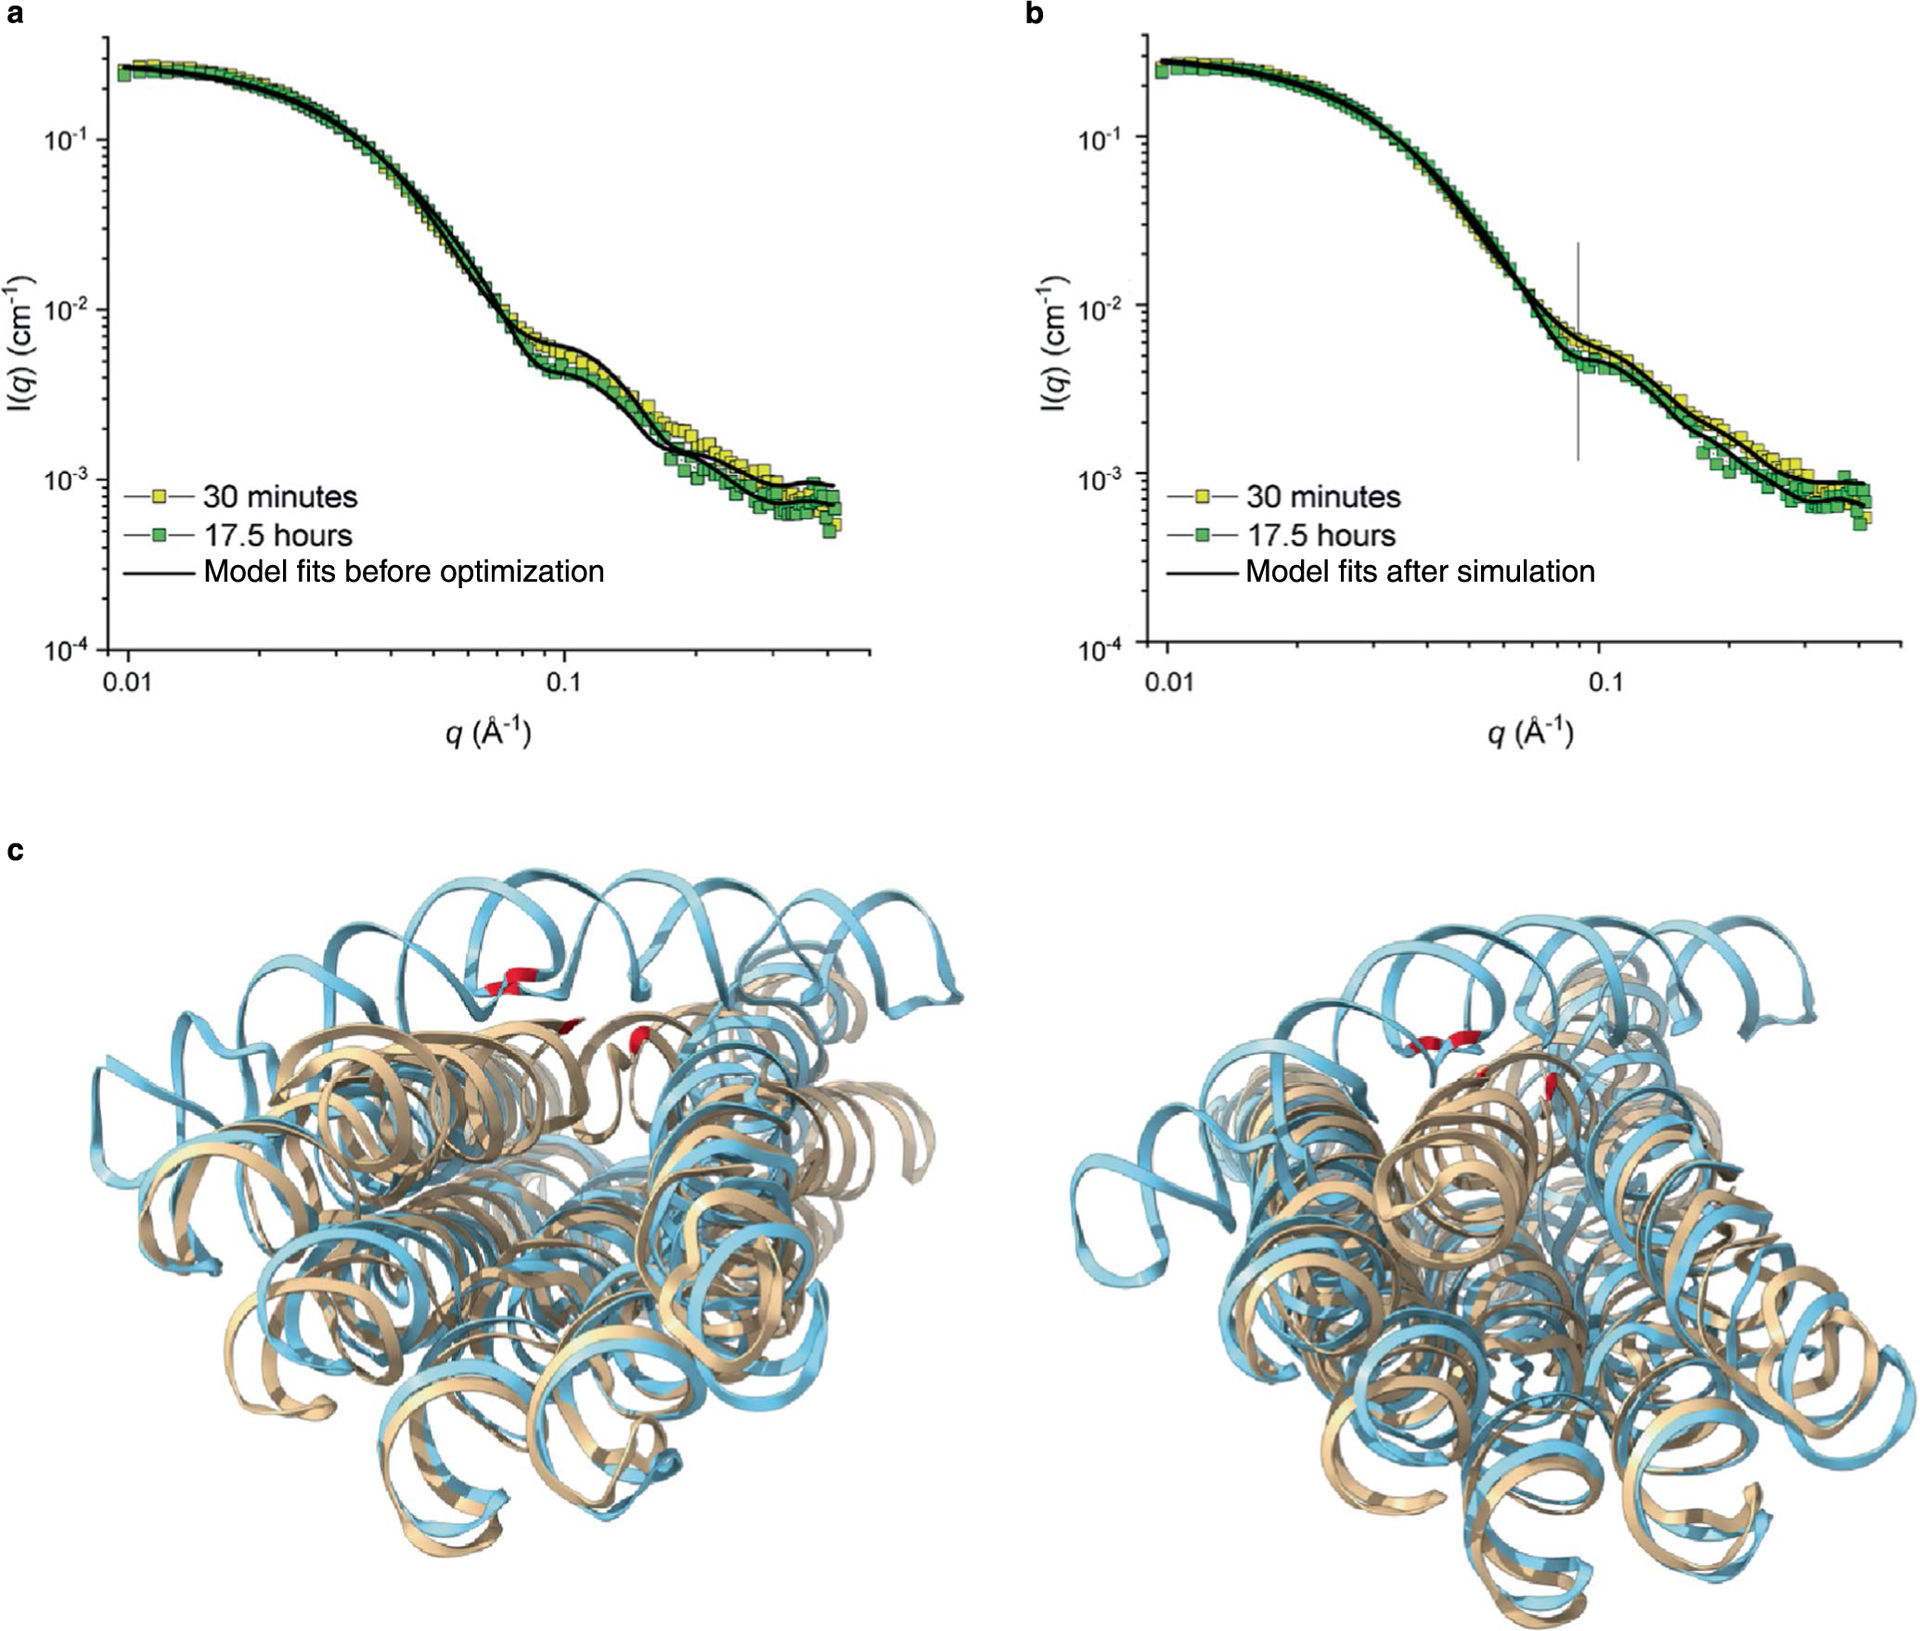
a, SAXS data showing observed scattering pre and post structural transformation of the 6HBC and the predicted scattering from the models prior to rigid-body minimization. b, Fit of the predicted scattering from rigid-body optimized 6HBC-Young and 6HBC-Mature models to the experimental scattering from early and late time points. Black line denotes q = 0.09 Å−1. c, Two views of an overlay of the two conformations (young and mature are turquoise and beige, respectively) of the 6HBC with the cross-strand adenine base stack shown in red.
Extended Data Fig. 7 |. Cryo-EM images of 16H-Satellite RNA and effect of electron dosage.
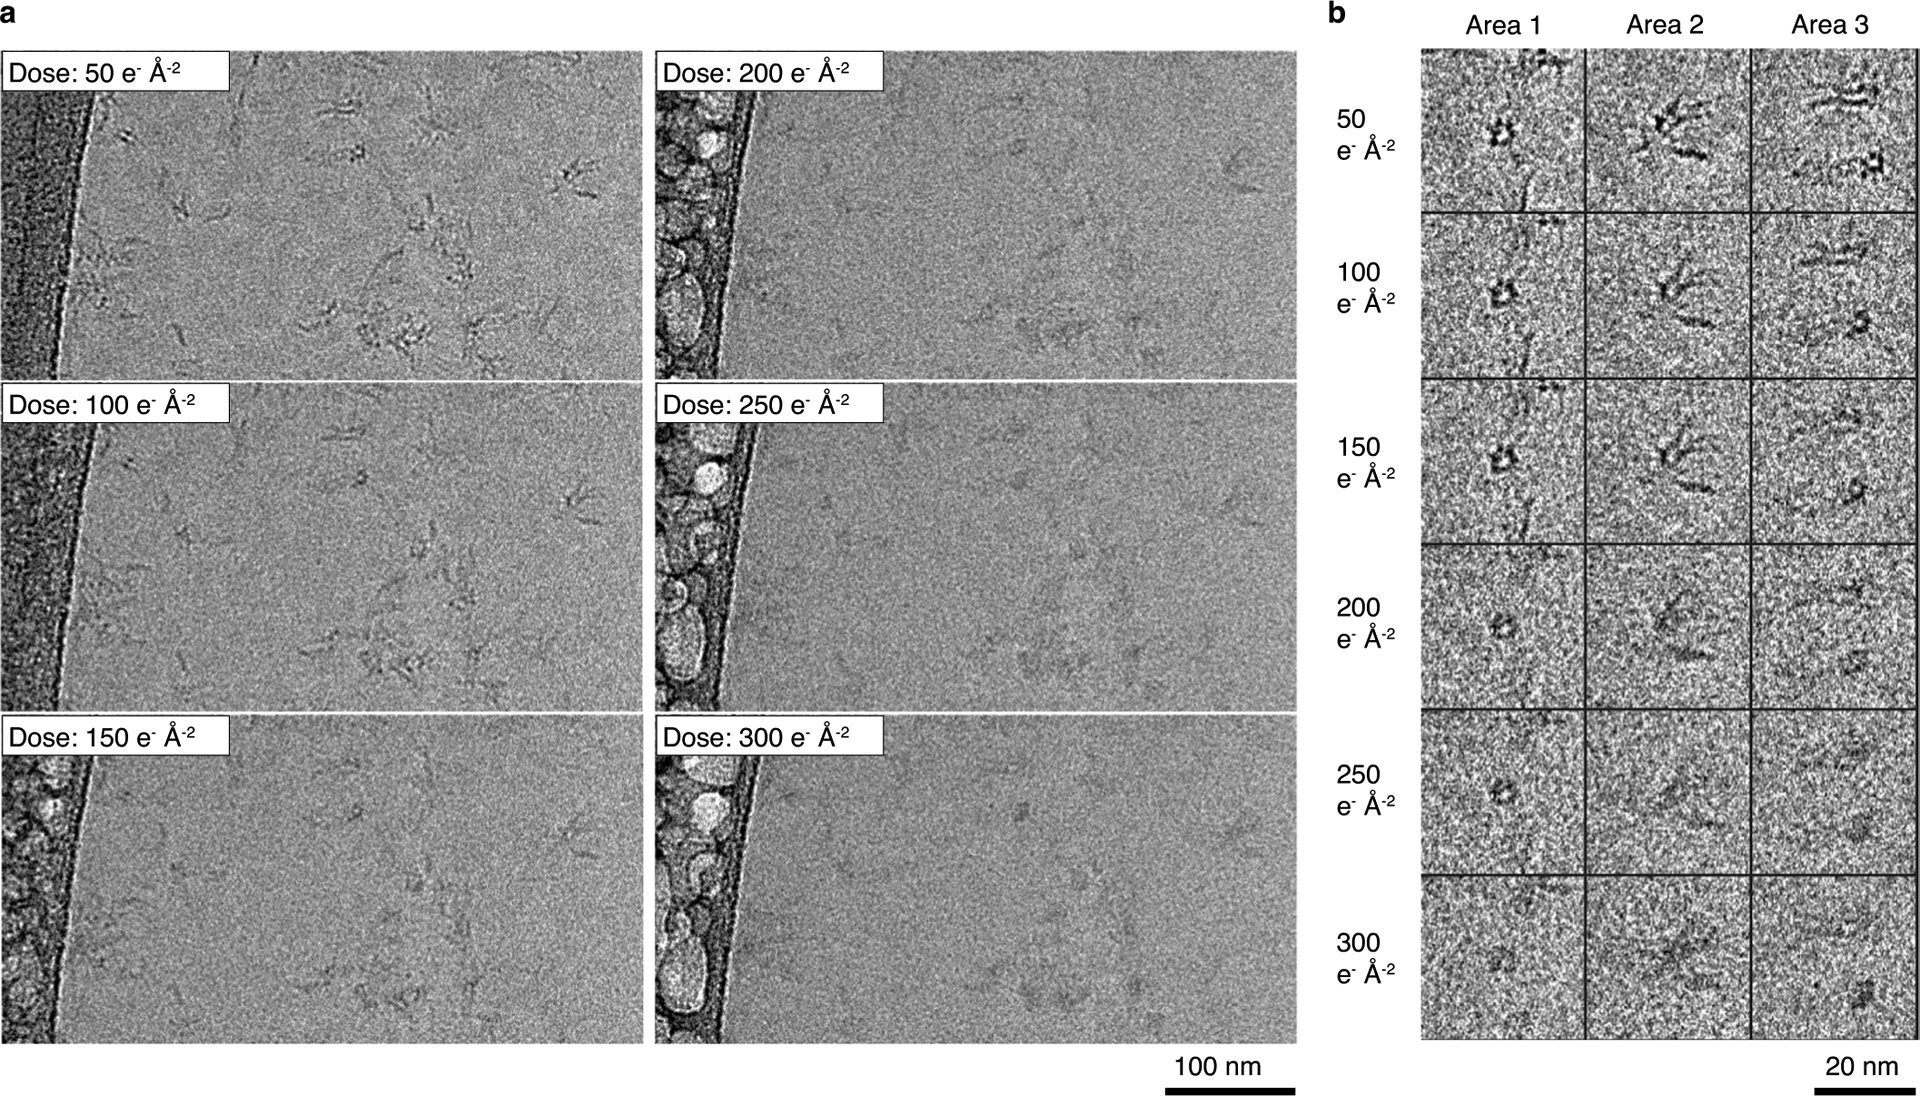
a, On a same area of the satellite sample, a series of un-tilted cryo-EM images were acquired under a same illumination condition, for example the electron dose of 50 e−Å−2 for each of six images. Thus, the images are corresponding to radiation damage after 50 e−Å−2, 100 e−Å−2, 150 e−Å−2, 200 e−Å−2, 250 e−Å−2 and 300 e−Å−2, respectively. After a dose above 100 e−Å−2, the radiation damage caused ‘bubbling’ phenomena on the supporting carbon area (left edge). However, the RNA particles in vitrious ice are not showing bubbling even at the dose of 300 e−Å−2. b, Zoomed-in images of three representative areas with particles. The radiation damage blurred the detailed structural features, but the low resolution shape of the particles remains.
Extended Data Fig. 8 |. IMOD 3D reconstruction from cryo-ET of 16H-satellite.
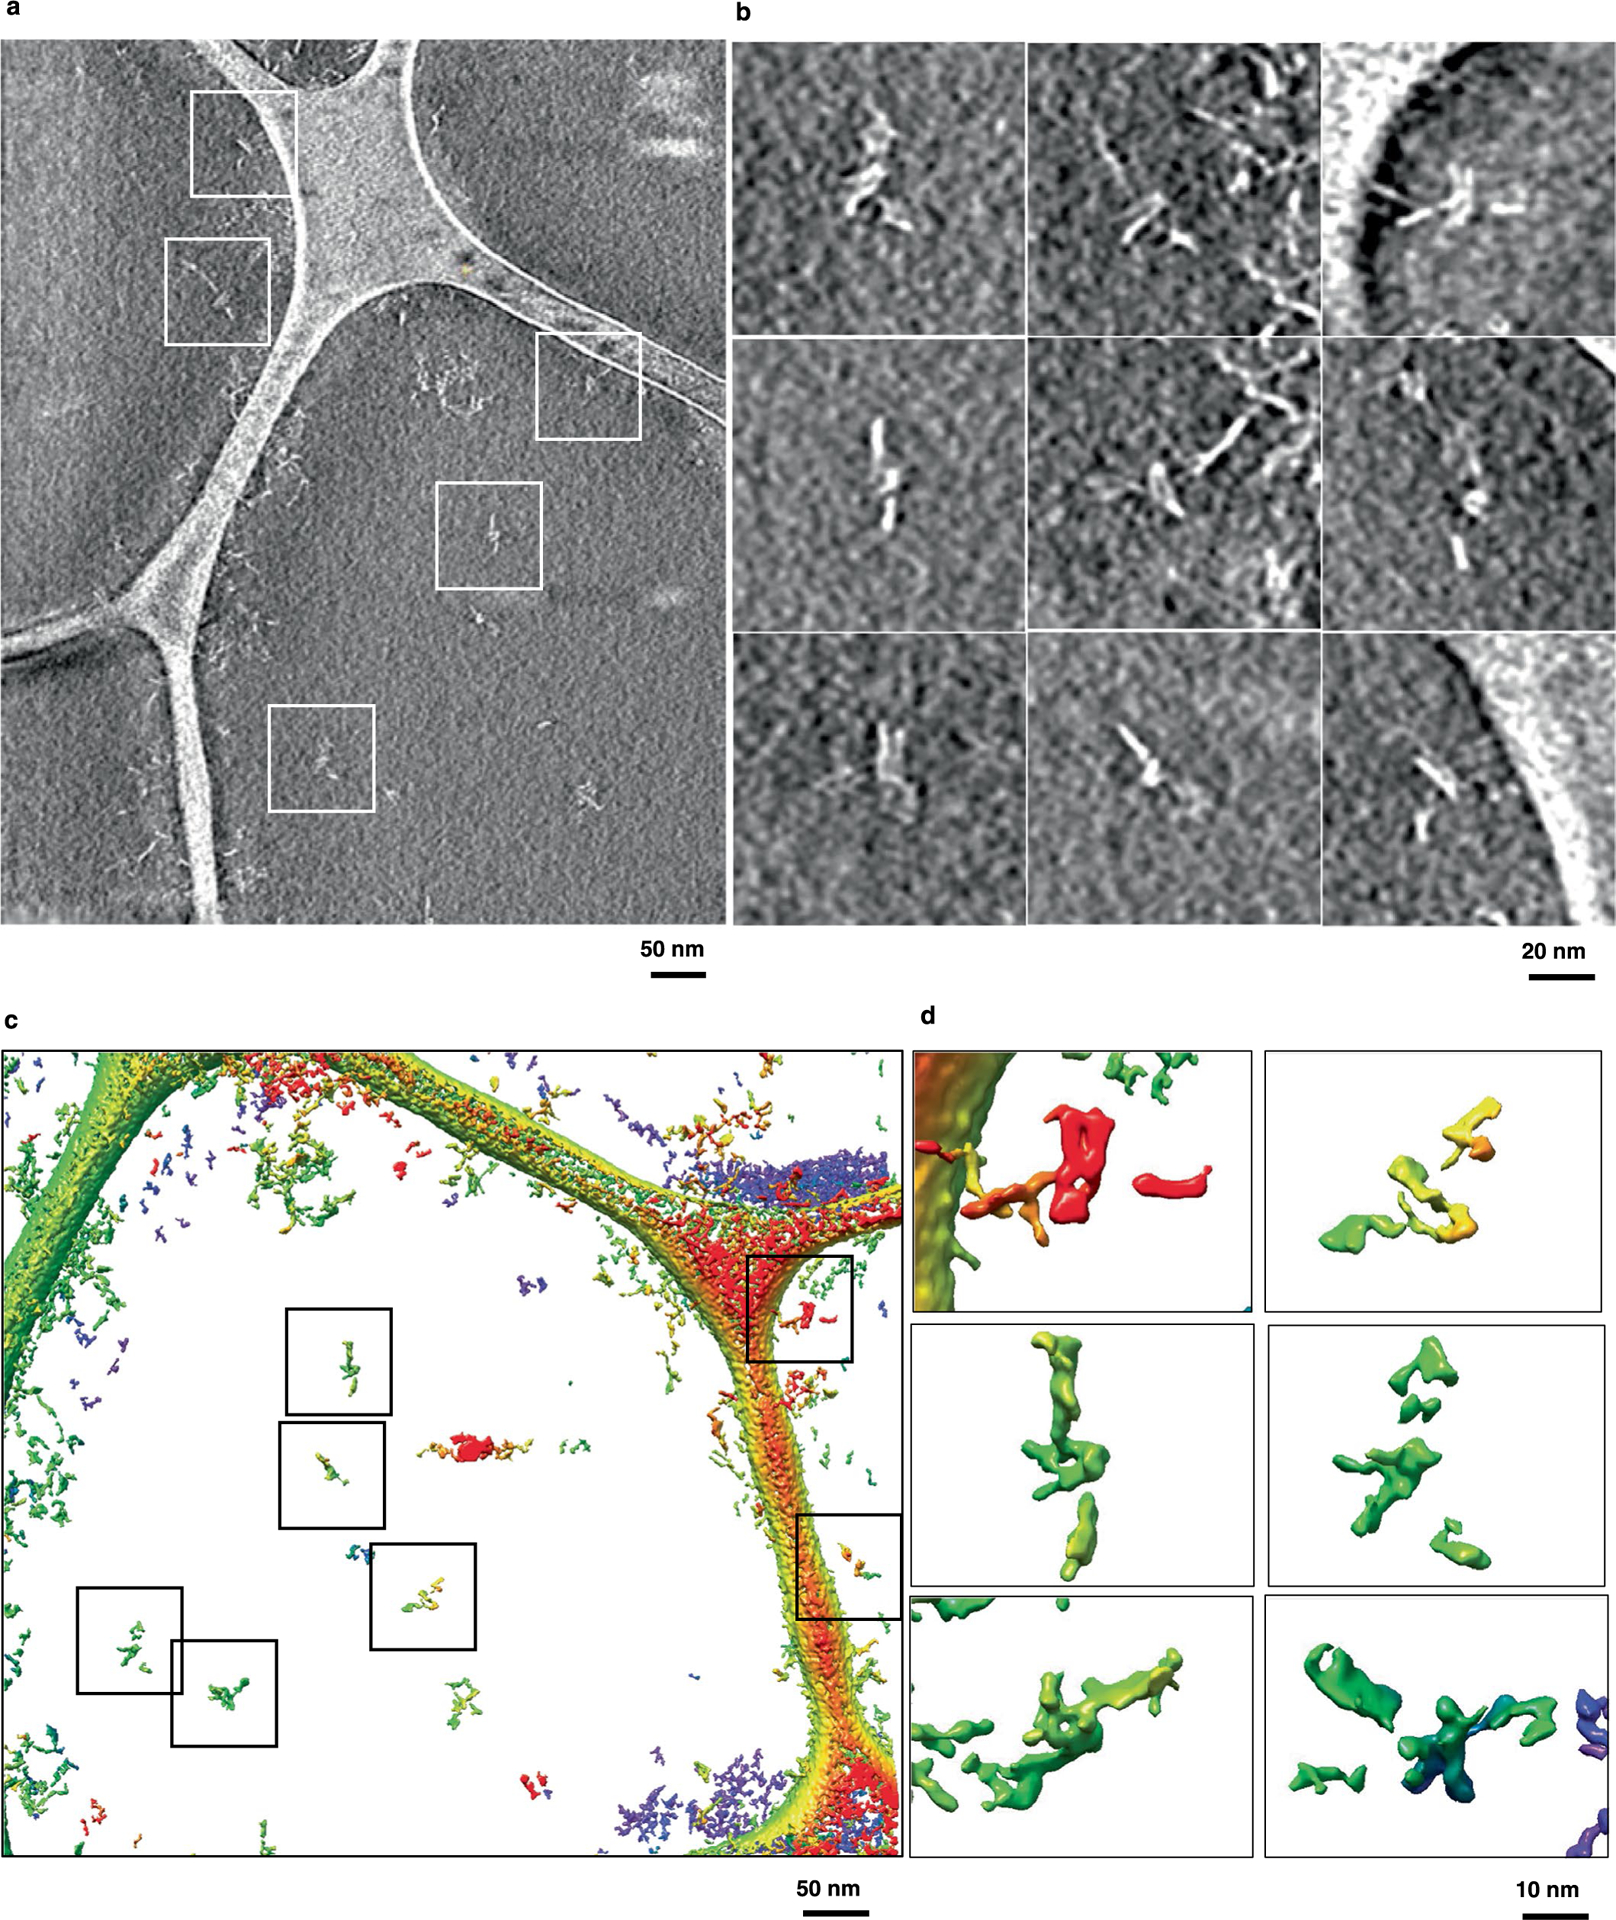
a, Central slice of the IMOD 3D reconstruction and b, zoomed-in areas that contains 16HS particles. c, The IMOD 3D reconstruction of a selected area shown in the Chimera software and colored based on the height along the normal direction to the plane, where particles are indicated by boxes and d, shows zoomed-in images of selected particles.
Extended Data Fig. 9 |. IPET 3D reconstruction and effects of masking and low-pass filtering.
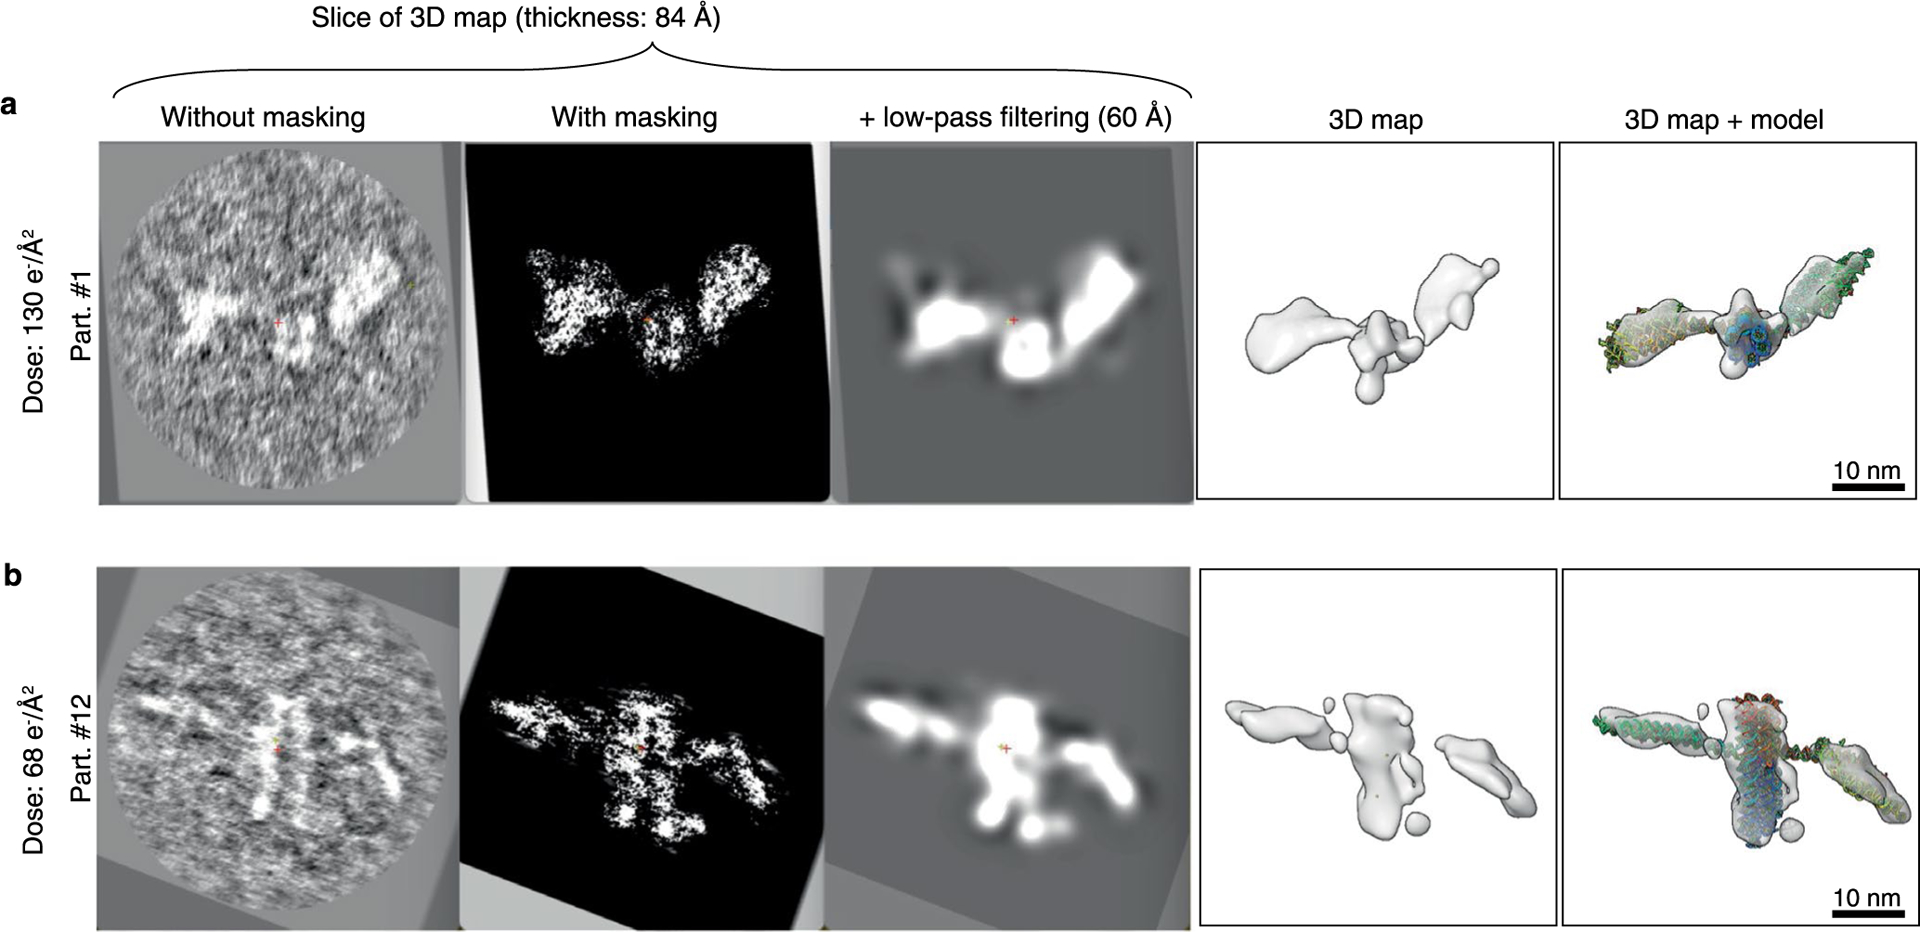
IPET cryo-EM 3D reconstruction of two different particles imaged under the dose of 130 e−Å−2 (a) and dose of 68 e−Å−2 (b). Left panels show the central slice of the IPET cryo-EM 3D reconstruction of an individual particle without using the particle-shaped mask. Second left panel shows the central slice using the automatically generated particle-shaped soft mask. Middle panel shows the masked particle low-pass filtered to 60 Å. Second right panel show the final 3D density map. Right panel shows the final 3D density map superimposed with fitted model.
Extended Data Fig. 10 |. Cryo-ET 3D reconstruction of 16 individual particles of 16H-Satellite RNA.
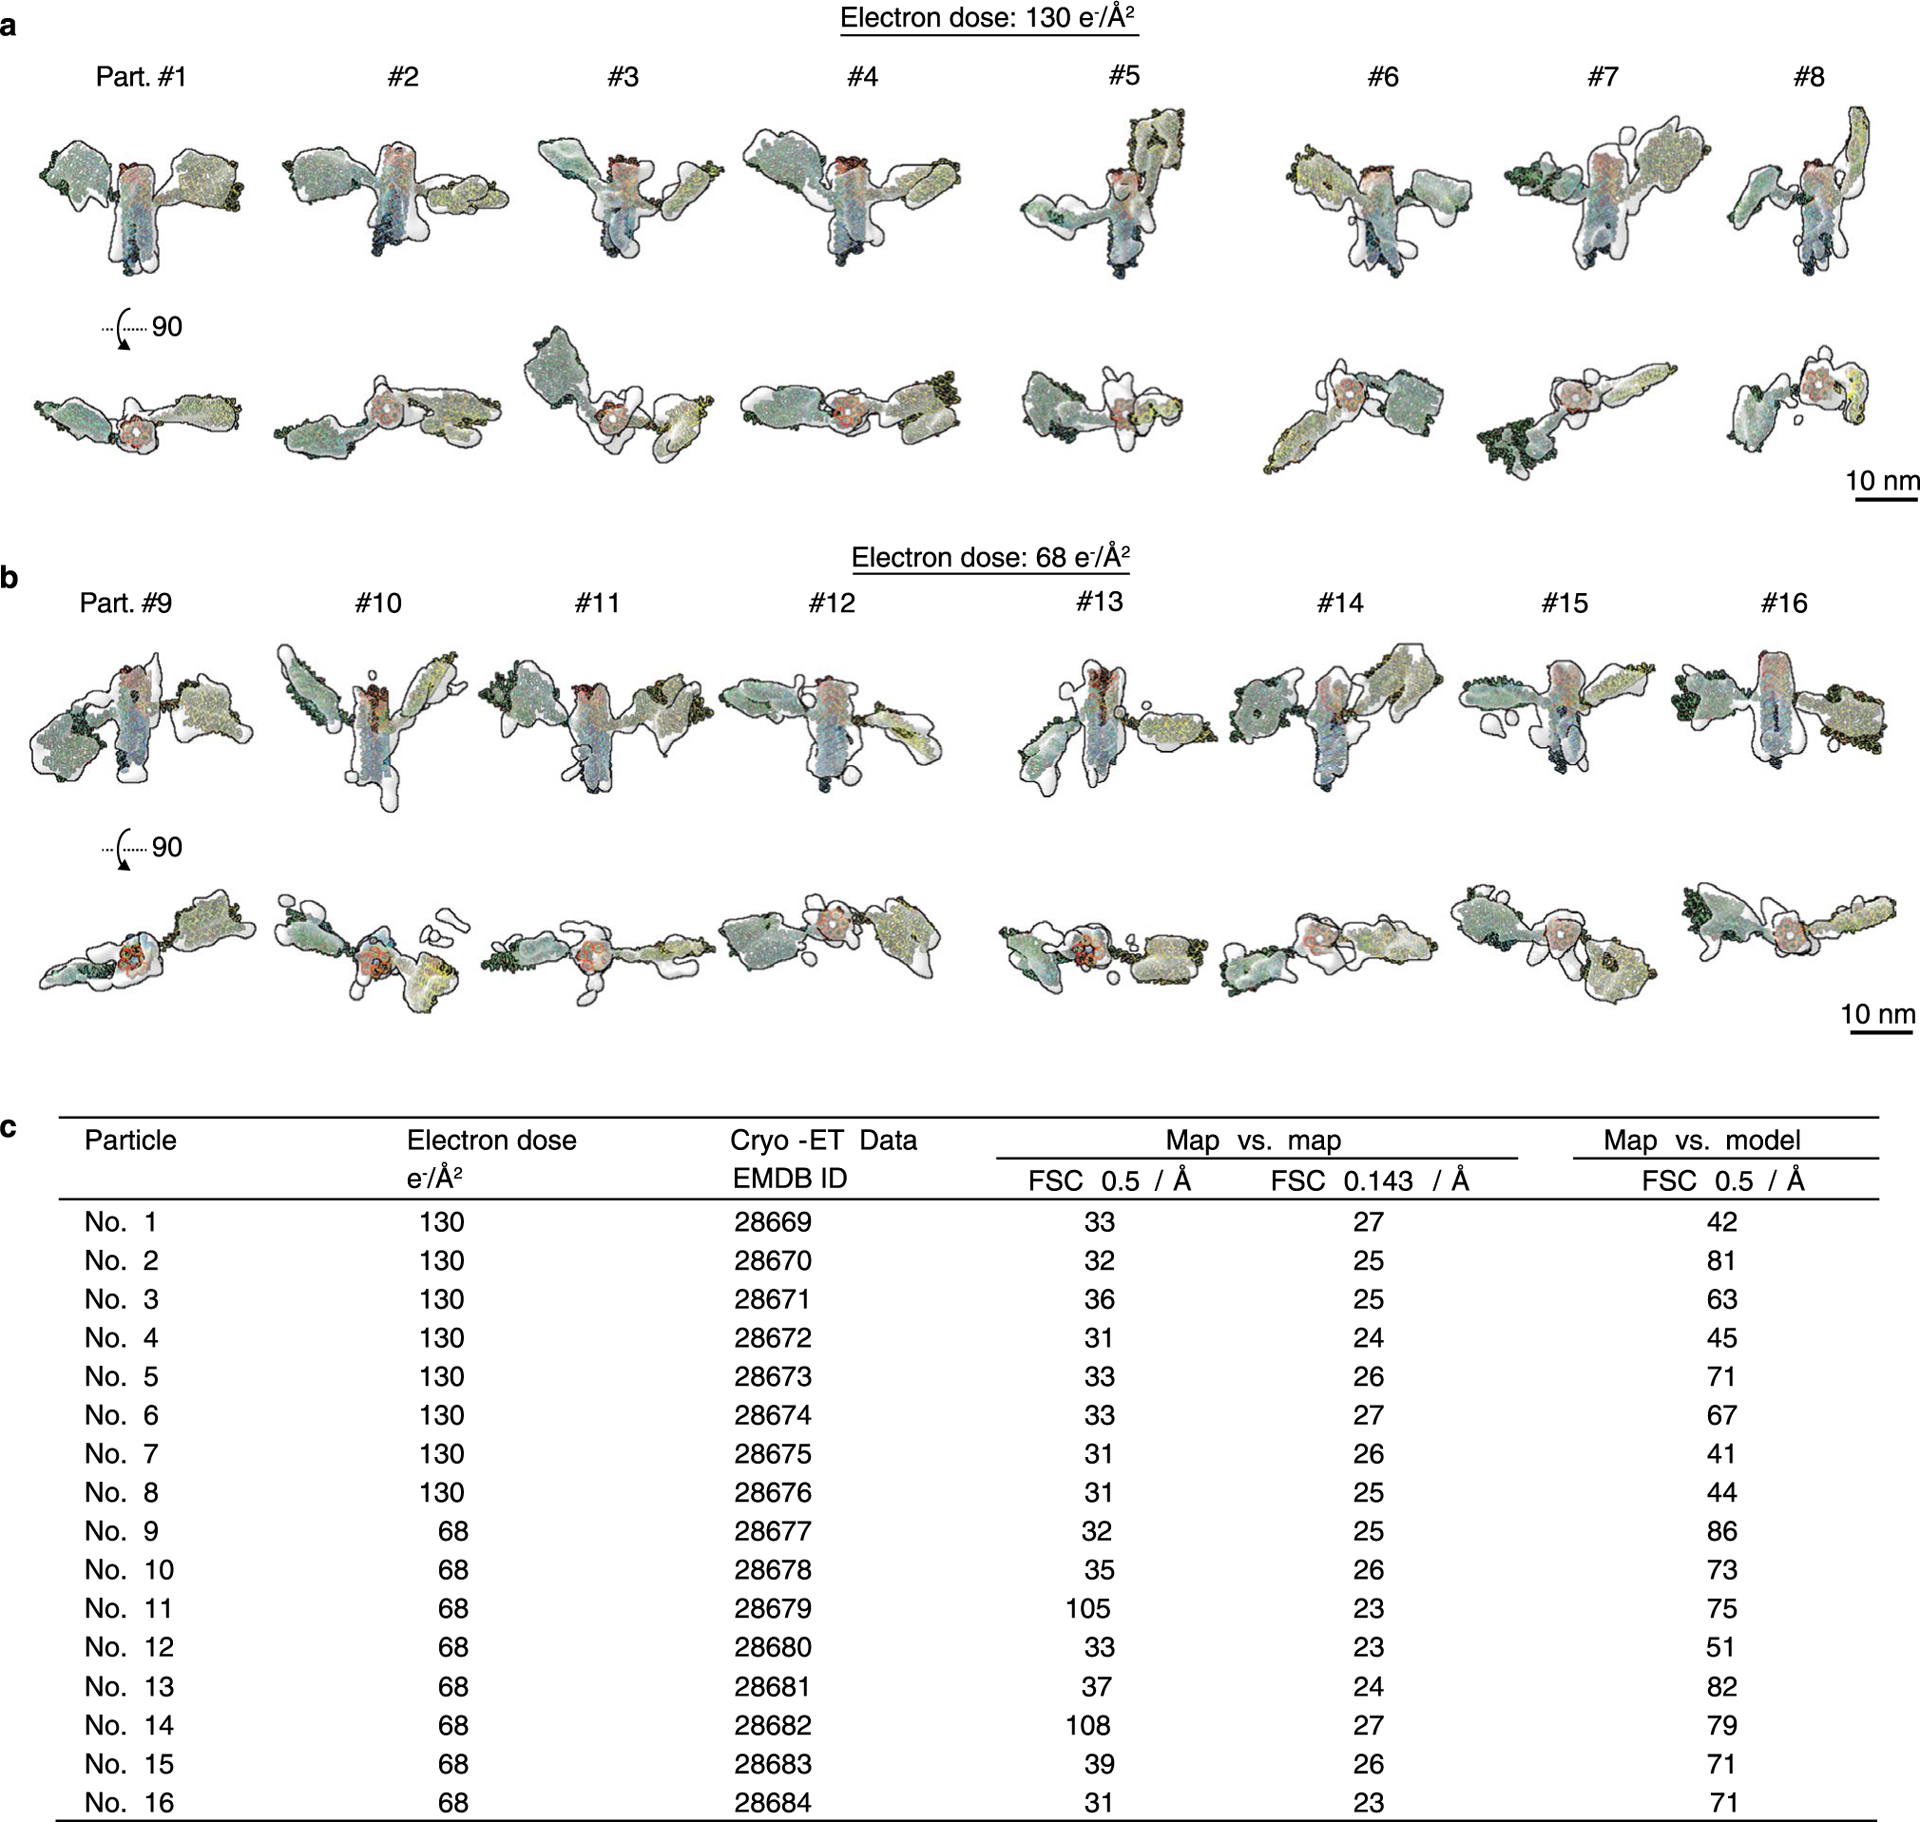
a, Perpendicular views of the cryo-ET 3D reconstructions with the corresponding fitted models of 8 representative particles. The tilt series was imaged under the total electron dose of 130 e−Å−2. b, Another 8 cryo-ET reconstructions of individual particles that were imaged under the electron dose of 68 e−Å−2. c, Table listing FSC analyses of the final map resolution. Two resolutions were measured for ‘map vs. map’ analysis at FSC = 0.5 and FSC = 0.143 and one resolution was measured for ‘map vs. model’ analysis at FSC = 0.5.
Supplementary Material
Acknowledgements
We dedicate our work to the late Ned Seeman, who pioneered the research field of structural nucleic acid nanotechnology and greatly inspired our work and directly or indirectly influenced our careers. We acknowledge the EMBION Cryo-EM Facility at iNANO, Aarhus University, for time under application ID 0042. We thank P. Nissen and A. Briegel for their early support of the project and valuable discussion, S. Sparvath for early design and experiments with the 6HB and A. Briegel and H. C. Høiberg for early NS-TEM characterization of 6HBs. We thank R. Rosendahl and C. Bus for technical assistance. The work at iNANO was supported by the Independent Research Fund Denmark under the Research Project 1 grant (9040-00425B) to E.S.A., the Canadian Natural Sciences and Engineering Research Council post-doctoral fellowship (532417) to E.K.S.M., the Carlsberg Foundation Research Infrastructure grant (CF20-0635) to E.S.A., the European Research Council (ERC) Consolidator grant (683305) to E.S.A. and Novo Nordisk Foundation Ascending Investigator grant (NNF20OC0060694) and Interdisciplinary Synergy grant (NNF21OC0070452) to E.S.A. The work at the Molecular Foundry, Lawrence Berkeley National Laboratory, was supported by the Office of Science, Office of Basic Energy Sciences, of the US Department of Energy (contract no. DE-AC02-05CH11231) and the US National Institutes of Health (nos. R01HL115153, R01 GM104427, R01MH077303 and R01DK042667) to J.L. and G.R.
Footnotes
Competing interests
The authors declare no competing interests.
Extended data is available for this paper at https://doi.org/10.1038/s41565-023-01321-6.
Supplementary information The online version contains supplementary material available at https://doi.org/10.1038/s41565-023-01321-6.
Online content
Any methods, additional references, Nature Portfolio reporting summaries, source data, extended data, supplementary information, acknowledgements, peer review information; details of author contributions and competing interests; and statements of data and code availability are available at https://doi.org/10.1038/s41565-023-01321-6.
Data availability
The sequences of the designs used and the images of the blueprints are available in the Supplementary Information. Text versions of the blueprints are available from the corresponding author upon request. The volumes from the final refinements of our cryo-EM single-particle analysis datasets have been deposited to the Electron Microscopy Data Bank (EMDB) under accession codes EMD-13633 (5HT-A), EMD-13926 (5HT-A-twist-corrected), EMD-13636 (5HT-B), EMD-13592 (5HT-B-3X), EMD-13627 (6HB), EMD-13628 (6HBC-young-1), EMD-13630 (6HBC-PBS-mature-1), EMD-13626 (6HBC-young-2) and EMD-13625 (6HBC-mature-2). The atomic models have been deposited to the Protein Data Bank (PDB) under the PDB codes 7PTQ (5HT-A), 7QDU (5HT-A-twist-corrected), 7PTS (5HT-B), 7PTK (6HBC-young-1) and 7PTL (6HBC-mature-1). The 16HS volumes reconstructed from the cryo-ET data have been deposited to the EMDB under accession codes EMD-28669 to EMD-28684.
References
- 1.Jasinski D, Haque F, Binzel DW & Guo P Advancement of the emerging field of RNA nanotechnology. ACS Nano 11, 1142–1164 (2017). [DOI] [PMC free article] [PubMed] [Google Scholar]
- 2.Ohno H, Akamine S & Saito H RNA nanostructures and scaffolds for biotechnology applications. Curr. Opin. Biotechnol 58, 53–61 (2019). [DOI] [PubMed] [Google Scholar]
- 3.Kim J & Franco E RNA nanotechnology in synthetic biology. Curr. Opin. Biotechnol 63, 135–141 (2020). [DOI] [PubMed] [Google Scholar]
- 4.Geary C, Rothemund PW & Andersen ES A single-stranded architecture for cotranscriptional folding of RNA nanostructures. Science 345, 799–804 (2014). [DOI] [PubMed] [Google Scholar]
- 5.Høiberg HC, Sparvath SM, Andersen VL, Kjems J & Andersen ES An RNA origami octahedron with intrinsic siRNAs for potent gene knockdown. Biotechnol. J 14, 1700634 (2018). [DOI] [PubMed] [Google Scholar]
- 6.Krissanaprasit A et al. Genetically encoded, functional single-strand RNA origami: anticoagulant. Adv. Mater 31, e1808262 (2019). [DOI] [PubMed] [Google Scholar]
- 7.Li M et al. In vivo production of RNA nanostructures via programmed folding of single-stranded RNAs. Nat. Commun 9, 2196 (2018). [DOI] [PMC free article] [PubMed] [Google Scholar]
- 8.Jepsen MDE et al. Development of a genetically encodable FRET system using fluorescent RNA aptamers. Nat. Commun 9, 18 (2018). [DOI] [PMC free article] [PubMed] [Google Scholar]
- 9.Liu D et al. Branched kissing loops for the construction of diverse RNA homooligomeric nanostructures. Nat. Chem 12, 249–259 (2020). [DOI] [PubMed] [Google Scholar]
- 10.Nguyen MTA, Pothoulakis G & Andersen ES Synthetic translational regulation by protein-binding RNA origami scaffolds. ACS Synth. Biol 11, 1710–1718 (2022). [DOI] [PMC free article] [PubMed] [Google Scholar]
- 11.Pothoulakis G, Nguyen MTA & Andersen ES Utilizing RNA origami scaffolds in Saccharomyces cerevisiae for dCas9-mediated transcriptional control. Nucleic Acids Res. 50, 7176–7187 (2022). [DOI] [PMC free article] [PubMed] [Google Scholar]
- 12.Geary C, Grossi G, McRae EKS, Rothemund PWK & Andersen ES RNA origami design tools enable cotranscriptional folding of kilobase-sized nanoscaffolds. Nat. Chem 13, 549–558 (2021). [DOI] [PMC free article] [PubMed] [Google Scholar]
- 13.Severcan I et al. A polyhedron made of tRNAs. Nat. Chem 2, 772–772 (2010). [DOI] [PMC free article] [PubMed] [Google Scholar]
- 14.Afonin KA et al. In vitro assembly of cubic RNA-based scaffolds designed in silico. Nat. Nanotechnol 5, 676–682 (2010). [DOI] [PMC free article] [PubMed] [Google Scholar]
- 15.Ko SH et al. Synergistic self-assembly of RNA and DNA molecules. Nat. Chem 2, 1050–1055 (2010). [DOI] [PMC free article] [PubMed] [Google Scholar]
- 16.Hao C et al. Construction of RNA nanocages by re-engineering the packaging RNA of Phi29 bacteriophage. Nat. Commun 5, 3890 (2014). [DOI] [PubMed] [Google Scholar]
- 17.Afonin KA et al. Multifunctional RNA nanoparticles. Nano Lett. 14, 5662–5671 (2014). [DOI] [PMC free article] [PubMed] [Google Scholar]
- 18.Yu J, Liu Z, Jiang W, Wang G & Mao C De novo design of an RNA tile that self-assembles into a homo-octameric nanoprism. Nat. Commun 6, 5724 (2015). [DOI] [PubMed] [Google Scholar]
- 19.Geary C, Chworos A, Verzemnieks E, Voss NR & Jaeger L Composing RNA nanostructures from a syntax of RNA structural modules. Nano Lett. 17, 7095–7101 (2017). [DOI] [PMC free article] [PubMed] [Google Scholar]
- 20.Zakrevsky P et al. Truncated tetrahedral RNA nanostructures exhibit enhanced features for delivery of RNAi substrates. Nanoscale 12, 2555–2568 (2020). [DOI] [PubMed] [Google Scholar]
- 21.Xu C et al. 3D RNA nanocage for encapsulation and shielding of hydrophobic biomolecules to improve the in vivo biodistribution. Nano Res. 13, 3241–3247 (2020). [DOI] [PMC free article] [PubMed] [Google Scholar]
- 22.Kappel K et al. De novo computational RNA modeling into cryo-EM maps of large ribonucleoprotein complexes. Nat. Methods 15, 947–954 (2018). [DOI] [PMC free article] [PubMed] [Google Scholar]
- 23.Zhang K et al. Cryo-EM structure of a 40 kDa SAM-IV riboswitch RNA at 3.7 Å resolution. Nat. Commun 10, 5511 (2019). [DOI] [PMC free article] [PubMed] [Google Scholar]
- 24.Kappel K et al. Accelerated cryo-EM-guided determination of three-dimensional RNA-only structures. Nat. Methods 17, 699–707 (2020). [DOI] [PMC free article] [PubMed] [Google Scholar]
- 25.Zhang K et al. Cryo-EM and antisense targeting of the 28-kDa frameshift stimulation element from the SARS-CoV-2 RNA genome. Nat. Struct. Mol. Biol 28, 747–754 (2021). [DOI] [PMC free article] [PubMed] [Google Scholar]
- 26.Su Z et al. Cryo-EM structures of full-length Tetrahymena ribozyme at 3.1 Å resolution. Nature 596, 603–607 (2021). [DOI] [PMC free article] [PubMed] [Google Scholar]
- 27.Liu D, Thelot FA, Piccirilli JA, Liao M & Yin P Sub-3-Å cryo-EM structure of RNA enabled by engineered homomeric self-assembly. Nat. Methods 19, 576–585 (2022). [DOI] [PubMed] [Google Scholar]
- 28.Bonilla SL, Vicens Q & Kieft JS Cryo-EM reveals an entangled kinetic trap in the folding of a catalytic RNA. Sci. Adv 8, eabq4144 (2022). [DOI] [PMC free article] [PubMed] [Google Scholar]
- 29.Li S et al. Topological crossing in the misfolded Tetrahymena ribozyme resolved by cryo-EM. Proc. Natl Acad. Sci. USA 119, e2209146119 (2022). [DOI] [PMC free article] [PubMed] [Google Scholar]
- 30.Andersen ES et al. Self-assembly of a nanoscale DNA box with a controllable lid. Nature 459, 73–76 (2009). [DOI] [PubMed] [Google Scholar]
- 31.Bai XC, Martin TG, Scheres SH & Dietz H Cryo-EM structure of a 3D DNA-origami object. Proc. Natl Acad. Sci. USA 109, 20012–20017 (2012). [DOI] [PMC free article] [PubMed] [Google Scholar]
- 32.Martin TG et al. Design of a molecular support for cryo-EM structure determination. Proc. Natl Acad. Sci. USA 113, E7456–E7463 (2016). [DOI] [PMC free article] [PubMed] [Google Scholar]
- 33.Laing C & Schlick T Analysis of four-way junctions in RNA structures. J. Mol. Biol 390, 547–559 (2009). [DOI] [PMC free article] [PubMed] [Google Scholar]
- 34.Ennifar E et al. The crystal structure of the dimerization initiation site of genomic HIV-1 RNA reveals an extended duplex with two adenine bulges. Structure 7, 1439–1449 (1999). [DOI] [PubMed] [Google Scholar]
- 35.Ennifar E, Walter P, Ehresmann B, Ehresmann C & Dumas P Crystal structures of coaxially stacked kissing complexes of the HIV-1 RNA dimerization initiation site. Nat. Struct. Biol 8, 1064–1064 (2001). [DOI] [PubMed] [Google Scholar]
- 36.Ennifar E & Dumas P Polymorphism of bulged-out residues in HIV-1 RNA DIS kissing complex and structure comparison with solution studies. J. Mol. Biol 356, 771–782 (2006). [DOI] [PubMed] [Google Scholar]
- 37.Kieken F, Paquet F, Brule F, Paoletti J & Lancelot G A new NMR solution structure of the SL1 HIV-1Lai loop-loop dimer. Nucleic Acids Res. 34, 343–352 (2006). [DOI] [PMC free article] [PubMed] [Google Scholar]
- 38.Baba S et al. Solution RNA structures of the HIV-1 dimerization initiation site in the kissing-loop and extended-duplex dimers. J. Biochem 138, 583–592 (2005). [DOI] [PubMed] [Google Scholar]
- 39.Takahashi K et al. NMR analysis of intra- and inter-molecular stems in the dimerization initiation site of the HIV-1 genome. J. Biochem 127, 681–686 (2000). [DOI] [PubMed] [Google Scholar]
- 40.Liu D, Shao Y, Piccirilli JA & Weizmann Y Structures of artificially designed discrete RNA nanoarchitectures at near-atomic resolution. Sci. Adv 7, eabf4459 (2021). [DOI] [PMC free article] [PubMed] [Google Scholar]
- 41.Richardson JS et al. RNA backbone: consensus all-angle conformers and modular string nomenclature (an RNA Ontology Consortium contribution). RNA 14, 465–481 (2008). [DOI] [PMC free article] [PubMed] [Google Scholar]
- 42.Rupert PB, Massey AP, Sigurdsson ST & Ferre-D’Amare AR Transition state stabilization by a catalytic RNA. Science 298, 1421–1424 (2002). [DOI] [PubMed] [Google Scholar]
- 43.Isambert H The jerky and knotty dynamics of RNA. Methods 49, 189–196 (2009). [DOI] [PubMed] [Google Scholar]
- 44.Clatterbuck Soper SF, Dator RP, Limbach PA & Woodson SA In vivo X-ray footprinting of pre-30S ribosomes reveals chaperone-dependent remodeling of late assembly intermediates. Mol. Cell 52, 506–516 (2013). [DOI] [PMC free article] [PubMed] [Google Scholar]
- 45.Punjani A, Rubinstein JL, Fleet DJ & Brubaker MA cryoSPARC: algorithms for rapid unsupervised cryo-EM structure determination. Nat. Methods 14, 290–296 (2017). [DOI] [PubMed] [Google Scholar]
- 46.Kremer JR, Mastronarde DN & McIntosh JR Computer visualization of three-dimensional image data using IMOD. J. Struct. Biol 116, 71–76 (1996). [DOI] [PubMed] [Google Scholar]
- 47.Zhai X et al. LoTToR: an algorithm for missing-wedge correction of the low-tilt tomographic 3D reconstruction of a single-molecule structure. Sci. Rep 10, 10489 (2020). [DOI] [PMC free article] [PubMed] [Google Scholar]
- 48.Benson E et al. DNA rendering of polyhedral meshes at the nanoscale. Nature 523, 441–444 (2015). [DOI] [PubMed] [Google Scholar]
- 49.Silvester E et al. DNA origami signposts for identifying proteins on cell membranes by electron cryotomography. Cell 184, 1110–1121.e16 (2021). [DOI] [PMC free article] [PubMed] [Google Scholar]
- 50.Lei D et al. Three-dimensional structural dynamics of DNA origami Bennett linkages using individual-particle electron tomography. Nat. Commun 9, 592 (2018). [DOI] [PMC free article] [PubMed] [Google Scholar]
- 51.Wang ST et al. Designed and biologically active protein lattices. Nat. Commun 12, 3702 (2021). [DOI] [PMC free article] [PubMed] [Google Scholar]
- 52.Watters KE, Strobel EJ, Yu AM, Lis JT & Lucks JB Cotranscriptional folding of a riboswitch at nucleotide resolution. Nat. Struct. Mol. Biol 23, 1124–1131 (2016). [DOI] [PMC free article] [PubMed] [Google Scholar]
- 53.Liu D, Wang M, Deng Z, Walulu R & Mao C Tensegrity: construction of rigid DNA triangles with flexible four-arm DNA junctions. J. Am. Chem. Soc 126, 2324–2325 (2004). [DOI] [PubMed] [Google Scholar]
- 54.Zhou H & Zhang S Recent development of fluorescent light-up RNA aptamers. Crit. Rev. Anal. Chem 52, 1644–1661 (2021). [DOI] [PubMed] [Google Scholar]
- 55.Shibata T et al. Protein-driven RNA nanostructured devices that function in vitro and control mammalian cell fate. Nat. Commun 8, 540 (2017). [DOI] [PMC free article] [PubMed] [Google Scholar]
- 56.Liu H et al. Kinetics of RNA and RNA:DNA hybrid strand displacement. ACS Synth. Biol 10, 3066–3073 (2021). [DOI] [PubMed] [Google Scholar]
- 57.Guo S et al. Tuning the size, shape and structure of RNA nanoparticles for favorable cancer targeting and immunostimulation. Wiley Interdiscip. Rev. Nanomed. Nanobiotechnol 12, e1582 (2020). [DOI] [PMC free article] [PubMed] [Google Scholar]
- 58.Chandler M, Panigaj M, Rolband LA & Afonin KA Challenges to optimizing RNA nanostructures for large-scale production and controlled therapeutic properties. Nanomedicine 15, 1331–1340 (2020). [DOI] [PMC free article] [PubMed] [Google Scholar]
- 59.Lorenz R et al. ViennaRNA package 2.0. Algorithms Mol. Biol 6, 26 (2011). [DOI] [PMC free article] [PubMed] [Google Scholar]
- 60.Zadeh JN et al. NUPACK: analysis and design of nucleic acid systems. J. Comput. Chem 32, 170–173 (2011). [DOI] [PubMed] [Google Scholar]
- 61.Punjani A & Fleet DJ 3D variability analysis: resolving continuous flexibility and discrete heterogeneity from single particle cryo-EM. J. Struct. Biol 213, 107702 (2021). [DOI] [PubMed] [Google Scholar]
- 62.Tegunov D & Cramer P Real-time cryo-electron microscopy data preprocessing with Warp. Nat. Methods 16, 1146–1152 (2019). [DOI] [PMC free article] [PubMed] [Google Scholar]
- 63.Punjani A, Zhang H & Fleet DJ Non-uniform refinement: adaptive regularization improves single-particle cryo-EM reconstruction. Nat. Methods 17, 1214–1221 (2020). [DOI] [PubMed] [Google Scholar]
- 64.Pettersen EF et al. UCSF Chimera—a visualization system for exploratory research and analysis. J. Comput. Chem 25, 1605–1612 (2004). [DOI] [PubMed] [Google Scholar]
- 65.Goddard TD et al. UCSF ChimeraX: meeting modern challenges in visualization and analysis. Protein Sci. 27, 14–25 (2018). [DOI] [PMC free article] [PubMed] [Google Scholar]
- 66.Pettersen EF et al. UCSF ChimeraX: structure visualization for researchers, educators, and developers. Protein Sci. 30, 70–82 (2021). [DOI] [PMC free article] [PubMed] [Google Scholar]
- 67.Croll TI ISOLDE: a physically realistic environment for model building into low-resolution electron-density maps. Acta Cryst. D 74, 519–530 (2018). [DOI] [PMC free article] [PubMed] [Google Scholar]
- 68.Rodrigues J, Teixeira JMC, Trellet M & Bonvin A pdb-tools: a Swiss army knife for molecular structures. F1000Res. 7, 1961 (2018). [DOI] [PMC free article] [PubMed] [Google Scholar]
- 69.Liebschner D et al. Macromolecular structure determination using X-rays, neutrons and electrons: recent developments in Phenix. Acta Cryst. D 75, 861–877 (2019). [DOI] [PMC free article] [PubMed] [Google Scholar]
- 70.Terwilliger TC et al. Model morphing and sequence assignment after molecular replacement. Acta Cryst. D 69, 2244–2250 (2013). [DOI] [PMC free article] [PubMed] [Google Scholar]
- 71.Afonine PV et al. New tools for the analysis and validation of cryo-EM maps and atomic models. Acta Cryst. D 74, 814–840 (2018). [DOI] [PMC free article] [PubMed] [Google Scholar]
- 72.Williams CJ et al. MolProbity: more and better reference data for improved all-atom structure validation. Protein Sci. 27, 293–315 (2018). [DOI] [PMC free article] [PubMed] [Google Scholar]
- 73.Richardson JS, Williams CJ, Videau LL, Chen VB & Richardson DC Assessment of detailed conformations suggests strategies for improving cryoEM models: helix at lower resolution, ensembles, pre-refinement fixups, and validation at multi-residue length scale. J. Struct. Biol 204, 301–312 (2018). [DOI] [PMC free article] [PubMed] [Google Scholar]
- 74.Lavery R, Moakher M, Maddocks JH, Petkeviciute D & Zakrzewska K Conformational analysis of nucleic acids revisited: Curves+. Nucleic Acids Res. 37, 5917–5929 (2009). [DOI] [PMC free article] [PubMed] [Google Scholar]
- 75.Blanchet C, Pasi M, Zakrzewska K & Lavery R CURVES+ web server for analyzing and visualizing the helical, backbone and groove parameters of nucleic acid structures. Nucleic Acids Res. 39, W68–W73 (2011). [DOI] [PMC free article] [PubMed] [Google Scholar]
- 76.Lyngso J & Pedersen JS A high-flux automated laboratory small-angle X-ray scattering instrument optimized for solution scattering. J. Appl. Crystallogr 54, 295–305 (2021). [Google Scholar]
- 77.Li Y, Beck R, Huang T, Choi MC & Divinagracia M Scatterless hybrid metal–single-crystal slit for small-angle X-ray scattering and high-resolution X-ray diffraction. J. Appl. Crystallogr 41, 1134–1139 (2008). [Google Scholar]
- 78.Oliveira CLP, Vorup-Jensen T, Andersen CBF, Andersen GR & Pedersen JS in Applications of Synchrotron Light to Scattering and Diffraction in Materials and Life Sciences (eds Gomez M; Nogales A; Cruz Garcia-Gutierrez M & Ezquerra TA) 231–244 (Springer, 2009). [Google Scholar]
- 79.Steiner EM et al. The structure of the N-terminal module of the cell wall hydrolase RipA and its role in regulating catalytic activity. Proteins 86, 912–923 (2018). [DOI] [PubMed] [Google Scholar]
- 80.Carragher B et al. Leginon: an automated system for acquisition of images from vitreous ice specimens. J. Struct. Biol 132, 33–45 (2000). [DOI] [PubMed] [Google Scholar]
- 81.Tang G et al. EMAN2: an extensible image processing suite for electron microscopy. J. Struct. Biol 157, 38–46 (2007). [DOI] [PubMed] [Google Scholar]
- 82.Sun M et al. Practical considerations for using K3 cameras in CDS mode for high-resolution and high-throughput single particle cryo-EM. J. Struct. Biol 213, 107745 (2021). [DOI] [PubMed] [Google Scholar]
- 83.Mastronarde DN Automated electron microscope tomography using robust prediction of specimen movements. J. Struct. Biol 152, 36–51 (2005). [DOI] [PubMed] [Google Scholar]
- 84.Zheng SQ et al. MotionCor2: anisotropic correction of beam-induced motion for improved cryo-electron microscopy. Nat. Methods 14, 331–332 (2017). [DOI] [PMC free article] [PubMed] [Google Scholar]
- 85.Zhang K Gctf: real-time CTF determination and correction. J. Struct. Biol 193, 1–12 (2016). [DOI] [PMC free article] [PubMed] [Google Scholar]
- 86.Fernandez JJ, Li S & Crowther RA CTF determination and correction in electron cryotomography. Ultramicroscopy 106, 587–596 (2006). [DOI] [PubMed] [Google Scholar]
- 87.Weigert M et al. Content-aware image restoration: pushing the limits of fluorescence microscopy. Nat. Methods 15, 1090–1097 (2018). [DOI] [PubMed] [Google Scholar]
- 88.Zhang L & Ren G IPET and FETR: experimental approach for studying molecular structure dynamics by cryo-electron tomography of a single-molecule structure. PLoS ONE 7, e30249 (2012). [DOI] [PMC free article] [PubMed] [Google Scholar]
- 89.Ludtke SJ, Baldwin PR & Chiu W EMAN: semiautomated software for high-resolution single-particle reconstructions. J. Struct. Biol 128, 82–97 (1999). [DOI] [PubMed] [Google Scholar]
Associated Data
This section collects any data citations, data availability statements, or supplementary materials included in this article.
Supplementary Materials
Data Availability Statement
The sequences of the designs used and the images of the blueprints are available in the Supplementary Information. Text versions of the blueprints are available from the corresponding author upon request. The volumes from the final refinements of our cryo-EM single-particle analysis datasets have been deposited to the Electron Microscopy Data Bank (EMDB) under accession codes EMD-13633 (5HT-A), EMD-13926 (5HT-A-twist-corrected), EMD-13636 (5HT-B), EMD-13592 (5HT-B-3X), EMD-13627 (6HB), EMD-13628 (6HBC-young-1), EMD-13630 (6HBC-PBS-mature-1), EMD-13626 (6HBC-young-2) and EMD-13625 (6HBC-mature-2). The atomic models have been deposited to the Protein Data Bank (PDB) under the PDB codes 7PTQ (5HT-A), 7QDU (5HT-A-twist-corrected), 7PTS (5HT-B), 7PTK (6HBC-young-1) and 7PTL (6HBC-mature-1). The 16HS volumes reconstructed from the cryo-ET data have been deposited to the EMDB under accession codes EMD-28669 to EMD-28684.


