

Significance
Forest ecosystems have the potential to provide crucial carbon sinks contributing to national carbon neutrality initiatives. However, the policy relevance of existing evaluations on the biophysical potential of forest carbon sink was greatly limited because they ignored near-term to mid-term decadal carbon uptake dynamics and the suitable forest species for forestation. This study addressed these issues by answering the three key questions of potential forestation in China: where, with what species, and when to afforest. Progressive forestation of an additional 78 Mha with the right species up to the 2060s will provide a persistent biophysical carbon sink potential, effectively supporting China’s carbon neutrality strategy. Our research hence provides an example of building a forestation roadmap to support climate mitigation policies.
Keywords: carbon sequestration, progressive forestation, carbon neutrality
Abstract
Previous evaluations on the biophysical potential of forest carbon sink have focused on forestation area distribution and the associated carbon stock for equilibrium-state forests after centuries-long growth. These approaches, however, have limited relevance for climate policies because they ignore the near-term and mid-term decadal carbon uptake dynamics and suitable forest species for forestation. This study developed a forestation roadmap to support China’s “carbon neutrality” objective in 2060 by addressing three key questions of forestation: where, with what forest species, and when to afforest. The results yielded a high-confidence potential forestation map for China at a resolution of 1 km with the identified optimal native forest type or species. Our analysis revealed an additional 78 Mha suitable for forestation up to the 2060s, a 43% increase on the current forest area. Selecting forest species for maximal carbon stock in addition to maximizing local environmental suitability enabled almost a doubling in forest carbon sink potential. Progressive forestation of this area can fix a considerable amount of CO2 and compensate for the carbon sink decline in existing forests. Altogether, the entire forest ecosystem can support a persistent biophysical carbon sink potential of 0.4 Pg C y−1 by 2060 and 0.2 Pg C y−1 by 2100, offsetting 7 to 14% of the current national fossil CO2 emissions. Our research provides an example of building a forestation roadmap toward a sustained forest carbon sink, which creates a critical time window for the emission cuts required by the goal of carbon neutrality.
China is committed to reaching “carbon neutrality,” i.e., net-zero carbon emissions by 2060 (1). Given that it is currently the world’s largest carbon dioxide (CO2) emitter, safeguarding the success of China’s ambitious climate goal is crucial for global efforts to slow down and ultimately halt the atmospheric CO2 increase (2, 3). Achieving this goal, however, requires extensive efforts on both emission reduction and atmospheric CO2 removal (4–6). Forestation has a large potential to absorb atmospheric CO2 by fixing it in plant biomass and soil organic matter (7–9), and hence, it is a key component in the climate mitigation strategies of many nations (10).
Expanding forest area and enhancing the forest carbon sink has been identified as an important strategy in the national climate mitigation plans of China (9, 11–13), with several milestone forest cover targets having been announced by the government (14). However, the spatial distribution of areas climatically suitable for forestation in China is uncertain (9), raising feasibility concerns about the government targets and milestones. Recent research progresses have provided methods for enhancing our confidence in quantifying potential forestation opportunities using a range of approaches, including ecozoning (15), machine learning–based prediction (8), and simulations by dynamic global vegetation models (16). These advances allowed us to integrate multiple approaches in a comprehensive assessment of forestation opportunities in China—to address the primary question of where to afforest when the country moves toward implementation of its carbon-neutrality strategy.
Careful and effective planning of the carbon-neutrality strategy requires not only information on the size of forest carbon sink potential but also on its temporal evolution, which calls for research into the questions of with what and when to afforest. These issues are no less important than quantifying the area potentially suitable for forestation but have been largely ignored in previous analyses (7, 8, 17). Forestation projects with maladapted species have been reported to risk a low survival rate and have caused soil water depletion, which in turn threatens the stability of forest carbon stock (18), highlighting the need to select appropriate forest types or forest species in forestation projects (18, 19). Moreover, forestation species selection needs to further account for the differences in carbon sequestration capacities of different forest species (20), but to the best of our knowledge, forest species distribution maximizing carbon sequestration is not yet available over China. At a regional or national scale, forest carbon sequestration is also highly influenced by forest age structure (21, 22), which further depends on the temporal planning of nationwide forestation (i.e., when to afforest). However, the temporal planning of the forestation area has been unclear in China, preventing a practical and realistic evaluation of future carbon sink potential in the country.
This study aimed to develop an illustrative roadmap for China's forestation strategy to support its carbon neutrality goal by addressing the three key questions described above: “where to afforest,” “with what forest species to afforest,” and “when to afforest” (Materials and Methods). Here, we use “afforest(ation)” to broadly refer to the fact of forest expansion, including both afforestation (i.e., establishing forest in areas that have not been forested before) and/or reforestation (i.e., restoring forest in areas that used to be forested) by either active human management or natural forest restoration. The exact way to implement the broad, illustrative forestation roadmap outlined here needs to incorporate local context. To answer the question of “where to afforest,” we generated a potential forestation map at a high resolution of 1 km across China through harmonizing different potential forest distributions. To answer the question “with what forest species to afforest,” we combined species distribution and forest growth models to search for optimal forest species which are compatible with the local environment and at the same time provide maximum biomass stock. Finally, to address the question of “when to afforest,” we integrated government milestone targets and the climatically determined potential forestation area to develop a practical and progressive forestation scenario (SI Appendix, Fig. S1).
Results along these three axes were then incorporated into an empirical modeling framework of forest biomass growth, which accounts for the effects of forest type, forest age, climate, and CO2 fertilization, to evaluate the biophysical potential of China’s forest biomass carbon sink until the end of this century. Note that the biophysical potential reported here refers to the accumulation of carbon in forest ecosystems under given climate, topographic, and soil edaphic conditions and atmospheric CO2 concentration without a full consideration of the associated ecological, hydrological, or socioeconomic impacts of the proposed afforestation plan. We acknowledge that a significant extension of forested land, as proposed in this study, will have environmental (23, 24) and socioeconomic impacts (25, 26). Some of these impacts can be positive (e.g., surface cooling) (27), but more importantly, some can be unintendedly negative, such as declines in runoff potentially affecting water availability for human society (23), or reductions in household income (25). Local-scale implementation of the proposed afforestation roadmap while avoiding or mitigating potential negative impacts will probably lead to a carbon sink lower than its biophysical potential, the quantification of which on a national level is our key focus.
Results
Where to Afforest: Mapping the Potential Forestation Opportunity.
Potential forest distribution represents a hypothetical description of where forests would grow under given climate conditions and with minimal human intervention. We integrated three independent approaches to enhance the confidence in potential forest distribution mapping (Materials and Methods). The three methods produced similar spatial patterns (Fig. 1 B–D) of potential forestation land in China, with the main locations being in southern, southwestern, and northeastern China, along with the Tianshan Mountains region in northwestern China, where annual precipitation typically exceeds 400 mm. The smallest total potential forest area was predicted by the random forest modeling approach (386 Mha), with the biome mapping approach being the next largest (458 Mha). The largest area (482 Mha) was given by the ORCHIDEE model. We considered the potential forest distribution with a high level of confidence (high-confidence) to be the areas agreed upon by all three approaches, which resulted in 338 Mha of potential area (Fig. 1A), lower than any one of the individual approaches (Fig. 1E).
Fig. 1.

Potential forestation opportunity in China. All maps are based on 1-km spatial resolution data. (A) Combined spatial pattern of the potential forestation opportunity (pink), created by harmonizing multiple potential forest distribution datasets: existing forests (green) and cropland and urban land (gray). High-confidence or medium-confidence forestation indicates places where all three or two of the three potential forest distributions (B–D) agree, while low-confidence indicates places where only one map shows potential forest distribution. The blue line is the 400-mm annual precipitation contour. (B–D), Potential forest distributions predicted by the random-forest modeling approach (B), potential map from World Resources Institute (C), and the dynamic global vegetation model OCHIDEE (D). (E) Areas of potential forests, existing forests, and cropland and urban land derived from multiple datasets (see Materials and Methods and SI Appendix, Figs. S4 and S5). (F) The box plot shows the distribution of 48 estimates for the potential forestation opportunity obtained by combining the high-confidence potential forest map with different existing forest, cropland, and urban land datasets, with the lower and upper box limits indicating the 25th and 75th percentiles, respectively. The red pentagram represents the high-confidence potential forestation opportunity shown in (A).
The environmental sustainability of forestation projects demands that social objectives, other than carbon sequestration, such as food safety and human settlement, should not be neglected. We therefore defined “the potential forestation opportunity” as areas of high-confidence potential forest distribution not collocated with existing forest, agricultural land, or human settlements. The spatial distributions of existing forest, cropland, and urban land were determined from seven different land-cover datasets and defined as places where more than half of the datasets agreed on the land-cover mapping (Materials and Methods). The high-resolution (1-km) map of potential forestation opportunity obtained from this process (Fig. 1A) reveals that about 8.1% of the terrestrial area of China, or 78 Mha, was available for future forestation. The potential forestation areas were predominantly located in the South of China, especially southwestern China, and parts of northwestern and central China. Large parts of northeastern China, the North China Plain, and the Sichuan Basin show great potential for forest distribution but are mostly occupied by agricultural land, precluding their use for forestation (Fig. 1A).
The majority (79%) of the high-confidence potential forestation areas (Fig. 1A) already have partial tree cover but have not yet reached a forest state (SI Appendix, Fig. S3A). This includes open forest or shrub land, lands with mixed tree cover and grassland, as well as lands that are being or planned to be afforested (e.g., lands afforested but not yet reaching a forest state, harvested forest area, burned forest area by wildfire, nursery land, lands suitable for plantation but not yet forested). These lands are often prioritized in forestry practices or forestation plans given their suitable environmental conditions for forestation (28, 29). The successful large-scale forest expansion that China has achieved on these regions over the past decades also confirms their suitability for sustainable afforestation (11, 18). In contrast, the dominant present land-cover type (66%) in the medium-confidence potential forestation areas is grassland (SI Appendix, Fig. S3B), while the low-confidence potential forestation areas are further dominated by grassland (78%) and by bare soil (15%) (SI Appendix, Fig. S3C). These land-cover types hold relatively poorer climatic or soil conditions to support forest growth, hence successful afforestation on these lands requires high economic, labor, water, or nutrient inputs. Moreover, parts of the medium- and low-confidence potential forestation areas are located in arid and semiarid regions (Fig. 1A), where cases of afforestation failure have been reported due to depletion of groundwater or overreliance on irrigation (18), implying a high chance that forests established in these areas may not sustain till the end of this century. Based on these results, low- and medium-confidence potential forestation areas in Fig. 1A are omitted in subsequent analysis.
The potential forestation area reported above has an uncertainty of 61 to 98 Mha (as measured by the lower and upper quantiles) (Fig. 1F), obtained from 48 maps of potential forestation opportunities by combining the high-confidence potential forest distributions with various existing forest maps (SI Appendix, Fig. S4) and cropland and urban land maps (SI Appendix, Fig. S5). The major source of uncertainty arises from the inconsistent definitions of “forest” and “cropland” applied in different datasets (SI Appendix, Table S3). This result emphasizes that using consistent definitions for land-cover types in both field inventory and satellite-based land-cover mapping will help increase the accuracy of land use dynamics monitoring and confidence in land-management policymaking.
With What to Afforest: Forest Type Selection to Maximize Local Adaptation and Carbon Uptake.
Past experience suggests that establishing tree species which are ecologically adapted to the local environment is crucial to ensuring the success of forestation projects (18). We applied a widely used species distribution model (i.e., the Maximum Entropy model or MaxEnt), which has been tested against national forest inventory data, to identify a number of major forest types (by dominant tree species) that are suitable for each 1-km potential forestation pixel in China (Materials and Methods). For the convenience of analyses, forest types with small areas were integrated into those which have closely related dominant species and/or share similar vegetation characteristics (22). The results revealed diverse environmental tolerances for different forest types (Fig. 2), with the spatial suitability distribution for each of the 15 forest types shown in SI Appendix, Fig. S6. At the large scale, the distribution of optimal forest types for future forestation basically followed their climatic zoning patterns. Temperate forest species, especially coniferous ones, were mostly suitable for northern China, whereas subtropical and tropical forest species, which were dominated by broad-leaved trees and warm conifers, were more apt for southern China. Some widely distributed species, such as Betula-Populus, can tolerate the diverse range of climatic conditions found across the country and are even suitable for the arid or semiarid climate of northwest China (SI Appendix, Fig. S6).
Fig. 2.

Dominant forest type of existing forests and their optimal distribution for potential forestation in China. (A) Spatial distribution of the 15 dominant forest types from the 2013–2017 China Forest Vegetation Survey project (30). The optimal distribution of forest types for potential forestation in China determined through optimizing carbon sequestration (B) or local environmental suitability (C). The biomass carbon storage (D) of the largest biomass forest species vs. the highest suitability forest species under the same progressive forestation as in Fig. 3B. Only the effects of forest age were considered here.
For carbon sequestration, maximizing biomass carbon storage is an additional consideration to be taken into account when looking for optimal forest types for future forestation. Within each pixel, we pared down the list of suitable forest types to the single forest type predicted to deliver the highest biomass at the mature stage (see Materials and Methods, Fig. 2B). This forestation species selection for maximum biomass almost doubles (13.9 Pg C vs. 8.1 Pg C until 2100) the carbon sequestration capacity compared to an alternative scenario (Fig. 2C) in which the forest type with the highest habitat suitability was selected, under the same progressive forestation scenario (Fig. 2D).
When to Afforest: Progressive Forestation for Sustained Carbon Sequestration.
The magnitude and temporal patterns of the CO2 removal potential of China’s forests are determined by both contributions from new forests, which depend on the temporal planning of forestation, and those from existing forests, which depend on their age structure. We generated an up-to-date forest age map of China for 2019 at a high resolution of 1 km using the most recently available datasets of forest canopy height and inventory-based provincial forest age class information, following the approach of Zhang et al. (31) (see Materials and Methods, Fig. 3A). Most of the forests in China are still very young, with an average forest age of 41.2 y and 60% of the forests younger than 40 y. Young forests are prevalent in southern China, due to several major forestation projects since 1998, such as the Grain for Green Program (32). The generally young age of China’s existing forests suggests that they are likely to continue functioning as a carbon sink in the near future. In the next section, we estimate the size of that sink.
Fig. 3.
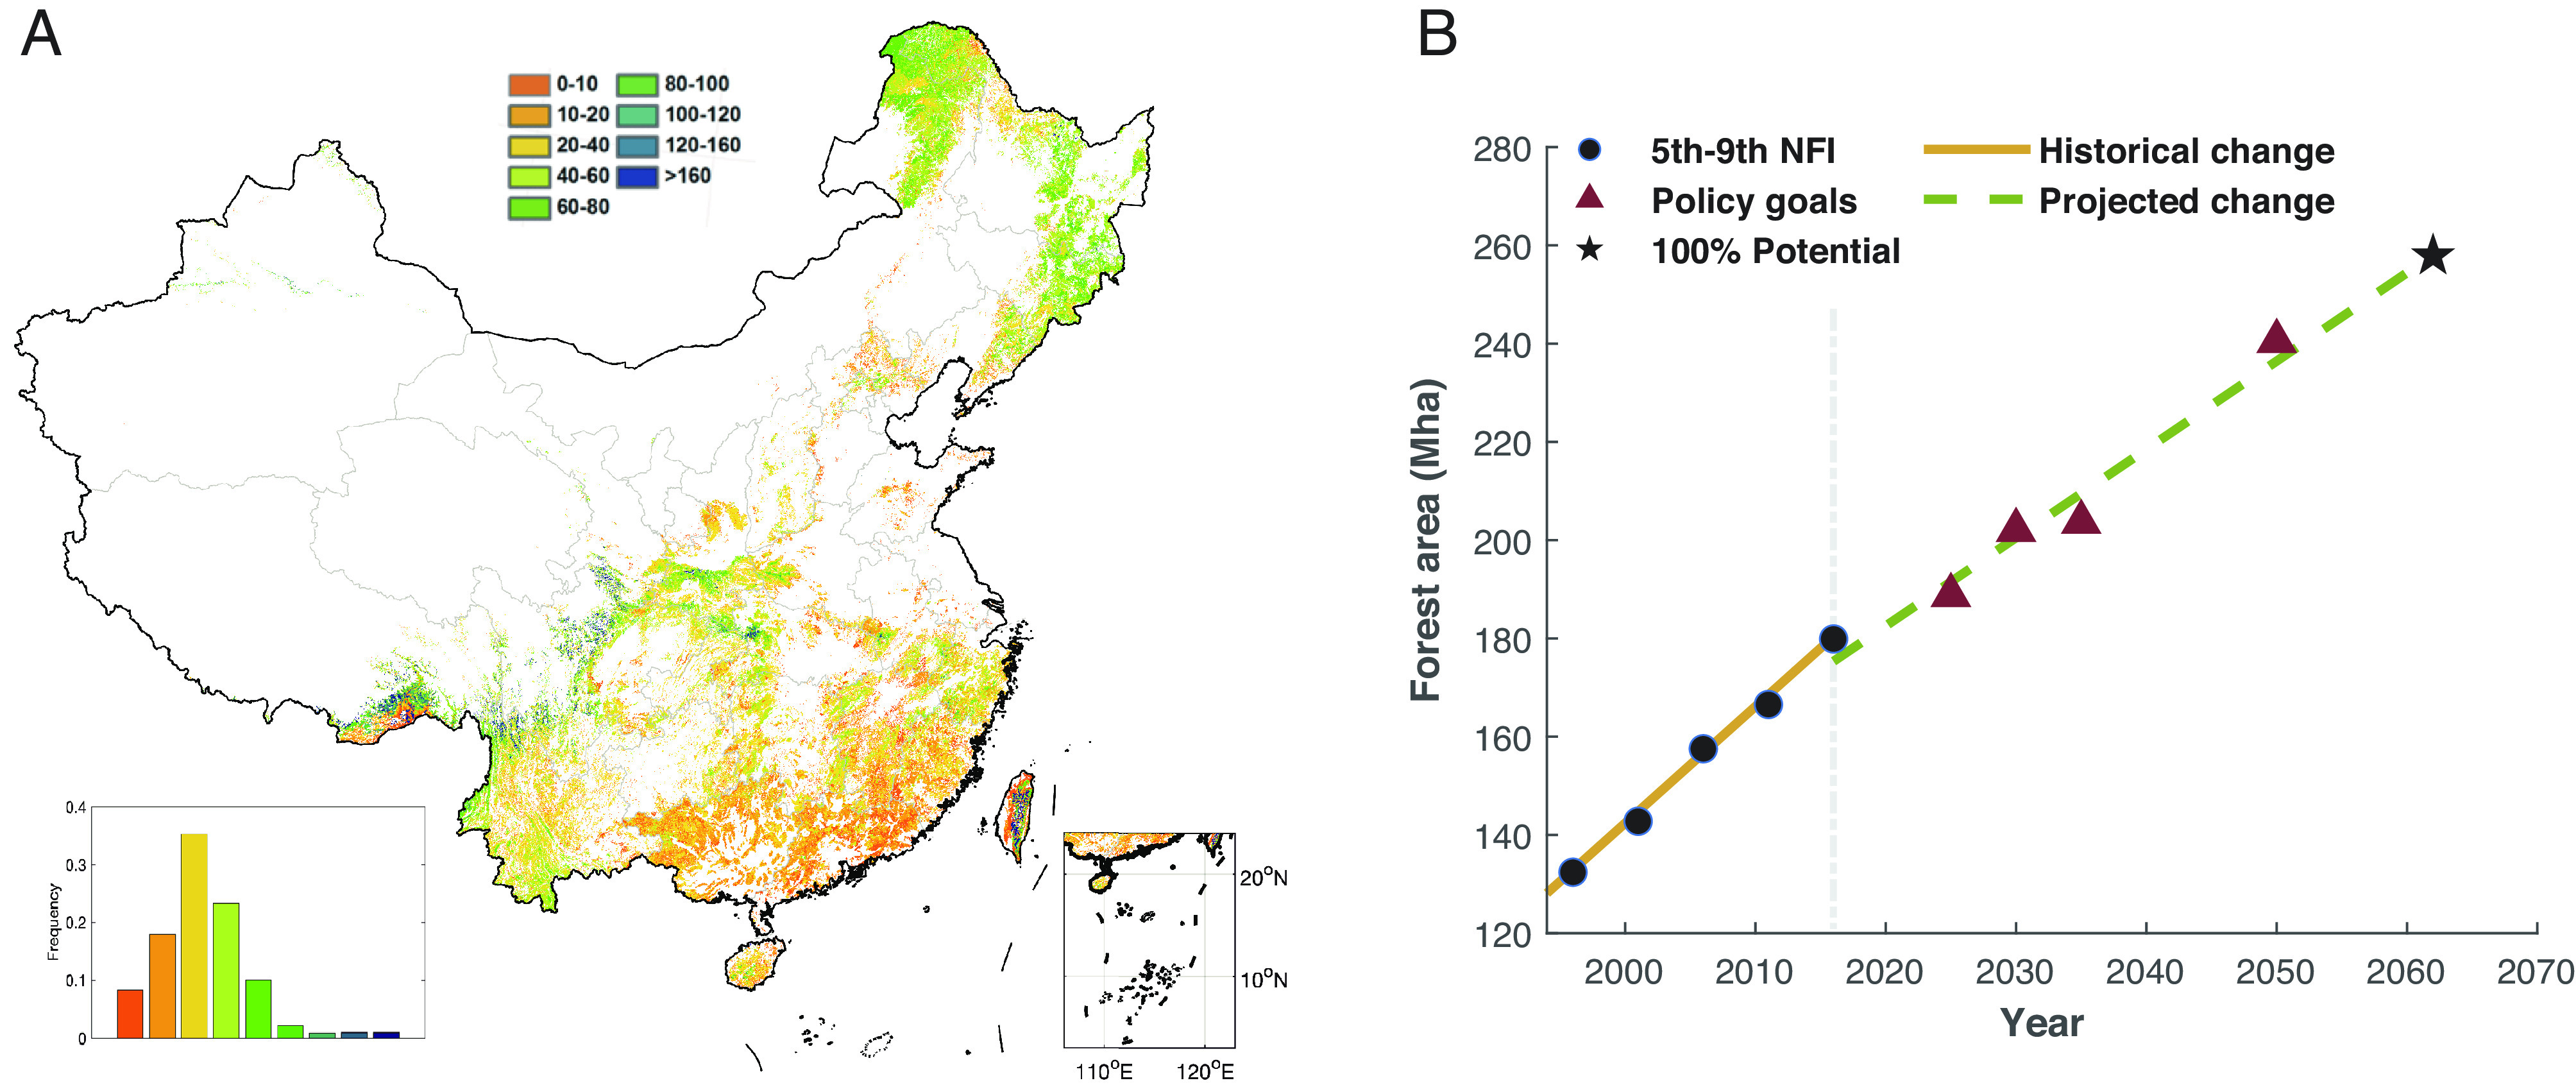
Forest age of existing forests and the progressive forestation scenario. (A) The forest stand age map of existing forests at 1-km resolution updated to 2019 by integrating inventory-based forest age class information and satellite-derived distribution of forest height. The bar plot indicates the frequency of each forest age class. (B) The progressive forestation scenario constrained by government milestone targets (for details refer to SI Appendix, Table S6). The black dots indicate arbor forest areas reported in the 5th to 9th national forest inventories fitted by a linear increasing relationship with time (the orange line). The red triangles indicate the four government milestone targets on the forest area. The dashed green line represents a linear regression of areas of existing forests and government targets against time, which extends to the year of 2062, corresponding to the forest area when all high-confidence potential forestation opportunities across the country are 100% fulfilled (the black asterisk).
Future, large-scale forestation across the nation will not be achieved overnight. Instead, the forest plans of the Chinese forestry departments suggest a gradual and sustained expansion in the forest area (SI Appendix, Table S6). The publicly announced milestones in the forest area in China fit a linear increasing relationship with time (Fig. 3B), suggesting a progressive forestation strategy. Such a strategy, with a constant forestation rate of 1.8 Mha y−1, is expected to exhaust the national potential forestation area by 2062. This rate is lower than the average forest expansion rate of 2.4 Mha y−1 achieved in China from 1994 to 2018 (Fig. 3B). The fact that the historical changes in national forest area show a linear increase over time convinces us that the progressive forestation scenario in China is consistent with government planning and highly plausible, since it has been well implemented and adhered to over the past two decades.
Projected Forest Biomass Carbon Sequestration.
Empirical forest biomass growth models for different forest types (22) were combined with the age structure of existing forests and the future progressive forestation scenario to estimate biomass carbon sequestration until 2100 under different future climate scenarios. The newly established forests of 1.8 Mha for each year were assumed to be distributed randomly over the available forestation space until all potential forestation areas were exhausted in 2062. The biomass growth models accounted for the individual effects of forest age and climate (22), with the effects of CO2 concentration change being derived from simulations of Earth System Models (ESMs) taking part in the sixth phase of the Coupled Model Intercomparison Project (CMIP6) (33). The results reported here focus on the sustainable scenario, SSP1-2.6, as it is the most consistent with the progressive forestation scenario in support of China’s carbon-neutrality strategy, which along with other international commitments, if all fully delivered, will keep global warming below 2 °C (3).
Existing forests were projected to provide a still considerable carbon sink under the SSP1-2.6 scenario, accumulating 14.6 Pg C up to the end of this century through doubling their biomass (Fig. 4A). This carbon sink is dominated by the forest age effect, with climate change and CO2 fertilization contributing 4.7% and 10.4% of the carbon gains in 2100, respectively. Under the higher-emission scenarios of SSP2-4.5 and SSP5-8.5, climate change effects were projected to be similar to those of SSP1-2.6 (SI Appendix, Figs. S8 and S9), when only changes in average climate conditions of mean annual temperature (MAT) and mean annual precipitation (MAP) are considered while neglecting potential changes in climate extremes and their carbon effects. Both MAT and MAP tend to increase under SSP2-4.5 and SSP5-8.5 scenarios compared to present, which will increase the equilibrium biomass carbon stock for most of the species (SI Appendix, Table S7). The CO2 fertilization effects under SSP2-4.5 and SSP5-8.5 scenarios were, however, amplified by two and five times in comparison to the SSP1-2.6 scenario, respectively, although with a larger uncertainty among the models (SI Appendix, Figs. S8 and S9). Nonetheless, the carbon sink of the existing forests will diminish over time, reducing from 0.38 Pg C y−1 in 2020 to 0.13 Pg C y−1 in 2060, and eventually, due to the inevitable maturation and growth saturation, falling to a very weak sink of 0.03 Pg C y−1 in 2100 (Fig. 4C). Such dramatic reductions of the biomass carbon sink will exacerbate the pressure of emissions reduction in the postcarbon neutrality period, which confirms the necessity of our progressive forestation beyond the preservation of existing forests.
Fig. 4.
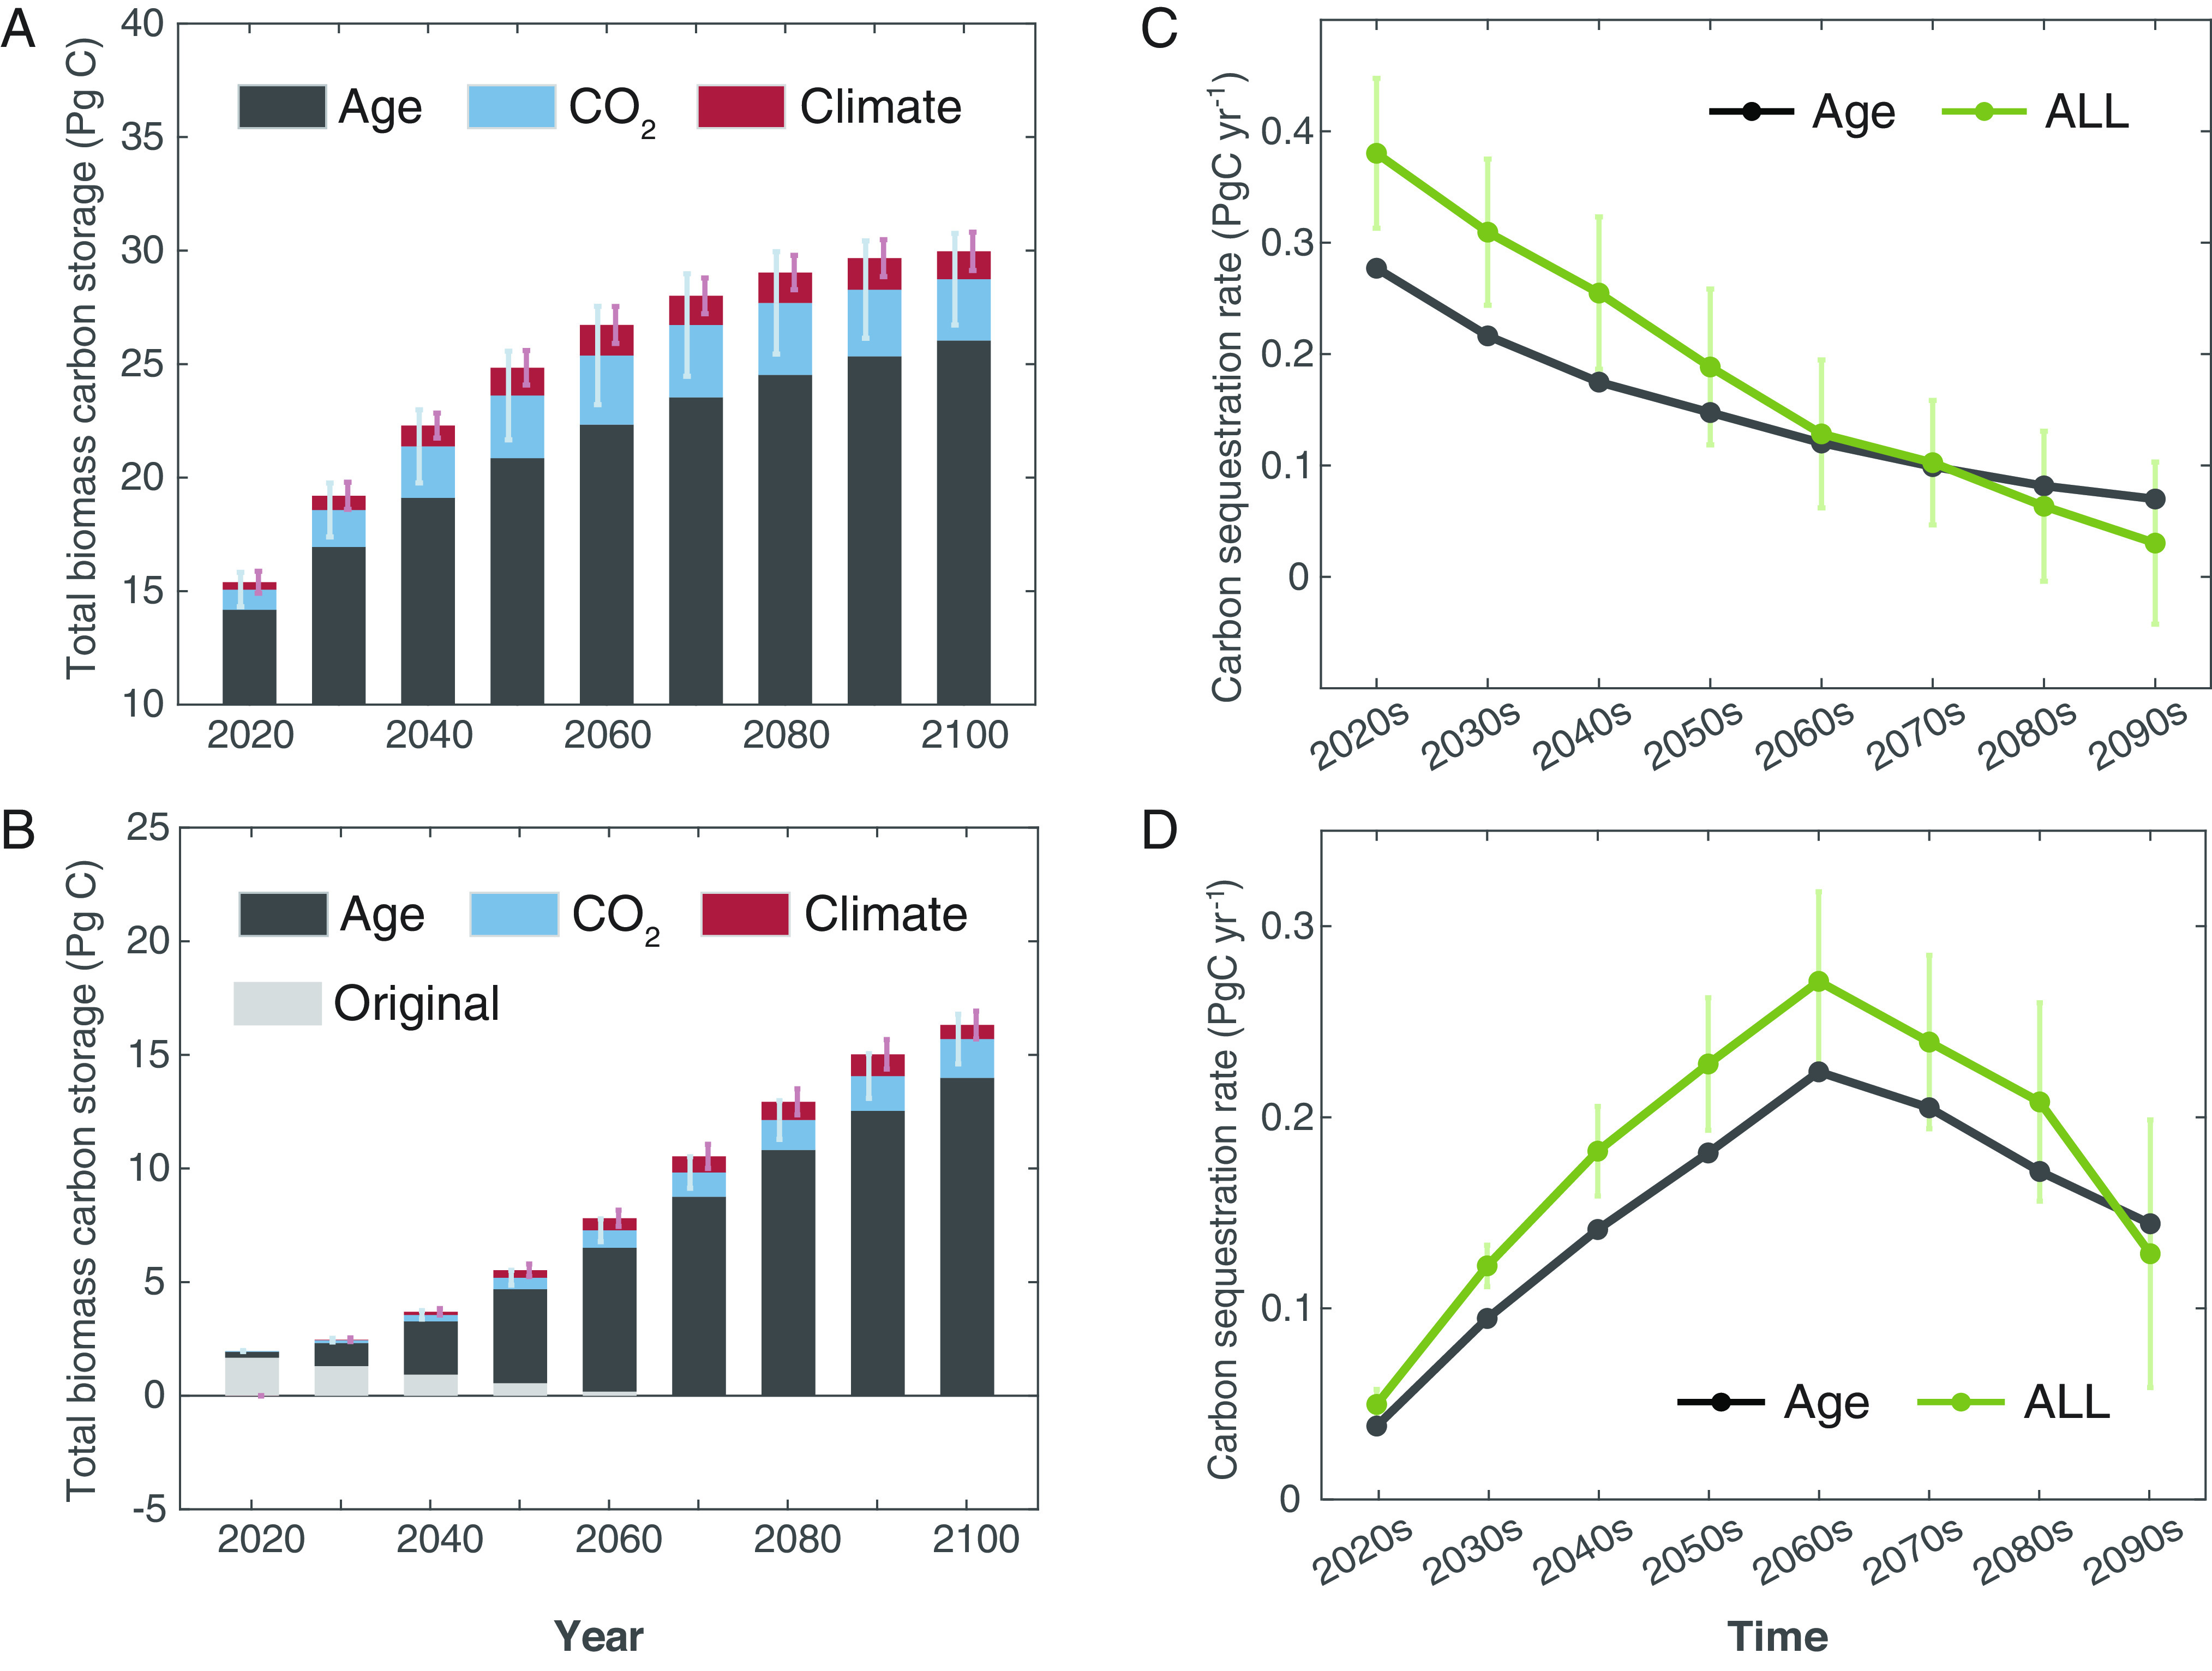
Dynamics of biomass carbon storage and carbon sink of existing and newly established forests under the progressive forestation scenario for 2020 to 2100. The area of the newly established forests was assumed to expand according to the progressive forestation scenario shown in Fig. 3B. (A and B) show the total forest biomass carbon storage (Pg C) attributed to the effects of forest age, climate change, and rising atmospheric CO2 concentration under the SSP1-2.6 scenario for existing forests (A) and newly established forests (B). The gray bars indicate changes of the biomass carbon stock over the land areas prior to forestation. The error bars show the range of values obtained from the different ESMs participating in CMIP6. (C and D) Projected carbon sequestration rates for each decade between 2020 and 2100 for existing forests (C) and the newly established forests (D). The green lines denote the projected carbon sinks obtained by integrating the effects of forest age, climate, and CO2, whereas the black lines account for the forest age effect only. The error bars show SDs.
The newly established forests under the progressive forestation scenario can supply a cumulative biophysical carbon sink potential of 14.3 Pg C between 2020 and 2100 under the SSP1-2.6 scenario (Fig. 4B), after deducting the original biomass carbon stock of 1.7 Pg C prior to forestation (SI Appendix, Fig. S7). The size of this carbon sink from future forestation is comparable to the size of that from existing forests. Climate change and CO2 fertilization were projected to contribute 4.5% and 12.5%, respectively, of the carbon gains in 2100 (Fig. 4B). Under the higher-emission scenarios of SSP2-4.5 and SSP5-8.5, the effects of changes in average climate conditions turned neutral or negative (+0.9% and −4.5%, respectively), whereas the CO2 fertilization effects were amplified by three and six times, respectively, compared to the SSP1-2.6 scenario (SI Appendix, Figs. S8 and S9). Although the projected carbon sink from existing forests will decline with time, the projected biophysical potential of carbon sink in the newly established forests will continue to increase as their area expands, rising from 0.05 Pg C y−1 during the 2020 s to a maximum value of 0.27 Pg C y−1 during the 2060s, when all potential forestation is completed (Fig. 4D). Subsequently, this carbon sink potential will decline, falling to 0.13 Pg C y−1 in 2100 but remaining substantial.
The additional carbon sink created by a progressive forestation scenario can compensate for the declining sink of the existing forests (Fig. 4), thus maintaining relatively stable carbon sequestration over time for the forest ecosystem as a whole (SI Appendix, Fig. S10). Altogether, the entire forest ecosystem in China can be expected to provide a stable biophysical sink potential of around 0.4 Pg C y−1 to 2060 (SI Appendix, Fig. S10), roughly equivalent to 13.8% of the national fossil CO2 emissions of China in 2020 (34). Subsequently, the carbon sink will decline but can still be maintained at 0.18 Pg C y−1 by the end of this century (SI Appendix, Fig. S10).
Discussion
Our analysis demonstrated the large biophysical potential of climate mitigation by nationwide progressive forestation. We acknowledge, however, that in practice, multiple effects and potential trade-offs must be considered within the ecological, climatic, social, and economic contexts of forestation. For example, trees store and transpire more water than herbaceous vegetation, making afforestation potentially conflicting with agricultural, industrial, and household water demands (35, 36), especially in arid and semiarid regions. The reduction of albedo caused by afforestation in drylands or high latitudes would partially offset its climate cooling effect (37, 38). On the other hand, surface climate cooling and enhanced precipitation resulting from forest biogeophysical processes may further facilitate local climate change mitigation (24, 27). Forestation can also have positive (39) or negative (40) effects on local biodiversity. In addition, forestation also has to be balanced with socioeconomic considerations. For instance, forestation potential quantified in this study is greatly limited in southern and eastern China due to land competition from agriculture and human settlement (Fig. 1). Financial investments or policy incentives will also affect the incomes of local people (32, 41). It is reported in northern China that afforestation has reduced local household income (25). More importantly, there are huge divergences in these trade-offs described above across different regions (24, 42). Therefore, we should emphasize again that our proposed afforestation roadmap and estimated carbon sink reflect a “biophysical potential” and that accounting for various trade-off effects might render the actually realized forestation area and carbon sink below such a potential. Local knowledge, more holistic impact assessment, and careful planning are hence needed to tailor our proposed forestation roadmap to the local socioecological context and balance potential trade-offs (26, 41, 42).
We identified the forest types for potential forestation based on their potential feasibility for establishing under current local environmental conditions as demonstrated in the national forest inventory, with the hope of minimizing unanticipated failures while maximizing carbon sequestration benefits. Recent meta-analyses based on global-scale paired-site observations have reported higher forest productivity in multispecies plantations than in monoculture ones (43). Enhanced cobenefits of biodiversity conservation, soil erosion control, and water yield have also been reported in native old-growth forests or restored native forests compared to plantations (39, 43). These results suggest that mixed species or native species from natural restoration should be preferred over monoculture plantations in afforestation or reforestation efforts (42). In our analysis, the proposed 15 dominant forest types for forestation are all native and they should be best understood as being the dominant species of a forest community rather than monoculture plantations. Our approach has the advantage of using the proven species distribution information and field-based biomass growth models to derive robust estimates of the future carbon sink potential, and hence, the roadmap proposed merits serious consideration. Nonetheless, stresses have to be made that the optimal tree species selection proposed in this study (Fig. 2B) is based on the context of maximizing carbon sequestration and is not necessarily the best option for biodiversity conservation, soil erosion control, and water yield. Forestation is a context-dependent activity with a single approach barely suited to all areas. Our study aimed for a broad illustrative roadmap rather than providing direct, readily implementable solutions at a local scale. Expertise from local foresters or forest management agencies is still needed to determine the optimal forest species depending on its specific end goals.
We omitted changes in soil organic carbon (SOC) stock following afforestation due to its great uncertainties. Although afforestation-induced SOC reduction has occasionally been reported over northeastern China (44), nationwide meta-analyses have shown that the initial drop in SOC following afforestation could be largely reversed at a later stage with forest growth (45). Moreover, significant carbon accumulations have also been reported in surface litter and dead wood along with forest growth on a national scale (46). Hence, neglecting carbon accumulation in soil organic matter (including surface litter, dead wood, and SOC) may lead to an underestimation of the biophysical carbon sink potential (47). But on the other hand, ignoring negative effects of climate extremes (drought, heat waves, snow storms, etc) and forest disturbances (fire, wind, insects, etc.) on forest carbon accumulation may lead to an overestimation of the carbon sink potential (48, 49). This is particularly true under the high-emission scenarios of SSP2-4.5 and SSP5-8.5 as the frequencies of climate extremes and forest disturbances were projected to increase under these scenarios (50, 51). Unfortunately, great uncertainties exist in our current predictions of the frequency and extent of future climate extreme events (50, 51) and in our knowledge to predict how forest carbon cycle responds to climate extremes, in particular, in the nonlinearity nature of such responses and the associated tipping points (48, 52). These shortcomings hinder us from making accurate predictions on how changes in climate extremes and forest disturbance will impact future carbon sequestration in China’s forests. Without accounting for the effects of climate extremes, forest disturbances, or wood harvest, forest ecosystems can provide a sustained biophysical carbon sink potential of around 0.4 Pg C y−1 well before and after the official carbon-neutrality target year of 2060. Such nature-based CO2 removals will not replace vital emission cuts, but they can help to offset the residual emissions that cannot be entirely eliminated, hence enabling the country to effectively reach—and remain at—a state of net-zero emissions.
Nonetheless, warnings must be made that forestation, or forest restoration, should not be oversold as a panacea to mitigate climate change. Forest carbon removals should never overshadow other crucial mitigation actions such as preventing deforestation or drastically reducing fossil fuel emissions (26). As shown in Fig. 4, the enhancement of carbon sequestration by expanding forest area is capped by the available area for forestation. Carbon sinks over both the existing and the newly established forests will inevitably diminish in the last few decades of this century when all forestation opportunities are exhausted. To maintain the net zero-carbon emissions state, further reduction of anthropogenic emissions must be required. In other words, our study does by no means preclude the urgent need to reduce greenhouse gas emissions (2, 8). Instead, the temporal path of forest carbon sink potential should be integrated with the planning of emissions reduction from the energy and industrial sectors, so that the successful implementation of the carbon-neutrality strategy can be secured by respecting the potential boundaries of natural climate solutions.
Materials and Methods
Our study consisted of four main modules as shown in the research framework (SI Appendix, Fig. S1). The first three modules addressed the three key questions of “where?,” “when?,” and “with what?” to afforest (SI Appendix, Fig. S1). For the question of “where” to afforest, we synthesized multiple datasets of potential forest distribution, existing forest, cropland, and urban distributions to determine the places where forestation is appropriate, without curtailing the agricultural activity or human settlements. For the question of “when” to afforest, we integrated the government's forest cover targets with the potential forestation area derived from addressing the question of “where” and developed a progressive forestation scenario to reach a feasible national forestation rate of 1.8 Mha y−1. The spatial distribution of forest age for existing forests was also estimated in this module in order to assess their future potential of carbon sequestration. For the question of “with what” to afforest, given that the species selection is influenced by “where” and “when” to afforest, we used a species distribution model to predict the environmentally suitable species or forest type out of a total of 15 forest types for places where potential forestation is needed and further combined the outcome with forest growth models to search for optimal forest species providing the maximum biomass carbon sequestration potential.
The fourth and final module integrated the results of the previous three modules (as indicated by the gray annotations in SI Appendix, Fig. S1) into an empirical, spatially explicit modeling framework of forest biomass growth to estimate the biophysical potentials of forest biomass carbon storage and the corresponding carbon sequestration rates of both existing forest and newly established forest. Specifically, the outcome of “where” to afforest determines the location of forestation and its climate and environmental conditions, the outcome of “when” to afforest determines forest age, and the outcome of “with what” to afforest determines the forest species or forest type and the resulting forest biomass growth model being used to predict the biophysical potential of carbon sequestration. Descriptions of our methods are provided below, with detailed information being further provided in SI Appendix.
Potential Forest Distributions and Forestation Opportunity.
We defined “the potential forestation opportunity” as areas of potential forest distribution unoccupied by existing forest, agricultural land, or human settlements (Fig. 1A). The derivation of potential forest distributions is described in this section, while the derivation of the spatial distribution of existing forest, agricultural land, or human settlements is provided in the next section.
We integrated three different methods/datasets to predict the potential forest distribution across China (for details see SI Appendix). The first of these is the potential tree cover distribution predicted by random-forest modeling, following a similar approach to Bastin et al. (8). In that study, direct tree cover (0 to 100%) measurements were made using direct photo interpretation for protected regions across the world, and the results used as a measure of the natural tree cover distribution without human intervention. We fitted a random forest model using their observations in China and predicted the potential tree cover distribution across China at a spatial resolution of 30 arcsec (~1 km). Grid cells (1 km resolution) with a tree cover ≥20% were defined as “forest,” consistent with the definition used in Chinese National Forest Continues Inventory (28). We also generated a global 1-km map of potential forest coverage using the map of forest and landscape restoration opportunities from the World Resources Institute (15), which has been extensively used in previous studies on evaluating the potentials of forest restoration and the land carbon sink (7, 42). The main data source to define potential forest extent in this map was the Olson ecoregion map that based on the global climatic and topographic factors on nature (53). Here, three ecoregion types—dense forest, open forest, and woodland—were combined and considered as the potential forest extent.
Third, we employed the process-based dynamic global vegetation model ORCHIDEE (Organizing Carbon and Hydrology in Dynamic Ecosystems) to simulate the potential forest distribution in China under current environmental conditions at a 0.5° resolution (see details in SI Appendix). We used version ORC-HL-NVD (54) which has an improved parameterization for vegetation dynamics in northern temperate and boreal regions, including the processes of establishment, mortality, and species competition for different tree functional types. For integration with the other two 1-km distribution maps, potential forest coverage (%) as simulated by the ORCHIDEE model at a 0.5° spatial resolution was converted to forest distribution at a 1-km resolution. This was done by first ranking the underlying 1-km pixels within each 0.5° grid cell by their respective tree cover as simulated by the random forest modeling approach. Then, an appropriate threshold was chosen such that the total area of the 1-km pixels with a predicted forest cover above the threshold was equal to the predicted forest coverage value derived for the 0.5° grid cell concerned by the ORCHIDEE model.
The random-forest modeling approach produced a more conservative potential forest distribution than the other two methods probably because it considered multiple environmental constraints (including climate, soil, and topography) at a native 1-km high resolution and/or because tree cover observations used to train the model tend to underestimate tree cover due to the inevitable legacy effects of human management (8) or disturbances (55). The ORCHIDEE model yielded the largest potential forest area, likely because the coarse spatial resolution (0.5° compared to the fine-resolution (1-km) data used by the other two approaches) smoothed out environmental heterogeneity within the grid. We divided these potential forest pixels into three classes (high, medium, and low confidence) based on the consistency of the three approaches. For a potential forested pixel, high confidence means that all three approaches agreed; medium confidence means that two of the three methods agreed, while low confidence means only one of the three methods indicated forestation (Fig. 1A). To maximize our confidence in the derived potential forest distribution used for future carbon sequestration prediction, only those 1-km pixels labeled as high confidence were considered to be a potential forestation area (Fig. 1A).
Existing Forest, Cropland, and Urban Distributions.
To accurately identify the current distribution of forest, agricultural, and urban land, we harmonized multiple sources of inventory data and high-resolution satellite images (SI Appendix, Table S3). First, we used a 1:1000000 vector map of forest type distribution from the forest inventory made during the period 2013 to 2017 (FI 2013 to 2017) by the China Forest Vegetation Survey project of the Chinese Academy of Forestry Sciences (30). The vector map was remapped to a 1-km grid under the WGS1984 coordinate system. This map contains the forest type and species information needed to estimate forest biomass carbon, and, therefore, it served as the baseline distribution map for estimating existing forest biomass carbon. For the convenience of analyses, we grouped the 500 forest types (by dominant tree species) in FI 2013 to 2017 into 15 types (SI Appendix, Table S15). Forest types with small areas were integrated into those which have closely related dominant species and/or share similar vegetation characteristics (22).
Second, we employed the widely used global tree cover dataset of Hansen et al. (56), which provides global tree cover (0 to 100%) distribution in 2000, and forest loss and gain information for 2000 to 2019 at a spatial resolution of 30 m. These data were used to calculate tree cover in China for 2019, followed by further resampling to a 1-km grid by area-weighted averaging. We then defined those 1-km grid cells with ≥20% tree cover as “forest,” consistent with the definition used in Chinese National Forest Continuous Inventory (28).
Third, we used another five satellite-based land-cover datasets: one Chinese regional database [CNLUCC (57)] and four global databases [MODIS (58), GLC-FCS30 (59), Globeland30 (60), and ESA-CCI (61)]. The latest versions of all five datasets were used (SI Appendix, Table S3). Since these datasets were provided at a finer resolution (30 m or 500 m) than 1 km, we defined the land-cover type for each 1-km grid cell according to its dominant land-cover type, i.e., the land-cover type occupying the largest area according to the fine-resolution distribution information.
We found that the major source of mismatches in forest and cropland distribution between the different datasets arises from inconsistency in the definitions of “forest” or “cropland” (SI Appendix, Table S3). For forest distribution, the inconsistency resides in the different thresholds of canopy cover or tree cover used to define “forest.” “Forest” is defined as occupying an area of more than 0.0667 ha and with canopy coverage exceeding 20% in the national survey (28). However, some satellite-based land-cover datasets define forest as having canopy coverage more than 30% (e.g., CNLUCC and MODIS), whereas others define it as canopy coverage greater than 10% or 15%, and hence include part of the national survey woodland areas (areas having a canopy coverage of 10 to 20%) as “forest.” In addition, differences in forest distribution between the databases also depend on whether economic forests are included or not. For “cropland,” the differences were mainly due to inconsistent treatment of whether economic trees (i.e., orchard) or grasses were included (SI Appendix, Table S3).
In order to maximize the accuracy in the derived spatial distributions of existing forest, cropland, and urban land, we integrated the inventory-derived map and six satellite-based land-cover products (as described above) based on the consistency of the different datasets. We identified the land-cover type of a given grid cell as “forest” or “cropland” in Fig. 1A only when no less than half of the datasets (i.e., ≥4 for forest and ≥3 for cropland) agreed (SI Appendix, Table S3 and Figs. S4 and S5). Note that forest type information, which is not available in our combined forest map, was required when determining the forest stand age and estimating the forest biomass carbon. Hence, we used the existing forest map from FI 2013 to 2017 instead of the combined forest map in subsequent analyses (Figs. 2–4) for existing forests. This alternative approach yielded quite similar areas of existing forest (181.2 Mha for the combined forest map vs. 179.4 Mha for the FI 2013 to 2017 forest map), though there were slight differences in the spatial distribution (kappa coefficient = 0.71).
Additionally, we identified the current land-cover types of potential afforestation areas in Fig. 1A based on the five satellite-based land-cover datasets. Given the wide variation in land-cover classifications and definitions among the five datasets, we have grouped those numerous classifications into five main categories: 1) partial tree cover but not forested (tree cover mostly lower than 20%), which includes mosaic patches with tree covered, open forest land, shrub land, and unestablished forestry land (e.g., unestablished afforestation land, cut-over area, fired-over area, nursery land, forest suitable land) (12, 28); 2) grassland, which is dominated by herbaceous vegetation with barely tree distribution at present, including steppes, meadows, savannas, desert grasslands, and urban artificial grasslands; 3) wetland, which includes wetlands, swamps, mudflats, etc., with water cover; 4) bare soil or sparsely vegetated areas, which includes deserts, bare rock, permanent snow, and ice, etc., with less than 10% vegetation cover; 5) others. For each potential forestation pixel, we chose the land-cover type (excluding cropland and urban) which occurred most frequently among the five land-cover datasets as the final result. Statistics on the proportion of current land types in potential forestation areas with high, medium, and low confidence in Fig. 1A are presented in SI Appendix, Fig. S3.
Modeling the Species Suitability Distribution.
Species distribution models, which predict a species’ probability of occurrence based on occurrence–environment correlations, have become important tools for afforestation and forest restoration planning (18). In this study, we employed the Maximum Entropy model (MaxEnt v3.4.3) to predict species distribution for potential forestation in China. The MaxEnt model is one of the most widely used and robust modeling approaches (62, 63) especially for cases where only presence data are available and absence data are difficult to collect. Details of the process of building the species distribution prediction models are given in SI Appendix and summarized here. The key input of species occurrence observations was converted from the spatial distribution of existing forest species obtained from a recent nationwide field survey (Fig. 2A), with, when necessary, further spatially rarefication of the observations. The corresponding environmental variables (including climate, soil, and topography) of 1-km pixels were extracted and used together with the species presence data to build the prediction models. Model performance was assessed using 10-fold cross-validations, and the area under the curve (AUC) scores were used to evaluate model accuracy (62). The obtained MaxEnt models for the 15 forest types all showed high accuracy (AUC ≥ 0.83, SI Appendix, Table S4), which confirmed the feasibility of using species distribution modeling to guide species selection for forestation.
The constructed species distribution models were then used to predict the distribution probability (i.e., suitability, 0 to 1) for different forest types using environmental variables (SI Appendix, Fig. S6). The average value of the occurrence probabilities predicted by the 10 distribution models constructed in the cross-validation process was used as the occurrence probability for each forest type. We converted the distribution probability into a binary map (i.e., suitable or not) applying the average of the maximum test sensitivity plus specificity threshold to minimize the false-positive and false-negative errors (64) (SI Appendix, Table S4). The outcome of this process was a number of forest species or groups of species which were considered suitable for each 1-km potential forestation pixel. On this basis, we proposed two solutions to determine the “optimal forest type” out of all the potentially suitable forest types. One was to select the forest species with the highest habitat suitability for each grid point as the optimum (Fig. 2C), while the other was to select the forest type with the largest biomass carbon storage at a mature stage under current climate condition (Fig. 2B). The comparison between the two solutions can be used to indicate how much the selection to maximize carbon stock has increased the carbon sequestration (Fig. 2C).
Existing Forest Stand Age Distribution.
Spatially explicit information on forest stand age was required for estimating the future forest biomass carbon sink capacity of existing forests. We developed a 1-km forest stand-age map for China by translating satellite-based forest height observations into stand-age information using growth relationships between forest height and stand age, following the approach of Zhang et al. (31). The principle is to optimize the parameters in forest type–specific growth equations that link forest age to canopy height (SI Appendix, Table S5), so that fractions of different forest age classes for each forest type at provincial levels (that are inversed from a spatially explicit forest height map) would best match those reported by the national forest inventory. In the current study, the most recent versions of the key datasets were used. These include provincial statistics for areas of different forest age classes from the latest 9th national forest inventory (2014 to 2018) (28), the recently released 30-m spatial resolution global forest height map from the Global Ecosystem Dynamics Investigation (65) in 2019 (resampled to 1-km resolution), and the most recent forest type distribution map from the FI 2013 to 2017 (30). Due to the parameter optimization against the age structure data from the national forest inventory, it is believed that our growth models generate a more accurate forest age map of China, since it better depicts the regional heterogeneity compared to global datasets such as the MPI-BGI global forest age dataset, which only capture a homogeneous pattern of regional average age (66).
Progressive Forestation Scenario.
The Chinese government has announced a series of national goals and ambitions on “total forest area” in recent years (14), which are a guide to building a practical and realistic forestation scenario. We synthesized these national-level forestation goals, from the near-term plan for 2025 to the long-term 2050 target to “reach the world average level of forest coverage.” The forest cover or wood volume information was converted to “forest area” which better suits our research purpose (SI Appendix, Table S6). The extent of total forest area in government documents included not only the area of arbor forest (which is the forest area in our study) but also bamboo forest and special shrub forest (28). Hence, adjustments were made based on the proportion of arbor forest against the total forest area obtained from the latest 9th national forest inventory (28) to derive arbor forest area targets implied by these national plans (SI Appendix, Table S6).
We found that the forest areas targeted by different national goals over time can be well fitted by a linear relationship (Fig. 3B, R2 = 0.96), suggesting that a continuous and progressive forestation strategy was implied by government policies. We hence assumed a constant annual forestation area (1.8 Mha per year) over time, i.e., a constant number of potential forestation grid cells would be randomly selected and converted from nonforest to forest each year after 2016, until all potential forestation spaces are exhausted at the end of 2062 (Fig. 3B). Along with the conversion from nonforest to forest for the potential forestation grids, the associated living biomass C of the original land cover was assumed to be lost to the atmosphere and was therefore subtracted from the accumulation of the biomass C of the newly established forest (Fig. 4C). We calculated the living biomass C stored in the original land cover based on the carbon densities map of living biomass (both above- and below-ground) in 2010 from Spawn et al. (67) (SI Appendix, Fig. S7). The amount of biomass in these areas was assumed to be static up to the occurrence of forestation, which we believe to be a reasonable assumption because the biomass of nonforest land, such as grassland and shrub land, has a good chance of being close to saturation. Moreover, the influence of this assumption on the estimated future carbon sink potential was considered small because the total biomass C over the nonforest pixels (~1.7 Pg C) was relatively small compared to the forest biomass that will establish and grow with time (Fig. 4B). Ultimately, we repeated the random sampling of forestation grids over space and time 1,000 times and found a small variation of the estimated annual carbon sink (<0.005 Pg C y−1) caused by the random selection of forestation pixels in the progressive forestation scenario.
Age-Dependent Statistical Models for Estimating Forest Biomass C Storage.
To estimate the forest biomass C sequestration in China driven by forest aging, climate change, and rising atmospheric CO2 concentration, we employed a set of statistical forest biomass growth models as established by Yao et al. (22) (SI Appendix, Table S7). These were further complemented by the CO2 fertilization effects on biomass estimated by ESMs. The models employed, listed in SI Appendix, Table S7, integrated the individual effects of age-related forest regrowth, MAT and MAP on forest biomass accumulation in China by synthesizing in situ measurements (68). The CO2 fertilization effects on biomass were based on the results of model experiments (i.e., 1pctCO2 experiments) carried out as part of the CMIP6 (33).
During forest development, forest biomass increases with stand age, but the rate of increase gradually declines to zero until the old-growth stage when biomass growth saturation is reached. The relationships between forest biomass and stand age can be described by growth equations (SI Appendix, Table S7) that include both stand age and climate factors as parameters. Climate factors were included by adding a linear combination of MAT and MAP (i.e., α×MAT+β×MAP+γ) into the model formulation. Previous studies have reported great variations in biomass–age relationships along environmental gradients and among different forest types (20), and these have been represented in this study by various forms of growth function (e.g., logarithmic, logistic, and theoretical growth). Nonlinear least square regressions were used to determine the optimal function and associated parameters for each of the 15 forest species groups. R2 and root mean square error (RMSE) were used as criteria to determine the best function form. The function form with the highest R2 and the lowest RMSE is denoted as “Fitted function” in SI Appendix, Table S7.
To quantify the effect of changing forest age only on forest biomass C storage from 2016 to 2100, forest age was allowed to change annually, with the climate held constant at the average current period (2005 to 2015, i.e., t0 in Eq. 1) conditions. The MAP and MAT were extracted from a 1-km monthly climate dataset for China (69). This dataset was spatially downscaled from the 0.5° Climatic Research Unit climate dataset (CRU-TS-4.03) using the 1-km climate dataset of WorldClim2.1 and was validated using observations from 496 weather stations across China.
| [1] |
where B denotes forest biomass at a given year t between 2016 and 2100, with the subscript and superscript denoting the corresponding forest age and whether, and which, climate effects were considered, respectively. For instance, represents forest biomass predicted based on the forest age at year t with fixed current climate conditions. f represents the biomass growth function listed in SI Appendix, Table S7. represents the forest age for year t. Biomass was converted into C content using a conversion factor of 0.5 (70).
Future Climate Bias Correction and its Effects On Biomass C.
For the future period, climate-change effects on total forest biomass C storage were calculated by varying the values of MAP and MAT as simulated by climate models under the future Shared Socioeconomic Pathways (SSPs) which reflect different plausible projections of climate change mitigation (71). In the main text, we have focused on the sustainable scenario, SSP1-2.6, which was close to the future mitigation scenarios implied by the climate pledges, such as the Paris Agreement (3), made by various countries/regions. However, we also analyzed two further scenarios: the SSP2-4.5 scenario which has an intermediate level of carbon emissions (SI Appendix, Fig. S8) and the SSP5-8.5 scenario with its very high levels of carbon emissions (SI Appendix, Fig. S9). We used outputs from 31 ESMs (SI Appendix, Table S8) participating in CMIP6 to calculate the uncertainty of future climate change effects as represented by different model simulations. Since outputs of climate simulations from CMIP6 models are generally biased compared to observations and these outputs were provided at very coarse resolutions (0.8° to 2.8°), we applied both bias correction and spatial downscaling to generate high-resolution (i.e., 1-km), bias-corrected MAP and MAT data (for details refer to SI Appendix).
To estimate climate change–induced changes in total forest biomass C storage, both forest age and climate variables were allowed to change (Eq. 2):
| [2] |
where represents the biomass predicted based on both the forest age and the climate conditions for a given year t. and are the MAP and MAT for the year t, respectively. The effect of climate change on forest biomass C storage ( ) was then obtained by subtracting the age-driven biomass from (Eq. 3):
| [3] |
CO2 Fertilization Effects on Biomass C.
To estimate the effect of increasing CO2 concentration on forest biomass C storage, we used the results of the 1 pctCO2 biogeochemical diagnostic experiment from CMIP6, in which 140-y simulations were performed assuming a 1% increase per year in CO2 concentration (72). In this experiment, it is only the CO2 concentration that was allowed to change with time, while other forcing variables such as climate were maintained at their preindustrial levels. The model outputs were first remapped onto a 1-km grid using the first-order conservative interpolation method. For each grid cell, we first determined the evolution of the CO2 concentration under different SSP scenarios and extracted the corresponding vegetation biomass C density (variable name: cVeg) from the 1% CO2 experiment results. Ratios ( ) were calculated for the whole of China of the simulated forest biomass C densities under different CO2 concentrations corresponding to a given year t in the future (i.e., 2020, …, 2090, 2100) to that under the CO2 concentration of 1978 to 2008 (Eq. 4).
| [4] |
where denotes the simulated biomass C density corresponding to the mean CO2 concentration for a given year t, and t0 denotes the simulated biomass C density corresponding to the CO2 concentration of 1978 to 2008 (358.6 ppm). An upper bound of 10 was imposed on F to avoid unrealistically large CO2 fertilization effects on biomass C in the model simulations.
The effect of increasing CO2 concentrations on the forest biomass C density in China was then calculated using the ratios derived above (Eq. 5):
| [5] |
where represents biomass C density driven by changing forest age only, and represents the effect of increasing CO2 concentration that should be added on top of . The uncertainty of the CO2 fertilization effects was characterized as the SD of calculated using different forest biomass ratios from 1pctCO2 experiments of 22 ESMs participating in CMIP6 (SI Appendix, Table S8).
The predicted forest biomass C density for a given year t in the future, calculated by combining all three effects—forest age, climate change, and CO2 concentration increase—can be expressed as
| [6] |
where represents the biomass C density for a given year t when all effects are included (Fig. 4). Finally, the average biomass C storage growth rate for each decadal interval (e.g., 2020s representing 2021 to 2030) was calculated as the change in biomass C stock during a given decade divided by the duration in years, to represent the predicted carbon sink (Fig. 4 C and D).
Supplementary Material
Appendix 01 (PDF)
Acknowledgments
This study was supported by the Second Tibetan Plateau Scientific Expedition and Research Program (2022QZKK0101) and the Strategic Priority Research Program of Chinese Academy of Sciences (XDB40000000). C.Y. acknowledges the support from Open-end Funds of Ministry of Education Key Laboratory for Earth System Modeling (Tsinghua University).
Author contributions
S.P. designed research; H.X. performed research; H.X., C.Y., Y.Z., D.L., and S.P. contributed new reagents/analytic tools; H.X. analyzed data; and H.X., C.Y., Y.Z., and D.L. wrote the paper.
Competing interests
The authors declare no competing interest.
Footnotes
This article is a PNAS Direct Submission. P.S. is a guest editor invited by the Editorial Board.
Although PNAS asks authors toadhere to United Nations naming conventions for maps (https://www.un.org/geospatial/mapsgeo), our policy is topublish maps as provided by the authors.
Contributor Information
Chao Yue, Email: chaoyue@ms.iswc.ac.cn.
Shilong Piao, Email: slpiao@pku.edu.cn.
Data, Materials, and Software Availability
The WorldClim2.1 dataset is available at https://www.worldclim.com/version2 (73). The 1-km monthly precipitation and air temperature at 2-m datasets for China can be obtained from https://doi.org/10.5281/zenodo.3114194 (74) and https://doi.org/10.5281/zenodo.3185722 (75), respectively. The China Meteorological Forcing Dataset is available at https://data.tpdc.ac.cn/en/data/8028b944-daaa-4511-8769-965612652c49/ (76). Soilgrid250m datasets are available at https://files.isric.org/soilgrids/latest/ (77). The Global Multiresolution Terrain Elevation Data 2010 is available at https://www.usgs.gov/coastal-changes-and-impacts/gmted2010 (78). The 1:1000000 forest distribution map of China from the forest inventory during the period 2013 to 2017 (30) is available at http://www.doi.org/10.12041/geodata.43370179401687.ver1.db. The tree cover of Global Forest Change 2000–2019 (79) is available at http://earthenginepartners.appspot.com/science-2013-global-forest/download_v1.7.html. The CNLUCC dataset (80) can be obtained from https://www.resdc.cn/DOI/DOI.aspx?DOIID=54. The GLC-FCS30 global land-cover product (81) is available at https://data.casearth.cn/sdo/detail/6123651428a58f70c2a51e49. The MODIS Land Cover Type (MCD12Q1) Version 6 data product (58) is available at https://lpdaac.usgs.gov/products/mcd12q1v006/. The Globeland30 land-cover dataset (82) is available at https://doi.org/10.5281/zenodo.8385299. ESA-CCI land-cover dataset (61) is available at https://doi.org/10.24381/cds.006f2c9a. The 2019 global forest canopy height map is available at https://glad.umd.edu/dataset/gedi/ (83). The Global Aboveground and Belowground Biomass Carbon Density Maps for the Year 2010 (84) is available at https://daac.ornl.gov/cgi-bin/dsviewer.pl?ds_id=1763. The outputs of ESMs participating in CMIP6 are available at https://esgf-node.llnl.gov/search/cmip6/ (85). The forest inventory data for the 5th to 9th national forest inventories are available from https://doi.org/10.5281/zenodo.8297679 (86). The analyses and mapping were both performed using MATLAB (R2021b). In addition, ArcGIS 10.8 and MaxEnt v 3.4.3 were used to construct MaxEnt species distribution models and predict species suitable. All computer codes for process and analysis of the data are available at https://doi.org/10.5281/zenodo.8297679. All other data are included in the manuscript and/or SI Appendix.
Supporting Information
References
- 1.Liu Z., et al. , Challenges and opportunities for carbon neutrality in China. Nat. Rev. Earth Environ. 3, 141–155 (2021). [Google Scholar]
- 2.He J., et al. , Comprehensive report on China’s long-term low-carbon development strategies and pathways. Chin. J. Popul. Resour. Environ. 18, 263–295 (2020). [Google Scholar]
- 3.Meinshausen M., et al. , Realization of Paris Agreement pledges may limit warming just below 2 °C. Nature 604, 304–309 (2022). [DOI] [PubMed] [Google Scholar]
- 4.Baldocchi D., Penuelas J., The physics and ecology of mining carbon dioxide from the atmosphere by ecosystems. Glob. Change Biol. 25, 1191–1197 (2019). [DOI] [PubMed] [Google Scholar]
- 5.IPCC, Climate Change 2022: Impacts, Adaptation, and Vulnerability, Contribution of Working Group II to the Sixth Assessment Report of the IPCC (Cambridge Univ. Press, 2022). [Google Scholar]
- 6.Piao S., Yue C., Ding J., Guo Z., Perspectives on the role of terrestrial ecosystems in the ‘carbon neutrality’ strategy. Sci. China Earth Sci. 65, 1178–1186 (2022). [Google Scholar]
- 7.Griscom B. W., et al. , Natural climate solutions. Proc. Natl. Acad. Sci. U.S.A. 114, 11645–11650 (2017). [DOI] [PMC free article] [PubMed] [Google Scholar]
- 8.Bastin J.-F., et al. , The global tree restoration potential. Science 365, 76–79 (2019). [DOI] [PubMed] [Google Scholar]
- 9.Lu N., et al. , Biophysical and economic constraints on China’s natural climate solutions. Nat. Clim. Change 12, 847–853 (2022). [Google Scholar]
- 10.Grassi G., et al. , Reconciling global-model estimates and country reporting of anthropogenic forest CO2 sinks. Nat. Clim. Change 8, 914–920 (2018). [Google Scholar]
- 11.Lu F., et al. , Effects of national ecological restoration projects on carbon sequestration in China from 2001 to 2010. Proc. Natl. Acad. Sci. U.S.A. 115, 4039–4044 (2018). [DOI] [PMC free article] [PubMed] [Google Scholar]
- 12.Yu Z., et al. , Forest expansion dominates China’s land carbon sink since 1980. Nat. Commun. 13, 5374 (2022). [DOI] [PMC free article] [PubMed] [Google Scholar]
- 13.Piao S., He Y., Wang X., Chen F., Estimation of China’s terrestrial ecosystem carbon sink: Methods, progress and prospects. Sci. China Earth Sci. 65, 641–651 (2022). [Google Scholar]
- 14.National Development and Reform Commission, Ministry of Natural Resources of China, The Master plan for Major Projects of National Important Ecosystem Protection and Restoration (2021–2035), (National Development and Reform Commission and Ministry of Natural Resources of China, 2020), pp. 10-11. https://www.ndrc.gov.cn/xxgk/zcfb/tz/202006/P020200611354032680531.pdf. Accessed 20 June 2020.
- 15.World Resources Institute, Data from “Atlas of Forest and Landscape Restoration Opportunities”. https://www.wri.org/applications/maps/flr-atlas/#. Accessed 6 January 2021.
- 16.Baudena M., et al. , Forests, savannas, and grasslands: Bridging the knowledge gap between ecology and Dynamic Global Vegetation Models. Biogeosciences 12, 1833–1848 (2015). [Google Scholar]
- 17.Cai W., et al. , Carbon sequestration of Chinese forests from 2010 to 2060: Spatiotemporal dynamics and its regulatory strategies. Sci. Bull. 67, 836–843 (2022). [DOI] [PubMed] [Google Scholar]
- 18.Zhang L., Sun P., Huettmann F., Liu S., Where should China practice forestry in a warming world? Glob. Change Biol. 28, 2461–2475 (2022). [DOI] [PubMed] [Google Scholar]
- 19.Benz J. P., et al. , Multifunctionality of forests: A white paper on challenges and opportunities in China and Germany. Forests 11, 266 (2020). [Google Scholar]
- 20.Bukoski J. J., et al. , Rates and drivers of aboveground carbon accumulation in global monoculture plantation forests. Nat. Commun. 13, 4206 (2022). [DOI] [PMC free article] [PubMed] [Google Scholar]
- 21.Zhu K., Zhang J., Niu S., Chu C., Luo Y., Limits to growth of forest biomass carbon sink under climate change. Nat. Commun. 9, 2709 (2018). [DOI] [PMC free article] [PubMed] [Google Scholar]
- 22.Yao Y., Piao S., Wang T., Future biomass carbon sequestration capacity of Chinese forests. Sci. Bull. 63, 1108–1117 (2018). [DOI] [PubMed] [Google Scholar]
- 23.Feng X., et al. , Revegetation in China’s Loess Plateau is approaching sustainable water resource limits. Nat. Clim. Change 6, 1019–1022 (2016). [Google Scholar]
- 24.Li Y., et al. , Divergent hydrological response to large-scale afforestation and vegetation greening in China. Sci. Adv. 4, eaar4182 (2018). [DOI] [PMC free article] [PubMed] [Google Scholar]
- 25.Wang X., et al. , Unintended consequences of combating desertification in China. Nat. Commun. 14, 1139 (2023). [DOI] [PMC free article] [PubMed] [Google Scholar]
- 26.Holl K. D., Brancalion P. H. S., Tree planting is not a simple solution. Science 368, 580–581 (2020). [DOI] [PubMed] [Google Scholar]
- 27.Peng S.-S., et al. , Afforestation in China cools local land surface temperature. Proc. Natl. Acad. Sci. U.S.A. 111, 2915–2919 (2014). [DOI] [PMC free article] [PubMed] [Google Scholar]
- 28.National Forestry and Grassland Administration, Forest Resource Report of China (2014–2018) (Forestry Publishing House, 2019). [Google Scholar]
- 29.FAO, Global Forest Resources Assessment 2015: How are the World’s Forests Changing? (Food and Agriculture Organization of the United Nations, 2016). [Google Scholar]
- 30.Liu S., Chen Y., Zang R., Data from “1:1000000 forest distribution map of China for 2013-2017.” Geodata. Available at 10.12041/geodata.43370179401687.ver1.db. Deposited 19 May 2020. [DOI] [Google Scholar]
- 31.Zhang Y., Yao Y., Wang X., Liu Y., Piao S., Mapping spatial distribution of forest age in China. Earth Space Sci. 4, 108–116 (2017). [Google Scholar]
- 32.Delang C. O., Yuan Z., China’s Grain for Green Program (Springer International Publishing, 2015), 10.1007/978-3-319-11505-4 (27 July 2022). [DOI] [Google Scholar]
- 33.O’Neill B. C., et al. , The Scenario Model Intercomparison Project (ScenarioMIP) for CMIP6. Geosci. Model Dev. 9, 3461–3482 (2016). [DOI] [PMC free article] [PubMed] [Google Scholar]
- 34.Friedlingstein P., et al. , Global Carbon Budget 2021. Earth Syst. Sci. Data 14, 1917–2005 (2022). [Google Scholar]
- 35.Jackson R. B., et al. , Trading water for carbon with biological carbon sequestration. Science 310, 1944–1947 (2005). [DOI] [PubMed] [Google Scholar]
- 36.Tong X., et al. , Forest management in southern China generates short term extensive carbon sequestration. Nat. Commun. 11, 129 (2020). [DOI] [PMC free article] [PubMed] [Google Scholar]
- 37.Rohatyn S., Yakir D., Rotenberg E., Carmel Y., Limited climate change mitigation potential through forestation of the vast dryland regions. Science 377, 1436–1439 (2022). [DOI] [PubMed] [Google Scholar]
- 38.Arora V. K., Montenegro A., Small temperature benefits provided by realistic afforestation efforts. Nat. Geosci. 4, 514–518 (2011). [Google Scholar]
- 39.Hua F., et al. , The biodiversity and ecosystem service contributions and trade-offs of forest restoration approaches. Science 376, 839–844 (2022). [DOI] [PubMed] [Google Scholar]
- 40.Veldman J. W., et al. , Where tree planting and forest expansion are bad for biodiversity and ecosystem services. BioScience 65, 1011–1018 (2015). [Google Scholar]
- 41.Strassburg B. B. N., et al. , Strategic approaches to restoring ecosystems can triple conservation gains and halve costs. Nat. Ecol. Evol. 3, 62–70 (2018). [DOI] [PubMed] [Google Scholar]
- 42.Erbaugh J. T., et al. , Global forest restoration and the importance of prioritizing local communities. Nat. Ecol. Evol. 4, 1472–1476 (2020). [DOI] [PubMed] [Google Scholar]
- 43.Feng Y., et al. , Multispecies forest plantations outyield monocultures across a broad range of conditions. Science 376, 865–868 (2022). [DOI] [PubMed] [Google Scholar]
- 44.Hong S., et al. , Divergent responses of soil organic carbon to afforestation. Nat. Sustain. 3, 694–700 (2020). [Google Scholar]
- 45.Deng L., Liu G., Shangguan Z., Land-use conversion and changing soil carbon stocks in China’s ‘Grain-for-Green’ Program: A synthesis. Glob. Change Biol. 20, 3544–3556 (2014). [DOI] [PubMed] [Google Scholar]
- 46.Zhu J., et al. , Carbon stocks and changes of dead organic matter in China’s forests. Nat. Commun. 8, 151 (2017). [DOI] [PMC free article] [PubMed] [Google Scholar]
- 47.Hong S., et al. , Asymmetry of carbon sequestrations by plant and soil after forestation regulated by soil nitrogen. Nat. Commun. 14, 3196 (2023). [DOI] [PMC free article] [PubMed] [Google Scholar]
- 48.Reichstein M., et al. , Climate extremes and the carbon cycle. Nature 500, 287–295 (2013). [DOI] [PubMed] [Google Scholar]
- 49.Anderegg W. R. L., et al. , Climate-driven risks to the climate mitigation potential of forests. Science 368, eaaz7005 (2020). [DOI] [PubMed] [Google Scholar]
- 50.IPCC, Climate Change 2021: The Physical Science Basis, Working Group I Contribution to the Sixth Assessment Report of the Intergovernmental Panel on Climate Change (Cambridge University Press, 2021). [Google Scholar]
- 51.Anderegg W. R. L., et al. , A climate risk analysis of Earth’s forests in the 21st century. Science 377, 1099–1103 (2022). [DOI] [PubMed] [Google Scholar]
- 52.Li X., et al. , Global variations in critical drought thresholds that impact vegetation. Nat. Sci. Rev. 10, nwad049 (2023). [DOI] [PMC free article] [PubMed] [Google Scholar]
- 53.Olson D. M., et al. , Terrestrial ecoregions of the world: A new map of life on earth. BioScience 51, 933 (2001). [Google Scholar]
- 54.Zhu D., et al. , Improving the dynamics of Northern Hemisphere high-latitude vegetation in the ORCHIDEE ecosystem model. Geosci. Model Dev. 8, 2263–2283 (2015). [Google Scholar]
- 55.Guirado E., et al. , Climate legacies drive the distribution and future restoration potential of dryland forests. Nat. Plants 8, 879–886 (2022). [DOI] [PMC free article] [PubMed] [Google Scholar]
- 56.Hansen M. C., et al. , High-resolution global maps of 21st-century forest cover change. Science 342, 850–853 (2013). [DOI] [PubMed] [Google Scholar]
- 57.Liu J., et al. , Spatiotemporal characteristics, patterns, and causes of land-use changes in China since the late 1980s. J. Geogr. Sci. 24, 195–210 (2014). [Google Scholar]
- 58.Friedl M.,Sulla-Menashe D., Data from “MCD12Q1 MODIS/Terra+Aqua Land Cover Type Yearly L3 Global 500m SIN Grid V006.” NASA EOSDIS Land Processes DAAC. Available at 10.5067/MODIS/MCD12Q1.006. Accessed 6 January 2021. [DOI]
- 59.Zhang X., et al. , GLC_FCS30: Global land-cover product with fine classification system at 30 m using time-series Landsat imagery. Earth Syst. Sci. Data 13, 2753–2776 (2021). [Google Scholar]
- 60.Jun C., Ban Y., Li S., Open access to Earth land-cover map. Nature 514, 434–434 (2014). [DOI] [PubMed] [Google Scholar]
- 61.European Space Agency, Data from “Land cover classification gridded maps from 1992 to present derived from satellite observations.” C3S Climate Data Store (CDS). 10.24381/cds.006f2c9a. Accessed 20 October 2020. [DOI]
- 62.Phillips S. J., Anderson R. P., Schapire R. E., Maximum entropy modeling of species geographic distributions. Ecol. Modell. 190, 231–259 (2006). [Google Scholar]
- 63.Elith J., et al. , A statistical explanation of MaxEnt for ecologists: Statistical explanation of MaxEnt. Divers. Distrib. 17, 43–57 (2011). [Google Scholar]
- 64.Liu C., Newell G., White M., On the selection of thresholds for predicting species occurrence with presence-only data. Ecol. Evol. 6, 337–348 (2016). [DOI] [PMC free article] [PubMed] [Google Scholar]
- 65.Potapov P., et al. , Mapping global forest canopy height through integration of GEDI and Landsat data. Remote Sens. Environ. 253, 112165 (2021). [Google Scholar]
- 66.Besnard S., et al. , Mapping global forest age from forest inventories, biomass and climate data. Earth Syst. Sci. Data 13, 4881–4896 (2021). [Google Scholar]
- 67.Spawn S. A., Sullivan C. C., Lark T. J., Gibbs H. K., Harmonized global maps of above and belowground biomass carbon density in the year 2010. Sci. Data 7, 112 (2020). [DOI] [PMC free article] [PubMed] [Google Scholar]
- 68.Luo Y., Zhang X., Wang X., Lu F., Biomass and its allocation of Chinese forest ecosystems. Ecology 95, 2026–2026 (2014). [Google Scholar]
- 69.Peng S., Ding Y., Liu W., Li Z., 1 km monthly temperature and precipitation dataset for China from 1901 to 2017. Earth Syst. Sci. Data 11, 1931–1946 (2019). [Google Scholar]
- 70.Myneni R. B., et al. , A large carbon sink in the woody biomass of Northern forests. Proc. Natl. Acad. Sci. U.S.A. 98, 14784–14789 (2001). [DOI] [PMC free article] [PubMed] [Google Scholar]
- 71.Meinshausen M., et al. , The shared socio-economic pathway (SSP) greenhouse gas concentrations and their extensions to 2500. Geosci. Model Dev. 13, 3571–3605 (2020). [Google Scholar]
- 72.Arora V. K., et al. , Carbon–concentration and carbon–climate feedbacks in CMIP6 models and their comparison to CMIP5 models. Biogeosciences 17, 4173–4222 (2020). [Google Scholar]
- 73.Fick S. E., Hijmans R. J., Data from “WorldClim Version2.” WorldClim. https://www.worldclim.com/version2. Accessed 6 January 2021.
- 74.Peng S., Data from “High-spatial-resolution monthly precipitation dataset over China during 1901–2017.” Zenodo. 10.5281/zenodo.3114194. Deposited 17 May 2019. [DOI]
- 75.Peng S., Data from “High-spatial-resolution monthly temperatures dataset over China during 1901–2017.” Zenodo. 10.5281/zenodo.3185722. Deposited 17 May 2019. [DOI]
- 76.Yang K., et al. , Data from “China meteorological forcing dataset (1979-2018).” TPDC. 10.11888/AtmosphericPhysics.tpe.249369.file. Deposited 20 April 2021. [DOI]
- 77.Poggio L., et al. , Data from “SoilGrids250m 2.0.” ISRIC. https://files.isric.org/soilgrids/latest/. Deposited 31 January 2022.
- 78.Danielson J. J., Gesch D. B., Data from “Global Multi-resolution Terrain Elevation Data 2010 (GMTED2010).” USGS. https://www.usgs.gov/coastal-changes-and-impacts/gmted2010. Deposited 6 January 2021.
- 79.Hansen M. C., et al. , Data from “Global Forest Change 2000–2019.” Global Forest Watch. http://earthenginepartners.appspot.com/science-2013-global-forest/download_v1.7.html. Accessed 6 January 2021.
- 80.Xu X. L., et al. , Data from “China Multi-period Land Use Remote Sensing Monitoring Data Set (CNLUCC).” RESDC. 10.12078/2018070201. Accessed 6 January 2021. [DOI]
- 81.Liu L. Y., Zhang X., Data from “Global 30-meter Surface Coverage Fine Classification Product V1.0.” CASEarth. 10.12237/casearth.6123651428a58f70c2a51e49. Accessed 23 August 2021. [DOI]
- 82.Xu H., Data from “Land cover data (30m) derived from GlobeLand30 for the China region.” Zenodo. 10.5281/zenodo.8385299. Deposited 28 September 2023. [DOI]
- 83.Potapov P., et al. , Data from “Global Forest Canopy Height, 2019.” GLAD. https://glad.umd.edu/dataset/gedi/. Accessed 20 October 2021.
- 84.Spawn S. A., Gibbs H.K., Data from “Global Aboveground and Belowground Biomass Carbon Density Maps for the Year 2010.” ORNL DAAC. https://daac.ornl.gov/cgi-bin/dsviewer.pl?ds_id=1763. Accessed 20 October 2021.
- 85.WCRP, Data from “CMIP6 - Coupled Model Intercomparison Project Phase 6.” CMIP6. https://esgf-node.llnl.gov/search/cmip6/. Accessed 12 October 2021.
- 86.Xu H., Data from “Forestation at the right time with the right species can generate persistent carbon benefits in China.” Zenodo. 10.5281/zenodo.8297679. Deposited 29 August 2023. [DOI] [PMC free article] [PubMed]
Associated Data
This section collects any data citations, data availability statements, or supplementary materials included in this article.
Supplementary Materials
Appendix 01 (PDF)
Data Availability Statement
The WorldClim2.1 dataset is available at https://www.worldclim.com/version2 (73). The 1-km monthly precipitation and air temperature at 2-m datasets for China can be obtained from https://doi.org/10.5281/zenodo.3114194 (74) and https://doi.org/10.5281/zenodo.3185722 (75), respectively. The China Meteorological Forcing Dataset is available at https://data.tpdc.ac.cn/en/data/8028b944-daaa-4511-8769-965612652c49/ (76). Soilgrid250m datasets are available at https://files.isric.org/soilgrids/latest/ (77). The Global Multiresolution Terrain Elevation Data 2010 is available at https://www.usgs.gov/coastal-changes-and-impacts/gmted2010 (78). The 1:1000000 forest distribution map of China from the forest inventory during the period 2013 to 2017 (30) is available at http://www.doi.org/10.12041/geodata.43370179401687.ver1.db. The tree cover of Global Forest Change 2000–2019 (79) is available at http://earthenginepartners.appspot.com/science-2013-global-forest/download_v1.7.html. The CNLUCC dataset (80) can be obtained from https://www.resdc.cn/DOI/DOI.aspx?DOIID=54. The GLC-FCS30 global land-cover product (81) is available at https://data.casearth.cn/sdo/detail/6123651428a58f70c2a51e49. The MODIS Land Cover Type (MCD12Q1) Version 6 data product (58) is available at https://lpdaac.usgs.gov/products/mcd12q1v006/. The Globeland30 land-cover dataset (82) is available at https://doi.org/10.5281/zenodo.8385299. ESA-CCI land-cover dataset (61) is available at https://doi.org/10.24381/cds.006f2c9a. The 2019 global forest canopy height map is available at https://glad.umd.edu/dataset/gedi/ (83). The Global Aboveground and Belowground Biomass Carbon Density Maps for the Year 2010 (84) is available at https://daac.ornl.gov/cgi-bin/dsviewer.pl?ds_id=1763. The outputs of ESMs participating in CMIP6 are available at https://esgf-node.llnl.gov/search/cmip6/ (85). The forest inventory data for the 5th to 9th national forest inventories are available from https://doi.org/10.5281/zenodo.8297679 (86). The analyses and mapping were both performed using MATLAB (R2021b). In addition, ArcGIS 10.8 and MaxEnt v 3.4.3 were used to construct MaxEnt species distribution models and predict species suitable. All computer codes for process and analysis of the data are available at https://doi.org/10.5281/zenodo.8297679. All other data are included in the manuscript and/or SI Appendix.