

Abstract
Homologous recombination (HR) is a prominent DNA repair pathway maintaining genome integrity. Mutations in many HR genes lead to cancer predisposition. Paradoxically, the implication of the pivotal HR factor RAD51 on cancer development remains puzzling. Particularly, no RAD51 mouse models are available to address the role of RAD51 in aging and carcinogenesis in vivo. We engineered a mouse model with an inducible dominant‐negative form of RAD51 (SMRad51) that suppresses RAD51‐mediated HR without stimulating alternative mutagenic repair pathways. We found that in vivo expression of SMRad51 led to replicative stress, systemic inflammation, progenitor exhaustion, premature aging and reduced lifespan, but did not trigger tumorigenesis. Expressing SMRAD51 in a breast cancer predisposition mouse model (PyMT) decreased the number and the size of tumors, revealing an anti‐tumor activity of SMRAD51. We propose that these in vivo phenotypes result from chronic endogenous replication stress caused by HR decrease, which preferentially targets progenitors and tumor cells. Our work underlines the importance of RAD51 activity for progenitor cell homeostasis, preventing aging and more generally for the balance between cancer and aging.
Keywords: aging, homologous recombination, mouse model, RAD51, tumorigenesis
Subject Categories: Cancer; DNA Replication, Recombination & Repair
A new transgenic mouse model expressing a dominant‐negative SMRAD51 mutant shows that loss of key recombinase function does not trigger tumorigenesis.

Introduction
Genomic instability is a hallmark of cancer and aging (Garinis et al, 2008; Hoeijmakers, 2009; Negrini et al, 2010; Hanahan & Weinberg, 2011; López‐Otín et al, 2013, 2023). To maintain genome stability, the DNA damage response (DDR) coordinates cell cycle progression and DNA repair. Notably, activation of the DDR, which is proposed to be triggered in response to endogenous replication stress, has been observed at the preceding/early stages of cancer and senescence (Bartkova et al, 2005, 2006; Gorgoulis et al, 2005), suggesting that genomic instability represents an initial step in tumor formation. Moreover, aging and cancer are interrelated, and age is considered a risk factor for cancer (Hanahan & Weinberg, 2011; López‐Otín et al, 2013). However, the mechanisms underlying the balance between tissue degeneration and cell transformation that drive aging versus cancer after alteration of DNA repair pathways remain to be fully unraveled (López‐Otín et al, 2013; Tubbs & Nussenzweig, 2017; Petr et al, 2020).
Homologous recombination (HR) is a highly evolutionarily conserved pathway that plays essential roles in genome plasticity. HR is involved in the repair of DNA double‐strand breaks (DSBs) and DNA interstrand crosslinks (ICLs); importantly, it is also involved in the protection of arrested replication forks and the resumption of replication (Haber, 2014; Feng & Jasin, 2017). HR is initiated by the resection of DNA ends, which generates 3′ single‐stranded DNA (ssDNA) tails. These 3′ ssDNA tails are first covered and protected by replication protein A (RPA). Then, BRCA2/PALB2 displace RPA and replace it with RAD51, forming a RAD51‐ssDNA filament. This filament promotes sequence homology searching and the invasion of a homologous duplex sequence to form recombination intermediates that are subsequently resolved. Therefore, the ssDNA‐RAD51 filament is the active species of HR, and RAD51 thus plays a pivotal role at the critical step of HR.
Because of its importance in genome stability maintenance, HR is generally considered a tumor suppressor pathway. Consistent with this theory, many HR genes are altered in tumors, including in familial breast and ovarian cancers (Walsh et al, 2011; Chen et al, 2018; Angeli et al, 2020; Matos‐Rodrigues et al, 2021a) and in sporadic tumors (Lord & Ashworth, 2016; Matos‐Rodrigues et al, 2021a). Additionally, many HR genes are mutated in Fanconi anemia (FA), a rare autosomal recessive syndrome in which developmental defects are associated with malignancy (Kennedy & D'Andrea, 2005; Auerbach, 2009; Walden & Deans, 2014; Matos‐Rodrigues et al, 2021a). However, despite the pivotal role of RAD51 in HR, data have failed to implicate RAD51 inactivation in cancer development, constituting what we named the “RAD51 paradox” (Matos‐Rodrigues et al, 2021a). Several hypotheses have been proposed to explain this paradox (Matos‐Rodrigues et al, 2021a; Thomas et al, 2023). One of these hypotheses is based on the fact that mediator/accessory proteins that are mutated in cancer, such as BRCA1/2 or PALB2, promote RAD51 loading and stabilization on ssDNA. Therefore, mutations affecting any of these proteins lead to the abrogation of the loading of RAD51 on damaged DNA, which then becomes accessible to alternative nonconservative repair processes, such as single‐strand annealing (SSA) and alternative end‐joining (A‐EJ), increasing genome instability. Therefore, suppression of the mediators of RAD51 leads not only to the suppression of conservative HR but also to the concomitant stimulation of nonconservative SSA and A‐EJ pathways (Stark et al, 2002; Ahrabi et al, 2016; Han et al, 2017; So et al, 2022; Thomas et al, 2023). The stimulation of such alternative repair pathways might thus compensate for the decreased viability that results from HR suppression, but the fact that they are nonconservative should increase genome instability (So et al, 2022; Thomas et al, 2023). Therefore, the aforementioned hypothesis raises the following question: Does oncogenesis result from HR ablation alone per se or is the concomitant stimulation of nonconservative pathways necessary? In addition to being essential to HR, RAD51 binding to damaged DNA protects replication forks and prevents SSA and A E‐J in HR‐independent ways (Mason et al, 2019; So et al, 2022; Thomas et al, 2023). Therefore, suppressing HR without compromising the binding of RAD51 to damaged DNA would allow us to dissect the precise roles of RAD51 and HR in genome stability maintenance and cancer and premature aging protection.
Mouse models are helpful tools to study carcinogenesis and aging in vivo. However, most HR genes are essential, and their inactivation leads to embryonic lethality (Tsuzuki et al, 1996; Evers & Jonkers, 2006; Matos‐Rodrigues et al, 2021b). Nevertheless, elaborate strategies for partial or tissue‐specific HR inactivation have been designed and have confirmed the correlation between HR alteration and cancer development (Matos‐Rodrigues et al, 2021b). Surprisingly, despite the paramount role of RAD51 in HR, alternative strategies have not been developed to analyze the impact of RAD51 functional disruption in vivo (Matos‐Rodrigues et al, 2021b). Here, we took advantage of an engineered dominant negative form of RAD51 (SMRad51) that suppresses RAD51 HR activity but prevents stimulation of the alternative mutagenic nonconservative repair pathways due to its DNA‐binding capability (Lambert & Lopez, 2000, 2001, 2002; Wilhelm et al, 2014, 2016; So et al, 2022). This specificity of SMRAD51 differs from other RAD51 dominant negative forms, such as that described in FA and RAD51 ATP mutants, and from the knockdown of RAD51 and its mediators (Ameziane et al, 2015; Wang et al, 2015; So et al, 2022). Therefore, SMRad51 represents a unique experimental tool that can downregulate HR without inducing a concomitant stimulation in the nonconservative SSA and A‐EJ repair pathways. We engineered two mouse models with ubiquitous conditional expression of SMRad51 or, as a control, exogenous wild‐type mouse Rad51 (exMmRad51) induced by doxycycline (Dox). In addition, this strategy enabled us to overcome the embryonic lethality problem since HR was inactivated after birth through Dox‐mediated induction of SMRad51 expression. Thus, these mouse models represent unique tools to analyze RAD51 functional alterations in vivo. We found that suppression of HR through SMRad51 expression led to replicative stress, systemic inflammation, progenitor cell exhaustion, premature aging and a reduced lifespan but, surprisingly, did not induce tumor formation. To deepen the understanding of the role played by SMRAD51 in cancer in vivo, we crossed our mouse model with the PyMT breast cancer‐predisposition model mice. We observed that expressing SMRAD51 decreased both the frequency and the size of breast tumors, revealing an effect against breast cancer development.
Although HR deficiency is generally thought to be a cause of cancer, this work shows that specifically reducing RAD51‐mediated HR leads primarily to aging not oncogenesis and, in fact, prevents tumorigenesis. These data shed light on the separation and potential competition rather than the cooperation between these two in vivo phenotypes.
Results
SMRAD51 suppresses the strand exchange activity of the RAD51‐ssDNA filament
SMRad51 is a yeast/mammalian Rad51 chimeric gene (Fig 1A) whose ectopic expression suppresses HR in mammalian cells but, importantly, still prevents nonconservative SSA and A‐EJ, in contrast to the effect of RAD51 silencing or the suppression of RAD51 DNA‐loading factors, such as BRCA2 (Lambert & Lopez, 2000, 2001, 2002; Wilhelm et al, 2014, 2016; So et al, 2022). To analyze the consequences of the specific suppression of the HR function of RAD51 in vivo, we developed two mouse models: one bearing Dox‐inducible SMRad51 and one bearing Dox‐inducible exogenous wild‐type mouse Rad51 (exMmRad51) (Fig 1B).
Figure 1. Functional inactivation of RAD51 leads to premature aging.
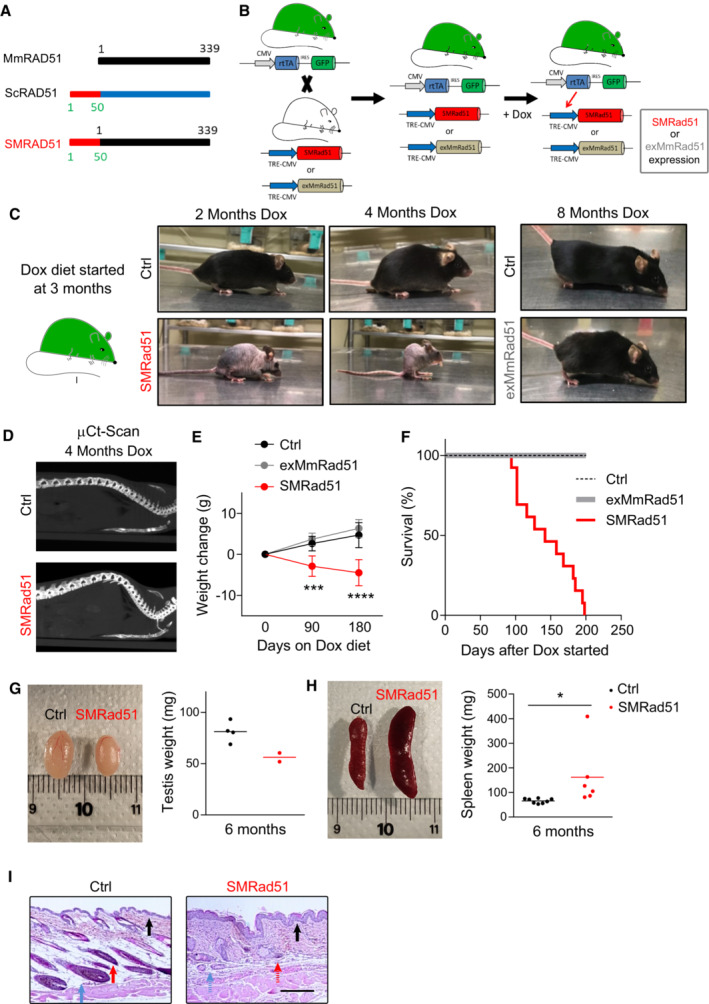
- Schematic representation of SMRAD51. SMRAD51 is a chimeric construct composed of the full‐length wild‐type mouse MmRAD51 (black box) fused to the nonevolutionarily conserved N‐terminal 55 amino acids (red box) of Saccharomyces cerevisiae Rad51 (ScRad51).
- Schematic representation of SMRad51 and exMmRad51 mouse model generation. Two mouse models, one expressing SMRad51 and the other expressing exMmRad51 (HA‐tagged) under the control of the Dox‐inducible promoter (TRE‐CMV), were established. Induction of transgene expression by Dox requires the rtTA transcription activator. The two transgenic mouse models were thus crossed with a mouse bearing rtTA (and GFP) at the ubiquitous expression locus Rosa26. Expression of the transgene (SMRad51 or exMmRad51) resulted from exposure of the rtTA+;SMRad51+ or rtTA+;exMmRad51+ models to Dox. The rtTA−;SMRad51+ and rtTA−;exMmRad51+ mice did not express the transgenes, even in the presence of Dox, and were thus conveniently used as controls.
- Experimental design and representative photos of Ctrl, exMmRad51 and SMRad51 mice fed a Dox‐supplemented diet for 2, 4 or 8 months.
- μCt scan images illustrating the spines of Ctrl and SMRad51 adult mice fed a Dox‐supplemented diet for 4 months.
- Quantitative analysis of body weight changes from the beginning of Dox treatment in Ctrl mice (n = 9, 3 months; n = 7, 6 months), exMmRad51 mice (n = 5, 3 months; n = 5, 6 months) and SMRad51 mice (n = 10, 3 months; n = 5, 6 months) fed a Dox‐supplemented diet for 3 and 6 months. Each dot represents the mean of the biological replicates for a given time point.
- Survival curves of Ctrl (n = 7), exMmRad51 (n = 6) and SMRad51 (n = 12) mice fed a Dox‐supplemented diet.
- Images (left) and quantification (right) of testis weight in Ctrl (n = 4) and SMRad51 (n = 2) adult mice fed a Dox‐supplemented diet for 6 months.
- Images (left) and quantification (right) of spleen weight in Ctrl (n = 7) and SMRad51 (n = 6) adult mice fed a Dox‐supplemented diet for 6 months.
- Representative images of the skin histology of Ctrl and SMRad51 mice fed a Dox‐supplemented diet for 6 months. Red arrow: follicular bulb, the density of which was decreased in SMRad51‐expressing mice. Blue arrow: hypodermis in a Ctrl mouse, the thickness of which was decreased in SMRad51‐expressing mice. Black arrow: epidermis, the thickness of which was increased in SMRad51 mutants. Hatched arrows: missing structures.
Data information: (G, H) Each point represents a biological replicate, and the horizontal line represents the mean. Statistical analysis: (E) Two‐way ANOVA followed by Sidak's posttest. ***P < 0.001; ****P < 0.0001. Error bars indicate the SEM (H) Student's t‐test. *P < 0.05. Dox was added to food during the entire duration of the experiments.
In mouse embryonic fibroblasts (MEFs) derived from our mouse models, Dox‐induced SMRad51 expression reduced homology‐directed gene targeting efficacy (Fig EV1A and B). SMRad51 expression also increased the sensitivity of the MEFs to mitomycin C and olaparib (a PARP inhibitor) compared with the absence of Dox (Fig EV1C), as indicated by a colony formation assay. The acquisition of these phenotypes reflects downregulated HR.
Figure EV1. SMRad51 expression decreases HR efficiency and increases sensitivity to genotoxic agents in immortalized MEFs.
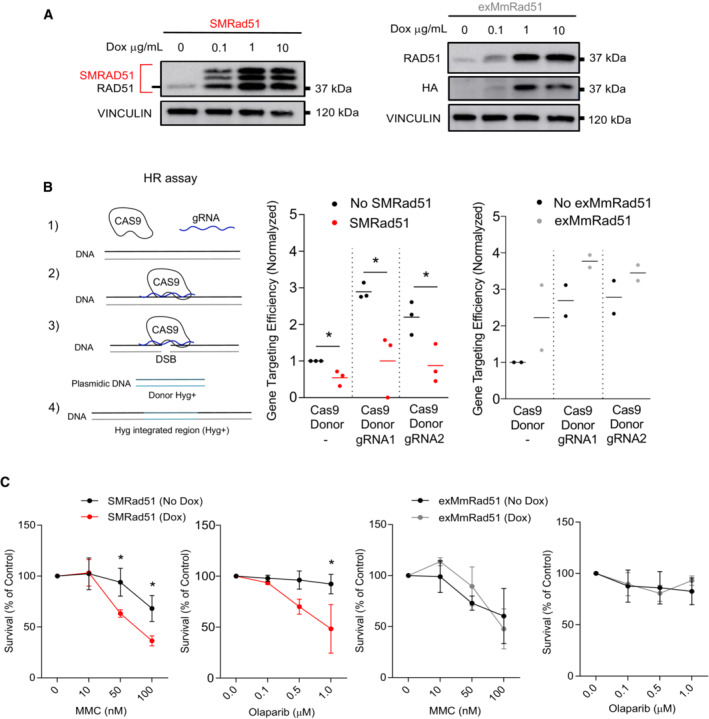
- Transgene expression as assessed by Western blot analysis in immortalized exMmRad51 or SMRad51 MEFs treated or not treated with increasing concentrations of Dox for 24 h. SMRAD51 expression resulted in 3 characteristic diagnostic bands (Lambert & Lopez, 2000, 2001; Saintigny et al, 2001; Wilhelm et al, 2014; So et al, 2022).
- Homology‐directed repair‐mediated gene targeting assay. The protocol consisted of sequence homology‐dependent replacement of the second exon of the 53BP1 gene by a hygromycin resistance (Hyg+) gene using homologous donor DNA (here called Donor) after Cas9‐mediated induction of a DSB in the targeted sequence (left panel). Cells with and without SMRad51 expression were transfected with three combinations of plasmids: (1) Cas9+Donor (no Cas9 activity) and (2) Cas9+Donor+gRNA1 (Cas9 active) or (3) Cas9+Donor+gRNA2 (Cas9 active). Recombinant cells became resistant to hygromycin. Right panel: Quantification from 3 independent experiments.
- Quantification of cell viability by colony formation assay for immortalized MEFs expressing or not expressing SMRad51 or exMmRad51 observed 10 days after MMC or Parp inhibitor (olaparib) treatment. Dox treatment was started 24 h before exposure to genotoxic drugs. Statistical analysis: (B) Student's t‐test. (C) Two‐way ANOVA followed by Sidak posttest, Student's t‐test. *P < 0.05. The error bars represent the ±SEM.
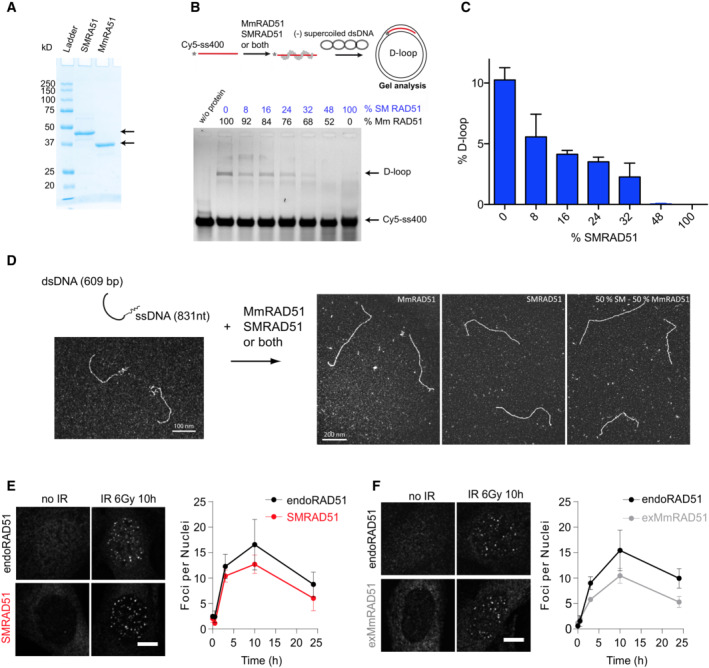
To further elucidate the molecular basis of the dominant negative effect of SMRAD51 on HR, we purified the SMRAD51 and mouse wild‐type MmRAD51 proteins (Fig EV2A). The D‐loop in vitro assay revealed that in the presence of SMRAD51, MmRAD51 showed reduced strand invasion activity (Fig EV2B and C), thus accounting for its dominant negative effect on HR observed in living cells. Transmission electron microscopy (TEM) revealed that the SMRAD51 protein was able to coat DNA in vitro (Fig EV2D). It should be noted that 100% of the DNA molecules were coated by either MmRAD51 or SMRAD51. These data indicated that SMRAD51 inhibited HR by reducing RAD51‐ssDNA filament strand exchange, thus inhibiting the key activity leading to HR.
Figure EV2. Cellular and biochemical characterization of SMRAD51.
-
AElectrophoresis analysis of the purified SmRAD51 and MmRAD51 proteins.
-
BImpact of SMRAD51 on the MmRAD51‐mediated D‐loop assay. Upper panel: scheme of the D‐loop assay. Lower panel: gel electrophoresis of the D‐loop formation experiment. Lane 1: in the absence of proteins; other lanes: different mix of MmRAD51 and SMRAD51 proteins. The respective percentages of each protein are indicated.
-
CQuantification of the D‐loop assay.
-
DTransmission electron microscopy (TEM) analysis. Left panel: the DNA substrate. Right panels: representative pictures of presynaptic filaments formed by MmRAD51, SMRAD51 or both. Note that 100% of DNA molecules were coated by MmRAD51 or SMRAD51.
-
E, FRepresentative pictures and quantification of endogenous MmRAD51 (endoRad51), SMRAD51 and exMmRAD51 focus formation dynamics after irradiation. Immortalized MEFs were treated or not treated with Dox for 24 h, exposed to ionizing irradiation (6 Gy) and fixed at different time points. SMRAD51 was stained with a specific antibody raised against the N‐terminal part of yeast ScRad51. exMmRAD51 was stained with an HA‐tag antibody. The graph shows the ±SEMs of three independent experiments. EndoRAD51 staining was performed in cells not treated with Dox and stained for RAD51. Scale bars: 5 μm.
Importantly, SMRAD51 formed radiation‐induced nuclear foci with assembly/disassembly kinetics similar to those of exMmRAD51 as well as endogenous MmRAD51 (Fig EV2E and F), confirming the in vitro TEM data showing that SMRAD51 bound damaged DNA and that it was processed similarly to wild‐type endogenous MmRAD51 in living cells.
To measure the impact of SMRAD51 on alternative repair pathways in our mouse model cells, we inserted reporter substrates that were specific for SSA or EJ after induction of a targeted DSB through the expression of the meganuclease I‐SceI into MEFs (Fig EV3). Because the SSA substrate was based on GFP expression and our MEFs expressed GFP (resulting from the rtTa constructs), we first mutated the endogenous GFP via CRISPR–Cas9, selected gfp‐negative clones and introduced the substrates monitoring SSA or EJ. The absence of the RAD51 protein resulting from silencing with Rad51 siRNA (Fig EV3A) led to the stimulation of SSA and slight stimulation of EJ (Fig EV3B and C), as previously observed in human cells (So et al, 2022). The slight EJ stimulation was shown to result from A‐EJ pathway stimulation (So et al, 2022). In contrast, induction of SMRad51 expression through exposure to Dox (Fig EV3A) stimulated neither SSA nor EJ (Fig EV3B and C), although HR was downregulated (see Fig EV1), as has also been shown with human cells (So et al, 2022). These data show that, similar to the effect in human cells, expression of SMRAD51, which binds DNA (see Fig EV2), downregulates HR (see Fig EV1) without stimulating nonconservative SSA and EJ pathways (Fig EV3) in MEFs.
Figure EV3. Impact of SMRad51 expression on alternative nonconservative DSB repair mechanisms SSA and EJ, immortalized MEFs.
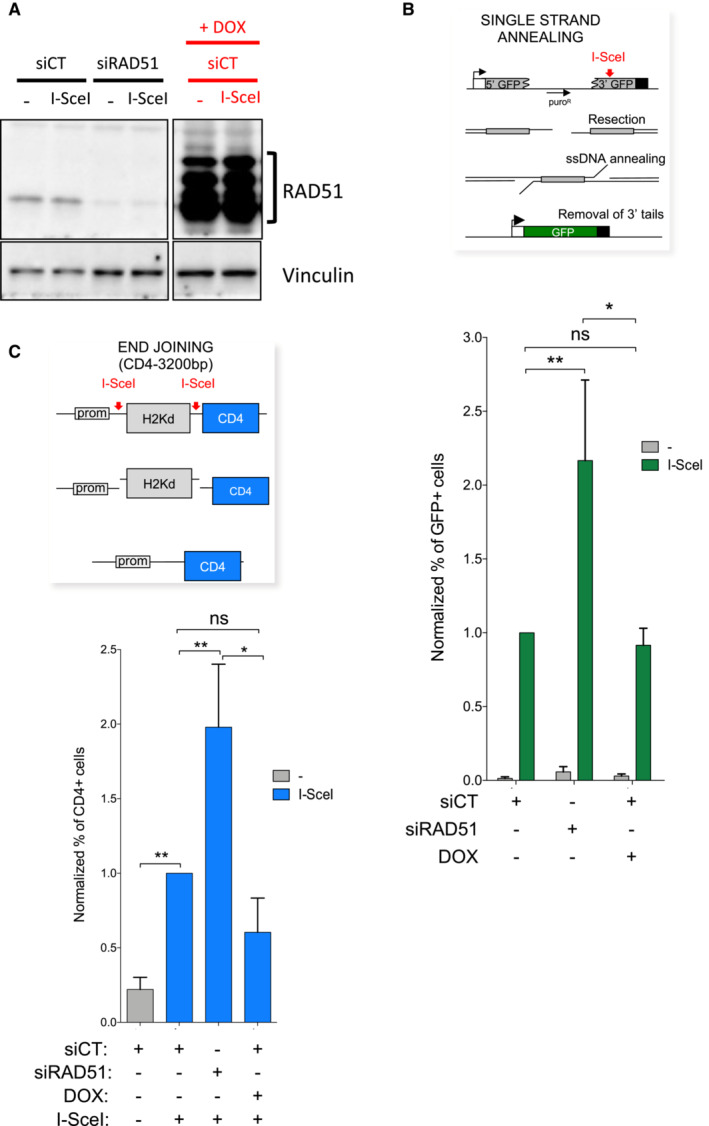
- Efficiency of RAD51 silencing (left panel) or SMRad51 expression (right panel).
- Impact on SSA. Upper panel: reporter substrate monitoring SSA induced by targeted cleavage by the meganuclease I‐SceI (Gunn & Stark, 2012). The values are shown normalized to the control siRNA (CT) plus I‐SceI and represent the average ± SEM of at least 3 independent experiments.
- Impact on EJ. Upper panel: reporter substrate monitoring EJ induced by targeted cleavage by the meganuclease I‐SceI (Guirouilh‐Barbat et al, 2004, 2007; Rass et al, 2009; Gelot et al, 2016; So et al, 2022). The values are shown normalized to the control siRNA (CT) plus I‐SceI and represent the average ± SEM of at least 3 independent experiments. Student t‐test: *P < 0.05 and **P < 0.01.
Collectively, these data showed that SMRAD51 is able to bind DNA and inhibit the strand invasion activity of the RAD51‐ssDNA filament, accounting for its dominant negative effect on HR, and that the consequences of SMRAD51 expression resulted from RAD51‐ssDNA filament activity disruption not unscheduled prolonged DNA occupancy by the SMRAD51 protein. Notably, ssDNA occupancy by SMRAD51 also accounted for the ability of this protein to prevent accessibility to nonconservative repair pathways in MEFs, similar to our previous observations in human cells (So et al, 2022).
Alteration of RAD51 activity leads to aging not carcinogenesis
To analyze the in vivo consequences of specific inhibition of RAD51‐HR activity through SMRad51 expression, we induced the expression of SMRad51 and exMmRad51 in rtTA+;SMRad51+ and rtTA+;exMmRad51+ mice, respectively. These mice were then compared to Dox‐exposed control littermates (rtTA−;SMRad51+ and rtTA−;exMmRad51+) that bore the transgenes but not the transcription activator rtTA and thus did not express transgenes in the presence of Dox.
We fed 3‐month‐old adult mice ad libitum with Dox‐supplemented food (Fig 1C). After approximately 6 weeks of Dox exposure, SMRad51, but not exMmRad51, mice started to show features of premature aging, including reduced activity, hair loss, intermittent priapism and abnormal posture with protuberance of the upper back (Fig 1C; Appendix Table S1). X‐ray imaging by microcomputed tomography (μCT) after 4 months of Dox treatment revealed that these changes in the mouse backs were associated with curvature of the spine, consistent with kyphosis (Fig 1D, Movies EV1 and EV2). Prolonged expression of SMRad51, but not exMmRad51, decreased both body weight and lifespan (Fig 1E and F). Collectively, these phenotypes indicate the induction of premature aging in SMRad51‐expressing mice.
To evaluate tissue morphological changes caused by SMRad51 expression, we performed anatomical and histopathological analyses. After 6 months of Dox treatment, the testis size was reduced (Fig 1G) and splenomegaly, as indicated by increased spleen size (Fig 1H), was observed. Splenomegaly is a feature of systemic inflammation and aging in mice (Pettan‐Brewer & Treuting, 2011). Notably, SMRad51 expression decreased follicular bulb density and led to hyperplasia in the epidermis (Fig 1I). Subcutaneous skin fat layer thickness was reduced in SMRad51‐expressing mice compared with control mice (Fig 1I). Consistent with an aging phenotype, a reduction in subcutaneous fat has been observed in aged and prematurely aging mice (Muñoz‐Lorente et al, 2019). Similar phenotypes have been observed in mice with skin‐specific CRE‐LOX‐mediated inactivation of Brca1 expression (Sotiropoulou et al, 2013). Given that BRCA1 and RAD51 share roles in HR, this finding suggests that the phenotypes observed resulted from HR inactivation in vivo. The other tissues that we analyzed did not exhibit major histological modifications (Fig EV4A). Remarkably, tumors were not detected in any of the animals or in any of the different tissues analyzed via extensive anatomical and histopathological examination; only one mouse had a precancerous lesion in the skin (Fig EV4A). Altogether, these data show that SMRad51 expression leads to premature aging but not to increased tumorigenesis.
Figure EV4. Histopathological analysis of adult mice after SMRad51 expression for 3 months.
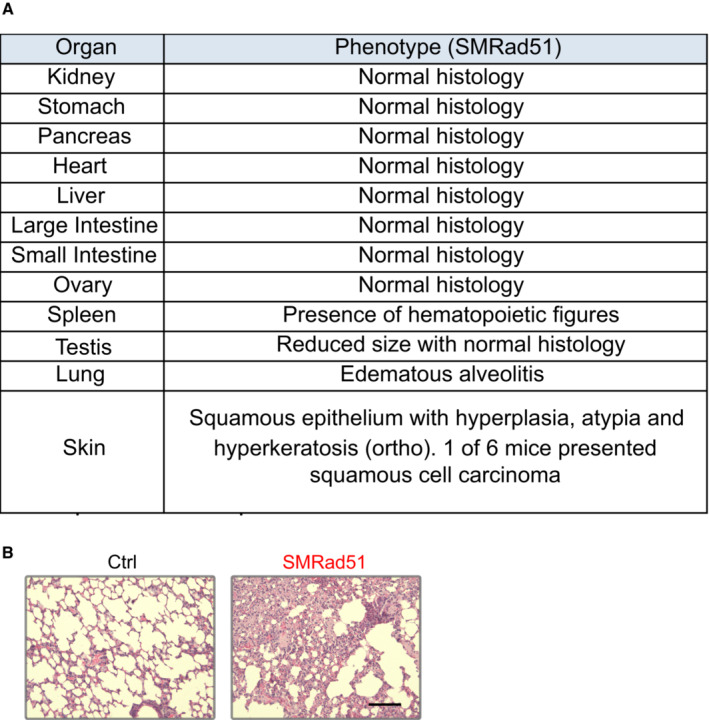
- Table showing a summary of the pathological analysis results for various tissues of Ctrl and SMRad51 adult mice fed a Dox‐containing diet for 6 months. At least 3 different mice of each genotype were analyzed.
- Representative images of hematoxylin–eosin‐saffron staining in lungs. Scale bar: 100 μm.
We then performed histopathological analyses of different tissues from mice fed a Dox‐supplemented diet for 6 months (Fig EV4A). These analyses revealed edematous alveolitis in the lungs of the SMRad51‐expressing mice (Fig EV4B), consistent with the induction of inflammation. Therefore, we evaluated whether SMRad51 expression leads to a systemic inflammatory response. We measured the levels of cytokines in the serum of SMRad51 and control mice after 3 months of Dox exposure. Using cytokine arrays, we showed that among the 111 proteins analyzed, 29 proteins, including proinflammatory factors, showed upregulated expression in SMRad51 mice (Fig 2A and B; Appendix Table S2 and Dataset EV1). These data reveal that disruption of RAD51 HR function leads to a systemic inflammatory response in adult mice.
Figure 2. Expression of SMRad51 in adult mice increases serum levels of proinflammatory cytokines.
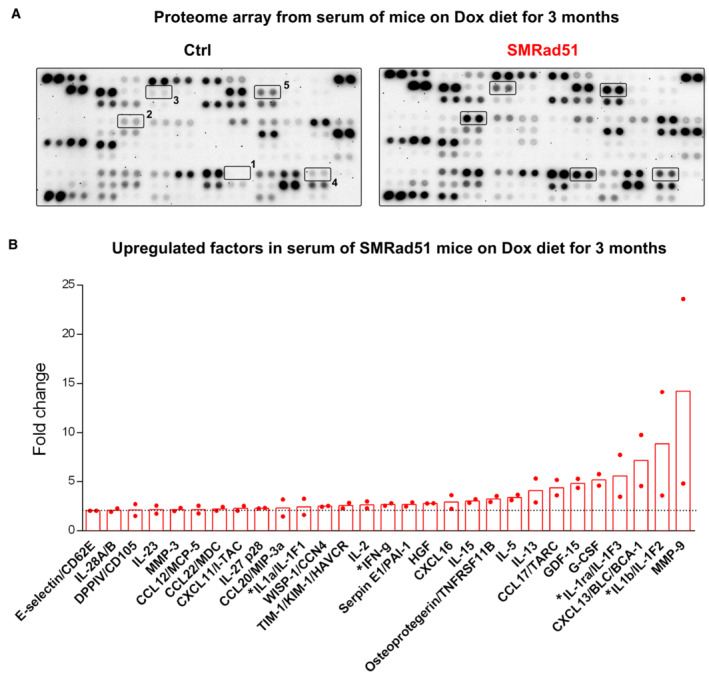
- Representative images of proteome array membranes of Ctrl and SMRad51 mice fed a Dox‐supplemented diet for 3 months.
- Graphical representation of the fold changes of upregulated factors in SMRad51 mouse serum compared with Ctrl mouse serum. Each dot in the graph represents a different biological replicate, and the horizontal dashed line marks a 2‐fold change. Pro‐inflammatory factors are marked with an asterisk (*). In (A) and (B), the values correspond to the mean of the intensity 5 different duplicate protein dots in the membranes from two different experiments.
Expression of SMRad51 decreases tumor number and size
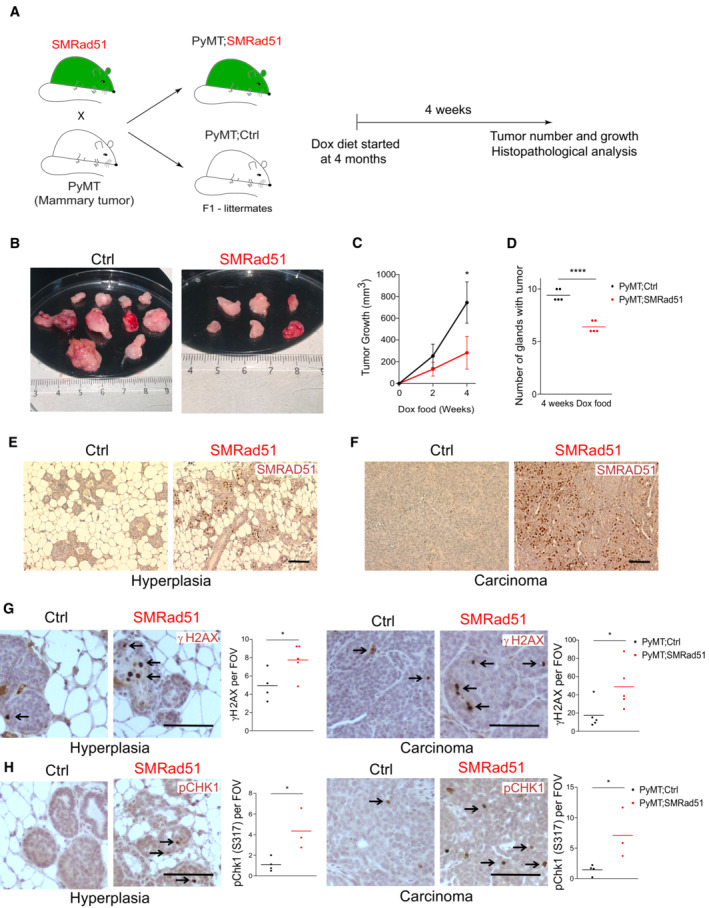
To better characterize the effect of SMRAD51 on tumorigenesis, we crossed SMRad51 mice with MMTV‐PyMT (mouse mammary tumor virus‐polyomavirus middle T antigen) breast cancer model mice, which present 100% tumor development penetrance, to generate PyMT;SMRad51 and PyMT;Ctrl mice (Fig 3A). This strategy was chosen because most genes mutated in familial breast cancer are involved in HR (Walsh et al, 2011; Angeli et al, 2020; Matos‐Rodrigues et al, 2021a). The expression of the middle T oncogene in mammary epithelia induces the rapid transformation and formation of mammary tumors with histological stages that mimic human ductal breast cancer progression (from hyperplasia to late carcinoma) (Attalla et al, 2021). MMTV‐PyMT mice show sequential tumor formation in which cervical and thoracic gland tumors develop before abdominal and inguinal tumors. In our PyMT;SMRad51 and PyMT;Ctrl mice without Dox treatment, cervical and thoracic palpable tumors started to be observed in 4‐month‐old females, and abdominal and inguinal palpable tumors started to be observed in 5‐month‐old females. We took advantage of these characteristics to evaluate both tumor initiation and tumor growth. We fed MMTV‐PyMT mice bearing or not the DOX‐inducible SMRad51 transgene (PyMT;SMRad51 and PyMT;Ctrl mice) with a Dox‐supplemented diet for a maximum of 4 weeks starting when they were 4 months old (Fig 3A). Tumor growth was evaluated on the basis of tumor size measured after 0, 2 and 4 weeks of Dox treatment (Fig 3B). We observed a reduction in tumor size after 2 and 4 weeks of SMRad51 expression in the PyMT;SMRad51 mice compared to the control mice (Fig 3C). We quantified the total number of tumors after 4 weeks of Dox treatment and observed a reduced number of tumors in the mice expressing SMRad51 (Fig 3D). Histopathological analysis of the tumors revealed hyperplasia and cancer cells (carcinoma) in the PyMT;SMRad51 and PyMT;Ctrl mice. Expression of SMRad51 was detected in a large number of cells at both the hyperplasia and cancerogenesis stages in PyMT;SMRad51 mice after Dox treatment (Fig 3E and F). We investigated whether the expression of SMRAD51 was associated with an increase in the DDR. We observed an increase in the level of the DNA damage marker γH2AX detected in hyperplasic and carcinoma cells after 4 months of SMRad51 expression via immunolocalization assay (Fig 3G). We also observed an increase in the DNA damage marker pCHK1, which is often associated with the replication stress response, in both aforementioned stages of tumor progression in the PyMT;SMRad51 mice compared to the level in the control mice (Fig 3H). These results show that expressing SMRad51 leads to DNA damage and activation of a replication stress response both in pretumorigenic (hyperplasic) and tumorigenic (carcinoma) mammary cells. Collectively, these data reveal that expressing SMRad51 protects cells against oncogenesis, although it inhibits HR and leads to replication stress and DNA damage accumulation.
Figure 3. SMRad51 expression in mice with mammary tumors decreases tumor growth and tumorigenesis.
-
ASchematic representation of the experimental design used to evaluate the effects of SMRad51 expression on mammary tumor growth and initiation. SMRad51 mice were crossed with PyMT mice. Littermate PyMT mice with Dox‐inducible expression of SMRad51 (PyMT;SMRad51) were compared to mice without Dox‐inducible expression of SMRad51 (PyMT;Ctrl). All mice were fed a Dox‐supplemented diet for 4 weeks starting at 4 months of age.
-
BRepresentative images of mammary tumors from a PyMT;Ctrl (left) and PyMT;SMRad51 (right) mouse fed a Dox‐supplemented diet starting from 4 months of age.
-
CQuantitative analysis of tumor growth in PyMT;Ctrl and PyMT;SMRad51 mice based on tumor size measurements after 0, 2 and 4 weeks of Dox treatment. The graph represents the mean ± SEM of 5 mice from two independent litters for each group.
-
DQuantitative analysis of tumor prevalence in PyMT;Ctrl and PyMT;SMRad51 mice fed a Dox‐supplemented diet.
-
E, FRepresentative images of SMRAD51 staining in hyperplasia (E) and carcinomas (F) of PyMT;Ctrl and PyMT;SMRad51 mice fed a Dox‐supplemented diet for 4 weeks. SMRAD51 was stained with a specific antibody raised against the N‐terminal ScRad51.
-
GRepresentative images (left) and quantitative analysis (right) of γH2AX (DDR) marker staining comparing hyperplasias (left) and carcinomas (right) of PyMT;Ctrl and PyMT;SMRad51 mice fed a Dox‐supplemented diet starting for 4 weeks. The arrows indicate the presence of positive cells.
-
HRepresentative images (left) and quantitative analysis (right) of pCHK1 (S317) (a replication stress response marker) staining comparing hyperplasias (left) and carcinomas (right) of PyMT;Ctrl and PyMT;SMRad51 mice fed a Dox‐supplemented diet starting for 4 weeks. The arrows indicate the presence of positive cells.
Data information: (D, G, H) Each point represents a biological replicate, and the horizontal line represents the mean. FOV: fields of visualization. Statistical analysis: (C) two‐way ANOVA followed by Sidak's multiple comparisons test and (D, G, H) Student's t‐test. *P < 0.05 and ****P < 0.0001. Scale bar: 100 μm.
Expression of SMRad51 alters progenitor homeostasis
We observed hematopoietic cells in the spleens of SMRad51 mice after 6 months of Dox exposure, revealing extramedullary hematopoiesis (Fig EV5A). Splenomegaly associated with extramedullary hematopoiesis is a common feature of aged and prematurely aging mice and is a compensatory mechanism triggered by bone marrow progenitor cell exhaustion (French et al, 2002; Pettan‐Brewer & Treuting, 2011; Mann et al, 2018). Then, we investigated whether these changes in spleen histology were associated with alterations in hematopoiesis. First, we analyzed the blood composition of mice with and without SMRad51 expression. The number of red blood cells (RBCs) and platelets (PLTs), but not that of white blood cells (WBCs), was decreased in the blood of SMRad51 mice compared with control mice after 3 months of Dox treatment (Fig 4A). Expansion of the hematopoietic stem cell pool is an aging‐related adaptation to reduced stem cell function (Morrison et al, 1996). After 3 months of Dox treatment, SMRad51 expression did not lead to a reduction in the overall number of bone marrow stem cells (Lineage [Lin]−Sca‐1+‐c‐Kit+‐Fkl2− or LSK, Flk2− cells), but after 6 months of Dox treatment, the SMRad51‐expressing mice showed a tendency to present with an increased stem cell pool (Fig EV5B). Next, we evaluated whether these changes correlated with hematopoietic changes in the bone marrow and found a reduction in the amount of common lymphocyte progenitors (CLPs; Lin−Sca‐1−c‐Kit+IL7R+ cells) and B cells (B220+ B cells) after SMRad51 was expressed for 3 months (Fig 4B). These data indicate that SMRAD51 altered hematopoiesis by reducing the progenitor cell pool (Fig EV5B). Altogether, our data show that the expression of SMRad51 disrupted blood cell production, leading to thrombocytopenia (a reduction in the number of PLTs) and anemia (a reduction in the number of RBCs), which are associated with compromised hematopoiesis.
Figure EV5. Expression of SMRad51 in adult mice leads to extramedullary hematopoiesis in the spleen, increases hematopoietic stem cells in the bone marrow and leads to DNA damage in the small intestine.
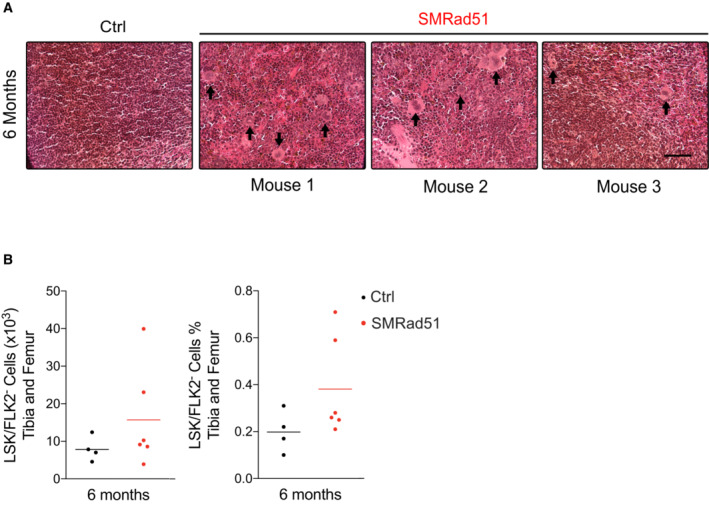
- Representative images of hematoxylin–eosin‐saffron staining in spleen sections of Ctrl and SMRad51 adult mice fed a Dox‐containing diet for 6 months. Arrows: overrepresentation of megakaryocytes in the spleens of SMRad51‐expressing mice.
- Quantification of hematopoietic stem cells Lin (−), Sca‐1 (+), c‐Kit (+) and FLK2 (−) (in short, LSK/FLK2−) in tibia and femur of Ctrl (n = 4) and SMRad51 (n = 6) adult mice fed with Dox‐containing diet for 6 months. In the left, the absolute number of cells was plotted. In the right, the percentage of cells was plotted. Each point in the graphs represents an independent biological replicate and the horizontal bar show the mean. (A) Scale bar: 100 μm.
Figure 4. SMRad51 expression induces γH2AX foci formation in vivo and disrupts progenitor cell homeostasis.
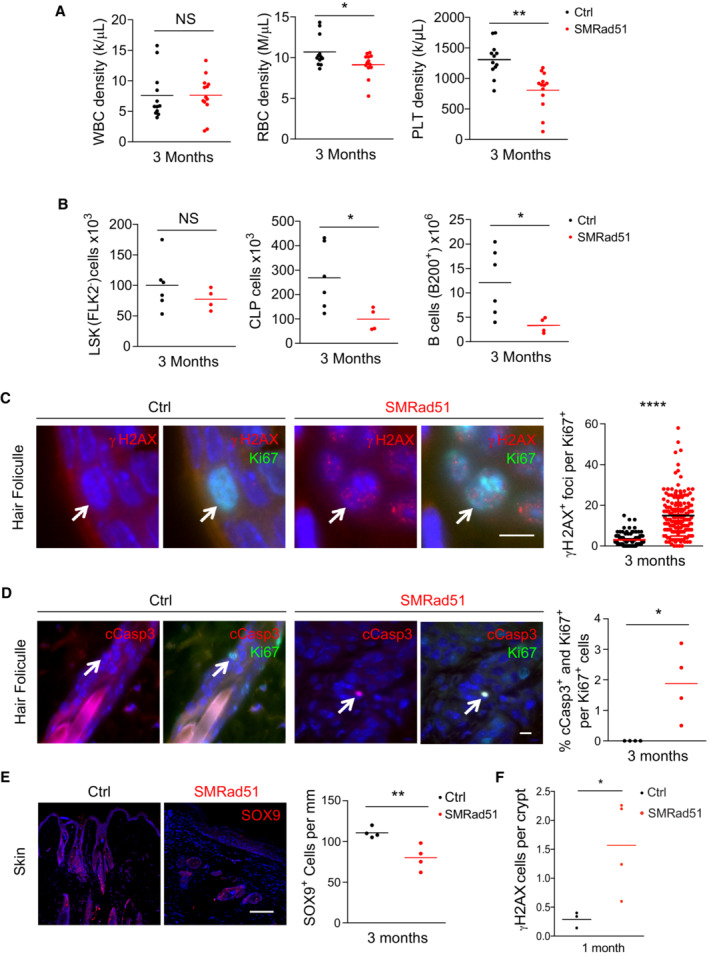
- Analysis of the density of WBCs, RBCs and PLTs in the blood of Ctrl (n = 12) and SMRad51 (n = 13) adult mice 3 months after initiation of Dox treatment.
- Analysis of the number of hematopoietic stem cells (KLS cells, FLK2−), CLPs and B‐lymphocytes (B cells, B220+) in the bone marrow of Ctrl (n = 6) and SMRad51 (n = 4) adult mice 3 months after initiation of Dox treatment.
- Representative images (left) and quantification (right) of γH2AX foci in Ki67+ (white arrow) follicular bulb cells in skin sections of Ctrl (n = 4 biological replicates, 104 Ki67+ cells) and SMRad51 (n = 4 biological replicates, 166 Ki67+ cells) mice fed a Dox‐supplemented diet for 3 months. The quantification illustrates the number of γH2AX foci in Ki67+ cells. Ctrl (black dots), SMRad51 (red dots); the horizontal line represents the mean.
- Representative images (left) and quantification (right) of cCas3+ and Ki67+ (white arrow) follicular bulb cells in skin sections of Ctrl (n = 4) and SMRad51 (n = 4) mice fed a Dox‐supplemented diet for 3 months.
- Representative images (left) and quantification (right) of SOX9+ cells in skin sections of Ctrl (n = 4) and SMRad51 (n = 4) mice fed a Dox‐supplemented diet for 3 months.
- Quantification of γH2AX+ cells in the small intestine of Ctrl (n = 3) and SMRad51 (n = 4) mice after 1 month of Dox treatment.
Data information: Statistical analysis: (C) Mann–Whitney test and (A, B, D–F) Student's t‐test. *P < 0.05; **P < 0.01; ****P < 0.0001. (A, B, D–F) Each point represents a biological replicate, and the horizontal line represents the mean. Scale bars: (C, D) 10 μm and (E) 100 μm.
Progenitor cell exhaustion is a key cause of aging (López‐Otín et al, 2013). Since SMRAD51 suppresses HR, which is a prominent DNA damage repair pathway, we evaluated whether DNA damage and apoptosis are correlated with progenitor loss after SMRad51 expression. Double immunostaining for Ki67 (a progenitor cell marker) and γH2AX (a DNA damage marker) revealed an increase in DNA damage in follicular bulb progenitor cells in the skin of the SMRad51‐expressing mice after 3 months of Dox treatment (Fig 4C). In addition, cleaved caspase‐3 (cCasp3) staining revealed an increase in the apoptosis rate of follicular bulb progenitor cells (Fig 4D). The increases in DNA damage and apoptosis were also associated with a reduction in the number of SOX9+ cells, which are progenitor hair follicle cells, in mice expressing SMRad51 for 3 months (Fig 4E). Importantly, the induction of DNA damage was not limited to the skin as indicated by an increase in γH2AX staining observed in the small intestine (Fig 4F). Taken together, these data support the assumption that apoptosis triggered by chronic DNA damage is an underlying cause of progenitor cell loss in mice expressing SMRad51, accounting for the acquisition of premature aging phenotypes.
Disruption of RAD51 HR activity strongly compromises the viability of growing mice
Although suppression of RAD51 HR activity did not lead to tumorigenesis in adult mice, we hypothesized that HR inactivation in young growing mice, which bear more dividing cells, might induce tumorigenesis. Therefore, we expressed SMRAD51 in young growing mice (12–14 days after birth). We observed that expressing SMRAD51 in growing mice induced phenotypes much more rapidly than in adult mice (Fig 5). Indeed, SMRad51 expression resulted in growth arrest (as determined by body weight measurements), hair loss and death as soon as Day 7 of Dox treatment in mice at postnatal Days 12–14 (P12–P14) (Fig 5A–D). In contrast, exMmRad51 expression did not cause hair loss or affect body weight or mouse survival, even after prolonged Dox treatment for up to 3 weeks (Fig 5A–D). Notably, no induction of tumorigenesis was recorded upon expression of SMRad51 in the course of these experiments, that is in young growing mice.
Figure 5. SMRad51, but not exMmRad51, expression leads to rapid death in young growing mice.
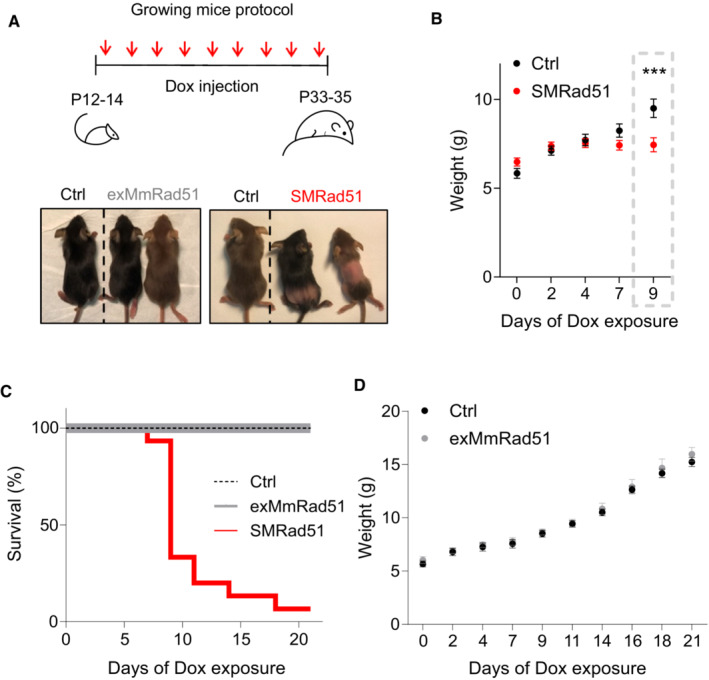
- Schematic of the experimental designs for exMmRad51 and SMRad51 expression in growing mice (top) and representative photos (bottom) of Ctrl, exMmRad51 and SMRad51 growing mice after 12 days of Dox treatment.
- Body weight measurements of SMRad51 (n = 21) and Ctrl (n = 15) littermate mice treated with Dox.
- Survival curve from P12/14 to P33/35 for Ctrl (n = 32), exMmRad51 (n = 6) and SMRad51 (n = 15) mice treated with Dox.
- Body weight measurements of exMmRad51 (n = 6) and Ctrl (n = 10) littermate mice treated with Dox.
Data information: Statistical analysis: (B) two‐way ANOVA followed by the Sidak's posttest. ***P < 0.001. Error bars represent the ±SEM.
The SMRAD51 protein was observed in several tissues (Appendix Fig S1A). Histopathological analysis of young mice that survived 12 days of SMRad51 expression (from P12–14 to P24–26) showed morphological alterations in tissues with high cell proliferation, such as the skin and testes (Figs 6A and B and Appendix Fig S1B). In accordance with our data on adult mice, SMRad51 expression in the skin led to follicular bulb atrophy, subcutaneous fat loss, and epidermal hyperplasia (Fig 6B). Moreover, the bone marrow of SMRad51‐expressing growing mice exhibited a decrease in the number of cells (Appendix Fig S1C). More specifically, SMRad51 expression led to decreases in progenitor cell populations in tissues with high cell proliferation: SOX9+ cells in the skin (Fig 6B), PLZF+ cells in the testis (Fig 6C and D), and Lin−Sca‐1+c‐Kit+ (LSK) stem cells/progenitor cells in the bone marrow (Fig 6E). Thus, in growing mice, SMRAD51 affected progenitor homeostasis in different tissues with high cell proliferation rates.
Figure 6. SMRad51 expression in young growing mice decreases progenitor numbers in tissues with highly proliferative cells.
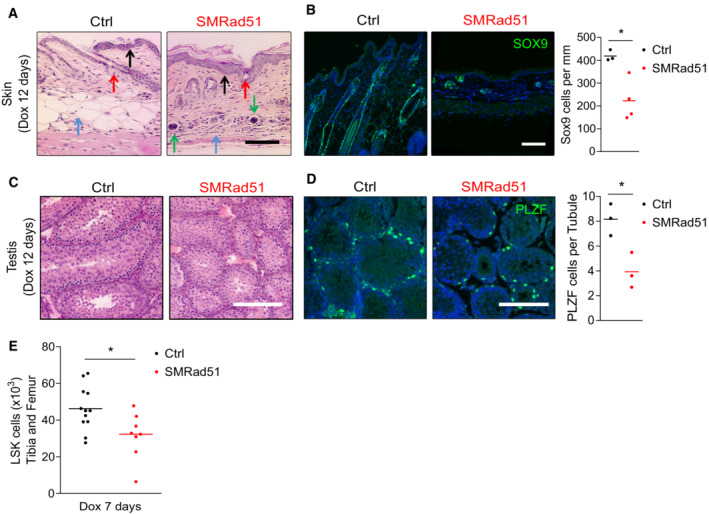
- Representative images of histological analysis of skin from Ctrl and SMRad51 mice treated with Dox. Red arrow: follicular bulb, the density of which was decreased in SMRad51‐expressing mice. Blue arrow: hypodermis, the thickness of which was decreased in SMRad51‐expressing mice. Black arrow: epidermis, the thickness of which was increased in SMRad51‐expressing mice. Green arrow: inflammatory infiltrates.
- Representative images and quantification of follicular bulb progenitors stained for SOX9 in skin sections of Ctrl (n = 3) and SMRad51 (n = 4) mice treated with Dox.
- Representative images of testis sections showing testis tubules in Ctrl and SMRad51 mice after 12 days of Dox treatment. Tubules were stained with hematoxylin (nuclei in purplish blue) and eosin (extracellular matrix and cytoplasm in pink).
- Representative images (left) and quantification (right) of testis sections immunostained for PLZF in Ctrl (n = 3) and SMRad51 (n = 3) mice after 12 days of Dox treatment.
- Numbers of bone marrow stem cells (LSK, Lin−Sca1+c‐kit+) in the tibias and femurs of Ctrl (n = 12) and SMRad51 (n = 8) mice after 7 days of Dox treatment.
Data information: Statistical analysis: (B, D, E) Student's t‐test. *P < 0.05. Each point represents a biological replicate, and the horizontal line represents the mean. Scale bar: 100 μm.
Disruption of RAD51 HR activity induces inflammation in growing mice
Histopathological analyses of the skin revealed inflammatory cell infiltration after 12 days of SMRad51 expression in growing mice (Fig 6A). Immunolocalization analyses revealed an increase in T‐lymphocyte infiltration (as indicated by CD3 staining; Fig 7A) and monocyte/macrophage aggregates (as indicated by F4/80 staining) in skin samples (Fig 7B). Real‐time RT–PCR showed that SMRAD51 stimulated the expression of proinflammatory cytokines in the skin (Fig 7C). Thus, SMRad51 expression led to an inflammatory response in tissue in vivo. These data were consistent with the induction of systemic inflammation observed in adult mice (see Fig 2). We next investigated whether in vivo expression of SMRad51 also induced a systemic inflammatory response in young growing mice. No differences in the density of WBCs, RBCs or hemoglobin (HGB) were observed between SMRad51‐expressing and control‐growing mice (after 7 days of Dox treatment) (Appendix Fig S2). However, SMRad51 expression decreased the number of B lymphocytes and increased the number of monocytes (Fig 7D), consistent with the induction of inflammation (Cain et al, 2009; Shi & Pamer, 2011). To further analyze the systemic effects of SMRad51 expression, we performed a serum cytokine array analysis (Fig 7E). Proinflammatory factors that were upregulated in the serum of SMRad51 adult mice, namely, Lipocalin‐2/NGAL, CCL17/TARC, E‐selectin/CD62A and CCL22/MDC, were also among the most upregulated factors in the serum of young mice (compare Figs 7E and 2). These data showed that SMRad51 expression led to a systemic proinflammatory response in both adult and growing mice.
Figure 7. Functional inhibition of SMRad51 expression induces inflammation in young growing mice.
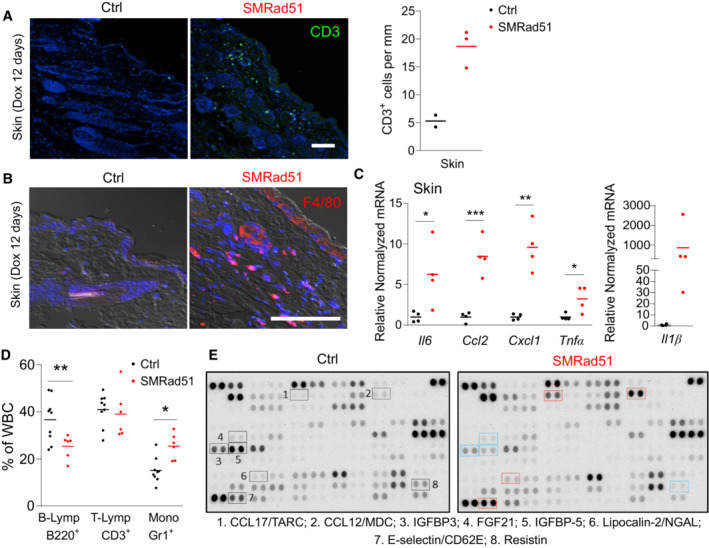
- Representative images (left panels) and quantification (right panel) of CD3+ cells (T lymphocytes) in skin sections of Ctrl (n = 2) and SMRad51 (n = 3) mice treated with Dox for 12 days.
- Representative images of staining for F4/80 (a monocyte/macrophage marker) in skin sections of Ctrl and SMRad51 mice treated with Dox for 12 days.
- Real‐time RT–PCR analysis of Ctrl (n = 4) and SMRad51 (n = 4) skin samples.
- WBC proportions in growing mice after 7 days of Dox treatment in Ctrl (n = 9) and SMRad51 (n = 6). B‐lymphocytes (B‐Lymp) were revealed by B220 staining. T‐lymphocytes (T‐Lymp) were revealed by CD3 staining. Monocytes (Mono) were revealed by Gr1 staining.
- Representative image of cytokine array analysis using serum from SMRad51‐ and Ctrl‐growing mice after 7 days of Dox treatment. The selected proteins highlighted in blue were downregulated (SMRad51 vs. Ctrl), and those highlighted in red were upregulated (SMRad51 vs. Ctrl). Dataset EV2 shows the quantification results for two independent biological samples of each group.
Data information: Statistical analysis: (C, D) Student's t‐test. *P < 0.05; **P < 0.01; ***P < 0.001. Each point represents a biological replicate, and the horizontal line represents the mean. Scale bar: 100 μm.
SMRAD51 affects replication dynamics
Our data suggested that replication dynamics might be affected in SMRad51‐expressing cells as indicated by (i) the pronounced effects of in vivo SMRad51 expression on tissues with proliferating cells; (ii) the fact that growing mice, in which many tissues are proliferating, were more sensitive to the expression of SMRad51 than adult mice; and (iii) the role of HR in arrested replication fork protection and resumption. In addition, the connections between replication stress and inflammation that are now clearly established can account for the observed inflammation (Gasser et al, 2016; Gekara, 2017; Coquel et al, 2019; Ragu et al, 2020). Therefore, we evaluated the impact of SMRAD51 on replication dynamics in MEFs from our mouse models.
In primary MEFs, the expression of SMRad51, but not that of exMmRad51, increased the number of pCHK1 (S317) and γH2AX foci, indicating spontaneous activation of the DDR in response to endogenous replication stress (Fig 8A and B). Molecular combing revealed that SMRAD51, but not exMmRAD51, decreased the velocity of DNA replication and concomitantly increased the rate of asymmetric labeling, indicating the accumulation of arrested replication forks (Fig 8C–E). This finding suggested that the resumption of replication at arrested forks, which normally involves RAD51‐mediated strand exchange needed for template switching, was defective. To analyze the impact of SMRad51 expression on fork restart, we performed an analysis by DNA fibers spreading (Fig 8F) after blocking replication with hydroxyurea (HU), a ribonucleotide reductase inhibitor that generates replication stress through nucleotides pool exhaustion. SMRAD51 decreased the replication restart efficiency after HU release (Fig 8F), consistent with the inhibition of strand exchange by SMRAD51 (see Fig EV2A).
Figure 8. SMRAD51 leads to replication stress during unchallenged replication.
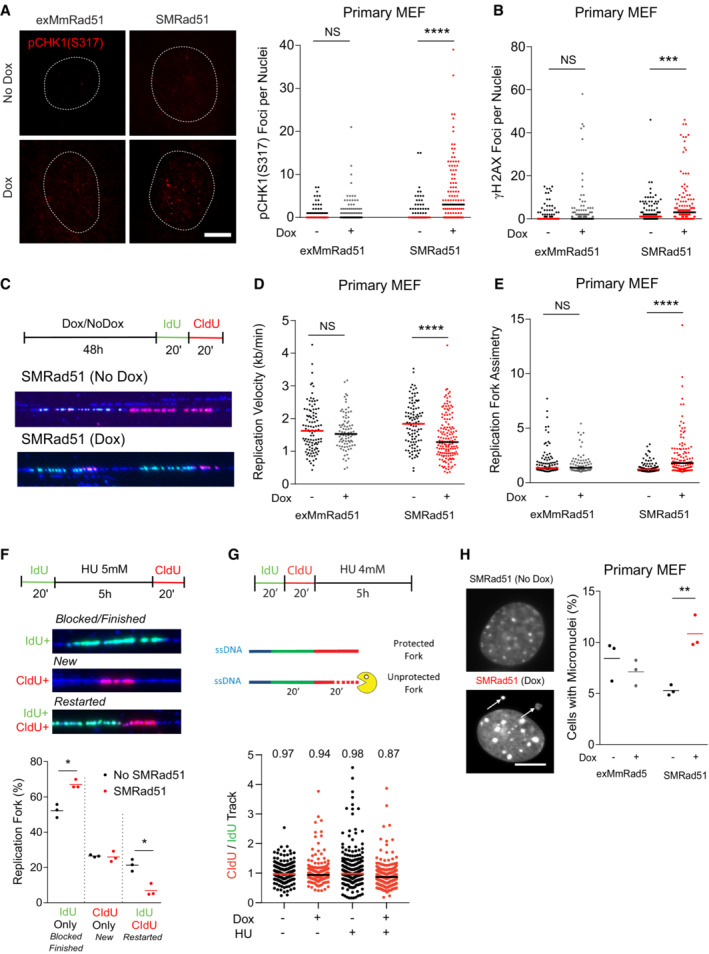
- Representative images (left panel) and quantification (right panel) of pChk1 (S317) foci in exMmRad51 and SMRad51 primary MEFs treated or not treated with Dox for 6 days (n = 3 experimental replicates per group). Number of nuclei quantified per condition: exMmRad51 (no Dox = 98; Dox = 102) and SMRad51 (no Dox = 94; Dox = 117).
- Quantification of γH2AX foci per nucleus in exMmRad51 and SMRad51 primary MEFs treated or not treated with Dox for 6 days (n = 4 experimental replicates per group). Number of nuclei quantified per condition: exMmRad51 (no Dox = 125; Dox = 138) and SMRad51 (no Dox = 124; Dox = 135).
- Representative schematic and images of molecular combing DNA fibers in SMRad51 primary MEFs treated or not treated with Dox (48 h).
- Quantitation of the replication velocity analyzed by molecular combing in exMmRad51 and SMRad51 primary MEFs treated or not treated with Dox for 48 h (n = 1 experimental replicate per group). Number of fibers quantified per condition: exMmRad51 (no Dox = 102; Dox = 85) and SMRad51 (no Dox = 104; Dox = 149).
- Replication fork asymmetry analysis by molecular combing in exMmRad51 and SMRad51 primary MEFs treated or not treated with Dox for 48 h (n = 1 experimental replicate per group). Each dot represents a fiber. Number of fibers quantified per condition: exMmRad51 (no Dox = 102; Dox = 85) and SMRad51 (no Dox = 104; Dox = 149).
- Analysis of fork restart. A representative scheme (upper panel) and image (bottom left panel) showing replication restart after fork blockage by hydroxyurea (HU) are shown. After one pulse of IdU (green), replication was blocked with 4 mM HU for 5 h. Fresh HU medium was added to remove the HU, and a pulse of CldU (red) was applied. Forks that did not restart did not incorporate CldU (green without red labeling), while forks that restarted incorporated both IdU and CldU (both green and red labeling). New replication initiation was not labeled by the initial IdU but incorporated CldU (red without green). Bottom panel: Quantitative analysis of the percentage of replication forks labeled with only IdU, only CldU or both markers (right) in immortalized MEFs expressing or not expressing SMRad51. The graphs represent three independent experiments, and the lines show the mean values.
- Analysis of fork protection by SMRAD51. A representative scheme (upper panel) of the fork protection assay is shown. (bottom panel) Quantitative analysis of the CIdU‐ to IdU‐labeled sequence length ratio after replication blockage with 4 mM HU or not in SMRad51 immortalized MEFs treated or not with dox. The graphs represent the aggregate of three independent experiments, each dot represents a fiber, and the lines show the mean values. Number of fibers quantified per condition: Dox(−) HU(−) = 300; Dox(+) HU(−) = 236; Dox(−) HU(+) = 300; Dox(+) HU(+) = 300.
- SMRAD51 expression induces micronucleus formation. Representative images (left) and quantification (right) of micronucleated cells after exMmRAD51 or SMRAD51 expression in primary MEFs with Dox treatment (Dox +) or without Dox treatment (Dox −) for 6 days are shown (n = 3). White arrows: micronuclei.
Data information: Statistical analysis: (A, B, D, E) Mann–Whitney test and (F, H) Student's t‐test. *P < 0.05; **P < 0.01; ***P < 0.001; ****P < 0.0001; NS: not significant. (F, H) Each point represents a biological replicate, and the horizontal line represents the mean. Scale bars: (A) 5 μm.
The RAD51 protein is also involved in the protection of arrested replication forks in a process independent of its role in HR (Schlacher et al, 2011; Mason et al, 2019). Here, fiber spreading revealed that SMRAD51, which binds DNA (see Fig EV2D), still efficiently protected arrested replication forks (Fig 8G). These data also showed that SMRad51 expression induced replication stress even when the arrested replication forks were efficiently protected.
Replication stress often leads to the accumulation of micronuclei. Consistent with its impact on replication stress (Fig 8A and B), SMRad51 expression also led to an increase in the number of cells carrying micronuclei (Fig 8H). Taken together, the data demonstrate that SMRAD51 affects replication fork dynamics, resulting in replication stress in MEFs derived from our mouse model. As DNA damage (as indicated by γH2AX staining) and apoptosis (as indicated by cCasp3 staining) accumulated in vivo in adult or young growing mice after SMRad51 expression (Figs 4 and 9A and B, and Appendix Fig S3A and B), we evaluated whether the DDR was specifically activated in replicating cells in vivo. We quantified γH2AX foci in BrdU+ follicular bulb progenitor cells (Sox9+ cells) in the skin of growing mice. After 5 days of SMRad51 expression in young mice, the number of γH2AX foci in BrdU+/Sox9+ (proliferating) cells (Fig 9C) increased, confirming that SMRad51 expression induced DNA damage, likely arising from replicative stress in vivo.
Figure 9. SMRAD51 leads to DNA damage in replicating cells and activates apoptosis in vivo .
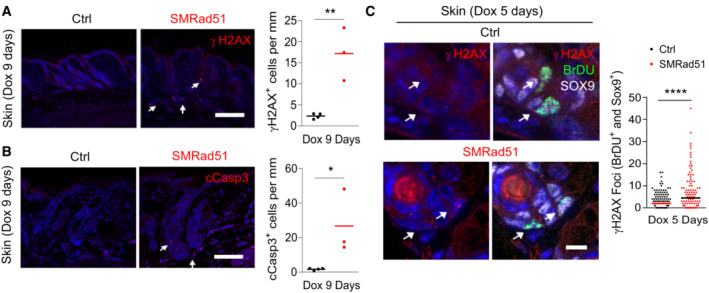
- Analysis of γH2AX+ cells in vivo. Left panels: representative images. White arrow: example of γH2AX staining. Right panel: quantification of γH2AX+ cells in skin sections of Ctrl (n = 4) and SMRad51 (n = 3) mice after 9 days of Dox treatment.
- Analysis of cCasp3 labeling in vivo. Left panels: representative images. White arrow: example of cCasp3 staining. Right panel: quantification of cCasp3+ cells in skin sections of Ctrl (n = 4) and SMRad51 (n = 3) mice after 9 days of Dox treatment.
- Representative images (left) and quantification (right) of γH2AX foci in BrdU+ (replicating cell marker) and Sox9+ (follicular bulb progenitor cell marker) cells (white arrow) in the skin sections of Ctrl (n = 2) and SMRad51 (n = 3) mice treated with Dox for 5 days. White arrow: BrdU+ and Sox9+ cells. Number of nuclei quantified per condition: Ctrl =137 and SMRad51 = 102.
Data information: Statistical analysis: (C) Mann–Whitney test. ****P < 0.0001; NS: not significant. (A, B) Each point represents a biological replicate, and the horizontal line represents the mean. Student's t‐test. *P < 0.05; **P < 0.01. Scale bars: (A, B) 100 μm; (C) 10 μm.
All together, these data show that RAD51 is essential for progenitor homeostasis in vivo and that its functional inactivation leads to replication stress and apoptosis, resulting in progenitor cell exhaustion in proliferative tissues and accounting for premature aging due to defective tissue renewal.
Discussion
Here, we showed that in vivo expression of a dominant negative form of RAD51 that reduces its strand exchange activity without stimulating nonconservative DSB repair pathways (SSA and A‐EJ) not only induces premature aging but also impedes tumor development in mice.
To circumvent limitations caused by the essential nature of the RAD51 gene, we took advantage of a dominant negative form of RAD51, SMRAD51, which we had previously designed (Lambert & Lopez, 2000, 2001, 2002; Wilhelm et al, 2014, 2016; So et al, 2022).
In addition to its pivotal role in HR, RAD51 also exercises HR‐independent functions, such as replication fork protection and prevention against the nonconservative repair pathways SSA and A‐EJ (Schlacher et al, 2011; Mason et al, 2019; So et al, 2022). HR competes with the nonconservative repair processes SSA and A‐EJ (Rass et al, 2009; Bétermier et al, 2014; So et al, 2017), the binding of RAD51 to ssDNA not only triggers HR but also prevents SSA and A‐EJ through DNA occupancy in an HR‐independent manner (So et al, 2022). Therefore, this latter capacity of RAD51 should preserve from the genomic instability generated by these nonconservative repair processes. Consequently, knocking out RAD51 or RAD51‐loading proteins, such as BRCA2 or PALB2, results in the absence of RAD51 on ssDNA, making it accessible to alternative nonconservative pathways (Ahrabi et al, 2016; Han et al, 2017; So et al, 2022) and increasing genomic instability. Therefore, the phenotypes of such mutants result from the combination of HR deficiency and an increase in SSA and A‐EJ. Because SMRAD51 binds damaged DNA (see Fig EV2; So et al, 2022), its expression suppresses HR but without stimulation of the nonconservative repair mechanisms SSA and A‐EJ (Figs EV1, EV2, EV3; So et al, 2022). Thus, SMRAD51 is a unique tool that enabled us to focus on the impact of HR downregulation without stimulating nonconservative repair pathways in vivo. Indeed, the expression of other dominant‐negative forms of RAD51, such as that in Fanconi anemia Group R (RAD51‐T131P) or that encoding for a dysfunctional ATP‐binding site (RAD51‐K133R and RAD51‐K133A), impair foci formation (including that of endogenous WT‐RAD51) after the induction of DNA damage (So et al, 2022) and therefore lead to SSA and A‐EJ stimulation (So et al, 2022).
Here, we demonstrate that SMRAD51 reduces HR without increasing the rate of alternative nonconservative repair pathways SSA and end‐joining in MEFs (see Fig EV3). Moreover, we also further characterized the molecular mechanisms of HR inhibition by SMRAD51 (Figs EV1 and EV2) and demonstrated that SMRAD51 ultimately reduces HR in a dominant negative manner by suppressing the strand exchange activity of the RAD51‐ssDNA filament. RAD51 promotes the central step of HR through homology searching and strand exchange with an intact DNA partner. We showed that by altering the activity of the RAD51‐ssDNA filament, SMRAD51 ultimately reduces HR in a dominant negative manner.
In addition, we show here that SMRAD51 protects arrested replication forks from degradation (a function consistent with its ability to bind DNA) but inhibits the resumption of replication (because of its abrogated strand exchange activity), ultimately leading to replication stress. We cannot exclude the possibility that SMRAD51 may mediate the reversal of arrested replication forks. Indeed, SMRAD51 may retain the capacity to induce fork reversal since this function of RAD51 might not require strand exchange activity (Mason et al, 2019; Berti et al, 2020; Thomas et al, 2023). Addressing these questions is an exciting challenge for future research. Nevertheless, the important point is that, in the end, SMRAD51 generates replication stress, thereby preferentially affecting proliferating cells.
With our mouse model, we showed that SMRAD51 suppressed HR and generated replication stress and systemic inflammation, ultimately resulting in premature aging. An increasing number of publications show that replication stress induces the production of inflammatory cytokines and innate immunity, notably through the production of cytosolic DNA and activation of the STING pathway (for reviews, see Ragu et al, 2020; Lin & Pasero, 2021). Moreover, replication stress can directly induce the expression of proinflammatory cytokine genes through the activation of NFκB mediated by PARP1 (Ragu et al, 2023). Since HR defects lead to replication stress, they are also expected to induce inflammation, as observed when cells express dysfunctional BRCA2 mutants (Reisländer et al, 2019). Given that SMRad51 expression leads to replication stress (Daboussi et al, 2008; Wilhelm et al, 2014, 2016), including in MEFs (present data), it is therefore consistent that it also leads to the expression of inflammatory cytokine genes and to systemic inflammation.
Due to the induction of replication stress, tissues with proliferating cells and progenitor cells, which replicate their genome, were particularly affected. The outcome was progenitor cell pool exhaustion, hampering tissue renewal and thus accounting for the accelerated aging observed. These defects affected young mice to a markedly greater extent than adult mice, consistent with the fact that most cells divide, replicating their genome, in young mice, and thus, these cells must be more sensitive to replication stress. Collectively, the combined defects in different tissues (due to progenitor pool attrition) led to the reduced lifespan observed after RAD51 HR function was disrupted in vivo. Additionally, other systemic effects, such as inflammation, could aggravate the aging phenotypes (Fig 10).
Figure 10. Impact of RAD51 in vivo .
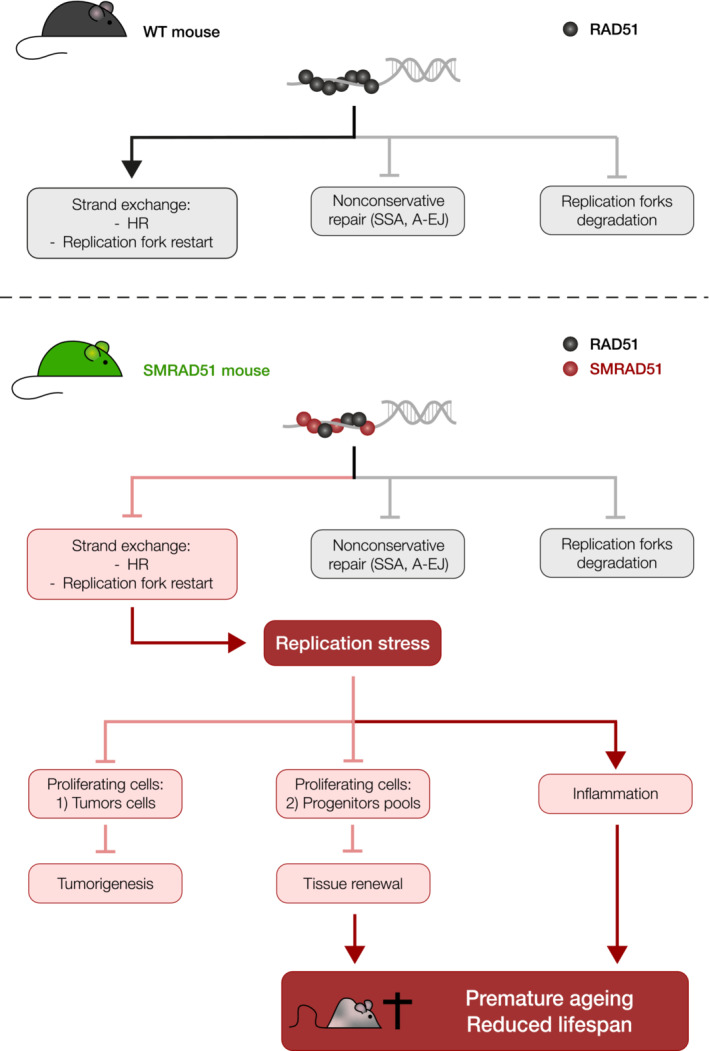
WT RAD51 (upper panel) binds ssDNA, preventing nonconservative repair (SSA and A‐EJ), protecting arrested replication forks from degradation and fostering strand exchange. Strand exchange leads to HR and favors the restart of arrested replication forks. SMRAD51 (lower panel) binds to ssDNA, preventing nonconservative repair (SSA and A‐EJ) and protecting arrested replication forks from degradation. However, SMRAD51 abrogates strand exchange, thus altering both HR and the restart of arrested replication forks, resulting in replication stress. Replication stress affects proliferating cells and thus tumor cells and progenitor cells, leading to both impaired tumorigenesis and exhaustion of progenitor cell pools. Diminished progenitor pools hinder tissue renewal, leading to premature aging. The simultaneous and combined deficiencies of different tissues reduce lifespan. Moreover, the systemic inflammation (that can result from replication stress) can also amplify premature aging and reduce lifespan.
According to the intrauterine programming model, developmental issues generated by replication stress during embryogenesis are the underlying cause of tissue degeneration and malfunction that result in a premature aging‐like phenotype in adulthood (Fernandez‐Capetillo, 2002; Murga et al, 2009). Here, functional inactivation of RAD51 was performed in adults but still resulted in premature aging phenotypes. Therefore, the intrauterine programming model cannot account for the phenotypes observed in the current study. Instead, our results are consistent with data showing that inactivation of the replicative stress response factor Atr leads to premature aging in adult mice (Ruzankina et al, 2007).
RAD51 is a pharmacological target, and research is being performed to develop RAD51 inhibitors (Huang & Mazin, 2014; Grundy et al, 2020). However, taking into account the impact of these inhibitors on alternative nonconservative repair processes such as SSA and A‐EJ might be important: molecules that selectively inhibit the HR activity of RAD51 without stimulating nonconservative repair processes may limit the risks of increased genetic instability and its associated consequences. Our data at a genetic level support this suggestion and show that hypomorphic forms of Rad51 can affect de novo tumor formation in vivo, establishing a novel proof of concept.
Activation of the DDR, interpreted as a response to endogenous replication stress, has been described at pre‐ or early steps of tumorigenesis (Bartkova et al, 2005; Gorgoulis et al, 2005). Moreover, mutations affecting factors that promote the loading of RAD51 onto ssDNA, such as BRCA1, BRCA2 and PALB2, cause cancer predisposition. Intriguingly, although RAD51 plays a pivotal role in HR, inactivating mutations of RAD51 has not been associated with carcinogenesis, although extensive studies have been performed, revealing the “RAD51 paradox” (Matos‐Rodrigues et al, 2021a). Our data provide experimental support for this paradox, as alteration of RAD51 HR activity not only does not favor tumorigenesis but also prevents it, although replication stress is induced. DNA repair sometimes differs between rodents and humans. However, we can point out that mutated RAD51 is not classified as a tumor‐prone (“the RAD51 paradox”) in humans, suggesting that our present data obtained with mice truly recapitulated the situation in humans and the “RAD51 paradox.”
One hypothesis that could account for the present data suggests that mice with premature aging cannot support tumor development and die before tumors develop. A second nonexclusive hypothesis posits that functional inactivation of RAD51 directly prevents the expansion of transformed cells and thus hinders tumor formation. Indeed, transformed cells are highly proliferative, and RAD51 HR functional inactivation preferentially affects highly proliferative cells. Additionally, the induction of inflammatory cytokine expression might favor the elimination of cells with genome instability. Third, tumorigenesis might require a combination of HR inhibition, unprotected replication fork and stimulation of mutagenic alternative pathways such as the SSA and A‐EJ; then RAD51 would contribute to both protection against tumor formation and premature aging. However, suppressing solely its HR function, without abrogating its protection of replication forks and without stimulation of SSA and A‐EJ, leads to accelerated aging but not tumor development (Fig 10).
Materials and Methods
Mice
ExMmRad51 (hemagglutinin (HA)‐tagged Mus musculus Rad51)‐ and SMRad51‐expressing mice were established using the following strategy: ExMmRad51 and SMRad51 were derived from previously developed plasmid constructs (Lambert & Lopez, 2000). Both transgenes were obtained from a pcDNA3.1‐puro plasmid carrying exMmRad51 and SMRad51 sequences and subcloned into a pBI‐4 plasmid carrying tet operators. The vectors were then linearized and electroporated into ES cells (129/SVEV). Clones were selected using puromycin and injected into blastocysts to enable germline transmission. For the establishment of a rtTA mouse line, mice carrying the lox‐stop‐lox rtTA‐EGFP transgene (B6.Cg‐Gt(ROSA)26SorTM1(rtTA,EGFP)Nagy/J) were mated with Vasa‐Cre mice (FVB‐Tg(Ddx4‐cre)1Dcas/J) to obtain mice that constitutively expressed rtTA (these mice were therefore called rtTA mice). Littermates obtained from crosses of SMRad51 (rtTA;SMRad51) mice with control (SMRad51) mice or exMmRad51 (rtTA;ExMmRad51) mice with control (exMmRad51) mice were used for experimental analysis. Survival curves were generated comparing littermates of at least three different litters.
All mice were maintained with a mixed genetic background. In young growing mice, in vivo transgene expression was induced by intraperitoneal injections of Dox diluted in PBS (5 μg/g, Sigma #D9891) on Monday, Wednesday and/or Friday. In adult mice, in vivo transgene expression was induced by ad libitum feeding of a diet with 625 mg/kg Dox (Sigma #D9891). All mice used as controls were treated with Dox.
The breast cancer model MMTV;PyMT (FVB/N‐Tg (MMTV‐PyVT)634Mul/J) mice were mated with SMRad51 (rtTA;SMRad51) mice to generate rtTA;SMRad51;MMTV‐PyMT (PyMT;MRad51) and SMRad51;MMTV‐PyMT (PyMT;Ctrl) mice. All mice were maintained with a mixed genetic background. In vivo transgene expression was induced by ad libitum feeding of a diet supplemented with doxycycline 625 mg/kg (Sigma #D9891). All mice used as controls were treated with doxycycline. For tumor growth analysis, the diameter of palpable tumors was determined by measuring the anteroposterior length of the tumors, and the formula for the volume (V) of a sphere V = 4/3 πr3 was used to determine tumor volume. All mice that reached the limit points indicated by French Government regulation (Services Vétérinaires de la Santé et de la Production Animale, Ministère de l'Agriculture) were sacrificed.
The experimental procedures with animals were performed in accordance with French government regulations (Services Vétérinaires de la Santé et de la Production Animale, Ministère de l'Agriculture). Authority granting ethics approval: #22023‐2019091716277208.
Histology
Whole tissues or biopsies were fixed in 4% paraformaldehyde (PFA) immediately after dissection. The fixed tissues were then dehydrated and embedded in paraffin using a Tissue‐Tek tissue machine (Sakura). The paraffin blocks were sliced (5 μm) and placed on slides. Before staining, the sections were dewaxed and rehydrated. Pathological analyses were performed with hematoxylin (Path #10047105)‐, eosin (Path #10047001)‐ and alcoholic saffron (Path #10047028)‐stained sections from at least three different mice. Colorimetric images were captured using an Olympus BX51 microscope.
Immunohistochemistry and immunofluorescence
For tissue immunostaining, the slides were washed with PBS, and antigen retrieval was performed using citrate buffer (pH = 6). Antibodies were diluted in blocking buffer (5% normal donkey serum (NDS), 1% bovine serum albumin (BSA) and 0.1% Triton X‐100). For cultured cell immunostaining, cells were grown on glass coverslips and fixed with 4% PFA for 10 min at room temperature. The cells were then washed with PBS, permeabilized with 0.2% Triton and blocked with 1% BSA for 30 min. Primary antibodies were diluted in 1% BSA for immunostaining of cultured cells. The samples were incubated with the following primary antibodies overnight at 4°C: anti‐SMRAD51 (directed against yeast N‐terminal rad51) (1:100, Santa Cruz Biotechnology #SC33626), anti‐Ki67 (1:100, BD Biosciences #556003), anti‐SOX9 (1:100, Abcam #AB5535), anti‐γH2AX (1:1,000, Bethyl #A300‐081), anti‐γH2AX (1:100, Millipore #05–636), anti‐pCHK1 (S317) (1:100, Cell Signaling Technology #2344), anti‐BrdU (1:100, Bio‐Rad #OBT0030G), anti‐PLZF (1:50, Santa Cruz #SC22839), anti‐cCasp3 (1:100, Cell Signaling Technology #9661S) and anti‐HA (1:200, Santa Cruz #7392) antibodies. For immunofluorescence staining, the samples were incubated with Alexa‐conjugated secondary antibodies for 2 h at room temperature, and the slides were then mounted with DAPI ProLong Gold (Thermo Fisher #P36931). For immunohistochemistry, the slides were incubated for 30 min with HRP‐conjugated secondary antibodies, and antibodies were then revealed with DAB (Vector #SK4100). Fluorescence images were captured using a Nikon Eclipse Ti2 microscope, and colorimetric images were captured using an Olympus BX51 microscope.
To label S‐phase cells in vivo, we intraperitoneally injected BrdU into mice (50 μg/g of body weight) (Sigma Aldrich #B5002). Samples were collected 1 h after injection for analysis.
Blood and bone marrow analysis
Bone marrow cells from mouse femur and tibia were flushed with PBS. After hemolysis of blood or bone marrow samples, the cells were counted using an Abbott Cell Dyn 3700 machine. The cells were then labeled using the following antibodies: anti‐Lin+ (MACS), anti‐c‐Kit (BioLegend), anti‐Sca1 (Thermo Fisher), anti‐IL7R (BD Bioscience), anti‐CD3 (BioLegend), anti‐B220 (Thermo Fisher), anti‐Gr1 (BioLegend) and anti‐FLK2 (Thermo Fisher) antibodies. Data acquisition was performed on a FACSCanto II flow cytometer (BD Biosciences), and the data were analyzed with FlowJo software.
MEFs
Mouse embryonic fibroblasts were isolated from embryos (embryonic Day 12.5: E12.5) and immortalized with SV40 (Addgene plasmid #21826). Primary MEFs were used up to passage 4. Immortalized MEFs (iMEFs) and primary MEFs were cultured in DMEM (Gibco #41965‐039) supplemented with 10% tetracycline‐free fetal bovine serum (FBS; Takara #631107) and penicillin–streptomycin (Gibco #15140122).
RNA extraction, cDNA synthesis and real‐time RT–PCR
RNA was extracted from skin biopsy samples (~1 cm2) taken from the upper dorsal surface of the mice (Qiagen #74106). Each RNA sample was collected in 40 μl of ultrapure water (Thermo Fisher #10977). RNA concentration and purity were determined using a NanoDrop spectrophotometer (Eppendorf). RNA integrity was analyzed by 1% agarose gel electrophoresis. cDNA was generated using a high‐capacity cDNA synthesis kit (Thermo Fisher #4368814) following the manufacturer's instructions.
We used 384‐well optical plates to perform real‐time RT–PCR with an Applied Biosystems 7900HT Fast Real‐Time PCR System thermocycler. The primer sequences used for real‐time RT–PCR are shown in Appendix Table S3. The real‐time RT–PCR mix included 6.25 μl of 2× SYBR Green mix, 2 μl of diluted cDNA (1:10), 0.25 μl (5 μM) of each primer and 4.25 μl of ultrapure water (Gibco #10977). The cycling conditions were 50°C for 2 min, 95°C for 10 min and 40 cycles of 95°C for 15 s and 60°C for 60 s. The delta–delta Ct (2−ΔΔCt) method was used to determine the relative quantities of target gene expression compared with that of reference genes. We used the average of the two reference genes (Gapdh and β‐actin) as the final reference.
Cytokine array
For protein array analysis, approximately 150 μl of blood serum containing protease inhibitors (Thermo Fisher #78438) was used. The serum was stored at −80°C until analysis. Samples from two mice of each genotype (Ctrl or SMRad51) that had been fed a Dox‐supplemented diet for 3 months were used. A Proteome Profiler Mouse XL Cytokine Array Kit (R&D Systems #ARY028) was used following the manufacturer's instructions. In Dataset EV1 (adult mice) and Dataset EV2 (young growing mice), we present the results of the densitometry analysis and comparisons.
Replication dynamics analysis
For the DNA spreading assay, replicating DNA in immortalized MEFs was labeled using 50 μM CldU and 50 μM IdU for 20 min for each. The cells were then harvested and resuspended in cold PBS. DNA spreading was performed using 1 × 10³ cells. To extend the DNA fibers, 2 μl of cell suspension was incubated for 3 min with 7 μl of lysis buffer (0.5% SDS, 50 mM EDTA and 200 mM Tris–HCl) in the upper parts of microscope slides. To generate single‐DNA‐molecule spreading, the slides were turned at a 15° angle, which allowed the genomic DNA to spread by gravity. The DNA fibers were then fixed in methanol and acetic acid (3:1) and stored at 4°C.
For molecular combing, a single assay was performed as previously described (Técher et al, 2013). Briefly, primary MEFs were incubated with or without Dox for 48 h and pulse‐labeled with 5‐iodo‐2′‐deoxyuridine (IdU) for 20 min and then with 5‐chloro‐2′‐deoxyuridine (CldU) for 20 min. The cells were collected, and the DNA fibers were purified by enzymatic protein digestion in agarose blocks and subsequently stretched at a rate of 2 kb/μm on silanized coverslips (Técher et al, 2013).
Immunofluorescence detection for the DNA combing and DNA spreading experiments was performed with the following antibodies: (1) mouse anti‐BrdU (BD Biosciences #347583) and rat anti‐BrdU (AbD Serotec #OBT 0030), (2) A488‐conjugated goat anti‐mouse (Invitrogen #A11029) and A555‐conjugated goat anti‐rat (Abcam #A21434), (3) mouse anti‐ssDNA (Millipore #MAB3034), (4) Cy5.5‐conjugated goat anti‐mouse (Abcam #ab6947) and (5) Cy5.5‐conjugated donkey anti‐goat (Abcam #ab6951) antibodies. Fluorescence images were acquired using an epifluorescence microscope (Axio Imager Z2; Carl Zeiss). MetaMorph software (Roper Scientific) was used to acquire images and to build a large‐scale mosaic of up to 100 images. This technique theoretically enabled us to recover long fibers up to approximately 3 Mb in length. We systematically used ssDNA staining to ensure that the replication signals belonged to the same fiber.
Western blot analysis
Proteins were extracted using RIPA buffer (Thermo Fisher #89900) supplemented with phosphatase inhibitors (Thermo Fisher #P0044 and #P5726) and a protease inhibitor (Thermo Fisher #78438). After SDS–PAGE protein separation, the proteins were transferred to nitrocellulose membranes overnight at 30 V and 4°C. The membranes were incubated with the following primary antibodies diluted in 5% milk prior to incubation: anti‐RAD51 (1:1,000, Millipore #PC130), anti‐VINCULIN (1:10,000, Abcam #AB18058) and anti‐HA (1:1,000, BioLegend #MMS‐101R). HRP‐conjugated secondary antibodies were purchased from Thermo Fisher (1:10,000, anti‐mouse IgG, #31430, anti‐rabbit IgG, #31460). A Pierce (Thermo Fisher #32106) or Luminata (Thermo Fisher #WBLUF0500) enhanced chemiluminescence (ECL) system was used according to the manufacturer's instructions, and chemiluminescence was captured using Amersham Imager 600 (GE Life Sciences).
Statistical analysis
The number of biological replicates per experiment is presented in each graph or legend. Quantifications of the histological sections were based on at least three biological sections in each biological sample. GraphPad Prism software was used for statistical analysis. One‐ or two‐way ANOVA was performed as indicated. The P‐values are based on two‐sided tests.
For additional material and methods, see Appendix Supplementary Methods.
Author contributions
Gabriel Matos‐Rodrigues: Data curation; formal analysis; investigation; methodology; writing – original draft; writing – review and editing. Vilma Barroca: Formal analysis; investigation; methodology; writing – review and editing. Ali‐Akbar Muhammad: Investigation; methodology. Elodie Dardillac: Investigation; methodology. Awatef Allouch: Investigation; methodology. Stephane Koundrioukoff: Methodology; writing – review and editing. Daniel Lewandowski: Investigation; methodology; writing – review and editing. Emmanuelle Despras: Methodology; writing – review and editing. Josée Guirouilh‐Barbat: Investigation; methodology. Lucien Frappart: Investigation; methodology. Patricia Kannouche: Resources; methodology. Pauline Dupaigne: Supervision; investigation; methodology; writing – review and editing. Eric Le Cam: Resources; supervision; methodology; writing – review and editing. Jean‐Luc Perfettini: Resources; supervision; methodology. Paul‐Henri Romeo: Resources; methodology; writing – review and editing. Michelle Debatisse: Resources; methodology; writing – review and editing. Maria Jasin: Resources. Gabriel Livera: Resources; supervision; writing – review and editing. Emmanuelle Martini: Conceptualization; resources; data curation; formal analysis; supervision; funding acquisition; validation; investigation; methodology; writing – original draft; writing – review and editing. Bernard S Lopez: Conceptualization; resources; formal analysis; supervision; funding acquisition; validation; methodology; writing – original draft; project administration; writing – review and editing.
Disclosure and competing interests statement
The authors declare that they have no conflict of interest.
Supporting information
Appendix
Expanded View Figures PDF
Movie EV1
Movie EV2
Dataset EV1
Dataset EV2
Review Process File
PDF+
Acknowledgements
We thank George Garinis for helpful and stimulating discussions and Didier Busso and Xavier Veaute from CIGEX (CEA, Fontenay aux Roses) for providing the purified SMRAD51 and MmRAD51 proteins. This work was supported by Institut National du Cancer (PLBIO18‐232, PLBIO21‐072), La ligue contre le cancer, et ITMO Cancer (PCSI 2022).
The EMBO Journal (2023) 42: e110844
Contributor Information
Emmanuelle Martini, Email: emmanuelle.martini@cea.fr.
Bernard S Lopez, Email: bernard.lopez@inserm.fr.
Data availability
This study includes no data deposited in external repositories.
References
- Ahrabi S, Sarkar S, Pfister SX, Pirovano G, Higgins GS, Porter ACG, Humphrey TC (2016) A role for human homologous recombination factors in suppressing microhomology‐mediated end joining. Nucleic Acids Res 44: 5743–5757 [DOI] [PMC free article] [PubMed] [Google Scholar]
- Ameziane N, May P, Haitjema A, van de Vrugt HJ, van Rossum‐Fikkert SE, Ristic D, Williams GJ, Balk J, Rockx D, Li H et al (2015) A novel Fanconi anaemia subtype associated with a dominant‐negative mutation in RAD51. Nat Commun 6: 8829 [DOI] [PMC free article] [PubMed] [Google Scholar]
- Angeli D, Salvi S, Tedaldi G (2020) Genetic predisposition to breast and ovarian cancers: how many and which genes to test? Int J Mol Sci 21: 1128 [DOI] [PMC free article] [PubMed] [Google Scholar]
- Attalla S, Taifour T, Bui T, Muller W (2021) Insights from transgenic mouse models of PyMT‐induced breast cancer: recapitulating human breast cancer progression in vivo . Oncogene 40: 475–491 [DOI] [PMC free article] [PubMed] [Google Scholar]
- Auerbach AD (2009) Fanconi anemia and its diagnosis. Mutat Res 668: 4–10 [DOI] [PMC free article] [PubMed] [Google Scholar]
- Bartkova J, Horejsi Z, Koed K, Kramer A, Tort F, Zieger K, Guldberg P, Sehested M, Nesland JM, Lukas C et al (2005) DNA damage response as a candidate anti‐cancer barrier in early human tumorigenesis. Nature 434: 864–870 [DOI] [PubMed] [Google Scholar]
- Bartkova J, Rezaei N, Liontos M, Karakaidos P, Kletsas D, Issaeva N, Vassiliou LV, Kolettas E, Niforou K, Zoumpourlis VC et al (2006) Oncogene‐induced senescence is part of the tumorigenesis barrier imposed by DNA damage checkpoints. Nature 444: 633–637 [DOI] [PubMed] [Google Scholar]
- Berti M, Cortez D, Lopes M (2020) The plasticity of DNA replication forks in response to clinically relevant genotoxic stress. Nat Rev Mol Cell Biol 21: 633–651 [DOI] [PubMed] [Google Scholar]
- Bétermier M, Bertrand P, Lopez BS (2014) Is non‐homologous end‐joining really an inherently error‐prone process? PLoS Genet 10: e1004086 [DOI] [PMC free article] [PubMed] [Google Scholar]
- Cain D, Kondo M, Chen H, Kelsoe G (2009) Effects of acute and chronic inflammation on B‐cell development and differentiation. J Invest Dermatol 129: 266–277 [DOI] [PMC free article] [PubMed] [Google Scholar]
- Chen C‐C, Feng W, Lim PX, Kass EM, Jasin M (2018) Homology‐directed repair and the role of BRCA1, BRCA2, and related proteins in genome integrity and cancer. Annu Rev Cancer Biol 2: 313–336 [DOI] [PMC free article] [PubMed] [Google Scholar]
- Coquel F, Neumayer C, Lin YL, Pasero P (2019) SAMHD1 and the innate immune response to cytosolic DNA during DNA replication. Curr Opin Immunol 56: 24–30 [DOI] [PubMed] [Google Scholar]
- Daboussi F, Courbet S, Benhamou S, Kannouche P, Zdzienicka MZ, Debatisse M, Lopez BS (2008) A homologous recombination defect affects replication‐fork progression in mammalian cells. J Cell Sci 121: 162–166 [DOI] [PubMed] [Google Scholar]
- Evers B, Jonkers J (2006) Mouse models of BRCA1 and BRCA2 deficiency: past lessons, current understanding and future prospects. Oncogene 25: 5885–5897 [DOI] [PubMed] [Google Scholar]
- Feng W, Jasin M (2017) Homologous recombination and replication fork protection: BRCA2 and more! Cold Spring Harb Symp Quant Biol 82: 329–338 [DOI] [PMC free article] [PubMed] [Google Scholar]
- Fernandez‐Capetillo O (2002) Intrauterine programming of ageing. EMBO Rep 4: 993–997 [DOI] [PMC free article] [PubMed] [Google Scholar]
- French RA, Broussard SR, Meier WA, Minshall C, Arkins S, Zachary JF, Dantzer R, Kelley KW (2002) Age-associated loss of bone marrow hematopoietic cells is reversed by GH and accompanies thymic reconstitution. Endocrinology 143: 690–699 [DOI] [PubMed] [Google Scholar]
- Garinis GA, van der Horst GTJ, Vijg J, Hoeijmakers JHJ (2008) DNA damage and ageing: new‐age ideas for an age‐old problem. Nat Cell Biol 10: 1241–1247 [DOI] [PMC free article] [PubMed] [Google Scholar]
- Gasser S, Zhang WYL, Tan NYJ, Tripathi S, Suter MA, Chew ZH, Khatoo M, Ngeow J, Cheung FSG (2016) Sensing of dangerous DNA. Mech Ageing Dev 165: 33–46 [DOI] [PubMed] [Google Scholar]
- Gekara NO (2017) DNA damage‐induced immune response: micronuclei provide key platform. J Cell Biol 216: 2999–3001 [DOI] [PMC free article] [PubMed] [Google Scholar]
- Gelot C, Guirouilh-Barbat J, Le Guen T, Dardillac E, Chailleux C, Canitrot Y, Lopez BS (2016) The cohesin complex prevents the end joining of distant DNA double-strand ends. Mol Cell 61: 15–26 [DOI] [PubMed] [Google Scholar]
- Gorgoulis VG, Vassiliou LV, Karakaidos P, Zacharatos P, Kotsinas A, Liloglou T, Venere M, Ditullio RAJ, Kastrinakis NG, Levy B et al (2005) Activation of the DNA damage checkpoint and genomic instability in human precancerous lesions. Nature 434: 907–913 [DOI] [PubMed] [Google Scholar]
- Grundy MK, Buckanovich RJ, Bernstein KA (2020) Regulation and pharmacological targeting of RAD51 in cancer. NAR Cancer 2: zcaa024 [DOI] [PMC free article] [PubMed] [Google Scholar]
- Guirouilh-Barbat J, Huck S, Bertrand P, Pirzio L, Desmaze C, Sabatier L, Lopez BSBS (2004) Impact of the KU80 pathway on NHEJ-induced genome rearrangements in mammalian cells. Mol Cell 14: 611–623 [DOI] [PubMed] [Google Scholar]
- Guirouilh-Barbat J, Rass E, Plo I, Bertrand P, Lopez BSBS (2007) Defects in XRCC4 and KU80 differentially affect the joining of distal nonhomologous ends. Proc Natl Acad Sci USA 104: 20902–20907 [DOI] [PMC free article] [PubMed] [Google Scholar]
- Gunn A, Stark JM (2012) I-SceI-based assays to examine distinct repair outcomes of mammalian chromosomal double strand breaks. Methods Mol Biol 920: 379–391 [DOI] [PubMed] [Google Scholar]
- Haber JE (2014) Genome stability. DNA repair and recombination, 1st edn. New York, NY: Garland Science; [Google Scholar]
- Han J, Ruan C, Huen MSY, Wang J, Xie A, Fu C, Liu T, Huang J (2017) BRCA2 antagonizes classical and alternative nonhomologous end‐joining to prevent gross genomic instability. Nat Commun 8: 1470 [DOI] [PMC free article] [PubMed] [Google Scholar]
- Hanahan D, Weinberg RA (2011) Hallmarks of cancer: the next generation. Cell 144: 646–674 [DOI] [PubMed] [Google Scholar]
- Hoeijmakers JH (2009) DNA damage, aging, and cancer. N Engl J Med 361: 1475–1485 [DOI] [PubMed] [Google Scholar]
- Huang F, Mazin AV (2014) A small molecule inhibitor of human RAD51 potentiates breast cancer cell killing by therapeutic agents in mouse xenografts. PloS One 9: e100993 [DOI] [PMC free article] [PubMed] [Google Scholar]
- Kennedy RD, D'Andrea AD (2005) The Fanconi anemia/BRCA pathway: new faces in the crowd. Genes Dev 19: 2925–2940 [DOI] [PubMed] [Google Scholar]
- Lambert S, Lopez BS (2000) Characterization of mammalian RAD51 double strand break repair using non lethal dominant negative forms. EMBO J 19: 3090–3099 [DOI] [PMC free article] [PubMed] [Google Scholar]
- Lambert S, Lopez BS (2001) Role of RAD51 in sister‐chromatid exchanges in mammalian cells. Oncogene 20: 6627–6631 [DOI] [PubMed] [Google Scholar]
- Lambert S, Lopez BS (2002) Inactivation of the RAD51 recombination pathway stimulates UV‐induced mutagenesis in mammalian cells. Oncogene 21: 4065–4069 [DOI] [PubMed] [Google Scholar]
- Lin Y‐L, Pasero P (2021) Replication stress: from chromatin to immunity and beyond. Curr Opin Genet Dev 71: 136–142 [DOI] [PubMed] [Google Scholar]
- López‐Otín C, Blasco MA, Partridge L, Serrano M, Kroemer G (2013) The hallmarks of aging. Cell 153: 1194–1217 [DOI] [PMC free article] [PubMed] [Google Scholar]
- López‐Otín C, Pietrocola F, Roiz‐Valle D, Galluzzi L, Kroemer G (2023) Meta‐hallmarks of aging and cancer. Cell Metab 35: 12–35 [DOI] [PubMed] [Google Scholar]
- Lord CJ, Ashworth A (2016) BRCAness revisited. Nat Rev Cancer 16: 110–120 [DOI] [PubMed] [Google Scholar]
- Mann M, Mehta A, de Boer CG, Kowalczyk MS, Lee K, Haldeman P, Rogel N, Knecht AR, Farouq D, Regev A et al (2018) Heterogeneous responses of hematopoietic stem cells to inflammatory stimuli are altered with age. Cell Rep 25: 2992–3005 [DOI] [PMC free article] [PubMed] [Google Scholar]
- Mason JM, Chan YL, Weichselbaum RW, Bishop DK (2019) Non‐enzymatic roles of human RAD51 at stalled replication forks. Nat Commun 10: 4410 [DOI] [PMC free article] [PubMed] [Google Scholar]
- Matos‐Rodrigues G, Guirouilh‐Barbat J, Martini E, Lopez BS (2021a) Homologous recombination, cancer and the ‘RAD51 paradox’. NAR Cancer 3: zcab016 [DOI] [PMC free article] [PubMed] [Google Scholar]
- Matos‐Rodrigues G, Martini E, Lopez BS (2021b) Mouse models for deciphering the impact of homologous recombination on tumorigenesis. Cancers 13: 2083 [DOI] [PMC free article] [PubMed] [Google Scholar]
- Morrison SJ, Wandycz AM, Akashi K, Globerson A, Weissman IL (1996) The aging of hematopoietic stem cells. Nat Med 2: 1011–1016 [DOI] [PubMed] [Google Scholar]
- Muñoz‐Lorente MA, Cano‐Martin AC, Blasco MA (2019) Mice with hyper‐long telomeres show less metabolic aging and longer lifespans. Nat Commun 10: 4723 [DOI] [PMC free article] [PubMed] [Google Scholar]
- Murga M, Bunting S, Montãa MF, Soria R, Mulero F, Cãamero M, Lee Y, McKinnon PJ, Nussenzweig A, Fernandez‐Capetillo O (2009) A mouse model of ATR‐Seckel shows embryonic replicative stress and accelerated aging. Nat Genet 41: 891–898 [DOI] [PMC free article] [PubMed] [Google Scholar]
- Negrini S, Gorgoulis VG, Halazonetis TD (2010) Genomic instability—an evolving hallmark of cancer. Nat Rev Mol Cell Biol 11: 220–228 [DOI] [PubMed] [Google Scholar]
- Petr MA, Tulika T, Carmona‐Marin LM, Scheibye‐Knudsen M (2020) Protecting the aging genome. Trends Cell Biol 30: 117–132 [DOI] [PubMed] [Google Scholar]
- Pettan‐Brewer C, Treuting PM (2011) Practical pathology of aging mice. Pathobiol Aging Age Relat Dis 1: 7202 [DOI] [PMC free article] [PubMed] [Google Scholar]
- Ragu S, Matos‐Rodrigues G, Lopez BS (2020) Replication stress, DNA damage, inflammatory cytokines and innate immune response. Genes 11: 409 [DOI] [PMC free article] [PubMed] [Google Scholar]
- Ragu S, Droin N, Matos‐Rodrigues G, Barascu A, Caillat S, Zarkovic G, Siberchicot C, Dardillac E, Gelot C, Guirouilh‐Barbat J et al (2023) A noncanonical response to replication stress protects genome stability through ROS production, in an adaptive manner. Cell Death Differ 30: 1349–1365 [DOI] [PMC free article] [PubMed] [Google Scholar]
- Rass E, Grabarz A, Plo I, Gautier J, Bertrand P, Lopez BSBS (2009) Role of Mre11 in chromosomal nonhomologous end joining in mammalian cells. Nat Struct Mol Biol 16: 819–824 [DOI] [PubMed] [Google Scholar]
- Reisländer T, Lombardi EP, Groelly FJ, Miar A, Porru M, Di Vito S, Wright B, Lockstone H, Biroccio A, Harris A et al (2019) BRCA2 abrogation triggers innate immune responses potentiated by treatment with PARP inhibitors. Nat Commun 10: 3143 [DOI] [PMC free article] [PubMed] [Google Scholar]
- Ruzankina Y, Pinzon‐Guzman C, Asare A, Ong T, Pontano L, Cotsarelis G, Zediak VP, Velez M, Bhandoola A, Brown EJ (2007) Deletion of the developmentally essential gene ATR in adult mice leads to age‐related phenotypes and stem cell loss. Cell Stem Cell 7: 113–126 [DOI] [PMC free article] [PubMed] [Google Scholar]
- Saintigny Y, Delacôte F, Varès G, Petitot F, Lambert S, Averbeck D, Lopez BS, Delacote F, Vares G, Petitot F et al (2001) Characterization of homologous recombination induced by replication inhibition in mammalian cells. EMBO J 20: 3861–3870 [DOI] [PMC free article] [PubMed] [Google Scholar]
- Schlacher K, Christ N, Siaud N, Egashira A, Wu H, Jasin M (2011) Double‐strand break repair‐independent role for BRCA2 in blocking stalled replication fork degradation by MRE11. Cell 145: 529–542 [DOI] [PMC free article] [PubMed] [Google Scholar]
- Shi C, Pamer EG (2011) Monocyte recruitment during infection and inflammation. Nat Rev Immunol 11: 762–774 [DOI] [PMC free article] [PubMed] [Google Scholar]
- So A, Le Guen T, Lopez BS, Guirouilh‐Barbat J (2017) Genomic rearrangements induced by unscheduled DNA double strand breaks in somatic mammalian cells. FEBS J 284: 2324–2344 [DOI] [PubMed] [Google Scholar]
- So A, Dardillac E, Muhammad A, Chailleux C, Sesma‐Sanz L, Ragu S, Le Cam E, Canitrot Y, Masson JY, Dupaigne P et al (2022) RAD51 protects against nonconservative DNA double‐strand break repair through a nonenzymatic function. Nucleic Acids Res 50: 2651–2666 [DOI] [PMC free article] [PubMed] [Google Scholar]
- Sotiropoulou PA, Karambelas AE, Debaugnies M, Candi A, Bouwman P, Moers V, Revenco T, Rocha AS, Sekiguchi K, Jonkers J et al (2013) Brca1 deficiency in skin epidermis leads to selective loss of hair follicle stem cells and their progeny. Genes Dev 27: 39–51 [DOI] [PMC free article] [PubMed] [Google Scholar]
- Stark JM, Hu P, Pierce AJ, Moynahan ME, Ellis N, Jasin M (2002) ATP hydrolysis by mammalian RAD51 has a key role during homology‐directed DNA repair. J Biol Chem 277: 20185–20194 [DOI] [PubMed] [Google Scholar]
- Técher H, Koundrioukoff S, Azar D, Wilhelm T, Carignon S, Brison O, Debatisse M, Le Tallec B (2013) Replication dynamics: biases and robustness of DNA fiber analysis. J Mol Biol 425: 4845–4855 [DOI] [PubMed] [Google Scholar]
- Thomas M, Dubacq C, Rabut E, Lopez BS, Guirouilh‐Barbat J (2023) Noncanonical roles of RAD51. Cells 12: 1169 [DOI] [PMC free article] [PubMed] [Google Scholar]
- Tsuzuki T, Fujii Y, Sakumi K, Tominaga Y, Nakao K, Sekiguchi M, Matsushiro A, Yoshimura Y, Morita T (1996) Targeted disruption of the Rad51 gene leads to lethality in embryonic mice. Proc Natl Acad Sci USA 93: 6236–6240 [DOI] [PMC free article] [PubMed] [Google Scholar]
- Tubbs A, Nussenzweig A (2017) Endogenous DNA damage as a source of genomic instability in cancer. Cell 168: 644–656 [DOI] [PMC free article] [PubMed] [Google Scholar]
- Walden H, Deans AJ (2014) The Fanconi anemia DNA repair pathway: structural and functional insights into a complex disorder. Annu Rev Biophys 43: 257–278 [DOI] [PubMed] [Google Scholar]
- Walsh T, Casadei S, Lee MK, Pennil CC, Nord AS, Thornton AM, Roeb W, Agnew KJ, Stray SM, Wickramanayake A et al (2011) Mutations in 12 genes for inherited ovarian, fallopian tube, and peritoneal carcinoma identified by massively parallel sequencing. Proc Natl Acad Sci USA 108: 18032–18037 [DOI] [PMC free article] [PubMed] [Google Scholar]
- Wang AT, Kim T, Wagner JE, Conti BA, Lach FP, Huang AL, Molina H, Sanborn EM, Zierhut H, Cornes BK et al (2015) A dominant mutation in human RAD51 reveals its function in DNA interstrand crosslink repair independent of homologous recombination. Mol Cell 59: 478–490 [DOI] [PMC free article] [PubMed] [Google Scholar]
- Wilhelm T, Magdalou I, Barascu A, Techer H, Debatisse M, Lopez BS (2014) Spontaneous slow replication fork progression elicits mitosis alterations in homologous recombination‐deficient mammalian cells. Proc Natl Acad Sci USA 111: 763–768 [DOI] [PMC free article] [PubMed] [Google Scholar]
- Wilhelm T, Ragu S, Magdalou I, Machon C, Dardillac E, Técher H, Guitton J, Debatisse M, Lopez BS (2016) Slow replication fork velocity of homologous recombination‐defective cells results from endogenous oxidative stress. PLoS Genet 12: e1006007 [DOI] [PMC free article] [PubMed] [Google Scholar]
Associated Data
This section collects any data citations, data availability statements, or supplementary materials included in this article.
Supplementary Materials
Appendix
Expanded View Figures PDF
Movie EV1
Movie EV2
Dataset EV1
Dataset EV2
Review Process File
PDF+
Data Availability Statement
This study includes no data deposited in external repositories.