

Summary
Many quantitative trait loci (QTLs) are in non-coding regions. Therefore, QTLs are assumed to affect gene regulation. Gene expression and RNA splicing are primary steps of transcription, so DNA variants changing gene expression (eVariants) or RNA splicing (sVariants) are expected to significantly affect phenotypes. We quantify the contribution of eVariants and sVariants detected from 16 tissues (n = 4,725) to 37 traits of ∼120,000 cattle (average magnitude of genetic correlation between traits = 0.13). Analyzed in Bayesian mixture models, averaged across 37 traits, cis and trans eVariants and sVariants detected from 16 tissues jointly explain 69.2% (SE = 0.5%) of heritability, 44% more than expected from the same number of random variants. This 69.2% includes an average of 24% from trans e-/sVariants (14% more than expected). Averaged across 56 lipidomic traits, multi-tissue cis and trans e-/sVariants also explain 71.5% (SE = 0.3%) of heritability, demonstrating the essential role of proximal and distal regulatory variants in shaping mammalian phenotypes.
Keywords: gene expression, RNA splicing, eQTL, sQTL, complex traits, heritability, BayesR, BayesRC
Graphical abstract
Highlights
-
•
Map cis and trans eQTLs and RNA splicing sQTLs in 16 tissues of 4,725 cattle
-
•
Use cis and trans e/sQTLs to partition heritability (h2) of 37 traits of 120,000 cattle
-
•
cis and trans e/sQTLs explained an average of 69.2% of h2 across phenotypic traits
-
•
cis and trans e/sQTLs are essential for mammalian phenotypes
Xiang et al. analyzed the genome, transcriptome, and phenotypes of ∼120,000 cattle. They found, on average across 37 traits, 69.2% of heritability (SD = 9.7%) due to DNA variants changing gene expression and RNA splicing via cis and trans effects. This demonstrates the major role of regulatory variants in shaping mammalian phenotypes.
Introduction
Understanding how DNA variants shape phenotype is a central goal in genetics and biology. Most complex, mammalian phenotypes are influenced by the accumulated effects of many variable sites in the genome known as quantitative trait loci (QTLs). Most of these QTLs are in non-coding regions of the genome. Since non-coding regions are usually involved in gene regulation, numerous human studies have mapped regulatory loci, including QTLs affecting gene expression (eQTLs)5,6 and RNA splicing (sQTLs),7 with the expectation that they would explain variation in complex traits.
Significant efforts in mapping regulatory variants in other species have been initiated, including in livestock species. A Cattle Genotype-Tissue Expression (CattleGTEx)8 consortium, part of the Farm Animal GTEx (FarmGTEx), has been launched along with new priorities for the Functional Annotation of Animal Genomes (FAANG)9,10 consortium. Genome-wide association studies (GWASs) of cattle are now carried out in more than 100,000 individuals11,12 to identify trait QTLs for dozens of complex traits. Therefore, there are unique opportunities in non-human species to dissect the impact of regulatory variants on mammalian complex traits.
Despite being biologically important, regulatory variants have been reported to contribute only a small part to variation in mammalian complex traits.13,14 For example, a recent human study suggested that around 11% of trait SNP-based heritability is attributable to eQTLs.13 Evaluating published human data, Connally et al.14 proposed the term “missing regulation” to describe the result that genomic variants that affect gene expression (eQTLs) explain so little of the genetic variance in conventional phenotypes. In cattle, limited overlaps between eQTLs and trait QTLs estimated from 44,000 cattle have been reported,15 and the total contribution of eQTLs to the heritability of cattle traits was estimated to be around 10%.16
Herein, we address the contribution of regulatory variants to mammalian complex traits with a comprehensive analysis of cattle data. We mapped eQTLs and sQTLs from transcriptomic data across 16 tissues in more than 40 breeds from 4,725 cattle, comprising between 105 and 945 individuals (average 295) per tissue. In another ∼120,000 Australian cattle, we use a Bayesian mixture model, allowing prior information that a variant affects gene regulation,4 to estimate the genetic variance explained by cis and trans eQTL and sQTL in 37 traits in dairy cows, and we report the averaged partitioned heritability across these 37 traits. Our analysis differs from many of those previously reported in that we consider the effects of cis and trans eQTL and sQTL derived from both single tissues as well as from multiple tissues. To validate the estimates of partitioned heritability, we replicate analyses in 56 lipidomic traits assayed by liquid chromatography-mass spectrometry and found that, averaged across lipidomic traits, regulatory genetic variants can explain a large proportion of genetic variance as well.
Results
eQTLs and sQTLs were mapped in 16 tissues in either newly generated data or data obtained from CattleGTEx v.08 in tissues with a sample size >100 (Table S1) using a linear mixed-model approach3 (see STAR Methods). After filtering out identical samples (similarity at SNPs >0.85; see Liu et al.8), there were 4,725 different samples across 16 tissues and, on average, 295 samples per tissue. Cis (±1 Mb gene or intron) e-/sQTLs were identified in the association analysis based on a cutoff of p < 5 × 10⁻⁶ in the association mapping. More stringent criteria were applied to the selection of trans e-/sQTLs (from different chromosomes to the gene or intron; see STAR Methods). A meta-analysis across 16 tissues was conducted to identify multi-tissue eQTLs and sQTLs (see STAR Methods). More than 1.8 million linkage disequilibrium (LD)-pruned (r2 < 0.9) genome-wide variants from ∼120,000 Australian cattle were placed into 13 classes based on whether they mapped to variants designated as eQTLs, sQTLs, or both eQTLs and sQTLs (esQTLs) that act in cis or trans at both the single-tissue and multi-tissue levels (Data S1). In the following sections, we use the term “regulatory variants” to describe variants associated with changes in gene expression (eVariants) and splicing (sVariants), which do not necessarily imply causation.
Each of the 37 complex traits (Table S2) was analyzed with a Bayesian mixture model called BayesRC.4 These 37 phenotypic traits had genetic correlations ranging from −0.66 to 0.79 with a mean of 0.04, and the average magnitude of correlation was 0.13 (Figure S1; Data S2), suggesting a diverse range of 37 phenotypic traits. Like BayesR,17,18 BayesRC assumes that the effect of a variant on a complex trait is drawn from a mixture of 4 normal distributions with mean = 0 and variances of zero (no effect), 0.0001 (small effect), 0.001 (medium effect), or 0.01 (large effects) times the genetic variance. However, in BayesRC, the variants are placed into non-overlapping classes based on prior information (e.g., with regulatory evidence), and the proportion of each distribution in the mixture is allowed to vary between classes. This allowed us to quantify the relative proportion of heritability attributable to classes of variants acting as cis and trans eQTLs and sQTLs, i.e., cis and trans eVariants and sVariants. Here, the heritability is based on additive genetic variance due to sequence variants using the methodology equivalent to estimating “SNP-based heritability” in human genetics.19 As dairy cattle have a small effective population size, the total heritability estimated here (the denominator in proportions reported) is approximately equal to the estimate of the heritability using pedigree data. In BayesRC, the proportion of heritability explained was also estimated for a class of “remaining variants” with no regulatory evidence. We used this estimate together with its ratio of genomic size (proportion of variants relative to the total number of variants analyzed) to other classes of regulatory variants to derive an expected proportion of heritability explained by each class of variants, assuming they explained the same amount per variant as the remaining class (Table 1; STAR Methods).
Table 1.
Summary of the proportion (%) of heritability (SNP-based) and trait-associated variants (trait QTLs) affecting gene expression (eVariants), RNA splicing (sVariants), or variants affecting both expression and splicing (esVariants)
| Tissue | Class | N class | % class | Small (SE) | Medium (SE) | Large (SE) | O[% h2] (SE), % | E[% h2] (SE), % | O[% QTLs] (SE), % | E[% QTLs] (SE), % |
|---|---|---|---|---|---|---|---|---|---|---|
| Single tissue | cis.eVariants | 7,921 | 0.42 | 166.5 (3.9) | 16.7 (0.5) | 0.6 (0.0) | 3.78 (0.09)∗∗∗∗ | 0.32 (0.01) | 9.12 (0.30)∗∗∗∗ | 0.002 (0.000) |
| cis.sVariants | 26,222 | 1.39 | 324.9 (11.7) | 25.0 (0.8) | 0.7 (0.0) | 6.23 (0.18)∗∗∗∗ | 1.05 (0.05) | 4.60 (0.20)∗∗∗∗ | 0.005 (0.000) | |
| cis.esVariants | 4,598 | 0.24 | 106.4 (3.3) | 11.2 (0.3) | 0.6 (0.0) | 2.66 (0.08)∗∗∗∗ | 0.18 (0.01) | 20.86 (1.06)∗∗∗∗ | 0.001 (0.000) | |
| trans.eVariants | 3,003 | 0.16 | 128.4 (3.0) | 13.9 (0.4) | 0.5 (0.0) | 3.04 (0.07)∗∗∗∗ | 0.13 (0.00) | 19.03 (0.77)∗∗∗∗ | 0.001 (0.000) | |
| trans.sVariants | 32,083 | 1.70 | 296.9 (4.6) | 28.9 (0.8) | 0.7 (0.0) | 6.27 (0.11)∗∗∗∗ | 1.34 (0.02) | 2.61 (0.08)∗∗∗∗ | 0.007 (0.000) | |
| trans.esVariants | 2,740 | 0.15 | 109.9 (2.5) | 12.0 (0.4) | 0.5 (0.0) | 2.65 (0.06)∗∗∗∗ | 0.11 (0.00) | 17.25 (0.96)∗∗∗∗ | 0.001 (0.000) | |
| remaining | 1,805,933 | 95.93 | 6,726.8 (53.7) | 98.1 (2.1) | 1.7 (0.1) | 75.38 (0.41) | 75.38 (0.41) | 0.38 (0.00) | 0.38 (0.003) | |
| Multi-tissue | cis.eVariants | 1,919 | 0.10 | 84.9 (9.3) | 9.5 (1.0) | 0.4 (0.0) | 2.09 (0.18)∗∗∗∗ | 0.06 (0.00) | 14.53 (1.47)∗∗∗∗ | 0.000 (0.000) |
| cis.sVariants | 252,518 | 13.41 | 1,611.2 (74.4) | 55.7 (5.5) | 1.0 (0.1) | 21.46 (0.77)∗∗∗∗ | 7.57 (0.39) | 1.29 (0.05)∗∗∗∗ | 0.066 (0.003) | |
| cis.esVariants | 275,390 | 14.63 | 1,593.8 (60.3) | 53.6 (4.8) | 1.5 (0.3) | 21.77 (1.01)∗∗∗∗ | 8.26 (0.43) | 1.18 (0.04)∗∗∗∗ | 0.072 (0.004) | |
| trans.eVariants | 227,126 | 12.07 | 987.8 (39.6) | 32.3 (3.2) | 0.8 (0.0) | 13.13 (0.36)∗∗∗∗ | 6.81 (0.35) | 0.93 (0.04)∗∗∗∗ | 0.059 (0.003) | |
| trans.sVariants | 47,694 | 2.53 | 365.4 (25.7) | 23.0 (2.0) | 0.6 (0.0) | 6.21 (0.36)∗∗∗∗ | 1.43 (0.07) | 2.31 (0.16)∗∗∗∗ | 0.012 (0.001) | |
| trans.esVariants | 49,692 | 2.64 | 244.6 (18.8) | 17.8 (1.7) | 0.6 (0.0) | 4.51 (0.30)∗∗∗∗ | 1.49 (0.08) | 1.89 (0.16)∗∗∗∗ | 0.013 (0.001) | |
| remaining | 1,028,161 | 54.62 | 2,708.2 (138.5) | 44.1 (9.5) | 0.9 (0.2) | 30.83 (1.59) | 30.83 (1.59) | 0.27 (0.01) | 0.27 (0.014) |
Within each non-overlapping class, the total number of variants (N class) and their genome proportion (% class, number of variants in the class/total number of variants analyzed), the number of variants with small effects (“small”), medium effects (“medium”), and large effects (“large”) averaged across 16 tissues and 37 traits are given. These numbers are used to estimate the observed heritability explained (O[% h2]) and the proportion of trait QTLs in each class (O[% QTLs]). The number of variants within the remaining class (no regulatory evidence) is used to estimate the expected proportion of heritability explained (E[% h2]) and the proportion of trait QTLs in each class (E[% QTLs]). The standard errors as shown in parentheses are derived based on the estimates across 37 traits. ∗∗∗∗p of heritability enrichment < 0.0001 (difference between observed and expected across 37 traits and 16 single tissues or 1 multi-tissue, two-sided test).
Bayesian partitioning heritability across e-/sVariants
The BayesRC analysis was performed when the regulatory classes were defined based on each individual tissue (e.g., eVariants called for a given tissue). While the classes were defined from all tissues in a single analysis (e.g., eVariants were called in at least one of the 16 tissues). Table 1 gives the BayesRC results for the 7 prior classes (fitted jointly) averaged across the 37 traits and 16 tissues for the single-tissue analyses and across the 37 traits for multi-tissue analyses. The 7 prior classes categorized the variants into non-overlapping groups of cis- and trans-regulatory variants and variants with no regulatory evidence. In single-tissue and multi-tissue analyses, all 6 regulatory classes had a higher proportion of variants affecting phenotypes than the remaining class with no regulatory evidence (Table 1; STAR Methods). In particular, 6 regulatory classes had a higher proportion of variants with medium or large effects on phenotypes than the remaining class. Consequently, the variance explained by the 6 regulatory classes was higher than expected if they explained the same amount per variant as the remaining classes (Table 1; STAR Methods). There was no overlap of variants between classes.
In the multiple tissue analysis, all tissues and samples were combined to increase power to detect regulatory variants, and this resulted in more variants classified as regulatory and fewer variants defined as having no regulatory evidence in the “remaining” class. Also, within the regulatory classes, more variants affected both gene expression and RNA splicing, resulting in the esVariant class having more variants, whereas the eVariant and sVariant classes had fewer variants (Table 1). As a result of the larger number of regulatory variants discovered, the multi-tissue analysis across 37 phenotypic traits found that, on average, 69.2% of the genetic variance was explained by regulatory variants (SD = 9.7%, 44% more than expected by the same number of random variants; Figure S2A), whereas the average of the single-tissue analyses was 25% (SD = 9.9%, 22% more than expected; Figure S2B). As the multi-tissue analysis had more than a 16-fold increase in sample size compared with each single-tissue analysis (4,725 vs. 295), our results suggest that the increased power in the multi-tissue analyses, due to the larger sample size, allowed for better estimates of the genetic effects of e-/sVariants on phenotypic traits. A full list of partitioned heritability across tissues and traits can be found in Data S3.
Including more regulatory variants in the model increased the heritability explained, with the largest proportions of heritability explained by eVariants and sVariants detected from all tissues analyzed jointly (Figure 1A). To further illustrate this, as well as the 7 classes defined by both eVariants and sVariants, we performed BayesRC analyses using 3 classes defined only by eVariants or by sVariants (Table S3). Based on e-/sVariants detected from single tissues averaged across tissues and traits, when eVariants and sVariants were analyzed separately, cis and trans eVariants explained 5.6% (SE = 0.1%) and 4.1% (SE = 0.1%) of heritability, respectively, and cis and trans sVariants explained 8.3% (SE = 0.2%) and 7.6% (SE = 0.1%) of heritability, respectively (Table S3). When eVariants and sVariants were analyzed jointly in the single-tissue scenarios, cis and trans esVariants explained 12.7% (SE = 0.1%) and 12% (SE = 0.1%) of heritability, respectively (Figure 1A; Table 1).
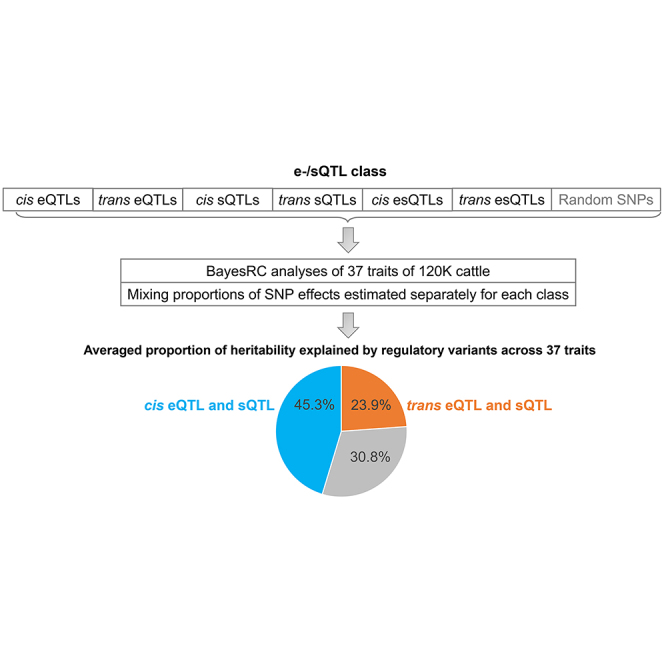
Figure 1.

Averaged proportions of genetic variance or heritability explained by regulatory variants across 37 traits
(A) Left panel: when only variants affecting gene expression (eVariants) were considered. Middle panel: when only variants affecting RNA splicing (sVariants) were considered. Right panel: eVariants and sVariants were considered jointly. Where “e” is the expected proportion of heritability explained by the genomic size, “o” is the observed proportion of heritability, and “Multi.tissue” is the regulatory variants detected from 16 tissues. Means and standard error bars across 37 traits are presented. In the right panel, multi-tissue analysis observed that, averaged across 37 traits, the largest proportion of heritability was explained by regulatory variants (total = 69.2%, cis = 45.3%, and trans = 23.9%).
(B) Enrichment of heritability across fitted classes in the joint model (6 regulatory classes). The enrichment was calculated as the difference between the observed proportion of heritability explained and the expected proportion of heritability explained from the number of variants in each class. ∗∗∗∗p of heritability < 0.0001 (difference between observed and expected across 37 traits and 16 single tissues or 1 multi-tissue, two-sided test).
Based on e-/sVariants detected from multiple tissues across traits, when eVariants and sVariants were analyzed separately, cis and trans eVariants explained 29% (SE = 1%) and 21% (SE = 0.5%) of heritability, respectively, and cis and trans sVariants explained 58% (SE = 1%) and 8% (SE = 0.4%) of heritability, respectively (Table S3). When eVariants and sVariants were analyzed jointly in the multi-tissue scenarios, cis and trans esVariants explained 45.3% (SE = 0.5%) and 23.9% (SE = 0.3%) of heritability, respectively (Figure 1A; Table 1; Data S3).
As a check on the BayesRC method, we also analyzed the same data using the GCTA implementation of REML to partition the genetic variance in the 37 complex traits into that caused by multi-tissue cis and trans e-/sVariants and non-regulatory variants (see STAR Methods). Consistent with BayesRC results, averaged across 37 traits, GREML analyses showed that multi-tissue cis e-/sVariants explained 62% (SE = 2%) of heritability and that multi-tissue trans e-/sVariants explained 23% (SE = 2%) of heritability (Figure S3). We also implemented and tested LD score regression (LDSC)20 in estimating heritability in cattle (STAR Methods; Table S4). LDSC-estimated heritability for known heritable cattle traits such as milk yield16,21,22 was close to 0 or negative. Using the same data, GREML- or BayesR-estimated heritability of these traits ranged from 0.4 to 0.72. Therefore, LDSC was not used to partition heritability in the current study.
By ranking classes of variants based on the difference between the observed and expected proportion of heritability explained (Figure 1B), multi-tissue cis sVariants and cis esVariants explained the most additional variance. Multi-tissue trans eVariants, sVariants, and esVariants also explained more heritability than expected from the number of variants in each class. At the single-tissue level, cis and trans sVariants had the greatest additional variance explained. In additional analyses, e-/sVariants under at least two chromatin immunoprecipitation sequencing (ChIP-seq) peaks10,23,24 (regardless of histone post-translational modification type) explained more heritability than expected but not necessarily more than e-/sVariants outside of peaks (Figure S4). Analysis of histone post-translational modifications with ChIP-seq data may achieve different results given that some of these sites likely are activators, and others repressors, of gene expression.
BayesRC estimated the number of trait-associated variants, i.e., trait QTLs, with small, medium, and large effects within each regulatory class. We then compared the proportion of variants within each class that fell into the small-, medium-, and large-effect trait QTL distributions. By comparing each regulatory class with the remaining class (no regulatory evidence), we estimated the additional proportion of trait QTLs in each class above that expected by the number of variants of that class (Figure 2A). Overall, the enrichment of trait QTLs in e-/sVariants was similar across different effect-size groups. Across analyzed traits, multi-tissue cis eVariants had the greatest additional proportion of trait QTLs above what was expected. Driven by the relatively small number of variants identified (e.g., Table 1), trans e-/sVariants also had a high additional proportion of trait QTLs above expected in both single-tissue and multi-tissue analyses.
Figure 2.

Amount of trait-associated variants (trait QTLs) that were also variants affecting gene expression (eVariants), splicing (sVariants), or both (esVariants)
(A) For each class, the difference between the observed proportion (or concentration) of trait QTLs and the expected proportion of trait QTLs by genome size in the BayesRC analysis is the additional proportion of trait QTLs included. ∗∗∗∗p of heritability enrichment < 0.0001 (difference between observed and expected across 37 traits and 16 single tissues or 1 multi-tissue, two-sided test).
(B) The enrichment of trait QTLs in regulatory variants was determined as the difference (t value) of variant effects in GWASs between a set of e-/sVariants and a set of random variants with matched LD and MAF to the e-/sVariant set. The blue dashed line indicates t = log(2), which is equivalent to the p value threshold of 0.05. Each violin bar represents the results across 37 traits. Conditional.GWAS, GWAS results conditioned on the top-2 trait QTLs per chromosome from the results of the ordinary GWAS; Ordinary.GWAS, no top trait QTLs fitted.
Verification of heritability explained by e-/sVariants
To verify our results, we re-classified 1.8 million variants where regulatory variants and variants conserved across 100 vertebrates16 were fitted together and used this file to re-analyze 37 traits (STAR Methods). The results show that although conserved variants were significantly enriched with respect to heritability, cis-e-/sVariants still explained the largest proportion of heritability and had the strongest enrichment (Table S5). We also analyzed regulatory variants with coding variants annotated by Ensembl VEP25 (STAR Methods; Table S6). Coding variants and regulatory variants were both significantly enriched with heritability, and those coding variants that also had cis-regulatory function showed the strongest enrichment of heritability (Table S7). In total, 8,125 coding variants accounting for 0.4% of variants analyzed explained 6.6% heritability. This is comparable to previous estimates in humans.20,26,27,28 As there were a small number of coding variants, regulatory variants still explained the majority of heritability across traits (Table S7).
It is possible that the classes of regulatory variants differ in minor allele frequency (MAF) or LD and that this explains the enrichment of trait QTLs and genetic variance within regulatory classes. To test this possibility, we implemented a MAF-LD matched enrichment test (see STAR Methods) using GWAS results of 37 traits on 16 million sequence variants.12 For each class of regulatory variants, e.g., cis eQTLs, we sampled a random set of variants (repeated 1,000 times) with matched MAF and LD, and then we compared the GWAS effects between the set of regulatory variants and the set of random variants with matched MAF and LD. To ensure that the results are not driven by a few large-effect trait QTLs, we carried out another set of GWASs of the 37 traits conditional on the effects of the top 2 variants per chromosome at least 1 Mb apart (i.e., we fitted the top 2 variants per chromosome in the statistical model as fixed effects; see STAR Methods). We then applied the MAF-LD matched enrichment test to the conditional GWAS. As shown in Figure 2B, across traits and tissues, both proximal and distal regulatory variants were significantly enriched with trait QTLs compared with random variants with matched MAF and LD using both the original and conditional GWASs. The strongest enrichment of trait QTLs was found in e-/sVariants from multiple tissues. We further tested these MAF-LD tests using coloc,29 and these results also support the enrichment of e-/sVariants above LD-MAF matched random variants (Figure S5). Therefore, these results confirmed that the enrichment of trait QTLs in regulatory variants was not driven by MAF or LD.
We next examined whether the contribution of regulatory variants to trait heritability was consistent between different populations and could be reproduced using different datasets. As there are 37 phenotypic records on both 110,000 cows and (daughter records of) 9,000 bulls, we conducted BayesRC, fitting the 7 classes of regulatory variants separately in bulls and cows to check the variability of the enrichment of heritability between different cattle datasets. As the bulls and cows have different phenotypic variances and low genetic relationships due to different LD structures, results from one population can be validated using the other population.30,31 We found that the Pearson correlation of partitioned heritability across 6 regulatory classes from different tissues for 37 traits was 0.87, with the correlation from single and multiple tissues being 0.87 and 0.77, respectively (Figure 3A). Higher correlations for single-tissue analysis were due to there being more estimated points (16 tissues × 37 traits.)
Figure 3.

Consistency and lipidomic analysis of heritability explained by regulatory variants
(A) A scatterplot of the heritability explained by 6 classes of regulatory variants across tissues and traits between bulls and cows. Each point represents the fraction of heritability of a trait for a class within a tissue in two sexes. Colors of lines are the regressions for heritability partitioned using multi-tissue, single-tissue, and cis- and trans-regulatory variants, respectively.
(B) The proportion of heritability explained by multi-tissue regulatory variants above that expected by genomic size averaged across 56 lipidomic traits and different classes. ∗∗∗∗p of heritability enrichment < 0.0001 (difference between observed and expected across 56 lipidomic traits and 16 single tissues or 1 multi-tissue, two-sided test).
To further verify the large proportion of heritability explained by regulatory variants, we used multi-tissue e-/sVariants to define classes for BayesRC to partition heritability in 56 polar lipid traits assayed by liquid chromatography-mass spectrometry (LCMS) on 320 cattle (see STAR Methods and Table S8). Across these 56 traits, on average, cis and trans e-/sVariants together explained 71.5% (SE = 0.3%) of the heritability, 36.6% (SE = 0.6%) more than expected if the regulatory variants explained as much genetic variance per variant as the variants that are neither eVariants nor sVariants (Figures 3B and S6; Data S4). Both cis and trans e-/sVariants contribute substantially to the heritability of polar lipids (Figure 3B). A full list of partitioned heritability for the polar lipid phenotypes can be found in Data S4.
Examples of trait QTLs as e-/sVariants
In Figure 4, we provide examples where cis- or trans-regulatory variants significantly affect complex traits and are also supported by external functional information. We considered variants with previously defined posterior inclusion probability (PIP) >0.25 as potentially causal.4 For instance, we highlight a cis eVariant from blood at chr15:42,044,576 (rs137255300) that affected both the birth size and the concentration of lactosylceramide in the milk of cattle (Figure 4A, left and middle panels). Chr15:42,044,576 is a missense mutation25 for IRAG1 and is conserved across 100 vertebrates (PhastCon score = 0.999), but this mutation also affects the expression of CTR9 (Figure 4A, right panel), which is a transcription factor. Another example is a multi-tissue trans eVariant (chr5:105,773,809, rs109676906), which significantly affects cattle height (Figure 4B). This single mutation explained ∼0.6% of the phenotypic variance of stature in 133,306 cattle across more than 19 populations/breeds.11,32 A list of cis and trans e-/sVariants affecting different complex and lipidomic traits with their functional annotation is provided in Data S5.
Figure 4.

Examples of cis and trans eVariant-affecting complex traits
(A) A candidate causal mutation (chr15:42,044,576, rs137255300) within IRAG1 for birth size (left panel, n = 103,350) and the concentration of lactosylceramide (middle panel, n = 320) is a cis eVariant for CTR9 in blood (right panel, n = 945). Chr15:42,044,576 is also a missense mutation for IRAG1 at a site conserved across 100 vertebrates. The y axis of the left and the middle panels are the posterior inclusion probability (PIP) of BayesRC and the y axis of the right panel is the −log10(p) of eVariant mapping in blood.
(B) A candidate causal mutation (chr5:105,773,809, rs109676906) within Cyclin D2 (CCND2) for stature (black point in left and middle panels) is a trans eVariant across multiple genes and tissues (right panel). Chr5:105,773,809 is also a lead variant in a meta-GWAS of cattle stature across 18 (excluding the current study) global populations32 The y axis of the left panel is the PIP of BayesRC and the y axis of the middle panel is the −log10(p) of meta-analysis GWAS of 120,097 Australian and New Zealand cattle. The right panel is the heatmap of effects of the trans eVariant on the expression of genes averaged within each tissue, where “mean t” is the average t value across genes for each tissue and “mean |t|” is the geometric mean of the magnitude of t values across genes for each tissue.
Discussion
Our analysis of large datasets in cattle demonstrates that both cis- and trans-regulatory variants significantly contribute to variation in complex traits. Such contribution is not due to the LD or MAF of regulatory variants, and it increases when more regulatory variants of different types (e.g., eVariants and sVariants) and a large number of tissues are included in the analysis. When cis and trans eVariants and sVariants from multiple tissues are jointly analyzed, on average, they accumulatively explain the majority of heritability across 37 analyzed phenotypic traits (mean = 69.2% with SE = 0.5% and SD = 9.7%; Figures 1A and S2; Data S3). Therefore, we expect that as more regulatory variants are discovered from more assays, tissues, and individuals, they will explain an even larger proportion of the heritability of complex traits. We also analyzed regulatory variants with conserved and with coding variants (Tables S6–S8). Although we found that all 3 categories are significantly enriched in heritability, regulatory variants still explained the majority of heritability due to the large number. However, we observed that coding variants with cis-regulatory roles had strong heritability enrichment. This new observation points to the existence of important mutations that could affect both protein coding and the expression of nearby genes. In humans, protein-coding variants affecting skin diseases via their effects on gene expression have been reported.33
The e-/sVariants are identified by association analysis, and we used all possible knowledge to adjust confounders, although it is impossible to remove all unwanted factors including cellular compositions in the RNA-seq data. However, we mapped e-/sVariants in CattleGTEx data and used them to partition trait heritability in another independent 100,000 cows. Such analysis externally validated results from e-/sQTLs mapping. That is, if e-/sVariants explain a significant amount of trait heritability in an independent dataset, most of them must have biological significance.
Although in the best scenario, e-/sVariants from multi-tissue analyses explained 69.2% of heritability as an average across 37 traits (Figure S2A), e-/sVariants from single-tissue analyses with a much smaller sample size compared with multi-tissue analysis (295 vs. 4,725) only explained 25% heritability on average across 37 traits (Figure S2B). This is comparable with what was reported in recent human studies.13,14 Also, compared with the previous cattle study,16 where cis eVariants contributed ∼15% of heritability, the current study increased the sample sizes for the mapping of e-/sVariants by up to 20-fold (n = ∼205 vs. n = ∼4,725). The current study also increased the sample size of the mapping of complex traits by 2.5-fold, which increases the power of the BayesRC analysis. Therefore, our study, along with others, highlights the importance of sample size in the mapping of e-/sVariants and the detection of their overlap with trait QTLs.
Our analysis supporting the direct role of regulatory variants in shaping complex traits has several differences from previous studies, which may have led to our conclusions. One obvious distinction is that cattle are a different species from humans, although previous studies showed high similarities in genomic features between these two species.32,34
The second distinction of our study is that when analyzing variant-trait associations, we used Bayesian methods. Our BayesRC4 analysis used raw data that fit all variants simultaneously, while most human studies use GWASs or summary statistics of GWASs (e.g., Yao et al.13), which associate one variant at a time with the phenotype. BayesRC4 selects the variants to include in the model and estimates their effects jointly. It also allows the distribution of effects to vary between classes and fits the different class annotations jointly in the model. When similar Bayesian methods were used in human datasets,35,36 they showed better performances in training genomic predictors than using GWAS results. However, these Bayesian analyses did not fit different distributions of variant effect to different classes of regulatory variants. In addition, raw data are more powerful than summary statistics, when they are available.
The third distinction is that we jointly modeled multiple categories of regulatory variants, including eVariants and sVariants from multiple tissues. Although sVariants were first discovered to be important to complex traits in humans,7 they have not always been analyzed together with eVariants in human studies of the phenotypic effects of regulatory variants.13,14,37,38 The current study observed that at the same p value threshold, more sVariants (3 times more in single-tissue analysis) were called than eVariants, and therefore, they alone or in combination with eVariants explained more heritability than eVariants alone. In fact, multi-tissue sVariants alone explained a similarly large proportion (66%; Figure 1A) of heritability to the proportion of heritability explained jointly by eVariants and sVariants (69.2%; Figure 1A). This again validates the important role of sVariants in shaping mammalian complex traits.
The fourth difference between this study and most others is that we included trans eVariants and sVariants, whereas most only included cis. In the human GTEx analysis,39 only a few trans eVariants were identified, and this may have limited their use in the downstream analysis. Due to the small effect size, trans eVariant mapping requires a large sample size, but the accumulated phenotypic effects of them may be more estimable. The CattleGTEx had different individuals per tissue, which means the total sample size approaches 5,000 in the multi-tissue analysis. Discovered from the CattleGTEx population and tested in the Australian cattle population, on average across 37 traits, single-tissue trans e-/sVariants explained 12% of heritability and multi-tissue trans e-/sVariants explained 24% of heritability (Figure 1A). These findings demonstrate the important role of distal regulatory variants in shaping complex traits.
To further validate the contribution of regulatory variants to phenotypes, we applied the same BayesRC methods fitting the multi-tissue e-/sVariant data as biological priors to a set of polar lipid phenotypes. These traits, where large effect trait QTLs exist, are genetically simpler than traits like milk production or body size.16,40 We found that, on average across 56 polar lipid phenotypes, 71.5% of heritability could be explained by both cis- and trans-regulatory variants (Figure S6). Among analyzed lipid and phenotypic traits, we highlighted an example where cis eVariant chr15:42,044,576 (rs137255300) affected both the birth size and the concentration of lactosylceramide in milk (Figure 4A). Its causal candidacy for these two traits is supported by external functional annotation, as it is also a missense mutation and a conserved site across 100 vertebrates. It is worth noting that chr15:42,044,576 is a missense mutation for IRAG1 but that it affected the expression of the nearby transcription factor gene CTR9, which appears to show bystander effects like FTO.30,41 This implies complex consequences of large-effect mutations on both activities of protein coding and transcription and that some coding variants can also impact gene expression. Also, CTR9 has been implicated in embryonic organogenesis and the maintenance of embryonic stem cell pluripotency.42 This appears to be consistent with its effects on birth size observed in the current study. We also highlight a multi-tissue trans eVariant chr5:105,773,809 (rs109676906) within CCND2 affecting cattle stature. This mutation is not at a conserved site but had a large and replicable effect on stature in ∼200,000 cattle across 19 populations across the globe.32 Its effect on gene expression in different tissues tended to have different directions (Figure 4B), which is consistent with the expectation of effect patterns of trans eQTLs.5 The relatively strong effects of this trans eVariant on brain and muscle tissues appear to support its role in regulating body size. In addition, some regulatory variants/regions defined by us could directly act on metabolites and/or protein expression, which will require further investigations.
Taken together, using cattle as a model, we demonstrate the significant and direct role of cis- and trans-regulatory variants in shaping mammalian complex traits. Our findings suggest that many trait QTLs have an impact on the regulation of transcription. Therefore, with proper analysis and sufficient power, regulatory variants not only provide etiology behind the genome-to-phenome relationship but also are a powerful resource to directly map causal variants for mammalian complex traits.
Limitations of the study
In the current study, we are not able to include structural variants, and their contribution to cattle trait heritability will require further investigation. The ongoing work of improved annotation of the bovine genome and functional elements may also improve our understanding of the trait heritability explained by regulatory variants in cattle.
STAR★Methods
Key resources table
Resource availability
Lead contact
Further information and requests for resources and reagents should be directed to and will be fulfilled by the lead contact, Ruidong Xiang (ruidong.xiang@unimelb.edu.au).
Materials availability
This study did not generate new unique reagents.
Method details
RNA-seq data
The RNA-seq and genotype data analyzed included those generated by Agriculture Victoria Research (AVR) in Victoria, Australia, and those provided by the CattleGTEx consortium8 (Table S1). Blood samples were taken from 390 lactating cows from 2 breeds, and milk samples from 281 lactating cows from 2 breeds as approved by DJPR Animal Ethics Committee (application numbers 2013-14 and 2018–2019), Australia. As lactation is the most important physiological state for dairy traits all animals were lactating and ranged from 1 to 369 days in milk (DIM). Breed and DIM were fitted as categorical and quantitative fixed effects respectively (described below). The processing of samples, RNA extractions, and library preparation followed that previously described.46,47 RNA sequencing (RNA-seq) was performed on a HiSeq3000 (Illumina Inc) or NovaSeq6000 (Illumina Inc) genome analyzer in a paired-end, 150-cycle run. Only RNA-seq data of 356 Holstein and 26 Jersey with >50 million reads for milk cells or >25 million reads for white blood cells and had concordant alignment rate48 > 80% were used. QualityTrim (https://bitbucket.org/arobinson/qualitytrim) was used to trim and filter poor-quality bases and sequence reads. Adaptor sequences and bases with a quality score of <20 were removed. Reads with a mean quality score less than 20, greater than 3 N, greater than three consecutive bases with a quality score less than 15, or a final length of fewer than 50 bases were discarded. High-quality raw reads were aligned to the ARS-UCD1.2 bovine genome49 with STAR48 using the 2-pass method. The gene counts were extracted by FeatureCount.50 Leafcutter51 was used to generate junction files which were then used to create the RNA splicing phenotype matrix, i.e., intron excision ratio.51
The RNA-seq gene counts of 15 tissues (Table S1) with sample size >100 were downloaded from CattleGTEx website http://cgtex.roslin.ed.ac.uk/. The blood counts generated by AVR and CattleGTEx were combined. We used PCA52 plot to check the blood transcriptome data and we found no evidence of batch effects between AVR and Cattle GTEx blood samples (Figure S7). All gene counts were normalised by voom53 and then underwent quantile normalisation for the following analyses. Junction files from CattleGTEx tissues were also downloaded and data from each tissue was processed by leafcutter51 to generate RNA splicing phenotype. Milk cell data used in this study was only from AVR.
Genotype data
The genotype data for Australian animals including those used for e/sQTLs mapping (blood and milk cells) and association analysis of phenotypes (described later) were 16,251,453 sequence variants imputed using Run7 of the 1000 Bull Genomes Project.54,55 The details of the imputation were described previously.12 Briefly, the imputation of biallelic sequence variants was performed with Minimac356,57 and those variants with imputation accuracy R2 > 0.4 and minor allele frequency (MAF) > 0.005 in both bulls and cows were kept. Bulls were genotyped with either a medium-density SNP array (50K: BovineSNP50 Beadchip, Illumina Inc) or a high-density SNP array (HD: BovineHD BeadChip, Illumina Inc) and cows were genotyped with the BovineSNP50 Beadchip (Illumina Inc). The genotype data for CattleGTEx animals were generated previously8 and included a total of more than 6 million sequence variants imputed also using Run7 of the 1000 Bull Genomes Project. Because the CattleGTEx used RNA-seq-called variants for imputation, a more stringent imputation threshold R-square (>0.8) was chosen by pilot paper.8 As same as described above, the variants with MAF >0.005 were kept.
Phenotype data
Data was collected by farmers and processed by DataGene Australia (http://www.datagene.com.au/) for the official May 2020 release of National breeding values. No live animal experimentation was required. DataGene provided the bull and cow phenotypes as de-regressed breeding values or trait deviations for cows, and daughter trait deviations for bulls (i.e., progeny test data for bulls). DataGene corrected the phenotypes for herd, year, season and lactation following the procedures used for routine genetic evaluations in Australian dairy cattle. Phenotype data included a total of 8,949 bulls and 103,350 cows, including Holstein (6,886♂/87,003♀), Jersey (1562♂/13,353♀), cross-breed (36♂/5,037♀) and Australian Red (265♂/3,379♀) dairy breeds. In total, 37 traits were studied that related to milk production, mastitis, fertility, temperament and body conformation and the details of these traits can be found in.12
Mapping and selection of eQTLs and sQTLs
A GWAS approach that fits random effects of a relationship matrix3 can control false correlations and that was used in the current study to map eQTLs and sQTLs in each tissue one variant at a time:
| (Equation 1) |
where is an n × 1 vector of omics values such as gene expression or RNA splicing, was the design matrix allocating phenotypes to fixed effects; is a vector of fixed effects like breeds, different experiments, PCs of population structure, or PEER58 factors derived by the CattleGTEx consortium,8 Z is a matrix allocating records to individuals; is an n × 1 vector of the total genetic effects of the individuals with g ∼ N(0, ) where is the genomic relationship matrix (GRM) built by all the variants (GCTA or VanRaden’s method or --make-grm-alg 0); is the design matrix of variant genotypes (0, 1, 2) and is the variant additive effect; e is the error term. For AVR blood samples breed and days in milk (DIM) were fitted as fixed effects in the model. For the milk samples, experiment, DIM and the first and second principal components, extracted from the expression count matrix, were fitted as fixed effects. This aimed at adjusting the high expression of casein genes in milk cells based on previous experiences.46 The nature of dataset dictates that we cannot fully remove and/or adjust all unwanted effects, including different cellular compositions in the RNA-seq data.
cis e/sQTLs were defined as those variants within ±1Mb of the transcription start site of a gene or down/upstream of an intron with p < 5e-6 in GWAS. This threshold resulted in, on average across tissues, the false discovery rate (FDR) was 0.0158(6e-5) for eQTLs mapping and 0.0164(2e-5) for sQTLs mapping (see Equation 2 described in the following). Trans e/sQTLs were defined as those not on the same chromosome of the gene expression or splicing feature with p < 5e-6 in GWAS. Only the top 3 trans e/sQTLs per chromosome were selected. This is because previous studies of CattleGTEx6,8 showed on average, there were 3 causal mutations per locus. In addition, we impose (FDR):
| (Equation 2) |
where is the GWAS p value cutoff, e.g., 5e-6, is the proportion of variants significant given the GWAS p value cutoff to the total number of variants analyzed. If ≥ 0.05 for a feature, no trans e/sQTLs were selected. Also, those e/sQTLs under at least two ChIP-seq peaks identified from multiple studies10,23,24 targeting multiple histone post-translational modifications were used in the Bayesian analysis described below. We did not consider trans e/sQTLs on the same chromosome as the gene/intron. Small effective population size has caused long-range LD in cattle so that variants >1 Mb from a gene may be in LD with cis acting regulatory variants. Also, in both human6 and Cattle GTEx,8 trans e/sQTLs were defined as those on different chromosomes than the gene/intron. Imposing additional FDR on mapping trans e/sQTLs provided greater stringency in mapping trans e/sQTLs reducing the chance of false positives to ensure higher probability of replication in future studies.
Our method used a linear mixed model to map e/sQTLs while others (e.g.,6,8) used permutation methods such as FastQTL.45 While FastQTL is powerful, most CattleGTEx samples are from the public domain with cryptic relationships. Therefore, we prefer to fit a relationship matrix (GRM) as a random effect to account for these relationships. FastQTL does not allow random effects. As a verification, we compared our results with FastQTL e/sQTLs mapping results generated by CattleGTEx. Using the π159 as the measure of agreement, we found that more than 92% (average π1 > 0.95 for eQTLs and average π1 > 0.92 for sQTLs) of e/sVariants identified by our analysis were replicated in results generated using FastQTL CattleGTEx (Figure S8). Therefore, there was strong agreement between the two results. There are also other software to conduct sQTLs mapping based on transcripts instead of introns, such as sQTLseekeR260 and THISTLE.61 However, since the transcripts in the cattle reference genome are not as well-annotated as in humans, we chose leafcutter, which does not rely on the genome annotation, for the current study.
Meta-analysis of e/sVariants
Because data from different tissues of CattleGTEx were from different individuals, combining results from each tissue can increase the chance of detecting causal regulatory variants. The human GTEx5,6 showed that cis e/sVariants to a large extent showed consistent effects across tissues. Although, the ranking of the effects of the same variant across tissues may be different. For trans e/sVariants, it is not expected that their effects will be consistent across tissues. Considering these factors, we implemented the following 2 formulae in meta-analyses of e/sVariants:
| (Equation 3) |
| (Equation 4) |
In Equation 3, it is assumed that the effects of a variant across genes and tissues were largely consistent; the chi-square is based on the mean of the t value (/se) of variants where was the estimated SNP effects and se is the standard error from mixed linear regression (Equation 1); is the mean of the t-value of a variant across all genes that it affected across all tissues the effects were measured; is the number of genes and tissues where the effect of this variant was estimated; was tested against a chi-square distribution with 1 degree of freedom. In Equation 4, it is not assumed that the effects of a variant across genes and tissues were largely consistent; the chi-square is based on the sum of the square of t values of variants across all genes and tissues; was tested against a chi-square distribution with degree of freedom. For cis e/sQTLs, both and were calculated and variants with a p < 5e-8 for either or were called significant. For trans e/sQTLs, variants with p < 5e-8 for and effects estimated in at least two tissues were called significant.
As a verification, we used the established method Meta-Tissue.62 All single-tissue eVariant and sVariant results used for the above analysis were re-analysed by Meta-Tissue using default settings. Using the π159 as the measure of agreement, we found that more than 99% (π1 > 0.99) of e/sVariants identified by our meta-analysis were replicated in results generated by Meta-Tissue.
BayesRC using cis and trans e/sVariants
BayesRC4 extends the classic BayesR algorithm17,18 to incorporate independent classes of variants (‘c’) to model informative biological priors. Similar to the classic BayesR, BayesRC models the prior of variant effects which is a mixture distribution of four normal distributions including a null distribution, zero-effect [], and three others: small-effect [], medium-effect [] and large-effect [], where is the additive genetic variance for the trait. The BayesRC4 model used here for association analysis of phenotypes was:
| (Equation 5) |
where was the vector of corrected phenotypes for a given trait, was the design matrix of marker genotypes; centered and standardised to have a unit variance; was the vector of variant effects; was the design matrix allocating phenotypes to fixed effects; was the vector of fixed effects of breeds. BayesRC was conducted for 37 traits on cows and bulls separately (Table S2). Separation analysis of cows and bulls was required due to the different variances in the phenotypes of bulls (smaller variance) and cows (larger variance). This difference cannot be simply adjusted for by fitting a sex effect. Also, separating the analysis provides validation which has been routine in animal analyses (e.g.,63). As a result of 50,000 iterations with 25,000 burn-ins of Markov chain Monte Carlo (MCMC), the effect for each variant jointly estimated with other variants was obtained. This mixture of distributions is modeled independently in each class of variants to allow for different mixture models per class (‘c’).
To better understand the contribution of regulatory variants to complex traits, we used different classifications to jointly or separately model eVariants and/or sVariants. When eVariants and sVariants were modeled jointly, 7 classes of variants were created (Data S1) with the 7th class being the remaining variants neither eVariants nor sVariants. When eVariants and sVariants were modeled separately, 3 classes of variants were created for eVariants and sVariants separately and the 3rd class was the remaining variants neither eVariants nor sVariants. Such classification, i.e., one 7-category classification and two 3-category classifications (eVariants and sVariants separately) was created for e/sVariants mapping at both the single-tissue and multi-tissue levels. When creating these classes, variants detected as both cis e/sVariants and trans e/sVariants were set to cis e/sVariants. For better computational efficiency, we LD pruned (r2 < 0.9) those 16 million variants using plink43 and used the resultant 1,882,504 variants for BayesRC. We also considered e/sVariants under ≥ 2 ChIP-seq peaks from multiple studies10,23,24 targeting multiple histone post-translational modifications. When ChIP-seq peaks were considered, 13 classes were created (Figure S4) and these classes were analyzed in BayesRC as described above.
Partitioning heritability across functional classes
MCMC in BayesRC estimated additive genetic variance (Va) based on sequence variants and the total error variance (Ve) and this can be used to calculate the heritability of each trait
| (Equation 6) |
Results from BayesRC from cows and bulls were analyzed separately and the average of the two estimates was presented. MCMC in BayesRC also estimated the number of variants in each class (e.g., cis eVariants, trans eVariants) that fell into the 4 distributions of effects: zero-effect [], small-effect [], medium-effect [] and large-effect [], where was the additive genetic variance for the trait. This can be used to partition Va and thus, , into each class:
| (Equation 7) |
where was the number of small-effect variants in class i (e.g., cis eQTLs), was the number of medium-effect variants in cis e/sQTLs and was the number of large-effect variants in cis e/sQTLs. Then for each class, we used Equation 6 to calculate for each class (), and then the proportion of explained by each class as:
| (Equation 8) |
where was the total number of classes fitted in the model.
We derive an expected , or using the and the proportion of variants for the remaining class (variants were neither eQTLs nor sQTLs):
| (Equation 9) |
where was the proportion of heritability explained by the class of remaining variants, was the proportion of the class of remaining variants to the total number of variants analyzed and was the proportion of the class i of variants (e.g., cis eQTLs) to the total number of variants analyzed. When was derived, can be used to estimate the amount of heritability explained by each class as a deviation from that expected by the size of class i. The significance of enrichment was determined by a t-test with the null hypothesis that = 0, i.e., across all analyzed traits, the mean difference between the observed and expected proportion of heritability explained is 0. Alternatively, can be derived using all variants, i.e., and the enrichment of heritability would be (Equation 9a) which was used previously.20 We applied this formula to our data and found that the heritability enrichment estimated by Equation 9a had a correlation (rho) of 0.98 with the heritability enrichment estimated by Equation 9 (Figure S9A). There were hardly any differences in the heritability enrichment between the two methods per each regulatory class (Figure S9B). However, when using Equation 9a to derive the enrichment, the remaining class had negative values (Figure S9B). To increase the interpretability of the enrichment results, we used Equation 9 to estimate the heritability enrichment in the manuscript.
Applying the same mechanism as above, we estimated the expected proportion of trait-associated variants (QTLs) for each class:
| (Equation 10) |
where was the proportion of trait QTLs in the class of remaining variants. Then can be used to estimate the proportion of trait QTLs included in each class as a deviation from that expected by the size of class i.
Partitioning heritability using REML
To verify the results obtained from BayesRC, we conducted additional analyses using gREML implemented in GCTA.3 We implemented a 3-GRM model where the 1st GRM was built using multi-tissue cis e/sVariants (variants that were either significant cis eVariant or cis sVariant in the 16-tissue meta-analysis), the 2nd GRM was built using multi-tissue trans e/sVariants and the 3rd GRM was built using the remaining variants (no regulatory evidence). We then fitted the 3 GRMs jointly in the linear mixed model to partition heritability across 37 traits of 100k cows (Figure S3).
LD score regression (LDSC)
The python package was downloaded from https://github.com/bulik/ldsc and installed. The reference panel data used Holstein and Jersey cattle from the 1000 Bull Genome2 (N = 935) which represent the majority of the cattle breeds in the current study. Those 1.8 million variants used in the current study were used with LDSC. ldsc.py --l2 function was used to estimate LD score using the recommended setting.20 munge_sumstats.py was used to organise GWAS summary statistics for cattle milk traits12 known for their high heritability.16,21,22 These LD scores and GWAS summary stats were used to estimate the heritability of milk traits using the function ldsc.py --h2 with default settings. As a comparison, the same variants and phenotypes were analyzed by BayesR64 and GCTA-GREML3 to estimate heritability (Table S4). GCTA-GREML used a genomic relationship matrix made of those 1.8 million variants and this relationship matrix was also used for a birariate analysis (--reml-bivar) for genetic correlation between pairs of 37 traits (Data S2 and Figure S1).
Comparing regulatory variants with conserved variants in BayesRC
We constructed a new class file fitting regulatory variants (e/sVariants) and conserved variants (PhastCon score >0.9) together. The variants conserved 100 vertebrates were obtained from a previous study.16 The regulatory variants were based on the variants identified as either eQTLs or sQTLs across all tissues (significant in meta-analysis). In classifying 1.8 million variants analyzed, there were 6 groups: 1. cis-regulatory variants (cis e/sQTLs, 1,092,791 variants); 2) cis-regulatory variants that are also conserved across 100 vertebrates (28,735 variants); 3) trans-regulatory variants (trans e/sQTLs, 40,783 variants); 4) trans-regulatory and conserved variants (849 variants); 5) conserved variants (no overlaps with regulatory variants, 16894 variants), and the remaining variants (702,452 variants). Then, analyses of BayesRC (Equation 5) and partitioning genetic variance (Equations 7, 8, 9, and 10) were conducted (Table S5).
Comparing regulatory variants with coding variants in BayesRC
We used Ensemble Variant Effect Predictor (VEP)25 to annotate analyzed variants and identified 8,125 variants related to coding (Table S6). We then used these 8,125 variants together with identified regulatory variants to classify 1.8 million variants analyzed: 1. cis-regulatory variants (cis e/sQTLs, 1,115,975 variants); 2) cis-regulatory variants that were annotated as coding variants (5,551 variants); 3) trans-regulatory variants (trans e/sQTLs, 41,609 variants); 4) trans-regulatory that were annotated as coding variants (23 variants); 5) coding variants that were not regulatory (2,551 variants), and the remaining variants (716,795 variants). Then, analyses of BayesRC (Equation 5) and partitioning genetic variance (Equations 7, 8, 9, and 10) were conducted (Table S7).
MAF-LD matched enrichment test
Using the Australian cattle genotype data the 16 million sequence variants were first divided into 20 bins using LD score (50kb window size) calculated using GCTA.3 Within each of these LD bins, we then divided variants into 20 bins of MAF. This divided the 16 million variants into 400 LD-MAF bins. Then, for a given set of regulatory variants, e.g., cis eVariants from blood, we laid them over 400 LD-MAF bins to identify LD-MAF bins associated with this set of regulatory variants and the number of regulatory variants falling into each bin (). Within each of these LD-MAF bins associated with the regulatory variants, we sampled a random set of variants. This random sampling was repeated 1000 times. For the set of regulatory variants, we used the significance from the GWAS and conditional GWAS (detailed in the next paragraph), i.e., -log(GWAS p), to indicate the effect size which was averaged across all regulatory variants. Then, for each of 1000 sets of LD-MAF matched random variants, the average -log(GWAS p) was also calculated. We then used a t-test to quantify the difference of between regulatory variants and LD-MAF matched random variants, where we used the t value to indicate the enrichment of GWAS hits in regulatory variants compared to that expected by random variants with matched LD and MAF.
We also implemented the LD-MAF enrichment test using coloc29 and a Wilcoxon signed-rank test (Figure S5). For coloc we applied the pipeline implemented by the CattleGTEx.8 Briefly, for a trait, variants with GWAS p value <10−5 were used and for regulatory variants, we used multi-tissue significant e/sVariants. coloc.abf function was used and variants with the PP.H4 (posterior probability of colocalization) > 0.8 were determined as colocalised. Then the proportion of colocalised variants was the number of them divided by the total number of variants analyzed. This proportion of colocalised variants was estimated for real e/sVariants and was also carried out for 1000 sets of random variants with matched MAF and LD to targeted e/sVariants. The one proportion for colocalised real e/sVariants and the 1000 proportions of colocalised random variants were compared using wilcox.test() in R. The colocalization between eQTLs and sQTLs and their fine-mapping were analyzed in Liu et al.8
GWAS and conditional GWAS were used for the enrichment test
The original GWAS of 37 traits in cows had been conducted previously.12 Briefly, the following linear mixed model analysing each variant one at a time was used:
| (Equation 11) |
where y = vector of phenotypes for bulls or cows, = four breeds for cows (Holstein, Jersey, Australian Red and MIX); bx = regression coefficient b on variant genotypes x; a = random polygenic effects ∼ N(0, Gσg2) where G = genomic relatedness matrix based on all variants and σg2 = random polygenic variance; error = the vector of random residual effects ∼N(0, Iσe2), where I = the identity matrix and σe2 the residual variance. The construction of GRM followed the default setting (--make-grm) in GCTA.3
The above-described MAF-LD matched enrichment test used both the original and conditional GWAS. The purpose of using conditional GWAS to conduct the enrichment test was to make sure that the enrichment was not driven by a few large-effect trait QTLs on each chromosome. We first selected the top 2 variants based on the p value of the original GWAS on each chromosome which were at least 1Mb apart. Then we fit these ∼2 × 30 top variants in the COJO analysis implemented in GCTA65 to obtain GWAS results conditioned on these top variants for 37 traits. Then the MAF-LD matched enrichment test was applied to the results of conditional GWAS of 37 traits.
Polar lipid mQTLs
We previously developed metabolomics techniques for bovine milk.40,66,67 Therefore, we used these relatively novel traits in cattle to study and validate the phenotypic effects of regulatory variants. The discovery of milk fat polar lipid QTLs (mQTLs) was based on the mass spectrometry quantified concentration of 59 polar lipids in milk from 338 Holstein cows (Table S8). The bovine milk was collected as described previously46 and polar lipids were extracted from bovine milk following the previously developed protocols.67 The chromatographic separation of polar lipids used a Luna HILIC column (250 × 4.6 mm, 5 μm, Phenomenex) maintained at 30°C. The lipids were detected by the LTQ-Orbitrap mass spectrometer (Thermo Scientific) operated in electrospray ionization positive (for most polar lipid classes) or negative (for analysis of PI) Fourier transform mode. The identification of lipid species present in milk was performed as previously reported.67 Quantification of selected polar lipid species was based on the peak area of parent ions after normalization by the internal standard. After a quality check, data from 56 lipidomic traits from 320 cows were used for further analysis.
We applied the same BayesRC model in Equation 5 to analyze each of these polar lipids, with additional fixed effects of year and batch. The biological prior for the analysis of polar lipids used the 7 classes of regulatory variants detected from multiple tissues as this set explained the largest proportion of the heritability for conventional traits. Then we applied Equations 6, 7, and 8 to partition the heritability of polar lipid traits. We raised the MAF cutoff to >0.025 in the analysis of polar lipid traits as the sample size is relatively small. The sample size for lipidomic traits was relatively small and therefore, we used GCTA-GREML3 to re-estimate heritability with standard errors. In 53 converged GREML analyses, 42 heritability estimates (79%) had significance p < 0.05 (Data S6), suggesting reasonable power in this dataset.
Conserved variants
Conserved genome sites in cattle were based on the lifted over (https://genome.ucsc.edu/cgi-bin/hgLiftOver) of human sites with PhastCon score68 >0.8 computed across 30 mammals and 100 vertebrate species. The human PhastCon data was downloaded from UCSC genome database (http://hgdownload.cse.ucsc.edu/goldenpath/hg38/phastCons30way/and http://hgdownload.cse.ucsc.edu/goldenpath/hg38/phastCons100way/). The downloaded Wiggle files were converted to bed files which were used by the LiftOver tool as input. Another input for LiftOver was the chain file between hg38 and cattle ARS-UCD1.2.
Meta-analysis of GWAS
For variants that appeared in multiple studies, we used the formula based on the inversed variance from METAL44 to conduct meta-analysis. When combined betameta and semeta were obtained we calculated the tmeta = betameta/semeta and the phenotypic variance explained by a variant was determined by the formula:
| (Equation 12) |
where where was the proportion of phenotypic variance explained by a variant, was the chi-square value of the effect of the variant which is equal to the square of t value (b/se), , of the effect of the variant from GWAS; N was the sample size of the GWAS; b was the GWAS beta of the variant and se is the standard error of b.
Quantification and statistical analysis
Details regarding statistical tests, significance thresholds, sample sizes and p value can be found in the tables and figure legends, as well as in the relevant sections above.
Acknowledgments
The Australian Research Council’s Discovery Projects (DP160101056 and DP200100499) supported R.X., M.E.G., and N.R.W. DairyBio, a joint venture project of Agriculture Victoria (Melbourne, Australia), Dairy Australia (Melbourne, Australia), and the Gardiner Foundation (Melbourne, Australia), funded computing resources used in the analysis. N.R.W. acknowledged funding from the National Health and Medical Research Council (NHMRC 1113400 and 1078901). L.F. received funding from the European Union’s Horizon 2020 research and innovation program under the Marie Skłodowska-Curie grant (agreement no. 801215). A.T. acknowledges funding from the BBSRC through program grants BBS/E/D/10002070 and BBS/E/D/30002275, MRC research grant MR/P015514/1, and HDR-UK award HDR-9004. The authors also thank the University of Melbourne, Australia, for supporting this research. No funding bodies participated in the design of the study nor the analysis, interpretation of data, or writing of the manuscript. The 1000 Bull Genomes consortium provided access to cattle sequence data, and the CattleGTEx consortium provided access to expression data. For the purpose of open access, the author has applied a CC-BY public copyright licence to any Author Accepted Manuscript version arising from this submission.
Author contributions
R.X. and M.E.G. conceived the study. R.X. carried out the main analyses with assistance from M.E.G. and E.J.B. L.F., S.L., Y.G., G.E.L., and A.T. assisted in the analysis of data from CattleGTEx. Z.L. generated the lipidomics data, and I.M.M. assisted in the analysis of the lipidomics data. B.A.M. and A.J.C. generated and assisted in the analysis of the new RNA-seq data. M.E.G. and N.R.W. oversaw the project. R.X. and M.E.G. wrote the paper. R.X., M.E.G., N.R.W., L.F., S.L., A.T., and A.J.C. revised the paper. All authors read and approved the final manuscript.
Declaration of interests
The authors declare no competing interests.
Published: August 23, 2023
Footnotes
Supplemental information can be found online at https://doi.org/10.1016/j.xgen.2023.100385.
Supplemental information
. Classification of regulatory variants based on eQTL and sQTL at the single-tissue and multi-tissue level using 1.8 million genome-wide pruned variants (LD-r2 < 0.9) in Australian cattle, related to STAR Methods
The category of esQTL had 7 classes of variants fitting cis and trans eQTL and sQTL together at the single-tissue and multi-tissue levels. The category of eQTL had 3 classes of variants only fitting cis and trans eQTL at the single-tissue and multi-tissue levels. The category of sQTL had 3 classes of variants only fitting cis and trans sQTL at the single-tissue and multi-tissue levels. esQTL: regulatory variants that were both detected as eQTL and sQTL. Multi.tissue: regulatory variants detected from the multi-tissue meta-analysis. nVariants: number of variants in the class.
Genetic correlation (rG) and its standard error (SE) between pairs of 37 phenotypic traits (no gene expression or RNA splicing is analyzed), related to STAR Methods
Partitioned heritability across 37 traits and 16 tissues, related to Figure 1A
h2:heritability of traits; pva.o: observed proportion of heritability explained; pva.o: expected proportion of heritability explained by the proportion of variants. esVariants: 7-class categorisation of variants fitting eQTLs and sQTLs together. Multi.tissue: regulatory varaints detected from the multi-tissue meta-analysis.
Partitioned heritability across 56 lipidomic traits by multi-tissue esQTLs, related to Figure 3B
Partitioned heritability across 56 lipidomic traits by multi-tissue esQTLs. h2:heritability of lipidomic traits; pva.o: observed proportion of heritability explained; pva.o: expected proportion of heritability explained by the proportion of variants. The annotation of lipids is in Supplementary Table 8. esVariants: 7-class categorisation of variants fitting eQTL sand sQTLs together.
Summary of multi-tissue esQTLs that affect complex traits, related to Figures 4A and 4B
The annotation of lipids are in Supplementary Table 8. ∗.eVariants.∗: variants affecting gene expression. ∗.sVariants.∗: variants affecting RNA splicing. ∗.esVariants.∗: variants affecting both gene expression and RNA splicing. yesChIP: regulatory variants under ≥ 2 ChIP-seq peaks. noChIP: regulatory variants not under <2 ChIP-seq peaks. bycPIP: Posterior Inclusion Probability of SNPs for BayesRC. Lipids: lipidomic phenotypes that the SNP affects. phastcon.30w: Phascon score across 30 mammals (NA means the score <0.8, i.e., not conserved). phastcon.100w: Phascon score across 100 vertebrates (NA means the score <0.8, i.e., not conserved). VEP: Variant Effect Prediction annotation of the SNP. VEP.geneID: Variant Effect Prediction annotation for the gene of the SNP.
GCTA-GREML-estimated heritability (h2) for lipidomic traits with standard errors (SEs), related to STAR Methods
p-values were estimated by GCTA. p-values >0.05 were labeled as bold. NA meant REML did not converge. The annotation of lipids is in Supplementary Table 8.
Data and code availability
The newly generated RNA-seq data (356 blood and 268 milk cells) are publically available via NCBI SRA (BioProject accessions: PRJNA392196, PRJNA616134, PRJNA305942, PRJNA392196, PRJNA917329). Other RNA-seq data can be accessed via the CattleGTEx consortium:http://cgtex.roslin.ed.ac.uk/. Linear mixed model-based summary statistics of mapped eQTLs and sQTLs from each of the 16 tissue and the multi-tissue analysis is available at figshare: https://melbourne.figshare.com/articles/dataset/eQTL_and_sQTL_from_16_cattle_tissues_linear_mixed_model_/19793047 with DOI: 10.26188/19793047. The DNA sequence data as part of the 1000 Bull Genomes Consortium1,2 are available to consortium members and the membership is open. Sequence data of 1832 samples from the 1000 Bull Genome Project have been made publicly available at EBI: https://www.ebi.ac.uk/eva/?eva-study=PRJEB42783. DataGene Limited (http://www.datagene.com.au/) manages the raw phenotype and genotype data of Australian dairy animals and access to these data for research purposes may be granted upon request to DataGene. Other supporting data are shown in the Supplementary Materials of the manuscript. The linear mixed model analysis used GCTA.3 The Bayesian analysis used BayesRC.4 Code for these analyses is uploaded to GitHub and ZENODO: https://github.com/rxiangr/e-sQTL_h2 (https://sandbox.zenodo.org/account/settings/github/repository/rxiangr/e-sQTL_h2 or https://doi.org/10.5072/zenodo.1219141). The implementation of coloc used the CattleGTEx code at GitHub and ZENODO: https://github.com/shuliliu/cattleGTEx/tree/master/GWAS_eQTLs/Coloc (https://zenodo.org/badge/latestdoi/484289386).
References
- 1.Hayes B.J., Daetwyler H.D. 1000 bull genomes project to map simple and complex genetic traits in cattle: applications and outcomes. Annu. Rev. Anim. Biosci. 2019;7:89–102. doi: 10.1146/annurev-animal-020518-115024. [DOI] [PubMed] [Google Scholar]
- 2.Daetwyler H.D., Capitan A., Pausch H., Stothard P., Van Binsbergen R., Brøndum R.F., Liao X., Djari A., Rodriguez S.C., Grohs C., et al. Whole-genome sequencing of 234 bulls facilitates mapping of monogenic and complex traits in cattle. Nat. Genet. 2014;46:858–865. doi: 10.1038/ng.3034. [DOI] [PubMed] [Google Scholar]
- 3.Yang J., Lee S.H., Goddard M.E., Visscher P.M. GCTA: a tool for genome-wide complex trait analysis. Am. J. Hum. Genet. 2011;88:76–82. doi: 10.1016/j.ajhg.2010.11.011. [DOI] [PMC free article] [PubMed] [Google Scholar]
- 4.MacLeod I.M., Bowman P.J., Vander Jagt C.J., Haile-Mariam M., Kemper K.E., Chamberlain A.J., Schrooten C., Hayes B.J., Goddard M.E. Exploiting biological priors and sequence variants enhances QTL discovery and genomic prediction of complex traits. BMC Genom. 2016;17:144. doi: 10.1186/s12864-016-2443-6. [DOI] [PMC free article] [PubMed] [Google Scholar]
- 5.GTEx Consortium The Genotype-Tissue Expression (GTEx) pilot analysis: multitissue gene regulation in humans. Science. 2015;348:648–660. doi: 10.1126/science.1262110. [DOI] [PMC free article] [PubMed] [Google Scholar]
- 6.Aguet F., Anand S., Ardlie K.G., Gabriel S., Getz G.A., Graubert A., Hadley K., Handsaker R.E., Huang K.H., Kashin S., et al. The GTEx Consortium atlas of genetic regulatory effects across human tissues. Science. 2020;369:1318–1330. doi: 10.1126/science.aaz1776. [DOI] [PMC free article] [PubMed] [Google Scholar]
- 7.Li Y.I., van de Geijn B., Raj A., Knowles D.A., Petti A.A., Golan D., Gilad Y., Pritchard J.K. RNA splicing is a primary link between genetic variation and disease. Science. 2016;352:600–604. doi: 10.1126/science.aad9417. [DOI] [PMC free article] [PubMed] [Google Scholar]
- 8.Liu S., Gao Y., Canela-Xandri O., Wang S., Yu Y., Cai W., Li B., Xiang R., Chamberlain A.J., Pairo-Castineira E., et al. A multi-tissue atlas of regulatory variants in cattle. Nat. Genet. 2022;54:1438–1447. doi: 10.1038/s41588-022-01153-5. [DOI] [PMC free article] [PubMed] [Google Scholar]
- 9.Clark E.L., Archibald A.L., Daetwyler H.D., Groenen M.A.M., Harrison P.W., Houston R.D., Kühn C., Lien S., Macqueen D.J., Reecy J.M., et al. From FAANG to fork: application of highly annotated genomes to improve farmed animal production. Genome Biol. 2020;21:285. doi: 10.1186/s13059-020-02197-8. [DOI] [PMC free article] [PubMed] [Google Scholar]
- 10.Kern C., Wang Y., Xu X., Pan Z., Halstead M., Chanthavixay G., Saelao P., Waters S., Xiang R., Chamberlain A., et al. Functional annotations of three domestic animal genomes provide vital resources for comparative and agricultural research. Nat. Commun. 2021;12:1821. doi: 10.1038/s41467-021-22100-8. [DOI] [PMC free article] [PubMed] [Google Scholar]
- 11.Reynolds E.G.M., Neeley C., Lopdell T.J., Keehan M., Dittmer K., Harland C.S., Couldrey C., Johnson T.J.J., Tiplady K., Worth G., et al. Non-additive association analysis using proxy phenotypes identifies novel cattle syndromes. Nat. Genet. 2021;53:949–954. doi: 10.1038/s41588-021-00872-5. [DOI] [PubMed] [Google Scholar]
- 12.Xiang R., Breen E.J., Bolormaa S., Jagt C.J.V., Chamberlain A.J., Macleod I.M., Goddard M.E. Mutant alleles differentially shape fitness and other complex traits in cattle. Commun. Biol. 2021;4:1353. doi: 10.1038/s42003-021-02874-9. [DOI] [PMC free article] [PubMed] [Google Scholar]
- 13.Yao D.W., O’Connor L.J., Price A.L., Gusev A. Quantifying genetic effects on disease mediated by assayed gene expression levels. Nat. Genet. 2020;52:626–633. doi: 10.1038/s41588-020-0625-2. [DOI] [PMC free article] [PubMed] [Google Scholar]
- 14.Connally N.J., Nazeen S., Lee D., Shi H., Stamatoyannopoulos J., Chun S., Cotsapas C., Cassa C.A., Sunyaev S.R. The missing link between genetic association and regulatory function. Elife. 2022;11 doi: 10.7554/eLife.74970. [DOI] [PMC free article] [PubMed] [Google Scholar]
- 15.van den Berg I., Xiang R., Jenko J., Pausch H., Boussaha M., Schrooten C., Tribout T., Gjuvsland A.B., Boichard D., Nordbø Ø., et al. Meta-analysis for milk fat and protein percentage using imputed sequence variant genotypes in 94,321 cattle from eight cattle breeds. Genet. Sel. Evol. 2020;52:37. doi: 10.1186/s12711-020-00556-4. [DOI] [PMC free article] [PubMed] [Google Scholar]
- 16.Xiang R., Berg I.v.d., MacLeod I.M., Hayes B.J., Prowse-Wilkins C.P., Wang M., Bolormaa S., Liu Z., Rochfort S.J., Reich C.M., et al. Quantifying the contribution of sequence variants with regulatory and evolutionary significance to 34 bovine complex traits. Proc. Natl. Acad. Sci. USA. 2019;116:19398–19408. doi: 10.1073/pnas.1904159116. [DOI] [PMC free article] [PubMed] [Google Scholar]
- 17.Erbe M., Hayes B.J., Matukumalli L.K., Goswami S., Bowman P.J., Reich C.M., Mason B.A., Goddard M.E. Improving accuracy of genomic predictions within and between dairy cattle breeds with imputed high-density single nucleotide polymorphism panels. J. Dairy Sci. 2012;95:4114–4129. doi: 10.3168/jds.2011-5019. [DOI] [PubMed] [Google Scholar]
- 18.Moser G., Lee S.H., Hayes B.J., Goddard M.E., Wray N.R., Visscher P.M. Simultaneous discovery, estimation and prediction analysis of complex traits using a Bayesian mixture model. PLoS Genet. 2015;11 doi: 10.1371/journal.pgen.1004969. [DOI] [PMC free article] [PubMed] [Google Scholar]
- 19.Yang J., Zeng J., Goddard M.E., Wray N.R., Visscher P.M. Concepts, estimation and interpretation of SNP-based heritability. Nat. Genet. 2017;49:1304–1310. doi: 10.1038/ng.3941. [DOI] [PubMed] [Google Scholar]
- 20.Finucane H.K., Bulik-Sullivan B., Gusev A., Trynka G., Reshef Y., Loh P.-R., Anttila V., Xu H., Zang C., Farh K., et al. Partitioning heritability by functional annotation using genome-wide association summary statistics. Nat. Genet. 2015;47:1228–1235. doi: 10.1038/ng.3404. [DOI] [PMC free article] [PubMed] [Google Scholar]
- 21.Hill W.G., Edwards M.R., Ahmed M.K.A., Thompson R. Heritability of milk yield and composition at different levels and variability of production. Anim. Sci. 1983;36:59–68. [Google Scholar]
- 22.Visscher P.M., Goddard M.E. Genetic parameters for milk yield, survival, workability, and type traits for Australian dairy cattle. J. Dairy Sci. 1995;78:205–220. doi: 10.3168/jds.S0022-0302(95)76630-9. [DOI] [PubMed] [Google Scholar]
- 23.Prowse-Wilkins C.P., Wang J., Xiang R., Garner J.B., Goddard M.E., Chamberlain A.J. Putative causal variants are enriched in annotated functional regions from six bovine tissues. Front. Genet. 2021;12:664379. doi: 10.3389/fgene.2021.664379. [DOI] [PMC free article] [PubMed] [Google Scholar]
- 24.Xiang R., Breen E.J., Prowse-Wilkins C.P., Chamberlain A.J., Goddard M.E. Bayesian genome-wide analysis of cattle traits using variants with functional and evolutionary significance. Anim. Prod. Sci. 2021;61:1818–1827. doi: 10.1071/AN21061. [DOI] [Google Scholar]
- 25.McLaren W., Gil L., Hunt S.E., Riat H.S., Ritchie G.R.S., Thormann A., Flicek P., Cunningham F. The ensembl variant effect predictor. Genome Biol. 2016;17:122. doi: 10.1186/s13059-016-0974-4. [DOI] [PMC free article] [PubMed] [Google Scholar]
- 26.Gusev A., Lee S.H., Trynka G., Finucane H., Vilhjálmsson B.J., Xu H., Zang C., Ripke S., Bulik-Sullivan B., Stahl E., et al. Partitioning heritability of regulatory and cell-type-specific variants across 11 common diseases. Am. J. Hum. Genet. 2014;95:535–552. doi: 10.1016/j.ajhg.2014.10.004. [DOI] [PMC free article] [PubMed] [Google Scholar]
- 27.Kierczak M., Rafati N., Höglund J., Gourlé H., Lo Faro V., Schmitz D., Ek W.E., Gyllensten U., Enroth S., Ekman D., et al. Contribution of rare whole-genome sequencing variants to plasma protein levels and the missing heritability. Nat. Commun. 2022;13:2532. doi: 10.1038/s41467-022-30208-8. [DOI] [PMC free article] [PubMed] [Google Scholar]
- 28.Sun B.B., Kurki M.I., Foley C.N., Mechakra A., Chen C.-Y., Marshall E., Wilk J.B., Biogen Biobank Team. Chahine M., Chevalier P., et al. Genetic associations of protein-coding variants in human disease. Nature. 2022;603:95–102. doi: 10.1038/s41586-022-04394-w. [DOI] [PMC free article] [PubMed] [Google Scholar]
- 29.Giambartolomei C., Vukcevic D., Schadt E.E., Franke L., Hingorani A.D., Wallace C., Plagnol V. Bayesian test for colocalisation between pairs of genetic association studies using summary statistics. PLoS Genet. 2014;10 doi: 10.1371/journal.pgen.1004383. [DOI] [PMC free article] [PubMed] [Google Scholar]
- 30.Xiang R., van den Berg I., MacLeod I.M., Daetwyler H.D., Goddard M.E. Effect direction meta-analysis of GWAS identifies extreme, prevalent and shared pleiotropy in a large mammal. Commun. Biol. 2020;3:88. doi: 10.1038/s42003-020-0823-6. [DOI] [PMC free article] [PubMed] [Google Scholar]
- 31.Xiang R., MacLeod I.M., Bolormaa S., Goddard M.E. Genome-wide comparative analyses of correlated and uncorrelated phenotypes identify major pleiotropic variants in dairy cattle. Sci. Rep. 2017;7:9248. doi: 10.1038/s41598-017-09788-9. [DOI] [PMC free article] [PubMed] [Google Scholar]
- 32.Bouwman A.C., Daetwyler H.D., Chamberlain A.J., Ponce C.H., Sargolzaei M., Schenkel F.S., Sahana G., Govignon-Gion A., Boitard S., Dolezal M., et al. Meta-analysis of genome-wide association studies for cattle stature identifies common genes that regulate body size in mammals. Nat. Genet. 2018;50:362–367. doi: 10.1038/s41588-018-0056-5. [DOI] [PubMed] [Google Scholar]
- 33.Mucha S., Baurecht H., Novak N., Rodríguez E., Bej S., Mayr G., Emmert H., Stölzl D., Gerdes S., Jung E.S., et al. Protein-coding variants contribute to the risk of atopic dermatitis and skin-specific gene expression. J. Allergy Clin. Immunol. 2020;145:1208–1218. doi: 10.1016/j.jaci.2019.10.030. [DOI] [PubMed] [Google Scholar]
- 34.Liu S., Yu Y., Zhang S., Cole J.B., Tenesa A., Wang T., McDaneld T.G., Ma L., Liu G.E., Fang L. Epigenomics and genotype-phenotype association analyses reveal conserved genetic architecture of complex traits in cattle and human. BMC Biol. 2020;18:80. doi: 10.1186/s12915-020-00792-6. [DOI] [PMC free article] [PubMed] [Google Scholar]
- 35.Lloyd-Jones L.R., Zeng J., Sidorenko J., Yengo L., Moser G., Kemper K.E., Wang H., Zheng Z., Magi R., Esko T., et al. Improved polygenic prediction by Bayesian multiple regression on summary statistics. Nat. Commun. 2019;10:5086. doi: 10.1038/s41467-019-12653-0. [DOI] [PMC free article] [PubMed] [Google Scholar]
- 36.Patxot M., Banos D.T., Kousathanas A., Orliac E.J., Ojavee S.E., Moser G., Holloway A., Sidorenko J., Kutalik Z., Mägi R., et al. Probabilistic inference of the genetic architecture underlying functional enrichment of complex traits. Nat. Commun. 2021;12:6972. doi: 10.1038/s41467-021-27258-9. [DOI] [PMC free article] [PubMed] [Google Scholar]
- 37.Boyle E.A., Li Y.I., Pritchard J.K. An expanded view of complex traits: from polygenic to omnigenic. Cell. 2017;169:1177–1186. doi: 10.1016/j.cell.2017.05.038. [DOI] [PMC free article] [PubMed] [Google Scholar]
- 38.Võsa U., Claringbould A., Westra H.-J., Bonder M.J., Deelen P., Zeng B., Kirsten H., Saha A., Kreuzhuber R., Yazar S., et al. Large-scale cis-and trans-eQTL analyses identify thousands of genetic loci and polygenic scores that regulate blood gene expression. Nat. Genet. 2021;53:1300–1310. doi: 10.1038/s41588-021-00913-z. [DOI] [PMC free article] [PubMed] [Google Scholar]
- 39.GTEx Consortium Genetic effects on gene expression across human tissues. Nature. 2017;550:204–213. doi: 10.1038/nature24277. [DOI] [PMC free article] [PubMed] [Google Scholar]
- 40.Liu Z., Wang T., Pryce J.E., MacLeod I.M., Hayes B.J., Chamberlain A.J., Jagt C.V., Reich C.M., Mason B.A., Rochfort S. Fine-mapping sequence mutations with a major effect on oligosaccharide content in bovine milk. Sci. Rep. 2019;9:2137. doi: 10.1038/s41598-019-38488-9. [DOI] [PMC free article] [PubMed] [Google Scholar]
- 41.Claussnitzer M., Dankel S.N., Kim K.-H., Quon G., Meuleman W., Haugen C., Glunk V., Sousa I.S., Beaudry J.L., Puviindran V., et al. FTO obesity variant circuitry and adipocyte browning in humans. N. Engl. J. Med. 2015;373:895–907. doi: 10.1056/NEJMoa1502214. [DOI] [PMC free article] [PubMed] [Google Scholar]
- 42.Hanks S., Perdeaux E.R., Seal S., Ruark E., Mahamdallie S.S., Murray A., Ramsay E., Del Vecchio Duarte S., Zachariou A., De Souza B., et al. Germline mutations in the PAF1 complex gene CTR9 predispose to Wilms tumour. Nat. Commun. 2014;5:4398. doi: 10.1038/ncomms5398. [DOI] [PMC free article] [PubMed] [Google Scholar]
- 43.Chang C.C., Chow C.C., Tellier L.C., Vattikuti S., Purcell S.M., Lee J.J. Second-generation PLINK: rising to the challenge of larger and richer datasets. Gigascience. 2015;4:7. doi: 10.1186/s13742-015-0047-8. [DOI] [PMC free article] [PubMed] [Google Scholar]
- 44.Willer C.J., Li Y., Abecasis G.R. METAL: fast and efficient meta-analysis of genomewide association scans. Bioinformatics. 2010;26:2190–2191. doi: 10.1093/bioinformatics/btq340. [DOI] [PMC free article] [PubMed] [Google Scholar]
- 45.Ongen H., Buil A., Brown A.A., Dermitzakis E.T., Delaneau O. Fast and efficient QTL mapper for thousands of molecular phenotypes. Bioinformatics. 2016;32:1479–1485. doi: 10.1093/bioinformatics/btv722. [DOI] [PMC free article] [PubMed] [Google Scholar]
- 46.Xiang R., Hayes B.J., Vander Jagt C.J., MacLeod I.M., Khansefid M., Bowman P.J., Yuan Z., Prowse-Wilkins C.P., Reich C.M., Mason B.A., et al. Genome variants associated with RNA splicing variations in bovine are extensively shared between tissues. BMC Genom. 2018;19:521. doi: 10.1186/s12864-018-4902-8. [DOI] [PMC free article] [PubMed] [Google Scholar]
- 47.Chamberlain A., Hayes B., Xiang R., Vander Jagt C., Reich C., Macleod I., Prowse-Wilkins C., Mason B., Daetwyler H., Goddard M. 2018. Identification of Regulatory Variation in Dairy Cattle with RNA Sequence Data. held in Auckland, New Zealand; p. 254. [Google Scholar]
- 48.Dobin A., Davis C.A., Schlesinger F., Drenkow J., Zaleski C., Jha S., Batut P., Chaisson M., Gingeras T.R. STAR: ultrafast universal RNA-seq aligner. Bioinformatics. 2013;29:15–21. doi: 10.1093/bioinformatics/bts635. [DOI] [PMC free article] [PubMed] [Google Scholar]
- 49.Rosen B.D., Bickhart D.M., Schnabel R.D., Koren S., Elsik C.G., Tseng E., Rowan T.N., Low W.Y., Zimin A., Couldrey C., et al. De novo assembly of the cattle reference genome with single-molecule sequencing. Gigascience. 2020;9 doi: 10.1093/gigascience/giaa021. [DOI] [PMC free article] [PubMed] [Google Scholar]
- 50.Liao Y., Smyth G.K., Shi W. featureCounts: an efficient general purpose program for assigning sequence reads to genomic features. Bioinformatics. 2014;30:923–930. doi: 10.1093/bioinformatics/btt656. [DOI] [PubMed] [Google Scholar]
- 51.Li Y.I., Knowles D.A., Humphrey J., Barbeira A.N., Dickinson S.P., Im H.K., Pritchard J.K. Annotation-free quantification of RNA splicing using LeafCutter. Nat. Genet. 2018;50:151–158. doi: 10.1038/s41588-017-0004-9. [DOI] [PMC free article] [PubMed] [Google Scholar]
- 52.Love M.I., Huber W., Anders S. Moderated estimation of fold change and dispersion for RNA-seq data with DESeq2. Genome Biol. 2014;15:550. doi: 10.1186/s13059-014-0550-8. [DOI] [PMC free article] [PubMed] [Google Scholar]
- 53.Law C.W., Chen Y., Shi W., Smyth G.K. Voom: precision weights unlock linear model analysis tools for RNA-seq read counts. Genome Biol. 2014;15 doi: 10.1186/gb-2014-15-2-r29. [DOI] [PMC free article] [PubMed] [Google Scholar]
- 54.Daetwyler H., Brauning R., Chamberlain A., McWilliam S., McCulloch A., Vander Jagt C., Sunduimijid B., Hayes B., Kijas J. 2017. 1000 Bull Genomes and Sheepgenomedb Projects: Enabling Cost Effective Sequence Level Analyses Globally; pp. 201–204. [Google Scholar]
- 55.Daetwyler H., Xiang R., Yuan Z., Bolormaa S., Vander Jagt C., Hayes B., van der Werf J., Pryce J., Chamberlain A., Macleod I. Proceedings of the Association for the Advancement of Animal Breeding and Genetics, Armidale, NSW, Australia. 2019. Integration of functional genomics and phenomics into genomic prediction raises its accuracy in sheep and dairy cattle; pp. 11–14. [Google Scholar]
- 56.Fuchsberger C., Abecasis G.R., Hinds D.A. minimac2: faster genotype imputation. Bioinformatics. 2015;31:782–784. doi: 10.1093/bioinformatics/btu704. [DOI] [PMC free article] [PubMed] [Google Scholar]
- 57.Howie B., Fuchsberger C., Stephens M., Marchini J., Abecasis G.R. Fast and accurate genotype imputation in genome-wide association studies through pre-phasing. Nat. Genet. 2012;44:955–959. doi: 10.1038/ng.2354. [DOI] [PMC free article] [PubMed] [Google Scholar]
- 58.Stegle O., Parts L., Piipari M., Winn J., Durbin R. Using probabilistic estimation of expression residuals (PEER) to obtain increased power and interpretability of gene expression analyses. Nat. Protoc. 2012;7:500–507. doi: 10.1038/nprot.2011.457. [DOI] [PMC free article] [PubMed] [Google Scholar]
- 59.Storey J.D., Tibshirani R. Statistical significance for genomewide studies. Proc. Natl. Acad. Sci. USA. 2003;100:9440–9445. doi: 10.1073/pnas.1530509100. [DOI] [PMC free article] [PubMed] [Google Scholar]
- 60.Garrido-Martín D., Borsari B., Calvo M., Reverter F., Guigó R. Identification and analysis of splicing quantitative trait loci across multiple tissues in the human genome. Nat. Commun. 2021;12:1–16. doi: 10.1038/s41467-020-20578-2. [DOI] [PMC free article] [PubMed] [Google Scholar]
- 61.Qi T., Wu Y., Fang H., Zhang F., Liu S., Zeng J., Yang J. Genetic control of RNA splicing and its distinct role in complex trait variation. Nat. Genet. 2022;54:1355–1363. doi: 10.1038/s41588-022-01154-4. [DOI] [PMC free article] [PubMed] [Google Scholar]
- 62.Sul J.H., Han B., Ye C., Choi T., Eskin E. Effectively identifying eQTLs from multiple tissues by combining mixed model and meta-analytic approaches. PLoS Genet. 2013;9 doi: 10.1371/journal.pgen.1003491. [DOI] [PMC free article] [PubMed] [Google Scholar]
- 63.Xiang R., MacLeod I.M., Daetwyler H.D., de Jong G., O’Connor E., Schrooten C., Chamberlain A.J., Goddard M.E. Genome-wide fine-mapping identifies pleiotropic and functional variants that predict many traits across global cattle populations. Nat. Commun. 2021;12:860. doi: 10.1038/s41467-021-21001-0. [DOI] [PMC free article] [PubMed] [Google Scholar]
- 64.Breen E.J., MacLeod I.M., Ho P.N., Haile-Mariam M., Pryce J.E., Thomas C.D., Daetwyler H.D., Goddard M.E. BayesR3 enables fast MCMC blocked processing for largescale multi-trait genomic prediction and QTN mapping analysis. Commun. Biol. 2022;5:661. doi: 10.1038/s42003-022-03624-1. [DOI] [PMC free article] [PubMed] [Google Scholar]
- 65.Yang J., Ferreira T., Morris A.P., Medland S.E., Genetic Investigation of ANthropometric Traits GIANT Consortium. DIAbetes Genetics Replication And Meta-analysis DIAGRAM Consortium. Madden P.A.F., Heath A.C., Martin N.G., Montgomery G.W., et al. Conditional and joint multiple-SNP analysis of GWAS summary statistics identifies additional variants influencing complex traits. Nat. Genet. 2012;44:369–375, S1-S3. doi: 10.1038/ng.2213. [DOI] [PMC free article] [PubMed] [Google Scholar]
- 66.Liu Z., Logan A., Cocks B.G., Rochfort S. Seasonal variation of polar lipid content in bovine milk. Food Chem. 2017;237:865–869. doi: 10.1016/j.foodchem.2017.06.038. [DOI] [PubMed] [Google Scholar]
- 67.Liu Z., Moate P., Cocks B., Rochfort S. Comprehensive polar lipid identification and quantification in milk by liquid chromatography–mass spectrometry. J. Chromatogr. B. 2015;978–979:95–102. doi: 10.1016/j.jchromb.2014.11.036. [DOI] [PubMed] [Google Scholar]
- 68.Siepel A., Bejerano G., Pedersen J.S., Hinrichs A.S., Hou M., Rosenbloom K., Clawson H., Spieth J., Hillier L.W., Richards S., et al. Evolutionarily conserved elements in vertebrate, insect, worm, and yeast genomes. Genome Res. 2005;15:1034–1050. doi: 10.1101/gr.3715005. [DOI] [PMC free article] [PubMed] [Google Scholar]
Associated Data
This section collects any data citations, data availability statements, or supplementary materials included in this article.
Supplementary Materials
. Classification of regulatory variants based on eQTL and sQTL at the single-tissue and multi-tissue level using 1.8 million genome-wide pruned variants (LD-r2 < 0.9) in Australian cattle, related to STAR Methods
The category of esQTL had 7 classes of variants fitting cis and trans eQTL and sQTL together at the single-tissue and multi-tissue levels. The category of eQTL had 3 classes of variants only fitting cis and trans eQTL at the single-tissue and multi-tissue levels. The category of sQTL had 3 classes of variants only fitting cis and trans sQTL at the single-tissue and multi-tissue levels. esQTL: regulatory variants that were both detected as eQTL and sQTL. Multi.tissue: regulatory variants detected from the multi-tissue meta-analysis. nVariants: number of variants in the class.
Genetic correlation (rG) and its standard error (SE) between pairs of 37 phenotypic traits (no gene expression or RNA splicing is analyzed), related to STAR Methods
Partitioned heritability across 37 traits and 16 tissues, related to Figure 1A
h2:heritability of traits; pva.o: observed proportion of heritability explained; pva.o: expected proportion of heritability explained by the proportion of variants. esVariants: 7-class categorisation of variants fitting eQTLs and sQTLs together. Multi.tissue: regulatory varaints detected from the multi-tissue meta-analysis.
Partitioned heritability across 56 lipidomic traits by multi-tissue esQTLs, related to Figure 3B
Partitioned heritability across 56 lipidomic traits by multi-tissue esQTLs. h2:heritability of lipidomic traits; pva.o: observed proportion of heritability explained; pva.o: expected proportion of heritability explained by the proportion of variants. The annotation of lipids is in Supplementary Table 8. esVariants: 7-class categorisation of variants fitting eQTL sand sQTLs together.
Summary of multi-tissue esQTLs that affect complex traits, related to Figures 4A and 4B
The annotation of lipids are in Supplementary Table 8. ∗.eVariants.∗: variants affecting gene expression. ∗.sVariants.∗: variants affecting RNA splicing. ∗.esVariants.∗: variants affecting both gene expression and RNA splicing. yesChIP: regulatory variants under ≥ 2 ChIP-seq peaks. noChIP: regulatory variants not under <2 ChIP-seq peaks. bycPIP: Posterior Inclusion Probability of SNPs for BayesRC. Lipids: lipidomic phenotypes that the SNP affects. phastcon.30w: Phascon score across 30 mammals (NA means the score <0.8, i.e., not conserved). phastcon.100w: Phascon score across 100 vertebrates (NA means the score <0.8, i.e., not conserved). VEP: Variant Effect Prediction annotation of the SNP. VEP.geneID: Variant Effect Prediction annotation for the gene of the SNP.
GCTA-GREML-estimated heritability (h2) for lipidomic traits with standard errors (SEs), related to STAR Methods
p-values were estimated by GCTA. p-values >0.05 were labeled as bold. NA meant REML did not converge. The annotation of lipids is in Supplementary Table 8.
Data Availability Statement
The newly generated RNA-seq data (356 blood and 268 milk cells) are publically available via NCBI SRA (BioProject accessions: PRJNA392196, PRJNA616134, PRJNA305942, PRJNA392196, PRJNA917329). Other RNA-seq data can be accessed via the CattleGTEx consortium:http://cgtex.roslin.ed.ac.uk/. Linear mixed model-based summary statistics of mapped eQTLs and sQTLs from each of the 16 tissue and the multi-tissue analysis is available at figshare: https://melbourne.figshare.com/articles/dataset/eQTL_and_sQTL_from_16_cattle_tissues_linear_mixed_model_/19793047 with DOI: 10.26188/19793047. The DNA sequence data as part of the 1000 Bull Genomes Consortium1,2 are available to consortium members and the membership is open. Sequence data of 1832 samples from the 1000 Bull Genome Project have been made publicly available at EBI: https://www.ebi.ac.uk/eva/?eva-study=PRJEB42783. DataGene Limited (http://www.datagene.com.au/) manages the raw phenotype and genotype data of Australian dairy animals and access to these data for research purposes may be granted upon request to DataGene. Other supporting data are shown in the Supplementary Materials of the manuscript. The linear mixed model analysis used GCTA.3 The Bayesian analysis used BayesRC.4 Code for these analyses is uploaded to GitHub and ZENODO: https://github.com/rxiangr/e-sQTL_h2 (https://sandbox.zenodo.org/account/settings/github/repository/rxiangr/e-sQTL_h2 or https://doi.org/10.5072/zenodo.1219141). The implementation of coloc used the CattleGTEx code at GitHub and ZENODO: https://github.com/shuliliu/cattleGTEx/tree/master/GWAS_eQTLs/Coloc (https://zenodo.org/badge/latestdoi/484289386).