

Summary
Relationships between the genome, transcriptome, and metabolome underlie all evolved phenotypes. However, it has proved difficult to elucidate these relationships because of the high number of variables measured. A recently developed data analytic method for characterizing the transcriptome can simplify interpretation by grouping genes into independently modulated sets (iModulons). Here, we demonstrate how iModulons reveal deep understanding of the effects of causal mutations and metabolic rewiring. We use adaptive laboratory evolution to generate E. coli strains that tolerate high levels of the redox cycling compound paraquat, which produces reactive oxygen species (ROS). We combine resequencing, iModulons, and metabolic models to elucidate six interacting stress tolerance mechanisms: 1) modification of transport, 2) activation of ROS stress responses, 3) use of ROS-sensitive iron regulation, 4) motility, 5) broad transcriptional reallocation toward growth, and 6) metabolic rewiring to decrease NADH production. This work thus demonstrates the power of iModulon knowledge-mapping for evolution analysis.
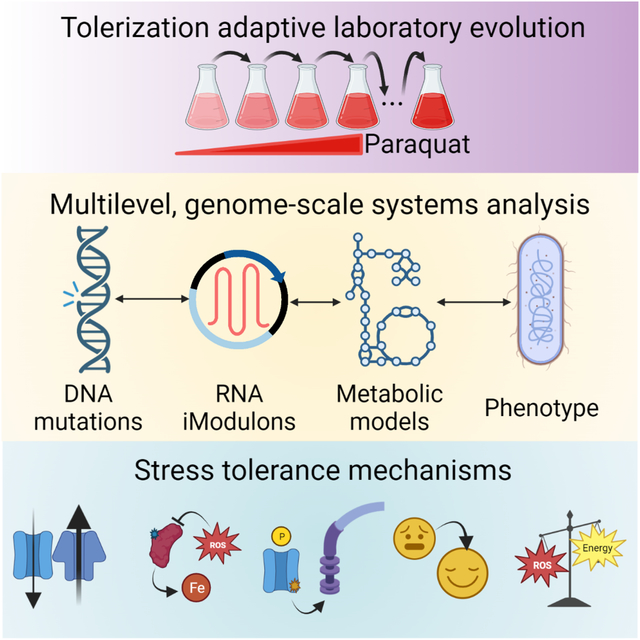
Graphical Abstract
eTOC
Adaptive laboratory evolution can reveal novel stress tolerance mechanisms, but typical methods struggle to interpret the rich information in transcriptomes of evolved strains. Rychel et al. evolved strains with high paraquat tolerance, and revealed six tolerance mechanisms by integrating iModulon-based transcriptomic analysis with other systems biology tools.
Introduction
Adaptive laboratory evolution (ALE) is an excellent tool for discovery in biology. The experimental procedure is to grow a microbial starting strain in a selected condition for many generations, propagating when flasks reach a targeted density during repeated batch growth. This allows selection to enrich for mutant strains with improved fitness under the chosen condition6. A tolerization ALE uses this procedure with increasing stressor concentrations, pushing cells to amplify stress tolerance mechanisms7, thereby generating unique strains which are stress tolerance specialists. Analysis of ALE strains is highly informative for improving gene annotations, identifying fundamental biological principles and tradeoffs, designing bioproduction strains, and understanding antimicrobial resistance6,8,9.
Using ‘omics technology, we can globally characterize evolved strains from ALE studies. Typically, DNA resequencing and mutation calling algorithms8,10 are used to enumerate all changes to the genome in each strain. Then, researchers perform a literature search to map knowledge onto the mutated genes and make predictions about the mechanisms underlying the ALE. Researchers test those mechanisms with further experiments, and they employ a variety of other tools such as metabolic modeling2,3,11–15 to discover new biological details about the strain and condition of interest. For example, Sandberg et al.16 evolved Escherichia coli to grow well at elevated temperatures, and found genes that were consistently mutated in parallel. By relating these mutations to heat sensitive properties, the ALE analysis provides a clearer overall picture of the major weaknesses of the cell to heat stress. This understanding can then be applied for design of tolerant strains for bioproduction, and contribute to our understanding of the role of each gene in biological systems.
Several prior ALE studies have employed transcriptomics as part of the characterization tool kit. In principle, this data should be highly informative. Unlike the genome, the transcriptome is condition-specific. In addition, mutations can often have little or no effect17, but coordinated changes in gene expression often have a strong effect on phenotypes. However, the knowledge-mapping step, in which the transcriptome is mined for biological insights, is often challenging. The typical method for transcriptional analysis, differentially expressed gene (DEG) analysis, often returns a large number of DEGs, and determining their upstream regulation or downstream effects at large scales is daunting. We seek to integrate signals from the transcriptome with mutations in the genome via biologically meaningful relationships, which is difficult if we do not decrease the number of transcriptomic variables and map those variables to established knowledge from literature. This work would add global transcriptional analysis to the toolkit for understanding ALE strains.
iModulon analysis is a transcriptional analysis technique which has emerged as an effective way to reduce the number of transcriptomic variables and map knowledge onto them20,21. It uses independent component analysis (ICA) of large compendia of transcriptomic data to group genes into independently modulated sets (iModulons). iModulons are comparable to regulons. Regulons are the sets of genes that respond to a particular regulator as determined by bottom-up methods such as chromatin immunoprecipitation and regulator knock-outs18,19, whereas iModulons are determined from the top-down by analyzing only trends in transcriptomes. iModulons are therefore more flexible, and can capture the effects of regulatory changes along with other signals, like genomic deletions. They are also more amenable to computation: they are based on matrix decomposition, and each iModulon has an activity level in each sample, which can be combined with gene weightings to calculate the expression of the set of genes. By comparing iModulons with regulon annotations22, each iModulon is manually curated with predicted regulators and functions, bridging between the statistical patterns in data and existing literature. iModulon activity levels can be used to infer the activity of their underlying regulators, and thus enable quantitative interrogation of the cell’s sensory systems. This approach has provided valuable insights into E. coli20,23 and several other organisms24–31. iModulon analysis is supported by a publicly available codebase and online knowledgebase (iModulonDB.org)21,32.
We have recently updated our iModulon structure for E. coli using a dataset with over 1,000 samples, called PRECISE-1K23. Data from the present study was included in this dataset, which computed and characterized 201 signals in the transcriptional regulatory network (TRN) and reported details on iModulonDB.org. In this study, we demonstrate the usefulness of this knowledge-enriched representation by iteratively characterizing each significant transcriptional signal (iModulon) that changed over the course of an ALE. We identify relationships between mutations, iModulons, the ALE condition, and other results such as physiological measurements and metabolic models. Though iModulons have been used in past ALE studies11,12,33–35, no other study has iterated through each significant signal in the transcriptome in a way that mirrors the iterative interpretation of each mutation. Inference from the transcriptome reveals a large set of phenotypic predictions, many of which are more complex than would be identifiable by previous methods. This motivates further use of the iModulon framework as an important new part of the ALE analysis toolkit.
We used ALE to generate E. coli strains which are specialized to tolerate a common herbicide, the redox cycling compound paraquat (PQ). Redox cycling compounds generate large amounts of reactive oxygen species (ROS) by stripping electrons from cellular electron carriers, such as NADH and NADPH, and reducing oxygen; this generates destructive superoxide ROS and regenerates the oxidizing agent to re-initiate the cycle36–38. The ROS are particularly damaging to iron-containing enzymes and DNA. They decrease activity of important pathways, challenge the integrity of the genome, and inhibit growth3,37,39–42.
Though the ROS response of E. coli is well understood and ROS are often delivered in the laboratory by PQ40, some questions remain about how high levels of tolerance can be achieved: (i) In addition to the known proteins, which transporters and enzymes are involved in PQ cycling? (ii) What transcriptional alterations, specifically with respect to stress responses, metal homeostasis, and redox balance, are optimal? (iii) How can cells balance a tradeoff between generating NAD(P)H for energy and decreasing its production to prevent redox cycling36–38? Through our unique combination of systems biology techniques and new emphasis on iModulon knowledge-mapping, we are able to shed new light on these questions. Their answers are informative for the fundamental biology of stress and metabolism, and for applications in pathology, antimicrobial design, and biomanufacturing.
This work provides a blueprint for combining iModulon analysis with ALE. We begin by characterizing the strains and presenting an overview of the genomic and transcriptional changes. We then show the effects of large DNA changes and TF mutations on the transcriptome. We also find an unexpected non-TF mutation that regulates motility regulons in our strains. Next, we disentangle the large fraction of the transcriptome which responds to changes in stress and growth phenotypes. Finally, we propose and model a metabolic mechanism for PQ tolerance involving several mutations and broad transcriptional reallocation. We show that the evolved strains employ a multi-pronged strategy of: (i) modifying membrane transport, (ii) using the SoxS and OxyR regulons to ensure stress readiness, (iii) allowing ROS-sensitive iron-sulfur (Fe-S) clusters to play a larger role in regulation of metal homeostasis, (iv) increasing motility, (v) shifting transcriptional allocation toward growth, and (vi) using fermentation to avert the PQ cycle.
Results
Laboratory evolution increased tolerated PQ levels by 1000%
We evolved strains aerobically in minimal media with glucose under increasing PQ stress (Figure 1A). Our starting strain (0_0) was a derivative of E. coli K-12 MG1655 which had been pre-evolved to grow in minimal media with glucose43. By using this media-adapted starting strain, the subsequent ALEs were enriched for mutations which improve stress tolerance, since the mutations that promote rapid growth under the culture conditions were already fixed (Table S1). ALE was performed by steadily increasing PQ concentrations, first in three parallel first generation ALEs (1_0, 2_0, 3_0) and followed by eleven second generation ALEs (1_1, 1_2, …, 2_1, etc.) (Figure 1A–B). Parallelizing ALE replicates generated diverse strains and allowed for identification of common mutation targets which are more likely to be causal.
Figure 1. ALE increases PQ tolerance via changes to the genome and transcriptome.
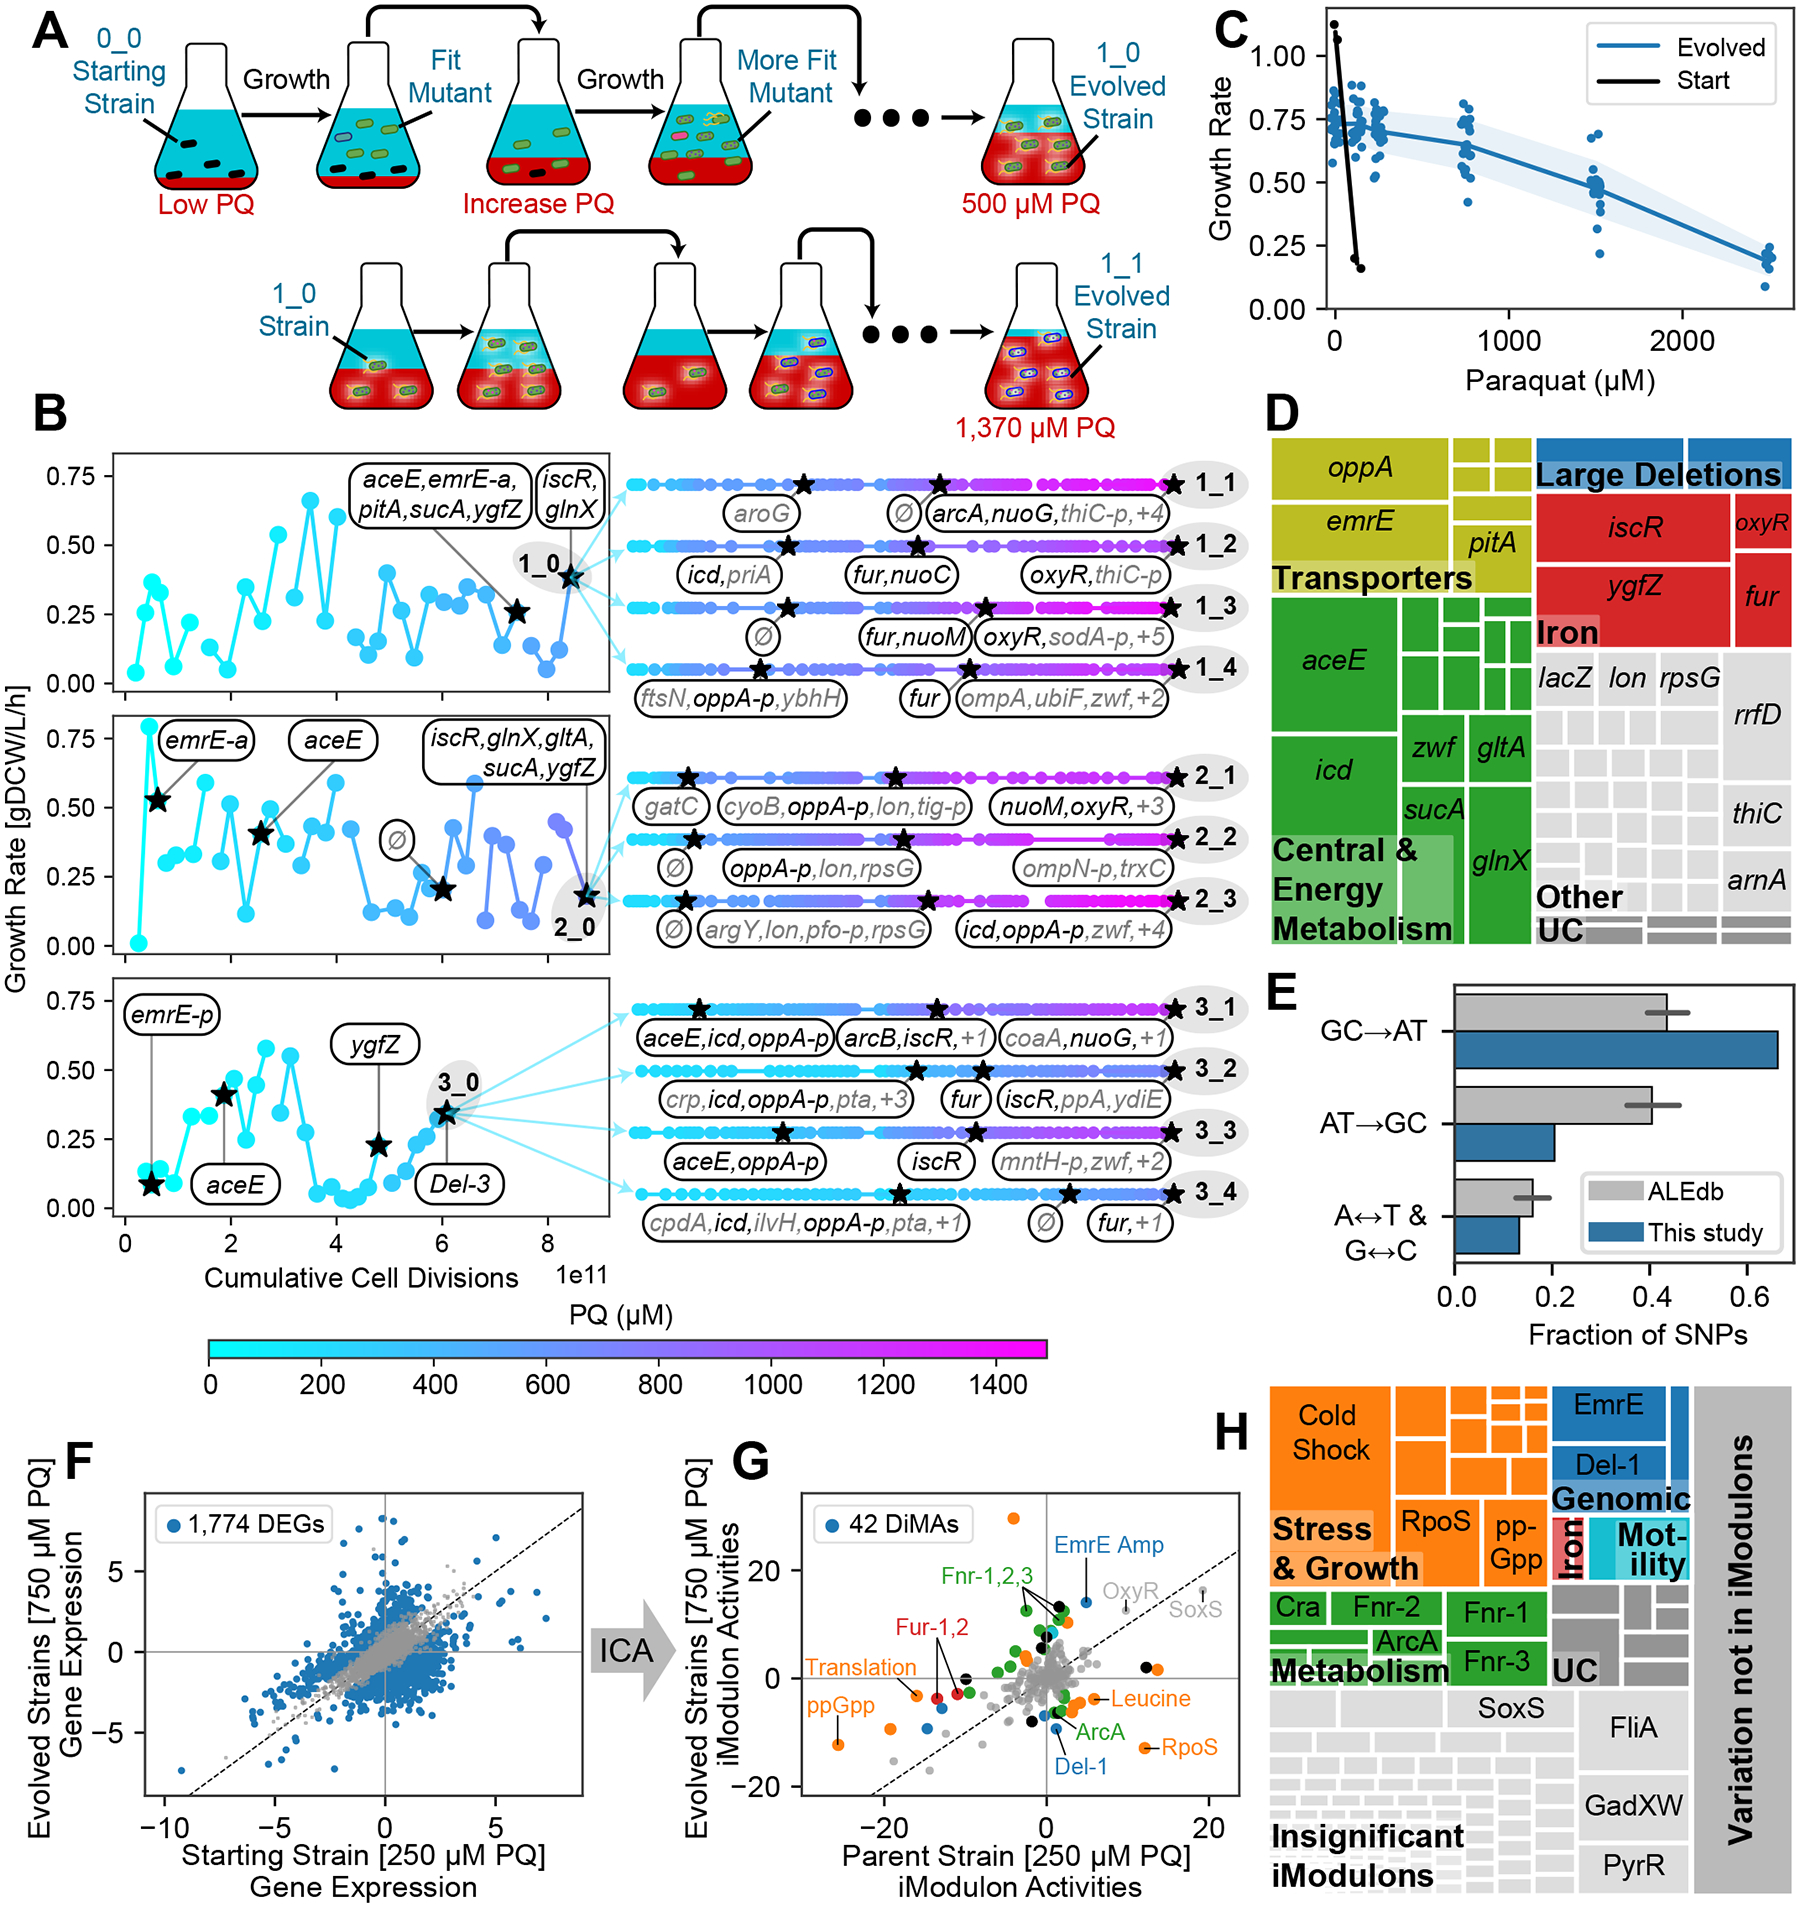
(A) Tolerization ALE process, showing mutant strains (cells with various appearances) in media with increasing stress concentrations (red). Example replicates are shown: 1_0 in the first generation and 1_1 in the second generation. (B) Points represent ALE flasks colored by PQ concentration. The first generation of ALEs (strains 1_0, 2_0, and 3_0) are shown with each flask’s growth rate in grams dry cell weight per liter per hour (gDCW/L/h). ‘Cumulative cell divisions’ are estimated from the growth rate and time elapsed. Stars represent flasks that underwent DNA sequencing, and newly mutated genes are shown. Black colored genes are discussed in detail. (C) Growth rate for each strain at each PQ concentration. The starting strain cannot grow at 250 μM PQ, whereas some evolved strains reach up to 2500 μM PQ. Evolved strains grow slower than the starting strain in the absence of PQ. (D) Treemap of mutations in all strains, grouped by gene with intergenic mutations assigned to nearest genes. UC: Uncharacterized. See Table S2, Methods. (E) Fraction of SNP types in this study compared with all public ALE studies on ALEdb (aledb.org; mean ± 95% confidence interval, n = 54). Each label corresponds to four of the twelve possible substitutions; for instance, “GC→AT” includes “G→A”, “G→T”, “C→A” and “C→T” substitutions. This study is enriched for mutations which decrease the GC content of the genome. (F-G) Comparison between the mean transcriptomes of the parent strain at 250 μM PQ vs. all evolved strains at 250 and 750 μM PQ. (F) DEG analysis with FDR = 0.1 and a minimum fold change of 0.78 (Methods), showing an intractably large number of DEGs. (G) Differential iModulon activity (DiMA) analysis, which compresses the differential transcriptomic changes into 42 DiMAs. DiMAs are colored by their category from panel (H). For more information about each iModulon, explore the PRECISE-1K E. coli dataset at iModulonDB.org and see Table S2. (H) Treemap of the explained variance of each iModulon in the transcriptome of the evolved strains (see Methods). The map is first broken into three parts: the colorful region, composed of iModulons that are differentially activated after the evolution and categorized, the light gray region composed of iModulons that do not show a significant trend with evolution, and the dark gray region, representing the error in the iModulon decomposition.
After evolution, growth rates for each endpoint under different PQ concentrations were measured (Figure 1C). The starting strain’s growth was severely impaired by low PQ concentrations, with no growth at 250 μM PQ. The evolved strains showed a dramatic increase in the concentration of PQ they can tolerate while still growing; some endpoint strains tolerated 2500 μM. There was a fitness cost to the PQ tolerance, however: the strains no longer grew as well in the absence of PQ as the starting strain. This observation is consistent with the tradeoffs of the PQ tolerization mechanisms.
Adaptive mutations reflect effects of PQ
Across the entire set of evolved endpoint strains in the PQ ALE, a total of 222 mutations were observed, representing 111 unique sequence changes. These totals include point mutations, indels, and amplifications as determined by the mutation caller. Each mutation was assigned to its closest gene in the case of intergenic mutations, and 72 total genes were affected. No new mutations in the previously mutated genes were observed, and none of the mutations reverted. Mutations were then categorized by their likely effects and visualized in a treemap where larger areas indicate genes that were more commonly mutated in the endpoint strains (Figure 1D, Table S2). The largest category of mutated genes was central and energy metabolism-related (35%), which reflect the metabolic effects of PQ on redox balance. Transporters were also frequently mutated (16%), likely to prevent influx or promote efflux of PQ or other ROS. Iron and iron-sulfur (Fe-S) clusters are sensitive to oxidative stress40, so we observed changes to iron regulators and Fe-S cluster synthesis genes (16%). Three large deletions were also notable (5%). Other mutations which were less convergent across endpoint strains (26%) were observed in ribosomal subunits, tRNAs, and lon protease, as well as across other parts of the metabolic network.
We performed DNA sequencing on several midpoint strains during the ALEs (Figure 1B), which provided insight into the most effective growth strategies since mutations tend to fix in the order of fitness benefit44. We note that emrE and aceE are among the first genes to be affected in all three of our first generation strains.
An interesting pattern arose in the observed single nucleotide polymorphisms (SNPs): compared to other ALE projects available on ALEdb8, they are highly enriched for changes from guanine or cytosine to adenine or thymine (Figure 1E; Fisher’s exact test p = 9.38*10−5). This enrichment was consistent with direct damage to DNA by ROS, since guanine is the most easily oxidized nucleotide39,45,46. Thus, these mutations might not only improve cellular fitness through genomic and transcriptomic changes, but also by physically tolerizing cellular DNA to oxidation.
iModulons enable analysis of complex transcriptomic changes
To identify transcriptomic adaptations, we performed RNAseq on the starting strain at 0 and 250 μM PQ, and on each evolved strain at 0, 250, and 750 μM PQ. In a comparison between the stressed samples for the pool of all evolved strains vs. the starting strain, we found 1,774 differentially expressed genes (DEGs) (Figure 1F), making detailed analysis using traditional transcriptomic methods challenging. Therefore, we applied iModulon analysis to enable interpretation.
The data was previously included in a large compendium of E. coli RNAseq data generated from a single wet lab protocol (PRECISE-1K23). By leveraging over 1,000 samples across diverse conditions, this dataset facilitated machine learning of global transcriptomic patterns. Following our pipeline32, ICA was performed on the full dataset. The result was a set of 201 iModulons, independently modulated gene sets which have similar expression patterns, along with their activities in each sample. iModulons reflect signals of any source that may affect the transcriptome: ‘Regulatory iModulons’ are those that are likely regulated by a known regulator, ‘Biological iModulons’ are enriched for a biological function but no currently known regulator, ‘Genomic iModulons’ represent the transcriptomic effect of changes to the genome in some samples in the data, and ‘Uncharacterized iModulons’ may be the result of technical noise or other unknown signals20. Together, the iModulons constitute a quantitative regulatory structure which maps well to the known TRN, and can be used to reduce the dimensionality of the dataset. The set of PRECISE-1K iModulons was characterized in a separate study47, and the iModulon structure is available at iModulonDB.org under E. coli PRECISE-1K21. In the remainder of this paper, we show the usefulness of applying the iModulon knowledge-mapping performed in the previous study to gain detailed biological insights as part of an ALE analysis toolkit.
iModulons enabled a global characterization of changes in the transcriptome. They summarize expression of sets of genes in an activity level, where each gene is weighted based on the strength of its predicted association with the regulatory signal. The evolved strains’ gene expression under PQ stress against the starting strain had only 42 statistically significant differential iModulon activities (DiMAs) (Figure 1G). Compared to the hundreds of DEGs, these 42 iModulon changes made the analysis of the large-scale changes in the transcriptome tractable. We iteratively characterized and categorized each of the DiMAs and assigned mechanistic hypotheses which explain their changes (Table S3). We also summarized the explained variance in the transcriptome (Methods) in Figure 1H, where the transcriptome is first broken into significant iModulon signals that exhibit a change after ALE, insignificant iModulon changes, and variance not captured by the iModulon structure. The significant iModulon signals are further broken down into categories, where stress-related and metabolic signals reflect the largest changes in the data.
Mapping between the genome and transcriptome reveals new insights
Modifications to the genome can affect the transcriptome in several ways: large deletions and duplications can directly alter the expression of genes involved, mutations in TFs can change the expression of their associated regulons, and the transcriptome can adjust due to changes in metabolites or other sensed processes that result from mutations. The latter type of alteration can be complicated by the fact that gene expression also regulates metabolite concentrations and sensed processes. In Figure 2A, we summarize how each of these types of relationships were observed in the evolved strains. Each relationship depicted in the figure was associated with evidence from our data and the literature, and several relationships are new; we provide all details in Table S4. iModulons play a central role in each highlighted mechanism, as evidenced by the full second column in Figure 2A. The combined analysis of genomic and transcriptional changes led us to six key cellular mechanisms of PQ tolerance (Figure 2B). We will now describe each of these relationships in order of increasing complexity.
Figure 2. Multilevel approach reveals mechanisms of PQ tolerance.
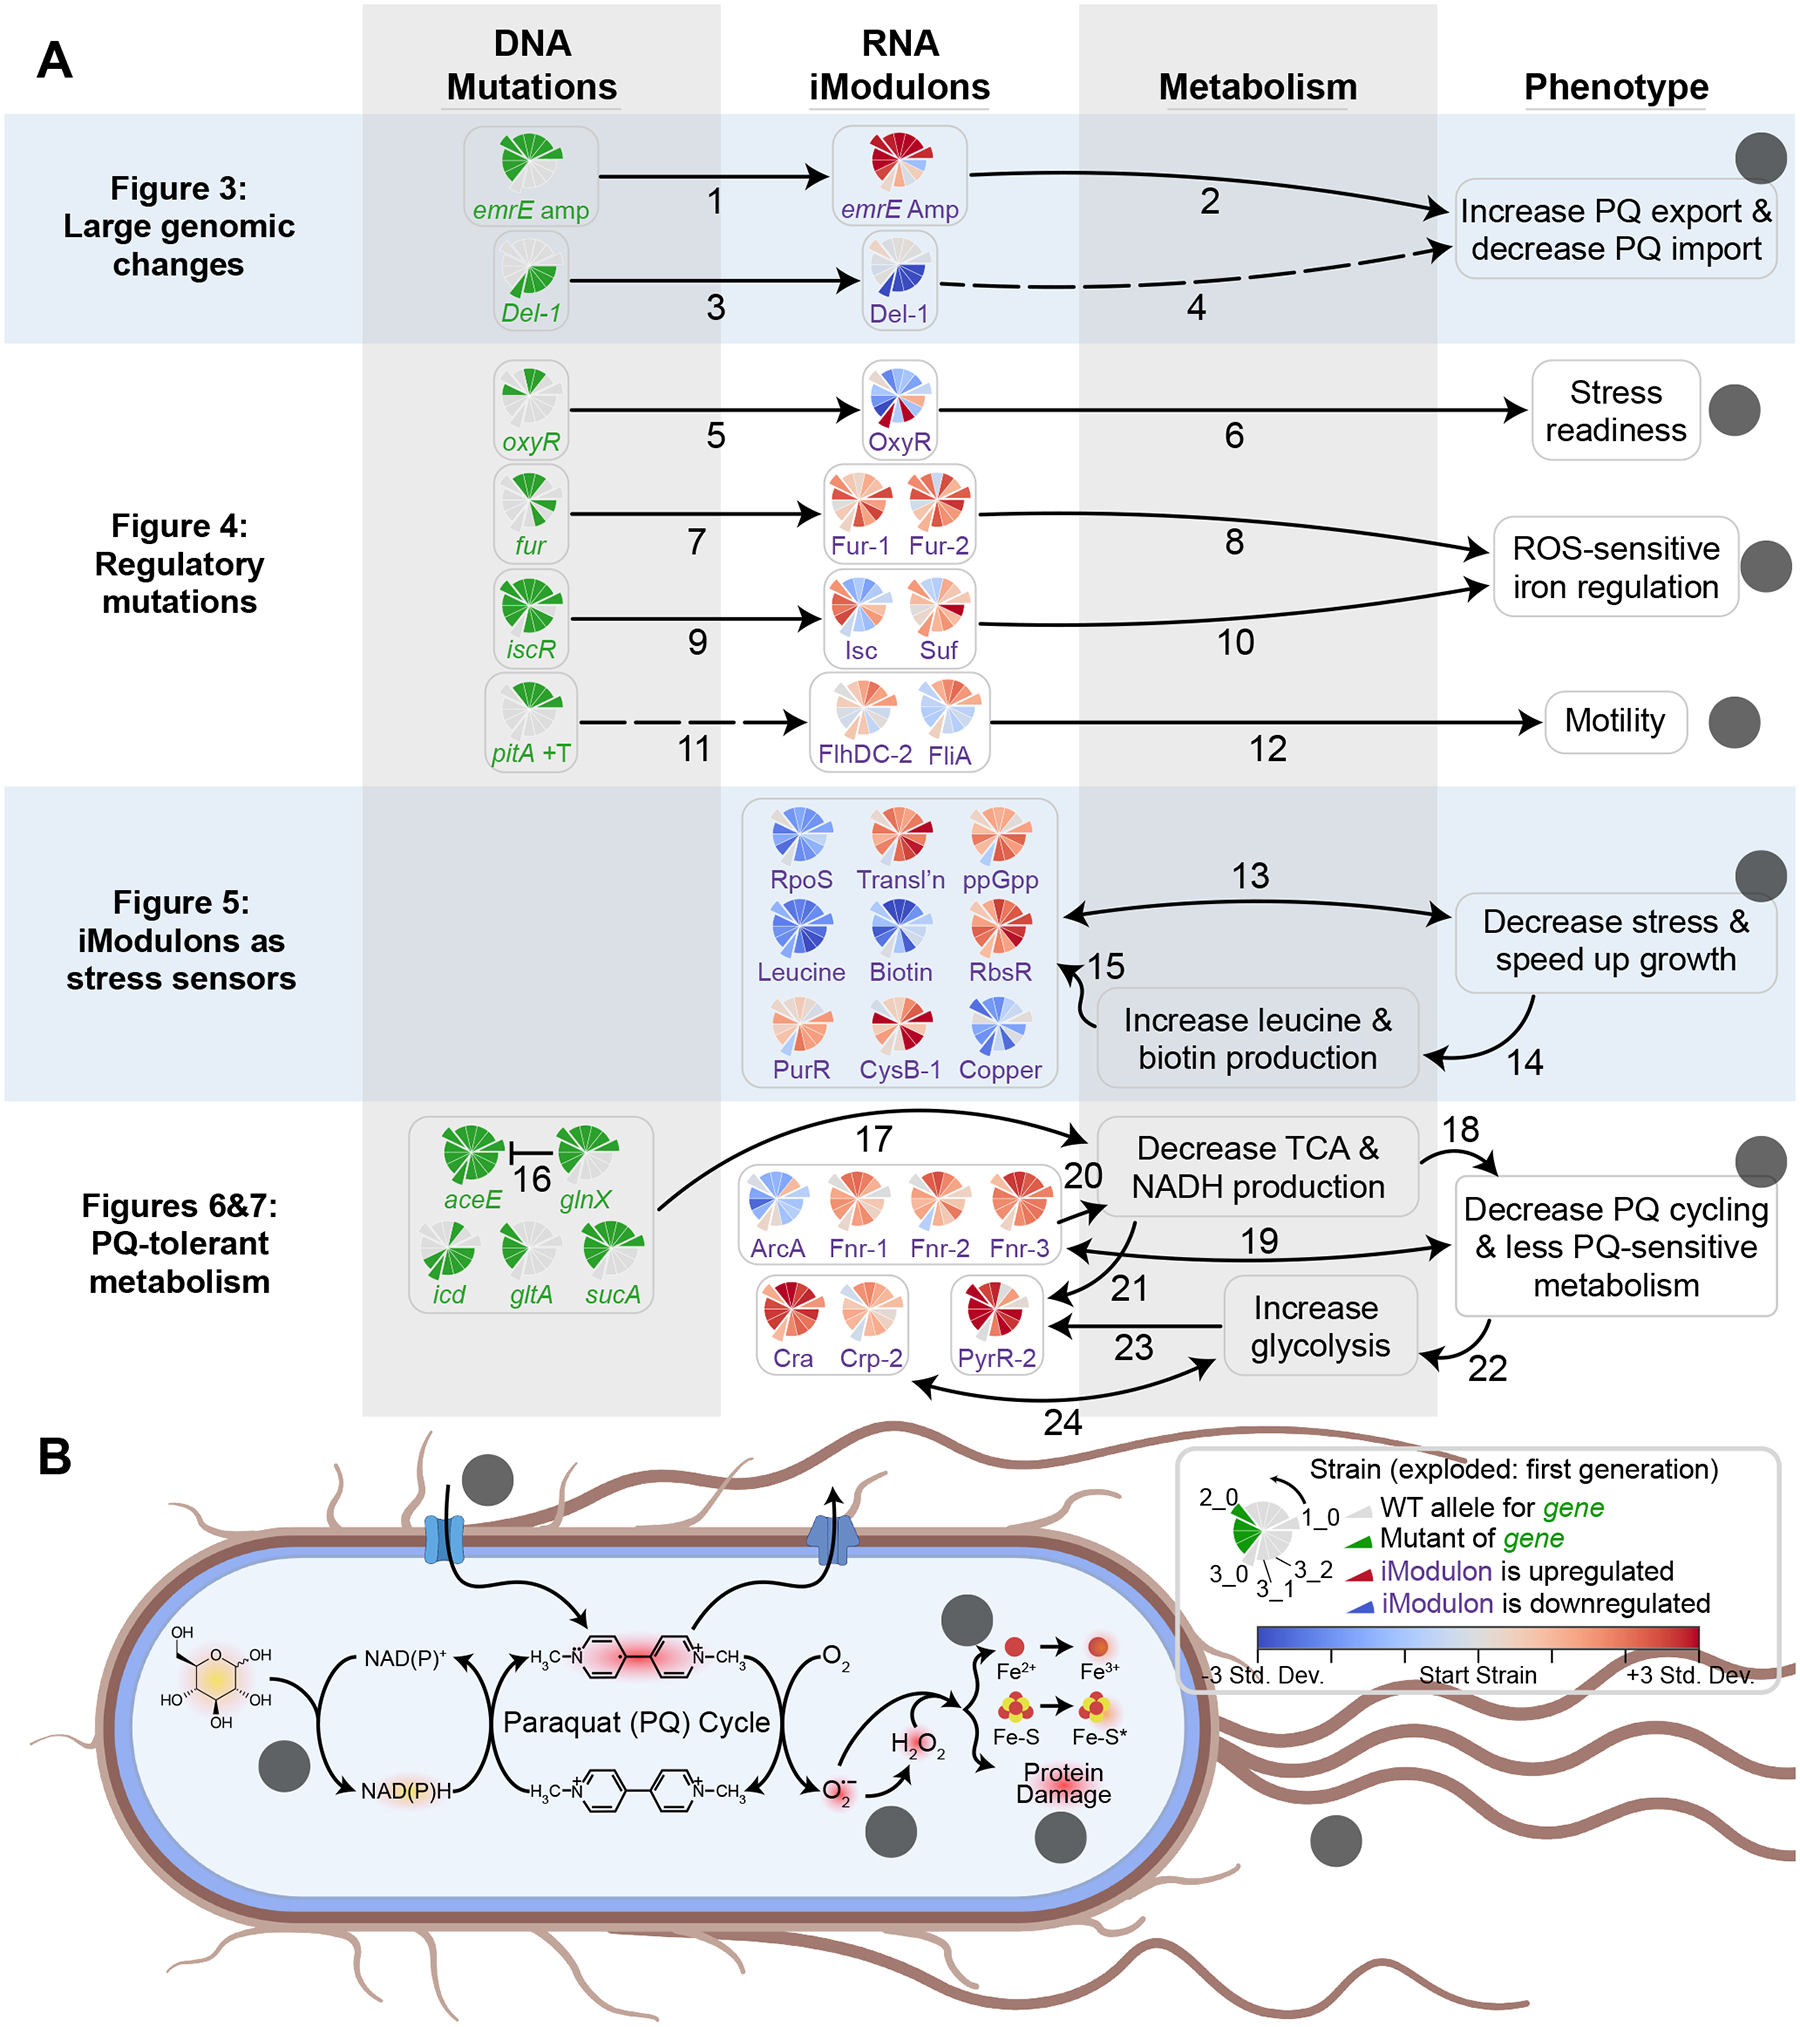
(A) Knowledge graph summarizing multilevel relationships between mutations, iModulons, metabolism, and phenotypes. Pie charts appearing in the two left columns indicate prevalence of given changes to the genome and transcriptome (legend in panel B), where wedges indicate strains. The protruding wedges correspond to the first generation of ALEs, with the wedges counterclockwise to them being their second generation descendants. For genes, green indicates the strain has mutations affecting it or its promoter. For iModulons, colors indicate the difference between the iModulon activity in the strain at 750 μM PQ and the starting strain at 250 μM PQ, normalized to the standard deviation of the iModulon activity across all of PRECISE-1K. Solid arrows represent hypothetical relationships with extensive experimental evidence, whereas dashed lines represent relationships for which there is little existing literature. Each arrow is labeled with a numeral corresponding to a row in Table S4 that describes the meaning, data evidence, literature evidence, and novelty of the corresponding relationship. (B) Phenotypic changes target specific processes involved in PQ and ROS stress. Lowercase letters indicate elements from the rightmost column of (A). Entities which glow are reduced, and red indicates stress-related molecules.
Large amplifications and deletions in the genome affect membrane transport
‘Genomic iModulons’ are transcriptomic modules which capture the effect of large changes to the genome, so they are of primary interest for obtaining genome-to-transcriptome relationships. In the PQ tolerant strains, the major genomic iModulons happen to all be associated with alterations in membrane transport.
The first mutation in each of the first-generation strains affected emrE, a multidrug efflux pump which pumps out PQ48. In 1_0, 2_0, and their subsequent evolutions, DNA sequencing reads mapped increased approximately 42-fold in the region containing emrE (Figure 3A). This was likely caused by repeated duplication (amplification) which may have been mediated by the flanking DLP12 prophage insertion sequence (IS) genes, specifically the IS3 transposase elements insEF349. ICA of the transcriptome recovered the amplified genes as an independent signal in the dataset, which we named the emrE Amp iModulon (called ROS TALE Amp-1 in PRECISE-1K23 on iModulonDB.org21). This iModulon showed elevated activity levels in all affected strains regardless of PQ concentration (Figure 3C). Thus, this case illustrates a relationship between the genome (gene amplification) and transcriptome (emrE Amp iModulon) with a likely beneficial phenotype (PQ efflux) – knowledge-mapping between these three levels to generate hypotheses like this one is the goal of our new approach (Figure 2A).
Figure 3. Consequences of deletions and amplifications affecting membrane transport are found in both genomes and transcriptomes.
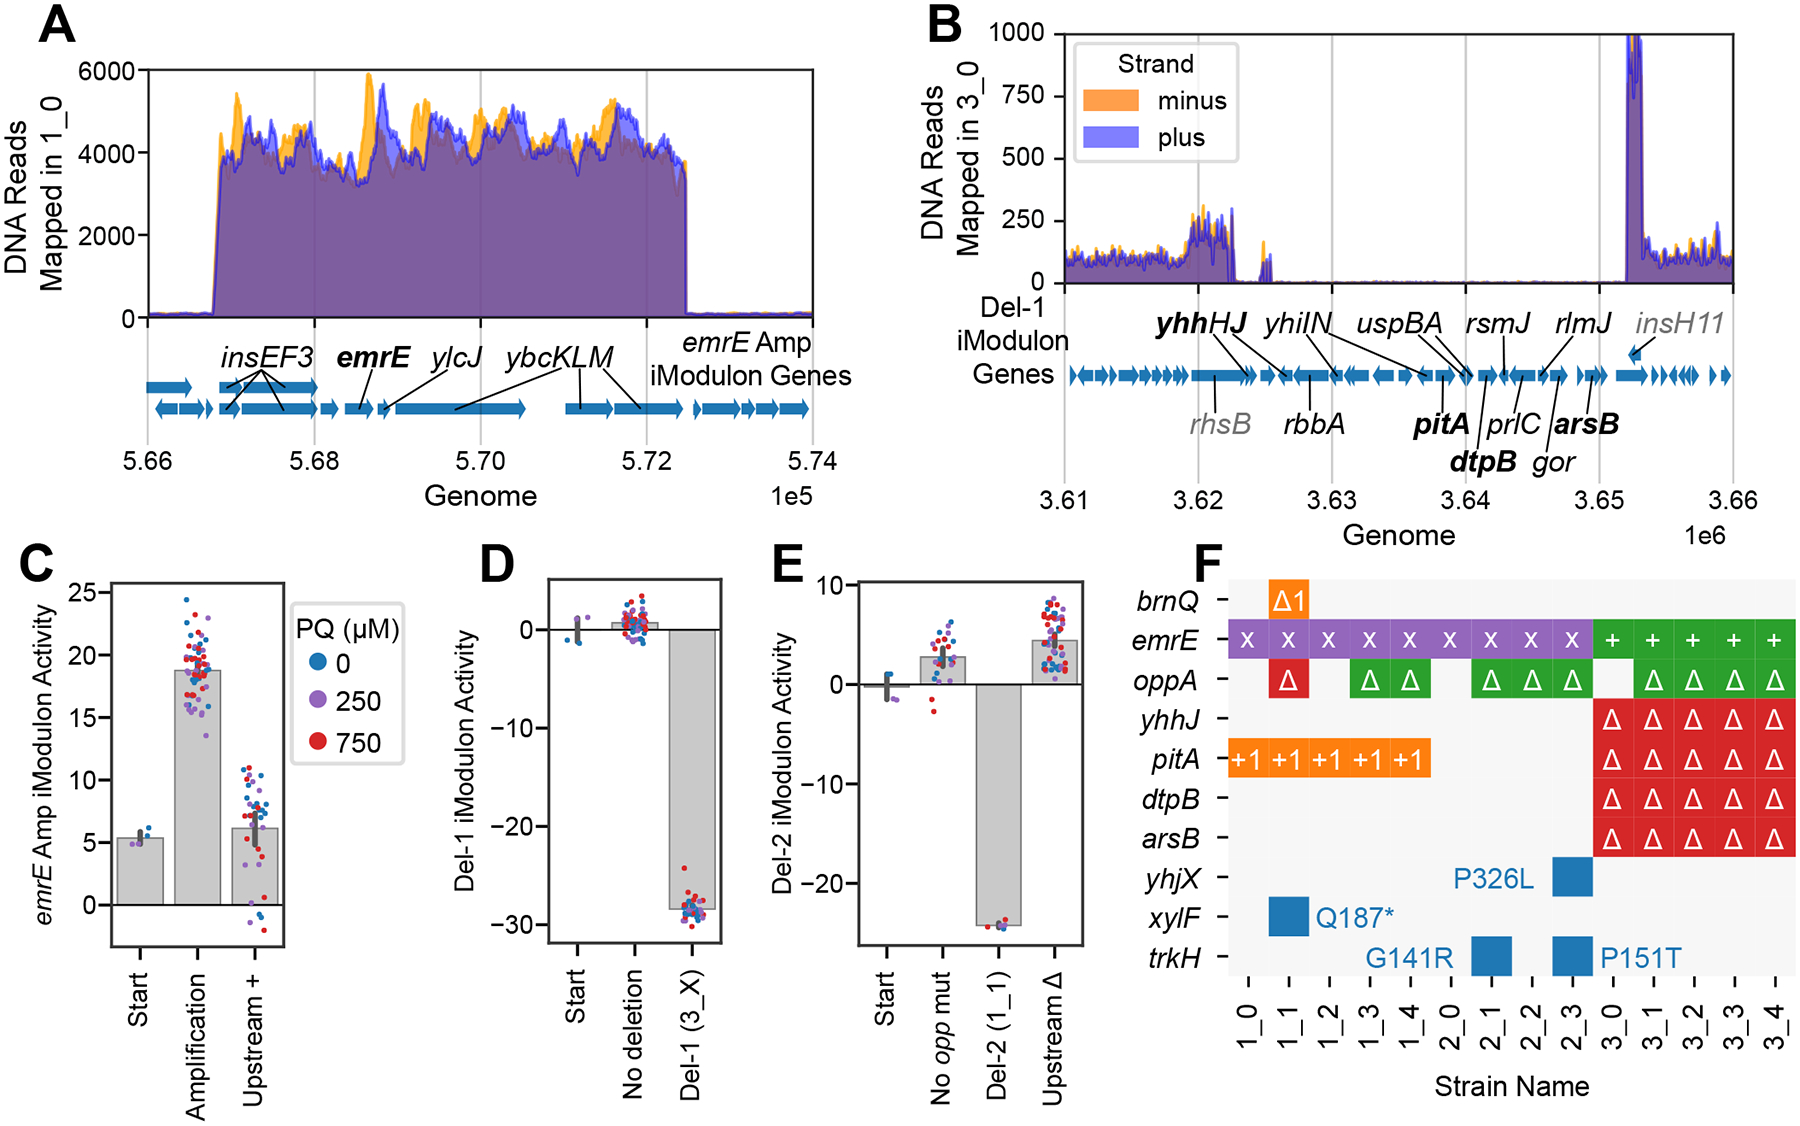
(A) Number of reads mapped to the region around emrE in strain 1_0, which is representative of strains containing the emrE amplification. Genes in the iModulon are labeled. (B) Number of reads from strain 3_0 mapped in the region of Del-1. Del-1 iModulon genes are shown in black, with flanking non-deleted, non-iModulon genes in gray, and transporters in bold. (C-E) iModulon activities for selected genomic iModulons. Bars indicate mean ± 95% confidence interval. Individual samples are color-coded by PQ concentration. Upstream + and Δ indicate insertions and deletions, respectively. (F) Color-coded table showing all observed mutations related to transporter genes. Purple x: amplification; green: upstream insertion (+) or deletion (Δ); blue: indicated SNP; orange: frameshift mutation within gene; red delta: complete gene deletion (See Table S2 for more details on each mutation).
We discuss Del-1, and Del-2, large deletions that contain several transporters (Figure 3B, D, E), and additional transporter mutations of potential interest (Figure 3F) in Supplementary Data S1 – Note S1. We hypothesize that these mutations and their related genomic iModulons may have decreased influx of PQ or other oxidized molecules.
Mutations in TFs alter the regulation of stress responses and iron homeostasis
‘Regulatory iModulons’ are iModulons which are statistically enriched with genes from a specific regulon, and their activity level quantifies the activity of the underlying TF. Thus, iModulon analysis reveals the effects of TF mutations in a convenient way.
The OxyR iModulon contains oxidative stress response genes, and its regulator, OxyR, responds to oxidative stress50. Thus, we expected its activity level to correlate with PQ level. We found that for most strains, this is the case (Pearson; p = 6.2*10−5). However, we observed three separate oxyR mutations which all fix OxyR iModulon activity levels at a level just below that of the stressed starting strain (Figure 4A), regardless of PQ concentration. We speculate that this level may be ideal because it enables quick detoxification of ROS, while higher levels would be proteomically expensive and/or induce growth-limiting levels of oxyS (which is regulated by OxyR and leads to growth arrest51). Previous iModulon work in other ALEs found that fixing OxyR in the active conformation provided a fitness benefit35. Without the OxyR iModulon to quantify OxyR activity, it would have been much more difficult to define the effect of these mutations.
Figure 4. Mutations regulate stress response, iron metabolism, and motility iModulons in novel ways.
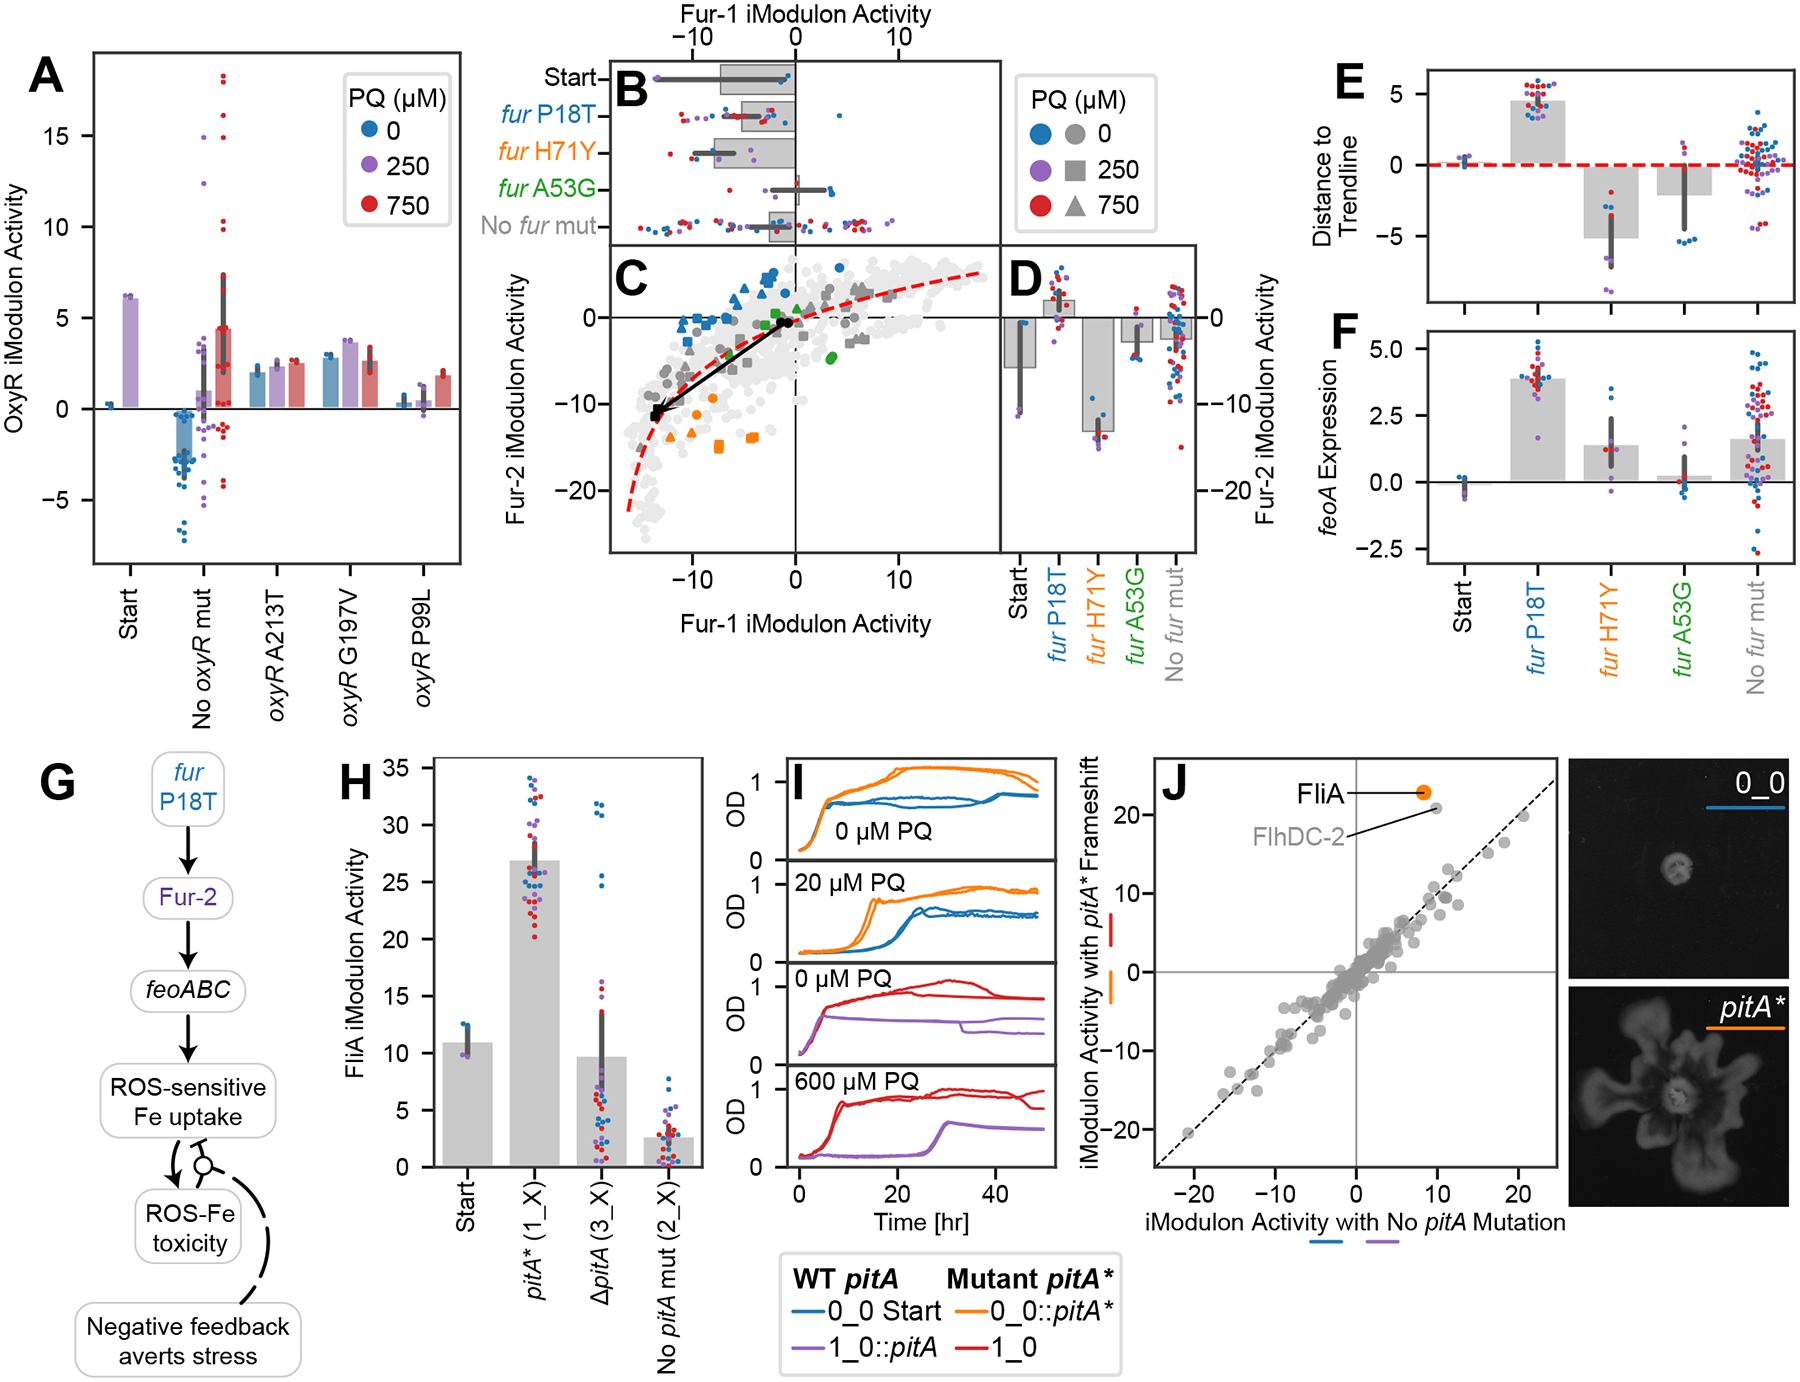
Bars indicate mean ± 95% confidence interval. (A) OxyR iModulon activity is correlated with PQ in starting and evolved strains (Pearson R = 0.47, p = 6.2*1−5), except for the three strains which mutated oxyR. PQ colors in the legend also apply to panels (B, D, E-F, H). (B-D) Scatter plot of Fur-1 and Fur-2 iModulon activities with bar plots sharing axes. Light gray dots indicate other samples from PRECISE-1K. In (C), samples are colored by relevant mutations, and shapes indicate PQ concentrations according to the legends. A black arrow connects the starting strain samples between 0 and 250 μM PQ. In bar plots, point colors indicate PQ concentrations and label colors match with the scatter plots. The red trend line is a logarithmic curve fit to all samples in PRECISE-1K. Samples with the P18T mutation are above the trend line, indicating a preference for Fur-2. (E) Distances from each sample in this study to the trend line in (B), more clearly showing the preference for Fur-2 induced by P18T. (F) feoA expression, which is representative of the feoABC operon. Genes are upregulated by the fur P18T mutation. (G) Knowledge graph linking fur mutation to negative feedback which averts stress. (H) FliA iModulon activities by pitA mutation, showing an upregulation in the case of the frameshift pitA*, but not in the case of pitA deletion. (I) Growth curves for strains with and without the pitA* mutation as the only difference. The mutation contributes to higher final ODs under no stress, and shorter lag and faster growth under stress. (J) DiMA for strains 0_0 and 1_0 with and without the pitA frameshift mutation under PQ stress. Points indicate the mean of all relevant samples (individual conditions in duplicate; n=6 per axis). The strains with the mutation significantly activate FliA, one of the motility iModulons. The point near FliA is FlhDC-2, the other major motility iModulon. (K) Representative images of swarming in the 0_0 strain with (bottom) and without (top) the pitA* frameshift. Scale bars: 1 cm. Additional plots: Figure S1; Images for all swarming experiments: Figure S2.
Fur, the ferric uptake regulator, regulates two main iModulons (Fur-1 and Fur-2) whose activities have a nonlinear relationship52 (Figure 4B–D, S1A). Three separate strains acquired fur P18T, which appears to shift Fur’s preference above the trend line, towards Fur-2 (Figure 4E). They specifically upregulate the expression of feoABC, a ROS-sensitive iron transporter53 (Figure 4F). By using feoABC to strongly couple iron uptake to ROS levels, this mutation should prevent ROS-induced iron toxicity by preventing iron uptake under high stress (Supplementary Data S1 – Note S2; Figure 4G). This mutation is of interest for further study, since it modifies the TRN in a unique way, and promotes a strategy of ROS-sensitive iron uptake that may be useful for production strains that are hampered by ROS.
The TFs IscR and SoxS also provide important insights (Figure S1; Supplementary Data S1 – Note S3).
These results highlight the efficacy of iModulon analysis for revealing TF mutational mechanisms. The Fur and IscR mechanisms predict that the ROS-sensitivity of Fe-S clusters can be used to couple iron uptake or utilization to ROS levels. The particular mutations ought to be introduced into production strains, where they could increase yields if ROS stresses are limiting.
An unexpected mutation in pitA upregulates motility
A frameshift in the phosphate transporter pitA led to a motile phenotype. This mutation occurred in 1_0 and its derivatives, and these strains also exhibited strong activation of motility-associated iModulons such as FliA (Figure 4H). There is no obvious connection between phosphate transport and motility, and the mutated strains were likely able to use the other phosphate transport system, pstABCS, to meet their phosphorus needs54. Interestingly, the 3_0 strain deleted pitA as part of Del-1 (Figure 3B), and it did not exhibit the motility phenotype. Thus, to understand this mutation, we generated two new strains: 0_0::pitA* and 1_0::pitA, which added the mutation on its own to the starting strain and removed it in favor of the original pitA sequence in the evolved strain, respectively. We found that the mutation provided a growth advantage under PQ stress (Figure 4I). We also transcriptomically profiled the strains under the same conditions used for our other strains, and found that, particularly under PQ stress, the mutation exclusively perturbs the motility iModulons (Figure 4J). The change to the transcriptome was also reflected in the phenotype, as the mutant strains swarmed on agar plates while the wild-type pitA strains did not (Figure 4K, S2). The detailed mechanism of action linking the pitA mutant to motility remains to be elucidated. There is also a possible connection to fermentation55 (Figure S2A, Supplementary Data S1 – Note S4).
This section illustrates the usefulness of our multilevel approach. After connecting mutations to their effects and predicting causes for DiMAs, we were left with an orphan mutation (pitA) and an unexplained DiMA (FliA). We predicted that the mutation caused the DiMA, and then we generated new strains to validate the prediction. The recapitulation of the expected iModulon change and swarming phenotype lends credibility to the iModulon method of elucidating mutational effects.
Shifting from stress to growth explains activity of several iModulons
Regulatory iModulons can be used not only to understand the direct effects of mutations as described above, but also effects of changes to the processes that TFs sense. We have divided these types of changes in the PQ tolerant strains into two categories: those that respond to stress and growth (21% of the variance in the transcriptome; Figure 1H), and metabolic changes (10%). In this section we describe the former.
An important global tradeoff in the E. coli transcriptome is between growth and general stress readiness, which is governed by complex regulation56,57. We previously described a ‘fear-greed tradeoff’ between the RpoS and Translation iModulons, in which the activity levels of the two iModulons have a negative correlation; faster growing cells exhibit low RpoS and high Translation activity20,35,52,58–60. Mutations which downregulate the RpoS regulon have been known to increase growth in long term culture61. A similar tradeoff between stress readiness and nutritional competence has also been described62. This previous knowledge can be applied to the new ALE strains: the starting strain without stress is ‘greedy’, but it becomes ‘fearful’ upon addition of PQ, as expected (Figure 5A–B). The evolved strains, on the other hand, largely remain ‘greedy’ in the presence of PQ; they strongly downregulate RpoS (Figure 5A) and have higher translation activity than the stressed starting strain (Figure 5B). Translation activity is decreased relative to the starting strain in the absence of PQ, likely because of tradeoffs towards ROS stress readiness.
Figure 5. Changes to stress and growth explain the changes to activity in several iModulons.
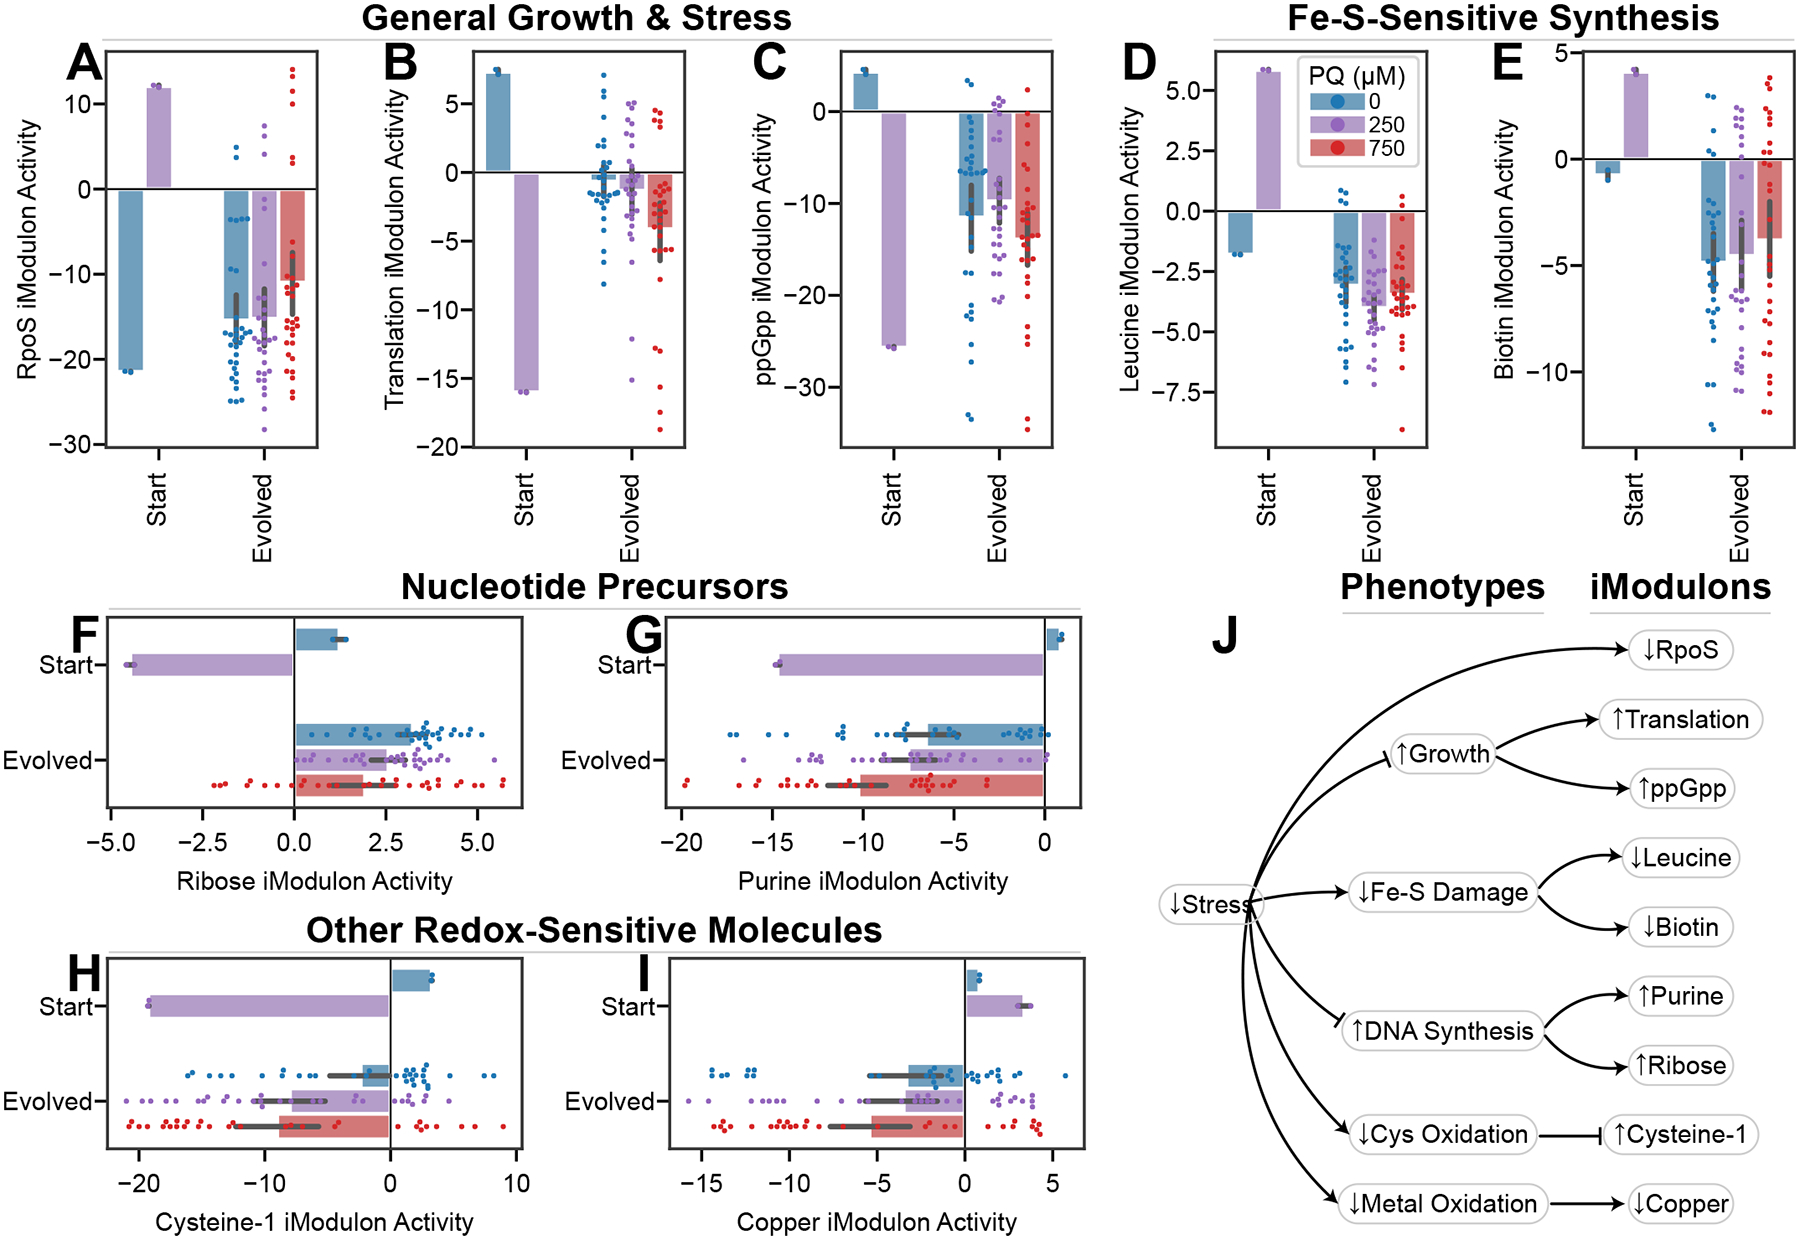
Mean iModulon activities ± 95% confidence interval; all plots use the legend in (D). P-values are false discovery rate corrected p-values from a DiMA comparison of stressed transcriptomes (250 and/or 750 μM PQ) between 0_0 and evolved strains. (A) RpoS activity, the general stress response, is downregulated (p = 0.017). (B) The Translation iModulon, ribosomes and translation machinery, is upregulated (p = 0.023). (C) The ppGpp iModulon, with many growth-related functions, follows a similar pattern to the Translation iModulon (p = 0.027). (D) The Leucine iModulon, which responds to leucine concentrations downstream of an Fe-S-dependent synthesis pathway, is downregulated after evolution, suggesting improved Fe-S metabolism (p = 0.0017). (E) The Biotin iModulon is downregulated after evolution. Biotin also depends on Fe-S-dependent synthesis (q = 0.017). (F-I) Ribose (p = 0.011), Purine (p = 0.036), Cysteine-1 (p = 0.025), and Copper (p = 0.034) iModulon activities behave differently in starting and evolved strains (Supplementary Data S1 – Note S5). (L) Knowledge graph connecting decreased oxidative stress to each of the iModulon changes shown.
Despite the presence of stressors and the activation of specific ROS responses OxyR and SoxS, the general stress response is not activated in the evolved strains. The stress signals are downregulated by the success of the evolved tolerance strategies, and the growth-inhibiting effects of RpoS have selected against strains with high RpoS activity. This work agrees with previous findings that ALE shifts allocation toward ‘greed’20,35,58. The decoupling of the ROS and general stress responses makes these strains ROS-response specialists, constituting a valuable adaptation strategy.
Two DiMAs reflect a decrease in oxidative damage by sensing Fe-S-dependent metabolites. The Leucine iModulon (Figure 5D) encodes the leucine biosynthesis pathway, which requires an Fe-S cluster and other metal-dependent enzymes that are sensitive to oxidative stress63. Leucine feeds back to inhibit the iModulon’s expression64. In the starting strain with PQ, oxidative damage likely leads to a decrease in leucine concentrations and an upregulation of the iModulon. By contrast, the evolved strains experience less stress, protect their Fe-S clusters, and therefore exhibit low Leucine iModulon activity. Similarly, the Biotin iModulon (Figure 5E) uses an Fe-S cluster in BioB to synthesize biotin65, which then controls iModulon activity via regulation by BirA66.
The activities of the ppGpp, Purine, Ribose, Cysteine-1, and Copper iModulons (Figure 5C, F–I) each also reflect decreased stress and a return to homeostasis in the evolved strains (Figure 5J; Supplementary Data S1 – Note S5).
Thus, iModulons measure the sensory output of the TRN and allow us to mine the transcriptome for insights into many cellular processes. Because we also have an understanding of the stress phenotype of our cells, we predicted reasons for a large fraction of transcriptional alterations. This approach would be useful to any researcher seeking to enumerate phenotypic alterations in novel strains using RNAseq data as a guide.
Mutating central and energy metabolism genes decreases PQ cycling
We now turn to metabolism, which involves a complex interplay of effects (Figure 2A). We show that enzyme mutations can suggest tolerance strategies, and then modeling can validate them. iModulon analysis reveals how those strategies are organized and regulated by the cell.
The main metabolic mutations occur in the tricarboxylic acid (TCA) cycle. The second gene to mutate in all strains was aceE (Figure 1B, D). aceE encodes a subunit of pyruvate dehydrogenase (PDH), the entry point into the TCA cycle. gltA, sucA, and icd also mutate often, with icd being affected by e14 deletion and SNPs68 (Figure 6A). These mutations would likely decrease the function of the enzymes, thus decreasing TCA cycle flux and production of NADH. These mutations suggest a tolerance benefit to decreasing NADH production. The likely reason for this benefit is that PQ uses electrons from NAD(P)H to reduce oxygen and generate stress69–71. These mutations decrease the available electrons to the PQ cycle and prevent stress generation. To decrease oxidative stress from PQ, the evolved strains perform less oxidative metabolism. The supplementary Fe-S and motility mechanisms (Supplementary Data S1 – Note S3, S4) also shift strains away from NADH production.
Figure 6. Mutations drive metabolic rerouting toward fermentation to avoid PQ cycling by decreasing NADH availability.
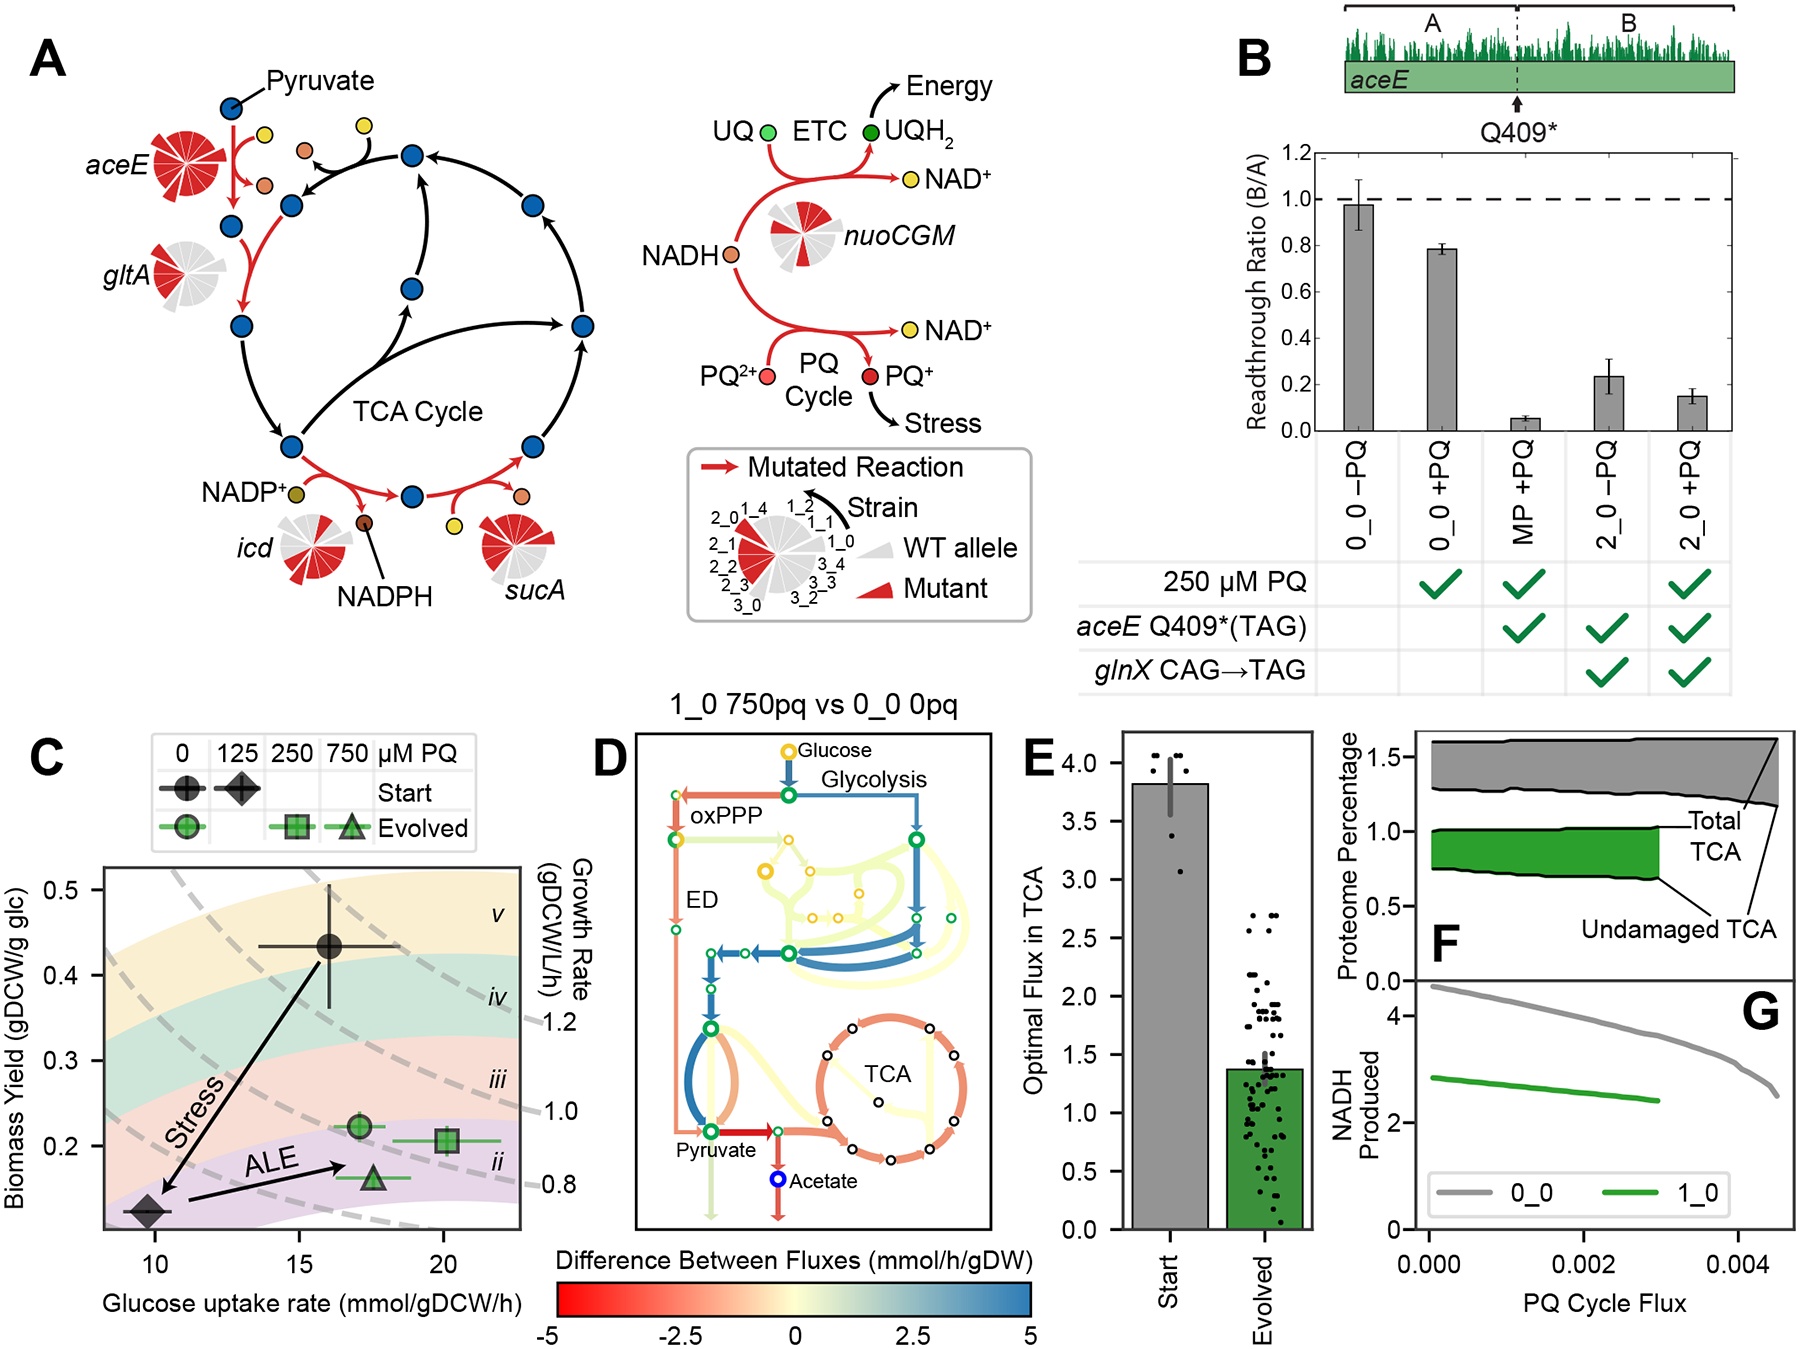
(A) Simplified metabolic map of the TCA cycle and fate of NADH. Reactions catalyzed by mutated enzymes are shown in red and labeled with a pie chart indicating which strains have a wild-type (WT) or mutant allele. First generation strains in the pie chart protrude, with their descendants following them counter-clockwise. (B) Ribosome readthrough ratio in aceE from ribosome profiling, means ± standard deviation, n = 3. The ratio B/A is the fraction of ribosomes bound downstream (B) vs. upstream (A) of the early amber stop codon (TAG) in aceE. The midpoint (MP) strain has aceE Q409* with WT glnX, whereas the 2_0 strain has both aceE Q409* and the glnX anticodon mutation that enables ribosomes to read through the amber stop codon. In evolved strains such as 2_0, PDH levels are decreased but not zero. (C) Aero-type plot67 computed from measured growth rates and glucose uptake rates, where points represent means ± SEM (strains in duplicate; black n = 2, green n = 26), with constant growth rate isoclines. Colored regions labeled with roman numerals are aero-type regions as defined previously12. Cells switch to a lower aero-type with PQ and increase their glucose uptake after evolution. (D) Flux differences from the OxidizeME model, comparing the starting strain with no PQ and a representative evolved strain at high PQ. Model was constrained by growth rate, glucose uptake rate, and RNAseq data (Figure S4). (E) Each point represents a TCA cycle reaction in the constrained OxidizeME models; models of evolved strains predict lower TCA cycle fluxes. (F-G) OxidizeME model results in mmol/gDCW/h for 0_0 and 1_0, constrained by growth rate, glucose uptake rate, and RNA expression. (F) As PQ cycle flux increases, the damaged fraction (filled in) of the TCA cycle increases. (G) NADH production decreases with PQ, but is more sensitive in 0_0. 0_0 can also carry more PQ cycle flux.
Loss of function (LOF) mutations in the TCA cycle come with a cost, since those pathways are the primary energy source for aerobic cells. Indeed, the evolved strains have decreased growth and translational activity under no stress relative to the starting strain, probably for this reason (Figure 1C, 5B). During ALE, the strains must therefore balance a tradeoff: generate enough NADH to grow and repair themselves, but not so much as to over-empower the PQ cycle. The tradeoff is embodied by an interesting interaction between mutations the aceE and glnX mutations, in which a tRNA mutation partially restored PDH activity (Figure 6B; Supplementary Data S1 – Note S6).
We summarize all metabolic mutations in Figure S3 and Table S2. We also observe mutations in enzymes involved in the utilization of NADH (Figure S3A; Supplementary Data S1 – Note S7). Next, we characterize the strains using a variety of tools to test this explanation for the selection for TCA cycle mutations.
Metabolic rewiring towards a lower aero-type decreases PQ sensitivity and flux in evolved strains
We quantified glucose uptake for each strain at various PQ levels (Supplementary Data S1 – Note S8), and generated a plot comparing biomass yield per gram of glucose to the glucose uptake rate (Figure 6C). This rate-yield plane has been characterized in past studies12,67, which revealed distinct energy generation strategies (aero-types) for each position in the plane. Samples with high biomass yields are in the highest aero-type (aero-type v), which represents efficient aerobic growth, whereas lower aero-types are associated with lower aerobicity and secretion of organic acids12.
In Figure 6C, we observe a switch to a lower aero-type in the starting strain upon PQ exposure, since ROS damage decreases growth rate and particularly damages respiration. In the evolved strains, the lower aero-type is maintained even when no PQ is present. The aero-type change is likely due to the TCA cycle-related mutations, which we predicted would decrease respiration. However, the evolved samples also shift rightward, increasing their glucose uptake and total metabolic flux, enabling them to maintain growth under stress. Their position in the plane doesn’t vary much with PQ concentration, indicating decreased sensitivity.
To characterize metabolism in silico, we used OxidizeME, a genome-scale computational model of E. coli metabolism and expression (ME) which incorporates ROS stress effects3. We constrained the model using growth rates, glucose uptake rates, and RNA expression, then simulated optimal steady states (Figure 6D, S4). Though we did not attempt to simulate the effects of mutations on the reaction rates, the optimal flux distributions in the evolved strains showed decreases in TCA cycle flux (Figure 6E), consistent with the predicted effects of the mutations.
In the absence of experimental methods for directly measuring PQ cycle flux, we computationally assessed the consequences of PQ cycle flux by varying it for the starting strain and a representative evolved strain (Figure 6F–G). Though total proteomic allocation to the TCA cycle was constrained to match the RNA expression, ROS damage to the Fe-S clusters in acnA, fumAB, and sdhABCD led to decreasing functional proteome fractions (Figure 6F). The starting strain relied more heavily on the TCA cycle; this made it more sensitive to PQ, as evidenced by the steeper slope in NADH production (Figure 6G). The starting strain was also able to grow at higher PQ fluxes, which is inefficient and exacerbates stress. Thus, tolerization both decreases sensitivity to lower PQ fluxes and prevents a steady state with high PQ flux.
The genome-scale OxidizeME model integrates the individual cellular processes and RNA expression changes which adjust the phenotype, and it elucidates key systems level tolerization strategies. Its results match expectations from mutational analysis.
iModulon activities shift tolerant strains towards anaerobic metabolism and glycolysis
Finally, we discuss iModulons which regulate the metabolic rerouting presented above. The cellular oxidation state is sensed and regulated by ArcA and Fnr72, whose iModulons are differentially activated in the evolved strains (Figure 7A–D). Both TFs sense redox balance, which shifts towards reduction in the evolved strains due to the successful tolerization: ArcA represses when the electron transport chain is in a reduced state73, whereas Fnr repression ceases when Fe-S clusters are intact74 (Figure 7E). These transcriptional changes shift from aerobic respiration genes toward anaerobic fermentation genes72 (despite the aerobic ALE conditions). This strategy maintains a lower aero-type and decreases reliance on NADH. Thus, this mechanism reinforces the decreased reliance on the TCA cycle brought on by the mutations, ultimately slowing PQ cycling.
Figure 7. Mutations and iModulon reallocation drive metabolic rerouting toward fermentation to avoid PQ cycling.
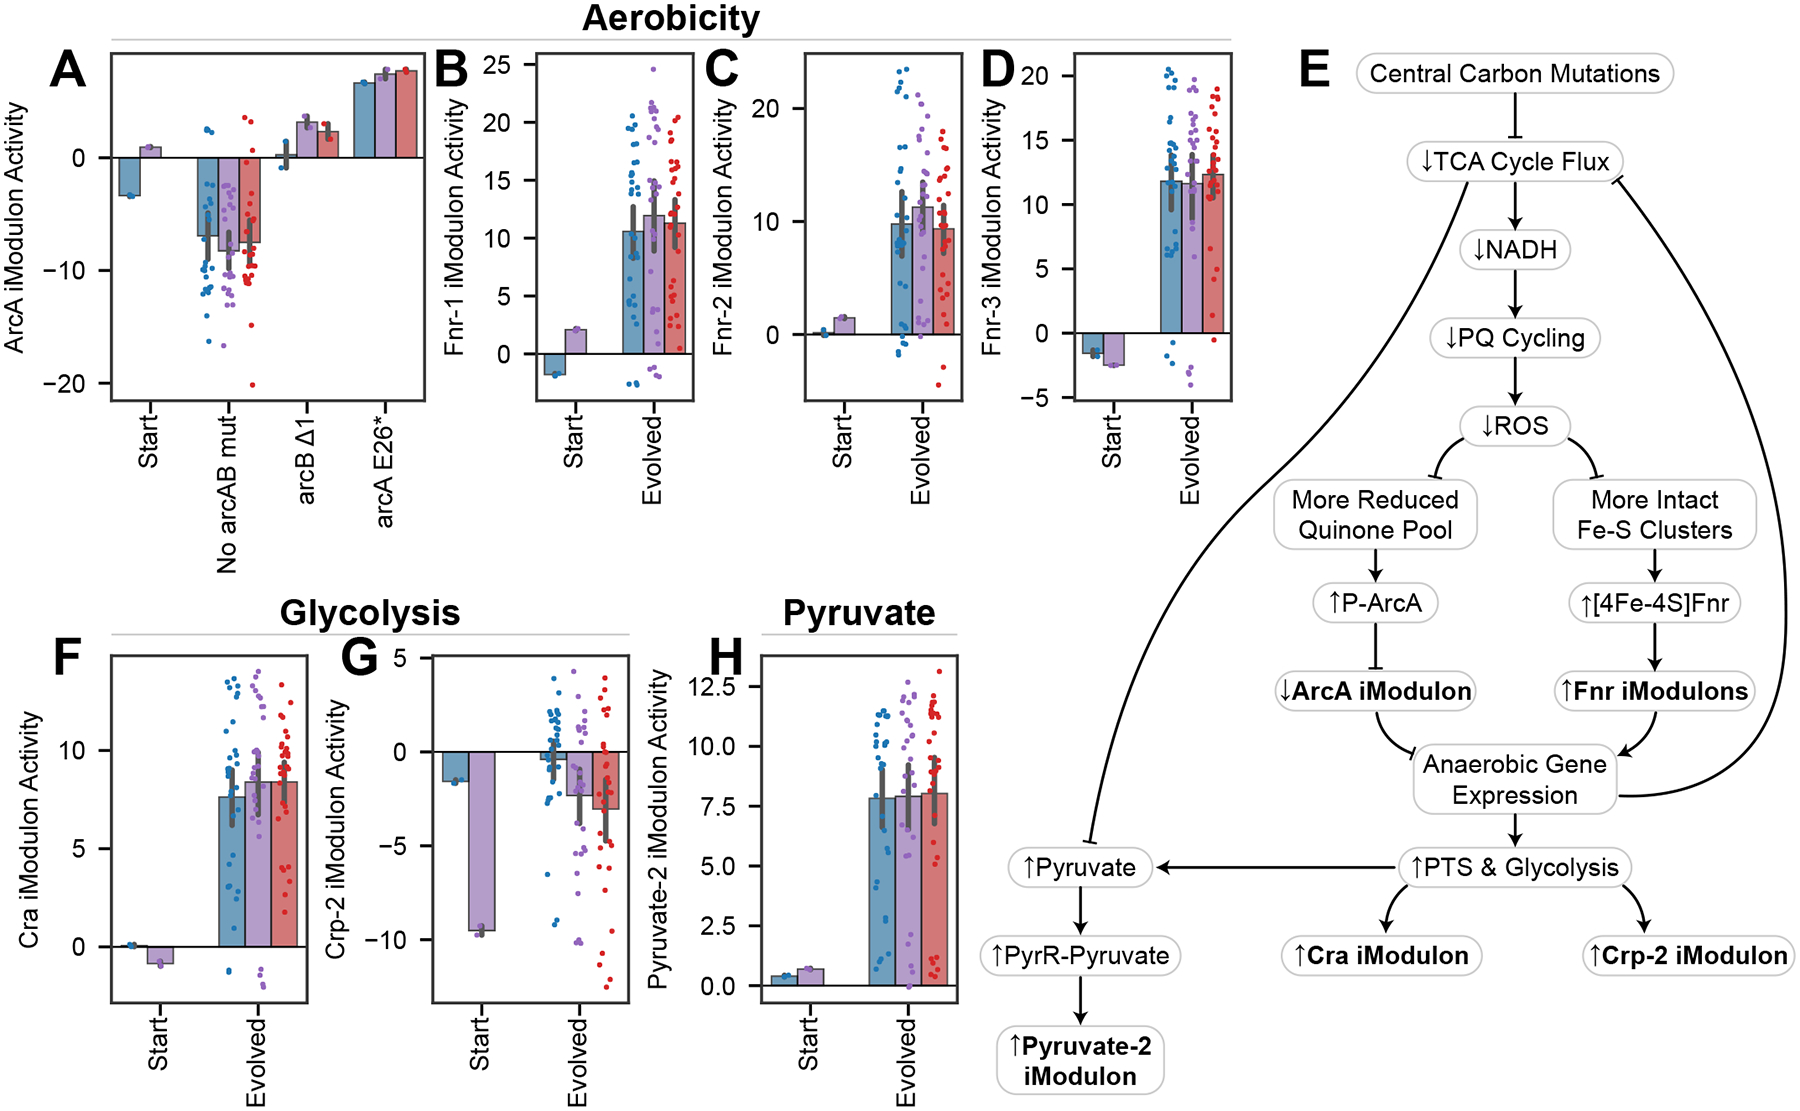
Bars indicate mean iModulon activities ±95% confidence interval. P-values are false discovery rate corrected p-values from a DiMA comparison of stressed transcriptomes (250 and/or 750 μM PQ) between 0_0 and evolved strains. (A) ArcA iModulon activities are mostly decreased after evolution, except in the case of mutations to arcAB (p = 0.035). ArcA contains aerobic metabolism genes. (B-D) Fnr controls three iModulons with anaerobic metabolism genes, all of which are upregulated (p = 0.034, 0.030, 0.023). (E) Knowledge graph describing changes in the evolved strains connecting central carbon mutations to anaerobic and glycolytic gene expression, which decreases TCA cycle flux and ROS generation. (F) The Cra iModulon, which contains glycolytic genes that are repressed by Cra, is upregulated (p = 0.017). (G) The Crp-2 iModulon, which controls phosphotransferase systems, is upregulated (p = 0.022). (H) The Pyruvate-2 iModulon is upregulated (p = 0.012).
To meet energy needs with lower respiration, the cells increased their glycolytic activity, a change which is described by two DiMAs. Cra iModulon activity increases, indicating an increase in glycolytic flux (Figure 7F). Similarly, the Crp-2 iModulon returns to unstressed or intermediate levels in the evolved strains, which indicates a more active phosphotransfer system (Figure 7G). This transcriptomic change matches the rightward shift in the aero-type plot (Figure 6C). Finally, the LOF mutations downstream of pyruvate should increase pyruvate concentrations, which strongly upregulate the Pyruvate-2 iModulon (Figure 7H). More details for all transcriptional mechanisms in this section are provided (Supplementary Data S1 – Note S9).
In the past three sections, we showed that mutations and iModulon activity adjustments work together to enforce a low aero-type, PQ-tolerant metabolic network. The PQ tolerance stems from a decreased reliance on the TCA cycle and decreased NADH production, which leads to less total PQ cycling and makes the system less sensitive to small amounts of PQ cycling. It is often difficult to interpret biological systems when genes, gene expression, and metabolic flux are all changing, but our multilevel approach produced a consistent and comprehensive interpretation of multiple data types.
Discussion
We combined ALE with a detailed, systems-level transcriptomic analysis to reveal mechanisms underlying PQ tolerance. The approach spanned four ALE analysis tools (Figure 2A): (i) genetic alterations and their predicted effects, (ii) transcriptomic adaptations along with up- and downstream inferences about their regulatory causes and physiological impact, (iii) metabolic fluxes calculated from genome-scale metabolic models, and (iv) phenotypic changes such as swarming motility. We found iModulon analysis to be particularly revealing, as the TF activities could be readily quantified and utilized to infer a wealth of information about the phenotypic state. We combined these approaches to summarize a coherent set of PQ tolerization strategies.
The evolved strains achieved high tolerance through several mechanisms (Figure 2B). They promoted efflux of PQ via emrE segmental amplification, and precluded influx by mutating or deleting various other transporters. Inside the cells, PQ failed to generate as much ROS due to LOF mutations in and downregulation of NADH-producing pathways. To compensate for the decreased biomass yield of their metabolism, the cells increased glucose uptake and glycolytic flux. Since ROS interact with iron, some strains modified iron regulation via TF mutations that curtailed these systems when stress was high. These mutational and metabolic strategies led to a decrease in stress, which was sensed by the TRN and shifted various regulators toward faster growth.
The impact of this study is threefold. (i) We present biological insights of wide interest to researchers, including the growth/stress tradeoff of redox metabolism, the use of Fe-S clusters as a brake on iron uptake and metabolism, and novel interactions such as those between pitA and motility and between aceE and glnX. (ii) Acquired mutations and iModulon activities can become design variables to mitigate oxidative stress for bioproduction applications. (iii) We demonstrate an approach that utilizes iModulons to reveal a novel integrated perspective on adaptation to stress by understanding transcriptomic allocation.
Taken together, our results demonstrate the usefulness of curated iModulon structures like PRECISE-1K as part of the hypothesis-generation toolkit for ALE strain analysis. We elucidate several systems-level strategies of ROS tolerization using genome-scale datasets, computational models, and detailed literature review. Given the falling cost of RNAseq, development of laboratory evolution, and the availability of this pipeline developed here, we expect that future ALE-derived and other strains can also be characterized from this new perspective, revealing novel cellular functions and adaptations.
Limitations of the study
The application of iModulon analysis to ALE as performed here has important limitations to note. Firstly, iModulons are not a perfect representation of the transcriptome: as described in other publications20,23, the ICA algorithm assumes that each regulator behaves independently, has a non-gaussian activity distribution in the dataset, and has a linear effect on genes. These assumptions enable a quantitative representation that is better than competing algorithms75, but may break down for the more complex regulons. Also, as with any dimensionality reduction, not all variance in expression is captured by the iModulons: in the samples discussed here, the iModulons explain 80.5% of the original expression dataset. In addition, the regulator annotations for each iModulon are statistically significant, but they may not accurately capture all of the regulation underlying each set of genes. For this reason, the more complicated observations were double-checked against the original data matrix, and we do not claim to mechanistically explain the entire transcriptome.
Another key limitation of the study is that the relationships put forward have not been rigorously tested. The scope of this work is to demonstrate how knowledge-mapping from major signals of the transcriptome leads to mechanistic predictions about a wide variety of systems in ALE. This gives this manuscript a broad scope, and we strongly encourage follow-up studies to rigorously test specific hypotheses. We clearly state the available evidence in the manuscript, supplemental notes, and Table S4.
STAR Methods
Resource Availability
Lead contact
Further information and requests for resources and reagents should be directed to and will be fulfilled by the lead contact, Bernhard Palsson (palsson@ucsd.edu).
Materials availability
Strains generated in this study are available upon request.
Data and code availability
RNA-seq data have been deposited to GEO and are publicly available as of the date of publication, under accession numbers GSE134256 and GSE221314. DNA-seq data are available from aledb.org under the project “ROS”. iModulons and related data are available from iModulonDB.org under the dataset “E. coli PRECISE-1K”.
All original code and data to generate figures are available at github.com/SBRG/ROS-ALE, which also links to the alignment, ICA, and iModulon analysis workflows32. It has been deposited at Zenodo and is publicly available as of the date of publication76. The DOI is 10.5281/zenodo.7449004.
Any additional information required to reanalyze the data reported in this paper is available from the lead contact upon request.
Experimental Model and Subject Details
Microbial strains
The starting strain (0_0) was an MG1655 K-12 E. coli strain which had been evolved for optimal growth on glucose as a carbon source in M9 minimal media43. Mutations for the starting strain are given in Table S1, and mutations for all strains are listed on aledb.org and in Table S2.
Culture conditions
Strains were grown overnight in M9 minimal media with 0.4% w/v glucose as a carbon source. Fresh media was inoculated with the overnight culture at an initial 600 nm optical density (OD) of 0.025. Cultures were aerated with a stir bar at 1100 rpm in a water bath maintained at 37°C until OD reached 0.5. 50 mM PQ was added to reach the desired concentration in stressed flasks. After 20 minutes, samples were harvested for transcriptomics or ribosome profiling.
Method Details
Adaptive laboratory evolution
ALE was performed using a similar protocol to Mohamad et al. 201777. Parallel cultures were started in M9 minimal medium by inoculation from isolated colonies. Evolution was performed in an automated platform with 15 mL working volume aerobic cultures maintained at 37°C and magnetically stirred at 1100 rpm. Growth was monitored by periodic measurement of the 600 nm OD on a Tecan Sunrise microplate reader, and cultures were passaged to fresh medium during exponential cell growth at an OD of approximately 0.3. Growth rates were determined for each batch by linear regression of ln(OD) versus time. At the time of passage, PQ concentration in the fresh medium batch was automatically increased if a growth rate of 0.08 h−1 had been met for 3 consecutive flasks. Samples were saved throughout the experiment by mixing equal parts culture and 50% v/v glycerol and storing at −80°C.
DNA sequencing and mutation calling
DNA was isolated as described78. Total DNA was sampled from an overnight culture and immediately centrifuged for 5 min at 8,000 rpm. The supernatant was decanted, and the cell pellet was frozen at −80°C. Genomic DNA was isolated using a Quick-DNA Fungal/Bacterial Microprep Kit (Zymo Research) following the manufacturer’s protocol, including treatment with RNase A. Resequencing libraries were prepared using a Kapa Hyper Plus Kit (Roche Diagnostics) following the manufacturer’s protocol. Libraries were run on HiSeq and/or NextSeq (Illumina).
Sequencing reads were filtered and trimmed using AfterQC version 0.9.779. We mapped reads to the E. coli K-12 MG1655 reference genome (NC_00913.3) using the breseq pipeline version 0.33.110. Mutation analysis was performed using ALEdb8.
Physiological characterization
Growth curves and extracellular glucose and organic acid concentrations were obtained by inoculating cells from an overnight culture to a low OD using the same conditions as the ALE. For each strain, we started with 0 PQ. OD measurements and samples were taken at various time points until stationary phase was reached. We then passaged the cells into a new flask, stepped up the PQ concentration, and characterized the next curve, for concentrations 125, 250, 500, 750, 1500, and 2500 μM. We stopped if growth was not observed after 48 hours. For each flask, growth rates were determined by linear regression of ln(OD) versus time in the early exponential part of the curve.
We took cell culture samples at the same time as OD measurements for the starting strain at 0 and 125 μM PQ, and for the evolved strains at 0, 250, and 750 μM PQ. Samples were sterile filtered, and extracellular by-products were determined by high pressure liquid chromatography (HPLC). The filtrate was injected into an HPLC column (Aminex HPX-87H 125–0140). The concentrations of the detected compounds were determined by comparison to a normalized curve of known concentrations. Substrate uptake and secretion rates in the early exponential growth phase were calculated from the product of the growth rate and the slope from a linear regression of the grams (dry weight) (gDW) versus the substrate concentration. The biomass yield was calculated as the quotient of the growth rate and the glucose uptake rates during the exponential growth phase.
RNA Sequencing
3 mL of induced culture was added to 6 mL of RNAProtect Bacteria Reagent (Qiagen) and vortexed, then left at room temperature to incubate for 5 minutes. Cells were pelleted, resuspended in 400 μL elution buffer, and then split into two tubes with one kept as a spare. One pellet was then lysed enzymatically with addition of lysozyme, proteinase-K, and 20% SDS. SUPERase-In was added to maintain the integrity of the RNA. RNA isolation was then performed according to the RNeasy Mini Kit (Qiagen) protocol. rRNA was depleted using the Ribo-Zero rRNA Removal Kit for gram negative bacteria according to the protocol. Libraries were constructed for paired-end sequencing using a KAPA RNAseq Library Preparation kit. Reads were sequenced on the Illumina NextSeq platform.
As part of the PRECISE-1K dataset47, transcriptomic reads were mapped using our pipeline (https://github.com/avsastry/modulome-workflow)32 and run on Amazon Web Services Batch. First, raw read trimming was performed using Trim Galore with default options, followed by FastQC on the trimmed reads. Next, reads were aligned to the E. coli K-12 MG1655 reference genome (NC_000913.3) using Bowtie80. The read direction was inferred using RSeQC81. Read counts were generated using featureCounts82. All quality control metrics were compiled using MultiQC83. Finally, the expression dataset was reported in units of log-transformed transcripts per million (log(TPM)).
All included samples passed rigorous quality control, with “high-quality” defined as (i) passing the following FastQC checks: per_base_sequence_quality, per_sequence_quality_scores, per_base_n_content, adaptor content; (ii) having at least 500,000 reads mapped to the coding sequences of the reference genome (NC_000913.3); (iii) not being an outlier in a hierarchical clustering based on pairwise Pearson correlation between all samples in PRECISE-1K; and (iv) having a minimum Pearson correlation between biological replicates of 0.95.
Ribosome profiling
Ribosome profiling libraries were created using a modified version of the protocol outlined in Latif et al.84. The protocol was modified to negate the effects of the addition of chloramphenicol by grinding frozen cells. 50 mL of cell culture was harvested by centrifugation for 4 minutes at 37°C in a 50 mL conical tube containing 0.4 g of sand. Supernatant was aspirated quickly and the pellet was flash frozen in liquid nitrogen. Pellets were transferred into a liquid nitrogen cooled mortar and pestle, 500 μL of lysis buffer was added, and the pellet was pulverized to lyse the cells. Lysate was transferred to a falcon tube to thaw on ice. The lysate was then centrifuged, and the supernatant was isolated to continue with the published protocol. Reads were sequenced on an Illumina HighSeq machine using a single end 50 bp kit.
Adaptors were removed from ribosome profiling reads using CutAdapt v1.885, then mapped to the E. coli K-12 MG1655 reference genome (NC_000913.3) using bowtie80. They were scored at the 3’ end to generate ribosome density profiles.
Generation of pitA mutant strains
The mutations referred to in Figures 4H–K and S2 were introduced into the starting (0_0) and evolved (1_0) genomes using a Cas9-assisted Lambda Red homologous recombination method. Golden gate assembly was first used to construct a plasmid vector harboring both Cas9 and lambda red recombinase genes under the control of an L-arabinose inducible promoter, a single guide RNA sequence, and a donor fragment generated by PCR which contained the desired pitA +T mutation and around 200 bp flanking both sides of the Cas9 target cut site as directed by the guide RNA. After allowing cells harboring the plasmid to grow for 2 hours at 30°C, L-arabinose was added to the media and the cells were allowed to grow for 3 to 5 hours, at which time a portion of the culture was plated. Single colonies were screened using ARMS PCR. Amplicons spanning the mutation site, generated with primers annealing to the genome upstream and downstream of the sequence of the donor fragment contained in the plasmid, were confirmed with Sanger sequencing. Confirmed isolates were cured of the plasmid by growth at 37°C.
Cell motility assay
We performed motility assays in duplicate for each of the conditions shown in Figure S2. We mixed a tryptone broth (13 g tryptone and 7 g NaCl per liter of media) with 0.25% agar and the desired PQ level. We autoclaved the broths, then poured 25 mL into petri dishes and solidified them at room temperature overnight. Fresh colonies were spotted in the middle of the semi-solid agar with a toothpick. The plates were then incubated at 37°C for 6–8 hours and imaged on a Gel Imaging System.
Quantification and statistical analysis
iModulon computation and curation
The full PRECISE-1K compendium, including the samples for this study, was used to compute iModulons using our previously described method47,86. The log(TPM) dataset X was first centered such that wild-type E. coli MG1655 samples in M9 minimal media with glucose had expression values of 0 for all genes. Independent component analysis was performed using the Scikit-Learn (v0.19.0) implementation of FastICA87. We performed 100 iterations of the algorithm across a range of dimensionalities, and for each dimensionality we pooled and clustered the components with DBSCAN to find robust components which appeared in more than 50 of the iterations. If the dimensionality parameter is too high, ICA will begin to return single gene components; if it is too low, the components will be too dense to represent biological signals. Therefore, we selected a dimensionality which was as high as possible without creating many single gene components, as described86. At the optimal dimensionality, the total number of iModulons was 201. The output is composed of matrices M [genes x iModulons], which defines the relationship between each iModulon and each gene, and A [iModulons x samples], which contains the activity levels for each iModulon in each sample.
For each iModulon, a threshold must be drawn in the M matrix to determine which genes are members of each iModulon. These thresholds are based on the distribution of gene weights. The highest weighted genes were progressively removed until the remaining weights had a D’agostino K2 normality below 550. Thus, the iModulon member genes are outliers from an otherwise normal distribution. iModulon annotation and curation was performed by comparing them against the known TRN from RegulonDB22. Names, descriptions, and statistics for each iModulon are available from the PRECISE-1K manuscript47, iModulonDB21, and Table S3.
Differential iModulon activity analysis
DiMAs were calculated as previously described20,32. For each iModulon, a null distribution was generated by calculating the absolute difference between each pair of biological replicates and fitting a log-normal distribution to them. For the groups being compared, their mean difference for each iModulon was compared to that iModulon’s null distribution to obtain a p-value. The set of p-values for all iModulons was then false discovery rate (FDR) corrected to generate q-values. Activities were considered significant if they passed an absolute difference threshold of 5 and an FDR of 0.1. The main comparison in this study was between the starting strain at 250 μM PQ (n = 2) and the combined set of all evolved strains at 250 and 750 μM PQ (n = 61). Performing the comparison using both concentrations of PQ ensures that our comparison captures all of the major effects of tolerization. The set of DiMAs was similar when performing the comparison at just one or the other concentration.
We also performed a brief DEG analysis, which used the same algorithm as above but with individual gene expression values instead of iModulon activities. We used an FDR of 0.1 as above, and we scaled the fold change from its default value of 5 such that it was proportional to the range of values in the different matrices: scaled_thresh = default_thresh * (Xmax - Xmin) / (Amax - Amin) = 0.787.
iModulon explained variance calculation
The explained variance for each iModulon in this study was calculated using our workflow32. Since iModulons are built on a matrix decomposition, the contribution of each one to the overall expression dataset can be calculated. For each iModulon, the column of M and the row of A for the evolved samples in this study were multiplied together, and the explained variance between the result and the full expression dataset was computed. These explained variance scores were used to size the subsets of the treemap in Figure 1H. Note that the variance explained by ICA is ‘knowledge-based’ in contrast to the ‘statistic-based’ variance explanation provided by the commonly used principal component analysis (PCA).
ME modeling
We used OxidizeME, a genome-scale model of metabolism and expression (ME) with ROS damage responses3. Models used for flux maps were constrained using phenotypic data (glucose uptake rate and growth rate) and expression data as previously described11,12. In order to force PQ cycling in the model, the lower bounds for the ‘PQ2RED_FWD_FLAVONADPREDUCT-MONOMER_mod_fad’ and ‘PQ1OX_FWD_SPONT’ were set to the same non-zero value and iterated over. Additionally, the former reaction was amended to accept NADH as an electron donor by editing the stoichiometry. PQ cycling sweeping calculations were performed by sampling various lower bounds to identify the range the model could support growth, and then sweeping 100 uniform values within that range. The total NADH produced through the TCA cycle was calculated by summing the fluxes for the ‘MDH’ and ‘AKGDH’ metabolic reactions. The percentage of the proteome allocated to the TCA cycle was calculated using the solutions from each model, specifically the translation fluxes:
Where mwi and represents the molecular weight and translation flux of the ith protein in the TCA cycle, and mwj and represents the molecular weight and translation flux of the jth protein the entire model. The damaged portion of the proteome was calculated as follows:
Where mwj and are the same variables above, and mwk and correspond to the kth protein in Table S5. The undamaged portion of the proteome allocated to the TCA cycle was calculated as the difference between the total proteome allocated and the damaged proteome allocated.
Supplementary Material
Mutations details, position, type, sequence change, and affected genes were generated by the ALEdb mutation calling pipeline8. A brief description of hypothetical effects is included as well. See43 for details about the starting strain, which was ALE #4 in the prior publication.
Mutations details, position, type, sequence change, and affected genes were generated by the ALEdb mutation calling pipeline8. Hypothetical effect descriptions, both levels of categorization, and figure references were manually curated. ‘Treemap Category’ was used to generate Figure 1D. Columns labeled with strain numbers indicate presence or absence of the mutation in the given strain.
List of significant DiMAs from the comparison shown in Figure 1F, in which evolved strains under 250 and 750 μM PQ were compared against the starting strain under 250 μM PQ. ‘Difference’ refers to the difference between the mean activity level of both groups, which has an absolute value greater than 5. ‘P-value’ is the false discovery rate corrected p-value for the statistical comparison, which is less than 0.1. ‘Explained Variance’ is the explained variance of the iModulon in the study samples, which was used with ‘Treemap Category’ to generate Figure 1H. ‘Treemap Category’, ‘Confidence’, ‘General Notes’, ‘Start Strain’, and ‘Evolved Strain’ were manually curated, with the latter two columns describing predicted regulatory mechanisms explaining the iModulon’s behavior in the respective samples. Remaining descriptive columns are copied from the PRECISE-1K curation of these iModulons47. See iModulonDB.org for details of each iModulon, including its member genes, activity levels across over 1000 conditions including those from this study, and overlap with associated regulons.
Each row of this table corresponds to an arrow in Figure 2. The ‘From’, ‘To’, and ‘Meaning’ columns describe the relationship in more detail than can be displayed on a knowledge graph. ‘Figure’ contains the specific relevant figure panels if available. ‘Data Evidence’ contains written descriptions of the evidence from this study associated with the relationship. ‘Literature Evidence’ lists citations which agree with or establish the relationship. The ‘New?’ column assesses the novelty of the relationship, which may be previously established, new in this study, or describe the new details and perspectives revealed by comparing the literature with the new data.
Nine supplementary notes are provided to give additional information and literature evidence as referenced throughout the paper.
Key resources, sources, and identifiers as part of the STAR Methods for this paper.
KEY RESOURCES TABLE
| REAGENT or RESOURCE | SOURCE | IDENTIFIER |
|---|---|---|
| Bacterial and Virus Strains | ||
| Glucose Optimized Escherichia coli K12 MG1655 | SBRG, University of California San Diego | PMID: 25304508 A4 F237 I1 R1 |
| PQ Optimized Escherichia coli K12 MG1655 1_0 | This paper | A16 F32 I1 R1 |
| PQ Optimized Escherichia coli K12 MG1655 2_0 | This Paper | A18 F36 I1 R1 |
| PQ Optimized Escherichia coli K12 MG1655 3_0 | This Paper | A14 F27 I1 R1 |
| PQ Optimized Escherichia coli K12 MG1655 1_1 | This Paper | A11 F83 I1 R1 |
| PQ Optimized Escherichia coli K12 MG1655 1_2 | This Paper | A13 F87 I1 R1 |
| PQ Optimized Escherichia coli K12 MG1655 1_3 | This Paper | A17 F104 I1 R1 |
| PQ Optimized Escherichia coli K12 MG1655 1_4 | This Paper | A19 F91 I1 R1 |
| PQ Optimized Escherichia coli K12 MG1655 2_1 | This Paper | A21 F97 I0 R1 |
| PQ Optimized Escherichia coli K12 MG1655 2_2 | This Paper | A25 F111 I1 R1 |
| PQ Optimized Escherichia coli K12 MG1655 2_3 | This Paper | A29 F119 I1 R1 |
| PQ Optimized Escherichia coli K12 MG1655 3_1 | This Paper | A1 F112 I1 R1 |
| PQ Optimized Escherichia coli K12 MG1655 3_2 | This Paper | A3 F76 I1 R1 |
| PQ Optimized Escherichia coli K12 MG1655 3_3 | This Paper | A7 F103 I1 R1 |
| PQ Optimized Escherichia coli K12 MG1655 3_4 | This Paper | A9 F77 I1 R1 |
| Chemicals, Peptides, and Recombinant Proteins | ||
| Paraquat Dichloride Hydrate | Sigma-Aldrich | 36541–100MG |
| Deposited Data | ||
| DNAseq | ALEdb.org | ROS |
| RNAseq | NCBI GEO | GSE134256; GSE221314 |
| PRECISE-1K iModulon Data | iModulonDB.org; DOI: 10.1101/2021.04.08.439047 | E. coli PRECISE-1K |
| Oligonucleotides | ||
| Guide Sense Oligo Insert “T”: AGCGCCAGCAAACAAATGTAGcat | IDT | N/A |
| Guide Antisense Oligo Insert “T”: AAACatgCTACATTTGTTTGCTGG | IDT | N/A |
| Guide Sense Oligo Remove “T”: AGCGCAGCAAACAAATGTAAGcat | IDT | N/A |
| Guide Antisense Oligo Remove “T”: AAACatgCTTACATTTGTTTGCTG | IDT | N/A |
| DONOR Forward Primer: CCAGGTCTCAGTGCCGCACCAGCGCCTAT | IDT | N/A |
| DONOR Reverse Primer: CCAGGTCTCAGAGCCGTCGGCAGCATATGCA | IDT | N/A |
| Software and Algorithms | ||
| iModulon Computation | DOI: 10.1101/2021.07.01.450581 | https://github.com/avsastry/modulome-workflow |
| OxidizeME model | PMID: 31270234 | https://github.com/SBRG/oxidizeme |
| Other | ||
| Code to generate all plots | This Paper | https://github.com/SBRG/ROS-ALE |
Highlights.
Adaptive laboratory evolution of E. coli generated strains which tolerate paraquat
Mutation analysis revealed a high level of parallel evolution across the replicates
iModulon analysis of transcriptomes provided detailed novel insights into evolution
Six paraquat and ROS stress tolerance mechanisms from the strains were revealed
Acknowledgements
This work was funded by the Novo Nordisk Foundation grant numbers NNF10CC1016517 and NNF20CC0035580, and by National Institute of General Medical Sciences grant number GM057089. It used resources of the National Energy Research Scientific Computing Center, a DOE Office of Science User Facility supported by the Office of Science of the U.S. Department of Energy under Contract No. DE-AC02-05CH11231. We would like to thank Marc Abrams for his assistance with manuscript editing and Lachlan Munro for assistance with wet lab experiments. We would also like to thank Daniel Zielinski, Lei Yang, Emre Ozdemir, Tobias Alter, Ke Chen, and Jayanth Krishnan for helpful discussions. We thank Jason Yang for invaluable discussions and advice on an early draft of this manuscript. The graphical abstract was created in Biorender.
Inclusion and diversity
We support inclusive, diverse, and equitable conduct of research.
Footnotes
Publisher's Disclaimer: This is a PDF file of an unedited manuscript that has been accepted for publication. As a service to our customers we are providing this early version of the manuscript. The manuscript will undergo copyediting, typesetting, and review of the resulting proof before it is published in its final form. Please note that during the production process errors may be discovered which could affect the content, and all legal disclaimers that apply to the journal pertain.
Declaration of interests
The authors declare no competing interests.
References
- 1.Muir P, Li S, Lou S, Wang D, Spakowicz DJ, Salichos L, Zhang J, Weinstock GM, Isaacs F, Rozowsky J, et al. (2016). The real cost of sequencing: scaling computation to keep pace with data generation. Genome Biol. 17, 53. 10.1186/s13059-016-0917-0. [DOI] [PMC free article] [PubMed] [Google Scholar]
- 2.Seif Y, and Palsson BØ (2021). Path to improving the life cycle and quality of genome-scale models of metabolism. Cell Syst. 12, 842–859. 10.1016/j.cels.2021.06.005. [DOI] [PMC free article] [PubMed] [Google Scholar]
- 3.Yang L, Mih N, Anand A, Park JH, Tan J, Yurkovich JT, Monk JM, Lloyd CJ, Sandberg TE, Seo SW, et al. (2019). Cellular responses to reactive oxygen species are predicted from molecular mechanisms. Proc. Natl. Acad. Sci. U. S. A 116, 14368–14373. 10.1073/pnas.1905039116. [DOI] [PMC free article] [PubMed] [Google Scholar]
- 4.Yang JH, Wright SN, Hamblin M, McCloskey D, Alcantar MA, Schrübbers L, Lopatkin AJ, Satish S, Nili A, Palsson BO, et al. (2019). A White-Box Machine Learning Approach for Revealing Antibiotic Mechanisms of Action. Cell 177, 1649–1661.e9. 10.1016/j.cell.2019.04.016. [DOI] [PMC free article] [PubMed] [Google Scholar]
- 5.Subramanian I, Verma S, Kumar S, Jere A, and Anamika K (2020). Multi-omics Data Integration, Interpretation, and Its Application. Bioinforma. Biol. Insights 14, 1177932219899051. 10.1177/1177932219899051. [DOI] [PMC free article] [PubMed] [Google Scholar]
- 6.Sandberg TE, Salazar MJ, Weng LL, Palsson BO, and Feist AM (2019). The emergence of adaptive laboratory evolution as an efficient tool for biological discovery and industrial biotechnology. Metab. Eng 56, 1–16. 10.1016/j.ymben.2019.08.004. [DOI] [PMC free article] [PubMed] [Google Scholar]
- 7.Peabody GL, Winkler J, and Kao KC (2014). Tools for developing tolerance to toxic chemicals in microbial systems and perspectives on moving the field forward and into the industrial setting. Curr. Opin. Chem. Eng 6, 9–17. 10.1016/j.coche.2014.08.001. [DOI] [Google Scholar]
- 8.Phaneuf PV, Gosting D, Palsson BO, and Feist AM (2019). ALEdb 1.0: a database of mutations from adaptive laboratory evolution experimentation. Nucleic Acids Res. 47, D1164–D1171. 10.1093/nar/gky983. [DOI] [PMC free article] [PubMed] [Google Scholar]
- 9.Hughes D, and Andersson DI (2015). Evolutionary consequences of drug resistance: shared principles across diverse targets and organisms. Nat. Rev. Genet 16, 459–471. 10.1038/nrg3922. [DOI] [PubMed] [Google Scholar]
- 10.Deatherage DE, and Barrick JE (2014). Identification of mutations in laboratory-evolved microbes from next-generation sequencing data using breseq. Methods Mol. Biol. Clifton NJ 1151, 165–188. 10.1007/978-1-4939-0554-6_12. [DOI] [PMC free article] [PubMed] [Google Scholar]
- 11.Anand A, Olson CA, Sastry AV, Patel A, Szubin R, Yang L, Feist AM, and Palsson BO (2021). Restoration of fitness lost due to dysregulation of the pyruvate dehydrogenase complex is triggered by ribosomal binding site modifications. Cell Rep. 35, 108961. 10.1016/j.celrep.2021.108961. [DOI] [PMC free article] [PubMed] [Google Scholar]
- 12.Anand A, Patel A, Chen K, Olson CA, Phaneuf PV, Lamoureux C, Hefner Y, Szubin R, Feist AM, and Palsson BO (2022). Laboratory evolution of synthetic electron transport system variants reveals a larger metabolic respiratory system and its plasticity. Nat. Commun 13, 3682. 10.1038/s41467-022-30877-5. [DOI] [PMC free article] [PubMed] [Google Scholar]
- 13.Monk JM, Lloyd CJ, Brunk E, Mih N, Sastry A, King Z, Takeuchi R, Nomura W, Zhang Z, Mori H, et al. (2017). iML1515, a knowledgebase that computes Escherichia coli traits. Nat. Biotechnol 35, 904–908. 10.1038/nbt.3956. [DOI] [PMC free article] [PubMed] [Google Scholar]
- 14.Chen K, Gao Y, Mih N, O’Brien EJ, Yang L, and Palsson BO (2017). Thermosensitivity of growth is determined by chaperone-mediated proteome reallocation. Proc. Natl. Acad. Sci 114, 11548–11553. 10.1073/pnas.1705524114. [DOI] [PMC free article] [PubMed] [Google Scholar]
- 15.Du B, Yang L, Lloyd CJ, Fang X, and Palsson BO (2019). Genome-scale model of metabolism and gene expression provides a multi-scale description of acid stress responses in Escherichia coli. PLOS Comput. Biol 15, e1007525. 10.1371/journal.pcbi.1007525. [DOI] [PMC free article] [PubMed] [Google Scholar]
- 16.Sandberg TE, Pedersen M, LaCroix RA, Ebrahim A, Bonde M, Herrgard MJ, Palsson BO, Sommer M, and Feist AM (2014). Evolution of Escherichia coli to 42 °C and subsequent genetic engineering reveals adaptive mechanisms and novel mutations. Mol. Biol. Evol 31, 2647–2662. 10.1093/molbev/msu209. [DOI] [PMC free article] [PubMed] [Google Scholar]
- 17.Phaneuf PV, Yurkovich JT, Heckmann D, Wu M, Sandberg TE, King ZA, Tan J, Palsson BO, and Feist AM (2020). Causal mutations from adaptive laboratory evolution are outlined by multiple scales of genome annotations and condition-specificity. BMC Genomics 21, 514. 10.1186/s12864-020-06920-4. [DOI] [PMC free article] [PubMed] [Google Scholar]
- 18.Myers KS, Park DM, Beauchene NA, and Kiley PJ (2015). Defining bacterial regulons using ChIP-seq. Methods 86, 80–88. 10.1016/j.ymeth.2015.05.022. [DOI] [PMC free article] [PubMed] [Google Scholar]
- 19.Browning DF, and Busby SJW (2016). Local and global regulation of transcription initiation in bacteria. Nat. Rev. Microbiol 14, 638–650. 10.1038/nrmicro.2016.103. [DOI] [PubMed] [Google Scholar]
- 20.Sastry AV, Gao Y, Szubin R, Hefner Y, Xu S, Kim D, Choudhary KS, Yang L, King ZA, and Palsson BO (2019). The Escherichia coli transcriptome mostly consists of independently regulated modules. Nat. Commun 10. 10.1038/s41467-019-13483-w. [DOI] [PMC free article] [PubMed] [Google Scholar]
- 21.Rychel K, Decker K, Sastry AV, Phaneuf PV, Poudel S, and Palsson BO (2020). iModulonDB: a knowledgebase of microbial transcriptional regulation derived from machine learning. Nucleic Acids Res. 10.1093/nar/gkaa810. [DOI] [PMC free article] [PubMed] [Google Scholar]
- 22.Santos-Zavaleta A, Salgado H, Gama-Castro S, Sánchez-Pérez M, Gómez-Romero L, Ledezma-Tejeida D, García-Sotelo JS, Alquicira-Hernández K, Muñiz-Rascado LJ, Peña-Loredo P, et al. (2019). RegulonDB v 10.5: tackling challenges to unify classic and high throughput knowledge of gene regulation in E. coli K-12. Nucleic Acids Res. 47, D212–D220. 10.1093/nar/gky1077. [DOI] [PMC free article] [PubMed] [Google Scholar]
- 23.Lamoureux CR, Decker KT, Sastry AV, Rychel K, Gao Y, McConn JL, Zielinski DC, and Palsson BO (2021). A multi-scale transcriptional regulatory network knowledge base for Escherichia coli (Bioinformatics) 10.1101/2021.04.08.439047. [DOI] [PMC free article] [PubMed] [Google Scholar]
- 24.Poudel S, Tsunemoto H, Seif Y, Sastry AV, Szubin R, Xu S, Machado H, Olson CA, Anand A, Pogliano J, et al. (2020). Revealing 29 sets of independently modulated genes in Staphylococcus aureus, their regulators, and role in key physiological response. Proc. Natl. Acad. Sci 117, 17228–17239. 10.1073/pnas.2008413117. [DOI] [PMC free article] [PubMed] [Google Scholar]
- 25.Rychel K, Sastry AV, and Palsson BO (2020). Machine learning uncovers independently regulated modules in the Bacillus subtilis transcriptome. Nat. Commun 11, 6338. 10.1038/s41467-020-20153-9. [DOI] [PMC free article] [PubMed] [Google Scholar]
- 26.Chauhan SM, Poudel S, Rychel K, Lamoureux C, Yoo R, Al Bulushi T, Yuan Y, Palsson BO, and Sastry AV (2021). Machine Learning Uncovers a Data-Driven Transcriptional Regulatory Network for the Crenarchaeal Thermoacidophile Sulfolobus acidocaldarius. Front. Microbiol 12. [DOI] [PMC free article] [PubMed] [Google Scholar]
- 27.Lim HG, Rychel K, Sastry AV, Bentley GJ, Mueller J, Schindel HS, Larsen PE, Laible PD, Guss AM, Niu W, et al. (2022). Machine-learning from Pseudomonas putida KT2440 transcriptomes reveals its transcriptional regulatory network. Metab. Eng 10.1016/j.ymben.2022.04.004. [DOI] [PubMed] [Google Scholar]
- 28.Rajput A, Tsunemoto H, Sastry AV, Szubin R, Rychel K, Sugie J, Pogliano J, and Palsson BO (2022). Machine learning from Pseudomonas aeruginosa transcriptomes identifies independently modulated sets of genes associated with known transcriptional regulators. Nucleic Acids Res. 50, 3658–3672. 10.1093/nar/gkac187. [DOI] [PMC free article] [PubMed] [Google Scholar]
- 29.Yoo R, Rychel K, Poudel S, Al-Bulushi T, Yuan Y, Chauhan S, Lamoureux C, Palsson BO, and Sastry A (2022). Machine Learning of All Mycobacterium tuberculosis H37Rv RNA-seq Data Reveals a Structured Interplay between Metabolism, Stress Response, and Infection. mSphere 7, e0003322. 10.1128/msphere.00033-22. [DOI] [PMC free article] [PubMed] [Google Scholar]
- 30.Rajput A, Tsunemoto H, Sastry AV, Szubin R, Rychel K, Chauhan SM, Pogliano J, and Palsson BO (2022). Advanced transcriptomic analysis reveals the role of efflux pumps and media composition in antibiotic responses of Pseudomonas aeruginosa. Nucleic Acids Res. 50, 9675–9688. 10.1093/nar/gkac743. [DOI] [PMC free article] [PubMed] [Google Scholar]
- 31.Yuan Y, Seif Y, Rychel K, Yoo R, Chauhan S, Poudel S, Al-Bulushi T, Palsson BO, and Sastry AV (2022). Pan-Genome Analysis of Transcriptional Regulation in Six Salmonella enterica Serovar Typhimurium Strains Reveals Their Different Regulatory Structures. mSystems, e0046722. 10.1128/msystems.00467-22. [DOI] [PMC free article] [PubMed] [Google Scholar]
- 32.Sastry AV, Poudel S, Rychel K, Yoo R, Lamoureux CR, Chauhan S, Haiman ZB, Bulushi TA, Seif Y, and Palsson BO (2021). Mining all publicly available expression data to compute dynamic microbial transcriptional regulatory networks. 2021.07.01.450581. 10.1101/2021.07.01.450581. [DOI] [Google Scholar]
- 33.Anand A, Chen K, Yang L, Sastry AV, Olson CA, Poudel S, Seif Y, Hefner Y, Phaneuf PV, Xu S, et al. (2019). Adaptive evolution reveals a tradeoff between growth rate and oxidative stress during naphthoquinone-based aerobic respiration. Proc. Natl. Acad. Sci 116, 25287–25292. 10.1073/pnas.1909987116. [DOI] [PMC free article] [PubMed] [Google Scholar]
- 34.Kavvas ES, Long CP, Sastry A, Poudel S, Antoniewicz MR, Ding Y, Mohamed ET, Szubin R, Monk JM, Feist AM, et al. (2022). Experimental Evolution Reveals Unifying Systems-Level Adaptations but Diversity in Driving Genotypes. mSystems, e0016522. 10.1128/msystems.00165-22. [DOI] [PMC free article] [PubMed] [Google Scholar]
- 35.Anand A, Chen K, Catoiu E, Sastry AV, Olson CA, Sandberg TE, Seif Y, Xu S, Szubin R, Yang L, et al. (2020). OxyR Is a Convergent Target for Mutations Acquired during Adaptation to Oxidative Stress-Prone Metabolic States. Mol. Biol. Evol 37, 660–667. 10.1093/molbev/msz251. [DOI] [PMC free article] [PubMed] [Google Scholar]
- 36.Hassan HM, and Fridovich I (1979). Paraquat and Escherichia coli. Mechanism of production of extracellular superoxide radical. J. Biol. Chem 254, 10846–10852. 10.1016/S0021-9258(19)86598-5. [DOI] [PubMed] [Google Scholar]
- 37.Imlay JA (2019). Where in the world do bacteria experience oxidative stress? Environ. Microbiol 21, 521–530. 10.1111/1462-2920.14445. [DOI] [PMC free article] [PubMed] [Google Scholar]
- 38.Hassan HM, and Fridovich I (1979). Intracellular production of superoxide radical and of hydrogen peroxide by redox active compounds. Arch. Biochem. Biophys 196, 385–395. 10.1016/0003-9861(79)90289-3. [DOI] [PubMed] [Google Scholar]
- 39.Fasnacht M, and Polacek N (2021). Oxidative Stress in Bacteria and the Central Dogma of Molecular Biology. Front. Mol. Biosci 8. [DOI] [PMC free article] [PubMed] [Google Scholar]
- 40.Imlay JA (2013). The molecular mechanisms and physiological consequences of oxidative stress: lessons from a model bacterium. Nat. Rev. Microbiol 11, 443–454. 10.1038/nrmicro3032. [DOI] [PMC free article] [PubMed] [Google Scholar]
- 41.Imlay JA (2015). Diagnosing oxidative stress in bacteria: not as easy as you might think. Curr. Opin. Microbiol 24, 124–131. 10.1016/j.mib.2015.01.004. [DOI] [PMC free article] [PubMed] [Google Scholar]
- 42.Schieber M, and Chandel NS (2014). ROS Function in Redox Signaling and Oxidative Stress. Curr. Biol. CB 24, R453–R462. 10.1016/j.cub.2014.03.034. [DOI] [PMC free article] [PubMed] [Google Scholar]
- 43.LaCroix RA, Sandberg TE, O’Brien EJ, Utrilla J, Ebrahim A, Guzman GI, Szubin R, Palsson BO, and Feist AM (2015). Use of Adaptive Laboratory Evolution To Discover Key Mutations Enabling Rapid Growth of Escherichia coli K-12 MG1655 on Glucose Minimal Medium. Appl. Environ. Microbiol 81, 17–30. 10.1128/AEM.02246-14. [DOI] [PMC free article] [PubMed] [Google Scholar]
- 44.LaCroix RA, Palsson BO, and Feist AM (2017). A Model for Designing Adaptive Laboratory Evolution Experiments. Appl. Environ. Microbiol 83, e03115–16. 10.1128/AEM.03115-16. [DOI] [PMC free article] [PubMed] [Google Scholar]
- 45.Candeias LP, and Steenken S (1993). Electron transfer in di(deoxy)nucleoside phosphates in aqueous solution: rapid migration of oxidative damage (via adenine) to guanine. J. Am. Chem. Soc 115, 2437–2440. 10.1021/ja00059a044. [DOI] [Google Scholar]
- 46.Foti JJ, Devadoss B, Winkler JA, Collins JJ, and Walker GC (2012). Oxidation of the guanine nucleotide pool underlies cell death by bactericidal antibiotics. Science 336, 315–319. 10.1126/science.1219192. [DOI] [PMC free article] [PubMed] [Google Scholar]
- 47.Lamoureux CR, Decker KT, Sastry AV, McConn JL, Gao Y, and Palsson BO (2021). PRECISE 2.0 - an expanded high-quality RNA-seq compendium for Escherichia coli K-12 reveals high-resolution transcriptional regulatory structure 2021.04.08.439047. 10.1101/2021.04.08.439047. [DOI] [Google Scholar]
- 48.Yerushalmi H, Lebendiker M, and Schuldiner S (1995). EmrE, an Escherichia coli 12-kDa multidrug transporter, exchanges toxic cations and H+ and is soluble in organic solvents. J. Biol. Chem 270, 6856–6863. 10.1074/jbc.270.12.6856. [DOI] [PubMed] [Google Scholar]
- 49.Sekine Y, Aihara K, and Ohtsubo E (1999). Linearization and transposition of circular molecules of insertion sequence IS3. J. Mol. Biol 294, 21–34. 10.1006/jmbi.1999.3181. [DOI] [PubMed] [Google Scholar]
- 50.Mongkolsuk S, and Helmann JD (2002). Regulation of inducible peroxide stress responses. Mol. Microbiol 45, 9–15. 10.1046/j.1365-2958.2002.03015.x. [DOI] [PubMed] [Google Scholar]
- 51.Barshishat S, Elgrably-Weiss M, Edelstein J, Georg J, Govindarajan S, Haviv M, Wright PR, Hess WR, and Altuvia S (2018). OxyS small RNA induces cell cycle arrest to allow DNA damage repair. EMBO J. 37, 413–426. 10.15252/embj.201797651. [DOI] [PMC free article] [PubMed] [Google Scholar]
- 52.Sastry AV, Dillon N, Anand A, Poudel S, Hefner Y, Xu S, Szubin R, Feist AM, Nizet V, and Palsson B (2021). Machine Learning of Bacterial Transcriptomes Reveals Responses Underlying Differential Antibiotic Susceptibility. mSphere 6, e00443–21. 10.1128/mSphere.00443-21. [DOI] [PMC free article] [PubMed] [Google Scholar]
- 53.Smith AT, Linkous RO, Max NJ, Sestok AE, Szalai VA, and Chacón KN (2019). The FeoC [4Fe-4S] Cluster Is Redox-Active and Rapidly Oxygen-Sensitive. Biochemistry 58, 4935–4949. 10.1021/acs.biochem.9b00745. [DOI] [PMC free article] [PubMed] [Google Scholar]
- 54.Rosenberg H, Gerdes RG, and Chegwidden K (1977). Two systems for the uptake of phosphate in Escherichia coli. J. Bacteriol 131, 505–511. 10.1128/jb.131.2.505-511.1977. [DOI] [PMC free article] [PubMed] [Google Scholar]
- 55.Prüss BM, Campbell JW, Van Dyk TK, Zhu C, Kogan Y, and Matsumura P (2003). FlhD/FlhC is a regulator of anaerobic respiration and the Entner-Doudoroff pathway through induction of the methyl-accepting chemotaxis protein Aer. J. Bacteriol 185, 534–543. 10.1128/JB.185.2.534-543.2003. [DOI] [PMC free article] [PubMed] [Google Scholar]
- 56.Gottesman S (2019). Trouble is coming: Signaling pathways that regulate general stress responses in bacteria. J. Biol. Chem 294, 11685–11700. 10.1074/jbc.REV119.005593. [DOI] [PMC free article] [PubMed] [Google Scholar]
- 57.Schellhorn HE (2020). Function, Evolution, and Composition of the RpoS Regulon in Escherichia coli. Front. Microbiol 11. [DOI] [PMC free article] [PubMed] [Google Scholar]
- 58.Kavvas ES, Antoniewicz M, Long C, Ding Y, Monk JM, Palsson BO, and Feist AM (2020). Laboratory evolution of multiple E. coli strains reveals unifying principles of adaptation but diversity in driving genotypes 2020.05.19.104992. 10.1101/2020.05.19.104992. [DOI] [PMC free article] [PubMed] [Google Scholar]
- 59.Utrilla J, O’Brien EJ, Chen K, McCloskey D, Cheung J, Wang H, Armenta-Medina D, Feist AM, and Palsson BO (2016). Global Rebalancing of Cellular Resources by Pleiotropic Point Mutations Illustrates a Multi-scale Mechanism of Adaptive Evolution. Cell Syst. 2, 260–271. 10.1016/j.cels.2016.04.003. [DOI] [PMC free article] [PubMed] [Google Scholar]
- 60.Dalldorf C, Rychel K, Szubin R, Hefner Y, Patel A, Zielinski D, and Palsson B (2023). The hallmarks of a tradeoff in transcriptomes that balances stress and growth functions. Res. Sq, rs.3.rs-2729651. 10.21203/rs.3.rs-2729651/v1. [DOI] [PMC free article] [PubMed] [Google Scholar]
- 61.Zambrano MM, Siegele DA, Almirón M, Tormo A, and Kolter R (1993). Microbial Competition: Escherichia coli Mutants That Take Over Stationary Phase Cultures. Science 259, 1757–1760. 10.1126/science.7681219. [DOI] [PubMed] [Google Scholar]
- 62.Ferenci T, and Spira B (2007). Variation in stress responses within a bacterial species and the indirect costs of stress resistance. Ann. N. Y. Acad. Sci 1113, 105–113. 10.1196/annals.1391.003. [DOI] [PubMed] [Google Scholar]
- 63.Jang S, and Imlay JA (2007). Micromolar intracellular hydrogen peroxide disrupts metabolism by damaging iron-sulfur enzymes. J. Biol. Chem 282, 929–937. 10.1074/jbc.M607646200. [DOI] [PMC free article] [PubMed] [Google Scholar]
- 64.Majumder A, Fang M, Tsai KJ, Ueguchi C, Mizuno T, and Wu HY (2001). LeuO expression in response to starvation for branched-chain amino acids. J. Biol. Chem 276, 19046–19051. 10.1074/jbc.M100945200. [DOI] [PubMed] [Google Scholar]
- 65.Jarrett JT (2005). The novel structure and chemistry of iron-sulfur clusters in the adenosylmethionine-dependent radical enzyme biotin synthase. Arch. Biochem. Biophys 433, 312–321. 10.1016/j.abb.2004.10.003. [DOI] [PubMed] [Google Scholar]
- 66.Beckett D (2007). Biotin sensing: universal influence of biotin status on transcription. Annu. Rev. Genet 41, 443–464. 10.1146/annurev.genet.41.042007.170450. [DOI] [PubMed] [Google Scholar]
- 67.Chen K, Anand A, Olson C, Sandberg TE, Gao Y, Mih N, and Palsson BO (2021). Bacterial fitness landscapes stratify based on proteome allocation associated with discrete aero-types. PLOS Comput. Biol 17, e1008596. 10.1371/journal.pcbi.1008596. [DOI] [PMC free article] [PubMed] [Google Scholar]
- 68.Hill CW, Gray JA, and Brody H (1989). Use of the isocitrate dehydrogenase structural gene for attachment of e14 in Escherichia coli K-12. J. Bacteriol 171, 4083–4084. 10.1128/jb.171.7.4083-4084.1989. [DOI] [PMC free article] [PubMed] [Google Scholar]
- 69.Fukushima T, Yamada K, Isobe A, Shiwaku K, and Yamane Y (1993). Mechanism of cytotoxicity of paraquat. I. NADH oxidation and paraquat radical formation via complex I. Exp. Toxicol. Pathol. Off. J. Ges. Toxikol. Pathol 45, 345–349. 10.1016/S0940-2993(11)80424-0. [DOI] [PubMed] [Google Scholar]
- 70.Liochev SI, and Fridovich I (1994). Paraquat diaphorases in Escherichia coli. Free Radic. Biol. Med 16, 555–559. 10.1016/0891-5849(94)90055-8. [DOI] [PubMed] [Google Scholar]
- 71.Shimada H, Hirai K, Simamura E, and Pan J (1998). Mitochondrial NADH-quinone oxidoreductase of the outer membrane is responsible for paraquat cytotoxicity in rat livers. Arch. Biochem. Biophys 351, 75–81. 10.1006/abbi.1997.0557. [DOI] [PubMed] [Google Scholar]
- 72.Federowicz S, Kim D, Ebrahim A, Lerman J, Nagarajan H, Cho B, Zengler K, and Palsson B (2014). Determining the Control Circuitry of Redox Metabolism at the Genome-Scale. PLOS Genet. 10, e1004264. 10.1371/journal.pgen.1004264. [DOI] [PMC free article] [PubMed] [Google Scholar]
- 73.Malpica R, Franco B, Rodriguez C, Kwon O, and Georgellis D (2004). Identification of a quinone-sensitive redox switch in the ArcB sensor kinase. Proc. Natl. Acad. Sci 101, 13318–13323. 10.1073/pnas.0403064101. [DOI] [PMC free article] [PubMed] [Google Scholar]
- 74.Myers KS, Yan H, Ong IM, Chung D, Liang K, Tran F, Keleş S, Landick R, and Kiley PJ (2013). Genome-scale Analysis of Escherichia coli FNR Reveals Complex Features of Transcription Factor Binding. PLoS Genet. 9, e1003565. 10.1371/journal.pgen.1003565. [DOI] [PMC free article] [PubMed] [Google Scholar]
- 75.Saelens W, Cannoodt R, and Saeys Y (2018). A comprehensive evaluation of module detection methods for gene expression data. Nat. Commun 9. 10.1038/s41467-018-03424-4. [DOI] [PMC free article] [PubMed] [Google Scholar]
- 76.Rychel K (2022). SBRG/ROS-ALE: Pre-release for initial journal submission. 10.5281/ZENODO.7449004. [DOI] [Google Scholar]
- 77.Mohamed ET, Wang S, Lennen RM, Herrgård MJ, Simmons BA, Singer SW, and Feist AM (2017). Generation of a platform strain for ionic liquid tolerance using adaptive laboratory evolution. Microb. Cell Factories 16, 204. 10.1186/s12934-017-0819-1. [DOI] [PMC free article] [PubMed] [Google Scholar]
- 78.Anand A, Olson CA, Yang L, Sastry AV, Catoiu E, Choudhary KS, Phaneuf PV, Sandberg TE, Xu S, Hefner Y, et al. (2019). Pseudogene repair driven by selection pressure applied in experimental evolution. Nat. Microbiol 4, 386–389. 10.1038/s41564-018-0340-2. [DOI] [PubMed] [Google Scholar]
- 79.Chen S, Huang T, Zhou Y, Han Y, Xu M, and Gu J (2017). AfterQC: automatic filtering, trimming, error removing and quality control for fastq data. BMC Bioinformatics 18, 80. 10.1186/s12859-017-1469-3. [DOI] [PMC free article] [PubMed] [Google Scholar]
- 80.Langmead B, Trapnell C, Pop M, and Salzberg SL (2009). Ultrafast and memory-efficient alignment of short DNA sequences to the human genome. Genome Biol. 10, R25. 10.1186/gb-2009-10-3-r25. [DOI] [PMC free article] [PubMed] [Google Scholar]
- 81.Wang L, Wang S, and Li W (2012). RSeQC: quality control of RNA-seq experiments. Bioinforma. Oxf. Engl 28, 2184–2185. 10.1093/bioinformatics/bts356. [DOI] [PubMed] [Google Scholar]
- 82.Liao Y, Smyth GK, and Shi W (2014). featureCounts: an efficient general purpose program for assigning sequence reads to genomic features. Bioinforma. Oxf. Engl 30, 923–930. 10.1093/bioinformatics/btt656. [DOI] [PubMed] [Google Scholar]
- 83.Ewels P, Magnusson M, Lundin S, and Käller M (2016). MultiQC: summarize analysis results for multiple tools and samples in a single report. Bioinforma. Oxf. Engl 32, 3047–3048. 10.1093/bioinformatics/btw354. [DOI] [PMC free article] [PubMed] [Google Scholar]
- 84.Latif H, Szubin R, Tan J, Brunk E, Lechner A, Zengler K, and Palsson BO (2015). A streamlined ribosome profiling protocol for the characterization of microorganisms. BioTechniques 58, 329–332. 10.2144/000114302. [DOI] [PubMed] [Google Scholar]
- 85.Martin M (2011). Cutadapt removes adapter sequences from high-throughput sequencing reads. EMBnet.journal 17, 10–12. 10.14806/ej.17.1.200. [DOI] [Google Scholar]
- 86.McConn JL, Lamoureux CR, Poudel S, Palsson BO, and Sastry AV (2021). Optimal dimensionality selection for independent component analysis of transcriptomic data. BMC Bioinformatics 22, 584. 10.1186/s12859-021-04497-7. [DOI] [PMC free article] [PubMed] [Google Scholar]
- 87.Pedregosa F Scikit-learn: Machine Learning in Python. Mach. Learn PYTHON, 6. [Google Scholar]
- 88.Grindley ND (1978). IS1 insertion generates duplication of a nine base pair sequence at its target site. Cell 13, 419–426. 10.1016/0092-8674(78)90316-1. [DOI] [PubMed] [Google Scholar]
- 89.Klepsch MM, Kovermann M, Löw C, Balbach J, Permentier HP, Fusetti F, de Gier JW, Slotboom DJ, and Berntsson RP-A (2011). Escherichia coli peptide binding protein OppA has a preference for positively charged peptides. J. Mol. Biol 414, 75–85. 10.1016/j.jmb.2011.09.043. [DOI] [PubMed] [Google Scholar]
- 90.Freddolino PL, Amini S, and Tavazoie S (2012). Newly identified genetic variations in common Escherichia coli MG1655 stock cultures. J. Bacteriol 194, 303–306. 10.1128/JB.06087-11. [DOI] [PMC free article] [PubMed] [Google Scholar]
- 91.Schnetz K, and Rak B (1992). IS5: a mobile enhancer of transcription in Escherichia coli. Proc. Natl. Acad. Sci. U. S. A 89, 1244–1248. 10.1073/pnas.89.4.1244. [DOI] [PMC free article] [PubMed] [Google Scholar]
- 92.Sen A, and Imlay JA (2021). How Microbes Defend Themselves From Incoming Hydrogen Peroxide. Front. Immunol 12. [DOI] [PMC free article] [PubMed] [Google Scholar]
- 93.Bagg A, and Neilands JB (1987). Ferric uptake regulation protein acts as a repressor, employing iron (II) as a cofactor to bind the operator of an iron transport operon in Escherichia coli. Biochemistry 26, 5471–5477. 10.1021/bi00391a039. [DOI] [PubMed] [Google Scholar]
- 94.Esquilin-Lebron K, Dubrac S, Barras F, and Boyd JM (2021). Bacterial Approaches for Assembling Iron-Sulfur Proteins. mBio 12, e02425–21. 10.1128/mBio.02425-21. [DOI] [PMC free article] [PubMed] [Google Scholar]
- 95.Blanc B, Clémancey M, Latour J-M, Fontecave M, and Ollagnier de Choudens S (2014). Molecular Investigation of Iron–Sulfur Cluster Assembly Scaffolds under Stress. Biochemistry 53, 7867–7869. 10.1021/bi5012496. [DOI] [PubMed] [Google Scholar]
- 96.Blanc B, Gerez C, and Ollagnier de Choudens S (2015). Assembly of Fe/S proteins in bacterial systems: Biochemistry of the bacterial ISC system. Biochim. Biophys. Acta 1853, 1436–1447. 10.1016/j.bbamcr.2014.12.009. [DOI] [PubMed] [Google Scholar]
- 97.Garcia PS, Gribaldo S, Py B, and Barras F (2019). The SUF system: an ABC ATPase-dependent protein complex with a role in Fe-S cluster biogenesis. Res. Microbiol 170, 426–434. 10.1016/j.resmic.2019.08.001. [DOI] [PubMed] [Google Scholar]
- 98.Roche B, Aussel L, Ezraty B, Mandin P, Py B, and Barras F (2013). Iron/sulfur proteins biogenesis in prokaryotes: Formation, regulation and diversity. Biochim. Biophys. Acta BBA - Bioenerg 1827, 455–469. 10.1016/j.bbabio.2012.12.010. [DOI] [PubMed] [Google Scholar]
- 99.Rajagopalan S, Teter SJ, Zwart PH, Brennan RG, Phillips KJ, and Kiley PJ (2013). Studies of IscR reveal a unique mechanism for metal-dependent regulation of DNA binding specificity. Nat. Struct. Mol. Biol 20, 740. 10.1038/nsmb.2568. [DOI] [PMC free article] [PubMed] [Google Scholar]
- 100.Lénon M, Arias-Cartín R, and Barras F (2022). The Fe–S proteome of Escherichia coli: prediction, function, and fate. Metallomics 14, mfac022. 10.1093/mtomcs/mfac022. [DOI] [PubMed] [Google Scholar]
- 101.Touati D (2000). Sensing and protecting against superoxide stress in Escherichia coli--how many ways are there to trigger soxRS response? Redox Rep. Commun. Free Radic. Res 5, 287–293. 10.1179/135100000101535825. [DOI] [PubMed] [Google Scholar]
- 102.Bibikov SI, Biran R, Rudd KE, and Parkinson JS (1997). A signal transducer for aerotaxis in Escherichia coli. J. Bacteriol 179, 4075–4079. 10.1128/jb.179.12.4075-4079.1997. [DOI] [PMC free article] [PubMed] [Google Scholar]
- 103.Taylor BL, Zhulin IB, and Johnson MS (1999). Aerotaxis and other energy-sensing behavior in bacteria. Annu. Rev. Microbiol 53, 103–128. 10.1146/annurev.micro.53.1.103. [DOI] [PubMed] [Google Scholar]
- 104.Pesavento C, and Hengge R (2012). The global repressor FliZ antagonizes gene expression by σS-containing RNA polymerase due to overlapping DNA binding specificity. Nucleic Acids Res. 40, 4783–4793. 10.1093/nar/gks055. [DOI] [PMC free article] [PubMed] [Google Scholar]
- 105.Irving SE, Choudhury NR, and Corrigan RM (2020). The stringent response and physiological roles of (pp)pGpp in bacteria. Nat. Rev. Microbiol, 1–16. 10.1038/s41579-020-00470-y. [DOI] [PubMed] [Google Scholar]
- 106.Mauzy CA, and Hermodson MA (1992). Structural and functional analyses of the repressor, RbsR, of the ribose operon of Escherichia coli. Protein Sci. Publ. Protein Soc 1, 831–842. 10.1002/pro.5560010701. [DOI] [PMC free article] [PubMed] [Google Scholar]
- 107.Christodoulou D, Link H, Fuhrer T, Kochanowski K, Gerosa L, and Sauer U (2018). Reserve Flux Capacity in the Pentose Phosphate Pathway Enables Escherichia coli’s Rapid Response to Oxidative Stress. Cell Syst. 6, 569–578.e7. 10.1016/j.cels.2018.04.009. [DOI] [PubMed] [Google Scholar]
- 108.Choi KY, and Zalkin H (1992). Structural characterization and corepressor binding of the Escherichia coli purine repressor. J. Bacteriol 174, 6207–6214. [DOI] [PMC free article] [PubMed] [Google Scholar]
- 109.Lochowska A, Iwanicka-Nowicka R, Plochocka D, and Hryniewicz MM (2001). Functional dissection of the LysR-type CysB transcriptional regulator. Regions important for DNA binding, inducer response, oligomerization, and positive control. J. Biol. Chem 276, 2098–2107. 10.1074/jbc.M007192200. [DOI] [PubMed] [Google Scholar]
- 110.Ostrowski J, and Kredich NM (1990). In vitro interactions of CysB protein with the cysJIH promoter of Salmonella typhimurium: inhibitory effects of sulfide. J. Bacteriol 172, 779–785. 10.1128/jb.172.2.779-785.1990. [DOI] [PMC free article] [PubMed] [Google Scholar]
- 111.Leichert LI, Gehrke F, Gudiseva HV, Blackwell T, Ilbert M, Walker AK, Strahler JR, Andrews PC, and Jakob U (2008). Quantifying changes in the thiol redox proteome upon oxidative stress in vivo. Proc. Natl. Acad. Sci 105, 8197–8202. 10.1073/pnas.0707723105. [DOI] [PMC free article] [PubMed] [Google Scholar]
- 112.Ohtsu I, Wiriyathanawudhiwong N, Morigasaki S, Nakatani T, Kadokura H, and Takagi H (2010). The l-Cysteine/l-Cystine Shuttle System Provides Reducing Equivalents to the Periplasm in Escherichia coli. J. Biol. Chem 285, 17479–17487. 10.1074/jbc.M109.081356. [DOI] [PMC free article] [PubMed] [Google Scholar]
- 113.Rensing C, and Grass G (2003). Escherichia coli mechanisms of copper homeostasis in a changing environment. FEMS Microbiol. Rev 27, 197–213. 10.1016/S0168-6445(03)00049-4. [DOI] [PubMed] [Google Scholar]
- 114.Benov L, Sage H, and Fridovich I (1997). The copper- and zinc-containing superoxide dismutase from Escherichia coli: molecular weight and stability. Arch. Biochem. Biophys 340, 305–310. 10.1006/abbi.1997.9940. [DOI] [PubMed] [Google Scholar]
- 115.Cunin R, Eckhardt T, Piette J, Boyen A, Piérard A, and Glansdorff N (1983). Molecular basis for modulated regulation of gene expression in the arginine regulon of Escherichia coli K-12. Nucleic Acids Res. 11, 5007–5019. 10.1093/nar/11.15.5007. [DOI] [PMC free article] [PubMed] [Google Scholar]
- 116.Chattopadhyay MK, Tabor CW, and Tabor H (2009). Polyamines are not required for aerobic growth of Escherichia coli: preparation of a strain with deletions in all of the genes for polyamine biosynthesis. J. Bacteriol 191, 5549–5552. 10.1128/JB.00381-09. [DOI] [PMC free article] [PubMed] [Google Scholar]
- 117.Wu WH, and Morris DR (1973). Biosynthetic arginine decarboxylase from Escherichia coli. Subunit interactions and the role of magnesium ion. J. Biol. Chem 248, 1696–1699. [PubMed] [Google Scholar]
- 118.Korkmaz G, Holm M, Wiens T, and Sanyal S (2014). Comprehensive Analysis of Stop Codon Usage in Bacteria and Its Correlation with Release Factor Abundance. J. Biol. Chem 289, 30334–30342. 10.1074/jbc.M114.606632. [DOI] [PMC free article] [PubMed] [Google Scholar]
- 119.Rould MA, Perona JJ, Söll D, and Steitz TA (1989). Structure of E. coli Glutaminyl-tRNA Synthetase Complexed with tRNAGln and ATP at 2.8 Å Resolution. Science 246, 1135–1142. 10.1126/science.2479982. [DOI] [PubMed] [Google Scholar]
- 120.Eggertsson G, and Söll D (1988). Transfer ribonucleic acid-mediated suppression of termination codons in Escherichia coli. Microbiol. Rev 52, 354–374. [DOI] [PMC free article] [PubMed] [Google Scholar]
- 121.Liochev SI, Hausladen A, Beyer WF, and Fridovich I (1994). NADPH: ferredoxin oxidoreductase acts as a paraquat diaphorase and is a member of the soxRS regulon. Proc. Natl. Acad. Sci 91, 1328–1331. 10.1073/pnas.91.4.1328. [DOI] [PMC free article] [PubMed] [Google Scholar]
- 122.Sauer U, Canonaco F, Heri S, Perrenoud A, and Fischer E (2004). The soluble and membrane-bound transhydrogenases UdhA and PntAB have divergent functions in NADPH metabolism of Escherichia coli. J. Biol. Chem 279, 6613–6619. 10.1074/jbc.M311657200. [DOI] [PubMed] [Google Scholar]
- 123.Kiley PJ, and Beinert H (1998). Oxygen sensing by the global regulator, FNR: the role of the iron-sulfur cluster. FEMS Microbiol. Rev 22, 341–352. 10.1111/j.1574-6976.1998.tb00375.x. [DOI] [PubMed] [Google Scholar]
- 124.Ramseier TM (1996). Cra and the control of carbon flux via metabolic pathways. Res. Microbiol 147, 489–493. 10.1016/0923-2508(96)84003-4. [DOI] [PubMed] [Google Scholar]
- 125.Kim D, Seo SW, Gao Y, Nam H, Guzman GI, Cho B-K, and Palsson BO (2018). Systems assessment of transcriptional regulation on central carbon metabolism by Cra and CRP. Nucleic Acids Res. 46, 2901–2917. 10.1093/nar/gky069. [DOI] [PMC free article] [PubMed] [Google Scholar]
- 126.Kochanowski K, Volkmer B, Gerosa L, Haverkorn van Rijsewijk BR, Schmidt A, and Heinemann M (2013). Functioning of a metabolic flux sensor in Escherichia coli. Proc. Natl. Acad. Sci. U. S. A 110, 1130–1135. 10.1073/pnas.1202582110. [DOI] [PMC free article] [PubMed] [Google Scholar]
- 127.Zheng D, Constantinidou C, Hobman JL, and Minchin SD (2004). Identification of the CRP regulon using in vitro and in vivo transcriptional profiling. Nucleic Acids Res. 32, 5874–5893. 10.1093/nar/gkh908. [DOI] [PMC free article] [PubMed] [Google Scholar]
- 128.Green J, Stapleton MR, Smith LJ, Artymiuk PJ, Kahramanoglou C, Hunt DM, and Buxton RS (2014). Cyclic-AMP and bacterial cyclic-AMP receptor proteins revisited: adaptation for different ecological niches. Curr. Opin. Microbiol 18, 1–7. 10.1016/j.mib.2014.01.003. [DOI] [PMC free article] [PubMed] [Google Scholar]
- 129.Miyake Y, Inaba T, Watanabe H, Teramoto J, Yamamoto K, and Ishihama A (2019). Regulatory roles of pyruvate-sensing two-component system PyrSR (YpdAB) in Escherichia coli K-12. FEMS Microbiol. Lett 366. 10.1093/femsle/fnz009. [DOI] [PubMed] [Google Scholar]
Additional resources
Associated Data
This section collects any data citations, data availability statements, or supplementary materials included in this article.
Supplementary Materials
Mutations details, position, type, sequence change, and affected genes were generated by the ALEdb mutation calling pipeline8. A brief description of hypothetical effects is included as well. See43 for details about the starting strain, which was ALE #4 in the prior publication.
Mutations details, position, type, sequence change, and affected genes were generated by the ALEdb mutation calling pipeline8. Hypothetical effect descriptions, both levels of categorization, and figure references were manually curated. ‘Treemap Category’ was used to generate Figure 1D. Columns labeled with strain numbers indicate presence or absence of the mutation in the given strain.
List of significant DiMAs from the comparison shown in Figure 1F, in which evolved strains under 250 and 750 μM PQ were compared against the starting strain under 250 μM PQ. ‘Difference’ refers to the difference between the mean activity level of both groups, which has an absolute value greater than 5. ‘P-value’ is the false discovery rate corrected p-value for the statistical comparison, which is less than 0.1. ‘Explained Variance’ is the explained variance of the iModulon in the study samples, which was used with ‘Treemap Category’ to generate Figure 1H. ‘Treemap Category’, ‘Confidence’, ‘General Notes’, ‘Start Strain’, and ‘Evolved Strain’ were manually curated, with the latter two columns describing predicted regulatory mechanisms explaining the iModulon’s behavior in the respective samples. Remaining descriptive columns are copied from the PRECISE-1K curation of these iModulons47. See iModulonDB.org for details of each iModulon, including its member genes, activity levels across over 1000 conditions including those from this study, and overlap with associated regulons.
Each row of this table corresponds to an arrow in Figure 2. The ‘From’, ‘To’, and ‘Meaning’ columns describe the relationship in more detail than can be displayed on a knowledge graph. ‘Figure’ contains the specific relevant figure panels if available. ‘Data Evidence’ contains written descriptions of the evidence from this study associated with the relationship. ‘Literature Evidence’ lists citations which agree with or establish the relationship. The ‘New?’ column assesses the novelty of the relationship, which may be previously established, new in this study, or describe the new details and perspectives revealed by comparing the literature with the new data.
Nine supplementary notes are provided to give additional information and literature evidence as referenced throughout the paper.
Key resources, sources, and identifiers as part of the STAR Methods for this paper.
Data Availability Statement
RNA-seq data have been deposited to GEO and are publicly available as of the date of publication, under accession numbers GSE134256 and GSE221314. DNA-seq data are available from aledb.org under the project “ROS”. iModulons and related data are available from iModulonDB.org under the dataset “E. coli PRECISE-1K”.
All original code and data to generate figures are available at github.com/SBRG/ROS-ALE, which also links to the alignment, ICA, and iModulon analysis workflows32. It has been deposited at Zenodo and is publicly available as of the date of publication76. The DOI is 10.5281/zenodo.7449004.
Any additional information required to reanalyze the data reported in this paper is available from the lead contact upon request.