

Abstract
miRNAs are short noncoding RNA single strands, with a crucial role in several biological processes. miRNAs are dysregulated in several human diseases, and their detection is an important goal for diagnosis and screening. Innovative biosensors for miRNAs are commonly based on the hybridization process between a miRNA and its corresponding complementary strand (or suitable aptamers) immobilized onto an electrode surface forming a duplex. A detailed description of the hybridization kinetics in working conditions deserves a great deal of interest for the optimization of the biosensing process. Surface plasmon resonance (SPR) and atomic force spectroscopy (AFS) were applied to investigate the hybridization process between miR-155, a multifunctional miRNA that constitutes an important marker overexpressed in several diseases, and its complementary strand (antimiR-155), immobilized on the gold-coated surface of a commercial electrode. Under well-adjusted pH, ionic strength, surface coverage, and concentration, we found that miR-155 has a high affinity for antimiR-155 with kinetics well described by the 1:1 Langmuir model. Both techniques provided an association rate of about 104 M–1 s–1, while a dissociation rate of 10–5 and 10–4 s–1 was assessed by SPR and AFS, respectively. These results allowed us to establish optimized measurement running times for applications in biosensing. An analysis of AFS data also led us to evaluate the binding free energy for the duplex, which was found to be close to that of free molecules in solution. These results could guide in the implementation of fine-tuned working conditions of a biosensor for detecting miRNAs based on correspondent complementary strands.
Introduction
MicroRNAs (miRNAs) are small noncoding RNA single strands of about 21–25 nucleotides associated with the regulation of gene expression.1,2 They are present in cells or circulate in bodily fluids with variable distribution and at different concentrations.3 Dysregulation of miRNAs has been associated with several human diseases, including different types of cancers.4 Accordingly, sensitive detection and quantification of miRNAs constitute extremely important challenges which are becoming progressively more relevant in diagnostics, prognostics, and therapeutics.5 Current detection methods of miRNAs are real time-PCR, microarrays, Northern blotting, and sequencing.6−9 These methods require a suitably furnished laboratory and numerous steps, with high costs and long time-to-result, with these features limiting their applicability to clinical practice and point-of-care devices.5 Recently, alternative biosensing strategies have been implemented in innovative biosensors to detect miRNAs as point-of-care devices.10 These new biosensors are based on the optimization of the biorecognition process between the target (miRNA) and a capture element (ligand) immobilized on a sensor surface; the ligand could be an aptamer, such as the miRNA complementary strand, or even a peptide nucleic acid.11,12 These ligands give rise to the formation of a duplex through a hybridization process. The interaction between the target and the ligand usually generates a detectable physical chemical, electrical, or mechanical signal which can be put into a relationship to the target concentration.5 We remark that single-strand oligonucleotides, including miRNAs and their complementary strands, are negatively charged, and therefore, the formation of a duplex can be strongly affected by several factors, such as ionic strength, pH, concentration, etc. Furthermore, the capability of single-stranded oligonucleotides to form a duplex may be different when they are free in solution from when one of them is immobilized on a surface. In the latter case, the hybridization also depends on further factors, such as the functionalization strategy, electrode roughness, coverage of the sensing area, etc.(13) On such a basis, some golden rules concerning the pH, the coverage, and the ionic strength to optimize surface-based hybridization of oligonucleotides have been proposed and applied to the preparation of electrodes (see e.g. ref (14)). However, a reliable use of a biosensor could take advantage of a detailed knowledge of the hybridization kinetics between the target (miRNA) and the ligand on the surface. For example, the time required to form the duplex, its stability, and the role of the fluxing rate of the solution target over the functionalized surface should be preliminarily evaluated in order to reach an optimized, reproducible response of the biosensor.
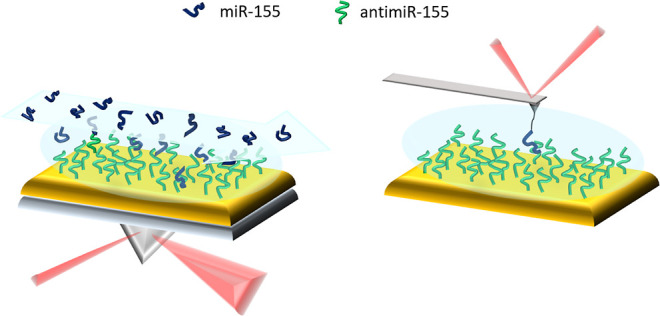
Here, we have focused our attention on miR-155, which is a multifunctional miRNA regulating B cell differentiation, development stages, etc.(15) miR-155 is overexpressed or mutated in various malignant tumor cells, such as hepatocellular carcinoma, breast cancer, and colon cancer, and it has been demonstrated to play a key role in the mammalian immune system.16 For these reasons, miR-155 is a suitable biomarker for many types of cancers and other diseases, and its detection deserves a high interest in diagnostics and prognosis.5,16 In the perspective to develop a biosensor for miR-155, we have investigated the hybridization kinetics between miR-155 and its complementary strand (here named antimiR-155) with the latter stably immobilized on a gold-coated surface. In particular, we have applied surface plasmon resonance (SPR) and atomic force spectroscopy (AFS). Both techniques work without labeling and under near physiological conditions, and they are suitable to investigate the interaction properties between two molecules, with one of the partners anchored to a surface.17,18 Briefly, SPR is a powerful tool to determine, in bulk, the process kinetics and the association and dissociation rates (kon and koff) between a ligand immobilized on a gold-coated surface and its partner free in solution fluxed on it;19 the affinity of the formed complex can also be determined. The capability to follow the duplex formation in time, even at different target concentrations and at different fluxing rates, also allows us to extract information about the time required to reach an optimized ligand–target interaction, helping to maximize the response of the biosensor device. AFS is a nanotechnological tool, able to investigate the interaction between two individual molecules by following their unbinding process. In an AFS experiment, one partner is bound to the tip of the atomic force microscope cantilever, while the other one is immobilized on a gold-coated surface.18 From AFS data, the dissociation rate constant (koff) and the width of the energy barrier of the biomolecular complex can be extracted. Furthermore, AFS data, analyzed in the framework of the Jarzynski identity,20,21 allows us to determine the binding equilibrium free energy, ΔG, from the mechanical work done along several nonequilibrium (irreversible) unbinding paths of a complex.22,23 The combined application of SPR and AFS to study the kinetics and the thermodynamics of the interaction of miR-155 with antimiR-155 immobilized on a gold-coated electrode provided useful information to optimize the conditions for biosensing experiments.
Results and Discussion
SPR Investigation
SPR kinetic assays have been performed to investigate the hybridization between antimiR-155 (ligand), immobilized on a gold-coated surface, and miR-155 (analyte), free in solution. The immobilization level of molecules at the surface has been chosen to be rather low to avoid mass transport and rebinding (see also, Materials and Methods). Furthermore, the selected conditions should also limit steric hindrance and therefore favor the hybridization process.24,25 According to the single-cycle kinetics (SCK) approach, the functionalized chip has been exposed to sequential injection and removal of miR-155 solutions in running buffer (10 mM NaPi, I = 300 mM, pH 7.8) at five increasing concentrations (0.1–750 nM). We have adopted a pH value higher than the isoelectric point of the miRNA, together with a rather high ionic strength for the working buffer (I = 300 mM), with these conditions being expected to favor the pairing of complementary RNA strands by overcoming the repulsion between their negatively charged phosphate backbones.24,25 Furthermore, we have used an ionic strength yielding a Debye length, as required in several biosensors, limiting the screening of the electric field from ions.26 A representative kinetic assay is shown in Figure 1.
Figure 1.

Top: SPR sensorgram (solid pink curve) of a representative SCK assay performed at 298 K by the injection of five increasing concentrations (0.1–750 nM) of miR-155 in running buffer (10 mM NaPi, I = 300 mM, pH 7.8) over the antimiR-155-functionalized sensor chip surface; global fit (dashed black curve) of the sensorgram according to a 1:1 reversible bimolecular binding model, scoring χ2 = 10.5 RU2 and U = 4. Bottom: plot of the fitting residuals. Inset: plot of the response versus miR-155 concentration.
During each injection of miR-155 into both the immobilized and control flow cells, a rapid and continuous rise in the response has been registered only in the antimiR-155-functionalized flow cell, with such a behavior being ascribed to a specific interaction occurring at increasing amounts of analyte. A 180 s injection time and a 30 μL/min flow rate have been adopted so that the association step is long enough to suitably monitor the duplex formation, and at the same time, mass transport limitation is prevented. As the analyte injection lasts, the number of association events gets progressively closer to the number of dissociations. However, within the analyte injection periods, the sensorgram does not reach a plateau, indicating that even after 3 min, many new duplexes are formed, while comparatively very fewer of them are dissociated. Such behavior reflects a rather strong affinity, combined with a slow dissociation rate. After 180 s, the flow of the miR-155-containing solution has been substituted with bare buffer for 180 s, to stop the association phase and to promote the dissociation process, by removing free analyte molecules from the surface. As expected, a much smaller effect on the signal is observed during the dissociation steps: the response drops only by 5% on average, even after a long waiting time (1200 s). These results indicate a quite strong and long-lived interaction between the partners. The sensorgrams have been successfully fitted by using a 1:1 Langmuir binding model which assumes a simple reversible bimolecular reaction.27 The fitting scored low χ2 (≤10), with uniformly distributed residuals of small entity. No significant bulk contributions have been found, and kinetic constants have been uniquely determined (U < 5). For the association and dissociation rate constants of the hybridization, we found that kon = (3.4 ± 0.8) × 104 M–1 s–1 and koff = (4.7 ± 0.8) × 10–5 s–1, respectively, the corresponding equilibrium dissociation constant (KD = koff/kon) being KD = 1.4 ± 0.6 nM. Accordingly, the association process is rather fast, meaning that the hybridization occurs within rather short times. At variance, the dissociation rate koff, related to a rather long lifetime of the complex (τ = 1/koff = 2 × 10⁴ s), indicates that the formed duplex is rather stable, and then the dissociation does not occur during the running time of an experiment. The KD value indicates a high affinity between the partners and falls within the range expected for a very stable and specific interaction, similarly for what was observed for duplex formation of oligonucleotides,28 and therefore, it points out that a high affinity is also preserved when one of the partners is immobilized onto a gold-coated surface, mimicking the conditions occurring in a biosensor.24,25,29 Furthermore, these results providing quantitative information about the kinetics and the affinity could be of help for optimizing the biosensing conditions, especially when experiments are carried out in a microfluid-based biosensing assay.
To further support the previous results, we have performed binding experiments using the multi-cycle kinetics (MCK) assay, in which a regeneration step is carried out between each analyte injection cycle (see Materials and Methods). Since only minimum dissociation can be obtained by fluxing buffer alone, a 10 s long injection of 5 M NaCl at a flow rate of 10 μL/min has been used to regenerate the antimiR-155-functionalized surface, the analyte concentration being in the range of 0.1–1000 nM.
As representatively shown in Figure 2, progressively higher signals are obtained as far as higher miR-155 concentrations are added. A fitting of MCK data by the 1:1 Langmuir model has provided kinetic rates comparable to the ones obtained by the SCK method, although the fit quality is slightly lower (see Figure 2), with the extracted KD being almost the same. The 1:1 Langmuir trend is also confirmed by the response of SPR as a function of the concentration, as shown in the inset of Figure 2. We also note that the occurrence of a 1:1 Langmuir binding can be put into a relationship to a good level of homogeneity as reached during the functionalization of our systems. Indeed, deviations from the Langmuir trend, observed for the hybridization kinetics of oligonucleotides immobilized onto copolymer-coated glasses, have been ascribed to some inhomogeneity in the arrangement of molecules on the surface, leading to an accumulation of charges onto the surface and then to steric hindrance.29
Figure 2.

Top: SPR sensorgrams (solid colored curves) of the MCK assay performed at 298 K by injecting six increasing concentrations (0.1–1000 nM) of miR-155 in running buffer (10 mM NaPi, I = 300 mM, pH 7.8) over the antimiR-155-functionalized substrate; global fit (dashed black curves) of the sensorgrams by the 1:1 binding model, with χ2 = 11.8 RU2 and U = 3. Bottom: plot of the fitting residuals. Inset: plot of the response versus miR-155 concentration.
Lastly, the specificity of detection of the antimiR-155-functionalized sensorchip for miR-155 in the assay has been evaluated by nontarget experiments in SCK assays, using miR-141 and miR-21 as analytes, according to ref (30). Figure 3 shows the SPR responses registered for three different concentrations of miR-141 and miR-21, compared with those of miR-155; in all the cases, the same analytical conditions (concentrations, injection times, sensorchip coverage, etc.) were used. We have obtained a substantially negligible signal for miR-141 and a response for miR-21 which was about 80–90% lower than that obtained with miR-155. The evidence that the used noncomplementary miRNA strands did not generate a significant system’s response supports the specificity of the used assay for miR-155.
Figure 3.
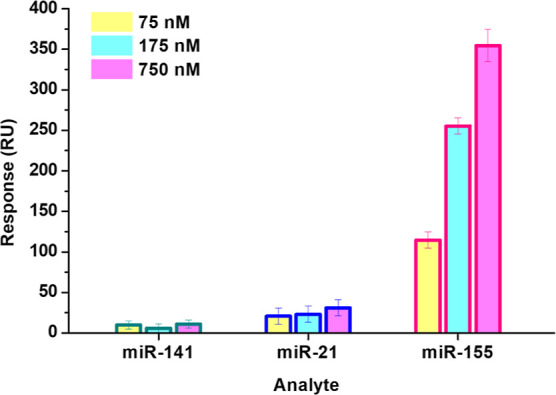
Comparison of SPR responses of the antimiR-155-functionalized sensorchip against the target (miR-155) and two noncomplementary miRNA strands (miR-141 and miR-21) at different concentrations.
AFS Investigation
The interaction of miR-155 with antimiR-155 has been also investigated by AFS at the single-molecule level, according to refs (31) and (32). Briefly, force curves have been acquired by approaching the cantilever, whose tip was functionalized with miR-155, toward a gold-coated commercial electrode [widely used in biosensing field effect transistor (BioFET) experiments] which had been functionalized with antimiR-155 and then retracted from it. In order to assure a higher mobility to miR-155 and also to allow the discrimination between specific and nonspecific unbinding events, a PEG linker has been used to anchor miR-155 to the tip. The approaching loading rate, R, has been kept fixed, while the retraction one has been varied (see Materials and Methods). An example of an AFS force curve acquired at the loading rate of 6.7 nN/s is shown in Figure 4. In the approaching phase (red line), the two partners may undergo a biorecognition process, eventually leading to a duplex formation. As long as the cantilever spring force overcomes the interacting force while retracting the atomic force microscopy (AFM) stage, a splitting of the duplex occurs and the cantilever jumps off (blue line), the corresponding extension providing the unbinding force. Before the jump-off, the curve exhibits a nonlinear trend which is expected to reflect the characteristic nonlinear PEG stretching.33 Such a region has been fitted by the worm-like chain (WLC) model describing the molecular stretching of the PEG linker (see Materials and Methods). The inset of Figure 4 shows a representative stretching curve (black line), plotted as a function of the extension, together with the corresponding fitting (red line); the contour length, as extracted by the fit, is also shown.
Figure 4.
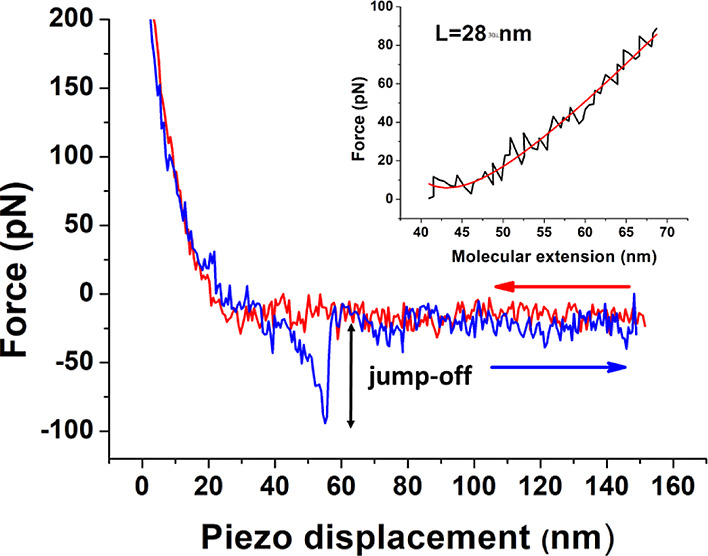
Representative AFS approach (blue) and retraction (red) force curves, performed at 298 K, as a function of the piezo displacement, with miR-155 covalently attached to the tip and antimiR-155 deposed on the gold-coated substrate. Inset: force curve as a function of the molecular extension (black line) together with fit by the WLC model (red line).
Only force curves characterized by a contour length value consistent with that expected for the PEG linker under stretching (30 ± 5 nm) have been associated with specific binding events and selected for further analysis.34 For each loading rate, the extracted unbinding forces have been cast into a histogram. Figure 5A shows the unbinding force histogram (red columns) for the loading rate of 6.7 nN/s. A single mode distribution is obtained and a Gaussian best fitting (continuous red line) indicates that the most probable unbinding force occurs at about 105 pN. A further check of the specificity of the observed unbinding events has been done by performing a blocking experiment in which force curves have been collected at the loading rate of 6.7 nN/s using a miR-155-functionalized tip against an antimiR-155-functionalized substrate which had been previously incubated with miR-155. The corresponding histogram (Figure 5A, gray columns), reveals that the number of events with unbinding forces between 50 and 200 pN markedly decreases. Accordingly, this range of forces is mainly due to specific events. Globally, the ratio of the total number of events, related to specific unbinding events, over the total recorded events is reduced from about 45 to 20% upon blocking. Such a reduction confirms that the AFS curves refer to specific events.
Figure 5.

(A) Histogram (red columns) of the unbinding forces for the miR-155/antimiR-155 complex from AFS measurements carried out at a loading rate of 6.7 nN/s. The most probable unbinding force value (F*) has been determined from the maximum of the main peak of the histogram by fitting with a Gaussian function (red curve). Histogram of the unbinding forces for the miR-155/antimiR-155 duplex after blocking (dashed columns), at the same loading rate. (B) Plot of the most probable unbinding force, F*, vs the logarithm of the loading rate for the miR-155/antimiR-155 duplex. Red continuous line is the best fit by the Bell–Evans model with eq 1; the extracted values for the koff and xβ parameters are reported.
Then, the most probable unbinding forces, F*, as extracted for all the applied loading rates, have been analyzed in the framework of the Bell–Evans model, which has been successfully applied to the unbinding process of several biological complexes, including DNA duplexes.35F*, when plotted as a function of the natural logarithm of the loading rate, follows a linear trend which can be described by the Bell–Evans relationship36,37
| 1 |
where kB is the Boltzmann constant, T is the absolute temperature, koff is the dissociation rate constant, and xβ is the width of the energy barrier along the direction of the applied force. The observation of a single linear trend in the F* vs the logarithm of the loading rate is consistent with a single energy barrier for the unbinding process.18 A fit of F* data by eq 1 has led us to determine koff = (6 ± 2) × 10–4 s–1 and xβ = 0.60 ± 0.05 nm. Both the width of the energy barrier, xβ, and the koff values fall in the range detected for other oligonucleotide duplexes as studied by AFS.18,35
With the aim to estimate the affinity constant of the duplex, we have evaluated the corresponding association rate constant (kon) by following the procedure given in refs (33) and (38). We found a kon of ∼104 M–1 s–1, which is close to those of other biomolecular systems31 and very similar to that measured by SPR. Then, the resulting KD is about 6 × 10⁻⁸ M–1, which is somewhat higher than that found by SPR but indicative of a high affinity between the partners either way.
We also note that the koff value is higher in comparison to that evaluated by SPR. Similar discrepancies have also been observed in other works, and they have been ascribed to different reasons.39 In particular, since AFS and SPR data have been obtained in different measurement conditions, they yield slightly different information. AFS conditions are reminiscent of biosensing experiments in which a direct injection of a solution with the target is carried out (see, e.g., refs (26) and (40)). On the other hand, SPR experiments closely match biosensing measurements in which a microfluidic approach is used. Accordingly, our SPR and AFS results indicate that the way in which the target is added to the substrate could slightly affect the kinetics and affinity.
AFS force curves have been also analyzed in the framework of the Jarzynski identity (JI), which permits the calculation of the equilibrium binding free energy of a complex from the mechanical work done along nonequilibrium unbinding paths.20,41 The JI has been applied by following the same procedure used for other biomolecular complexes, through the expression22,23
| 2 |
where N is the number of independent iterations of the unbinding path, Wi is the work along the i-th unbinding path done under the application of the external force, and ΔGunbinding is the free energy difference including the unbinding of the miR-155/antimiR-155 complex (ΔGduplex) and the stretching of the PEG (ΔGPEG). For each force curve, corresponding to a specific unbinding event, we have evaluated the work by calculating the integral from the beginning of the nonlinear course in the retraction curve up to the end of the jump-off event (see the inset of Figure 6). In particular, we have used the expression W = ∫baF dλ where the integration variable, λ, is the piezo displacement.22,23 To restrict the analysis to single unbinding events, only force curves characterized by an unbinding force below 200 pN have been taken into consideration. Although, in principle, the JI should be independent of the rate at which the external force is applied, at high loading rates, the decrease in the lifetime of the complex can result in a significant deviation from the required adiabatic regime, with a concomitant introduction of large statistical fluctuations.21
Figure 6.

Unbinding free energy as a function of the reciprocal of the loading rate (1/R). Error bars indicate the standard deviations. Inset: the grey region represents the work done during the unbinding path, this being calculated by the integral from the beginning of the nonlinear course in the retraction curve up to the end of the jump-off event.
Figure 6 shows the average and the corresponding standard deviation of ΔGunbnding as a function of the reciprocal of the loading rate. ΔGunbinding becomes progressively lower, and also, the standard deviation is decreasing. At the two lowest loading rates, ΔGunbinding approaches an almost constant value, suggesting that the adiabatic regime is substantially reached. Accordingly, the ΔGunbinding at the lowest loading rate has been assumed to be our equilibrium binding free energy. By taking into consideration that the ΔGunbinding includes the unbinding of the duplex and the stretching of the PEG, the free energy related to the duplex has been calculated from the expression Gduplex = ΔGunbinding – ΔGPEG, where the stretching free energy related for a 30 nm long PEG linker is about −1.8 kcal/mol, as previously determined.42 Accordingly, we found ΔGduplex = −12 ± 2 kcal/mol, which is in agreement with the value reported for similar systems.43 Furthermore, ΔGduplex is also consistent with the value calculated from ΔG = RT ln(KD) ∼ −10 kcal/mol, using KD extracted from the Bell–Evans approach. These results indicate that the thermodynamics of the hybridization process with one partner immobilized onto a surface does not significantly differ from that in solution.
Conclusions
Innovative biosensors for miRNAs are largely based on the hybridization process with a complementary strand immobilized onto a substrate; the efficiency and the optimization of such a process require that several experimental parameters be addressed, including the interaction kinetics. We have applied SPR and AFS techniques to characterize the hybridization process of miR-155, a multifunctional miRNA overexpressed in several diseases, with the complementary strand (antimiR-155) immobilized onto a gold-coated surface. With such an aim, our investigation has been performed in conditions reminiscent of those used in biosensing experiments. The kinetics of the duplex formation has been well described by the 1:1 Langmuir process, with this indicating that a single layer of duplex, with a good level of homogeneity, is formed. By SPR, we found an association and dissociation rate of about 104 M–1 s–1 and 10–5 s–1, respectively. The kon value provides an indication for the required time for the hybridization process at the corresponding concentration, while the koff, related to the lifetime, τ = 1/koff = 105 s, gives an estimation of the duplex duration; both these values are useful for optimizing measurement conditions in biosensors based on microfluidic assay. The slightly higher value for the dissociation rate koff = 10–4 s–1, found by AFS and corresponding to a shorter lifetime suggests that the hybridization process could be slightly different when a solution is fluxed onto the substrate. The dissociation constant that was found, KD ∼ 1 nM, indicates a high affinity between the partners and falls within the range expected for a very stable and specific interaction, similarly to what was observed for duplex formation when the oligonucleotides are free in solution. Such a behavior is also confirmed by the unbinding free energy value found for the duplex by AFS. All these results provide a characterization of the hybridization kinetics of miR-155 with its complementary strand immobilized onto a gold-coated substrate, and they could help to pave the way for the development and optimization of advanced biosensing experiments for miR-155, with these procedures being easily extended to other miRNAs.
Materials and Methods
Materials
Single-stranded RNA oligonucleotides with the sequence of human miR-155-5p (5′-uaa ugc uaa ucg uga uag ggg-3′) untagged (miR-155, 6.8 kDa), tagged at the 5′ end with the ThiolC6 linker group (miR-155-SH, 10 kDa) and the complementary strand (aaa aaa aac ccc uau cac gau uag cau uaa-3′), tagged with the ThiolC6 linker group, (antimiR-155, 9.9 kDa), as well as untagged miR-21-5p (5′-uag cuu auc aga cug aug uug a-3′, miR-21, 7.0 kDa), and miR-141-5p (5′-uaa cac ugu cug gua aag aug g-3′, miR-141, 7.1 kDa), were purchased from Metabion (Planegg, Germany). The producer purified the oligonucleotides by high-performance liquid chromatography–mass spectrometry (HPLC–MS). These oligonucleotides were resuspended in sterile 10 mM sodium phosphate buffer (NaPi, 8.1 mM Na2HPO4, 1.9 mM NaH2PO4, pH 7.8) and stored at 253 K. Work surfaces and equipment were decontaminated using RNaseZap (Ambion, Sigma-Aldrich Co.). Prior to use, ThiolC6-tagged oligonucleotides were incubated for 1 h with 100 mM dithiothreitol (DTT) (Sigma-Aldrich Co.) in NaPi buffer at pH 8.0 in order to break the disulfide bond protecting the thiol (−SH) moiety; the obtained miR-155-SH and antimiR-155-SH were eluted from NAP10 columns (GE Healthcare, USA) with working buffer (8.1 mM Na2HPO4, 1.9 mM NaH2PO4, 276.5 mM NaCl, 5.5 mM KCl, I = 300 mM, pH 7.8) for the removal of DTT. Buffers were prepared using reagents from Sigma-Aldrich Co. and bidistilled water; after being microfiltered (Sartorius, Göttingen, Germany), they were stored at 277 K and thermalized at room temperature before experiments.
SPR Measurements
SPR experiments were performed at 298 K with a Biacore X100 instrument (GE Healthcare, BioSciences AB, Uppsala, Sweden). AntimiR-155 was anchored to a solid metal support (sensor chip), while miR-155 was fluxed free over the ligand-functionalized surface, and their interaction was monitored in real time through the changes in the refractive index of the medium in close proximity to the surface as a shift in the SPR angle. AntimiR-155 was immobilized onto a customizable Sensor Chip Au (GE Healthcare) surface through a strategy involving covalent thiol–gold interactions. Briefly, the surface of the sensor chip was first covered with 30% hydrogen peroxide (Sigma-Aldrich Co.) and activated by ultraviolet (UV) irradiation for 30 min. After washing with ultrapure water and drying with nitrogen, the chip was immediately docked in the instrument and primed with running buffer [working buffer with 0.005% surfactant p20 (GE Healthcare)]. Using Manual Run (Biacore X100 software), two consecutive injections of 130 μL of a solution of 8 μM antimiR-155-SH in working buffer at pH 7.8 were carried out in flow cell 2 (Fc2) at a flow rate of 5 μL/min for 1080 s, while flow cell 1 (Fc1) was kept unmodified to be used as a reference. Then, the Manual Run was ended to allow incubation overnight at 298 K while keeping the chip docked in the instrument. In such a way, about 150–200 resonance units (RU) of antimiR-155-SH were immobilized in Fc2. Such a rather low immobilization level was chosen as a suitable compromise to avoid mass transport effect while still obtaining an appreciable response upon binding events. Furthermore, working under low ligand density conditions allows us to minimize the rebinding of the analyte during the dissociation phase.44
Interaction analyses were performed by both the automated (SCK) and (MCK) kinetics assays. With the SCK approach, five sequential increasing concentrations of the analyte (miR-155 in running buffer), ranging from 0.1 to 750 nM, were fluxed on the sensor chip surface for 180 s, each followed by a 180 s dissociation step with running buffer without intermediate regeneration. After a final dissociation of 1200 s, a 10 s pulse of 5 M NaCl in running buffer at 10 μL/min was used to ultimately unbind any residual analyte molecules. Whereas in MCK assays, the same ligand surface was regenerated between each analyte injection: each consecutive cycle consisted of the injection of one of six increasingly higher concentrations (0.1–1000 nM) of miR-155 for 180 s, followed by a dissociation step of 1200 s with running buffer and by a 10 s pulse of regeneration solution at 10 μL/min. After preliminary trials to verify that the association rate (kon) was not affected by a flow variation in the 10–30 μL/min range, the highest flow rate (30 μL/min) was chosen, with this reducing the diffusion distance, speeding up sample transition, and improving reference subtraction.44
The binding assays also included one start-up cycle using buffer to equilibrate the surface, as well as three zero concentration cycles of analyte to subtract the buffer contribution. Sensorgrams were corrected for nonspecific binding to the surface, systematic noise, and instrument drift using both the control sensograms registered from the reference Fc1 and the average blank response obtained from the zero concentration cycles. BiaEvaluation software 2.1 (GE Healthcare) was used to evaluate experimental data. Goodness of fits was evaluated by residual plots, χ2 value, and U value, the latter estimating the uniqueness of the calculated parameters (not significantly correlated for U < 15).45 Measurements were conducted in triplicates.
AFS Experiments
AFS experiments were performed by using silicon nitride AFM tips (cantilever D, SNL-10; Bruker Corporation), with a nominal spring constant, knom, of 0.06 N/m. The tips were functionalized with miR-155 using a flexible linker, N-hydroxysuccinimide-polyethyleneglycol-maleimide (NHS-PEG-MAL, 3.4 kDa, hereafter PEG) (Iris Biotech, Marktredwitz, Germany), by following the same procedure reported in ref (32). Briefly, the tips were cleaned in acetone (Sigma-Aldrich Co.) and UV-irradiated for 30 min to expose hydroxyl groups. They were therefore incubated for 2 h at room temperature with a solution of 2% (volume/volume) 2-aminopropyl-triethoxysilane (APTES) (Acros Organics, Geel, Belgium) in chloroform (Sigma-Aldrich Co.), extensively washed with chloroform, and dried with nitrogen. The silanized tips were then immersed in a 1 mM solution of PEG in dimethylsulfoxide (DMSO) (Sigma-Aldrich Co.) for 3 h, allowing the NHS-ester groups of the PEG to bind to the amino groups of APTES. After washing with DMSO and microfiltered bidistilled water, the tips were incubated overnight at 277 K with 10 μL of 10 μM miR-155-SH in working buffer pH 7.8, enabling −MAL groups of the PEG to react with the thiol group of miR-155-SH. Unreacted groups were passivated by incubation for 30 min with 1 M ethanolamine hydrochloride pH 8.5 (GE Healthcare, USA). The gold-coated electrode surfaces (screen-printed gold electrodes, DRP-C220AT-U75, Metrohm, Herisau, Swiss) were UV-irradiated for 30 min while immersed in hydrogen peroxide. Once thoroughly washed with Milli-Q and dried with nitrogen, they were incubated for 4 h at 298 K with 13 μL of a solution of 5 μM antimiR-155-ThiolC6 and 0.12 μM PEG20 in working buffer pH 7.8. All samples were stored in working buffer at 277 K. Control experiments (blocking) were performed by incubating the antimiR-155-functionalized electrode surfaces with 50 μL of 5 μM miR-155 in working buffer for 90 min at 298 K and by repeating the force curve acquisition over the same substrate.
AFS measurements were performed at room temperature with the Nanoscope IIIa/Multimode AFM (Veeco Instruments, Plainview, NY, USA) in working buffer at pH 7.8. The force, F, was evaluated by multiplying the cantilever deflection by its effective spring constant (keff = 0.052 ± 0.006 nN/m), determined according to the procedure in ref (46). Force curves were collected by approaching different points of the substrate with the tip and then retracting it. The approaching phase was stopped upon reaching a preset maximum force value of 0.7 nN. The approach was fixed at a constant velocity of 50 nm/s, while the retraction velocity was varied from 50 to 4200 nm/s. This led to five different loading rates (R), given by the product of the cantilever retraction velocity (v) and the spring constant of the entire system (ksyst) which was determined according to the procedure in ref (47). At each loading rate, more than thousands of force curves were acquired to guarantee information with statistical significance.
Worm-like Chain Analysis
Curves characterized by a nonlinear trend before the jump-off were preliminarily selected to find out those exhibiting the peculiar stretching features of the PEG linker, according to [PCCP]. In particular, the trend of the nonlinear portion of the retraction force curve after the baseline deflection and before the jump-off, expected to reflect the stretching of the PEG, was fitted by the worm-like chain (WLC) model,34 through the expression
| 3 |
where F is the applied force, γ is the molecular extension, lp is the persistence length, and L is the contour length of the polymer, i.e., the maximum distance between the ends of the linear polymer chain.42 Notably, the molecular extension can be obtained from γ = λ – Δz, where Δz = F/k is the deflection of the cantilever and λ is the piezo displacement.
Acknowledgments
The Italian Association for Cancer Research (AIRC) (grant IG24450 to A.R.B.) is acknowledged for supporting this research.
The authors declare no competing financial interest.
References
- Bartel D. P. MicroRNAs: Genomics, Biogenesis, Mechanism, and Function. Cell 2004, 116, 281–297. 10.1016/s0092-8674(04)00045-5. [DOI] [PubMed] [Google Scholar]
- He L.; Hannon G. J. MicroRNAs: small RNAs with a big role in gene regulation. Nat. Rev. Genet. 2004, 5, 522–531. 10.1038/nrg1379. [DOI] [PubMed] [Google Scholar]
- Hammond S. M. An overview of microRNAs. Adv. Drug Delivery Rev. 2015, 87, 3–14. 10.1016/j.addr.2015.05.001. [DOI] [PMC free article] [PubMed] [Google Scholar]
- Macfarlane L.; R Murphy P. MicroRNA: Biogenesis, Function and Role in Cancer. Curr. Genomics 2010, 11, 537–561. 10.2174/138920210793175895. [DOI] [PMC free article] [PubMed] [Google Scholar]
- Ouyang T.; Liu Z.; Han Z.; Ge Q. MicroRNA Detection Specificity: Recent Advances and Future Perspective. Anal. Chem. 2019, 91, 3179–3186. 10.1021/acs.analchem.8b05909. [DOI] [PubMed] [Google Scholar]
- Chen X.; Ba Y.; Ma L.; Cai X.; Yin Y.; Wang K.; Guo J.; Zhang Y.; Chen J.; Guo X.; et al. Characterization of microRNAs in serum: a novel class of biomarkers for diagnosis of cancer and other diseases. Cell Res. 2008, 18, 997–1006. 10.1038/cr.2008.282. [DOI] [PubMed] [Google Scholar]
- Li W.; Ruan K. MicroRNA detection by microarray. Anal. Bioanal. Chem. 2009, 394, 1117–1124. 10.1007/s00216-008-2570-2. [DOI] [PubMed] [Google Scholar]
- Válóczi A.; Hornyik C.; Varga N.; Burgyán J.; Kauppinen S.; Havelda Z. Sensitive and specific detection of microRNAs by northern blot analysis using LNA-modified oligonucleotide probes. Nucleic Acids Res. 2004, 32, e175 10.1093/nar/gnh171. [DOI] [PMC free article] [PubMed] [Google Scholar]
- Hu Y.; Lan W.; Miller D.. Next-Generation Sequencing for MicroRNA Expression Profile BT—Bioinformatics in MicroRNA Research; Huang J., Borchert G. M., Dou D., Huan J., Lan W., Tan M., Wu B., Eds.; Springer New York: New York, NY, 2017; pp 169–177. [DOI] [PubMed] [Google Scholar]
- Zhu C. S.; Zhu L.; Tan D. A.; Qiu X. Y.; Liu C. Y.; Xie S. S.; Zhu L. Y. Avenues Toward microRNA Detection In Vitro: A Review of Technical Advances and Challenges. Comput. Struct. Biotechnol. J. 2019, 17, 904–916. 10.1016/j.csbj.2019.06.018. [DOI] [PMC free article] [PubMed] [Google Scholar]
- Saarbach J.; Sabale P. M.; Winssinger N. Peptide nucleic acid (PNA) and its applications in chemical biology, diagnostics, and therapeutics. Curr. Opin. Chem. Biol. 2019, 52, 112–124. 10.1016/j.cbpa.2019.06.006. [DOI] [PubMed] [Google Scholar]
- Cardoso A. R.; Moreira F. T. C.; Fernandes R.; Sales M. G. F. Novel and simple electrochemical biosensor monitoring attomolar levels of miRNA-155 in breast cancer. Biosens. Bioelectron. 2016, 80, 621–630. 10.1016/j.bios.2016.02.035. [DOI] [PMC free article] [PubMed] [Google Scholar]
- Singh N. K.; Thungon P. D.; Estrela P.; Goswami P. Development of an aptamer-based field effect transistor biosensor for quantitative detection of Plasmodium falciparum glutamate dehydrogenase in serum samples. Biosens. Bioelectron. 2019, 123, 30–35. 10.1016/j.bios.2018.09.085. [DOI] [PubMed] [Google Scholar]
- Poghossian A.; Schöning M. J. Label-Free Sensing of Biomolecules with Field-Effect Devices for Clinical Applications. Electroanalysis 2014, 26, 1197–1213. 10.1002/elan.201400073. [DOI] [Google Scholar]
- Faraoni I.; Antonetti F. R.; Cardone J.; Bonmassar E. miR-155 gene: A typical multifunctional microRNA. Biochim. Biophys. Acta, Mol. Basis Dis. 2009, 1792, 497–505. 10.1016/j.bbadis.2009.02.013. [DOI] [PubMed] [Google Scholar]
- Mahesh G.; Biswas R. MicroRNA-155: A Master Regulator of Inflammation. J. Interferon Cytokine Res. 2019, 39, 321–330. 10.1089/jir.2018.0155. [DOI] [PMC free article] [PubMed] [Google Scholar]
- Nguyen H. H.; Park J.; Kang S.; Kim M. Surface Plasmon Resonance: A Versatile Technique for Biosensor Applications. Sensors 2015, 15, 10481–10510. 10.3390/s150510481. [DOI] [PMC free article] [PubMed] [Google Scholar]
- Bizzarri A. R.; Cannistraro S. The application of atomic force spectroscopy to the study of biological complexes undergoing a biorecognition process. Chem. Soc. Rev. 2010, 39, 734–749. 10.1039/b811426a. [DOI] [PubMed] [Google Scholar]
- Cooper M. A. Label-free screening of bio-molecular interactions. Anal. Bioanal. Chem. 2003, 377, 834–842. 10.1007/s00216-003-2111-y. [DOI] [PubMed] [Google Scholar]
- Jarzynski C. Nonequilibrium Equality for Free Energy Differences. Phys. Rev. Lett. 1997, 78, 2690–2693. 10.1103/physrevlett.78.2690. [DOI] [Google Scholar]
- Hummer G.; Szabo A. Free energy reconstruction from nonequilibrium single-molecule pulling experiments. Proc. Natl. Acad. Sci. U.S.A. 2001, 98, 3658–3661. 10.1073/pnas.071034098. [DOI] [PMC free article] [PubMed] [Google Scholar]
- Liu W.; Montana V.; Parpura V.; Mohideen U. Comparative Energy Measurements in Single Molecule Interactions. Biophys. J. 2008, 95, 419–425. 10.1529/biophysj.107.127886. [DOI] [PMC free article] [PubMed] [Google Scholar]
- Bizzarri A. R.; Cannistraro S. Free energy evaluation of the p53-Mdm2 complex from unbinding work measured by dynamic force spectroscopy. Phys. Chem. Chem. Phys. 2011, 13, 2738–2743. 10.1039/c0cp01474e. [DOI] [PubMed] [Google Scholar]
- Gong P.; Levicky R. DNA surface hybridization regimes. Proc. Natl. Acad. Sci. U.S.A. 2008, 105, 5301–5306. 10.1073/pnas.0709416105. [DOI] [PMC free article] [PubMed] [Google Scholar]
- Zhang J.; Lang H. P.; Yoshikawa G.; Gerber C. Optimization of DNA Hybridization Efficiency by pH-Driven Nanomechanical Bending. Langmuir 2012, 28, 6494–6501. 10.1021/la205066h. [DOI] [PubMed] [Google Scholar]
- Kaisti M.; Kerko A.; Aarikka E.; Saviranta P.; Boeva Z.; Soukka T.; Lehmusvuori A. Real-time wash-free detection of unlabeled PNA-DNA hybridization using discrete FET sensor. Sci. Rep. 2017, 7, 15734. 10.1038/s41598-017-16028-7. [DOI] [PMC free article] [PubMed] [Google Scholar]
- Oshannessy D. J.; Brighamburke M.; Soneson K. K.; Hensley P.; Brooks I. Determination of Rate and Equilibrium Binding Constants for Macromolecular Interactions Using Surface Plasmon Resonance: Use of Nonlinear Least Squares Analysis Methods. Anal. Biochem. 1993, 212, 457–468. 10.1006/abio.1993.1355. [DOI] [PubMed] [Google Scholar]
- Jing Z.; Qi R.; Thibonnier M.; Ren P. Molecular Dynamics Study of the Hybridization between RNA and Modified Oligonucleotides. J. Chem. Theory Comput. 2019, 15, 6422–6432. 10.1021/acs.jctc.9b00519. [DOI] [PMC free article] [PubMed] [Google Scholar]
- Vanjur L.; Carzaniga T.; Casiraghi L.; Chiari M.; Zanchetta G.; Buscaglia M. Non-Langmuir Kinetics of DNA Surface Hybridization. Biophysj 2020, 119, 989–1001. 10.1016/j.bpj.2020.07.016. [DOI] [PMC free article] [PubMed] [Google Scholar]
- Gong H.; Hu X.; Zeng R.; Li Y.; Xu J.; Li M.; Tang D. CRISPR/Cas12a-based photoelectrochemical sensing of microRNA on reduced graphene oxide-anchored Bi2WO6 coupling with catalytic hairpin assembly. Sens. Actuators, B 2022, 369, 132307. 10.1016/j.snb.2022.132307. [DOI] [Google Scholar]
- Moscetti I.; Cannistraro S.; Bizzarri A. R. Probing direct interaction of oncomiR-21-3p with the tumor suppressor p53 by fluorescence, FRET and atomic force spectroscopy. Arch. Biochem. Biophys. 2019, 671, 35–41. 10.1016/j.abb.2019.05.026. [DOI] [PubMed] [Google Scholar]
- Botti V.; Cannistraro S.; Bizzarri A. R. Interaction of miR-155 with Human Serum Albumin : An Atomic Force Spectroscopy , Fluorescence , FRET , and Computational Modelling Evidence. Int. J. Mol. Sci. 2022, 23, 10728. 10.3390/ijms231810728. [DOI] [PMC free article] [PubMed] [Google Scholar]
- Hinterdorfer P.; Baumgartner W.; Gruber H. J.; Schilcher K.; Schindler H. Detection and localization of individual antibody-antigen recognition events by atomic force microscopy. Proc. Natl. Acad. Sci. U.S.A. 1996, 93, 3477–3481. 10.1073/pnas.93.8.3477. [DOI] [PMC free article] [PubMed] [Google Scholar]
- Janshoff A.; Neitzert M.; Oberdörfer Y.; Fuchs H. Force Spectroscopy of Molecular Systems—Single Molecule Spectroscopy of Polymers and Biomolecules. Angew. Chem., Int. Ed. 2000, 39, 3212–3237. . [DOI] [PubMed] [Google Scholar]
- Strunz T.; Oroszlan K.; Schäfer R.; Güntherodt H. J.; Güntherodt H.-J. Dynamic force spectroscopy of single DNA molecules. Proc. Natl. Acad. Sci. U.S.A. 1999, 96, 11277–11282. 10.1073/pnas.96.20.11277. [DOI] [PMC free article] [PubMed] [Google Scholar]
- Bell I. Models for the specific adhesion of cells to cells. Science 1978, 200, 618–627. 10.1126/science.347575. [DOI] [PubMed] [Google Scholar]
- Evans E. Probing the relation between force--lifetime--and chemistry in single molecular bonds. Annu. Rev. Biophys. Biomol. Struct. 2001, 30, 105–128. 10.1146/annurev.biophys.30.1.105. [DOI] [PubMed] [Google Scholar]
- Bizzarri A. R.; Santini S.; Coppari E.; Bucciantini M.; Di Agostino; Yamada T.; Beattie C. W.; Cannistraro S. Interaction of an anticancer peptide fragment of azurin with p53 and its isolated domains studied by atomic force spectroscopy. Int. J. Nanomed. 2011, 6, 3011–3019. 10.2147/IJN.S26155. [DOI] [PMC free article] [PubMed] [Google Scholar]
- Moreno N.; Chevalier M.; Ronzon F.; Manin C.; Dupuy M.; Krell T.; Rieu J.-P. Unbinding forces of single pertussis toxin–antibody complexes measured by atomic force spectroscopy correlate with their dissociation rates determined by surface plasmon resonance. J. Mol. Recognit. 2011, 24, 1105–1114. 10.1002/jmr.1159. [DOI] [PubMed] [Google Scholar]
- Gutiérrez-Sanz Ó.; Andoy N. M.; Filipiak M. S.; Haustein N.; Tarasov A. Direct, Label-Free, and Rapid Transistor-Based Immunodetection in Whole Serum. ACS Sens. 2017, 2, 1278–1286. 10.1021/acssensors.7b00187. [DOI] [PubMed] [Google Scholar]
- Preiner J.; Janovjak H.; Rankl C.; Knaus H.; Cisneros D. A.; Kedrov A.; Kienberger F.; Muller D. J.; Hinterdorfer P. Free energy of membrane protein unfolding derived from single-molecule force measurements. Biophys. J. 2007, 93, 930–937. 10.1529/biophysj.106.096982. [DOI] [PMC free article] [PubMed] [Google Scholar]
- Oesterhelt F.; Rief M.; Gaub H. E. Single molecule force spectroscopy by AFM indicates helical structure of poly (ethylene-glycol) in water. New J. Phys. 1999, 1, 6. 10.1088/1367-2630/1/1/006. [DOI] [Google Scholar]
- Wang Y.; Li Y.; Ma Z.; Yang W.; Ai C. Mechanism of MicroRNA-Target Interaction : Molecular Dynamics Simulations and Thermodynamics Analysis. PLoS Comput. Biol. 2010, 6, e1000866 10.1371/journal.pcbi.1000866. [DOI] [PMC free article] [PubMed] [Google Scholar]
- Marquart J. A.Surface Plasmon Resonance and Biomolecular Interaction Analysis—Theory and Practice; Pumbo BV, 2013. www.sprpages.nl. [Google Scholar]
- GE Healthcare . Biacore Assay Handbook; General Electric Company, 2012. [Google Scholar]
- Hutter J. L.; Bechhoefer J. Calibration of atomic-force microscope tips. Rev. Sci. Instrum. 1993, 64, 1868–1873. 10.1063/1.1143970. [DOI] [Google Scholar]
- Friedsam C.; Wehle A. K.; Khner F.; Gaub H. E. Dynamic single-molecule force spectroscopy: bond rupture analysis with variable spacer length. J. Phys.: Condens.Matter 2003, 15, S1709–S1723. 10.1088/0953-8984/15/18/305. [DOI] [Google Scholar]