

Abstract
CT systems equipped with photon-counting detectors (PCDs), referred to as photon-counting CT (PCCT), are beginning to change imaging in several subspecialties, such as cardiac, vascular, thoracic, and musculoskeletal radiology. Evidence has been building in the literature underpinning the many advantages of PCCT for different clinical applications. These benefits derive from the distinct features of PCDs, which are made of semiconductor materials capable of converting photons directly into electric signal. PCCT advancements include, among the most important, improved spatial resolution, noise reduction, and spectral properties. PCCT spatial resolution on the order of 0.25 mm allows for the improved visualization of small structures (eg, small vessels, arterial walls, distal bronchi, and bone trabeculations) and their pathologies, as well as the identification of previously undetectable anomalies. In addition, blooming artifacts from calcifications, stents, and other dense structures are reduced. The benefits of the spectral capabilities of PCCT are broad and include reducing radiation and contrast material dose for patients. In addition, multiple types of information can be extracted from a single data set (ie, multiparametric imaging), including quantitative data often regarded as surrogates of functional information (eg, lung perfusion). PCCT also allows for a novel type of CT imaging, K-edge imaging. This technique, combined with new contrast materials specifically designed for this modality, opens the door to new applications for imaging in the future.
© RSNA, 2023

Summary
Photon-counting CT offers improved spatial resolution and spectral reconstructions, yielding advantages for cardiac, vascular, thoracic, and musculoskeletal CT imaging.
Essentials
■ CT systems equipped with photon-counting detectors, referred to as photon-counting CT (PCCT), provide advantages in clinical cardiac, vascular, thoracic, and musculoskeletal applications.
■ All these applications benefit from the improved spatial resolution as well as noise and artifact reduction offered by PCCT and allow detection of smaller structures, more subtle anomalies, and signs of pathologic abnormalities.
■ Spectral PCCT allows for a wide range of additional reconstructions from a single acquisition, thereby enabling a reduction in the radiation and contrast material dose for the patient, as well as supplementary information from which quantitative and functional information can be extracted.
■ K-edge imaging, a material-specific type of imaging possible with PCCT, due to its capacity to separate more than two energetic levels, opens the door to the exploration of new contrast materials and unprecedented CT applications.
Introduction
Since its inception in 1973, CT has undergone numerous improvements, among the most recent of which is the introduction of photon-counting detectors (PCDs) in CT platforms, referred to as photon-counting CT (PCCT). These detectors deliver images that have recently been the object of pioneer human studies, in some cases standing as critical references for the medical imaging community.
PCCT can overcome some well-known limitations of current CT systems, such as the relatively low spatial resolution, high noise, and limited spectral decomposition offered by dual-energy CT (DECT).
DECT systems have been commercially available for many years and have enabled not only improved diagnostic performance, but also several meaningful changes in CT practices. These include, among others, reduction in the contrast material dose needed to obtain diagnostic images (1,2), increases in vessel opacification (3), and lowered radiation doses due to virtual noncontrast (VNC) reconstruction (4). Nevertheless, DECT has some fundamental limitations, including limited spatial resolution and high electronic noise. Furthermore, the spectral resolution of DECT can be improved on because it uses two broad x-ray spectra or two layers of detectors, all presenting energetic overlaps. These overlaps are of varying amplitude depending on the DECT technology (5,6).
Unlike energy-integrating detectors (EIDs) used in current standard conventional and DECT scanners, PCDs are made of compounds such as cadmium telluride, cadmium zinc telluride, or silicon, which directly convert each x-ray photon into an electric pulse. The small detector element size used leads to a decrease in pixel size, which can be as low as 50 μm in preclinical systems (7) and 200 μm in clinical systems (8–14). In addition, this allows each detected photon to be counted and sorted according to its energy, thereby enabling spectral decomposition at the detector level (15–17). Furthermore, this process allows for relatively detailed spectral decomposition, into as many as seven energy bins, as well as reduction of electronic noise.
As PCDs are inherently capable of spectral decomposition, PCCT can produce various types of spectral reconstructions similar to those obtained with DECT systems with EIDs (ie, virtual monoenergetic images [VMIs], VNC, and pairs of material). Expectations are high for PCDs to confirm their theoretical potential to enhance spectral resolution. While improvements in spectral resolution have not been proven in clinical imaging as of yet, established uses of DECT spectral images are currently being transposed to PCCT and applied in daily practice (18).
In addition to improved spectral capabilities, PCCT allows detection and quantification of elements (known as K-edge imaging) with spikes in their attenuation curves at specific energetic levels corresponding to the binding energy of the K shell. Availability of K-edge imaging could prompt the development of new contrast materials, possibly allowing for an earlier and more specific detection of pathologic abnormalities as well as for the broadening of the spectrum of diseases detectable with CT.
While all major manufacturers are currently developing PCCT systems, to our knowledge, only the Siemens and Philips systems have been clinically investigated in the literature. This review article reports the clinical benefits of this technology in cardiovascular, lung, musculoskeletal, and temporal bone applications. It also discusses the possible benefits of using this imaging modality for other applications as well as future directions related to the use of new K-edge–based contrast materials with PCCT.
Terminology and Technical Summary
Important general terms used in this article are defined in Table 1. In Table 2, a list of terms referring to different types of spectral images is provided together with a short explanation. Table 3 lists the prototype and currently available commercial PCCT systems. Insights into the latest technological advances of PCCT are provided in Appendix S1.
Table 1:
Definition of General Terms Used in This Review

Table 2:
Spectral Reconstructions and Other Terms Used in This Review

Table 3:
Characteristics of Photon-counting CT Systems

Cardiac Applications
Calcifications and Coronary Artery Calcium Assessment
Research on the benefits of PCCT for imaging of vascular calcifications has shown that, compared with EID CT, the estimated volume of calcifications at PCCT is closer to the physical volume of the anthropomorphic phantom (19,20) and to that estimated with micro-CT in cadaveric specimens (21). This improvement is thought to mainly be due to improved spatial resolution and the reduction of blooming artifacts (19–21). With PCCT, blooming artifacts can be further reduced on VMIs at high energies (22), as has already been demonstrated with DECT (23). In addition, PCCT is capable of detecting smaller (as small as 0.5-mm) and less-dense calcifications, shows an increased contrast-to-noise ratio (CNR) (eg, from 4.5 to 5.0 for inserts of 200 HU), and allows visibility of dense calcifications at a lower radiation dose compared with EID CT (19,24,25). Although coronary artery calcium assessment with the traditional Agatston score is comparable between PCCT and EID CT (20), broader use of PCCT might result in the definition of new scores that, for example, include the newly detectable and less-dense calcifications. Furthermore, increased use of PCCT could lead to changes in acquisition protocols, such as lowering the radiation dose needed for accurate imaging. However, at present, coronary artery calcium score studies with PCCT in humans remain limited, and those that have been performed did not use electrocardiographic gating (22,25).
Coronary Stents
Coronary stents have been imaged with PCCT in vitro in different experimental settings. All these studies reported similar main findings: Compared with EID CT, PCCT depicted the structure of the stent better, estimated strut dimensions closer to the true dimensions, enabled easier detection of calcifications adjacent to the stent, and reduced the artifacts inside the stent, allowing for improved assessment of intrastent stenosis (26–30). Boccalini and Si-Mohamed et al (9) conducted an objective analysis that confirmed these in vitro results by directly comparing DECT and PCCT image quality of stents in a small number of human patients. Assessed parameters included the thickness of the stent struts, blooming artifacts, and intrastent artifacts, all reduced with PCCT. In addition, they found that three experienced radiologists attributed higher subjective scores to PCCT image quality for the evaluation of stent lumen and structure as well as for surrounding components. K-edge imaging with PCCT allows for depiction of the sole material of interest, for instance, the titanium composing the struts of the stents, possibly allowing for improved stent structure evaluation and distinction from very dense calcifications (27).
Coronary Artery Disease
Nowadays, CT is the imaging modality of choice to investigate chronic coronary artery disease. Recent guidelines recommend coronary CT angiography as the initial test in symptomatic patients who have an intermediate pretest risk of coronary artery disease and who do not have acute myocardial injury (31,32). Current limitations of this modality include the evaluation of distal arteries, the definition of stenosis degree in the presence of calcifications, stent assessment, and motion artifacts at a very high heart rate (31,33). These limitations derive from a combination of the limited spatial resolution of EID CT and blooming, beam-hardening, and motion artifacts. In particular, calcifications and stents on CT images appear bigger than they are in reality due to blooming artifacts, preventing correct evaluation of stenosis degree.
PCCT may eliminate some of these issues because the improved spatial resolution and noise reduction lead to more accurate depiction of calcification and blooming artifact reduction of metallic structures (Figs 1, 2). Indeed, the first results from patient studies show promising results (10,11). In a small group of 14 patients, Si-Mohamed and Boccalini et al (10) demonstrated that ultrahigh-resolution PCCT delivers improved subjective image quality, even in direct comparison with EID CT, for coronary arteries, atherosclerotic plaques (Fig 3), and many other cardiac structures, including valves (Fig 4). As an example, the three expert readers scored overall image quality as 5 (IQR, 2) with PCCT versus 4 (IQR, 1) with DECT on a five-point quality scale. As expected, calcifications had sharper borders and less blooming artifacts (calculated based on diameters of the vessels and the plaques), allowing for easier quantification of stenosis (10). Furthermore, PCCT has been shown to increase diagnostic confidence in interpreting coronary artery disease by 55% compared with DECT based on a five-point scale assessment by three radiologists (10) (Fig 3). Importantly, in these studies directly comparing PCCT and DECT, the radiation dose delivered to the patients was significantly reduced (by 19%–29%) with PCCT (9,10).
Figure 1:

(A) Maximum intensity projection and (B) volume rendered reconstructions of a coronary photon-counting CT angiography examination (performed with a Philips Healthcare scanner) in a 38-year-old man with history of myocardial infarction in the territory of the left anterior descending artery. Both images show distal branches of the right coronary artery, including the artery passing in the interatrial septum to reach the atrioventricular node (arrowheads). The distal pulmonary vessels are also clearly visible on these images (white dotted outlines). Reconstructions were performed with a 0.29 × 0.29 × 0.25-mm voxel size with a 1024 matrix size.
Figure 2:
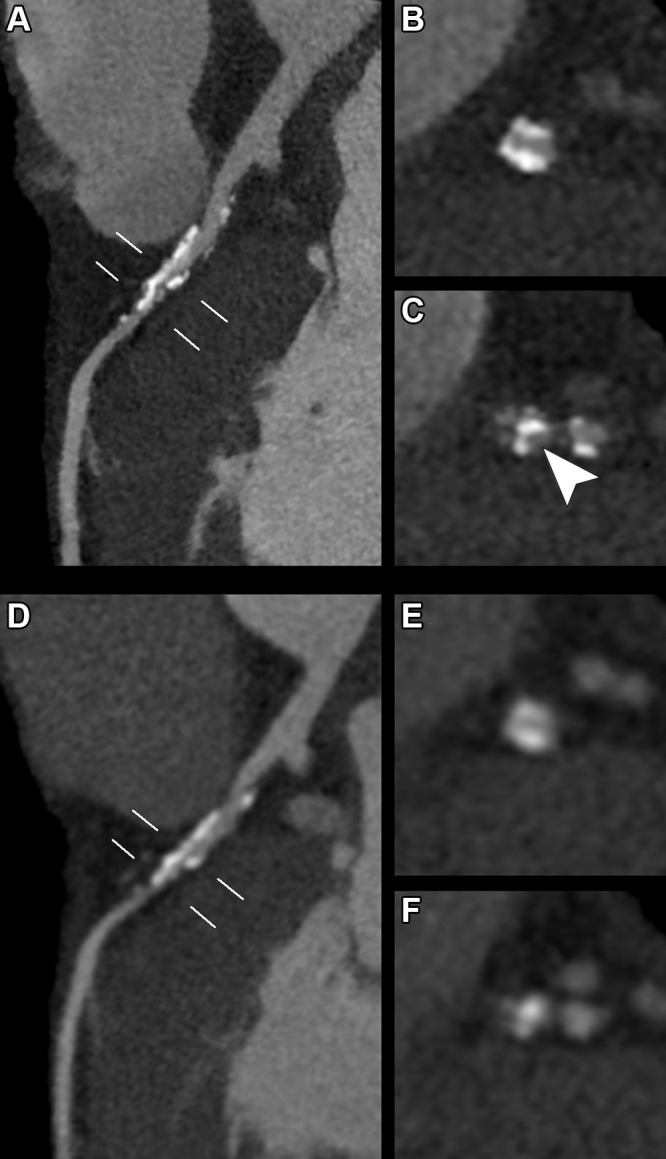
(A–C) Photon-counting CT (PCCT) (Philips Healthcare scanner) and (D–F) dual-energy CT (DECT) images show heavy calcifications of the left anterior descending coronary artery proximal and distal to the origin of the septal and diagonal branches in a 70-year-old woman who underwent coronary CT to investigate the cause of typical chest pain. PCCT images were reconstructed with a matrix of 1024 and voxels of 0.29 × 0.29 × 0.25 mm, whereas DECT images had a matrix of 512 with isotropic voxels of 0.67 mm. Curvilinear reconstructions of the (A, D) left main and left anterior descending coronary arteries show the two locations (white lines) where doubts arose regarding the presence of a significant stenosis. (B, E) The proximal view and (C, F) distal view cross-sectional images at these two locations show sharper, more defined and less bulky calcifications with (B, C) PCCT compared with (E, F) DECT. From a clinical point of view, this improved visualization of calcification confirmed the presence of (B, E) a significant proximal stenosis. Whereas with (E) DECT, the patency of the vessel was doubtful, the (B) PCCT image shows permeability of the vessel. More distally, after the origin of the branches, (C) PCCT allowed for diagnosis of stenosis due to the calcifications and afforded good visualization of the patent lumen (arrowhead). On the (F) DECT image, the distinction between calcifications and contrast material was not possible.
Figure 3:

(A, C) Photon-counting CT (PCCT) (Philips Healthcare scanner) and (B, D) dual-energy CT (DECT) images show minimal atherosclerotic lesions of a circumflex coronary artery in a 66-year-old man with known coronary artery disease. A and B show curved multiplanar reconstructions of the artery, while C and D show the cross-axial planes (white lines in A and B). Curved multiplanar reconstruction images reveal the presence of two lesions of this artery. The first lesion was small but clearly depicted by PCCT and presented a soft component (A, white arrowhead) and a calcified component (A, black arrowhead) invisible and barely visible, respectively, on the (B) DECT image. The second lesion was bigger, and the calcified component (arrows in A and B) was visible at both PCCT and DECT. Notice how with DECT, this calcification (arrow in B) presents fuzzy borders due to blooming artifacts. On (C, D) cross-axial images, the more proximal lesion is localized at the level of the origin of a tiny branch (arrows), the artery for the sinoatrial node. PCCT allowed for better definition and characterization of this plaque, as it showed two spotty calcifications and the soft component (C, arrowhead), all barely visible with (D) DECT. PCCT images were reconstructed with a matrix of 1024 and voxels of 0.29 × 0.29 × 0.25 mm, whereas DECT images had a matrix of 512 with isotropic voxels of 0.67 mm.
Figure 4:

Examples of cardiac valves imaged with photon-counting CT (PCCT) (Philips Healthcare scanner). (A) PCCT image shows an aortic valve in a multiplanar reconstruction with a well-depicted nodule of Arantius of the noncoronary cusp (arrowhead) in a 45-year-old man with a history of myocardial infarction in the territory of the left anterior descending artery. (B) PCCT image depicts a pulmonary valve showing a small orifice of regurgitation (arrowheads) in the same patient whose aortic valve is imaged in panel A. (C) A volume rendering shows the mitral valve apparatus, including the chordae (arrowheads) and the trabeculae of the left ventricle (white dotted outline), in a 47-year-old woman with a history of acute coronary artery disease.
The ability of PCCT to characterize plaques and, in particular, discriminate vulnerable plaques is also an area of great research interest. A study using postmortem human coronary arteries showed that PCCT spectral images allowed for the distinction of different elements that are not easily distinguishable using EID CT due to their similar density (34). Specifically, lipid-rich plaques identified at histologic examination presented different photograph-electric and Compton scatter values compared with the rest of the vessel wall and the epicardial fat (34). Mergen et al (35) showed that plaque component quantifications based on attenuation in Hounsfield units is related to the reconstruction parameters. Due to the lack of comparison with a reference standard in their study, however, the reconstruction parameters yielding the most accurate results for plaque component characterization remain to be established.
In the future, with spectral PCCT, it might be possible to directly visualize areas with ongoing inflammatory processes, believed to be one of the mechanisms of plaque instability. In fact, radiologists might also be able to exploit the K-edge properties of new types of contrast materials based, for instance, on gold to directly target inflammatory cells such as macrophages, as already demonstrated in animal models (36,37).
While PCCT is expected to show spectral properties at least as good as those of DECT for the evaluation of arterial lumens, including in coronary arteries, only preliminary data are available in humans, especially at very high resolution (10,13). Further advancement in cardiac imaging is expected to derive from K-edge imaging and contrast material development. For instance, by exploiting the K-edge of gadolinium, the lumen of the arteries of animals can be specifically depicted on angiographic images where only intravascular gadolinium is visible (38,39).
Vascular Applications
Similar to coronary artery imaging, the higher spatial resolution of PCCT is expected to allow for more detailed assessment of very small vascular branches and the vessel wall, as well as reduction of calcium blooming artifacts. PCCT with VMIs at low energy levels (eg, 40 keV) allows for a reduction in contrast material dose due to the increased attenuation of iodinated contrast material. For instance, CNR of the aorta is equivalent when comparing conventional EID CT images with a full contrast material dose versus PCCT VMIs at 50 keV obtained with 25% less dose (40). While specific data for PCCT are not yet available for other parts of the body, cautiously extrapolating data based on DECT with low-energy VMI showed contrast material doses may be reduced by 50% in pulmonary arteries (41) while retaining at least comparable CNR and subjective image quality scores compared with conventional DECT images. For coronary arteries, both the volume and the injection rate may be halved, with a similar number of segments judged to be of diagnostic quality (1).
In addition, PCCT-based image reconstruction algorithms allow for removal of vascular calcifications, aiding the assessment of vascular stenosis degree (42). As an example, a nominal stenosis of 50% was graded correctly with one of these algorithms and overestimated by 6% with VMIs at 65 keV in a phantom setup (42). Alternatively, iodine-based contrast enhancement may be virtually removed from the contrast-enhanced images, creating VNC images that help to differentiate calcium from iodine.
Imaging the Native Aorta and Arteries
Euler et al (43) have shown that high-pitch PCCT angiography of the aorta has significantly higher CNR on VMIs at 40 and 45 keV than matching VMIs from DECT scans acquired in the same patient at equal dose. The percentage difference was even higher, up to 34% difference in CNR, in overweight patients (43). Interestingly, noise was subjectively judged higher on a Likert scale for low-energy VMIs for both CT systems. In addition to in-stent imaging (Fig 5), more subtle disease abnormalities, especially those that manifest early in the disease process, such as renal artery stenoses in fibromuscular dysplasia and wall thickening in small-vessel vasculitis, may especially benefit from the increased spatial resolution offered by PCCT. In runoff examinations, the higher spatial resolution and reduced noise of PCCT allow for use of sharper reconstruction kernels and larger matrix sizes (up to 1024 × 1024) in clinical practice. This enables image reconstruction of the arteries of the lower legs with the same large field of view used for the pelvic region without losing image quality (Fig 6).
Figure 5:

Photon-counting CT images reconstructed at 0.4 mm using a Bv48 kernel (Siemens Healthineers) in a 55-year-old man with SMAD3 variation and osteoarthritis syndrome with previous aneurysm of the hepatic artery that had been treated with stent placement. (A) Complete axial field of view image at the level of the hepatic artery stent with detailed image quality of the vascular structures. (B) Zoomed-in coronal and (C) sagittal images of the stent reveal a very small hypointense area inside the stent (arrowheads) compatible with a small area of thrombus formation.
Figure 6:

(A–F) Abdominal aorta peripheral runoff photon-counting CT (PCCT) scan (Siemens Healthineers) in a 56-year-old man with intermittent claudication with a stent in the left superficial femoral artery and diffuse atherosclerosis in both legs. The entire scan range was reconstructed as a single image stack by using a field of view large enough to include the entire patient at the abdominal region. (A) Three-dimensional cinematic rendering reconstructions from the entire scan range (posterior view). Curved multiplanar reformats of the (B, D) upper and lower left leg and (C) zoomed-in image of the stent region. Notice the diffuse atherosclerosis (arrows in B and D) and the in-stent intimal hyperplasia (arrowheads in C). (E) Three-dimensional cinematic rendering reconstruction of the region of the left ankle and (F) multiplanar reformat. On E and F, very small vessel diameter can be observed (arrowheads) even though it is next to the calcification (arrows). (G–I) Abdominal aorta peripheral runoff PCCT scan in a 68-year-old patient with intermittent claudication, most severe on the left side. (G) Curved multiplanar reformation of the left anterior tibial artery with extensive calcifications (arrows) and (H, I) axial images at the level of the ankle and distal left lower leg. Notice how the lumen can be accurately assessed (G–I, arrowheads) despite the calcifications (G–I, arrows).
Post–Aortic Surgery and Interventional Imaging
PCCT offers advantages in follow-up imaging after open surgical and endovascular aorta repair by improving spatial resolution for imaging of the stent graft with reduced metal artifacts. In addition, PCCT reconstructions with removal of iodine are helpful to discriminate calcifications in the aneurysm sac from true endoleaks as well as surgical polytetrafluoroethylene felt material (which is commonly used during surgery on the thoracic aorta) from contrast material leakage, obviating the need for an additional noncontrast acquisition or follow-up scans (44). As an incidental finding, low-density blood pools on VNC images can indicate the presence of underlying anemia, as a good correlation with hemoglobin levels (R2 = 0.81) has been demonstrated (45).
Compared with regular VNC reconstructions, more sophisticated “pure calcium” PCCT algorithms performed better with regard to erroneous subtractions of stent parts and calcifications and were deemed to be able to replace true noncontrast scans in most cases (95% of assessed data sets vs 75% with VNC reconstructions) (46). Because patients who have undergone aortic surgery or stent placement often undergo yearly follow-up scans, omitting the true noncontrast scans helps reduce lifetime radiation exposure. This type of algorithm is promising also for quantification of calcifications (eg, coronary and valvular) on contrast-enhanced CT scans. However, assessment of absolute values of calcium scores obtained by noncontrast acquisition in 67 patients substantially differed, sometimes by more than 60 points, from those obtained on true noncontrast images (47). Therefore, the algorithm needs to be improved further before it can be reliably used.
Thoracic Applications
CT is the cornerstone of the diagnosis and follow-up of many diseases that involve the lungs. The image quality of a lung CT examination and its radiation dose are two factors that are considered current limitations of conventional CT technology and, thus, open to optimization. With the technical benefits expected from PCDs, PCCT is expected to improve and expand the current use of CT in lung imaging (48).
For lung parenchyma imaging, Si-Mohamed and Boccalini et al (12) have demonstrated, in one healthy volunteer, improved noncontrast PCCT image sharpness and conspicuity for small lung structures, including the interstitial tissue (especially the fissures), the distal airways and their walls, up to fourth-order bronchi, as well as distal vessels as compared with EID CT. These findings are mainly explained by the ultrahigh resolution achievable with a radiation dose lower than or similar to that from current EID CT systems, taking benefit from higher matrix size (eg, 1024–2048), thinner section thickness (eg, as low as approximately 0.2 mm), and higher-frequency filters (48–50). In addition to the increased spatial resolution, PCCT enables a greater dose efficiency associated with electronic noise suppression, resulting in noise reduction particularly in the regions prone to stronger beam-hardening artifacts, such as at the level of the shoulders and the diaphragm. For example, as demonstrated by Symons and Pourmorteza et al (51) in 30 participants at a tube current of 100 and 120 kVp, the noise was reduced between 15.2% and 16.8% compared with EID CT. Furthermore, the difference in attenuation between the pectoral and paraspinal muscle at the level of the aortic arch was significantly lower with PCCT, suggesting that the effects of beam hardening on image quality had been reduced.
PCCT also allows improved evaluation of lung density because of reduced electronic noise, suppression of beam-hardening artifacts, and better noise management enabled by its dose efficiency. As an example, a phantom study has shown that compared with EID CT, PCCT allowed more accurate quantification of biomarkers of emphysema, such as the low attenuation areas below −950 HU and the CT attenuation value at the 15th percentile of the lung CT histogram (52). This achievement may impact the management of chronic obstructive pulmonary disease and alpha-1 antitrypsin deficiency, for instance, allowing more precise quantification of the disease before and after treatment.
For nodule imaging, studies have shown that PCCT improved detection of different nodules (48,53,54), including both low-contrast ones such as ground-glass and subsolid nodules and high-contrast ones such as solid nodules (Fig 7). As an example, Si-Mohamed et al (55) showed a five times higher detectability index for a ground-glass nodule of 4 mm (in a dedicated thoracic phantom) with standard radiation dose compared with DECT. In addition, with a similar or lower dose, Zhou et al (53,54) and Kopp et al (56) showed that PCCT enabled more precise characterization of the contours and structures of both regularly and irregularly shaped nodules. They also reported more accurate quantification of nodule volumes in comparison with standard and high-resolution EID CT (53,54,56). These findings have importance for the management of incidental lung nodules, since nodules with irregular or spiculated margins, including distortion of adjacent vessels, have a higher risk of being malignant (57). In addition, preliminary studies have demonstrated the feasibility of low- and ultralow-dose PCCT imaging with potentially higher image quality than with current CT systems at similar radiation dose (12,51,58). Altogether, the expected benefits of PCCT may designate it as a more efficient tool for lung cancer screening even at lower radiation doses.
Figure 7:
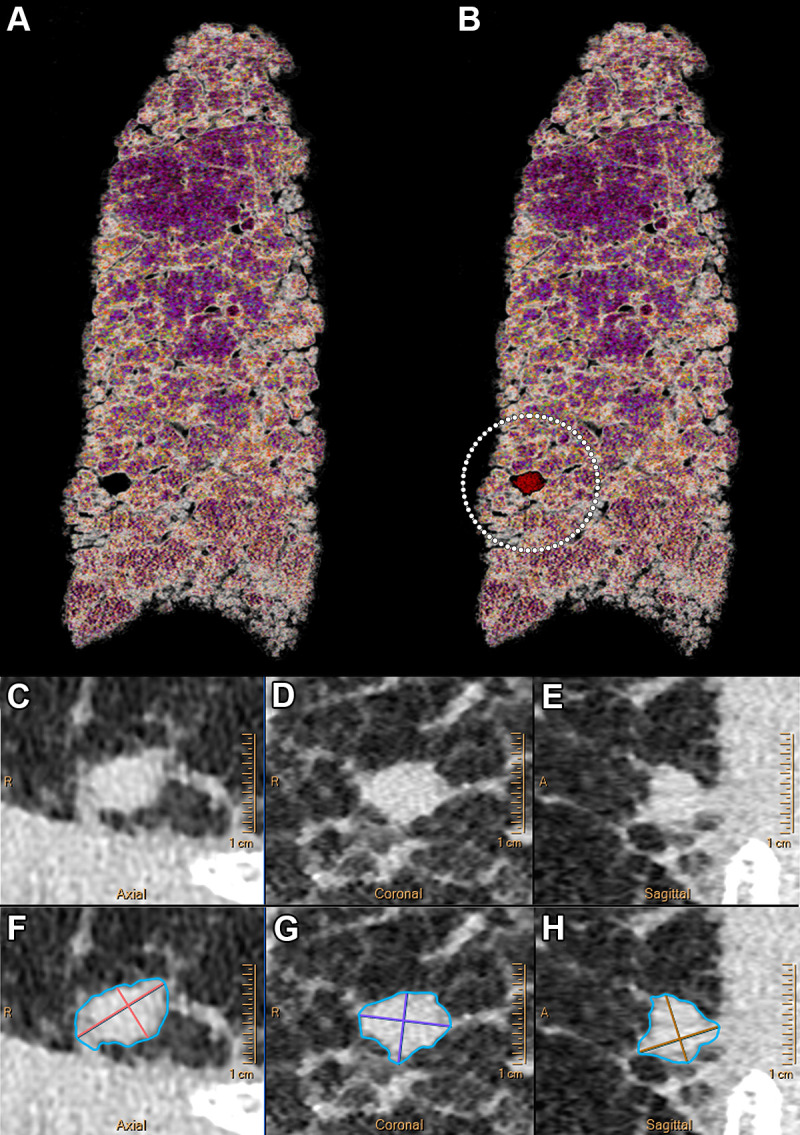
Example ultrahigh-resolution photon-counting CT images (Philips Healthcare scanner) of the lung show a centimetric solid nodule in a 58-year-old male patient with unclassifiable idiopathic interstitial lung disease. (A) Volume rendered image of lung parenchyma and (B) fusion volume rendered image between lung parenchyma and high-contrast nodule and reticulation (white dotted circle). (C–F) Quasi-isotropic multiplanar reconstruction images with 0.29 × 0.29 × 0.25-mm voxel size. (C–H) Multiplanar images show a magnified view of the spiculated nodule (C–E) before and (F–H) after automatic segmentation (IntelliSpace Portal, Philips) found in the lower right lobe and measuring 238.2 mm3.
For interstitial lung disease, Inoue et al (59) showed that PCCT outperformed an EID CT system in regard to image quality for the detection of reticulation, ground-glass opacities, and mosaic pattern while also enabling a higher confidence score for the probability of usual interstitial pneumonia. These findings are mainly explained by the ultrahigh resolution capabilities of PCCT, which may be further improved with use of the different visualization techniques available on workstations (Fig 8). In patients with persisting symptoms after SARS-CoV-2 infection, PCCT showed improved detection of lung abnormalities, especially bronchiolectasis, compared with EID CT. Additionally, the use of PCCT aided in the reclassification of ground-glass areas as reticulations, potentially explaining the chronic nature of the post–COVID-19 condition (60). Furthermore, Ferda et al (61) and Jungblut et al (62) have shown that low-dose lung PCCT may yield image quality sufficient for diagnosing interstitial pneumonia, highlighting the potential for further radiation dose reduction for the diagnosis and follow-up of interstitial lung disease.
Figure 8:

Example lung ultrahigh-resolution photon-counting CT images (Philips Healthcare scanner) show a typical usual interstitial pneumonia in a 73-year-old male patient. (A) Coronal oblique image with 0.29 × 0.29 × 0.25-mm voxel size shows subpleural predominant reticular abnormality with distal traction bronchiectasis and an area of honeycombing occurring in single or multiple layers (arrowhead). An important area of distal bronchiectasis and bronchiolectasis is seen in the right lower lobe with a clear visualization of the bronchial lumen from the center to the subpleural space (red dotted circle). An area of ground-glass opacity (arrow) is shown to present reticulations and traction bronchiectasis, indicating a fibrosis pattern. (B) A 3-mm-width volume rendered image with clear visualization of the traction bronchiectasis, honeycombing, and architectural distortion of the lungs.
In addition to the improved performance of PCCT for conventional imaging, the spectral capabilities of PCCT could combine anatomic and functional data for the diagnosis of many vascular lung diseases, such as pulmonary embolism and chronic thromboembolic pulmonary hypertension (Fig 9) (63–65). Furthermore, VNC images might enable some otherwise impracticable analysis of contrast-enhanced thoracic scans. As an example, one study demonstrated the feasibility of quantifying emphysema on VNC images generated at clinical PCCT from arterial and portal phases with high accuracy compared with true noncontrast images. Consequently, PCCT may allow significant reduction of noncontrast acquisitions by providing accurate and consistent VNC images (66). Furthermore, K-edge imaging could be advantageous for new thoracic applications, such as the discrimination between two contrast materials for lung ventilation and perfusion, specific lesion labeling, or theragnostic applications (17,67,68).
Figure 9:

Example lung photon-counting CT angiography images (Philips Healthcare scanner) with a multiparametric imaging analysis of the lung anatomy and its function show pulmonary embolism and its impact on the lung perfusion in a 41-year-old woman with pulmonary hypertension. (A) An axial 5-mm-width maximum intensity projection virtual monoenergetic image (VMI) at 70 keV that substitutes a 120-kVp conventional image due to similar mean energy of its spectrum. Multiple filling defects are seen in the right lower lobe (arrowheads). Also visible are the dilated distal pulmonary vessels (arrow) suggesting pre-existing pulmonary hypertension. (B) An axial 5-mm-width maximum intensity projection VMI at 40 keV that simulates the attenuation of a tissue at low energy (ie, 40 keV), consequently enabling an increase in CT attenuation of iodine due to an energy being close to its K-edge (33.2 keV). This effect enables a greater discrimination of the emboli (arrowheads) responsible for subsegmental partial and complete filling defects. (C) An axial 5-mm-width Z-effective image that measures the integrated atomic number of the tissue within a voxel. The contrast generated from the image is color-coded (in red are lower Z-effective values and in blue, higher Z-effective values) and enables the visualization of a perfusion defect downstream from the embolus completely occluding the laterobasal subsegment of the right lower lobe (★). (D) An axial 5-mm-width iodine map, a validated surrogate marker of lung perfusion that contributes to the functional assessment of vascular lung diseases. The contrast generated from the image is color-coded (black means no iodine, and red, a high iodine concentration) and enables visualization of an embolic-type perfusion defect downstream from the complete filling defect in the laterobasal subsegment of the right lower lobe (★). On the contrary, in the posterobasal subsegment, where a partial filling defect is seen in a subsegmental branch of the right lower pulmonary artery, the perfusion is preserved (white dotted circle).
Musculoskeletal Applications
PCCT offers advantages for musculoskeletal imaging, particularly related to its increased spatial resolution, which allows for detailed visualization of cortical and trabecular bone (Fig 10). In a feasibility study of 32 patients, Baffour et al (69) demonstrated that PCCT provided improved depiction of the shoulder and pelvic bones at radiation doses reduced by 31%–47% compared with EID CT. For smaller joints such as the wrist, a recent study on cadaveric specimens showed that PCCT provided superior visibility of cortical bone, trabeculae, and nutrient canals as well as an overall improved image quality compared with EID CT, even at half the radiation dose (70). These findings were confirmed in a 12-patient study that showed that PCCT was superior to EID CT in the visualization of wrist structures despite a 49% lower radiation dose (71). PCCT may also enhance the detection and characterization of fractures, especially those of small bones, such as in the wrist and foot. Moreover, follow-up of fracture healing may also benefit from the higher spatial resolution provided by PCCT (72).
Figure 10:
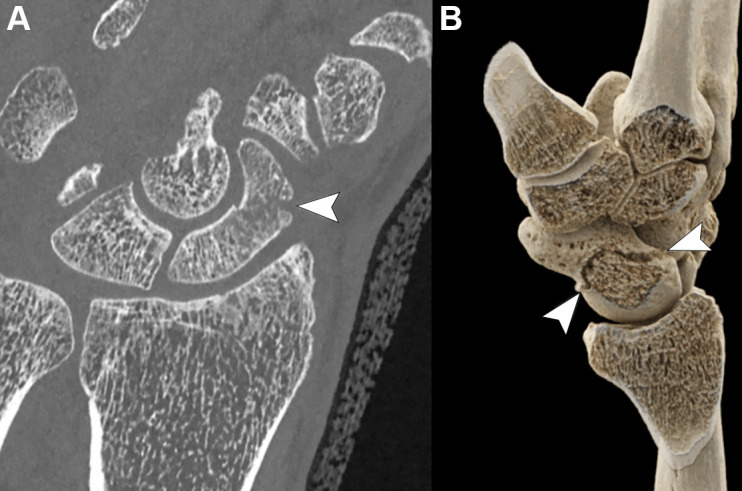
(A) Photon-counting CT coronal multiplanar image (Siemens Healthineers scanner) and (B) three-dimensional volumetric reconstruction using a cinematic rendering algorithm show a horizontal oblique fracture of the middle third of the scaphoid (arrowheads) in an otherwise healthy 47-year-old man.
High-resolution imaging of bone with PCCT also opens up the possibility to assess bone structure as a measure of “bone strength and quality” in the context of osteoporosis and other metabolic bone disorders (73). Currently, high-resolution peripheral quantitative CT is often considered the reference standard for imaging of bone microarchitecture, as it provides a range of quantitative parameters related to the cortical bone (eg, mean area, mean thickness, and porosity) and the trabecular bone (eg, mean thickness, mean number of trabeculae per unit length, and separation between trabeculae), as well as volumetric bone mineral density per bone compartment. Several of these parameters have been linked to fracture risk in patients with osteoporosis (74). However, high-resolution peripheral quantitative CT is limited to imaging the distal extremities. Furthermore, this imaging modality is primarily applied in clinical research settings, and implementation in daily clinical practice has been limited (75).
In the future, PCCT may serve as an alternative noninvasive method to assess bone microarchitecture at multiple anatomic sites, including common sites of osteoporotic fracture, such as the hip and vertebrae. Possibly, the assessment of bone quality could be performed in a single examination in conjunction with the initial diagnostic work-up of fractures in patients deemed at risk for osteoporosis. Of course, thorough validation against high-resolution peripheral quantitative CT and clinical outcomes of osteoporosis, as well as the availability of postprocessing algorithms and normative data, would be necessary before such a strategy could be implemented.
Another promising musculoskeletal application of PCCT is related to the reduction of beam-hardening artifacts compared with conventional EID-based CT scanners, which facilitates enhanced visualization of tissues around metal. Although systematic clinical studies are still lacking, it is expected that orthopedic implants, such as joint prostheses and fixation devices, can be evaluated more accurately with PCCT for complications such as loosening. In uncemented implants, the presence or absence of osseointegration—the structural and functional connection between living bone and the surface of a load-bearing artificial implant—could be more accurately determined by means of PCCT.
PCCT has also shown promise for musculoskeletal oncologic applications. In a recent comparative study of PCCT versus EID CT in 27 patients with multiple myeloma, Baffour et al (76) found that PCCT yielded improved visualization of lytic lesions, intramedullary lesions, fatty metamorphosis, and pathologic fractures, both with and without the application of denoising by a convolutional neural network. Another recent pilot investigation concluded that PCCT provided similar quantitative image quality and equivalent qualitative reader scores for multiple myeloma screening as EID CT, and did so at a significantly reduced radiation dose (83% lower) (77). In a similar comparative study of patients with breast cancer with bone metastases (78), it was found that PCCT was associated with an improved visualization of bone lesion margins and content and less interreader variability in the structural assessment of lesion sizes compared with EID CT.
Finally, the spectral information provided by PCCT could enhance musculoskeletal diagnostics similar to current DECT. For instance, the ability to visualize bone marrow edema may increase the conspicuity of fractures or could help distinguish old versus recent fractures. Theoretically, spectral information may also allow better visualization of soft-tissue structures. For example, Chappard et al (79) have shown that with VMIs at 60 keV, visual inspection of knee cartilage disruption in such tissues as the meniscus, tendons, ligaments, articular cartilage, and triangular fibrocartilage complex of the wrist was feasible in cadaveric specimens. While these preliminary results are promising, validation studies are needed to compare soft-tissue visualization at PCCT and MRI.
Imaging of the Temporal Bone and Internal Ear
The capability of PCCT to visualize bone structures in high anatomic detail can also be applied to the temporal bone, where it provides excellent visualization of the inner and middle ear, including the small bony structures of the ossicular chain, even with a reduced radiation dose (80,81) (Fig 11). This may increase confidence in diagnosing various diseases that are characterized by more subtle osseous changes, such as otosclerosis, cholesteatoma, and dehiscence of the semicircular canal, as well as congenital abnormalities.
Figure 11:

(A) Ultrahigh-resolution photon-counting CT image (Siemens Healthineers scanner) and (B) corresponding illustration of the temporal bone in a 53-year-old woman being examined for loss of hearing. The image shows the stapes (red shading in B) and its anterior and posterior arches in high anatomic detail as well as the lenticular process of the incus (yellow shading in B) and the incudostapedial joint (interface between the red and yellow structures in B). Several inner ear structures, such as the cochlea (green shading in B), are also visualized.
The Future of PCCT
We have summarized the improvements in imaging performance offered by PCCT compared with previous generations of CT technology that have been observed to date. Notwithstanding the encouraging results, we are at the very beginning of human investigations with PCCT. Henceforth, larger cohorts of patients from different centers are needed to fully explore and understand the comparative benefits and drawbacks of this new technology.
General Considerations
This new technology will lead to data challenges due to the higher spatial resolution, production of data in as many as seven channels, and multiple possible types of reconstructions. Handling the large amount of data generated may require adaptations of the picture archiving and communication system. Another challenge is that, at present, spectral data are not standardized and thus are stored in different formats that can only be analyzed with vendor-specific software. As PCCT scanners become more broadly available, this might impede optimized management of patients across hospitals.
PCCT has the potential to be applicable to many anatomic regions across different categories of patients, occasioning specific benefits that will be better understood with increased use of this imaging modality. Among the most anticipated benefits of PCCT already supported by the literature is improved image quality, namely CNR of different organs, for overweight and obese patients with or without concomitant radiation dose sparing (43,51,82).
Possibly the most pressing and highly anticipated future studies will be those that examine in clinical practice the theoretical improvements in spectral separation engendered by PCCT. The combination of ultrahigh spatial resolution and spectral capabilities is expected to result in improved performance of PCCT versus DECT. At the time of writing, only one study on this topic has been reported, to our knowledge, and this study used a clinical prototype from Philips (10).
Contrast Material Development
Due to its spectral decomposition capabilities, PCCT also opens exciting possibilities for contrast material development. While we expect that the current clinically available iodinated contrast materials will still be used in conjunction with PCCT, these agents have some disadvantages for use with any type of CT system, such as allergic reactions and a lack of specificity. Moreover, the K-edge of iodine is too low for K-edge imaging, and thus, the use of iodine at PCCT results in difficulty distinguishing the iodine signal from that of calcified structures, the same issue that occurs with EID CT and DECT. Therefore, there has been strong interest in agents based on other elements that possess higher K-edges for use with spectral PCCT imaging (83) (Table 4).
Table 4:
Summary of Prominent Materials Proposed as Contrast Materials for Spectral Photon-counting CT

Gadolinium chelates represent a promising alternative because they are already approved by the U.S. Food and Drug Administration (84,85). However, two to three times the gadolinium dose used for MRI would have to be administered for most PCCT imaging applications, and the retention of gadolinium in the brain is already a concern (86). Alternatives to iodine and gadolinium are also being explored. Tantalum oxide nanoparticles are advanced in their preclinical development and represent a high-contrast material with a good safety profile (83,87). Interestingly, hafnium oxide nanoparticles have been approved in Europe as a radiosensitizer for cancer therapy and therefore have the potential for use as an off-label CT contrast material, although the utility of this formulation for imaging is not well known. Gold nanoparticles have been studied by several groups for spectral PCCT applications (88,89). They are typically found to be safe, and their size and shape can be synthetically controlled. These properties, along with their high density, have recently led to their use for cell tracking applications (67). Bismuth nanoparticle contrast materials were reported early in the development of PCCT (90), inspired in part by bismuth-containing antacids. However, there have been fewer reports on bismuth in recent years, perhaps due to its high K-edge, which leads to a relatively low CNR on K-edge images (83). Overall, there are agents that can be used for K-edge imaging immediately (ie, gadolinium chelates and hafnium nanoparticles) and others that may be able to be used soon. These agents may afford novel applications, such as theranostics (91), cell tracking (67), and molecular imaging (36).
Conclusion
After 2 decades of development, photon-counting CT technology is now available for clinical use in humans. Although limited in number and conducted on small groups of patients, the first clinical studies have yielded promising insights. Photon-counting detectors provide benefits for all examinations demanding high spatial resolution, such as coronary, vascular, lung, and musculoskeletal CT. Furthermore, improvements in spectral resolution combined with high spatial resolution should allow for better characterization of small objects, such as coronary artery atherosclerotic plaques, and the detection of small cancers. Finally, K-edge imaging will allow for the development of new contrast materials with potential novel CT applications, such as theranostics and molecular imaging.
P.C.D. and S.B. contributed equally to this work.
Disclosures of conflicts of interest: P.C.D. Grant to institution from the European Union under the Horizon 2020 Research and Innovation Program (grant agreement no. 633937). S.B. Payment for lectures from Philips; support to attend a meeting from Guerbet. E.H.G.O. Research support to institution from Siemens Healthineers. D.P.C. Grant to institution from the National Institutes of Health. A.P. Institutional sponsored research agreements with Canon Medical Research, GE HealthCare, and Siemens Healthcare; royalties from CardioWise; consulting fees from CardioWise; patent US10959618B2 issued and patents no. 62/699,478 and 20200151880 A1 pending; stock options in CardioWise. L.B. No relevant relationships. S.A.S.M. Payment for presentation from Boehringer Ingelheim. R.P.J.B. Research support to institution from Siemens Healthineers; payment for lectures to institution from Bayer and Siemens Healthineers; support for attending meetings and/or travel to institution from Siemens Healthineers; executive board member for the European Society of Cardiovascular Radiology, member of the Society of Cardiovascular Computed Tomography guidelines committee, and member of the cardiovascular section of the Dutch Society of Radiology; editorial board member for Radiology: Cardiothoracic Imaging.
Abbreviations:
- CNR
- contrast-to-noise ratio
- DECT
- dual-energy CT
- EID
- energy-integrating detector
- PCCT
- photon-counting CT
- PCD
- photon-counting detector
- VMI
- virtual monoenergetic image
- VNC
- virtual noncontrast
References
- 1. Rotzinger DC , Si-Mohamed SA , Yerly J , et al . Reduced-iodine-dose dual-energy coronary CT angiography: qualitative and quantitative comparison between virtual monochromatic and polychromatic CT images . Eur Radiol 2021. ; 31 ( 9 ): 7132 – 7142 . [DOI] [PMC free article] [PubMed] [Google Scholar]
- 2. Cavallo AU , Patterson AJ , Thomas R , et al . Low dose contrast CT for transcatheter aortic valve replacement assessment: results from the prospective SPECTACULAR study (spectral CT assessment prior to TAVR) . J Cardiovasc Comput Tomogr 2020. ; 14 ( 1 ): 68 – 74 . [DOI] [PubMed] [Google Scholar]
- 3. Bae K , Jeon KN , Cho SB , et al . Improved opacification of a suboptimally enhanced pulmonary artery in chest CT: experience using a dual-layer detector spectral CT . AJR Am J Roentgenol 2018. ; 210 ( 4 ): 734 – 741 . [DOI] [PubMed] [Google Scholar]
- 4. Si-Mohamed S , Dupuis N , Tatard-Leitman V , et al . Virtual versus true non-contrast dual-energy CT imaging for the diagnosis of aortic intramural hematoma . Eur Radiol 2019. ; 29 ( 12 ): 6762 – 6771 . [DOI] [PubMed] [Google Scholar]
- 5. Johnson TRCC . Dual-energy CT: general principles . AJR Am J Roentgenol 2012. ; 199 ( 5 Suppl ): S3 – S8 . [DOI] [PubMed] [Google Scholar]
- 6. McCollough CH , Leng S , Yu L , Fletcher JG . Dual- and multi-energy CT: principles, technical approaches, and clinical applications . Radiology 2015. ; 276 ( 3 ): 637 – 653 . [DOI] [PMC free article] [PubMed] [Google Scholar]
- 7. Butler PH , Adebileje SA , Alexander SD , et al . MARS pre-clinical imaging: the benefits of small pixels and good energy data . In: Müller B , Wang G , eds. Proceedings Volume 11113, Developments in X-Ray Tomography XII . SPIE; , 2019. ; 111130C . [Google Scholar]
- 8. Adam SZ , Rabinowich A , Kessner R , Blachar A . Spectral CT of the abdomen: where are we now? Insights Imaging 2021. ; 12 ( 1 ): 138 . [DOI] [PMC free article] [PubMed] [Google Scholar]
- 9. Boccalini S , Si-Mohamed SA , Lacombe H , et al . First in-human results of computed tomography angiography for coronary stent assessment with a spectral photon counting computed tomography . Invest Radiol 2022. ; 57 ( 4 ): 212 – 221 . [DOI] [PMC free article] [PubMed] [Google Scholar]
- 10. Si-Mohamed SA , Boccalini S , Lacombe H , et al . Coronary CT angiography with photon-counting CT: first-in-human results . Radiology 2022. ; 303 ( 2 ): 303 – 313 . [DOI] [PubMed] [Google Scholar]
- 11. Mergen V , Sartoretti T , Baer-Beck M , et al . Ultra-high-resolution coronary CT angiography with photon-counting detector CT: feasibility and image characterization . Invest Radiol 2022. ; 57 ( 12 ): 780 – 788 . [DOI] [PMC free article] [PubMed] [Google Scholar]
- 12. Si-Mohamed S , Boccalini S , Rodesch PA , et al . Feasibility of lung imaging with a large field-of-view spectral photon-counting CT system . Diagn Interv Imaging 2021. ; 102 ( 5 ): 305 – 312 . [DOI] [PubMed] [Google Scholar]
- 13. Boccalini S , Si-Mohamed S , Dessouky R , Sigovan M , Boussel L , Douek P . Feasibility of human vascular imaging of the neck with a large field-of-view spectral photon-counting CT system . Diagn Interv Imaging 2021. ; 102 ( 5 ): 329 – 332 . [DOI] [PubMed] [Google Scholar]
- 14. Rajendran K , Petersilka M , Henning A , et al . First clinical photon-counting detector CT system: technical evaluation . Radiology 2022. ; 303 ( 1 ): 130 – 138 . [DOI] [PMC free article] [PubMed] [Google Scholar]
- 15. Taguchi K , Blevis I , Iniewski K , eds. Spectral, Photon Counting Computed Tomography . Devices, Circuits, and Systems Series . Boca Raton: : CRC Press; , 2020. . [Google Scholar]
- 16. Willemink MJ , Persson M , Pourmorteza A , Pelc NJ , Fleischmann D . Photon-counting CT: technical principles and clinical prospects . Radiology 2018. ; 289 ( 2 ): 293 – 312 . [DOI] [PubMed] [Google Scholar]
- 17. Si-Mohamed S , Bar-Ness D , Sigovan M , et al . Review of an initial experience with an experimental spectral photon-counting computed tomography system . Nucl Instrum Methods Phys Res A 2017. ; 873 : 27 – 35 . [Google Scholar]
- 18. Boccalini S , Si-Mohamed S . Spectral photon counting CT: not just a pimped-up new version of dual-energy CT . Diagn Interv Imaging 2023. ; 104 ( 2 ): 51 – 52 . [DOI] [PubMed] [Google Scholar]
- 19. van der Werf NR , Si-Mohamed S , Rodesch PA , et al . Coronary calcium scoring potential of large field-of-view spectral photon-counting CT: a phantom study . Eur Radiol 2022. ; 32 ( 1 ): 152 – 162 . [DOI] [PMC free article] [PubMed] [Google Scholar]
- 20. van der Werf NR , Rodesch PA , Si-Mohamed S , et al . Improved coronary calcium detection and quantification with low-dose full field-of-view photon-counting CT: a phantom study . Eur Radiol 2022. ; 32 ( 5 ): 3447 – 3457 . [DOI] [PubMed] [Google Scholar]
- 21. Sandstedt M , Marsh J Jr , Rajendran K , et al . Improved coronary calcification quantification using photon-counting-detector CT: an ex vivo study in cadaveric specimens . Eur Radiol 2021. ; 31 ( 9 ): 6621 – 6630 . [DOI] [PMC free article] [PubMed] [Google Scholar]
- 22. Eberhard M , Mergen V , Higashigaito K , et al . Coronary calcium scoring with first generation dual-source photon-counting CT—first evidence from phantom and in-vivo scans . Diagnostics (Basel) 2021. ; 11 ( 9 ): 1708 . [DOI] [PMC free article] [PubMed] [Google Scholar]
- 23. Mangold S , Cannaó PM , Schoepf UJ , et al . Impact of an advanced image-based monoenergetic reconstruction algorithm on coronary stent visualization using third generation dual-source dual-energy CT: a phantom study . Eur Radiol 2016. ; 26 ( 6 ): 1871 – 1878 . [DOI] [PubMed] [Google Scholar]
- 24. van der Werf NR , van Gent M , Booij R , et al . Dose reduction in coronary artery calcium scoring using mono-energetic images from reduced tube voltage dual-source photon-counting CT data: a dynamic phantom study . Diagnostics (Basel) 2021. ; 11 ( 12 ): 2192 . [DOI] [PMC free article] [PubMed] [Google Scholar]
- 25. Symons R , Sandfort V , Mallek M , Ulzheimer S , Pourmorteza A . Coronary artery calcium scoring with photon-counting CT: first in vivo human experience . Int J Cardiovasc Imaging 2019. ; 35 ( 4 ): 733 – 739 . [DOI] [PubMed] [Google Scholar]
- 26. Symons R , De Bruecker Y , Roosen J , et al . Quarter-millimeter spectral coronary stent imaging with photon-counting CT: initial experience . J Cardiovasc Comput Tomogr 2018. ; 12 ( 6 ): 509 – 515 . [DOI] [PubMed] [Google Scholar]
- 27. Sigovan M , Si-Mohamed S , Bar-Ness D , et al . Feasibility of improving vascular imaging in the presence of metallic stents using spectral photon counting CT and K-edge imaging . Sci Rep 2019. ; 9 ( 1 ): 19850 . [DOI] [PMC free article] [PubMed] [Google Scholar]
- 28. Bratke G , Hickethier T , Bar-Ness D , et al . Spectral photon-counting computed tomography for coronary stent imaging: evaluation of the potential clinical impact for the delineation of in-stent restenosis . Invest Radiol 2020. ; 55 ( 2 ): 61 – 67 . [DOI] [PubMed] [Google Scholar]
- 29. Mannil M , Hickethier T , von Spiczak J , et al . Photon-counting CT: high-resolution imaging of coronary stents . Invest Radiol 2018. ; 53 ( 3 ): 143 – 149 . [DOI] [PubMed] [Google Scholar]
- 30. Petritsch B , Petri N , Weng AM , et al . Photon-counting computed tomography for coronary stent imaging: in vitro evaluation of 28 coronary stents . Invest Radiol 2021. ; 56 ( 10 ): 653 – 660 . [DOI] [PubMed] [Google Scholar]
- 31. Knuuti J , Wijns W , Saraste A , et al. ; ESC Scientific Document Group . 2019 ESC guidelines for the diagnosis and management of chronic coronary syndromes . Eur Heart J 2020. ; 41 ( 3 ): 407 – 477 . [DOI] [PubMed] [Google Scholar]
- 32. Gulati M , Levy PD , Mukherjee D , et al. ; Writing Committee Members . 2021 AHA/ACC/ASE/CHEST/SAEM/SCCT/SCMR guideline for the evaluation and diagnosis of chest pain: a report of the American College of Cardiology/American Heart Association Joint Committee on Clinical Practice Guidelines . J Am Coll Cardiol 2021. ; 78 ( 22 ): e187 – e285 . [DOI] [PubMed] [Google Scholar]
- 33. Collet JP , Thiele H , Barbato E , et al. ; ESC Scientific Document Group . 2020 ESC guidelines for the management of acute coronary syndromes in patients presenting without persistent ST-segment elevation . Eur Heart J 2021. ; 42 ( 14 ): 1289 – 1367 . [DOI] [PubMed] [Google Scholar]
- 34. Boussel L , Coulon P , Thran A , et al . Photon counting spectral CT component analysis of coronary artery atherosclerotic plaque samples . Br J Radiol 2014. ; 87 ( 1040 ): 20130798 . [DOI] [PMC free article] [PubMed] [Google Scholar]
- 35. Mergen V , Eberhard M , Manka R , Euler A , Alkadhi H . First in-human quantitative plaque characterization with ultra-high resolution coronary photon-counting CT angiography . Front Cardiovasc Med 2022. ; 9 : 981012 . [DOI] [PMC free article] [PubMed] [Google Scholar]
- 36. Si-Mohamed SA , Sigovan M , Hsu JC , et al . In vivo molecular K-edge imaging of atherosclerotic plaque using photon-counting CT . Radiology 2021. ; 300 ( 1 ): 98 – 107 . [DOI] [PMC free article] [PubMed] [Google Scholar]
- 37. Cormode DP , Roessl E , Thran A , et al . Atherosclerotic plaque composition: analysis with multicolor CT and targeted gold nanoparticles . Radiology 2010. ; 256 ( 3 ): 774 – 782 . [DOI] [PMC free article] [PubMed] [Google Scholar]
- 38. Halttunen N , Lerouge F , Chaput F , et al . Hybrid nano-GdF3 contrast media allows pre-clinical in vivo element-specific K-edge imaging and quantification . Sci Rep 2019. ; 9 ( 1 ): 12090 . [DOI] [PMC free article] [PubMed] [Google Scholar]
- 39. Boccalini S , Dessouky R , Rodesch PA , et al . Gadolinium K-edge angiography with a spectral photon counting CT in atherosclerotic rabbits . Diagn Interv Imaging 2023. . 10.1016/j.diii.2023.05.002. Published online May 27, 2023 [DOI] [PubMed] [Google Scholar]
- 40. Higashigaito K , Mergen V , Eberhard M , et al . CT angiography of the aorta using photon-counting detector CT with reduced contrast media volume . Radiol Cardiothorac Imaging 2023. ; 5 ( 1 ): e220140 . [DOI] [PMC free article] [PubMed] [Google Scholar]
- 41. Yuan R , Shuman WP , Earls JP , et al . Reduced iodine load at CT pulmonary angiography with dual-energy monochromatic imaging: comparison with standard CT pulmonary angiography—a prospective randomized trial . Radiology 2012. ; 262 ( 1 ): 290 – 297 . [DOI] [PubMed] [Google Scholar]
- 42. Allmendinger T , Nowak T , Flohr T , et al . Photon-counting detector CT-based vascular calcium removal algorithm: assessment using a cardiac motion phantom . Invest Radiol 2022. ; 57 ( 6 ): 399 – 405 . [DOI] [PMC free article] [PubMed] [Google Scholar]
- 43. Euler A , Higashigaito K , Mergen V , et al . High-pitch photon-counting detector computed tomography angiography of the aorta: intraindividual comparison to energy-integrating detector computed tomography at equal radiation dose . Invest Radiol 2022. ; 57 ( 2 ): 115 – 121 . [DOI] [PubMed] [Google Scholar]
- 44. Boccalini S , Swart LE , Bekkers JA , et al . CT angiography for depiction of complications after the Bentall procedure . Br J Radiol 2019. ; 92 ( 1093 ): 20180226 . [DOI] [PMC free article] [PubMed] [Google Scholar]
- 45. Decker JA , Huber A , Senel F , et al . Anemia detection by hemoglobin quantification on contrast-enhanced photon-counting CT data sets . Radiology 2022. ; 305 ( 3 ): 650 – 652 . [DOI] [PubMed] [Google Scholar]
- 46. Decker JA , Bette S , Scheurig-Muenkler C , et al . Virtual non-contrast reconstructions of photon-counting detector CT angiography datasets as substitutes for true non-contrast acquisitions in patients after EVAR—performance of a novel calcium-preserving reconstruction algorithm . Diagnostics (Basel) 2022. ; 12 ( 3 ): 558 . [DOI] [PMC free article] [PubMed] [Google Scholar]
- 47. Emrich T , Aquino G , Schoepf UJ , et al . Coronary computed tomography angiography-based calcium scoring: in vitro and in vivo validation of a novel virtual noniodine reconstruction algorithm on a clinical, first-generation dual-source photon counting-detector system . Invest Radiol 2022. ; 57 ( 8 ): 536 – 543 . [DOI] [PubMed] [Google Scholar]
- 48. Si-Mohamed SA , Miailhes J , Rodesch PA , et al . Spectral photon-counting CT technology in chest imaging . J Clin Med 2021. ; 10 ( 24 ): 5757 . [DOI] [PMC free article] [PubMed] [Google Scholar]
- 49. Bartlett DJ , Koo CW , Bartholmai BJ , et al . High-resolution chest computed tomography imaging of the lungs: impact of 1024 matrix reconstruction and photon-counting detector computed tomography . Invest Radiol 2019. ; 54 ( 3 ): 129 – 137 . [DOI] [PMC free article] [PubMed] [Google Scholar]
- 50. Leng S , Bruesewitz M , Tao S , et al . Photon-counting detector CT: system design and clinical applications of an emerging technology . RadioGraphics 2019. ; 39 ( 3 ): 729 – 743 . [DOI] [PMC free article] [PubMed] [Google Scholar]
- 51. Symons R , Pourmorteza A , Sandfort V , et al . Feasibility of dose-reduced chest CT with photon-counting detectors: initial results in humans . Radiology 2017. ; 285 ( 3 ): 980 – 989 . [DOI] [PMC free article] [PubMed] [Google Scholar]
- 52. Sotoudeh-Paima S , Segars WP , Samei E , Abadi E . Photon-counting CT versus conventional CT for COPD quantifications: intra-scanner optimization and inter-scanner assessments using virtual imaging trials . Proc SPIE Int Soc Opt Eng 2022. ; 12031 : 120312I . [DOI] [PMC free article] [PubMed] [Google Scholar]
- 53. Zhou W , Montoya J , Gutjahr R , et al . Lung nodule volume quantification and shape differentiation with an ultra-high resolution technique on a photon-counting detector computed tomography system . J Med Imaging (Bellingham) 2017. ; 4 ( 4 ): 043502 . [DOI] [PMC free article] [PubMed] [Google Scholar]
- 54. Zhou W , Montoya J , Gutjahr R , et al . Lung nodule volume quantification and shape differentiation with an ultra-high resolution technique on a photon counting detector CT system . In: Flohr TG , Lo JY , Gilat Schmidt T , eds. Proceedings Volume 10132, Medical Imaging 2017: Physics of Medical Imaging . SPIE; , 2017. ; 101323Q . [DOI] [PMC free article] [PubMed] [Google Scholar]
- 55. Si-Mohamed SA , Greffier J , Miailhes J , et al . Comparison of image quality between spectral photon-counting CT and dual-layer CT for the evaluation of lung nodules: a phantom study . Eur Radiol 2022. ; 32 ( 1 ): 524 – 532 . [DOI] [PubMed] [Google Scholar]
- 56. Kopp FK , Daerr H , Si-Mohamed S , et al . Evaluation of a preclinical photon-counting CT prototype for pulmonary imaging . Sci Rep 2018. ; 8 ( 1 ): 17386 . [DOI] [PMC free article] [PubMed] [Google Scholar]
- 57. MacMahon H , Naidich DP , Goo JM , et al . Guidelines for management of incidental pulmonary nodules detected on CT images: from the Fleischner Society 2017 . Radiology 2017. ; 284 ( 1 ): 228 – 243 . [DOI] [PubMed] [Google Scholar]
- 58. Symons R , Cork T , Folio L , Bluemke D , Pourmorteza A . WE-FG-207B-07: feasibility of low dose lung cancer screening with a whole-body photon counting CT: first human results . Med Phys 2016. ; 43 ( 6Part42 ): 3835 . [Google Scholar]
- 59. Inoue A , Johnson TF , White D , et al . Estimating the clinical impact of photon-counting-detector CT in diagnosing usual interstitial pneumonia . Invest Radiol 2022. ; 57 ( 11 ): 734 – 741 . [DOI] [PubMed] [Google Scholar]
- 60. Prayer F , Kienast P , Strassl A , et al . Detection of post-COVID-19 lung abnormalities: photon-counting CT versus same-day energy-integrating detector CT . Radiology 2023. ; 307 ( 1 ): e222087 . [DOI] [PMC free article] [PubMed] [Google Scholar]
- 61. Ferda J , Vendiš T , Flohr T , et al . Computed tomography with a full FOV photon-counting detector in a clinical setting, the first experience . Eur J Radiol 2021. ; 137 : 109614 . [DOI] [PubMed] [Google Scholar]
- 62. Jungblut L , Euler A , von Spiczak J , et al . Potential of photon-counting detector CT for radiation dose reduction for the assessment of interstitial lung disease in patients with systemic sclerosis . Invest Radiol 2022. ; 57 ( 12 ): 773 – 779 . [DOI] [PMC free article] [PubMed] [Google Scholar]
- 63. Li K , Li Y , Qi Z , Garrett JW , Grist TM , Chen GH . Quantitative lung perfusion blood volume using dual energy CT-based effective atomic number (Zeff) imaging . Med Phys 2021. ; 48 ( 11 ): 6658 – 6672 . [DOI] [PMC free article] [PubMed] [Google Scholar]
- 64. Masy M , Giordano J , Petyt G , et al . Dual-energy CT (DECT) lung perfusion in pulmonary hypertension: concordance rate with V/Q scintigraphy in diagnosing chronic thromboembolic pulmonary hypertension (CTEPH) . Eur Radiol 2018. ; 28 ( 12 ): 5100 – 5110 . [DOI] [PubMed] [Google Scholar]
- 65. Si-Mohamed S , Moreau-Triby C , Tylski P , et al . Head-to-head comparison of lung perfusion with dual-energy CT and SPECT-CT . Diagn Interv Imaging 2020. ; 101 ( 5 ): 299 – 310 . [DOI] [PubMed] [Google Scholar]
- 66. Jungblut L , Sartoretti T , Kronenberg D , et al . Performance of virtual non-contrast images generated on clinical photon-counting detector CT for emphysema quantification: proof of concept . Br J Radiol 2022. ; 95 ( 1135 ): 20211367 . [DOI] [PMC free article] [PubMed] [Google Scholar]
- 67. Cuccione E , Chhour P , Si-Mohamed S , et al . Multicolor spectral photon counting CT monitors and quantifies therapeutic cells and their encapsulating scaffold in a model of brain damage . Nanotheranostics 2020. ; 4 ( 3 ): 129 – 141 . [DOI] [PMC free article] [PubMed] [Google Scholar]
- 68. Cormode DP , Si-Mohamed S , Bar-Ness D , et al . Multicolor spectral photon-counting computed tomography: in vivo dual contrast imaging with a high count rate scanner . Sci Rep 2017. ; 7 ( 1 ): 4784 . [DOI] [PMC free article] [PubMed] [Google Scholar]
- 69. Baffour FI , Rajendran K , Glazebrook KN , et al . Ultra-high-resolution imaging of the shoulder and pelvis using photon-counting-detector CT: a feasibility study in patients . Eur Radiol 2022. ; 32 ( 10 ): 7079 – 7086 . [DOI] [PMC free article] [PubMed] [Google Scholar]
- 70. Booij R , Kämmerling NF , Oei EHG , Persson A , Tesselaar E . Assessment of visibility of bone structures in the wrist using normal and half of the radiation dose with photon-counting detector CT . Eur J Radiol 2023. ; 159 : 110662 . [DOI] [PubMed] [Google Scholar]
- 71. Rajendran K , Baffour F , Powell G , et al . Improved visualization of the wrist at lower radiation dose with photon-counting-detector CT . Skeletal Radiol 2023. ; 52 ( 1 ): 23 – 29 . [DOI] [PubMed] [Google Scholar]
- 72. Baffour FI , Glazebrook KN , Ferrero A , et al . Photon-counting detector CT for musculoskeletal imaging: a clinical perspective . AJR Am J Roentgenol 2023. ; 220 ( 4 ): 551 – 560 . [DOI] [PubMed] [Google Scholar]
- 73. Klintström B , Henriksson L , Moreno R , et al . Photon-counting detector CT and energy-integrating detector CT for trabecular bone microstructure analysis of cubic specimens from human radius . Eur Radiol Exp 2022. ; 6 ( 1 ): 31 . [DOI] [PMC free article] [PubMed] [Google Scholar]
- 74. Mikolajewicz N , Bishop N , Burghardt AJ , et al . HR-pQCT measures of bone microarchitecture predict fracture: systematic review and meta-analysis . J Bone Miner Res 2020. ; 35 ( 3 ): 446 – 459 . [DOI] [PubMed] [Google Scholar]
- 75. van den Bergh JP , Szulc P , Cheung AM , Bouxsein M , Engelke K , Chapurlat R . The clinical application of high-resolution peripheral computed tomography (HR-pQCT) in adults: state of the art and future directions . Osteoporos Int 2021. ; 32 ( 8 ): 1465 – 1485 . [DOI] [PMC free article] [PubMed] [Google Scholar]
- 76. Baffour FI , Huber NR , Ferrero A , et al . Photon-counting detector CT with deep learning noise reduction to detect multiple myeloma . Radiology 2023. ; 306 ( 1 ): 229 – 236 . [DOI] [PMC free article] [PubMed] [Google Scholar]
- 77. Schwartz FR , Vinson EN , Spritzer CE , et al . Prospective multireader evaluation of photon-counting CT for multiple myeloma screening . Radiol Imaging Cancer 2022. ; 4 ( 6 ): e220073 . [DOI] [PMC free article] [PubMed] [Google Scholar]
- 78. Wehrse E , Sawall S , Klein L , et al . Potential of ultra-high-resolution photon-counting CT of bone metastases: initial experiences in breast cancer patients . NPJ Breast Cancer 2021. ; 7 ( 1 ): 3 . [DOI] [PMC free article] [PubMed] [Google Scholar]
- 79. Chappard C , Abascal J , Olivier C , et al . Virtual monoenergetic images from photon-counting spectral computed tomography to assess knee osteoarthritis . Eur Radiol Exp 2022. ; 6 ( 1 ): 10 . [DOI] [PMC free article] [PubMed] [Google Scholar]
- 80. Benson JC , Rajendran K , Lane JI , et al . A new frontier in temporal bone imaging: photon-counting detector CT demonstrates superior visualization of critical anatomic structures at reduced radiation dose . AJNR Am J Neuroradiol 2022. ; 43 ( 4 ): 579 – 584 . [DOI] [PMC free article] [PubMed] [Google Scholar]
- 81. Rajendran K , Voss BA , Zhou W , et al . Dose Reduction for sinus and temporal bone imaging using photon-counting detector CT with an additional tin filter . Invest Radiol 2020. ; 55 ( 2 ): 91 – 100 . [DOI] [PMC free article] [PubMed] [Google Scholar]
- 82. Hagen F , Hofmann J , Wrazidlo R , et al . Image quality and dose exposure of contrast-enhanced abdominal CT on a 1st generation clinical dual-source photon-counting detector CT in obese patients vs. a 2nd generation dual-source dual energy integrating detector CT . Eur J Radiol 2022. ; 151 : 110325 . [DOI] [PubMed] [Google Scholar]
- 83. Kim J , Bar-Ness D , Si-Mohamed S , et al . Assessment of candidate elements for development of spectral photon-counting CT specific contrast agents . Sci Rep 2018. ; 8 ( 1 ): 12119 . [DOI] [PMC free article] [PubMed] [Google Scholar]
- 84. Symons R , Krauss B , Sahbaee P , et al . Photon-counting CT for simultaneous imaging of multiple contrast agents in the abdomen: an in vivo study . Med Phys 2017. ; 44 ( 10 ): 5120 – 5127 . [DOI] [PMC free article] [PubMed] [Google Scholar]
- 85. Si-Mohamed S , Thivolet A , Bonnot PE , et al . Improved peritoneal cavity and abdominal organ imaging using a biphasic contrast agent protocol and spectral photon counting computed tomography K-edge imaging . Invest Radiol 2018. ; 53 ( 10 ): 629 – 639 . [DOI] [PMC free article] [PubMed] [Google Scholar]
- 86. McDonald RJ , McDonald JS , Kallmes DF , et al . Intracranial gadolinium deposition after contrast-enhanced MR imaging . Radiology 2015. ; 275 ( 3 ): 772 – 782 . [DOI] [PubMed] [Google Scholar]
- 87. Lambert JW , Sun Y , Stillson C , et al . An intravascular tantalum oxide-based CT contrast agent: preclinical evaluation emulating overweight and obese patient size . Radiology 2018. ; 289 ( 1 ): 103 – 110 . [DOI] [PMC free article] [PubMed] [Google Scholar]
- 88. Si-Mohamed S , Cormode DP , Bar-Ness D , et al . Evaluation of spectral photon counting computed tomography K-edge imaging for determination of gold nanoparticle biodistribution in vivo . Nanoscale 2017. ; 9 ( 46 ): 18246 – 18257 . [DOI] [PMC free article] [PubMed] [Google Scholar]
- 89. Moghiseh M , Lowe C , Lewis JG , et al . Spectral photon-counting molecular imaging for quantification of monoclonal antibody-conjugated gold nanoparticles targeted to lymphoma and breast cancer: an in vitro study . Contrast Media Mol Imaging 2018. ; 2018 : 2136840 . [DOI] [PMC free article] [PubMed] [Google Scholar]
- 90. Pan D , Roessl E , Schlomka JP , et al . Computed tomography in color: NanoK-enhanced spectral CT molecular imaging . Angew Chem Int Ed Engl 2010. ; 49 ( 50 ): 9635 – 9639 . [DOI] [PMC free article] [PubMed] [Google Scholar]
- 91. Bagley AF , Ludmir EB , Maitra A , et al . NBTXR3, a first-in-class radioenhancer for pancreatic ductal adenocarcinoma: report of first patient experience . Clin Transl Radiat Oncol 2022. ; 33 : 66 – 69 . [DOI] [PMC free article] [PubMed] [Google Scholar]
- 92. Grönberg F , Yin Z , Maltz J , Pelc NJ , Persson M . The effects of intra-detector Compton scatter on zero-frequency DQE for photon-counting CT using edge-on-irradiated silicon detectors . arXiv 2206.04164 [preprint] https://arxiv.org/abs/2206.04164. Posted June 8, 2022. Accessed January 2023 . [DOI] [PubMed] [Google Scholar]
- 93. Steadman R , Herrmann C , Livne A . ChromAIX2: a large area, high count-rate energy-resolving photon counting ASIC for a spectral CT prototype . Nucl Instrum Methods Phys Res A 2017. ; 862 : 18 – 24 . [Google Scholar]
- 94. Zhan X , Zhang R , Niu X , et al . Comprehensive evaluations of a prototype full field-of-view photon counting CT system through phantom studies . arXiv 2212.13337 [preprint] https://arxiv.org/abs/2212.13337. Posted December 27, 2022. Accessed January 2023 . [DOI] [PubMed] [Google Scholar]
- 95. Lee CL , Park J , Nam S , et al . Metal artifact reduction and tumor detection using photon-counting multi-energy computed tomography . PLoS One 2021. ; 16 ( 3 ): e0247355 . [DOI] [PMC free article] [PubMed] [Google Scholar]
- 96. MARS for clinicians . MARS Bioimaging Limited 2020 . https://www.marsbioimaging.com. Updated March 28, 2021. Accessed January 16, 2023 .
- 97. Pourmorteza A , Symons R , Sandfort V , et al . Abdominal imaging with contrast-enhanced photon-counting CT: first human experience . Radiology 2016. ; 279 ( 1 ): 239 – 245 . [DOI] [PMC free article] [PubMed] [Google Scholar]
- 98. Thivolet A , Si-Mohamed S , Bonnot PE , et al . Spectral photon-counting CT imaging of colorectal peritoneal metastases: initial experience in rats . Sci Rep 2020. ; 10 ( 1 ): 13394 . [DOI] [PMC free article] [PubMed] [Google Scholar]
- 99. Si-Mohamed S , Tatard-Leitman V , Laugerette A , et al . Spectral photon-counting computed tomography (SPCCT): in-vivo single-acquisition multi-phase liver imaging with a dual contrast agent protocol . Sci Rep 2019. ; 9 ( 1 ): 8458 . [DOI] [PMC free article] [PubMed] [Google Scholar]
- 100. Ostadhossein F , Moitra P , Gunaseelan N , et al . Hitchhiking probiotic vectors to deliver ultra-small hafnia nanoparticles for ‘color’ gastrointestinal tract photon counting x-ray imaging . Nanoscale Horiz 2022. ; 7 ( 5 ): 533 – 542 . [DOI] [PubMed] [Google Scholar]
- 101. Zhang C , Zhou L , Zhang J , Dai R , Zhuang P , Ye Z . One-pot synthesis of flower-like Bi2S3 nanoparticles for spectral CT imaging and photothermal therapy in vivo . New J Chem 2022. ; 46 ( 21 ): 10458 – 10469 . [Google Scholar]