

Abstract
Severe spinal cord injury (SCI) affects the ability of functional standing and walking. As the locomotor central pattern generator (CPG) in the lumbosacral spinal cord can generate a regulatory signal for movement, it is feasible to activate CPG neural network using intra-spinal micro-stimulation (ISMS) to induce alternating patterns. The present study identified two special sites with the ability to activate the CPG neural network that are symmetrical about the posterior median sulcus in the lumbosacral spinal cord by ISMS in adult rats. A reversal of flexion and extension can occur in an attempt to generate a stepping movement of the bilateral hindlimb by either reversing the pulse polarity of the stimulus or changing the special site. Therefore, locomotor-like activity can be restored with monopolar intraspinal electrical stimulation on either special site. To verify the motor function regeneration of the paralyzed hindlimbs, a four-week locomotor training with ISMS applied to the special site in the SCI + ISMS group (n=12) was performed. Evaluations of motor function recovery using behavior, kinematics and physiological analyses, were used to assess hindlimb function and the results showed the stimulation at one special site can promote significant functional recovery of the bilateral hindlimbs (P<0.05). The present study suggested that motor function of paralyzed bilateral hindlimbs can be restored with monopolar ISMS.
Keywords: spinal cord injury, central pattern generator, neuro-modulation, intra-spinal micro-stimulation, motor function recovery
Introduction
Restoring the motor function of the paralyzed limbs has always been an important aim of neuroscience research. Motor dysfunction of the limbs and the trunk below an injured segment after spinal cord injury (SCI) caused by falling from high altitude, traffic accidents and disease (1), severely affects the quality of life of individuals (2).
Spinal neural networks serve an important role in the execution of locomotion (3). Grill (4) pursued an approach to activate spinal neural networks: Restoration of function by electrical activation of higher-order interneurons directly instead of using synaptic activation of spinal neurons indirectly. These networks of spinal neurons, known as spinal locomotor central pattern generators (CPGs), are normally modulated by supraspinal and peripheral inputs, but retain the intrinsic ability to regulate the rhythmical and reciprocal activation pattern of hindlimb muscles after SCI, even in the absence of supraspinal and/or afferent input (5,6). Thus, the locomotor CPG is a dedicated neural network that generates regulatory signals for movements and contains signals that activate different motor neurons in the appropriate sequence and intensity to generate motor patterns (7-10). The coordination and control of damaged muscles can be effectively restored by electrical stimulation of the CPG. Thus, intraspinal microstimulation (ISMS), known as an electrical stimulation therapy for motor function recovery consisting of stimulation through fine, hair-like microwires targeted at the ventral horn of the lumbosacral enlargement, has been proved effective for restoring standing and walking following SCI (11-13). The implantation of intraspinal microwires and chronic applications of ISMS is generally well tolerated by spinal cord tissue (14). The mechanisms of action of ISMS and the clinical application prospect of ISMS have been widely discussed (15,16). Focal ISMS has been observed to activate sets of interneurons that projected to, and activated, motor neuron pools to generate synergistic motion (17-19). Gaunt et al (20) found that ISMS at a single point in the grey matter of the spinal cord could activate afferent terminals along the entire length of the lumbosacral enlargement. By activating the neural networks within the lumbosacral spinal cord, ISMS can generate inherently synergistic movements that are weight-bearing and fatigue-resistant (21,22). Through targeted activation of hindlimb locomotor-related networks, ISMS has been used to restore walking in SCI cats (23). Accurate and robust control of the multi-joint movement can be achieved by focally stimulating the target muscle motor pools within the spinal cord (24). Holinski et al (25) developed a feedback-driven ISMS system to enhance the functionality of stepping by reducing muscle fatigue and to produce synergistic movements by activating neural networks in the spinal cord. A fully intradural intraspinal microstimulation implant based on wireless floating microelectrode arrays has been exploited and the long-term stability of the implant in the spinal cord assessed (26). Barthélemy et al (27) focused on the use of the same polarity of the pulse for scanning stimulation of various loci of the spinal cord and described the distribution of various types of hindlimb responses evoked by ISMS in spinal cats. However, they did not consider the effect of the pulse polarity of the stimulus on the movement patterns of the bilateral hindlimbs. If different movement patterns can be induced by changing the polarity of the stimulation signal, then combinations of movement patterns can be generated by editing the positive and negative pulse signals to achieve a reduction both the number of stimulation electrodes and secondary injury to the spinal cord.
The present study aimed to investigate the effects of the different pulse polarity of stimulus on the movement patterns of the bilateral hindlimbs when applied to the same site and further developed a gait function reconstruction training with a single site stimulation strategy. It also conducted a 4-week evaluation of the effects of a single site stimulation training protocol.
Materials and methods
Experimental animals. All rats were purchased from Laboratory Animal Center, Nantong University School of Medicine (Nantong, China). Rats were kept in a temperature- and humidity-controlled environment with a 12:12-h light-dark cycle and allowed free access to food and water. The housing conditions adhered to specific requirements, including a temperature range of 18-26˚C and relative humidity of 40-70%. Typically, the rat housing temperature was 1-2˚C warmer than the ambient temperature, while the humidity was 5-10% higher. The noise level did not exceed 85 decibels, and the concentration of ammonia was <20 ppm. The lab was kept dry and ventilated. A total of 60 Sprague Dawley rats (age, 10 weeks; weight, 220-280 g) that provided valid experimental data were used. They were randomly divided into four experimental groups: Intact group (n=6; 3 males; 3 females), test group (n=30; 15 males, 15 females; exploration of the location of those special sites with the ability to activate the CPG neural network and appropriate stimulus parameters, not used for comparison), SCI group (n=12; 6 males, 6 females incomplete SCI due to weight impact) and SCI + ISMS (n=12; 6 males, 6 females; incomplete SCI followed by ISMS training: 20 min/day, 5 days/week, 4 weeks;). At the end of all experiments, 62 rats were sacrificed, including two rats in the SCI + ISMS group that were excluded from the present study due to electrode detachment problems.
Determination of the location of special sites in the spinal cord
All survival surgical procedures were performed under aseptic conditions. The animal's body temperature and respiratory rate were monitored simultaneously. The operating table was kept at a constant temperature of 37˚C to maintain the physiologic body temperature of the rats. A total of 30 rats in the test group were anesthetized with an intraperitoneal injection of sodium pentobarbital (30 mg/kg) (28). A midline incision was made over the skin in the back, exposing the thoracic vertebra (VT)9 and VT12-lumbar vertebra (VL1). The L1-L5 spinal segments (VT12-VL1 vertebral segments) were identified and the skin was cut along the direction of the spine. The corresponding segments of the spinal cord and vertebrae are shown in Fig. 1A. The lamina surface muscles were removed by a hemostat to expose the lamina. The length of each vertebra segment which was denoted as Si(i=1,2,3) and the transverse diameter of the spinal lumbar enlargement (L2 spinal segment) which was denoted as D were measured. The locations of the motor function points in the lumbosacral spinal cord are described as the positions in the corresponding vertebral segment, denoted as x, y and z. The intersection of the posterior median sulcus of the spinal cord and the cephalic side of the spinal segment was taken as the coordinate origin (29). The mediolateral direction X, dorsoventral direction Y, and rostrocaudal direction Z were normalized by
Figure 1.

Experimental design and timeline. (A) The corresponding segments of the spinal cord and vertebrae. The length of each vertebra segment (VT12, VT13, VT 1) was denoted as Si(i=1,2,3). (B) A schematic of preparing the contusion model. (C) Implanted electrodes at the special site right of the midline in the SCI + ISMS group three days before the training. (D) A constant alternating positive and negative pulse was delivered to the special site right of the midline in the SCI + ISMS group for four weeks. During the ISMS training, (E) the Basso-Beattie-Bresnahan scale, (F) grip strength, (G) detailed kinematics and EMG and (H) somatosensory-evoked potentials analyses were used to assess the recovery of motor function. Color markers were attached bilaterally to bony landmarks at the iliac crest (green), hip (green), knee (yellow), ankle (red) and fifth metatarsal (red) to collect the hindlimb movements. VT, thoracic vertebra; VT, lumbar vertebra; SCI, spinal cord injury; ISMS, intra-spinal micro-stimulation; EMG, electromyography.
ISMS using a stimulus isolator (ISO-Flex; A.M.P.I.) was applied to the spinal cord with a PFA-Coated Tungsten Wire (A-M Systems, LLC) electrode except for the tip and the electrode that served as a reference in the electrical stimulation, which was inserted into the adjacent muscle. The stimulation was applied to one point at a time in different parts of the L1-L5 spinal cord segments and from the midline to 2.5 or 3 mm on either side. The electrode was held in a microdrive and was mounted on a stereotaxic manipulandum with X and Z coordinates. Stimulation was performed on the mediolateral displacements (where 0 was on the midline) along the X axis at intervals of 200 µm and dorsoventral (where 0 was on the dorsal surface) along the Z axis at intervals of 500 µm. Stimulation tracks went from the dorsal surface to 1.8-2.1 mm deep in 300 µm intervals along the Y axis. Two patterns of movement were defined here: Pattern 1, left hindlimb extension and right hindlimb flexion; pattern 2, left hindlimb flexion and right hindlimb extension (The combination of the two patterns can realize a complete gait cycle movement.) A constant pulse of positive or negative currents (200 µs pulse width, 33 Hz frequency) was delivered. Only when the reversal of the pulse polarity of the stimulus was performed and the two patterns switched, can the point be confirmed as a special site. The duration of the entire surgery was 2-3 h. At the end of the surgery, euthanasia was performed by intraperitoneal injection of sodium pentobarbital (150 mg/kg) to reduce the pain of the animal. At five minutes after the administration of anesthesia, the rats' pupils were observed with a flashlight, and the absence of a constriction response was an indication that the animal had succumbed. To confirm that the rats were deceased, professionals were consulted to ensure compliance with ethical and standard procedures.
Efficacy evaluation of special sites activation with ISMS after SCI
Preparation of SCI model. To establish an incomplete SCI model, laminectomy was performed at the selected level (VT9). The vertebra was stabilized using a clamp system and an impactor (MASCIS Impactor Model-III; W.M. Keck Center for Collaborative Neuroscience, The State University of New Jersey, Piscataway, NJ, USA) was used to apply injury of desired severity. In the experiment, injury of moderate severity was applied by using the stimulus parameters described below. The diameter of the impact head was 2.5 mm, the weight 10 g and the height 6.25 mm.
Electrode implantation
Rats in the SCI + ISMS group were implanted with electrodes to chronically record muscle activity [electromyography (EMG)]. Pairs of PFA-Coated Tungsten Wires were sewn into the selected hindlimb muscles [the lateral gastrocnemius (LG) and the tibialis anterior (TA)] for dual electrode recordings. The stimulating electrode was attached to the special point right of the midline in the spinal cord by biocompatible dental cement [Root Canal Fitting Materials MTA; Longly Biotechnology (Wuhan) Co., Ltd.]. One additional wire that served as a reference electrode for use in electrical stimulation was sewn into the adjacent muscle. At the end of the experiment, the muscles and skin were sutured and thoroughly washed with saline. After the surgery, the animal was placed in an insulated incubator until it regained consciousness. The rats were manually urinated and injected with gentamicin sulfate (3 mg/kg) for anti-inflammatory treatment three days after surgery. Careful postoperative care was given for the next four weeks. However, two rats were excluded from this group because their implanted electrodes became dislodged on the first and third days, respectively. The SCI + ISMS group consisted of 12 rats and was euthanized four weeks later via intraperitoneal injection of sodium pentobarbital (150 mg/kg). The method used for verifying mortality is similar to the one aforementioned.
Locomotor training with ISMS
The day after the spinal cord surgery (i.e., post-operative day 1), rats in the SCI + ISMS groups underwent a four-week locomotor training period with ISMS. A constant alternating positive and negative pulse was delivered according to the following pulse train stimulation parameters: 200 µsec pulse width; 33 Hz frequency; 30 msec interval of the pulse of the same polarity; 1.5 sec interval between positive and negative pulse trains and 3 sec duration of stimulation.
Assessment methods
Evaluation of motor function recovery combined behavioral, kinesiological and physiological approaches (Fig. 1). The initial assessment for movement characteristics used the Basso-Beattie-Bresnahan (BBB) scale (30), EMG and kinematics (29) and grip strength (31,32)] to precisely assess hindlimb function rebuilding. Somatosensory-evoked potentials (SEPs) (33-35) were used to detect electrophysiological function for evaluating the recovery of spinal pathways.
BBB locomotor scale
To evaluate the motor function of hindlimbs, a 21-point BBB locomotion scale was used based on the movement of joints and the placement of paws and coordination of forepaw and hindlimbs on days 1, 3, 7, 10, 14, 21 and 28 after surgery.
EMG and kinematic testing procedures
EMG was collected using a Keypoint Portable apparatus (Dantec™ Keypoint® Focus; NEUROLITE AG). The EMG data set was obtained from bilateral recordings in the TA (ankle flexor) and the LG (ankle extensor). TA and LG with the best signal-to-noise ratio were retained for analysis.
Kinematic data were obtained using the Open MV CAM (OpenMV4 CAM H7; OpenMV, LLC) system without electrical stimulation. Color markers were attached bilaterally to bony landmarks at the iliac crest, hip, knee, ankle and fifth metatarsal to collect the hindlimb movements.
Grip strength testing procedures
The grip strength in all groups was determined without electrical stimulation by a grip strength meter (Stoelting Co.). The maximum grip strength was determined as the force recorded just before the rat released the bar. This was repeated three times a day and the maximum value was recorded.
SEPs testing procedures
Electromyograph and evoked potential equipment (Dantec™ Keypoint® Focus; NEUROLITE AG) was used to measure SEPs. The negative electrode of the stimulation electrode was inserted into the common peroneal nerve of the left hind limb of the rat (lateral gastrocnemius muscle) and the positive electrode was inserted ~0.8 cm distal to the negative electrode. Electrical stimulation was conducted at a frequency of 3 Hz, pulse intensity between 2 and 4 mA, a pulse width of 0.1 msec and 200 repetitions. The stimulation intensity was set to make the toes of the bilateral hindlimbs twitch slightly. The stimulation induced electrical activity from the lateral gastrocnemius muscle passing through the peripheral and central nervous system when nerve fiber action potential transmission, until the synaptic potentials. The recording electrode was placed in the sensory cortex of the rat brain and the reference electrode was placed under the mucosa of the hard palate of the rat. The ground electrode was placed between the stimulating electrode and the recording electrode. SEPs collected in the present study were composed of a forward wave (P) and a negative wave (N). The latency and amplitude of SEPs were recorded before the operation and on days 7, 14, 21 and 28 after the operation. Spinal cord conduction capacity (latency) and synchronous discharge quantity (amplitude) of the sensory or motor nervous system can indirectly reflect the recovery ability of motor function after SCI (35).
Statistical analysis
Statistical tests were performed with SPSS 24.0 software (IBM Corp.). To compare the effects of special site stimulation using ISMS on the recovery of hindlimbs movement two-way mixed [group (SCI + ISMS/SCI) x time (days 1, 3, 7, 10, 14, 21 and 28 after surgery)] ANOVA with Bonferroni's multiple comparison adjustment method was performed on BBB locomotor scales following ISMS. Two-way mixed [group (SCI + ISMS/SCI) x time (days 3, 7, 10, 14, 21 and 28 after surgery)] ANOVA with Bonferroni's multiple comparison adjustment methods was performed on grip strength after ISMS. Two-way mixed [group (SCI + ISMS/SCI) x time (days 7, 14, 21 and 28 after surgery)] ANOVA with Bonferroni's multiple comparison adjustment methods was performed on SEPs following ISMS. Two-way mixed [group (SCI + ISMS/SCI) x iEMG data (TA, LG)] ANOVA with Bonferroni's multiple comparison adjustment methods was performed. Paired t-tests were used to assess the activation current threshold of flexion and extension muscles and negative and positive pulses which evoked two movement patterns. Group data in the graphs were the mean ± the standard deviation. Data in Table I are presented as the mean. The collected gait data was processed by processing software (Processing 3.5.3; Processing Foundation) to generate stick diagrams and trajectories.
Table I.
iEMG of the intact, SCI + ISMS and SCI groups of TA and LG of right legs in rats when the negative and positive pulses were applied to the right special site.
| Time | iEMG (mV) | Intact | SCI + ISMS | SCI |
|---|---|---|---|---|
| Day 14 | TA | 7.16 | 1.53b | 1.12b |
| LG | 7.83 | 0.95a,b | 0.31a,b | |
| Day 21 | TA | 7.13 | 3.26a,b | 2.25a,b |
| LG | 7.84 | 4.15a,b | 1.13a,b | |
| Day 28 | TA | 7.17 | 7.13a,b | 5.97a,b |
| LG | 7.81 | 7.72a,b | 6.02a,b |
aIndicates a significant difference between the SCI + ISMS group and the SCI group in the same row. Significant differences in LG were observed between the SCI + ISMS group and the SCI group at 14, 21 and 28 days, while significant differences in TA were also observed between these two groups at 21 and 28 days
bSignificant difference between TA and LG iEMG data from the same column at the same time. As the number of days increased, the iEMG values for TA and LG in the SCI + ISMS/SCI group gradually increased. iEMG. electromyography integration; SCI, spinal cord injury; ISMS, intra-spinal micro-stimulation; TA, the tibialis anterior, ankle flexor; LG, lateral gastrocnemius, ankle extensor.
Results
Special sites in the spinal cord
A total of 30 rats in the test group were used to explore and verify the special sites.
Location of the special sites
Multiple sites were found on each side of the lumbar enlargement on which electrical stimulation evoked alternating activity in groups of flexors and extensors of the bilateral hindlimbs. However, two optimal sites could be identified as special sites, as the movement pattern immediately switched once the pulse polarity of the stimulus was switched. Longitudinal and transverse sections of VT12-VL1 vertebral segments were drawn, with grey dots representing the points of ISMS stimulation, purple dots representing the locations that can evoke alternating left-right movement and red and green dots representing the locations where the special site appeared. The red dot was the optimal site in the left side of the spinal cord and the green dot was the optimal site in the right side of the spinal cord (Fig. 2A and B). The three-dimensional map depicting the location of special sites which could activate movement pattern 1 and pattern 2 of the bilateral hindlimbs was also drawn (Fig. 2C). According to the normalized coordinates of intact rats (Fig. 2D), the special sites were located in the L2 spinal segment and described as the left special site (PL) and the right special site (PR). PR was determined as (X, Y, Z)=(0.377±0.196, 0.619±0.019, 0.780±0.143) and PL was determined as (X, Y, Z)=(-0.385±0.182, 0.638±0.020, 0.779±0.147). Furthermore, when negative pulse was applied to PR, pattern 1 was induced and when the polarity of the stimulus was switched from negative pulse to positive pulse and application continued to the same site, pattern 2 was induced. Therefore, considering the above phenomena and the criteria defined in the methods, PR and PL were identified as optimal sites and the target special sites.
Figure 2.

Assessment of the location of the special sites. (A) Longitudinal view of the spinal cord. The grey spots represented the scanning sites traversed during stimulation. The purple dots and area circled by purple wireframe indicated the area that could induce alternating movement of hindlimbs. The red dot and the green dot indicated the position of special sites. (B) Transverse view of the spinal cord. (C) Three-dimensional coordinate diagram displaying the special sites. The red dot PL represented the special point left of the midline and the green dot PR represented the special point right of the midline. (D) Normalized representation of special coordinates.
Moreover, it was found that the position of the site did not change when electrical stimulation was applied to the special site by the stimulating electrode in the SCI + ISMS groups in the following four weeks after the incomplete SCI caused by weight impact.
Amplitude of stimulus current
The amplitudes of the current used in 30 rats to induce alternation of hindlimbs by stimulating the special site were measured as was the changed current when the polarity of the current was switched to reverse the movement patterns of the bilateral hindlimbs. Paired t-tests were used to assess the activation current threshold of flexor and extensor muscles and negative and positive pulses which evoked two movement patterns (Fig. 3B and D). Fig. 3B depicted the statistical results of the threshold currents for activating the flexor neurons (blue box bubble plot) and extension neurons (purple box bubble plot). Fig. 3D depicted the statistical results of the threshold current for negative pulses (brown box bubble plot) and positive pulses (darker brown box bubble plot) when the movement patterns were switched. The activation threshold current of the flexor was 210±55 µA. The activation threshold current of the extensor was 113±26 µA. The results showed that the activation threshold currents of flexor and extensor muscles were significantly different [t=12.179; P=0.001; 95% confidence interval (CI) 80.66-113.49] through the measurement analysis. There were also significant differences between the negative and positive pulse amplitudes which evoked two movement patterns. The activation threshold current of the negative pulse was -228±44 µA. The activation threshold current of the positive pulse was 282±57 µA. The results showed that the activation threshold currents of evoking two movement patterns induced by negative pulse and positive pulse were significant (t=-26.088; P=0.001; 95% Cl-550.35- -469.81).
Figure 3.
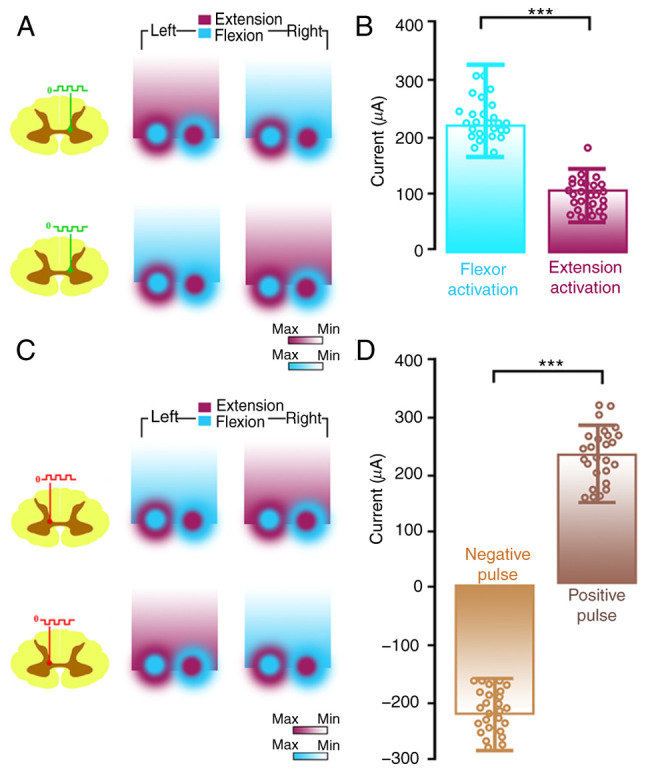
Heat map of flexor and extensor burst and paired t-test of activation current threshold of evoking two movement patterns in thirty rats. (A) The upper left spinal cord stimulation diagram shows the special point right of the midline of negative pulse stimulation, corresponding to the movement of pattern 1 shown in the upper right. The lower left spinal cord stimulation diagram shows the special point right of the midline of positive pulse stimulation, corresponding to the movement of pattern 2 shown in the lower right. Purple represents extensor burst and the color from dark to light indicates the decrease of burst degree. (B) Paired t-test of activation current threshold of flexor and extensor muscles. ***P<0.001 (C) Similar to A, C is the result of stimulating the special point left of the midline with positive and negative pulses. (D) Paired t-test of the threshold current of negative and positive pulses which evoked two movement patterns. ***P<0.001.
Relationship between stimulation signal/site and the bilateral hindlimbs movement patterns
Combined with ISMS, four specific properties were found indicating the relationships between the polarity of stimulus, the special sites and the movement patterns.
First, the coordinates of the two special sites indicated that they were symmetrical on the posterior median sulcus and yet triggered opposite movement patterns in the left and right hindlimbs once the polarity of the stimulus was switched.
Second, there was a reciprocal characteristic between the two symmetrical special sites. That is, when the negative pulse is applied to PL, pattern 2 was induced (Fig. 4A); then when the same pulse polarity of stimulus was applied to PR, pattern 1 is induced (Fig. 4B). When the polarity of the stimulus signal was positive, the movement patterns exchanged correspondingly, as shown in Fig. 4C and F.
Figure 4.

The clear corresponding relations between the polarity of stimulus, the special sites and the movement patterns. Representation of stick diagrams of the hindlimb (left/right) movements in the sagittal section. (A and B) The three-dimensional map depicts the location of special sites which could trigger the switch of two movement patterns of the bilateral hindlimbs. The red dot PL represented the special point left of the midline and the green dot PR represented the special point right of the midline. (C) A negative current was delivered to the special sites. (D) The left figure shows that when the negative pulse of the stimulus was applied to PL, the movement of pattern 2 was induced in the rat. The right figure shows the stick diagram of one step cycle in the left/right hindlimb joint by negative pulse stimulation on PL. (E) The left figure shows that when the negative pulse of the stimulus was applied to PR, the movement of pattern 1 was induced in the rat. The right figure shows the stick diagram of one step cycle in the left/right hindlimb joint by negative pulse stimulation on PR. (F) A positive current was delivered to the special sites. (G) The left figure shows that when the positive pulse of the stimulus was applied to PL, the movement of pattern 1 was induced in the rat. The right figure shows the stick diagram of one step cycle in the left/right hindlimb joint by positive pulse stimulation on PL. (H) The left figure shows that when the positive pulse of the stimulus was applied to PR, the movement of pattern 2 was induced in the rat. The right figure shows the stick diagram of one step cycle in the left/right hindlimb joint by positive pulse stimulation on PR.
Third, there was another reciprocal characteristic of both special sites. When the opposite pulse polarity of the stimulus was applied to the same special site, it induced the opposite movement pattern (Fig. 3A and C). When the negative pulse was applied to PL, pattern 2 was induced (Fig. 4D) and when the reverse polarity was applied to PL, pattern 1 was induced (Fig. 4G). That was the same for PR (Fig. 4E and H).
Fourth, there is a clear and certain relationship between the pulse polarity and the movement patterns of the bilateral hindlimbs. That is, the positive pulse applied to PR/PL faithfully induced the movement of pattern 2/pattern 1. The negative pulse applied to PL/PR faithfully induced the movement of pattern 1/pattern 2. Under these circumstances, gait control can be obtained by applying the relevant pulse polarity of the stimulus to the corresponding special site(PR/PL).
Evaluation of motor function recovery
Rehabilitation training was designed to evaluate the effect of motor function regeneration and a four-week training for rats in the SCI + ISMS group was performed to restore the motor function of the bilateral hindlimbs using ISMS applied to the special site. Alternating positive and negative pulse trains were continuously delivered to the PR during the training sessions using a signal generator to produce the movements of pattern 1 and pattern 2. Meanwhile, the motor speed of the bilateral hindlimbs of rats was artificially controlled by the time interval of the stimulus pulse. Evaluation of motor function recovery combined the BBB scale, EMG and kinematics, grip strength and SEPs (Fig. 5A-E).
Figure 5.

Results of the assessment of motor function after SCI based on BBB scale, EMG, kinematics, grip strength. (A) Effects of ISMS training on SCI rats assessed by BBB scale on days 1, 3, 7, 10, 14, 21 and 28 days after surgery. In each measurement, the simple effect was significant in both groups and became more significant over time (P<0.001). The final recovery effect in the SCI + ISMS was superior to that in the SCI group *P<0.05, vs. group; #P<0.05, vs. previous time point. (B) Time course of grip strength of the SCI + ISMS and SCI groups. *P<0.05, vs. group; #P<0.05, vs. previous time point. (C) Representative illustrations of EMG and kinematic features in the intact group. (D) Representative illustrations of EMG and kinematic features at 14, 21 and 28 days in the intact SCI + ISMS group. (E) Representative illustrations of EMG and kinematic features at 14, 21 and 28 days in the SCI group. The toe trajectories recorded overall session are displayed for different experimental data including during pre-lesion locomotion, illustrating the marked improvement of foot movements. The range of hindlimb joint angles also shows the recovery ability of all groups. SCI, spinal cord injury; BBB, Basso-Beattie-Bresnahan; EMG, electromyography; SEPs, somatosensory-evoked potentials; ISMS, intra-spinal micro-stimulation; TA, the tibialis anterior; LG, lateral gastrocnemius.
BBB locomotor scale
Two-way mixed ANOVA was applied to analyze the effect and interaction of group and time on the BBB locomotor scale, considering a Greenhouse-Geisser correction (data violated the sphericity assumption, with Mauchly's W=0.022 and P<0.001). Significant effects were observed for group (F=32.972; P<0.001; partial η2=0.6), time (F=481.843; P<0.001; partial η2=0.956) and interaction between time and group (F=18.153; P<0.001; partial η2=0.452). In the SCI group, pairwise comparisons of the BBB scale showed significant differences (P<0.001) except for day 1 and day 3 measurements (P=0.071), whereas the BBB scale in the SCI + ISMS group increased significantly (P<0.001). It was observed that two weeks after surgery, animals in the SCI + ISMS group were able to slightly move their hindlimb joints, whereas slight movement of a few joints of the hindlimbs was occasionally seen in the SCI group (Fig. 5A).
EMG and kinematics assessments
To precisely assess the recovery of motor function, the kinematics and EMG characteristics of stepping movements was extensively quantified in the intact, SCI + ISMS and SCI groups (Fig. 5C-E). The red circles showed the movement trajectory of the toes and, as the training time increased, the movement trajectory showed that the gait function of rats in both SCI and SCI + ISMS groups gradually rebuilt. The angles of hindlimb joint and the size of toe endpoint trajectories in the SCI + ISMS group were bigger than those of the rats in the SCI group and after 4 weeks of training, the range of motion was significantly similar to that of the intact rats.
The grey shading in the EMG indicates the presence of complementary phase in the EMG bursts of a pair of flexor and extensor muscles (Fig. 5C-E) and the corresponding EMG integral values are shown in Table I. At 14 days after the injury, rats in the SCI group could only move their hindlimbs slightly and no significant EMG bursts were observed in the antagonistic pair of muscles. By contrast, rats in the SCI + ISMS group showed improved hindlimb joint mobility, with weak bursts of muscle activity. On day 21, all rats in the SCI + ISMS group demonstrated a substantial increase in EMG bursting patterns or tonic activity in their hindlimb muscles and exhibited stepping movements. After four weeks, the EMG activity in the muscles of rats in the SCI + ISMS group was greatly improved compared with the rats in the SCI group. The EMG in rat muscle reached levels similar to those recorded during spontaneous movement in intact rats.
Grip strength assessment
At three days postoperatively, hindlimb grip strength was particularly weak in both the SCI and SCI + ISMS groups, at <0.5 N. At 1-2 weeks postoperatively, there was a significant increase in hindlimb grip strength in the SCI + ISMS group, approaching 10 N, while the hindlimb grip strength in the SCI group improved more slowly. After 4 weeks of training, the maximum hindlimb grip strength of the rats in the SCI + ISMS group was close to 14 N, which was closer to the maximum hindlimb grip strength of the rats in SCI group (11 N) than to that of the intact group (18N). Two-way mixed ANOVA was applied to analyze the effect and interaction of group and time on the grip strength, considering a Greenhouse-Geisser correction (data violated the sphericity assumption, with Mauchly's W=0.06 and P<0.001). Significant effects were observed for group (F=28.356; P<0.001; partial η2=0.563), time (F=1631.072; P<0.001; partial η2=0.987) and interaction between time and group F=4.881; P=0.007; partial η2=0.182). Grip strength increased significantly over time in both groups (P<0.001). The grip strength of the SCI + ISMS group was significantly greater than that of the SCI group at each measurement (P<0.001; Fig. 5B).
SEPs assessment
At 7 days postoperatively, the SEPs (P and N waves) changed due to the injury: The latency was somewhat prolonged and the amplitude correspondingly reduced. The main reason for this was the blockage of the upstream pathway following SCI, which resulted in the inability of the upstream nerve signals to transmit signals through the spinal cord when the nerve impulses transmitted them to the cerebral cortex, drastically reducing the number of nerve conduction and therefore significantly reducing the speed of nerve conduction in the upstream pathway. With ISMS following injury, the latency and amplitude would gradually approach that of SEPs in intact rats. As shown in Fig. 6A and B, the latency of the P-wave in the SCI group (34 msec) was much longer than that of the P-wave in intact rats (20 msec) at 7 days postoperatively, whereas the latency of the P-wave in the SCI + ISMS group (31 msec) was reduced compared with that of the SCI group. The amplitude of the P waves in the SCI group (1.6 mV) was much smaller than that of the intact rats (10 mV), whereas the amplitude of the P waves in the SCI + ISMS group (3 mV) increased compared with that of the SCI group. The latency and amplitude of the N waves also showed the same trend. After 3-4 weeks of stimulation, the latency of the P and N waves in the SCI + ISMS group gradually decreased and the amplitude became higher. By the fourth week, the latency and amplitude more closely resembled the SEPs of the intact rats and the rats in the SCI + ISMS group improved compared with than the rats in the SCI group in terms of overall improvement in SEPs. As represented in Fig. 6A and B, an improvement in the function of the sensory pathways was inferred based on the increase in amplitude and reduction of the latency in SEPs. The latency and amplitude values of P and N showed a gradual improvement in the SEPs of all rats from the first week to the end of the study. The application of two-way mixed ANOVA showed significant differences among the SCI + ISMS and SCI groups in latency and amplitude of SEPs at every time point (P<0.001). With the ISMS training, rats in the SCI + ISMS group exhibited significant improvement in the latency and the amplitude of SEPs over time (P<0.001).
Figure 6.

Results of the assessment of motor function after SCI based on SEPs. (A) Latency and amplitudes of P wave were recorded by SEPs on 7, 14 and 28 days after SCI. (B) Latency and amplitudes of N wave were recorded by SEPs on 7, 14 and 28 days after SCI. With the ISMS training, rats in the SCI + ISMS group showed significant improvement in the latency and the amplitude of SEPs over time. *P<0.05, vs. group; #P<0.05, vs. previous time point. SEPs, somatosensory-evoked potentials; SCI, spinal cord injury; ISMS, intra-spinal micro-stimulation.
All outcome measures revealed that a four-week period of ISMS locomotor training was sufficient to improve walking symmetry and correct the residual hindlimb deficits on the side of the lesion in SCI models.
Discussion
The present study first reported that two special sites were symmetrical on the posterior median sulcus and that ISMS can induce bilateral alternation of two movement patterns of the bilateral hind limbs after stimulating either of these two special sites once the polarity of the stimulus is changed. Based on this finding, four weeks of ISMS locomotor training was designed to examine the efficacy of stimulation at the special site on the reconstruction of lower limbs. Male and female rats did not differ significantly at the biological level during the experiment. The present study illustrated that the implantation of a pair of microelectrodes on the special site in the lumbosacral spinal cord in combination with the training of the bilateral hind limbs could be used to restore locomotor-like activity following SCI. ISMS is commonly used as a means of recovery motor function in animal experiments following SCI, activating the motor networks in the spinal cord distal to the site of injury (36). The present study also found that the threshold of stimulation amplitude increases slightly over time and that the position of the two special sites did not migrate with time, no matter which segment was damaged. It was observed in the present study that, before the identification of the optimal sites that induce alternating flexion and extension movements, a double rhythmic fast-jitter phenomenon of the bilateral hind limbs may be the specific manifestation of the neuronal network oscillation. Moreover, there is compelling evidence that neuronal connections between the left and right sides and those between the cervical and lumbar levels coordinate the activities of spinal CPGs (37). The optimal sites on the left and right of the spinal cord that control the stepping movement of the bilateral hind limbs are symmetrical concerning the posterior median sulcus, but the movement patterns generated by the stimulation using the same polarity pulses are complementary. These phenomena indicated that these specific sites may be closely related to CPGs. The induced body movement phenomenon met the characteristics of the CPG network responsible for walking, controlling the rhythm and the coordinated movement patterns of the bilateral hind limbs (38-40). In the process of transection injury of the VT9 vertebra segment, cutting off from the cerebral cortex neural control signaling pathways, the hind limbs spontaneously produced rhythmic movements uncontrolled by the upper central nervous system (5-7). Nevertheless, the two points identified using the method described were consistent with the stimulation positions of the bilateral alternating movements of the hind limbs induced by ISMS as mentioned in a number of published studies, both located in the L2 segment of the spinal cord (41-43). Therefore, it was hypothesized that these two optimal points were the activation sites of the CPG network responsible for hind limb walking and the special sites henceforth referred to as A-CPG sites.
Our studies have also indicated that micro-stimulation via a microelectrode did not merely activate an individual ‘motor pool’, but rather activated a complex spinal neural network that could generate coordinated, multi-joint flexion or extension movements (44,45). As an exploration of the motor mechanism by which unilateral stimulation can produce bilateral activation, the lower limb motor neural network was modelled as a CPG model in which the ipsilateral flexion and extension neurons inhibit each other via inhibitory interneurons, whereas the two contralateral extensor (or flexor) neurons produce excitatory activation primarily via excitatory interneurons. When an electrical stimulus was applied to the A-CPG site, it was equivalent to activating the entire neuronal network. Excitatory and inhibitory effects were transmitted between flexion and extension neurons via synapses, culminating in a bilateral pattern of motor activation. Compared with Saigal et al (23), in which a single micro-wire stimulating motor neuron pool of the cat produced single-joint movements as well as coordinated multi-joint synergies, the present study used fewer electrodes to activate the movement patterns and, when switching the pulse polarity of the stimulus, it could realize the switch of the movement pattern and thus finally form a complete gait movement. To further explore the mechanism behind this finding, the authors will next investigate from the perspective of electrophysiology or physical engineering to explain the relationship between the polarity of stimulus, the A-CPG sites and the movement patterns.
In conclusion, based on the A-CPG sites that are found to control the switch of two movement patterns, the present study assessed recovery based on electrical stimulation using mono-polar ISMS. It was possible to recover the gait function of paralyzed hind limbs after SCI by controlling one pair of electrodes on the spinal cord. It has been demonstrated that ISMS has several advantages over direct muscle stimulation (46-48). The disadvantage of the intramuscular stimulation was rapid muscle fatigue and ISMS was able to elicit prolonged and stable force generation (49). Compared with muscle stimulation, the present study greatly reduced surgical complexity, the number of implanted electrodes required and muscle fatigue. It is hoped that the present study will provide some insight into the motor function recovery of paralyzed limbs following SCI.
Acknowledgements
Not applicable.
Funding Statement
Funding: The present study was funded by the National Natural Science Foundation of China (grant nos. 81371663 and 61534003), the Six talents peaks Project (grant no. SWYY-116), and the Post-graduate Research and Practice Innovation Program of Jiangsu Province, China (grant no. KYCX21_3085).
Availability of data and materials
The datasets used and/or analyzed during the current study are available from the corresponding author on reasonable request.
Authors' contributions
XS was responsible for conceiving and designing the current study, definition of English abbreviations for special phrases in the paper, manuscript editing and manuscript review. XS, YW and ZL were responsible for experimental studies, manuscript editing and data acquisition. TS was responsible for design, literature search, experimental studies, statistical analysis, manuscript preparation and manuscript editing. TS, YW and ZL confirm the authenticity of all the raw data. All authors read and approved the final manuscript.
Ethics approval and consent to participate
All procedures were conducted according to the Guide for the Care and Use of Experimental Animals [approval no. SYXK (Su) 2017-0046], using protocols approved by the Ethics Committee of Nantong University.
Patient consent for publication
Not applicable.
Competing interests
The authors declare that they have no competing interests.
References
- 1.Wein AJ. Re: Traumatic spinal cord injury in the United States, 1993-2012. J Urol. 2016;195(685) doi: 10.1016/j.juro.2015.12.040. [DOI] [PubMed] [Google Scholar]
- 2.Krause JS, Carter RE. Risk of mortality after spinal cord injury: Relationship with social support, education, and income. Spinal Cord. 2009;47:592–596. doi: 10.1038/sc.2009.15. [DOI] [PMC free article] [PubMed] [Google Scholar]
- 3.Golowasch J. Neuromodulation of central pattern generators and its role in the functional recovery of central pattern generator activity. J Neurophysiol. 2019;122:300–315. doi: 10.1152/jn.00784.2018. [DOI] [PubMed] [Google Scholar]
- 4.Grill WM. Electrical activation of spinal neural circuits: Application to motor-system neural prostheses. Neuromodulation. 2000;3:97–106. doi: 10.1046/j.1525-1403.2000.00097.x. [DOI] [PubMed] [Google Scholar]
- 5.Grillner S, Perret C, Zangger P. Central generation of locomotion in the spinal dogfish. Brain Res. 1976;109:255–269. doi: 10.1016/0006-8993(76)90529-1. [DOI] [PubMed] [Google Scholar]
- 6.Grillner S, Zangger P. On the central generation of locomotion in the low spinal cat. Exp Brain Res. 1979;34:241–261. doi: 10.1007/BF00235671. [DOI] [PubMed] [Google Scholar]
- 7.Marder E, Bucher D. Central pattern generators and the control of rhythmic movements. Curr Biol. 2001;11:R986–R996. doi: 10.1016/s0960-9822(01)00581-4. [DOI] [PubMed] [Google Scholar]
- 8.Gordon IT, Whelan PJ. Deciphering the organization and modulation of spinal locomotor central pattern generators. J Exp Biol. 2006;209:2007–2014. doi: 10.1242/jeb.02213. [DOI] [PubMed] [Google Scholar]
- 9.Minassian K, Hofstoetter US, Dzeladini F, Guertin PA, Ijspeert A. The human central pattern generator for locomotion: Does it exist and contribute to walking? Neuroscientist. 2017;23:649–663. doi: 10.1177/1073858417699790. [DOI] [PubMed] [Google Scholar]
- 10.Steuer I, Guertin PA. Central pattern generators in the brainstem and spinal cord: An overview of basic principles, similarities and differences. Rev Neurosci. 2019;30:107–164. doi: 10.1515/revneuro-2017-0102. [DOI] [PubMed] [Google Scholar]
- 11.Mushahwar VK, Gillard DM, Gauthier MJA, Prochazka A. Intraspinal micro stimulation generates locomotor-like and feedback-controlled movements. IEEE Trans Neural Syst Rehabil Eng. 2002;10:68–81. doi: 10.1109/TNSRE.2002.1021588. [DOI] [PubMed] [Google Scholar]
- 12.Guevremont L, Renzi CG, Norton JA, Kowalczewski J, Saigal R, Mushahwar VK. Locomotor-related networks in the lumbosacral enlargement of the adult spinal cat: Activation through intraspinal microstimulation. IEEE Trans Neural Syst Rehabil Eng. 2006;14:266–272. doi: 10.1109/TNSRE.2006.881592. [DOI] [PubMed] [Google Scholar]
- 13.Zhang H, Feng L, Wang Y. Intraspinal microstimulation A novel technique for the functional recovery of spinal cord injury. Neural Regen Res. 2010;5:1249–1255. [Google Scholar]
- 14.Bamford JA, Todd KG, Mushahwar VK. The effects of intraspinal microstimulation on spinal cord tissue in the rat. Biomaterials. 2010;31:5552–5563. doi: 10.1016/j.biomaterials.2010.03.051. [DOI] [PMC free article] [PubMed] [Google Scholar]
- 15.Bamford JA, Mushahwar VK. doi: 10.1016/B978-0-444-53815-4.00004-2. Intraspinal microstimulation for the recovery of function following spinal cord injury. In: Brain Machine Interfaces: Implications for Science, Clinical Practice and Society. Schouenborg J, Garwicz M and Danielsen N (eds.) Elsevier Science Bv, Amsterdam, pp227-239, 2011. [DOI] [PMC free article] [PubMed] [Google Scholar]
- 16.Shu B, Yang F, Guan Y. Intra-spinal microstimulation may alleviate chronic pain after spinal cord injury. Med Hypotheses. 2017;104:73–77. doi: 10.1016/j.mehy.2017.05.028. [DOI] [PMC free article] [PubMed] [Google Scholar]
- 17.Jankowska E, Lundberg A, Roberts WJ, Stuart D. A long propriospinal system with direct effect on motoneurones and on interneurones in the cat lumbosacral cord. Exp Brain Res. 1974;21:169–194. doi: 10.1007/BF00234388. [DOI] [PubMed] [Google Scholar]
- 18.Jankowska E, Padel Y, Tanaka R. The mode of activation of pyramidal tract cells by intracortical stimuli. J Physiol. 1975;249:617–636. doi: 10.1113/jphysiol.1975.sp011034. [DOI] [PMC free article] [PubMed] [Google Scholar]
- 19.Jankowska E. Interneuronal relay in spinal pathways from proprioceptors. Prog Neurobiol. 1992;38:335–378. doi: 10.1016/0301-0082(92)90024-9. [DOI] [PubMed] [Google Scholar]
- 20.Gaunt RA, Prochazka A, Mushahwar VK, Guevremont L, Ellaway PH. Intraspinal microstimulation excites multisegmental sensory afferents at lower stimulus levels than local alpha-motoneuron responses. J Neurophysiol. 2006;96:2995–3005. doi: 10.1152/jn.00061.2006. [DOI] [PubMed] [Google Scholar]
- 21.Lau B, Guevremont L, Mushahwar VK. Strategies for generating prolonged functional standing using intramuscular stimulation or intraspinal microstimulation. IEEE Trans Neural Syst Rehabil Eng. 2007;15:273–285. doi: 10.1109/TNSRE.2007.897030. [DOI] [PubMed] [Google Scholar]
- 22.Mushahwar VK, Jacobs PL, Normann RA, Triolo RJ, Kleitman N. New functional electrical stimulation approaches to standing and walking. J Neural Eng. 2007;4:S181–S197. doi: 10.1088/1741-2560/4/3/S05. [DOI] [PubMed] [Google Scholar]
- 23.Saigal R, Renzi C, Mushahwar VK. Intraspinal microstimulation generates functional movements after spinal-cord injury. IEEE Trans Neural Syst Rehabil Eng. 2004;12:430–440. doi: 10.1109/TNSRE.2004.837754. [DOI] [PubMed] [Google Scholar]
- 24.Asadi AR, Erfanian A. Adaptive neuro-fuzzy sliding mode control of multi-joint movement using intraspinal microstimulation. IEEE Trans Neural Syst Rehabil Eng. 2012;20:499–509. doi: 10.1109/TNSRE.2012.2197828. [DOI] [PubMed] [Google Scholar]
- 25.Holinski BJ, Mazurek KA, Everaert DG, Toossi A, Lucas-Osma AM, Troyk P, Etienne-Cummings R, Stein RB, Mushahwar VK. Intraspinal microstimulation produces over-ground walking in anesthetized cats. J Neural Eng. 2016;13(056016) doi: 10.1088/1741-2560/13/5/056016. [DOI] [PMC free article] [PubMed] [Google Scholar]
- 26.Tawakol O, Mushahwar VK, Troyk PR. The use of digital image correlation for measurement of strain fields in a novel wireless intraspinal microstimulation interface. Artif Organs. 2022;46:2066–2072. doi: 10.1111/aor.14349. [DOI] [PubMed] [Google Scholar]
- 27.Barthélemy D, Leblond H, Provencher J, Rossignol S. Nonlocomotor and locomotor hindlimb responses evoked by electrical microstimulation of the lumbar cord in spinalized cats. J Neurophysiol. 2006;96:3273–3292. doi: 10.1152/jn.00203.2006. [DOI] [PubMed] [Google Scholar]
- 28.Shen XY, Tao CL, Ma L, Shen JH, Li ZL, Wang ZG, Lü XY. Influence of spinal cord injury on core regions of motor function. Neural Regen Res. 2021;16:567–572. doi: 10.4103/1673-5374.293158. [DOI] [PMC free article] [PubMed] [Google Scholar]
- 29.Islam R, Cuellar CA, Felmlee B, Riccelli T, Silvernail J, Boschen SL, Grahn P, Lavrov I. Multifactorial motor behavior assessment for real-time evaluation of emerging therapeutics to treat neurologic impairments. Sci Rep. 2019;9(16503) doi: 10.1038/s41598-019-52806-1. [DOI] [PMC free article] [PubMed] [Google Scholar]
- 30.Basso DM, Beattie MS, Bresnahan JC. Graded histological and locomotor outcomes after spinal cord contusion using the NYU weight-drop device versus transection. Exp Neurol. 1996;139:244–256. doi: 10.1006/exnr.1996.0098. [DOI] [PubMed] [Google Scholar]
- 31.Alam M, Garcia-Alias G, Shah PK, Gerasimenko Y, Zhong H, Roy RR, Edgerton VR. Evaluation of optimal electrode configurations for epidural spinal cord stimulation in cervical spinal cord injured rats. J Neurosci Methods. 2015;247:50–57. doi: 10.1016/j.jneumeth.2015.03.012. [DOI] [PMC free article] [PubMed] [Google Scholar]
- 32.Hanwright PJ, Rath JL, von Guionneau N, Harris TGW, Sarhane KA, Kemp SWP, Hoke A, Cederna PS, Tuffaha SH. Stimulated grip strength measurement: Validation of a novel method for functional assessment. Muscle Nerve. 2019;60:437–442. doi: 10.1002/mus.26646. [DOI] [PubMed] [Google Scholar]
- 33.Agrawal G, Kerr C, Thakor NV, All AH. Characterization of graded multicenter animal spinal cord injury study contusion spinal cord injury using somatosensory-evoked potentials. Spine (Phila Pa 1976) 2010;35:1122–1127. doi: 10.1097/BRS.0b013e3181be5fa7. [DOI] [PMC free article] [PubMed] [Google Scholar]
- 34.Lewis MJ, Howard JF Jr, Olby NJ. The relationship between trans-lesional conduction, motor neuron pool excitability, and motor function in dogs with incomplete recovery from severe spinal cord injury. J Neurotrauma. 2017;34:2994–3002. doi: 10.1089/neu.2017.5012. [DOI] [PMC free article] [PubMed] [Google Scholar]
- 35.Cheng XH, Zhang L, Fu J. Somatosensory evoked potential changes and decompression timing for spinal cord function recovery and evoked potentials in rats with spinal cord injury. Brain Res Bull. 2019;146:7–11. doi: 10.1016/j.brainresbull.2018.12.003. [DOI] [PubMed] [Google Scholar]
- 36.Jackson A, Zimmermann JB. Neural interfaces for the brain and spinal cord-restoring motor function. Nat Rev Neurol. 2012;8:690–699. doi: 10.1038/nrneurol.2012.219. [DOI] [PubMed] [Google Scholar]
- 37.Frigon A, Desrochers É, Thibaudier Y, Hurteau MF, Dambreville C. Left-right coordination from simple to extreme conditions during split-belt locomotion in the chronic spinal adult cat. J Physiol. 2017;595:341–361. doi: 10.1113/JP272740. [DOI] [PMC free article] [PubMed] [Google Scholar]
- 38.Cohen AH, Wallén P. The neuronal correlate of locomotion in fish. ‘Fictive swimming’ induced in an in vitro preparation of the lamprey spinal cord. Exp Brain Res. 1980;41:11–18. doi: 10.1007/BF00236674. [DOI] [PubMed] [Google Scholar]
- 39.Cowley KC, Schmidt BJ. Regional distribution of the locomotor pattern-generating network in the neonatal rat spinal cord. J Neurophysiol. 1997;77:247–259. doi: 10.1152/jn.1997.77.1.247. [DOI] [PubMed] [Google Scholar]
- 40.Ijspeert AJ, Kodjabachian J. Evolution and development of a central pattern generator for the swimming of a lamprey. Artif Life. 1999;5:247–269. doi: 10.1162/106454699568773. [DOI] [PubMed] [Google Scholar]
- 41.Cazalets JR, Borde M, Clarac F. Localization and organization of the central pattern generator for hindlimb locomotion in newborn rat. J Neurosci. 1995;15:4943–4951. doi: 10.1523/JNEUROSCI.15-07-04943.1995. [DOI] [PMC free article] [PubMed] [Google Scholar]
- 42.Zhang JM, Lanuza GM, Britz O, Wang Z, Siembab VC, Zhang Y, Velasquez T, Alvarez FJ, Frank E, Goulding M. V1 and v2b interneurons secure the alternating flexor-extensor motor activity mice require for limbed locomotion. Neuron. 2014;82:138–150. doi: 10.1016/j.neuron.2014.02.013. [DOI] [PMC free article] [PubMed] [Google Scholar]
- 43.Pujala A, Blivis D, O'Donovan MJ. Interactions between dorsal and ventral root stimulation on the generation of locomotor-like activity in the neonatal mouse spinal cord. eNeuro. 2016;3(ENEURO.0101-16.2016) doi: 10.1523/ENEURO.0101-16.2016. [DOI] [PMC free article] [PubMed] [Google Scholar]
- 44.Shen XY, Du W, Huang W, Chen Y. Rebuilding motor function of the spinal cord based on functional electrical stimulation. Neural Regen Res. 2016;11:1327–1332. doi: 10.4103/1673-5374.189199. [DOI] [PMC free article] [PubMed] [Google Scholar]
- 45.Tao C, Shen X, Ma L, Li Z, Shen J. doi: 10.1109/EMBC44109.2020.9175963. Three-dimensional map of lumbar spinal cord motor function for intraspinal microstimulation in rats. In: 2020 42nd Annual International Conference of the IEEE Engineering in Medicine & Biology Society (EMBC) IEEE, pp3525-3528, 2020. [DOI] [PubMed] [Google Scholar]
- 46.Dalrymple AN, Roszko DA, Sutton RS, Mushahwar VK. Pavlovian control of intraspinal microstimulation to produce over-ground walking. J Neural Eng. 2020;17(036002) doi: 10.1088/1741-2552/ab8e8e. [DOI] [PubMed] [Google Scholar]
- 47.Tai C, Booth AM, Robinson CJ, de Groat WC, Roppolo JR. Isometric torque about the knee joint generated by microstimulation of the cat L6 spinal cord. IEEE Trans Rehabil Eng. 1999;7:46–55. doi: 10.1109/86.750551. [DOI] [PubMed] [Google Scholar]
- 48.Tai C, Booth AM, Robinson CJ, de Groat WC, Roppolo JR. Multimicroelectrode stimulation within the cat L6 spinal cord: Influences of electrode combinations and stimulus interleave time on knee joint extension torque. IEEE Trans Rehabil Eng. 2000;8:1–10. doi: 10.1109/86.830943. [DOI] [PubMed] [Google Scholar]
- 49.Caldwell CW, Reswick JB. A percutaneous wire electrode for chronic research use. IEEE Trans Biomed Eng. 1975;22:429–432. doi: 10.1109/tbme.1975.324516. [DOI] [PubMed] [Google Scholar]
Associated Data
This section collects any data citations, data availability statements, or supplementary materials included in this article.
Data Availability Statement
The datasets used and/or analyzed during the current study are available from the corresponding author on reasonable request.