

Abstract
The aim of this descriptive-analytical study was to compare the categories of auditory performance (CAP) and speech intelligibility rating (SIR) in people with cochlear implants (CI) based on the implanted ear. CAP and SIR were evaluated in 184 people with CI of right (110) and left (74) ears every 6 to 24 months (6,12,18,24). The significance level was less than 0.05. People with CI in the right-ears had better mean CAP and SIR scores than the left-ears (P values6,12,18, 24= 0.001, 0.004, 0.004, 0.002, and 0.001, 0.010, 0.010, 0.006). There were the relationship between the means of language acquisition status at the time of surgery and the means of CAP and SIR scores (P values6,12,18, 24= 0.005, 0.031, 0.006, 0.019, and 0.000, 0.000, 0.000, 0.002). The highest mean SIR scores were found in people with high school education (P values6,12,18, 24= 0.000, 0.000, 0.000, 0.008). The means of CAP scores did not show a relationship with the level of education (P values6, 12, 18, 24= 0.388, 0.217, 0.297, 0.213). Mean SIR and CAP scores were not related to gender. People who received right ear prostheses after the language learning age and have a higher level of education are the best users of cochlear implants. Compared to others who do not have these facilities, they gain more ability in auditory-speech skills. Gender, does not affect these capabilities.
Key words: Cochlear implants, Auditory, Speech
Introduction
Children and adults with hearing loss have lower literacy levels than people with normal hearing. The consequences of this condition negatively affect their learning, educational activities, social interactions and quality of life [1]. The CI are widely accepted care for severe-profound hearing loss. They can lead to more effective and efficient changes in patient’s auditory function and increase their speech perception. CI provide information about high frequency sounds, which are usually impossible with hearing aids [2]. Archbold et al., were published the CAP scale to evaluate the auditory perception skills of people with CI, as follows: 0. Lack of awareness of surrounding sounds: The subject is not able to distinguish the environmental and speech sounds. 1. Awareness of environmental sounds: The subject is able to respond to at least five different sounds that receives in the home or outside environment. 2. Response to speech sounds: Any answer similar pausing during an activity, looking and smiling. 3. Determining the identity of environmental sounds: The subject has a different reaction to each specific sound and can distinguish at least five common environmental sounds. 4. Differentiation of some speech sounds without lip reading: The subject is able to confidently recognize at least two different speech sounds from each other. 5. Understanding common expressions without lip reading: By being in familiar situations, the subject is able to recognize simple and repetitive instructions, and correctly points to the pictures that are asked of him in closed sets. 6. Understanding conversations without lip reading: The subject are able to respond to everyday sentences. 7. Phone conversation: The subject is able to have a phone conversation with a familiar person on the spot and easily answer the simple questions. 8. Follow-up of group conversation: The subject can follow group conversation, where sounds are reflected or there is disturbing noise. 9. Telephone conversations with foreigners: Even if the subject of the conversation is not predictable [3].
Also, the SIR scale was designed by Allen et al., to evaluate the verbal clarity level of people with CI as follows: 1. The words produced by the subject are not clear and recognizable. The main method of communication in everyday situations is gestures. 2. Continuous speech is not clear and can be understood at the level of single words, provided that it is possible to use lip reading and to be aware of the verbal content for the listener. 3. Continuous speech is understandable for the listener, if concentrates, reads lips and is aware of the verbal content. 4. Continuous speech is intelligible to a listener, who has little experience of speaking with the deaf. The listener does not have to fully focus on what the deaf person is saying. 5. The person’s continuous speech is clear for everyone. The speaker’s message is clearly understandable in everyday message [4].
CAP and SIR scoring are based on audiologist or speech therapist observations and there is no age limitation for people. Since the left hemisphere is dominant for speech processing, there is a possibility of differences in CAP and SIR scores based on the cochlear implanted ear [5]. So, the aim of this study was to compare the CAP and SIR scores in people with CI according to the implanted ear.
Material and Method
This research was descriptive-analytical study. Its practical work was done from 2019 to 2022 in Besath Hospital, Hamedan, Iran. The study population were consisted of 184 people with CI (right ear = 110, left ear = 74 ), who were referred to the CI center of Besath Hospital, from 2012 to 2019. The people with CI were selected by census and available samples. CAP and SIR were evaluated every 6 to 24 months (6, 12, 18, 24) for each groups. Inclusion criteria were people with CI, who were underwent surgery at Besath Hospital from 2012 to 2019, agreement to contribute in this study. Exclusion criteria were no access to the people or their death, and an interval of less than two years since surgery time.
Informed verbal consent were obtained from all people. Research data were collected without mentioning names and individual characteristics. People were assured that the results would be publicly announced. Their information will not be given to a specific person or organization, and failure to participate in the study will not interfere with their treatment process. As soon as people’s prostheses were activated, all of people with CI (n = 184) were participated in 80 auditory rehabilitation sessions, by the cochlear implant rehabilitation team of Besath Hospital. Data collection tools were included CAP and SIR scores. All analysis were done by means of the statistics software SPSS14. Descriptive statistics were Kolmogorov-Smirnov and Shapiro-Wilk tests were used for evaluation of normal test distribution. Descriptive information of qualitative data were expressed in the form of tables, graphs, ratios and percentages. Kruskal-Wallis, Chi-square, Mann-Whitney tests were used for the multiple comparisons. The significance level was determined to be less than 0.05.
Results
In this study, 184 people with CI were selected (right ear = 110, left ear = 74), SIR and CAP were performed every 6 to 24 months for all of them. Their demographic information are summarized in Table 1. The characteristics of the two groups, who had CI in the right and left ears were statistically similar and there were no significant differences between the implanted ear and following factors: 1.Age (P value = 0.873), 2. Onset age of hearing loss (P value = 0.243), 3. Age at cochlear implantation (P value = 0.696), 4. Positive family history (P value = 0.526), 5. Gender (female, male), (P value = 0.911), 6. Level of education (illetrate, elementary and middle school, high school, university), (P value = 0.674), 7. Status of language acquisition at the time of surgery (pre-linguals, pos-tlingual), (P value = 0.802), 8. Type of CI prostheses (Advanced Bionics, MED-EL, Nucleus), (P value = 0.086).
Table 1.
Demographic information of people with cochlear implants (CI), (n = 184)
| Right implanted-ear n = 110) | Left implanted-ear (n = 74) | |||
|---|---|---|---|---|
| Factor | Mean (SD) | Mean (SD) | P value | |
| Age (Year, month, day = Y, M, D) | 15Y, 7M, 6D (14Y) | 15Y, 2M, 12D (13Y) | 0.873 | |
| Onset age of hearing loss | 15Y, 7M, 24D (13Y) | 3Y, 6M, 18D (10Y) | 0.243 | |
| Age at cochlear implantation | 9Y, 10M, 24D (14Y) | 10Y, 8M, 12D (14Y) | 0.696 | |
| Absolute values (frequency) | Absolute values (frequency) | |||
| Positive family history | 21 (19.1%) | 17 (23%) | 0.526 | |
| Gender |
Female Male |
63 (57.3%) | 43 (58.1%) | 0.911 |
| 47 (42.7%) | 31 (41.9%) | |||
| Level of education |
Illetrate Elementary and middle school High school University |
24 (21.8%) | 25 (33.8%) | 0.674 |
| 65 (59.1%) | 29 (39.2%) | |||
| 20 (18.2%) | 17 (23%) | |||
| 1 (0.9%) | 3 (4.1%) | |||
| Status of language acquisition at the time of surgery |
Pre-lingual Post-lingual |
86 (78.2%) | 59 (79.7%) | 0.802 |
| 24 (21.8%) | 15 (20.3%) | |||
|
Advanced Bionics MED-EL Nucleus |
19 (17.3%) | 23 (31.1%) | ||
| 31 (28.2%) | 16 (21.6%) | 0.086 | ||
| Type of CI | 60 (54.5%) | 35 (47.3%) | ||
According to Table 2, and Figures.1, 2, there were the significant differences between the implanted ear and auditory/speech performance. The people with CI in the right ears had better mean CAP and SIR scores than people, who had left ear prostheses (P values of CAP 6 = 0.001, CAP 12 = 0.004, CAP 18 = 0.004, CAP 24 = 0.002, and P values of SIR 6 = 0.001, SIR 12 = 0.010, SIR 18 = 0.010, SIR 24 = 0.006).
Table 2.
Means and standard deviations (SD) of speech intelligibility rating (SIR) and categories of auditory performance (CAP) scores of people with cochlear implants (CI) in time intervals of 6 to 24 months (n = 184)
| Time Intervals | Right implanted ear (n = 110) | Left implanted ear (n = 74) | P value | |
|---|---|---|---|---|
| Mean (SD) | Mean (SD) | |||
| CAP 6 | 4.29 (1.587) | 3.73 (1.051) | 0.001 | |
| CAP 12 | 5.63 (1.573) | 5.01 (1.255) | 0.004 | |
| CAP 18 | 6.55 (1.444) | 6.08 (1.236) | 0.004 | |
| CAP 24 | 7.49 (1.495) | 7.01 (1.298) | 0.002 | |
| SIR 6 | 2.13 (1.227) | 1.57 (845) | 0.001 | |
| SIR 12 | 3.19 (1.137) | 2.74 (1.048) | 0.010 | |
| SIR 18 | 3.88 (0.955) | 3.55 (0.953) | 0.010 | |
| SIR 24 | 4.41 (0.891) | 4.16 (0.794) | 0.006 |
Fig. 1.
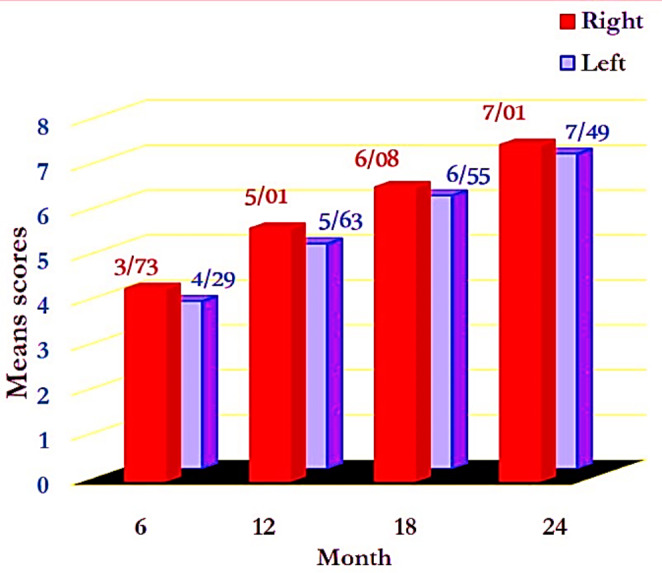
Mean categories of auditory performance (CAP) scores of people with cochlear implants (CI) in time intervals of 6 to 24 months (n = 184).
Fig. 2.
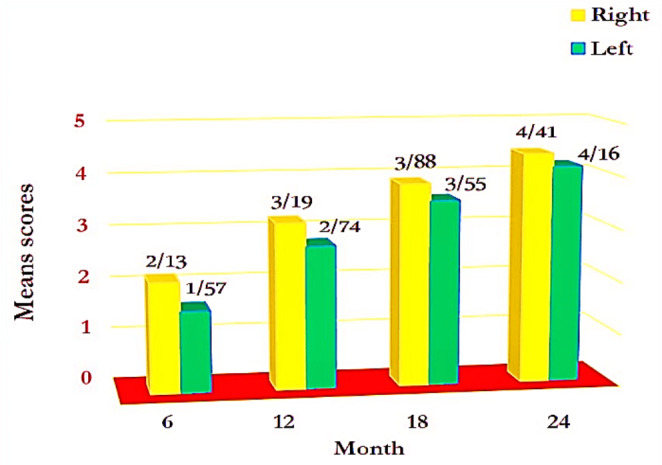
Mean speech intelligibility rating (SIR) scores of people with cochlear implants (CI) in time intervals of 6 to 24 months (n = 184).
Referring to Table 3, there were the significant differences between the means of CAP and SIR scores and the status of language acquisition at the time of surgery (pre-linual, post-lingual), (P values of CAP 6 = 0.005, CAP 12 = 0.031, CAP 18 = 0.006, CAP 24 = 0.019, and P values of SIR 6 = 0.000, SIR 12 = 0.000, SIR 18 = 0.000, and SIR 24 = 0.002). In other words, post-lingual people (n = 39) were obtained better advantages in auditory and speech performance than pre-linguals (n = 145).
Table 3.
Means and standard deviations (SD) of speech intelligibility rating (SIR) and categories of auditory performance (CAP) scores of people with cochlear implants (CI) in time intervals of 6 to 24 months, according to status of language acquisition at the time of surgery (pre-lingual, post-lingual), (n = 184)
| CAP 24 | CAP 18 | CAP 12 | CAP 6 | SIR 24 | SIR 18 | SIR 12 | SIR 6 | Status of language acquisition at the time of surgery | |
|---|---|---|---|---|---|---|---|---|---|
| 145 | 145 | 145 | 145 | 145 | 145 | 145 | 145 | N | Pre-lingual |
| 7.18 | 6.23 | 5.18 | 3.79 | 4.2 | 3.55 | 2.7 | 1.54 | Mean | |
| 1.44 | 1.28 | 1.27 | 1.10 | 0.89 | 0.91 | 0.89 | 0.63 | SD | |
| 39 | 39 | 39 | 39 | 39 | 39 | 39 | 39 | N | Post-lingual |
| 7.74 | 6.87 | 6.13 | 5.08 | 4.72 | 4.49 | 4.15 | 3.23 | Mean | |
| 1.35 | 1.61 | 1.92 | 1.95 | 0.56 | 0.82 | 1.16 | 1.50 | SD | |
| 0.019 | 0.006 | 0.031 | 0.005 | 0.002 | 0.000 | 0.000 | 0.000 | P value | |
Referring to Table 4, there were significant differences between the means of SIR scores and level of education (P values of SIR 6 = 0.000, SIR 12 = 0.000, SIR 18 = 0.000, SIR 24 = 0.008). People with CI, who had high school and university education level had the highest SIR scores, and those with illetrate and elementary education level had the lowest. The means of CAP scores had no relationship with the level of education (P values of CAP 6 = 0.388, CAP 12 = 0.217, CAP 18 = 0.297, CAP 24 = 0.213).
Table 4.
Means and standard deviations (SD) of speech intelligibility rating (SIR) and categories of auditory performance (CAP) scores of people with cochlear implants (CI) in time intervals of 6 to 24 months, based on level of education at time intervals of 6 to 24 months
| CAP 24 | CAP 18 | CAP 12 | CAP 6 | SIR 24 | SIR 18 | SIR 12 | SIR 6 | Level of Education | |
|---|---|---|---|---|---|---|---|---|---|
| 49 | 49 | 49 | 49 | 49 | 49 | 49 | 49 | n | Illetrate |
| 7.59 | 6.67 | 5.67 | 4.10 | 4.49 | 3.78 | 2.90 | 1.80 | Mean | |
| 1.12 | 0.97 | 1.07 | 0.94 | 0.65 | 0.65 | 0.74 | 0.74 | SD | |
| 94 | 94 | 94 | 94 | 94 | 94 | 94 | 94 | N | Elementary and middle school |
| 7.13 | 6.22 | 5.18 | 3.89 | 4.11 | 3.51 | 2.76 | 1.62 | Mean | |
| 1.50 | 1.42 | 1.47 | 1.39 | 0.98 | 1.05 | 1.10 | 0.96 | SD | |
| 41 | 41 | 41 | 41 | 41 | 41 | 41 | 41 | N | High school and University |
| 7.34 | 6.32 | 5.49 | 4.41 | 4.56 | 4.27 | 3.73 | 2.68 | Mean | |
| 1.58 | 1.67 | 1.86 | 1.87 | 0.67 | 0.90 | 1.25 | 1.46 | SD | |
| 0.213 | 0.297 | 0.217 | 0.388 | 0.008 | 0.000 | 0.000 | 0.000 | P value | |
There were no significant differences between the means of CAP and SIR scores in female (n = 106) compared to male (n = 78), (P values of CAP 6 = 0.394, CAP 12 = 0.316, CAP 18 = 0.401, CAP 24 = 0.785, and P values of SIR 6 = 0.245, SIR 12 = 0.442, SIR 18 = 0.764, SIR 24 = 0.736).
Discussion
In this study, 184 people with CI were selected to estimate their auditory and speech performance scores, and comparing their right and left ears advantages. Our findings showed that there were no significant differences between the implanted ear and 1.age, 2.onset age of hearing loss, 3.age at cochlear implantation, 4.positive family history, 5.gender, 6.level of education, 7.status of language acquisition at the time of surgery, 8.type of CI prosthesis. Better mean scores in auditory and speech function tests were belonging to people, who had right ear prostheses and were operated after the language learning age (post-linguals). The highest scores of speech performance were detected in people with university education and the lowest in the illiterate.
Gender were not related to the auditory and speech skills. However, human auditory system is dimorphism and its function is influenced by estrogen and progesterone hormones. Estrogen has the excitatory role and progesterone is inhibitory [5]. The effect of estrogen on the peripheral and central auditory system makes better auditory function in women compared to men, and the level of high frequency hearing loss in women is fewer [6]. Also, development the speech and language centers occurs earlier in women [7]. Therefore, it was expected that the development of auditory/speech skills in women with CI would be faster and better than men. But, this hypothesis was not confirmed.
In this research, there were 163 right-handed and 21 left-handed people, it seemed that the selection of candidates for cochlear implantation based on their dominant hand was not random. Therefore, we did not compare the dominant hand variable. However, dominant-handedness are not related to speech and language skills [8]. Indeed, peripheral nerve signals from the ears are sent diagonally to the brain hemispheres and considering that the left hemisphere is dominant for speech processing [9], it is suitable to use the term dominant-ear instead of the handedness. Also, it is believed that there is a relationship between the dominant-hemisphere and the dominant-ear for cell phone using. The existence of a difference in hearing causes one side of the ear to be superior to the other. People who hear better with their left ear, choose that ear for phone conversations, regardless of their handedness. People who hear well in both ears, are likely to use the same ear as their dominant hand. People who hear well from the right ear, hold the phone in their right hand in more than 50% of cases [10]. On the other hand, it is believed that there is a specific environmental basis (cochlear) for ear preference [11].
Children with right ears Cl perform significantly better than those with left ears, but only in the level of single words [12]. Perhaps the reason is related to the less vocabulary and linguistic knowledge of people with CI, compared to normal hearing subjects, which causes them to be unable to rely on their potential information to understand missing parts of phrases and sentences [13]. The side of CI may significantly influence neuroplasticity patterns in adults. Right ear implantation can more effectively activate the contralateral hemisphere. The increased activity in the contralateral temporal lobe is combined with decreased activity in the contralateral frontal lobe, which is associated with better frequency-change detection performance, which is not found in left ear implantation [8]. Both age and side of implantation are significantly associated to language proficiency outcomes [14]. Since, no advantage has been identified in the left ears CI, the operation in the right ears should be done with caution [15]. It has also been reported that Cl in the right and left ears have similar advantages in auditory performances [16]. Though, it is necessary to carry out more complete and accurate researches regarding the relationship between the dominant ear and the hemisphere superiority.
Simultaneously and bilateral implantation in children generate the significant benefits for speech intelligibility in the right ear, similar to reports in children with normal hearing. It may lead to normal growths of central auditory pathways and can play an important role in language and communication maturity [17]. Post-lingual deaf children with CI in the right ears have similar advantages as well as post-lingual deaf adults [15]. The improvement of speech/auditory skills in children with CI are slower than adults, and gradually after 9 to 10 months show significance [18]. Speech perception and quality of life improvement in pre-lingually deaf adults grow more than deaf children [19]. The reason for this situation is related to the maturity of the ears, so that the right ear reaches the same function as adults until about 10 years old, while the development of the left ear continues until 14 years old [20]. Also, the auditory/speech skills in children with normal hearing are weaker than normal adults [21].
Conclusion
People who received right ear prostheses after the language learning age and have a higher level of education are the best users of cochlear implants. Compared to others, who do not have these facilities, they gain more ability in auditory-speech skills. Gender, does not affect these capabilities.
Acknowledgments
The study was approved by the research ethics committee of Hamadan University of Medical Sciences (Code: IR.UMSHA.REC.1401.161). The financial sponsor of this research was Hamadan University of Medical Sciences (registered number: 140103312273). The authors would like to thank and appreciate the esteemed participants who cooperated in this research.
Abbreviations
- CI
Cochlear implants
- CAP
Categories of auditory performance
- SIR
Speech intelligibility rating
Footnotes
Publisher’s Note
Springer Nature remains neutral with regard to jurisdictional claims in published maps and institutional affiliations.
References
- 1.Emami SF, Abdoli A (2019) Cortical Auditory Evoked Potentials in Children with Auditory Neuropathy/Dys-Synchrony. Indian J Otolaryngol Head Neck Surg 71238–242. 10.1007/s12070-018-1445-x [DOI] [PMC free article] [PubMed]
- 2.Emami SF. Comparison of Cochlear Implants with Hearing Aids Regarding. Avicenna J Clin Med. 2020;97(27):171–177. [Google Scholar]
- 3.Archbold S, Lutman M, Marshal D (1995) Categories of Auditory Performance. Ann Otol Rhinol Laryngol Suppl. ; 16: 312-4. PMID: 7668685 [PubMed]
- 4.Allen C, Nikolopoulos TP, Dyar D, O'Donoghue GM. Reliability of a rating scale for measuring speech intelligibility after pediatric cochlear implantation. Otol Neurotol. 2001;22(5):631–633. doi: 10.1097/00129492-200109000-00012. [DOI] [PubMed] [Google Scholar]
- 5.Emami SF, Gohari N, Ramezani H, Borzouei M. Hearing performance in the follicular-luteal phase of the menstrual cycle. Int J Otolaryngol. 2018 doi: 10.1155/2018/7276359. [DOI] [PMC free article] [PubMed] [Google Scholar]
- 6.Emami SF. Studying the Inter-Peak Latencies of Auditory Brainstem Response in Menopause Women. J Iran Med Council. 2022;5(4):677–684. doi: 10.18502/jimc.v5i4.11341. [DOI] [Google Scholar]
- 7.Emami SF, Farahani F, Mortazavi SA. Studying of Distortion Product of Otoacoustic Emissions in Menopausal Women. Indian J Otolaryngol Head Neck Surg. 2023;75(suppl 1):88–92. doi: 10.1007/s12070-022-03210-1. [DOI] [PMC free article] [PubMed] [Google Scholar]
- 8.Liang C, Wenstrup LH, Samy RN, Xiang J, Zhang F (2020) The Effect of Side of Implantation on the Cortical Processing of Frequency Changes in Adult Cochlear Implant Users. Front NeuroSci 14. 10.3389/fnins.2020.00368 [DOI] [PMC free article] [PubMed]
- 9.Emami SF, Shariatpanahi E (2023) Central representation of speech-in-noise perception: a narrative review. Aud Vestib Res. https://avr.tums.ac.ir/index.php/avr/article/view/1102
- 10.Seidman MD, Siegel B, Shah P, Bowyer SM. Hemispheric Dominance and Cell Phone Use. JAMA Otolaryngol Head Neck Surg. 2013;139(5):466–470. doi: 10.1001/jamaoto.2013.2889. [DOI] [PubMed] [Google Scholar]
- 11.Reiss M, Reiss G (1998) Ear preference: association with other functional asymmetries of the ears. 86(2):399–402. 10.2466/pms.1998.86.2.399 [DOI] [PubMed]
- 12.Flipsen P. Ear selection and pediatric cochlear implants: A preliminary examination of speech production outcomes. Int J Pediatr Otorhinolaryngol. 2008;72(11):1663–1670. doi: 10.1016/j.ijporl.2008.08.001. [DOI] [PubMed] [Google Scholar]
- 13.Emami SF. Central Representation of Cervical Vestibular Evoked Myogenic Potentials. Indian J Otolaryngol Head Neck Surg. 2023 doi: 10.1007/s12070-023-03829-8. [DOI] [PMC free article] [PubMed] [Google Scholar]
- 14.Gohari N, Emami SF, Mirbagheri SS, Valizadeh Valizadeh A, Abdollahi N, Borzuei M (2019) The Prevalence and Causes of Auditory Neuropathy/Dys-synchrony (AN/AD) in Children with Hearing Impairment. Indian J Otolaryngol Head Neck Surg 7171–75. 10.1007/s12070-018-1494-1 [DOI] [PMC free article] [PubMed]
- 15.Chilosi AM, Comparini A, Scusa MF, et al. A Longitudinal Study of Lexical and Grammar Development in Deaf Italian Children Provided with Early Cochlear Implantation. Ear Hear. 2013;34(3):e28–e37. doi: 10.1097/aud.0b013e31827ad687. [DOI] [PubMed] [Google Scholar]
- 16.Kraaijenga V, Derksen T, Stegeman I, Smit A. The effect of side of implantation on unilateral cochlear implant performance in patients with prelingual and postlingual sensorineural hearing loss: A systematic review. Clin Otolaryngol. 2018;43(2):440–449. doi: 10.1111/coa.12988. [DOI] [PubMed] [Google Scholar]
- 17.Surmelioglu O, Cetik F, Tarkan O et al (2014) Choice of cochlear implant side in a paediatric population. J Laryngol Otol. ; 128 (6): 504–507. J Laryngol Otol. 2014 Jun;128(6):504-7. doi: 10.1017/S0022215114001212. Epub 2014 Jun 3 [DOI] [PubMed]
- 18.Henkin Y, Swead RT, Roth DA, Kishon-Rabin L, Shapira Y, Migirov L, et al. Evidence for a right cochlear implant advantage in simultaneous bilateral cochlear implantation. Laryngoscope. 2014;124(8):1937–1941. doi: 10.1002/lary.24635. [DOI] [PubMed] [Google Scholar]
- 19.Ghazvini A, Khalilavi R, Sadeghi R, Yousefi A, Efrekharian K. Development of Auditory and Speech Skills in Children Using Cochlear Implant. Sci J Rehabilitation Med. 2019;22(4):185–194. doi: 10.22037/JRM.2019.111166.1806. [DOI] [Google Scholar]
- 20.Emami SF, Shariatpanahi E, Gohari N, Mehrabifard M (2023) Aging and speech-in-noise perception. Indian J Otolaryngol Head Neck Surg. ; 3(21) https://link.springer.com/article/10.1007/s12070-023-03689-2 [DOI] [PMC free article] [PubMed]
- 21.Klop WM, Briaire JJ, Stiggelbout AM, Frijns JH. Cochlear implant outcomes and quality of life in adults with prelingual deafness. Laryngoscope. 2007;117(11):1982–1987. doi: 10.1097/mlg.0b013e31812f56a6. [DOI] [PubMed] [Google Scholar]