

Abstract
Background
Therapeutic approaches for extrahepatic cholangiocarcinoma (EHCC) are limited, due to insufficient understanding to biomarkers related to prognosis and drug response. Here, we comprehensively assess the molecular characterization of EHCC with clinical implications.
Methods
Whole‐exome sequencing (WES) on 37 tissue samples of EHCC were performed to evaluate genomic alterations, tumor mutational burden (TMB) and microsatellite instability (MSI).
Results
Mutation of KRAS (16%) was significantly correlated to poor OS. ERBB2 mutation was associated with improved OS. ERBB2, KRAS, and ARID1A were three potentially actionable targets. TMB ≥10 mutations per megabase was detected in 13 (35.1%) cases. Six patients (16.2%) with MSIsensor scores ≥10 were found. In multivariate Cox analysis, patients with MSIsensor sore exceed a certain threshold (MSIsensor score ≥0.36, value approximately above the 20th percentile as thresholds) showed a significant association with the improved OS (HR = 0.16; 95% CI: 0.056–0.46, p < 0.001), as well as patients with both TMB ≥3.47 mutations per megabase (value approximately above the 20th percentile) and MSIsensor score ≥0.36.
Conclusions
TMB and MSI are potential biomarkers associated with better prognosis for EHCC patients. Furthermore, our study highlights important genetic alteration and potential therapeutic targets in EHCC.
Keywords: extrahepatic cholangiocarcinoma, microsatellite instability, overall survival, tumor mutational burden, whole‐exome sequencing
1. INTRODUCTION
As a fatal tumor of the bile ducts, extrahepatic cholangiocarcinoma (EHCC) has limited therapeutic options with an overall poor prognosis. 1 , 2 FDA has approved several targeted therapies for cholangiocarcinoma (CCA), including drugs that target IDH1 mutation and fibroblast growth factor receptor 2 (FGFR2) fusions in genetically selected populations. 3 , 4 However, these FDA‐recognized gene alterations were not significant in EHCC, where TP53 and KRAS genes were identified to have high‐frequency mutations. 5 , 6 , 7 So far, few targeted therapies for EHCC have been approved, thus identification of possible therapeutic targets represents high unmet needs. However, the association between genetic alterations in EHCC and prognosis are not fully investigated.
Immune checkpoint inhibitors (ICIs) aimed at providing clinical benefit to CCA are currently under investigation. High TMB and MSI might be related to prolonged progression‐free survival (PFS) and overall survival (OS) in a variety type of tumors. 8 , 9 , 10 Notably, various cut‐offs for the definition of TMB‐high and MSI‐high resulted in a highly varied proportion of TMB‐high and MSI‐high tumors in EHCC among different researches. 11 , 12 Moreover, the predictive role of TMB‐high and MSI‐high in discriminating the responders to ICIs among CCA patients remains elusive. 12 , 13 , 14 Thus, the optimal TMB and MSI thresholds that associated with better survival are needed to be preferentially identified, which would favor to understand correlations of TMB and MSI with clinical outcomes of ICIs in EHCC.
To make a further comprehensive analysis of EHCC molecular profiling and understand the associations of mutation traits with clinical translational significance, we performed a comprehensive analysis of whole exome sequencing from a Chinese cohort of 37 patients with EHCC. We revealed the somatic mutation landscape of Chinese patients with EHCC, identified optimal TMB and MSI threshold associated with better survival, and explored novel actionable target and mutational signatures linked with the etiological background.
2. MATERIALS AND METHODS
2.1. Patients and tumor samples
This research was approved by the Ethics Committee of Peking Union Medical College Hospital (PUMCH). Briefly, patients who diagnosed with EHCC and underwent surgery without radiotherapy, chemotherapy or immunotherapy at PUMCH were enrolled from January 2013 to December 2017. Two experienced pathologists independently evaluated all histological specimens. Tumor samples and adjacent noncancerous tissue from 37 eligible patients with EHCC were collected in compliance with informed consent.
2.2. Clinical data
Information about age, sex, tumor anatomic location, histological subtype of tumor, tumor stage, and surgical margins were obtained. Overall survival was defined as time from surgery until death from any causes. The ultimate vital states of all 37 patients were death during follow‐up.
2.3. Whole‐exome sequencing
Using the GeneRead DNA FFPE Kit, genomic DNA was extracted from formalin‐fixed paraffin‐embedded (FFPE) samples and then was broke into ~250 bp fragments through M220 Focused‐ultrasonicator (Covaris). SureSelect Human All Exon V6 Kit (Agilent Technologies) was used for whole genome library preparation and exome capture. 15 Prepared libraries were sequenced on Illumina HiSeq 6000 platform. Mean coverage depth of ~80× for the normal control (adjacent noncancerous tissue) and ~250× for the tumor samples were attained.
2.4. Analysis of SNV and INDEL calling
High‐quality clean data were obtained by discarding reads with adapter contamination, low‐quality nucleotides and more than 10% uncertain nucleotides. Paired‐end clean reads were mapped to the reference genome (UCSC hg19) with Burrows–Wheeler Aligner (BWA) software (https://bio‐bwa.sourceforge.net/, RRID:SCR_010910). 16 Duplicates originated from PCR amplification was marked via Genome Analysis Toolkit (https://software.broadinstitute.org/gatk/, RRID:SCR_001876). 17 According to instructions of GATK best practice, 18 Indelrealigner and RealignerTargetCreator in GATK toolkits were utilized to perform reads realignment around regions of apparent indels. Base quality score recalibration (BQSR) process was then conducted using GATK BaseRecalibrator and ApplyBQSR. Short somatic variants (SNPs and INDELs) were identified and filtered using Strelka2 between tumor and matched adjacent noncancerous samples. Detected mutations were then annotated with ANNOVAR (http://www.openbioinformatics.org/annovar/, RRID:SCR_012821). All annotated variants were gathered and summarized using the R package maftools.
2.5. Copy number variation detection
Copy number variations were detected using CNV‐Facets, 19 and tumor purity and ploidy levels were estimated simultaneously. CNV hotspots were detected, and CNV results were summarized using GISTIC2(http://www.mmnt.net/db/0/0/ftp‐genome.wi.mit.edu/distribution/GISTIC2.0,RRID:SCR_000151). 20
2.6. Mutation spectrum and mutation signature analysis
To extract single base substitutions (SBS) signatures, a matrix of mutational spectrum with 96 elements (based on six base substitutions (C>A, C>G, C>T, T>A, T>C, and T>G) within 16 possible combinations of up and down stream bases for each substitution) was extracted from somatic SNVs using Mutational Signatures in Cancer (MuSiCa) software. Then de‐novo SBS signatures were extracted using nonnegative matrix factorization (NMF) method in MuSiCa. 21 Cosine similarity between de‐novo SBS signatures and 30 known COSMIC cancer signatures (https://cancer.sanger.ac.uk/cosmic/signatures) were calculated to illustrate potential functions and ontologies of these signatures. For each sample, proportions of signatures were calculated using MuSiCa and samples were then clustered.
2.7. TMB and MSI analysis
For each sample, TMB was uniformly calculated as the number of nonsynonymous mutations per megabase (Mb) of targeted exomic regions with at least 50× coverage.
To determine the MSI status, MSIsensor algorithm (https://github.com/ding‐lab/msisensor, RRID:SCR_006418) was applied 22 to calculate the percentage of unstable microsatellite loci in the tumor genome compared to its matched normal genome. The reference genome was systematically scanned by MSIsensor to identify and mark microsatellite sites. Subsequently, the distribution of simple repeat elements covering these microsatellites was calculated in both the normal and tumor samples. Microsatellite instability was inferred by assessing the differences in the distribution of repeat elements using the Chi‐Squared test. The proportion of unstable microsatellites was then computed, and the MSI level was determined by examining the distribution of unstable microsatellite proportions across all cohorts. MSIsensor score ≥10 was validated in colorectal cancers to separate MSI‐H from MSS tumors identified by IHC and/or PCR with a high accuracy. 23
2.8. Statistical analysis
Median OS was analyzed by the Kaplan–Meier method and compared using the log‐rank test. The association of mutation with OS was analyzed using univariate analysis and multivariate analysis with the Cox proportional hazards model. Age, gender, pathologic stage, differentiation, lymphatic metastasis, margin, habit of drinking alcohol and smoking were added as covariates in univariate and multivariate Cox analysis. Among the above variates, p value of age and differentiation was <0.05. Resection margins status and tumor stage are previously reported prognostic factors affecting survival of EHCC. 24 To make sure variables were weighed, age, pathologic stage, differentiation, and margin were selected as variates for analysis of cancer related genes, TMB and MSI associated with EHCC overall survival using multivariate Cox proportional hazards regression, even though the p values of margins status and tumor stage were not significant. For continuous variables, hypothesis testing was performed by Student's paired t‐tests or Wilcoxon matched‐pairs signed‐rank test. Statistical analyses were carried out using R (v.3.4.1). A 2‐side p value <0.05 was considered statistically significant.
3. RESULTS
3.1. Clinicopathological characteristics and sequence data of patients with EHCC
The cohort contained tumor samples of 37 therapy naïve cases from PUMCH (Table S1). The demographics and clinicopathological information are shown in Table 1. The longest survival time of patients in this cohort was 50 months, the shortest was 4 months, and the median was 23 months. Age, disease stage, tumor differentiation, and margins were correlated to OS in univariate Cox regression analysis (p < 0.2). Thus, these factors were selected as covariates for adjusting the subsequent gene alterations in the multivariate Cox proportional hazards regression model. As anticipated, poorly tumor differentiation was associated with shorter OS (Table 1).
TABLE 1.
Baseline patient and tumor characteristics (n = 37).
| Characteristic | No. of patients | % | Univariate HR | 95% CI | p | Multivariate HR* | 95% CI | p |
|---|---|---|---|---|---|---|---|---|
| Age | 37 | 1.1 | 1–1.1 | 0.0081 | 1.05 | 1.0–1.1 | 0.065 | |
| Mean | 60 ± 8.83 | |||||||
| Median | 61 | |||||||
| Gender | 37 | |||||||
| Female | 21 | 56.8 | 1 | Reference | – | 1 | Reference | – |
| Male | 16 | 43.2 | 0.93 | 0.48–1.8 | 0.84 | 0.68 | 0.25–1.8 | 0.441 |
| Stage at diagnosis | ||||||||
| I | 9 | 24.3 | 1 | Reference | – | 1 | Reference | – |
| II | 22 | 59.4 | 1.1 | 0.51–2.4 | 0.82 | |||
| III | 6 | 16.2 | 4.2 | 1.5–11 | 0.0051 | 3.66 | 0.75–17.8 | 0.107 |
| Differentiation | ||||||||
| High | 8 | 21.6 | 1 | Reference | – | 1 | Reference | – |
| High or moderate | 7 | 18.9 | 1.9 | 0.85–4.2 | 0.12 | |||
| Moderate | 8 | 21.6 | 3.2 | 1.6–6.6 | 0.0013 | 4.34 | 1.69–11.2 | 0.002 |
| Moderate or low | 10 | 27.0 | 4.3 | 2–9.3 | 0.00025 | |||
| Low | 4 | 10.8 | 1.9 | 0.66–5.5 | 0.24 | |||
| Lymphatic_Metastasis | ||||||||
| No | 26 | 70.3 | 1 | Reference | – | 1 | Reference | – |
| Yes | 11 | 29.7 | 1.3 | 0.63–2.7 | 0.48 | 0.81 | 0.25–2.6 | 0.729 |
| Margin | ||||||||
| Negative | 25 | 67.6 | 1 | Reference | – | 1 | Reference | – |
| Positive | 12 | 32.4 | 1.9 | 0.94–3.9 | 0.076 | 0.89 | 0.34–2.3 | 0.807 |
| Alcohol | ||||||||
| Never | 7 | 18.9 | 1 | Reference | – | 1 | Reference | – |
| Ever | 30 | 81.1 | 0.64 | 0.27–1.5 | 0.3 | 0.70 | 0.20–2.4 | 0.568 |
| Smoking | ||||||||
| Never | 14 | 37.8 | 1 | Reference | – | 1 | Reference | – |
| Ever | 23 | 62.2 | 1 | 0.53–2 | 0.9 | 2.60 | 1.0–6.8 | 0.051 |
Abbreviation: HR, hazard ratio.
The multivariate Cox proportional hazards regression model was adjusted for age, gender, pathologic stage, differentiation, Lymphatic Metastasis, Margin, habit of drinking alcohol, and smoking.
3.2. The landscape of mutation in Chinese patients with EHCC
In total, 8962 somatic mutations and 7517 nonsynonymous somatic mutations in 5627 genes were identified from the 37 patients with EHCC by whole‐exome sequencing (Figure S1; Table S2). The median number of mutations per sample was 112. The most frequently altered gene was MUC16 (49%), followed by TP53 (49%), TTN (43%), MUC4 (30%), and OBSCN (24%) (Figure S1; Table S2). The genes with a mutation frequency greater than 16% contained six tumor suppressor genes and three oncogenic genes annotated by OncoKB (www.oncokb.org), 25 including TP53 (48.6%), ANKRD11 (22%), ERBB2 (22%), SPEN (22%), KDM5A (22%), FAT1 (19%), FBXW7 (16%), KMT2D (16%), and KRAS (16%), among which CNV‐driving alterations were observed in the oncogenic genes ERBB2, KDM5A, and KRAS and tumor suppressor genes ANKRD11 and FAT1 (Figure 1). The alterations of KRAS included mutation and amplification, with a frequency of 16.2% in our cohort (Table 2). After adjusting for age, disease stage, tumor differentiation, and margins in a Cox proportional hazards model, mutations in ERBB2 were significantly associated with better prognosis (a median of 27 months with ERBB2 mutant tumor, 95% CI: 4.8–49.2 months vs. a median of 20 months with ERBB2 wild‐type tumor, 95% CI: 14.7–25.3 months), and mutations in KRAS were significantly associated with worse prognosis (a median of 15 months with KRAS mutant tumor, 95% CI: 9.4–20.6 months vs. a median of 27 months with KRAS wild type tumor, 95% CI: 19.5–34.5 months), which showed in Table 2; Table S3.
FIGURE 1.
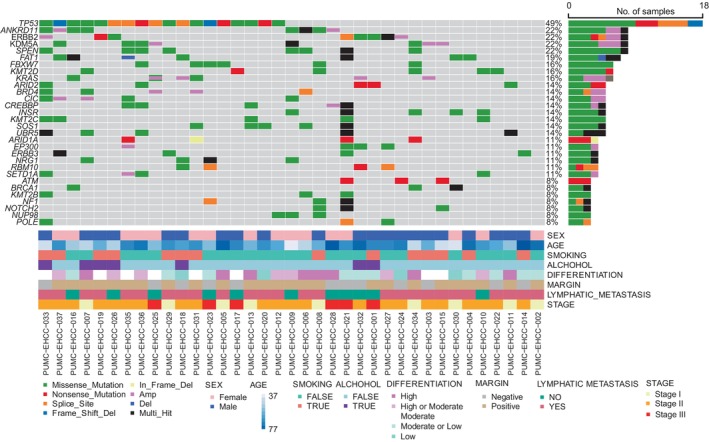
The landscape of somatic alterations in cancer related genes annotated by OncoKB. The cancer‐related genes annotated by OncoKB with the mutations are listed on the left‐side and the mutation status of the recurrently mutated genes for each tumor was showed in middle plot. Each column represents a sample. The right bar plot summarizes the ratio of different mutation types. Different colors refer to mutational types and clinicopathologic characteristics at low panel.
TABLE 2.
Analysis of cancer‐related genes, TMB and MSI associated with EHCC overall survival.
| Variable | No. of patients | % | Multivariate HR* (95% CI) | p | |
|---|---|---|---|---|---|
| ERBB2 | WT | 29 | 78.4 | Reference | |
| Mutant & amplification | 8 | 21.6 | 0.2 (0.077–0.54) | 0.001 ## | |
| KARS | WT | 31 | 83.8 | Reference | |
| Mutant & amplification | 6 | 16.2 | 3.6 (1.29–10.2) | 0.014 # | |
| TMB | Bottom 20% | 8 | 21.6 | Reference | |
| Top 80% | 29 | 78.4 | 0.46 (0.16–1.3) | 0.14 | |
| MSI | Bottom 20% | 8 | 21.6 | Reference | |
| Top 80% | 29 | 78.4 | 0.16 (0.056–0.46) | <0.001 ## | |
| MSI_TMB | Other | 13 | 35.1 | Reference | |
| MSI top 80% & TMB Nonsynonymous 80% | 24 | 64.9 | 0.21 (0.079–0.58) | 0.002 ## | |
Abbreviation: HR, hazard ratio.
The multivariate Cox proportional hazards regression model was adjusted for covariates with p < 0.05 in univariate analysis and variables that are known to affect prognosis of EHCC even though the p values were not significant here, which including age, pathologic stage, differentiation, and margin.
p < 0.05 in multivariate Cox proprotional hazards analysis.
p < 0.01 in mutivariate Cox proportional hazards analysis.
3.3. Actionable genomic alterations and targeted therapies
A total of 29.7% of patients (11/37) had one actionable genetic alteration that mainly caused gain of function and truncating mutations, which were classified as level 3B or 4 according to OncoKB classification (Table 3). These included oncogenic somatic alterations in ERBB2 (three patients), KRAS (three patients), ARID1A (three patients), PIK3CA (one patient), and SF3B1 (one patient). ERBB2 amplification was also observed in two patients (Figure 1; Table 3).
TABLE 3.
Potential actionable alteration levels of 37 EHCC sample in OncoKB database.
| Actionable gene | Alteration | Number of patients | Mutation effect | Therapeutic level | Drug |
|---|---|---|---|---|---|
| ERBB2 | S310F | 2 | Gain‐of function | 3B |
Ado‐Trastuzumab Emtansine Trastuzumab Deruxtecan Neratinib |
| R678Q | 1 | Gain‐of‐function | |||
| ARID1A | R1989X | 3 | Truncating Mutations | 4 |
Tazemetostat PLX2853 |
| KRAS | G12V | 1 | Gain‐of‐function | 3B/4 |
Adagrasib Cobimetinib Binimetinib Trametinib |
| G13D | 1 | Gain‐of‐function | |||
| A146V | 1 | Gain‐of‐function | |||
| PIK3CA | E545K | 1 | Gain‐of‐function | 3B | Alpelisib + Fulvestrant |
| SF3B1 | K700E | 1 | Switch‐of‐function | 4 | H3B‐8800 |
3.4. TMB and MSI are associated with improved OS
The association between nonsynonymous somatic TMB and OS of EHCC was examined. Because the median and range of TMB vary across tumor types, a given numeric value of TMB, such as patients whose TMB ≥10, which is grouped as high TMB in NSCLC cohorts, is not applicable as a universal cut‐off for other type of tumor. 26 In our cohort, 35.1% of patients (n = 13) have tumors with TMB ≥10 (Table S1). We stratified tumors by TMB decile and identified TMB value thresholds by investigating the association between TMB subgroups and the OS of patients under univariate Cox analysis. We found that the cut‐off value of TMB in the range among the top 90%, 80%, and 70% could effectively separate patients with high and low level of TMB (Table S4). In addition, a significant association was found between the OS of EHCC and a variety of cut‐off points defined by the decile of the MSIsensor score (Table S5). The top 80% of TMB values (≥3.47 mutations per megabase) and top 80% of MSIsensor score (MSIsensor score ≥0.36), both of which showed the lowest p values in univariate Cox analysis, were served as a watershed to separately divide the patients into two subgroups for the subsequent multivariate analysis. Typically, MSIsensor score ≥ 10 was defined as MSI‐high which showed a high concordance in validation by MSI PCR and/or MMR immunohistochemistry for colorectal cancers and uterine endometrioid cancer. 23 In our cohort, six patients (16.2%) with MSIsensor scores ≥10 were found.
The mean OS of TMB ≥3.47 versus TMB <3.47 was 27.6 months (95% CI: 22.1–33.1) versus 18.2 months (95% CI: 15.4–21.1), respectively, and the median OS of TMB ≥3.47 versus TMB <3.47 was 27 months (95% CI: 23.5–30.5) versus 18 months (95% CI: 12.5–23.5), respectively. It was found that TMB ≥3.47 was significantly associated with improved OS (log‐rank test, p = 0.015) (Figure 2A). However, in multivariate Cox analysis, TMB ≥3.47 did not show a significant association with the OS of EHCC (Table 2, HR = 0.46, 95% CI: 0.16–1.3, p = 0.14).
FIGURE 2.
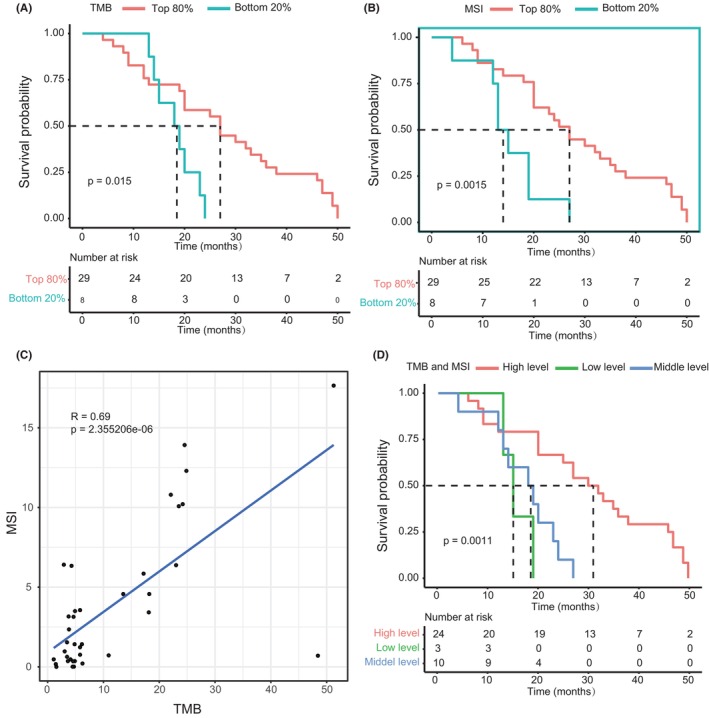
Improved OS in patients with high TMB and high MSI. (A) OS curves of top 80% of TMB and bottom 20% of TMB groups (p = 0.015). (B) OS curves of top 80% of MSIsensor score and bottom 20% of MSIsensor score groups (p = 0.0015). (C) The positive relation of MSI and TMB (R = 0.69). (D) OS curves of three TMB and MSI status (p = 0.001). Log‐rank test was used to calculate p value. OS, overall survival.
The mean OS of top 80% of MSIsensor score versus bottom 20% of MSIsensor score was 28.4 months (95% CI: 23.3–33.6) versus 15.3 months (95% CI: 10.6–19.9), respectively. The OS of EHCC was significantly longer in patients with top 80% of MSIsensor score (median of 27 months, 95% CI: 21.7–32.2) than in those with bottom 20% of MSIsensor score (median of 13 months, 95% CI: 10.2–15.8, Figure 2B, log‐rank test, p = 0.0015). We observed a 6.25‐fold decrease in mortality risk for cases with top 80% of MSIsensor score in multivariate Cox proportional hazards model (HR, 0.16; 95% CI: 0.056–0.46; p < 0.001; Table 2).
Nevertheless, when both TMB and MSI were enrolled as confounders in the multivariate analysis of OS (Table S6), top 80% of MSIsensor score was significantly correlated to OS, and top 80% of TMB values was not, indicating that TMB was not significantly associated with OS at a circumstance of MSI as a covariate. Then, we checked the collinearity of these two factors. A considerable collinearity relationship was observed between TMB and MSI (R = 0.69, p = 2.355206e‐06, Figure 2C). In line with that, both TMB and MSI belong to the top 80%, named as MSI_TMB, was significantly associated with lower mortality risk, as determined by multivariate Cox analysis (HR, 0.21; 95% CI: 0.079–0.58; p < 0.002; Table 2). To further dissect the effect of TMB and MSI on OS, we divided patients into three different groups as follows: (1) high level: both TMB and MSI belong to the top 80%; (2) low level: both TMB and MSI belong to the bottom 20%; and (3) middle level: others. The difference in OS was found significant among these groups (log‐rank test, p = 0.001, Figure 2D), showing that patients with both TMB and MSI belong to the top 80% had the best OS.
3.5. Mutational signatures of Chinese patients with EHCC
Further, four mutational signatures were identified (Figure 3A). By comparing with the COSMIC signatures, we found that signature 1 is similar to COSMIC signature S6, which is related to defective DNA mismatch repair (similarity = 0.755). Signature 4 is similar to COSMIC signature S1, which is related to spontaneous deamination of 5‐methylcytosine (similarity = 0.753). Signatures 2 and 3 were similar to COSMIC signatures S5 and S58, respectively, which are related to unknown mutation processes or sequencing artifacts. The proportions of somatic mutations in the four mutation signatures for each individual and the corresponding TMB and MSI values are shown in Figure 3B. The samples clustered according to the proportional contribution of each signature per sample and were divided into two signature clusters, with signature 1 and signature 4 dominating each (Figure 3B).
FIGURE 3.
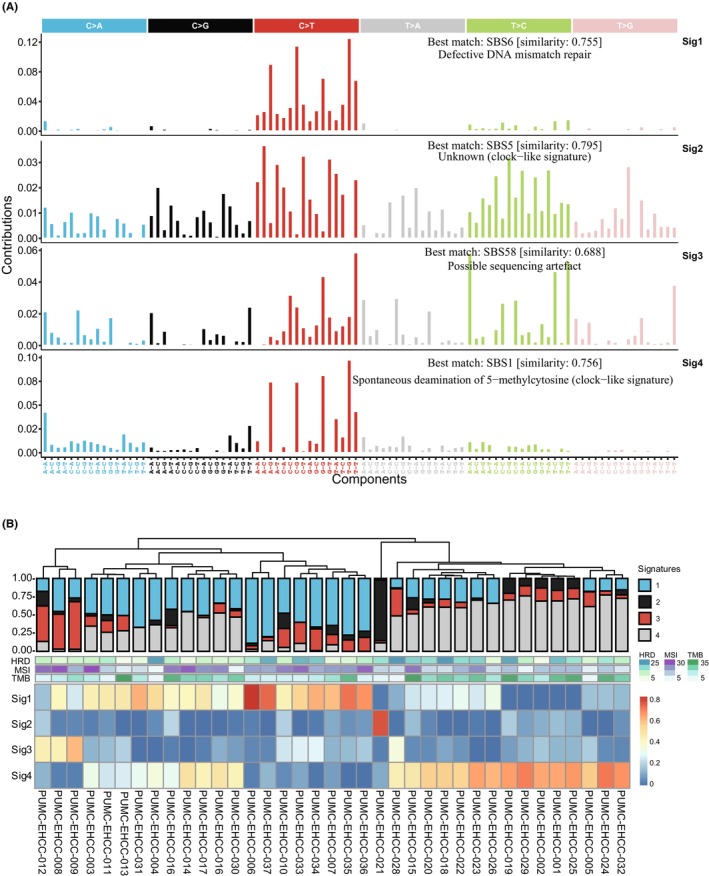
Profile of mutational signatures in 37 EHCC patients. (A) Four mutation signatures detected in EHCC (sig1–sig4), annotated with the corresponding COSMIC signature determined by cosine similarity. Sig 1 (COSMIC signature 6, cosine similarity = 0.755), Sig2 (COSMIC signature 5, cosine similarity = 0.792), Sig3 (COSMIC signature 58, cosine similarity = 0.686), and Sig4 (COSMIC signature 1, cosine similarity = 0.753). (B) Proportions of somatic mutations in 4 mutation signatures for each individual (top) and status of HRD, MSI and TMB enrichment (middle). The samples clustered by hierarchical cluster analysis according to the proportional contribution of each signature per sample (bottom). Sig, signature.
COSMIC signature 6 is strongly associated with the inactivation of DNA mismatch repair genes in colorectal cancer. Furthermore, we studied the clinical implication of DDR‐related genes in EHCC. In particular, we focused on the DNA damage repair pathway, and the DDR gene list was from the work of Arai et al. 27 A total of 40.5% of patients (15/37) had 19 nonsynonymous mutations in DDR‐related genes, among which ATM (8%), CDK12 (8%), and BRCA1 (8%) were the most frequently mutated genes. All the alterations in ATM were nonsense mutations (Figure S2A), and ATM mutations showed a significant association with better OS (Table S7). There was no significant difference between HRD scores of the DDR mutant and wild‐type (t‐test, p = 0.92). The association of the mutation in a group of DNA damage repair genes with survival probability was analyzed by multiple value Cox analysis (Figure S2B). The results showed that mutations in a group of DNA damage repair genes did not significantly influence the survival probability of EHCC (HR = 0.59, 95% CI: 0.14–2.4, p = 0.462).
4. DISCUSSION
The incidence rate of EHCC in the Asian population is higher than that in Europe and America, and its pathogenesis is not clear. 28 It is also a challenge to predict and improve the clinical outcome of patients with EHCC, possibly due to sample rarity, tumor heterogeneity, poorly understood pathophysiology, and lack of actionable driver events. 29 Here, we described the genomic characteristics of Chinese patients with EHCC and unraveled distinct genomic features with potential clinical implications, optimal TMB and MSI threshold associated with better survival, mutational signatures related to etiology and potentially actionable targets. These results enlighten precise treatment strategies for EHCC.
In this study, we reported for the first time that 49% of patients had MUC16 mutations. MUC16 is an important biomarker for the early diagnosis of epithelial ovarian cancer. 30 The abnormal expression of MUC16 is remarkably associated with the poor prognosis of many cancers. 31 , 32 Recently, it is reported that patients with MUC16 mutations have a higher tumor mutation load and neoantigen load, and are more responsive to immunotherapy. 33 , 34 Besides, the combined mutation status of MUC4, MUC16, and TTN showed the potential to predict TMB and immunotherapy efficacy in gastric cancer and pan cancer. 35 The alteration frequencies of TTN (43%) and MUC4 (30%) in EHCC were also considerably notable in our study, suggesting that MUC4, MUC16, and TTN may be associated with immunotherapy efficacy of EHCC.
Many previous studies have proven that TP53, KRAS, ERBB2, and SMAD4 have high mutation frequencies in EHCC, 5 , 6 , 7 , 36 among which alterations in TP53 and KRAS have been reported to be significantly associated with poor prognosis. 36 , 37 , 38 , 39 Similarly, in our cohort, the mutation frequencies of TP53 (49%), ERBB2 (22%), and KRAS (16%) were relatively high compared with those of other mutated genes. Although the mutation frequency of KRAS in our cohort was lower than that in other researches, 5 , 6 , 7 , 40 alteration of KRAS was significantly associated with the poor prognosis of EHCC. Moreover, mutation of ERBB2 in our study was positively related to a longer OS of EHCC, which is contrary to its oncogenic mutation type found in our cohort.
To date, it is still lack of targeted agents for patients with EHCC. We found ERBB2 and KRAS mutation in EHCC were actionable targets. ERBB2 and KRAS are key genes in the RTK‐RAS pathway, and both of them could be classified as level 3B actionable genomic alterations in OncoKB, defined as standard care or investigational biomarkers predictive of response to an FDA‐approved or investigational drug in another indication. 41 Level 1 genetic alterations predictive of response to an FDA‐approved drug in CCA are oncogenic mutations in IDH1, FGFR2 fusions, and NTRK1 fusions. However, these genetic alterations were not found in our study.
The main hotspot mutation of ERBB2 in our cohort was the S310F missense mutation, which is an active mutation sensitive to irreversible dual EGFR/HER2 inhibitors. 42 Anti‐HER2 targeted therapy in patients with ERBB2 amplification have shown effectiveness in cholangiocarcinoma. 43 At present, a clinical trial (NCT03093870) is ongoing to investigate the safety and efficacy of capecitabine in combination with varlitinib, an inhibitor of EGFR, HER2 and HER4, for the treatment of biliary tract cancer. Molecular profiling for EHCC highlighted that EHCC is enriched with actionable mutations. Genomic‐driven targeted therapy is promising for improving patient outcomes and contributing to the clinical management of patients suffering with refractory EHCC.
Unexpectedly, we also demonstrated that the top 80% of MSIsensor score (MSIsensor score ≥0.36) in our cohort can be used as a prognostic indicator for patients with EHCC. MSIsensor score of 35.1 was found in one tumor (0.5%) and identified as MSI‐high from a cohort of 195 CCA patients (78% intrahepatic and 22% extrahepatic cholangiocarcinoma). 44 Recently, the percentages of PD‐L1 overexpression, MSI‐High, and TMB‐High were investigated in CCA, in which EHCCs had a lower prevalence (6.9%). 11 TMB and MSI levels have been shown to be associated with the immunotherapy efficacy and prognosis of various cancers. Although the prognostic significance of MSI‐High has been reported in CCA, 45 whether TMB and MSI contribute to the survival of EHCC has not been reported. The median TMB in our cohort was 4.91 Mut/Mb, which was higher than the previously reported median TMB determined by WES, which was 1.23 (0.7–2.34) Mut/Mb in CCA. 39 29.4% of patients have tumors with TMB ≥10 muts/Mb are grouped as TMB‐High in NSCLC cohorts. 26 In a study of 3634 CCA patients, only 118 and 47 cases had TMB >10 and >20 mut/mb, respectively. 46 Besides, MSI‐high was rare in CCA (1%) and EHCC (0%–2%). 6 , 11 , 46 In our cohort, a TMB ≥10 muts/Mb was seen in 35.1% of tumors (n = 13). The percentage of TMB ≥10 mut/mb in our research was higher than previous research results of EHCC (7.5%), 6 which may attribute to small sample size of our study. After multivariate analysis, we found that the top 80% of MSIsensor score was significantly correlated with prognosis, whereas there was no significant association between top 80% of TMB in our cohort and prognosis. Our study showed that patients with both TMB and MSI belong to the top 80% had longer OS. Therefore, it needs to be further demonstrated whether TMB can be used to judge the prognosis of patients with EHCC, and it is valuable to study whether EHCC patients with TMB‐High and MSI‐High are responsive to immune checkpoint inhibitors targeting PD‐1/PD‐L1.
In cancer genome, different mutational signatures formed during a variety of mutational processes, which were strongly associated with the epidemiological and biological features of particular cancer types. By comparison in COSMIC databases, the major mutation signature in our cohort is COSMIC signature 6, which is associated with DNA mismatch repair defects. 47 MSI can result from defective DNA mismatch repair, and MSI‐high was strongly associated with prolonged survival in our cohort. However, the mutated DNA damage repair genes in our study were not prognostic. Along with the previous observation in cholangiocarcinoma, 39 , 48 we found that signature 4 is similar to COSMIC signature 1, which is related to the spontaneous deamination of 5‐methylcytosine. 47 The study of these mutation signatures will be helpful to deepen the understanding of the etiology of EHCC in Chinese individuals.
In conclusion, our study found mutations in ERBB2 and KRAS were prognostic factors for the overall survival of EHCC. Besides, overall survival was significantly longer in patients with both TMB and MSI belong to the top 80%. We posed that ERBB2 was one of the most prospective actionable targets of EHCC. In our study, we present a broad perspective to understand the molecular traits of EHCC for Chinese patients and offer valuable information for further in‐depth study on EHCC. Due to a small sample size in our research might cause bias in the data, study of large EHCC cohort need to be conducted in future.
AUTHOR CONTRIBUTIONS
Bao Jin: Data curation (equal); formal analysis (equal); investigation (equal); writing – original draft (equal). Yuxin Wang: Data curation (equal); formal analysis (equal); investigation (equal); writing – original draft (equal). Baoluhe Zhang: Data curation (equal); formal analysis (equal); investigation (equal). Haifeng Xu: Resources (equal). Xin Lu: Resources (equal). Xin‐Ting Sang: Resources (equal). Wenze Wang: Investigation (equal). Yilei Mao: Resources (equal). Pengxiao Chen: Validation (equal); visualization (equal); writing – review and editing (equal). Shun Wang: Validation (equal); visualization (equal); writing – review and editing (equal). Zhirong Qian: Conceptualization (equal); supervision (equal); validation (equal); visualization (equal). Yingyi Wang: Conceptualization (equal); funding acquisition (equal); resources (equal); supervision (equal). Shunda Du: Conceptualization (equal); funding acquisition (equal); resources (equal); supervision (equal).
FUNDING INFORMATION
This work was supported by the National Natural Science Foundation of China (Grant No. 81972698) and Chen Xiao‐Ping Foundation for the Development of Science and Technology of Hubei Province (Grant No. CXPJJH11900001‐2019215).
CONFLICT OF INTEREST STATEMENT
The authors have no conflict of interest to declare.
ETHICS STATEMENT
The studies involving human participants were reviewed and approved by Medical Ethics Committee of Peking Union Medical College Hospital (PUMCH). Written informed consent was obtained from the individual(s), and minor(s)’ legal guardian/next of kin, for the publication of any potentially identifiable images or data included in this article.
Supporting information
figure legend.
Table S1.
Table S2.
Table S3.
Table S4.
Table S5.
Table S6.
Table S7.
Figure S1.
Figure S2.
Jin B, Wang Y, Zhang B, et al. Immune checkpoint inhibitor‐related molecular markers predict prognosis in extrahepatic cholangiocarcinoma. Cancer Med. 2023;12:20470‐20481. doi: 10.1002/cam4.6441
Bao Jin and Yuxin Wang contributed equally to this work.
Contributor Information
Yingyi Wang, Email: wangyingyi@pumch.cn.
Shunda Du, Email: dushd@pumch.cn.
DATA AVAILABILITY STATEMENT
Data sharing is not applicable to this article as no new data were created or analyzed in this study.
REFERENCES
- 1. Primrose JN, Fox RP, Palmer DH, et al. Capecitabine compared with observation in resected biliary tract cancer (BILCAP): a randomised, controlled, multicentre, phase 3 study. Lancet Oncol. 2019;20:663‐673. [DOI] [PubMed] [Google Scholar]
- 2. Valle JW, Lamarca A, Goyal L, Barriuso J, Zhu AX. New horizons for precision medicine in biliary tract cancers. Cancer Discov. 2017;7:943‐962. [DOI] [PMC free article] [PubMed] [Google Scholar]
- 3. Abou‐Alfa GK, Macarulla T, Javle MM, et al. Ivosidenib in IDH1‐mutant, chemotherapy‐refractory cholangiocarcinoma (ClarIDHy): a multicentre, randomised, double‐blind, placebo‐controlled, phase 3 study. Lancet Oncol. 2020;21:796‐807. [DOI] [PMC free article] [PubMed] [Google Scholar]
- 4. Abou‐Alfa GK, Sahai V, Hollebecque A, et al. Pemigatinib for previously treated, locally advanced or metastatic cholangiocarcinoma: a multicentre, open‐label, phase 2 study. Lancet Oncol. 2020;21:671‐684. [DOI] [PMC free article] [PubMed] [Google Scholar]
- 5. Montal R, Sia D, Montironi C, et al. Molecular classification and therapeutic targets in extrahepatic cholangiocarcinoma. J Hepatol. 2020;73:315‐327. [DOI] [PMC free article] [PubMed] [Google Scholar]
- 6. Xue L, Guo C, Zhang K, et al. Comprehensive molecular profiling of extrahepatic cholangiocarcinoma in Chinese population and potential targets for clinical practice. Hepatobiliary Surg Nutr. 2019;8:615‐622. [DOI] [PMC free article] [PubMed] [Google Scholar]
- 7. Lee H, Wang K, Johnson A, et al. Comprehensive genomic profiling of extrahepatic cholangiocarcinoma reveals a long tail of therapeutic targets. J Clin Pathol. 2016;69:403‐408. [DOI] [PubMed] [Google Scholar]
- 8. Lee DW, Han SW, Bae JM, et al. Tumor mutation burden and prognosis in patients with colorectal cancer treated with adjuvant fluoropyrimidine and oxaliplatin. Clin Cancer Res. 2019;25:6141‐6147. [DOI] [PubMed] [Google Scholar]
- 9. Barroso‐Sousa R, Keenan TE, Pernas S, et al. Tumor mutational burden and PTEN alterations as molecular correlates of response to PD‐1/L1 blockade in metastatic triple‐negative breast cancer. Clin Cancer Res. 2020;26:2565‐2572. [DOI] [PMC free article] [PubMed] [Google Scholar]
- 10. Le DT, Kim TW, Van Cutsem E, et al. Phase II open‐label study of pembrolizumab in treatment‐refractory, microsatellite instability‐high/mismatch repair‐deficient metastatic colorectal cancer: KEYNOTE‐164. J Clin Oncol. 2020;38:11‐19. [DOI] [PMC free article] [PubMed] [Google Scholar]
- 11. Weinberg BA, Xiu J, Lindberg MR, et al. Molecular profiling of biliary cancers reveals distinct molecular alterations and potential therapeutic targets. J Gastrointest Oncol. 2019;10:652‐662. [DOI] [PMC free article] [PubMed] [Google Scholar]
- 12. Zhang W, Shi J, Wang Y, et al. Next‐generation sequencing‐guided molecular‐targeted therapy and immunotherapy for biliary tract cancers. Cancer Immunol Immunother. 2021;70:1001‐1014. [DOI] [PMC free article] [PubMed] [Google Scholar]
- 13. Piha‐Paul SA, Oh DY, Ueno M, et al. Efficacy and safety of pembrolizumab for the treatment of advanced biliary cancer: results from the KEYNOTE‐158 and KEYNOTE‐028 studies. Int J Cancer. 2020;147:2190‐2198. [DOI] [PubMed] [Google Scholar]
- 14. Kim RD, Chung V, Alese OB, et al. A phase 2 multi‐institutional study of nivolumab for patients with advanced refractory biliary tract cancer. JAMA Oncol. 2020;6:888‐894. [DOI] [PMC free article] [PubMed] [Google Scholar]
- 15. Gampawar P, Saba Y, Werner U, Schmidt R, Muller‐Myhsok B, Schmidt H. Evaluation of the performance of AmpliSeq and SureSelect exome sequencing libraries for ion proton. Front Genet. 2019;10:856. [DOI] [PMC free article] [PubMed] [Google Scholar]
- 16. Firnkorn D, Knaup‐Gregori P, Lorenzo Bermejo J, Ganzinger M. Alignment of high‐throughput sequencing data inside in‐memory databases. Stud Health Technol Inform. 2014;205:476‐480. [PubMed] [Google Scholar]
- 17. Wu X, Gao X, Han P, Zhou Y. Identification of causative variants in patients with non‐syndromic hearing loss in the Minnan region, China by targeted next‐generation sequencing. Acta Otolaryngol. 2019;139:243‐250. [DOI] [PubMed] [Google Scholar]
- 18. Kojima K, Kawai Y, Misawa K, Mimori T, Nagasaki M. STR‐realigner: a realignment method for short tandem repeat regions. BMC Genomics. 2016;17:991. [DOI] [PMC free article] [PubMed] [Google Scholar]
- 19. Shen R, Seshan VE. FACETS: allele‐specific copy number and clonal heterogeneity analysis tool for high‐throughput DNA sequencing. Nucleic Acids Res. 2016;44:e131. [DOI] [PMC free article] [PubMed] [Google Scholar]
- 20. Mermel CH, Schumacher SE, Hill B, Meyerson ML, Beroukhim R, Getz G. GISTIC2.0 facilitates sensitive and confident localization of the targets of focal somatic copy‐number alteration in human cancers. Genome Biol. 2011;12:R41. [DOI] [PMC free article] [PubMed] [Google Scholar]
- 21. Díaz‐Gay M, Vila‐Casadesús M, Franch‐Expósito S, Hernández‐Illán E, Lozano JJ, Castellví‐Bel S. Mutational Signatures in Cancer (MuSiCa): a web application to implement mutational signatures analysis in cancer samples. BMC Bioinformatics. 2018;19:224. [DOI] [PMC free article] [PubMed] [Google Scholar]
- 22. Niu B, Ye K, Zhang Q, et al. MSIsensor: microsatellite instability detection using paired tumor‐normal sequence data. Bioinformatics. 2014;30:1015‐1016. [DOI] [PMC free article] [PubMed] [Google Scholar]
- 23. Middha S, Zhang L, Nafa K, et al. Reliable pan‐cancer microsatellite instability assessment by using targeted next‐generation sequencing data. JCO precis Oncologia. 2017;1:PO.17.00084. [DOI] [PMC free article] [PubMed] [Google Scholar]
- 24. Pattanathien P, Khuntikeo N, Promthet S, Kamsa‐Ard S. Survival rate of extrahepatic cholangiocarcinoma patients after surgical treatment in Thailand. Asian Pac J Cancer Prev. 2013;14:321‐324. [DOI] [PubMed] [Google Scholar]
- 25. Chakravarty D, Gao J, Phillips S, et al. OncoKB: a precision oncology Knowledge Base. JCO precis. Oncologia. 2017;1:PO.17.00011. [DOI] [PMC free article] [PubMed] [Google Scholar]
- 26. Shi Y, Lei Y, Liu L, et al. Integration of comprehensive genomic profiling, tumor mutational burden, and PD‐L1 expression to identify novel biomarkers of immunotherapy in non‐small cell lung cancer. Cancer Med. 2021;10:2216‐2231. [DOI] [PMC free article] [PubMed] [Google Scholar]
- 27. Arai H, Elliott A, Xiu J, et al. The landscape of alterations in DNA damage response pathways in colorectal cancer. Clin Cancer Res. 2021;27:3234‐3242. [DOI] [PubMed] [Google Scholar]
- 28. Li Y, Li DJ, Chen J, et al. Expression of Laminingamma2 in extrahepatic cholangiocarcinoma tissues and its influence on tumor invasion and metastasis. Asian Pac J Cancer Prev. 2015;16:2099‐2102. [DOI] [PubMed] [Google Scholar]
- 29. Mukkamalla SKR, Naseri HM, Kim BM, Katz SC, Armenio VA. Trends in incidence and factors affecting survival of patients with cholangiocarcinoma in the United States. J Natl Compr Canc Netw. 2018;16:370‐376. [DOI] [PubMed] [Google Scholar]
- 30. Funston G, Hamilton W, Abel G, Crosbie EJ, Rous B, Walter FM. The diagnostic performance of CA125 for the detection of ovarian and non‐ovarian cancer in primary care: a population‐based cohort study. PLoS Med. 2020;17:e1003295. [DOI] [PMC free article] [PubMed] [Google Scholar]
- 31. Wang S, You L, Dai M, Zhao Y. Mucins in pancreatic cancer: a well‐established but promising family for diagnosis, prognosis and therapy. J Cell Mol Med. 2020;24:10279‐10289. [DOI] [PMC free article] [PubMed] [Google Scholar]
- 32. Cui Y, Chen H, Xi R, et al. Whole‐genome sequencing of 508 patients identifies key molecular features associated with poor prognosis in esophageal squamous cell carcinoma. Cell Res. 2020;30:902‐913. [DOI] [PMC free article] [PubMed] [Google Scholar]
- 33. Li X, Pasche B, Zhang W, Chen K. Association of MUC16 mutation with tumor mutation load and outcomes in patients with gastric cancer. JAMA Oncol. 2018;4:1691‐1698. [DOI] [PMC free article] [PubMed] [Google Scholar]
- 34. Zhang L, Han X, Shi Y. Association of MUC16 mutation with response to immune checkpoint inhibitors in solid tumors. JAMA Netw Open. 2020;3:e2013201. [DOI] [PMC free article] [PubMed] [Google Scholar]
- 35. Yang Y, Zhang J, Chen Y, Xu R, Zhao Q, Guo W. MUC4, MUC16, and TTN genes mutation correlated with prognosis, and predicted tumor mutation burden and immunotherapy efficacy in gastric cancer and pan‐cancer. Clin Transl Med. 2020;10:e155. [DOI] [PMC free article] [PubMed] [Google Scholar]
- 36. Churi CR, Shroff R, Wang Y, et al. Mutation profiling in cholangiocarcinoma: prognostic and therapeutic implications. PloS One. 2014;9:e115383. [DOI] [PMC free article] [PubMed] [Google Scholar]
- 37. Simbolo M, Fassan M, Ruzzenente A, et al. Multigene mutational profiling of cholangiocarcinomas identifies actionable molecular subgroups. Oncotarget. 2014;5:2839‐2852. [DOI] [PMC free article] [PubMed] [Google Scholar]
- 38. Javle M, Bekaii‐Saab T, Jain A, et al. Biliary cancer: utility of next‐generation sequencing for clinical management. Cancer. 2016;122:3838‐3847. [DOI] [PubMed] [Google Scholar]
- 39. Lin J, Cao Y, Yang X, et al. Mutational spectrum and precision oncology for biliary tract carcinoma. Theranostics. 2021;11:4585‐4598. [DOI] [PMC free article] [PubMed] [Google Scholar]
- 40. Noguchi R, Yamaguchi K, Ikenoue T, et al. Genetic alterations in Japanese extrahepatic biliary tract cancer. Oncol Lett. 2017;14:877‐884. [DOI] [PMC free article] [PubMed] [Google Scholar]
- 41. Pallarz S, Benary M, Lamping M, et al. Comparative analysis of public knowledge bases for precision oncology. JCO precis Oncologia. 2019;3:PO.18.00371‐PO.18.00378. [DOI] [PMC free article] [PubMed] [Google Scholar]
- 42. Greulich H, Kaplan B, Mertins P, et al. Functional analysis of receptor tyrosine kinase mutations in lung cancer identifies oncogenic extracellular domain mutations of ERBB2. Proc Natl Acad Sci U S A. 2012;109:14476‐14481. [DOI] [PMC free article] [PubMed] [Google Scholar]
- 43. Javle M, Churi C, Kang HC, et al. HER2/neu‐directed therapy for biliary tract cancer. J Hematol Oncol. 2015;8:58. [DOI] [PMC free article] [PubMed] [Google Scholar]
- 44. Lowery MA, Ptashkin R, Jordan E, et al. Comprehensive molecular profiling of intrahepatic and extrahepatic cholangiocarcinomas: potential targets for intervention. Clin Cancer Res. 2018;24:4154‐4161. [DOI] [PMC free article] [PubMed] [Google Scholar]
- 45. Goeppert B, Roessler S, Renner M, et al. Mismatch repair deficiency is a rare but putative therapeutically relevant finding in non‐liver fluke associated cholangiocarcinoma. Br J Cancer. 2019;120:109‐114. [DOI] [PMC free article] [PubMed] [Google Scholar]
- 46. Javle MM, Murugesan K, Shroff RT, et al. Profiling of 3,634 cholangiocarcinomas (CCA) to identify genomic alterations (GA), tumor mutational burden (TMB), and genomic loss of heterozygosity (gLOH). J Clin Oncol. 2019;37:4087. [Google Scholar]
- 47. Alexandrov LB, Kim J, Haradhvala NJ, et al. The repertoire of mutational signatures in human cancer. Nature. 2020;578:94‐101. [DOI] [PMC free article] [PubMed] [Google Scholar]
- 48. Wardell CP, Fujita M, Yamada T, et al. Genomic characterization of biliary tract cancers identifies driver genes and predisposing mutations. J Hepatol. 2018;68:959‐969. [DOI] [PubMed] [Google Scholar]
Associated Data
This section collects any data citations, data availability statements, or supplementary materials included in this article.
Supplementary Materials
figure legend.
Table S1.
Table S2.
Table S3.
Table S4.
Table S5.
Table S6.
Table S7.
Figure S1.
Figure S2.
Data Availability Statement
Data sharing is not applicable to this article as no new data were created or analyzed in this study.