Abstract
Background
Recent studies have reported associations between body mass index (BMI) and various autoimmune disorders. However, it is still uncertain whether there exists a direct cause-and-effect relationship between BMI and autoimmune thyroiditis (AIT). The aim of our study is to investigate the causal association between BMI and AIT.
Methods
We conducted a two-sample summary data Mendelian randomization (MR) analysis using genome-wide association studies (GWAS) summary statistics data related to BMI as exposure, and GWAS summary statistic data sets for AIT as the outcome. Robustly associated single-nucleotide polymorphisms (SNPs) for BMI were selected as instrumental variables (IVs). We used the inverse variance weighted (IVW) method as the primary method and performed other MR methods such as MR-Egger regression, weighted median, simple mode, and weighted mode analyses for further validation. The slope of MR-Egger regression was used to correct for pleiotropy and provide estimates of causality. The p-value for the intercept in MR-Egger was utilized to detect any directional pleiotropic effects. Heterogeneity and sensitivity analyses were performed to assess the robustness of our findings.
Results
Seventy-eight SNPs were selected from GWAS on BMI as the IVs. Our MR analysis using the IVW method showed a potential causal association between BMI and AIT (OR = 3.071, 95% CI 1.324–7.118). Findings from other MR methods are non-significant, although the direction of effect is consistent. There was no evidence that the result was affected by genetic pleiotropy (MR-Egger regression intercept = 0.01, SE = 0.00025, p = 0.719). Heterogeneity and sensitivity analyses revealed no significant heterogeneity among SNPs, and no single SNP drove the observed associations.
Conclusion
Our findings suggest a potential causal association between BMI and AIT, which may provide a basis for further investigation into the relationship between BMI and AIT. Further studies are required as only the IVW method shows significant results, and the case sample size is small.
Supplementary Information
The online version contains supplementary material available at 10.1186/s40001-023-01480-1.
Keywords: Mendelian randomization, Autoimmune thyroiditis, Body mass index, Causal association, Genetic variants
Introduction
Autoimmune thyroiditis (AIT), particularly Hashimoto's disease, is the most common autoimmune thyroid disease and is estimated to affect about 1–5% of the general population [1]. As the most common autoimmune inflammatory disease of the thyroid gland, AIT is also the main cause of autoimmune hypothyroidism [2]. Importantly, AIT-induced hypothyroidism typically persists permanently and usually necessitates lifelong thyroid hormone replacement therapy [2, 3]. In addition, as thyroid tissue is gradually destroyed and production of thyroid hormones decreases, it can cause various symptoms such as fatigue, weight gain, constipation, feeling cold, dry skin, depression, muscle pain, and reduced tolerance to exercise [4, 5].
The treatment for AIT depends on the severity of the condition and the symptoms experienced by the patient. Clinical evidence has shown that myo-inositol and selenium can be effective in treating AIT [6–8]. A systematic review and meta-analysis have found that vitamin D supplementation may have a beneficial effect on thyroid autoantibody levels in the treatment of AIT [9]. In addition, Glycyrrhizin, a direct HMGB1 antagonist, has been shown to ameliorate inflammatory infiltration in a murine model of AIT via inhibition of TLR2-HMGB1 signaling [10]. These factors may influence the development of AIT. Although research has implicated oxidative stress and psychiatric disorders as potential risk factors for developing AIT [11, 12], the exact mechanisms underlying this relationship are not well understood.
Adipocytes in adipose tissue produce adipokines, which can have either pro-inflammatory or anti-inflammatory effects in various tissues and organs, including the thyroid gland [13–15]. Adipocytes can also recruit and activate immune cells, promoting the release of pro-inflammatory mediators, and contributing to the development of chronic inflammatory conditions [16, 17]. Recent studies have reported that adipocytes possess the ability to engage in direct interactions with immune cells, either through cell-to-cell contact or via the release of extracellular vesicles containing microRNAs and other molecules. These interactions have been found to modulate the activity of immune cells and subsequently impact the magnitude of the immune response [18–21].
Body mass index (BMI) is a commonly used measure of body fatness and is calculated by dividing an individual's weight in kilograms by the square of their height in meters. It serves as a proxy for overall adiposity and is widely used in epidemiological studies to assess the relationship between obesity and various health outcomes [22, 23]. Consequently, it is hypothesized, based on the aforementioned research, that individuals with elevated BMI may be at an increased susceptibility for the development of AIT. This supposition finds support in observational studies [24, 25]. However, these types of studies can be influenced by biases such as reverse causation and residual confounding, which may limit our understanding of the impact of BMI on AIT.
Mendelian randomization (MR) is a statistical technique that uses genetic variants as instrumental variables (IVs) to evaluate the causal relationship between an exposure factor and an outcome [26]. This method can provide stronger evidence of causality than observational studies since it can minimize confounding and reverse causation bias [26]. Several MR studies have demonstrated the causal relationship between BMI(as the exposure) and numerous immune-related diseases [27, 28]. However, to our knowledge, no relevant studies have reported the causal effect of BMI on the risk of AIT.
In this study, we performed a two-sample summary data MR analysis to comprehensively investigate the causal relationship between BMI (as the exposure) and AIT (as the outcome).
Materials and methods
Study design
Using past explorations about BMI (Additional file 1: Table S1) as a reference, we combined and rectified these genetic variants (i.e., single-nucleotide polymorphisms (SNPs)) data for use as instrumental variables alongside AIT-related genome-wide association study (GWAS) summary information available (Additional file 2: Table S2). We then conducted a two-sample MR study to determine the relationship between BMI and AIT. We carried out our statistical analysis by utilizing the two-sample MR package (version 0.5.4) from the R program (version 4.3.0). We only utilized summarized-level data in our study, which meant ethical approval was unnecessary.
Data sources and selection of genetic variants
GWAS summary statistics data related to BMI were obtained from the IEU OpenGWAS project (https://gwas.mrcieu.ac.uk) as exposure, which includes 339,224 individuals of European ancestry with GWAS ID number ieu-a-2 [29]. Two-sample MR study was conducted using genetic variants (SNPs) robustly associated with BMI at p < 5 × 10⁻⁸. To obtain independent SNPs with a more relaxed threshold, SNPs were clumped and discarded based on linkage disequilibrium (LD) r2 > 0.001 using reference data from the 1000 Genomes Project for European ancestry. F-statistics were calculated to quantify the strength of genetic variants, and SNPs with a value less than 10 were discarded for their insufficient strength [30]. The selected SNPs were used as instrumental variables (IV) in the current MR study.
The publicly available summary statistic data sets of a GWAS for AIT were selected as the outcome (https://gwas.mrcieu.ac.uk/datasets/finn-b-E4_THYROIDITAUTOIM/), which included 187,928 individuals (cases = 244, controls = 187,684) of European ancestry with GWAS ID number finn-b-E4_THYROIDITAUTOIM. Details of the IVs in the outcome were extracted and merged with exposure data. To evaluate whether the IVs were associated with AIT risk factors, PhenoScanner (http://phenoscanner.medschl.cam.ac.uk/phenoscanner) was used, which provides SNP phenotype information [31, 32]. Thus, we ensure that we guarantee the principles of relevance, independence and exclusion restriction required by MR [33]. For missing data in our study, we will delete missing data if the proportion of missing data is small, However, if the proportion of missing data is large, this method may reduce the sample size and affect the reliability of the results.
Statistical analysis for Mendelian randomization
All statistical analyses were conducted using the Two Sample MR package in R software (version 4.3.0). The inverse variance weighted (IVW) method was utilized as the primary statistical method as it provides the most accurate estimate [34]; To enhance the accuracy of our assessment, we conducted additional MR methods including MR-Egger regression, weighted median, Simple mode, and Weighted mode analyses to further validate our findings [35–37]. Additionally, we used the slope of MR-Egger regression to correct for pleiotropy and provide estimates of causality [36]. The p-value for the intercept in MR-Egger was utilized to detect any directional pleiotropic effects [35].
Heterogeneity and sensitivity analysis
We employed the IVW and MR-Egger methods to detect heterogeneity for each SNP. The degree of heterogeneity between SNPs was evaluated through the heterogeneity statistic Q and Funnel plot [38]. Furthermore, a leave-one-out sensitivity analysis was performed to determine if the results of the MR investigation were influenced by a single SNP [38].
Results
Instrumental variables for Mendelian randomization
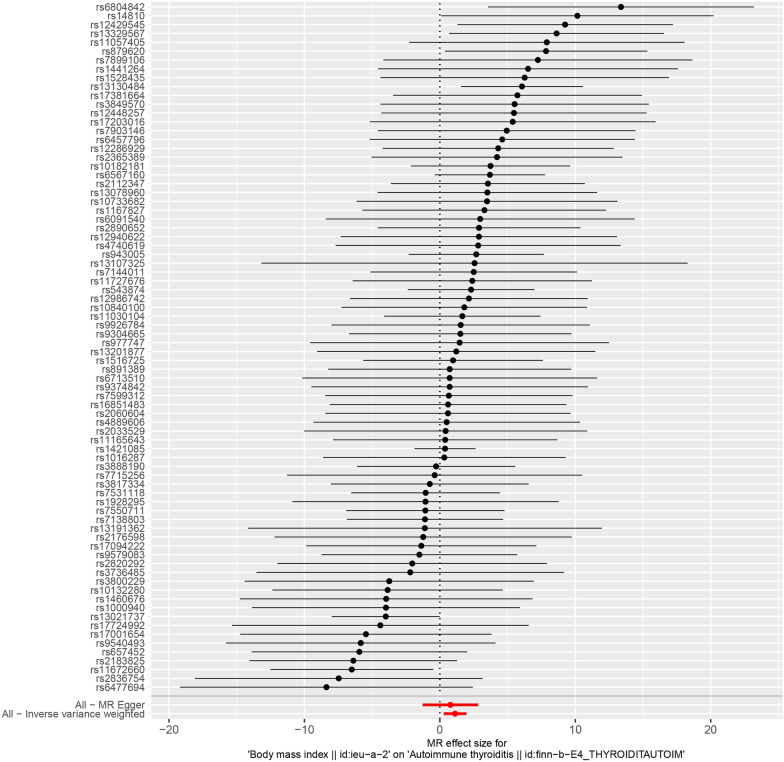
This study utilized 78 independent SNPs from GWASs on BMI as Ivs (without missing data). These SNPs were positively related to AIT, which is illustrated in Fig. 1 and Additional file 2: Table S2. Each SNP had an F statistic exceeding 10, indicating a decreased possibility of weak instrument bias (Additional file 2: Table S2). Furthermore, querying the PhenoScanner curated database did not reveal any noteworthy connections between individual SNPs and AIT.
Fig. 1.
Forest plot of single SNPs associated with BMI on AIT. BMI body mass index, AIT autoimmune thyroiditis
Mendelian randomization results
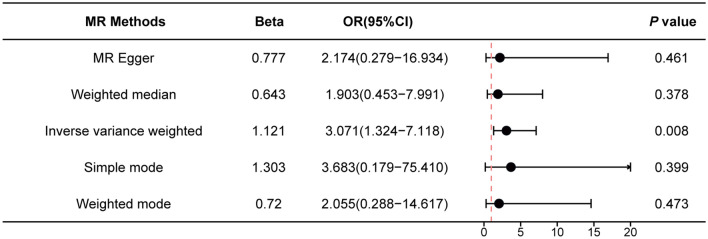
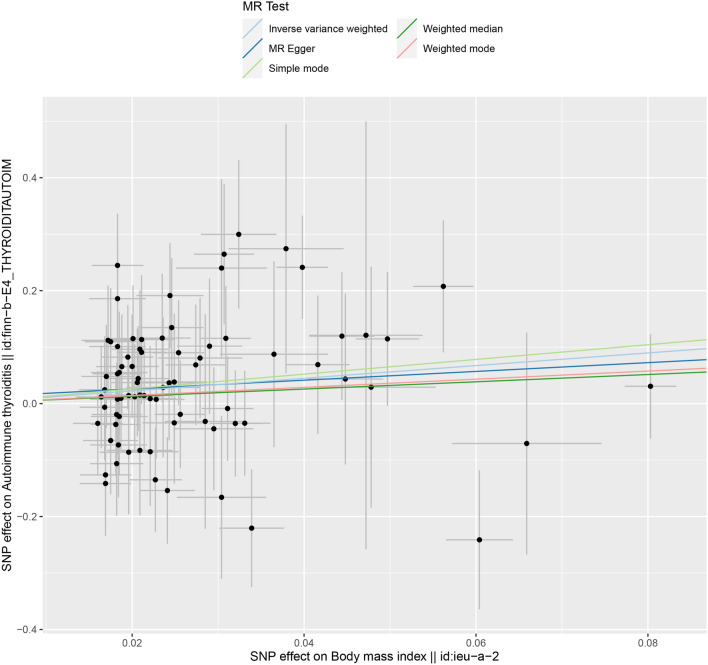
The IVW method showed evidence to support a causal association between BMI and AIT (OR = 3.071, 95% CI 1.324–7.118), and other MR methods showed the tendency of a causal association between BMI and AIT but without statistical significance (Figs. 2 and 3). The results of the MR analysis may support a potential causal association between BMI and AIT. The intercept represents the average pleiotropic effect across the genetic variants (the average direct effect of a variant with the outcome). An intercept that differs from zero (the MR‐Egger test) is indicative of directional pleiotropy. There was no evidence that the result was affected by genetic pleiotropy (MR-Egger regression intercept = 0.01, SE = 0.00025, P = 0.719).
Fig. 2.
Mendelian randomization estimates from each method of assessing the causal effect of BMI on the risk of AIT. BMI body mass index, AIT autoimmune thyroiditis, Beta beta coefficient, OR odds ratio
Fig. 3.
Scatter plot of SNPs associated with BMI and the risk of AIT. The plot presents the effect sizes of the SNP-BMI association (x-axis, SD units) and the SNP-AIT association (y-axis, log (OR)) with 95% confidence intervals. The regression slopes of the lines correspond to causal estimates using the five Mendelian randomization (MR) methods (the IVW method, weighted median estimator, simple mode, weighted mode and MR-Egger). BMI body mass index, AIT autoimmune thyroiditis
Heterogeneity and sensitivity test
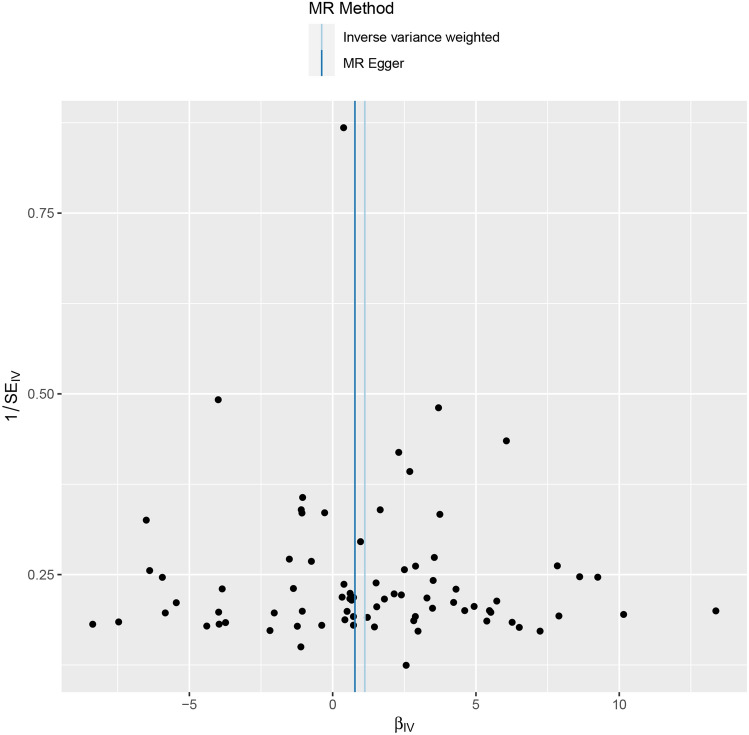
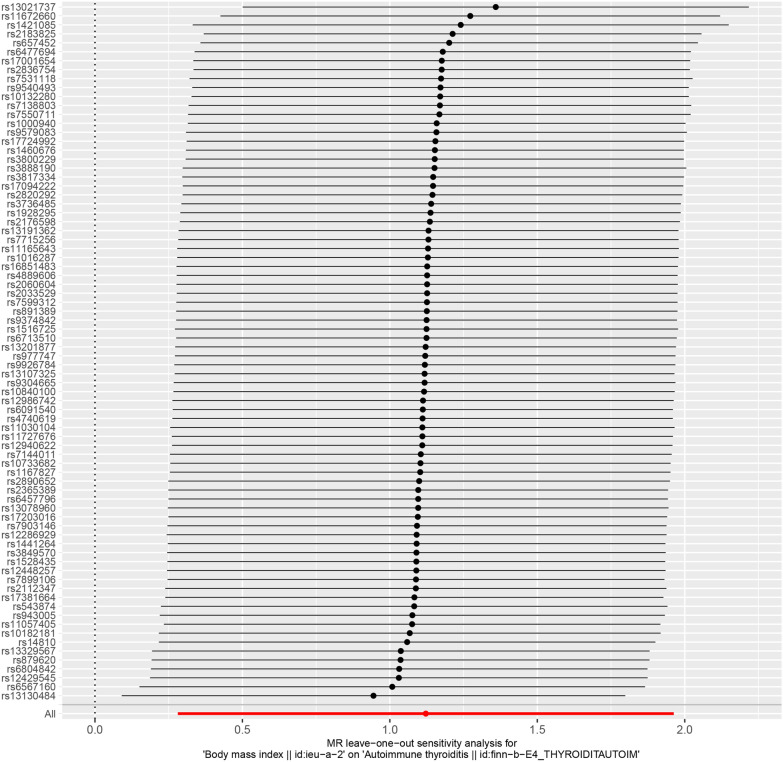
The Q test, which incorporated both the IVW and MR-Egger methods, revealed no significant heterogeneity among SNPs (Table 1), Additionally, the funnel plot showed a basically symmetrical shape(Fig. 4), suggesting that the results are robust. The leave-one-out method demonstrated that no single SNP disproportionately influenced the observed associations (Fig. 5).
Table 1.
Heterogeneity test among SNPs
| Method | Q | df | p-value |
|---|---|---|---|
| Inverse variance weighted | 77.35 | 77 | 0.570 |
| MR-Egger | 77.22 | 76 | 0.593 |
Fig. 4.
The funnel plot of Mendelian randomization analysis. The funnel plot appears symmetrical, indicating no evidence of heterogeneity
Fig. 5.
Leave-one-out of SNPs associated with BMI and their risk of AIT. Each black point represents the result of the IVW MR method applied to estimate the causal effect of BMI on AIT. BMI body mass index, AIT autoimmune thyroiditis, IVW inverse variance weighted, MR Mendelian randomization
Discussion
This study utilized the MR approach to assess the relationship between BMI and AIT. For our primary analysis, we employed the IVW method, which has been shown to have high sensitivity in detecting causal effects. Our IVW results provide evidence supporting a potential causal association between BMI and AIT. We also conducted additional analyses, including the weighted median, MR-Egger, and weighted mode methods, in the two-sample MR framework. These analyses revealed a trend towards causality between BMI and AIT, although statistical significance was not observed. Nonetheless, the consistency of our results across various methods strengthens the robustness of our findings.
Previous studies have suggested a potential link between BMI and AIT, where higher BMI levels have been associated with an increased risk of developing AIT [24, 25]. However, these studies were observational, meaning that they examined the relationship between BMI and AIT in real-world settings without interventions or control groups. Note that observational studies have some limitations, such as the presence of confounding factors and the possibility of reverse causation. Confounding factors are variables that can independently influence both BMI and AIT, which makes it challenging to determine if BMI directly causes AIT. On the other hand, reverse causation suggests that AIT could actually lead to weight gain and higher BMI, rather than higher BMI causing AIT. While these observational studies offer valuable insights, they cannot definitively establish a causal link between BMI and AIT. By utilizing the Mendelian randomization approach, we were able to overcome these limitations and provide more robust evidence supporting a causal link between BMI and AIT.
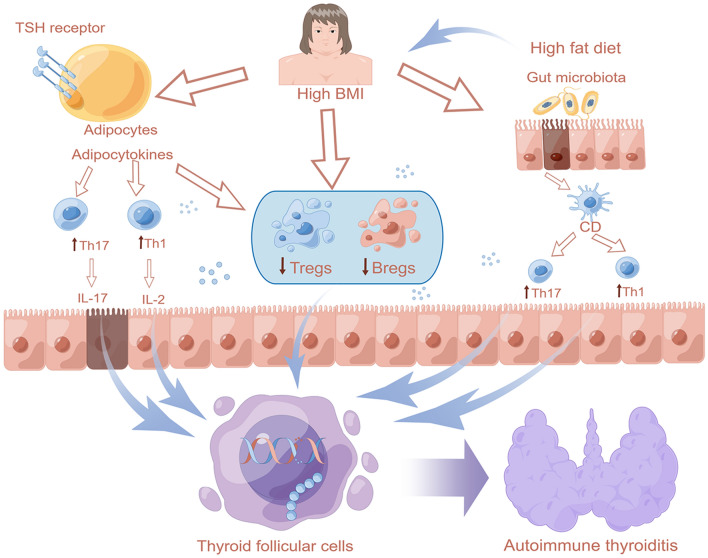
The mechanisms linking BMI and AIT are unclear. Research suggests that obesity can lead to gut dysbiosis, an alteration in the gut microbiota composition, which can trigger autoimmune diseases such as AIT [38, 39]. Dysbiosis can activate immune cells and produce pro-inflammatory cytokines as the gut microbiota plays a crucial role in regulating the immune system [39, 40]. Obesity can also hinder human self-tolerance mechanisms by promoting pro-inflammatory processes and reducing the number of Bregs and Tregs, leading to increased Th17 and Th1 cells that create an environment favorable for autoimmune disorders [14]. In Hashimoto's thyroiditis, adipose tissue enlargement in patients with high BMI results in the release of monocyte chemoattractant protein (MCP) from podocytes and monocytes that play a feedback role based on thyroid hormones [24]. Adipokines, which are biologically active substances derived from adipocytes, are involved in regulating metabolism, hormonal balance, and immune response [41, 42]. Obesity exacerbates the severity of certain autoimmune diseases and reduces treatment response. Moreover, excess body fat may promote the progression of autoimmune diseases [24]. Therefore, we hypothesize that AIT in high BMI patients might develop via similar mechanisms. Obesity could contribute to AIT development, which in turn may result in autoimmune disease progression. The thyroid and adipose tissues may interact bilaterally since adipocytes express functioning thyroid-stimulating hormone (TSH) receptors, and TSH binding to its receptor on brown adipocytes can stimulate thermogenesis. A schematic diagram to illustrate this concept is shown in Fig. 6.
Fig. 6.
Summary of several mechanisms by which BMI affects the pathogenesis of AIT reported in the literature. Bregs regulatory B cells, Tregs regulatory T cells, Th17 T-helper 17 cells, Th1 T-helper 1 cells, BMI body mass index, AIT autoimmune thyroiditis
Our study identified multiple SNPs associated with both BMI and immune function and inflammatory signaling, suggesting that immune function and signaling pathways may mediate the relationship between BMI and AIT. These results support our proposed hypothesis. However, the question of causality between BMI and AIT remains unresolved since not all patients with AIT are obese.
Previous studies have indicated that obesity is positively correlated with AIT, with obese individuals having a higher prevalence of AIT compared to non-obese individuals. The mechanism behind this correlation is not fully understood, but it is hypothesized that increased leptin production in obese individuals may promote Th17 cell differentiation, thus contributing to the development of AIT. Using MR, our findings provided evidence supporting a causal relationship between BMI and AIT. This provides stronger support than the mere correlation observed in observational studies and meta-analyses [43–45]. Our results are consistent with these findings, indicating that a high BMI may increase the risk of AIT. However, MR studies have limitations since they assume that instrumental variables are only related to the outcome through the risk factor being studied and require robust genetic instrumentation and large sample sizes [46].
In this study, we conducted heterogeneity and sensitivity analyses to assess the reliability and validity of our findings. Firstly, we assessed the level of heterogeneity among SNPs by employing the Q-statistic based on the IVW and MR-Egger methods. Our results indicated that there was no significant heterogeneity among SNPs, which strengthens the reliability of our findings. This was also confirmed by funnel plots, which did not show trends towards bias. Secondly, we performed a leave-one-out sensitivity analysis to explore if any single SNP was responsible for influencing the MR findings. Our results showed that the links were not reliant on a particular SNP. Thirdly, we employed the MR-Egger regression approach to detect directional pleiotropy, which can negatively impact MR techniques. We used the intercept of MR-Egger regression to provide free-of-bias estimates of causality. The results indicated that there was no evidence of genetic pleiotropy affecting our outcomes.
However, it should be acknowledged that our MR analysis may have certain limitations. Firstly, the accuracy of genetic instruments is essential for the validity of the MR approach. Despite using a significant number of independent SNPs as IVs, there remains the possibility of weak instrument bias. Secondly, one limitation of this study is the relatively small number of cases of AIT in the GWAS summary dataset. This may limit the statistical power to detect significant associations in some of the analyses. Additionally, it is worth noting that only the IVW method showed significant results, while other MR methods did not provide consistent findings. Therefore, caution should be exercised when interpreting the results as the evidence is not entirely convincing across all MR methods used in this study. Lastly, population stratification may influence the findings of MR analysis, potentially causing spurious associations. Although the MR approach minimizes the risk of confounding, it cannot fully eliminate the possibility of residual confounding, which might impact the results. Therefore, the interpretation of the results of this study should be cautious, and further research is necessary to confirm the causal relationship between BMI and AIT.
Our study underscores the significance of sample size selection in GWAS and how utilizing the European population for both exposure and outcome groups can address some of the limitations in MR. By using the European population, we mitigated the impact of genetic heterogeneity and population structure on the validity of our study. Our analysis involved a substantial sample size, using GWAS summary statistics data from 339,224 individuals of European ancestry as the exposure factor and 187,928 individuals of European descent from the autoimmune thyroiditis GWAS summary statistics as the outcome factor, which significantly increased the study's power.
The results of this study have clinical significance in terms of identifying a possible causal link between BMI and AIT. If confirmed through further investigation, healthcare providers may need to consider BMI as a risk factor for AIT and screen patients with high BMI for AIT. From a public policy perspective, our study may provide additional evidence for promoting healthy weight management practices to prevent the development of AIT. However, it should be noted that the effect size of possible interventions cannot be determined from this study alone, highlighting the need for further research to investigate the impact of interventions such as weight loss on the risk of developing AIT.
In summary, our MR analysis suggests that there may be a causal link between BMI and an increased risk of AIT, indicating that obesity could contribute to the onset of AIT. Our results provide a basis for future research into the association between BMI and AIT.
Supplementary Information
Additional file 1. SNPs are significantly associated with BMI (p < 5E-08).
Additional file 2. Data after BMI and AIT synergy.
Abbreviations
- BMI
Body mass index
- AIT
Autoimmune thyroiditis
- MR
Mendelian randomization
- GWAS
Genome-wide association study
- SNP
Single-nucleotide polymorphism
- IV
Instrumental variable
- OR
Odds ratio
- SE
Standard error
- TLR2
Toll-like receptor 2
- HMGB1
High mobility group box 1
- MCP
Monocyte chemoattractant protein
- Bregs
Regulatory B cells
- Tregs
Regulatory T cells
- Th17
T-helper 17
- Th1
T-helper 1
Author contributions
JLH, and DO contributed to study concept and design, acquisition, analysis, and drafting of the article. YXX and JY contributed to interpretation of data. YMG and XCH contributed to data collection and article review. RQ and LJZ supervised the study. All authors read and approved the final article.
Funding
Jinlong Huo is supported by the Department of Science and Technology of Guizhou Province (No. Qiankehe Foundation—ZK[2023] General 485).Dong Ou is supported by the Health and Family Planning Commission of Guizhou Province (gzwkj2023-283). Youming Guo is supported by the Technology and Science Bureau of Zunyi (NO. 2019-175). Rui Qu is supported by the Technology and Science Bureau of Zunyi (NO. 2019-174) and Science and Technology Department of Guizhou Province (LC[2021]004). Lijin Zhao is supported by the National Natural Science Foundation of China (NSFC) (No. 81960125) and the Department of Science and Technology of Guizhou Province (No. Qiankehe Foundation [2020] 1Y302).
Availability of data and materials
Not applicable.
Declarations
Ethics approval and consent to participate
All genetic instruments and summary statistics used in this study were obtained from published GWASs. All the participants in each study provided informed consent, and all the participating studies had been approved by the relevant institutional review board. Ethical approval for the present study was not required because no individual‑level data were used.
Consent for publication
Not applicable.
Competing interests
The authors declare that they have no competing interests.
Footnotes
Publisher's Note
Springer Nature remains neutral with regard to jurisdictional claims in published maps and institutional affiliations.
Contributor Information
Rui Qu, Email: ruiqusurgeon@163.com.
Lijin Zhao, Email: zhaolijin_22@163.com.
References
- 1.Mcleod DSA, Cooper DS. The incidence and prevalence of thyroid autoimmunity. Endocrine. 2012;42(2):252–265. doi: 10.1007/s12020-012-9703-2. [DOI] [PubMed] [Google Scholar]
- 2.Gonzalez CD, Resnik R, Vaccaro MI. Secretory autophagy and its relevance in metabolic and degenerative disease. Front Endocrinol (Lausanne) 2020;11:266. doi: 10.3389/fendo.2020.00266. [DOI] [PMC free article] [PubMed] [Google Scholar]
- 3.Cicone F, Santaguida MG, My G, Mancuso G, Papa A, Persechino R, et al. Hyperhomocysteinemia in acute iatrogenic hypothyroidism: the relevance of thyroid autoimmunity. J Endocrinol Invest. 2018;41(7):831–837. doi: 10.1007/s40618-017-0811-y. [DOI] [PubMed] [Google Scholar]
- 4.Chaker L, Bianco AC, Jonklaas J, Peeters RP. Hypothyroidism. Lancet (London, England) 2017;390(10101):1550–1562. doi: 10.1016/S0140-6736(17)30703-1. [DOI] [PMC free article] [PubMed] [Google Scholar]
- 5.Roberts LM, Pattison H, Roalfe A, Franklyn J, Wilson S, Hobbs FD, et al. Is subclinical thyroid dysfunction in the elderly associated with depression or cognitive dysfunction? Ann Intern Med. 2006;145(8):573–581. doi: 10.7326/0003-4819-145-8-200610170-00006. [DOI] [PubMed] [Google Scholar]
- 6.Wichman J, Winther KH, Bonnema SJ, Hegedüs L. Selenium supplementation significantly reduces thyroid autoantibody levels in patients with chronic autoimmune thyroiditis: a systematic review and meta-analysis. Thyroid. 2016;26(12):1681–1692. doi: 10.1089/thy.2016.0256. [DOI] [PubMed] [Google Scholar]
- 7.Ferrari SM, Fallahi P, Di Bari F, Vita R, Benvenga S, Antonelli A. Myo-inositol and selenium reduce the risk of developing overt hypothyroidism in patients with autoimmune thyroiditis. Eur Rev Med Pharmacol Sci. 2017;21(2 Suppl):36–42. [PubMed] [Google Scholar]
- 8.Nordio M, Basciani S. Treatment with myo-inositol and selenium ensures euthyroidism in patients with autoimmune thyroiditis. Int J Endocrinol. 2017;2017:2549491. doi: 10.1155/2017/2549491. [DOI] [PMC free article] [PubMed] [Google Scholar]
- 9.Wang S, Wu Y, Zuo Z, Zhao Y, Wang K. The effect of vitamin d supplementation on thyroid autoantibody levels in the treatment of autoimmune thyroiditis: a systematic review and a meta-analysis. Endocrine. 2018;59(3):499–505. doi: 10.1007/s12020-018-1532-5. [DOI] [PubMed] [Google Scholar]
- 10.Li C, Peng S, Liu X, Han C, Wang X, Jin T, et al. Glycyrrhizin, a direct hmgb1 antagonist, ameliorates inflammatory infiltration in a model of autoimmune thyroiditis via inhibition of tlr2-hmgb1 signaling. Thyroid. 2017;27(5):722–731. doi: 10.1089/thy.2016.0432. [DOI] [PubMed] [Google Scholar]
- 11.Siegmann E, Müller HHO, Luecke C, Philipsen A, Kornhuber J, Grömer TW. Association of depression and anxiety disorders with autoimmune thyroiditis: a systematic review and meta-analysis. JAMA Psychiat. 2018;75(6):577–584. doi: 10.1001/jamapsychiatry.2018.0190. [DOI] [PMC free article] [PubMed] [Google Scholar]
- 12.Kotkowska Z, Strzelecki D. Depression and autoimmune hypothyroidism—their relationship and the effects of treating psychiatric and thyroid disorders on changes in clinical and biochemical parameters including bdnf and other cytokines—a systematic review. Pharmaceuticals (Basel) 2022;15(4):391. doi: 10.3390/ph15040391. [DOI] [PMC free article] [PubMed] [Google Scholar]
- 13.Ouchi N, Parker JL, Lugus JJ, Walsh K. Adipokines in inflammation and metabolic disease. Nat Rev Immunol. 2011;11(2):85–97. doi: 10.1038/nri2921. [DOI] [PMC free article] [PubMed] [Google Scholar]
- 14.Tsigalou C, Vallianou N, Dalamaga M. Autoantibody production in obesity: is there evidence for a link between obesity and autoimmunity? Curr Obes Rep. 2020;9(3):245–254. doi: 10.1007/s13679-020-00397-8. [DOI] [PubMed] [Google Scholar]
- 15.Lira MC, Rosa FD, Aiello I, Machado MS, Palma AG, Paz L, et al. Ncoa3 upregulation in breast cancer-associated adipocytes elicits an inflammatory profile. Oncol Rep. 2023;49(5):105. doi: 10.3892/or.2023.8542. [DOI] [PMC free article] [PubMed] [Google Scholar]
- 16.Saltiel AR, Olefsky JM. Inflammatory mechanisms linking obesity and metabolic disease. J Clin Invest. 2017;127(1):1–4. doi: 10.1172/JCI92035. [DOI] [PMC free article] [PubMed] [Google Scholar]
- 17.Martínez-Fernández L, Burgos M, Sáinz N, Laiglesia LM, Arbones-Mainar JM, González-Muniesa P, et al. Maresin 1 exerts a tissue-specific regulation of adipo-hepato-myokines in diet-induced obese mice and modulates adipokine expression in cultured human adipocytes in basal and inflammatory conditions. Biomolecules. 2023;13(6):919. doi: 10.3390/biom13060919. [DOI] [PMC free article] [PubMed] [Google Scholar]
- 18.Biscetti F, Nardella E, Cecchini AL, Flex A, Landolfi R. Biomarkers of vascular disease in diabetes: the adipose-immune system cross talk. Intern Emerg Med. 2020;15(3):381–393. doi: 10.1007/s11739-019-02270-6. [DOI] [PubMed] [Google Scholar]
- 19.Connolly KD, Rees DA, James PE. Role of adipocyte-derived extracellular vesicles in vascular inflammation. Free Radic Biol Med. 2021;172:58–64. doi: 10.1016/j.freeradbiomed.2021.04.031. [DOI] [PubMed] [Google Scholar]
- 20.Delgadillo-Velázquez J, Mendivil-Alvarado H, Coronado-Alvarado CD, Astiazaran-Garcia H. Extracellular vesicles from adipose tissue could promote metabolic adaptation through pi3k/akt/mtor. Cells. 2022;11(11):1831. doi: 10.3390/cells11111831. [DOI] [PMC free article] [PubMed] [Google Scholar]
- 21.den Hartigh LJ, May KS, Zhang XS, Chait A, Blaser MJ. Serum amyloid a and metabolic disease: evidence for a critical role in chronic inflammatory conditions. Front Cardiovasc Med. 2023;10:1197432. doi: 10.3389/fcvm.2023.1197432. [DOI] [PMC free article] [PubMed] [Google Scholar]
- 22.Ortega FB, Sui X, Lavie CJ, Blair SN. Body mass index, the most widely used but also widely criticized index: would a criterion standard measure of total body fat be a better predictor of cardiovascular disease mortality? Mayo Clin Proc. 2016;91(4):443–455. doi: 10.1016/j.mayocp.2016.01.008. [DOI] [PMC free article] [PubMed] [Google Scholar]
- 23.Romero-Corral A, Somers VK, Sierra-Johnson J, Thomas RJ, Collazo-Clavell ML, Korinek J, et al. Accuracy of body mass index in diagnosing obesity in the adult general population. Int J Obes (Lond) 2008;32(6):959–966. doi: 10.1038/ijo.2008.11. [DOI] [PMC free article] [PubMed] [Google Scholar]
- 24.Baranowska-Bik A, Bik W. The association of obesity with autoimmune thyroiditis and thyroid function-possible mechanisms of bilateral interaction. Int J Endocrinol. 2020;2020:8894792. doi: 10.1155/2020/8894792. [DOI] [PMC free article] [PubMed] [Google Scholar]
- 25.Yang H, Xia Q, Shen Y, Chen T, Wang J, Lu Y. Gender-specific impact of metabolic obesity phenotypes on the risk of Hashimoto's thyroiditis: a retrospective data analysis using a health check-up database. J Inflamm Res. 2022;15:827–837. doi: 10.2147/JIR.S353384. [DOI] [PMC free article] [PubMed] [Google Scholar]
- 26.Burgess S, Daniel RM, Butterworth AS, Thompson SG. Network mendelian randomization: using genetic variants as instrumental variables to investigate mediation in causal pathways. Int J Epidemiol. 2015;44(2):484–495. doi: 10.1093/ije/dyu176. [DOI] [PMC free article] [PubMed] [Google Scholar]
- 27.Bae SC, Lee YH. Causal association between body mass index and risk of rheumatoid arthritis: a mendelian randomization study. Eur J Clin Invest. 2019;49(4):e13076. doi: 10.1111/eci.13076. [DOI] [PubMed] [Google Scholar]
- 28.He Y, Zheng C, He MH, Huang JR. The causal relationship between body mass index and the risk of osteoarthritis. Int J Gen Med. 2021;14:2227–2237. doi: 10.2147/IJGM.S314180. [DOI] [PMC free article] [PubMed] [Google Scholar]
- 29.Locke AE, Kahali B, Berndt SI, Justice AE, Pers TH, Day FR, et al. Genetic studies of body mass index yield new insights for obesity biology. Nature. 2015;518(7538):197–206. doi: 10.1038/nature14177. [DOI] [PMC free article] [PubMed] [Google Scholar]
- 30.Burgess S, Butterworth A, Thompson SG. Mendelian randomization analysis with multiple genetic variants using summarized data. Genet Epidemiol. 2013;37(7):658–665. doi: 10.1002/gepi.21758. [DOI] [PMC free article] [PubMed] [Google Scholar]
- 31.Staley JR, Blackshaw J, Kamat MA, Ellis S, Surendran P, Sun BB, et al. Phenoscanner: a database of human genotype-phenotype associations. Bioinformatics (Oxford, England) 2016;32(20):3207–3209. doi: 10.1093/bioinformatics/btw373. [DOI] [PMC free article] [PubMed] [Google Scholar]
- 32.Kamat MA, Blackshaw JA, Young R, Surendran P, Burgess S, Danesh J, et al. Phenoscanner v2: an expanded tool for searching human genotype-phenotype associations. Bioinformatics (Oxford, England) 2019;35(22):4851–4853. doi: 10.1093/bioinformatics/btz469. [DOI] [PMC free article] [PubMed] [Google Scholar]
- 33.Lawlor DA, Harbord RM, Sterne JA, Timpson N, Davey SG. Mendelian randomization: using genes as instruments for making causal inferences in epidemiology. Stat Med. 2008;27(8):1133–1163. doi: 10.1002/sim.3034. [DOI] [PubMed] [Google Scholar]
- 34.Burgess S, Bowden J, Fall T, Ingelsson E, Thompson SG. Sensitivity analyses for robust causal inference from mendelian randomization analyses with multiple genetic variants. Epidemiology. 2017;28(1):30–42. doi: 10.1097/EDE.0000000000000559. [DOI] [PMC free article] [PubMed] [Google Scholar]
- 35.Bowden J, Davey SG, Haycock PC, Burgess S. Consistent estimation in mendelian randomization with some invalid instruments using a weighted median estimator. Genet Epidemiol. 2016;40(4):304–314. doi: 10.1002/gepi.21965. [DOI] [PMC free article] [PubMed] [Google Scholar]
- 36.Bowden J, Davey SG, Burgess S. Mendelian randomization with invalid instruments: effect estimation and bias detection through egger regression. Int J Epidemiol. 2015;44(2):512–525. doi: 10.1093/ije/dyv080. [DOI] [PMC free article] [PubMed] [Google Scholar]
- 37.Hemani G, Zheng J, Elsworth B, Wade KH, Haberland V, Baird D, et al. The mr-base platform supports systematic causal inference across the human phenome. Elife. 2018;7:e34408. doi: 10.7554/eLife.34408. [DOI] [PMC free article] [PubMed] [Google Scholar]
- 38.Chen B, Benedetti A. Quantifying heterogeneity in individual participant data meta-analysis with binary outcomes. Syst Rev. 2017;6(1):243. doi: 10.1186/s13643-017-0630-4. [DOI] [PMC free article] [PubMed] [Google Scholar]
- 39.Belkaid Y, Hand TW. Role of the microbiota in immunity and inflammation. Cell. 2014;157(1):121–141. doi: 10.1016/j.cell.2014.03.011. [DOI] [PMC free article] [PubMed] [Google Scholar]
- 40.Honda K, Littman DR. The microbiota in adaptive immune homeostasis and disease. Nature. 2016;535(7610):75–84. doi: 10.1038/nature18848. [DOI] [PubMed] [Google Scholar]
- 41.Mehta NN, Mcgillicuddy FC, Anderson PD, Hinkle CC, Shah R, Pruscino L, et al. Experimental endotoxemia induces adipose inflammation and insulin resistance in humans. Diabetes. 2010;59(1):172–181. doi: 10.2337/db09-0367. [DOI] [PMC free article] [PubMed] [Google Scholar]
- 42.Karczewski KJ, Snyder MP. Integrative omics for health and disease. Nat Rev Genet. 2018;19(5):299–310. doi: 10.1038/nrg.2018.4. [DOI] [PMC free article] [PubMed] [Google Scholar]
- 43.Song RH, Wang B, Yao QM, Li Q, Jia X, Zhang JA. The impact of obesity on thyroid autoimmunity and dysfunction: a systematic review and meta-analysis. Front Immunol. 2019;10:2349. doi: 10.3389/fimmu.2019.02349. [DOI] [PMC free article] [PubMed] [Google Scholar]
- 44.Duntas LH, Biondi B. The interconnections between obesity, thyroid function, and autoimmunity: the multifold role of leptin. Thyroid. 2013;23(6):646–653. doi: 10.1089/thy.2011.0499. [DOI] [PubMed] [Google Scholar]
- 45.Winer S, Paltser G, Chan Y, Tsui H, Engleman E, Winer D, et al. Obesity predisposes to th17 bias. Eur J Immunol. 2009;39(9):2629–2635. doi: 10.1002/eji.200838893. [DOI] [PubMed] [Google Scholar]
- 46.Burgess S, Small DS, Thompson SG. A review of instrumental variable estimators for mendelian randomization. Stat Methods Med Res. 2017;26(5):2333–2355. doi: 10.1177/0962280215597579. [DOI] [PMC free article] [PubMed] [Google Scholar]
Associated Data
This section collects any data citations, data availability statements, or supplementary materials included in this article.
Supplementary Materials
Additional file 1. SNPs are significantly associated with BMI (p < 5E-08).
Additional file 2. Data after BMI and AIT synergy.
Data Availability Statement
Not applicable.


