Key Points
-
•
ACH-derived GCB cells with aberrant expression profiles underwent independent clonal evolution in the microenvironment of AITL.
-
•
Inhibition of the CD40–CD40LG axis, as revealed by in silico network analysis, is a potential novel therapeutic target.
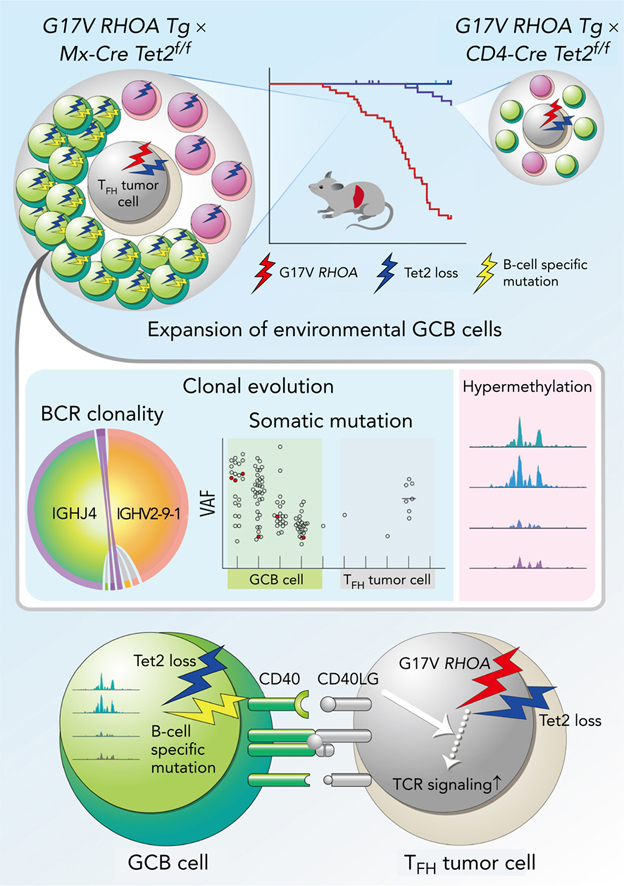
Visual Abstract
Abstract
Angioimmunoblastic T-cell lymphoma (AITL) is proposed to be initiated by age-related clonal hematopoiesis (ACH) with TET2 mutations, whereas the G17V RHOA mutation in immature cells with TET2 mutations promotes the development of T follicular helper (TFH)-like tumor cells. Here, we investigated the mechanism by which TET2-mutant immune cells enable AITL development using mouse models and human samples. Among the 2 mouse models, mice lacking Tet2 in all the blood cells (Mx-Cre × Tet2flox/flox × G17V RHOA transgenic mice) spontaneously developed AITL for approximately up to a year, while mice lacking Tet2 only in the T cells (Cd4-Cre × Tet2flox/flox × G17V RHOA transgenic mice) did not. Therefore, Tet2-deficient immune cells function as a niche for AITL development. Single-cell RNA-sequencing (scRNA-seq) of >50 000 cells from mouse and human AITL samples revealed significant expansion of aberrant B cells, exhibiting properties of activating light zone (LZ)-like and proliferative dark zone (DZ)-like germinal center B (GCB) cells. The GCB cells in AITL clonally evolved with recurrent mutations in genes related to core histones. In silico network analysis using scRNA-seq data identified Cd40–Cd40lg as a possible mediator of GCB and tumor cell cluster interactions. Treatment of AITL model mice with anti-Cd40lg inhibitory antibody prolonged survival. The genes expressed in aberrantly expanded GCB cells in murine tumors were also broadly expressed in the B-lineage cells of TET2-mutant human AITL. Therefore, ACH-derived GCB cells could undergo independent clonal evolution and support the tumorigenesis in AITL via the CD40–CD40LG axis.
The second most common peripheral T-cell lymphoma, angioimmunoblastic T-cell lymphoma (AITL), arises from T-follicular helper cells in the context of age-related clonal hematopoiesis. Fujisawa and colleagues utilized single cell analyses of primary samples and murine models to reveal that TET methylcytosine dioxygenase 2 (TET2) mutations within clonal B cells in the tumor microenvironment are necessary for facilitating TET2-mutated AITL. Their data also suggest a novel therapeutic possibility.
Introduction
The discovery of age-related clonal hematopoiesis (ACH) has resulted in a paradigm shift in research on hematopoiesis in aging. ACH occurs when hematopoietic stem/progenitor cells (HSPCs) acquire somatic mutations, particularly in genes encoding epigenetic regulators, such as DNMT3A, TET2, and ASXL1.1 They frequently occur in various age-related diseases such as diabetes, ischemic heart disease, atherosclerosis, as well as hematological and solid cancers.2 Various lineages of immune cells with somatic mutations derived from ACH infiltrate cancer tissues3,4; however, their function in cancer development remains poorly understood.
Angioimmunoblastic T-cell lymphoma (AITL), a neoplasm of mature T cells,5 is a representative cancer derived from ACH. Genetically, loss-of-function TET2 mutations occur in HSPCs,6 which then acquire disease-specific p.Gly17Val RHOA mutations leading to T-lineage tumor development.7,8 Pathologically, as the name “immunoblast” implies, AITL tissues are characterized by abundant infiltration of B immunoblasts.9 AITL tumor cells exhibit characteristics of T follicular helper (TFH) cells,10 which are physiologically localized in lymph node (LN) follicles and mainly interact with germinal center B (GCB) cells to facilitate their maturation and function.11, 12, 13, 14
Here, we investigated how ACH-derived immune cells are involved in AITL pathogenesis by using originally established mouse models and human samples. Single-cell RNA-sequencing analysis (scRNA-seq) revealed the marked expansion of abnormal GCB-related clusters simultaneously having a cell activation profile like light zone (LZ) GCB and a cell proliferation profile like dark zone (DZ) GCB in both mouse and human AITL samples. Notably, these GCB cells clonally evolved with recurrent mutations in genes related to core histones. In addition, in silico interactome analysis using scRNA-seq data of GCB cells and tumor cells harboring TFH features (TFH tumor cells) showed a strong association of Cd40–Cd40lg. Finally, a blockade of the Cd40–Cd40lg axis by administration of an anti-Cd40lg antibody suppressed the tumor growth.
These data suggest that aberrant GCB cells, which have undergone their own clonal evolution from ACH, play fundamental roles in AITL development. Furthermore, our findings provide a new therapeutic concept to target ACH-derived immune cells in AITL.
Materials and methods
The details were described in supplemental Methods.
Mice and human samples
Mx-Cre mice15 were crossed with Tet2flox/flox mice16 and human G17V RHOA transgenic (G17VRHOA) mice17 to generate Mx-Cre × Tet2flox/flox × G17VRHOA mice, as described previously.17 Tet2flox/flox mice served as the control. Polyinosinic:polycytidylic was injected intraperitoneally into Mx-Cre × Tet2flox/flox × G17VRHOA and Tet2flox/flox mice at 3 to 4 weeks of age at a dose of 20 mg/kg of body weight every other day, for a total of 4 times, and these mice are referred to as MxTR and MxWT, respectively. Cd4–Cre transgenic mice18 were crossed with Tet2flox/flox and G17VRHOA mice to generate Cd4–Cre × Tet2flox/flox × G17V RHOA (CD4TR) and Tet2flox/flox mice (CD4WT). In all experiments, MxTR, MxWT, CD4TR, and CD4WT were analyzed at the same age.
Human samples were prospectively collected from patients with solid tumors (n = 3) who had undergone LN resection and AITL samples (n = 6) between March 2019 and July 2020.
Statistical analysis
A 2-sided Student t test was used to compare the data from the 2 groups. Statistical significance was set at P < .05. All statistical analyses were performed using R software on R Studio.
Results
Tet2 loss in microenvironment immune cells and T cells accelerates TFH-like lymphoma development
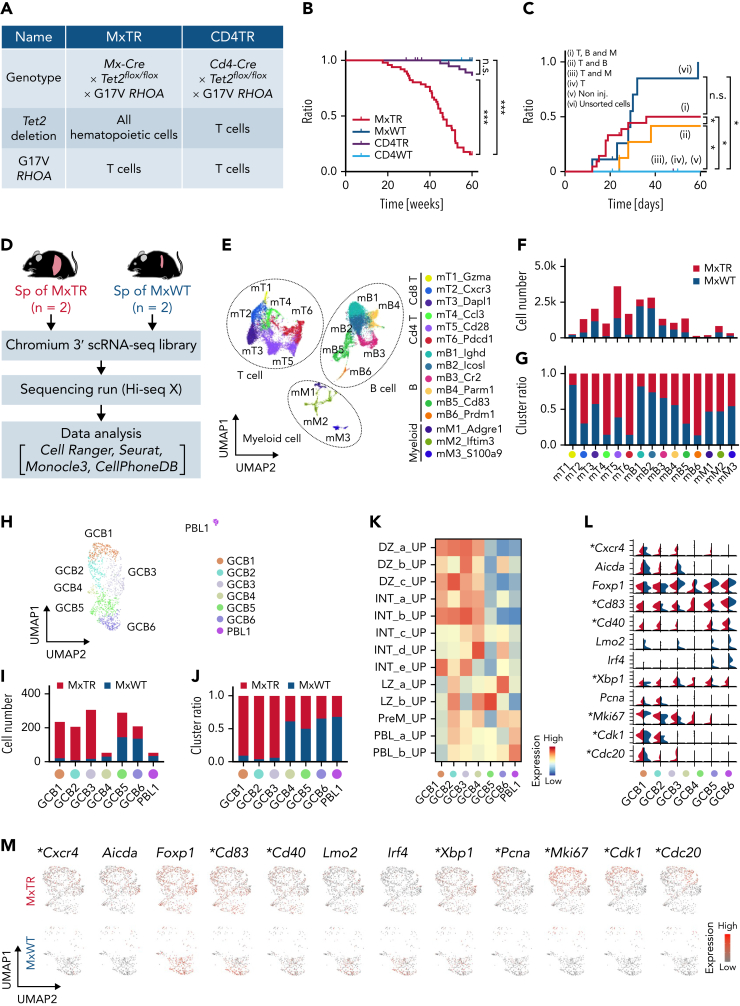
To assess the function of Tet2-deficient immune cells in the context of AITL tumorigenesis, we crossed G17VRHOA mice with mice exhibiting Tet2 deletion in all blood cells (Mx-Cre × Tet2flox/flox × G17VRHOA mice, MxTR) and those with Tet2 deletion only in T cells (Cd4-Cre × Tet2flox/flox × G17VRHOA mice, CD4TR) (Figure 1A). A total of 43 of the 51 (84.3%) MxTR succumbed to TFH-like lymphomas at latencies of 20 to 60 weeks (median, 46 weeks) (Figure 1B). Only 5 out of 49 (10.2%) CD4TR mice died by 60 weeks (median not reached; MxTR vs CD4TR; P < .001); control (MxWT or CD4WT) mice were alive (Figure 1B). The spleen weight and the number of Cd4+ T and Cd4+Pdcd1+Icos+ TFH cells in the spleen increased in MxTR compared with that in MxWT, CD4TR, or CD4WT mice at 20 and 40 weeks of age (supplemental Figure 1A-D in the data supplement). The number of Cd8+ T cells decreased in the spleen of MxTR compared with that in MxWT, CD4TR, or CD4WT mice (at 40 weeks, MxTR vs MxWT vs CD4TR vs CD4WT; CD4+7AAD−, median, 12.0% vs 11.9% vs 12.7% vs 22.8%; P < .05; CD8+7AAD−, median, 7.85% vs 9.44% vs 7.84% vs 5.87%; P < 0.05; Cd4+Pdcd1+Icos+, median, 0.64% vs 0.82% vs 0.58% vs 13.9%; P < .05) (supplemental Figure 1B). TFH-like lymphomas developed in MxTR appeared as previously described (supplemental Figure 1E-G).17
Figure 1.
Tet2 loss accelerates the development of TFH-like lymphomas in all immune cells. (A) Characteristics of the 2 genotypes. (B) Overall survival of mice with the 2 genotypes. ∗∗∗P value < .005; n.s., not significant. (C) Cumulative incidence of engraftment in nude mice injected in 6 different suspensions. ∗P value < .05. (D) Overview of scRNA-seq in spleen cells; MxTR, n = 2; and MxWT, n = 2. (E) UMAP plot after integration of data from spleen cells of MxTR and MxWT. Three cell types are indicated by dashed lines. Bar graphs indicating the (F) numbers and (G) proportions of cells in each cluster. (H) UMAP plots showing reclustering of mB5 cluster. The bar graphs show (I, left) the number of cells and (J, right) the percentages in each cluster. (K) GSVA with GCB-related gene sets for each mB5 subcluster. (L) Stacked violin plot split and (M) feature plots showing GCB markers. ∗Genes highly expressed in GCB1 to 3 of MxTR compared to those of MxWT.
These data suggest that Tet2-deficient immune cells in MxTR contribute to TFH-like lymphoma development. It was previously reported that whole tumor cells transplanted into BALB/c nu/nu (nude) mice developed TFH-like lymphomas in recipient mice.17 Furthermore, tumor development could be monitored by detecting donor-derived Cd4+ tumor cells in peripheral blood (PB) of recipient nude mice. Therefore, to identify the lineages of Tet2-deficient immune cells that contribute to tumorigenesis, we sorted each lineage from the tumors and prepared 6 different suspensions (supplemental Figure 2A). We transplanted them into nude mice. H2kb+ donor-derived cells and Cd3+Cd4+ cells were monitored in PB on day 28 (supplemental Figure 2B-C). Following the transplantation of cells from Cd4+, B220+, and Cd11b+ fractions, donor-derived tumor cells were detected only when B-lineage cells were cotransplanted with Cd4+ tumor-containing cells (groups (i), (ii), and (vi)) (Figure 1C and supplemental Figure 2C). Macroscopically, nude mice added Cd4+ tumor-containing cells with B-lineage cells exhibiting marked splenomegaly with disruption of follicular structures and hepatic infiltration of tumor cells (supplemental Figure 2D). Donor-derived Cd4+Pdcd1+ cells were expanded in the spleen of nude mice in groups (i) and (ii) on day 28 (supplemental Figure 2E-F).
These data suggest that B-lineage cells cotransplanted with Cd4+ tumor-containing cells play critical roles in tumorigenesis in recipient mice.
Comprehensive analysis of immune cell profiles and whole transcriptome of tumor-bearing spleen cells of MxTR
To define immune cell profiles and analyze the whole transcriptome of TFH-like lymphomas in detail, we performed scRNA-seq on spleen cells from tumor-bearing MxTR (n = 2) and control MxWT (n = 2) (Figure 1D). We analyzed 10 270 and 10 529 cells from MxTR and MxWT, respectively (supplemental Figure 3A). Cell-type annotations were performed based on the expression of the canonical marker genes in each cluster (mT1_Gzma [mT1], mT2_Cxcr3 [mT2], mT3_Dapl1 [mT3], mT4_Ccl3 [mT4], mT5_Cd28 [mT5], mT6_Pdcd1 [mT6], mB1_Ighd [mB1], mB2_Icosl [mB2], mB3_Cr2 [mB3], mB4_Parm1 [mB4], mB5_Cd83 [mB5], mB6_Prdm1 [mB6], mM1_Adgre1 [mM1], mM2_Ifitm3 [mM2], and mM3_S100a9 [mM3]) (Figure 1E, supplemental Figure 3B-C, and supplemental Table 1). Among the 15 clusters identified through graph-based clustering, the proportion of Cd4+ T cells (mT4 to 6 clusters) markedly increased in MxTR compared with that in MxWT; whereas the proportion of B cells (mB1 to 6) decreased, and the proportion of Cd8+ T cells (mT1 to 3) and myeloid cells (mM1 to 3) remained comparable (supplemental Figure 3D). The proportion of cells assigned to 8 clusters (mT2, mT4, mT5, mT6, mB5, mB6, mM1, and mM2) was higher in MxTR compared with that in MxWT (Figure 1F-G). We previously reported that tumor cells in MxTR expressed the TFH markers Cd4, Pdcd1, Icos, Cxcr5, and Bcl6, similar to those in human AITL and physiological TFH cells.17 We demonstrated that the mT6 cluster corresponded to a cluster of TFH tumor cells in MxTR based on the high expression of these marker genes and oligoclonal rearrangement of Tcr genes in TFH tumor cells (supplemental Figure 3B-C,E-F).17
In gene set enrichment analysis (GSEA) between each cluster, interferon α and γ responses were enriched throughout all T-cell clusters (mT1 to 6) in MxTR, and IL2-STAT5 signaling was prominently enriched in mT1 to 4 clusters. Among the clusters, the number of enriched signaling pathways in MxTR compared with MxWT was the highest in mT6. In particular, oncogenic pathways, including the MYC targets and the mammalian target of rapamycin1 (mTOR1) signaling, were enriched in the mT6 of MxTR compared with that of MxWT (supplemental Figure 3G). Gene set variable analysis (GSVA)19 with MsigDB C7 gene sets20 together with trajectory analysis for mB1 to 6 clusters revealed that mB1 to 4 groups correspond to naïve or memory B cells; while mB5 and 6 cells exhibit enrichment of GCB and plasma cell (PC)-related gene sets, respectively (supplemental Figure 4A). To assess the relevance of B-cell subclusters in hematological differentiation, we performed trajectory analysis of the integrated B-cell cluster data using the Monocle3 pipeline.21 Cells with gene expression profiles of the mB1 cluster were set as the starting point for the pseudotime analysis. The trajectory progressed from mB1 to mB6, as expected (supplemental Figure 4B). Expression of genes specific to each subtype, such as Ighd, Ighm, Cd27, and Cd38 for naïve or memory B cells; Aicda and Mki67 for GCB DZ; Basp1, Cd40, Cd83, and Cd86 for GCB LZ; and Prdm1 and Sdc1 for PCs, were observed along the B-cell differentiation status (supplemental Figure 4B). These findings support the annotation of mB1 to 4 clusters as naïve or memory B cells, mB5 clusters as GCB cells, and mB6 clusters as PCs, as suggested by GSVA.
We focused on the mB5 cluster because its proportion was much higher in MxTR than in MxWT, and it had the greatest number of differentially expressed genes (DEGs) (supplemental Figure 4C). Reclustering of mB5 revealed 7 subclusters (GCB1 to 6 and PBL1) (Figure 1H-J). We annotated these clusters from MxWT data using GCB-related gene sets22: GCB1 to 4 and GCB5 to 6 exhibited enrichment of DZ- and LZ-related gene sets, respectively, whereas plasmablast (PBL)-related gene sets were enriched in PBL1 (Figure 1K). MxTR samples exhibited a selective increase in the proportion of GCB1 to 3 (Figure 1I-J). MxTR GCB1 to 3 clusters were characterized by a high expression of both DZ (Cxcr4, Aicda, and Mki67) and LZ (Cd40 and Cd83) markers (Figure 1L-M). MYC targets and factors related to proliferative signaling were enriched in clusters GCB1 to 6 in MxTR, compared with MxWT (supplemental Figure 4D).
In summary, scRNA-seq showed that TFH-like lymphomas were divided into 15 clusters. Furthermore, among B cells, the mB5 cluster, which has the characteristics of GCB cells, was a population with a large number of DEGs, expanding in MxTR. This B5 subcluster was subdivided into 7 subclusters (GCB1 to 6 and PBL1). Three subclusters (GCB1 to 3), greatly expanded in MxTR, had characteristics of both DZ GCB, expressing Aicda and proliferative markers such as Mki67, and LZ GCB, expressing markers such as Cd40 and Cd83.
Flow cytometric analysis of intratumoral B cells in TFH-like lymphomas
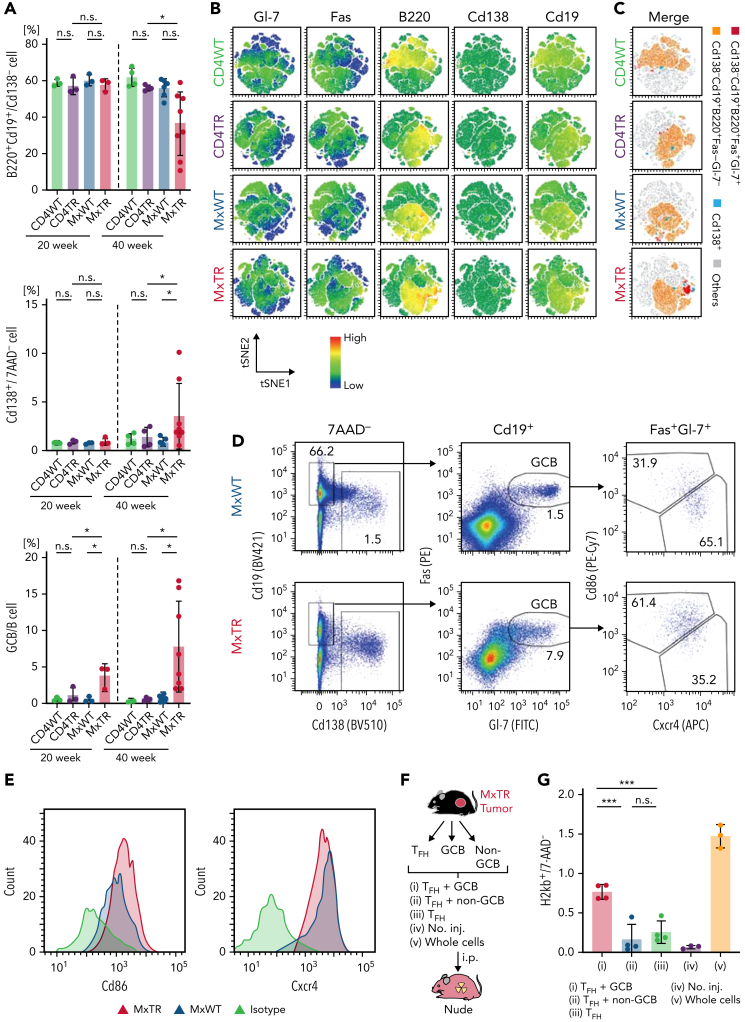
To verify that B-cell subclusters mB5 and mB6, which correspond to GCB cells and PCs, respectively, were increased in MxTR compared with MxWT in scRNA-seq, we performed flow cytometric analysis. B220+Cd19+ total B cells were significantly decreased in spleen cells of MxTR compared with MxWT at 40 weeks of age, whereas Cd138−B220+Cd19+Fas+Gl-7+ GCB cells and Cd138+Cd19dull PCs were significantly increased in spleen cells of MxTR compared with MxWT at 40 weeks of age (Figure 2A-C). Notably, the decrease in the ratio of total B cells, as well as the increase in the ratio of GCB cells and PCs, were prominent in tumor-bearing mice of MxTR (supplemental Figure 5A-C). These results were consistent with those of scRNA-seq.
Figure 2.
Flow cytometric analysis of B-lineage cells and transplantation of TFH-tumor and GCB cells from the spleen of tumor-bearing MxTR. (A) Proportions of B220+Cd19+/Cd138− cells, Cd138+/7AAD− cells, and Cd138−B220+Cd19+Fas+Gl-7+ (GCB)/B cells in the spleen from mice with the indicated genotypes at 20 and 40 weeks of age. MxTR, n = 6; MxWT, n = 4; CD4TR, n = 4; and CD4WT, n = 5. (B) Representative t-Distributed Stochastic Neighbor Embedding (tSNE) plots of flow cytometric data from B-cell fractions in the spleen of mice of the indicated genotypes at 40 weeks of age. B-lineage markers, including Gl-7, Fas, B220, Cd138, and Cd19. (C) tSNE plots of manually gated and integrated Cd138−Cd19+B220+Fas+Gl-7+ (red), Cd138−Cd19+B220+Fas−Gl-7− (orange), Cd138+ (light blue) cells, and others (gray) using data from Figure 2B. (D) Representative flow cytometry plots of Cd138, Cd19, Fas, Gl-7, Cxcr4, and Cd86 in spleen cells from tumor-bearing MxTR and MxWT at ∼50 weeks of age. (E) Histogram of Cd86 or Cxcr4 expression of GCB fractions in spleen cells from tumor-bearing MxTR and MxWT. (F) Workflows of transplant experiments with GCB and TFH cells sorted from tumors of MxTR transplanted into nude mice. i.p., intraperitoneal injection; no. inj., no injection. (G) Proportions of H2kb+ donor-derived cells in spleen cells of the indicated groups on day 7 after injection. Five groups (i–v) represent (i) TFH + GCB cells, (ii) TFH + non-GCB cells, (iii) TFH cells, (iv) no. inj., and (v) whole cells. ∗∗∗P value < .001; n.s., not significant.
To further characterize the expanded GCB DZ cells with an aberrant expression profile in MxTR, we performed flow cytometric analysis using markers characteristic of GCB fractions (Cd138, B220, Cd19, Fas, Gl-7, Cd86, and Cxcr4). MxTR GCB cells showed high expression of Cxcr4 as well as Cd86, which is different from the physiological DZ and LZ fractions (Figure 2D-E and supplemental Figure 6A-E).
In summary, the B-cell subtypes that were increased in TFH-like lymphomas of MxTR were also GCB cells and PCs in flow cytometric analysis. In addition, MxTR GCB cells highly expressed both Cxcr4 and Cd86.
Tet2-deficient GCB cells support the engraftment of TFH tumor cells when cotransplanted into nude mice
To confirm whether GCB cells in tumor-bearing MxTR contributed to the development of TFH-like lymphomas, we prepared 5 different cell suspensions: (i) n = 3, TFH and Cd138−B220+Cd19+Fas+Gl-7+ GCB cells; (ii) n = 4, TFH and Cd138−B220+Cd19+Fas−Gl-7− B cells excluding GCB cells; (iii) n = 3, TFH cells only; (iv) n = 3, uninjected; and (v) n = 4, whole cells. Cell suspensions from each group were injected into nude mice using a protocol modified for deep immunodeficiency (Figure 2F). The proportion of donor-derived cells in group (i) was significantly higher than that in groups (ii) or (iii) but lower than that in group (iv) in the spleens of nude mice on day 7 after transplantation (Figure 2G).
These data support that aberrant increases in GCB cells play key roles in the expansion of TFH-tumor cells in MxTR.
Global transcriptional regulation by DNA methylation in Tet2-deficient GCB cells
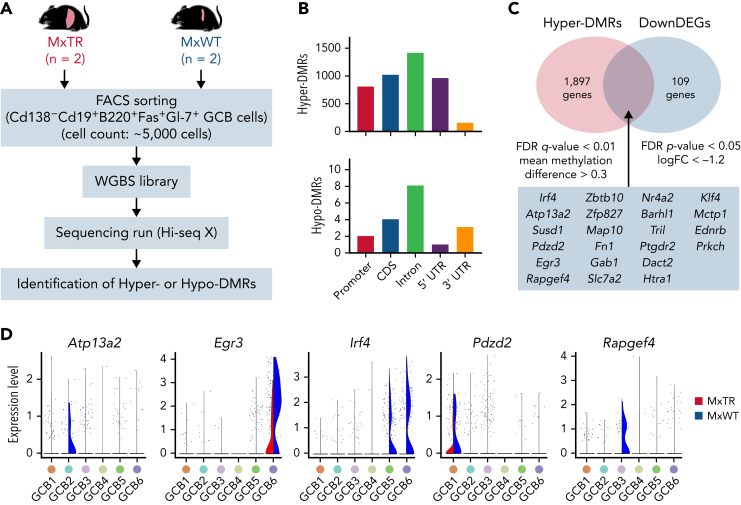
To investigate the mechanism by which methylome modifications following Tet2 deficiency alter GCB cell expansion, we performed whole-genome bisulfite sequencing (WGBS) in GCB cells sorted from tumor-bearing MxTR (n = 2) and control MxWT (n = 2) mice (Figure 3A). The number of hypermethylated differentially methylated regions (DMRs) (hyper-DMRs; n = 4356) was markedly greater than the number of hypomethylated DMRs (hypo-DMRs; n = 18) in GCB cells from MxTR compared with that in MxWT (supplemental Tables 2 and 3). The number of DMRs was higher in all functional genomic elements, including promoters, exons, introns, untranslated regions, and intergenic regions (Figure 3B). Twenty-two genes observed as hyper-DMRs in the WGBS data were found to be downregulated based on the corresponding RNA-seq data (Figure 3C and supplemental Figure 7A-D). scRNA-seq confirmed the downregulation of Atp13a2, Pdzd2, and Rapgef4 in GCB1 to 3 of MxTR. Irf4, which encodes a key regulator of B-cell differentiation,23 and Egr3 were downregulated in GCB5 to 6 (Figure 3D). We conclude that Tet2-deficiency in GCB cells induces specific changes in the DNA methylome, resulting in aberrant gene expression profiles.
Figure 3.
WGBS for GCB cells sorted from tumor-bearing MxTR and MxWT. (A) Overview of WGBS for GCB cells in the spleen from tumor-bearing MxTR (n = 2) and MxWT (n = 2) mice. FACS, fluorescence-activated cell sorting. (B) Distribution of hyper-DMRs (upper) and hypo-DMRs (bottom) in promoter, CDS, intron, 5′ UTR, and 3′ UTR. CDS, coding sequence. (C) Venn diagrams of hyper-DMRs from WGBS and downregulated DEG (DownDEGs)from corresponding RNA-seq analyses described in supplemental Figure 7. Cutoff: false discovery rate(FDR) q-value < 0.01, mean methylation difference > 0.3 (hyper-DMRs); FDR P-value < .05, logFC < −1.2 (DownDEGs). (D) Violin plots of 5 genes (Atp13a2, Egr3, Irf4, Pdzd2, and Rapgef4) downregulated in the GCB1 to 6 clusters of MxTR.
Clonal expansion of Tet2-deficient GCB cells sorted from tumor-bearing MxTR
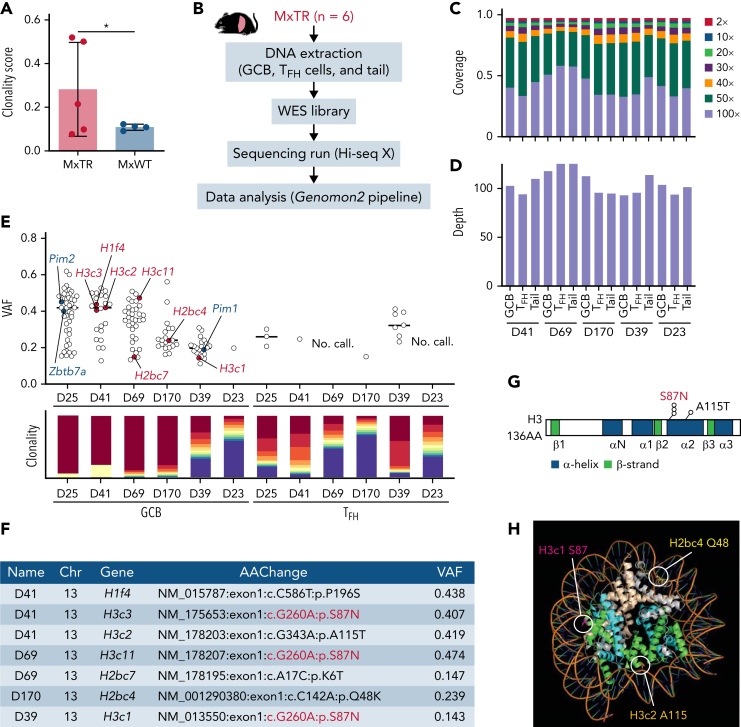
Next, to identify the clonal rearrangements of the B-cell receptor (BCR) gene, we subjected bulk RNA-seq data from GCB cells to the MiXCR algorithm (supplemental Figure 7E-F).24 The number of rearranged BCR genes detected in GCB cells in tumor-bearing MxTR was significantly lower than that in MxWT (Figure 4A and supplemental Table 4), suggesting that Tet2-deficient GCB cells harboring some BCRs clonally expand in MxTR.
Figure 4.
GCB cells clonally expand in the microenvironment of TFH-like lymphomas. (A) Clonality score of genes in RNA-seq data from GCB cells. ∗P value < .05. (B) Overview of whole-exome sequencing (WES) for GCB, TFH cells in the spleen, and tail from MxTR (n = 6). (C) The percentage of targeted bases covered by at least 2×, 10×, 20×, 30×, 40×, 50×, and 100× sequencing reads and (D) average read depth by WES are shown for 5 paired samples from GCB, TFH cells, and tail. (E) Variant allele frequencies (VAFs) of mutations detected using WES (upper). Red, mutations in histone genes; blue, mutations equivalent to those of human DLBCL. Rearrangements of immunoglobulin heavy locus genes or T-cell receptor genes identified in WES data from each sample of sorted GCB or TFH cells, respectively (lower). Each of the top 10 sequences is represented using a different color (red to blue), and the less frequent clones are represented in violet. (F) List of mutations in histone genes in GCB cells. Chr, chromosome; AAChange, amino acid change. (G) Positions of somatic mutations in histone 3 (H3). AA, amino acid. (H) Crystal structure of the nucleosome core particle containing 8 histone proteins and double-stranded DNA, modified from PDB ID: 1U35 by the PyMOL program (Schrödinger). Orthologous positions of 3 mutants discovered in GCB cells from MxTR are highlighted (Q48 in Hb2bc, S87 in H3c1, and A115 in H3c2). The DNA strands are colored orange; gray, H2a; light brown, H2b; green, H3; and light blue, H4.
To explore the difference between aberrant clonal GCB cells of MxTR and Tet2-mutant B-cell lymphomas, we compared the RNA-seq results of Tet2-deficient clonally expanded GCB cells in MxTR and those of Tet2-deficient mice with B-lymphoproliferative disease or those of human diffuse large B-cell lymphomas (DLBCLs) with TET2 mutations. Overall, the RNA-seq results of Tet2-deficient GCB cells sorted from TFH-like lymphomas in the spleen of MxTR and B-lymphoproliferative diseases in VAV1–Cre TET2flox/flox mice25 or those of DLBCL tissues with/without TET2 mutations (n = 735 vs n = 45)26 were less common than expected. For example, 17 and 28 genes were commonly up- and downregulated in Tet2-deficient GCB cells from both TFH-like lymphomas and B-lymphoproliferative disease. Interestingly, though downregulated pathways were commonly found between 2 groups to some extent, upregulated pathways were not shared at all (supplemental Figure 8A-C). We found that only 1 gene (PLAC8/Plac8) was commonly downregulated in both Tet2-deficient GCB cells and human tissue DLBCLs, while 19 pathways, including a proliferation signature, were commonly upregulated (supplemental Figure 8D-F).
Furthermore, to analyze the clonal evolution of GCB and TFH cells during tumorigenesis, we performed whole exome sequencing (WES) of these cells sorted from spleens of tumor-bearing MxTR, using tail DNA as a reference (n = 6) (Figure 4B-D and supplemental Table 5). The frequencies of somatic mutations in GCB samples were significantly higher than those in TFH samples (median, 19.0 vs 1.8; P < .05) (Figure 4E). We identified recurrent mutations in genes encoding core histones (2 in histone H2 and 4 in H3, core histone mutations) in 4 of the 6 GCB samples but did not identify mutations in TFH samples (Figure 4E). The c.G>A260 (p.Ser87Asn, H3S87N) mutations of canonical paralog histone H3 genes were detected in 3 of the 6 GCB samples (Figure 4F-G). Analysis of 3-dimensional (3D) structures of proteins indicated that all these core histone mutations reside in the interacting loci between histones and DNA (Figure 4H). Mice expressing histone H3-mutant under the Ighg1 promoter (c.G>A260, p.Ser87Asn; H3S87N KI) exhibited expansion of GCB cells (supplemental Note 1 and supplemental Figure 9). These data suggest that during clonal evolution in tumorigenesis, recurrent H3S87N mutations accumulate in Tet2-deficient GCB cells.
Identification of the Cd40–Cd40lg interaction between GCB and TFH tumor cell clusters as a therapeutic target in TFH-like lymphomas
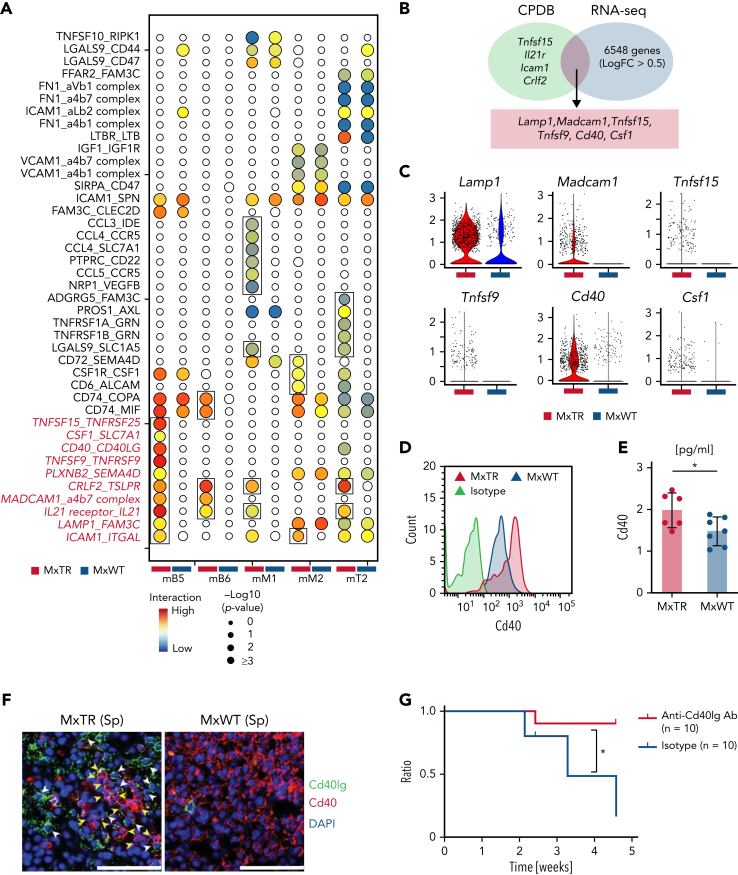
To analyze the mechanisms underlying the crosstalk between Tet2-deficient immune cells and TFH tumor cells, we performed intercellular ligand–receptor interaction analyses between immune cell clusters and TFH tumor cell clusters using CellPhoneDB (Figure 5A).27 We identified 41 significant interactions (28 more intense in MxTR compared with those in the MxWT background). In addition, 11 interactions within the mB5 cluster were specifically upregulated in MxTR but not MxWT (Figure 5A).
Figure 5.
Identification and functional analysis of significant ligand–receptor pairs potentially underlying GCB/TFH tumor cell cluster interactions. (A) Interactome landscape across immune and TFH tumor cell clusters. Circle size indicates a negative log10 of the adjusted P value. Circles are colored only in subclusters with a significant P value. Significant interactions observed only in the MxTR are indicated by squares. (B) Venn diagrams of significant markers in MxTR between mB5 and mT6 (green) and markers upregulated in GCB cells of MxTR (blue) data. CPDB, CellPhoneDB. (C) Violin plots of 6 markers shared by CPDB and RNA-seq. (D) Histograms showing cell surface Cd40 expression in GCB cells. (E) Bar plots of Cd40 concentrations in serum. ∗P value < .05. (F) Immunofluorescence staining of spleen tissue. Green, Cd40lg (white arrowheads); red, Cd40 (yellow arrowheads); and blue, DAPI. Scale bars, 50 μm. (G) Survival curves for anti-Cd40lg antibody or isotype-treated mice. Anti-Cd40lg antibody-treated mice, n = 10; isotype-treated mice, n = 10. Ab, antibody. ∗P value < .05.
Among the 11 genes involved in these interactions, 6 were commonly included in the DEGs between MxTR and MxWT samples (Figure 5B); Lamp1, Madcam1, and Cd40 were highly expressed in the mB5 cluster (Figure 5C). Concentrations of Cd40, a molecule physiologically essential for GCB cell maturation, were significantly higher on the cell surface of GCB cells and in plasma from MxTR than in MxWT (Figure 5D-E and supplemental Figure 10A-C). In addition, Cd40 expression on the cell surface was significantly higher in the GCB cells of MxTR than in those of MxWT as early as 20 weeks of age (supplemental Figure 10D). This suggests that the elevated Cd40 expression occurred before lymphoma development. In the spleen of MxWT, Cd40lg and Cd40 were expressed in Cd4+Pdcd1+ cells in the germinal center of the follicle and Cd19+ cells surrounding the follicles, respectively (supplemental Figure 10E-G). In contrast, the follicular structure was disrupted in tumor-bearing MxTR (supplemental Figure 10E-G), and both Cd40lg+Cd4+ tumor cells and Cd40+Cd19+ cells were diffusely distributed. However, immunofluorescence revealed the presence of multiple niches in which both cell types were localized adjacent to each other in MxTR (Figure 5F and supplemental Figure 10H).
Administration of anti-Cd40lg inhibitory antibodies to tumor-implanted nude mice prolonged survival (Figure 5G and supplemental Figure 10I). Therefore, the Cd40–Cd40lg interaction could be essential for mediating the crosstalk between TFH tumor cells and Tet2-deficient GCB cells (supplemental Figure 10J). Furthermore, in whole-transcriptome analysis using RNA extracted from Jurkat cells expressing the G17V mutant or mock (JurkatG17VRHOA and Jurkatmock), respectively,28 with or without stimulation by CD40-Fc chimera protein under stimulation by an anti-CD3 antibody, CD40LG signaling in T cells stimulated by CD40 activated not only IL2 STAT5, and interferon γ response signaling but also mTOR and vascular endothelial growth factor (VEGF) pathway (supplemental Note 2 and supplemental Figure 11).
Transcriptomic heterogeneity of intratumoral B cells at single-cell resolution in human AITL samples
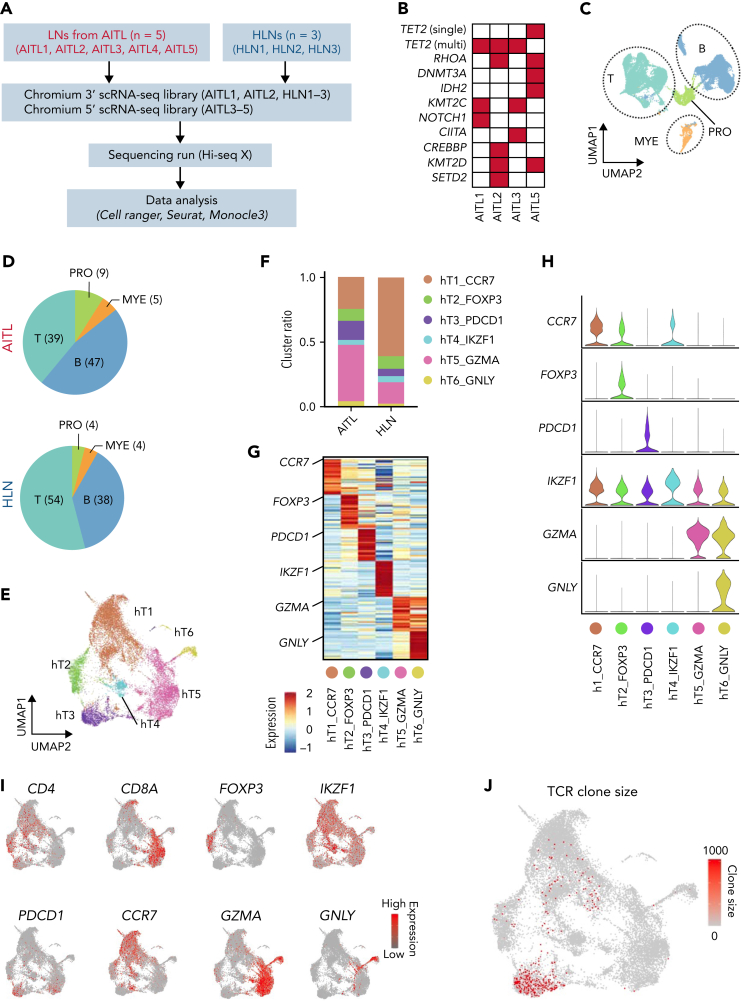
To extend the findings from our mouse model to human cancers, we performed scRNA-seq of 5 human AITL tumors and 3 homeostatic LN (HLN) samples (Figure 6A). TET2 mutations were identified in 4 AITL tumors available for WES (Figure 6B and supplemental Table 6). Unsupervised clustering of scRNA-seq of 36 762 cells identified T-, B-, and myeloid-cell clusters and a cluster characterized by the presence of proliferative markers (Figure 6C). Cell clusters were annotated based on the expression of canonical markers, such as CD3E, CD4, and CD8A for T cells (T); CD19, CD79B, and SDC1 for B cells (B); ADGRE1, IFITM3, and S100A9 for myeloid cells (MYE); and MKI67 for a cluster characterized by proliferative markers (PRO). The proportion of T cells decreased in AITL samples compared with that in HLN samples, whereas those of the B and myeloid cells increased (Figure 6D). In addition, T and B cells were separated from PRO using T- (CD3E) and B- (CD79B and CD19) cell markers with the “subset” function. T- and B-cell subclusters were subjected to scaling, principal component analysis-based dimensionality reduction, and unsupervised graph-based reclustering, respectively. T cells were divided into 6 clusters (hT1_CCR7 [hT1], hT2_FOXP3 [hT2], hT3_PDCD1 [hT3], hT4_IKZF1 [hT4], hT5_GZMA [hT5], and hT6_GNLY [hT6]); and B cells into 9 clusters (hB1_CIITA [hB1], hB2_IGHD [hB2], hB3_IFIT3 [hB3], hB4_FOXP1 [hB4], hB5_AIM2 [hB5], hB6_CD40 [hB6], hB7_BCL2A1 [hB7], hB8_TOP2A [hB8], and hB9_CD38 [hB9]) (Figures 6E-I and 7A-E). Notably, hT3 corresponded to a TFH tumor cell cluster with oligoclonal rearrangement of TCR genes (Figure 6J).
Figure 6.
Transcriptomic heterogeneity of human AITL samples analyzed at single-cell resolution. (A) Overview of scRNA-seq for AITL (n = 5) and homeostatic lymph nodes (HLNs, n = 3). (B) List of somatic mutations detected using WES in AITL tissues. (C) UMAP plot after integrating the scRNA-seq data of AITL and HLN. Three lineage clusters (T cells [T]; B cells [B]; and myeloid cells [MYE]) and a cluster characterized by proliferative markers (PRO) are indicated by dashed circles. (D) Pie graphs showing the proportions of each cluster in the AITL and HLN. Numbers in parentheses indicate the percentages of each cluster. (E) UMAP plot of T-cell subclusters sorted in silico after integrating scRNA-seq data of AITL and HLN samples. Six subclusters were labeled with different colors. (F) Bar graphs showing the percentages of each T-cell subcluster in the AITL or HLN samples. (G) Heatmap of the top 50 conserved markers in each T-cell subcluster from (E). (H) Stacked violin plots showing specific conserved markers expressed in each cluster. (I) Feature plots showing CD4, CD8A, and specific markers for each T-cell subcluster. (J) UMAP plot depicting TCR clone size for each clonotype.
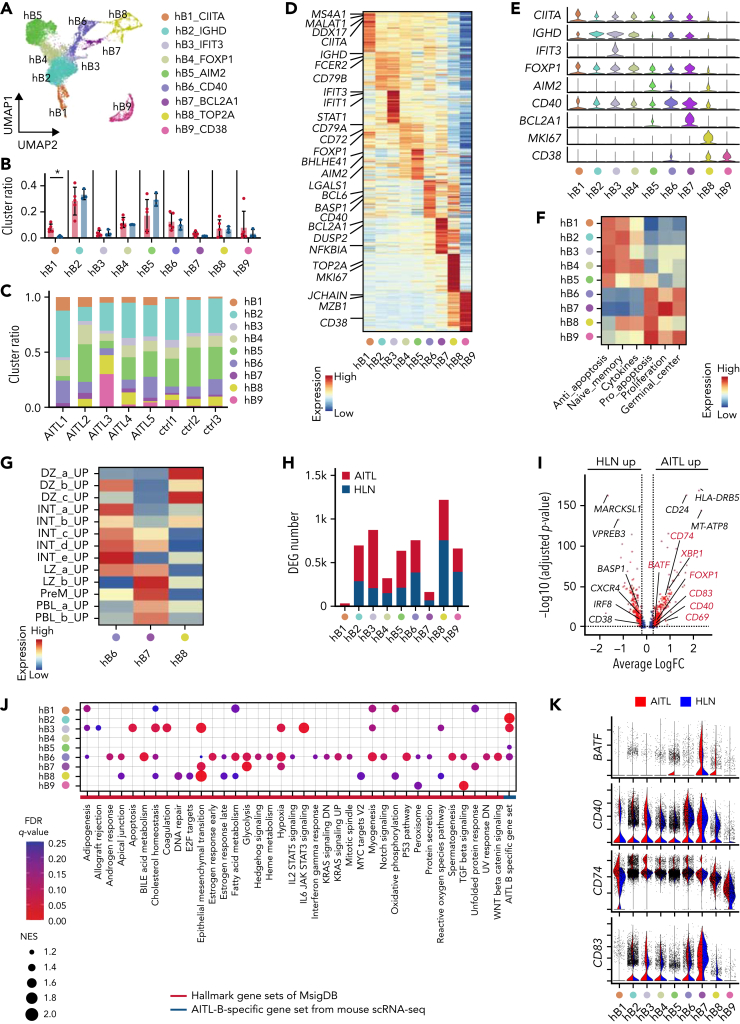
Figure 7.
Human AITL samples exhibit intratumoral B cells phenotypically similar to mouse GCB cells. (A) UMAP plot of B-cell subclusters sorted in silico after integrating scRNA-seq data of AIT L and HLN samples. Nine subclusters were labeled with different colors. (B) Bar plots indicating percentages of each cluster. (C) Bar graphs indicating the percentage of each cluster in indicated samples. (D) Heatmap of the top 50 conserved markers of each cluster in (A). (E) Stacked violin plots showing specific conserved markers expressed in each cluster. (F) Heatmap showing pathways differentially enriched at each B-cell cluster (hB1 to 9) based on GSVA with B-lineage-related genes from Chung and colleagues. Gene sets are listed in supplemental Table 8. (G) Heatmap showing pathways differentially enriched in hB6 to 8 based on GSVA with GCB-cell–associated genes, from Holmes and colleagues. Gene sets are listed in supplemental Table 8. (H) Bar graphs showing the number of DEGs in the AIT L or HLN samples. (I) Volcano plot of DEGs in hB6. Genes in red are included among AIT L-B–specific gene set. (J) Dot plots showing pathways upregulated in hB1 to 9 of AIT L by GSEA with hallmark and AIT L-B–specific gene sets. Dot size indicates the normalized enrichment score (NES). Cutoff, FDR q-value <0.25. (K) Violin plots of genes included in the AIT L-B–specific gene set.
As previously reported,29 the CD8 T-cell subcluster was markedly expanded. In B-cell subclusters, GSVA using datasets from Chung and colleagues30 and MsigDB C720 identified naïve or memory B-cell clusters (hB1 to 5), exhibiting the enrichment of antiapoptotic signaling factors, and GCB (hB6 to 8) and PBL (hB9) clusters exhibiting the enrichment of proliferative and proapoptotic signaling factors (Figure 7F and supplemental Figure 12A). To assess the relevance of B-cell subclusters with respect to hematological differentiation, we performed trajectory analysis of the integrated B-cell subcluster data similar to that of the mouse scRNA-seq data (supplemental Figure 12B). The hB1 clusters were used as the starting point for pseudotime analysis. The trajectories were split into 2 parts (ie, the memory B-cell side [hB4 and hB5] and the GCB side [hB6 to 8]) (supplemental Figure 12B). Gene expression characteristics of cells, such as naïve or memory B cells (IGHD, IGHM, and CD27), GCB DZ (AICDA and MKI67), GCB LZ (CD40 and CD86), and PBL (PRDM1) were observed (supplemental Figure 12B).
These results support the conclusion that hB1 to 5 clusters are naïve or memory B cells, hB6 to 8 clusters are GCB cells, and the hB9 cluster is PBL, as revealed by GSVA. GSVA with GCB-related gene sets22 applied to hB6 to 8 revealed the enrichment of gene sets for LZ to intermediate (INT) in hB6, DZ in hB7, and PBL in hB8 (Figure 7G). The proportion of each fraction was similar in AITL and HLN; however, hB1 was slightly increased in AITL compared with that in HLN (Figure 7B-C). Gene ontology analysis using MsigDB C720 for DEGs showed that GCB-related gene sets, as well as a CD40-related gene set, were enriched in GCB (hB6 to 8) and naïve or memory B-cell clusters (hB2 to 5) of AITL, compared with those in HLN (supplemental Figure 12C). The expression of GCB-related markers was significantly upregulated in GCB (hB6, CD40, CD83, CD69, XBP1, FOXP1, and BATF) and naïve or memory B-cell clusters (hB2 and hB3, CD40 and CD83; hB5, CD40, and CD69) in AITL (Figure 7H-I and supplemental Table 7). GSEA using the MsigDB Hallmark31 showed that the number of significantly enriched genes was the highest in hB6 (Figure 7J-K [red line in J] and supplemental Figure 12D), corresponding to the LZ to INT GCB transition, indicating that this cluster has the properties of AITL, and not that of HLN. AITL-B–specific gene set, comprising genes highly expressed in mB5 in murine TFH-like lymphomas in scRNA-seq, was enriched in GCB (hB6) and naïve or memory B-cell clusters (hB2, 3, and 5) (Figure 7J, blue line). The genes highly expressed in aberrantly expanded GCB cells in murine TFH-like lymphomas were also broadly expressed in B-lineage cells in human AITL.
To determine the clonal evolution of each fractionated subtype of B cells, we sorted each subtype of B cells from the AITL2 sample used for scRNA-seq and performed WES with unsorted cells (supplemental Figure 12E). Four B-cell fractions were sorted: naïve B cells (IgD+CD19+CD138−), memory B cells (IgD−CD38−CD10−CD19+CD138−), GCB cells (IgD−CD38−CD10+CD19+CD138−), and plasma cells (CD19dullCD138+). Overall, 309 mutations were detected by WES (supplemental Table 6). Two types of TET2 mutations were detected, one of which was only detected in unsorted cells (TET2: NM_001127208: exon11: c.5446_5450del: pL1816fs), while the other was also detected in B-cell fractions (TET2: mNM_017628: exon3: c.1387delC: pP463fs) (supplemental Figure 12F). Interestingly, 6 mutations characteristic of DLBCL were detected in GCB and plasma cells. In addition, the HIST1H1C mutation was detected in all B-cell fractions of AITL2 and, importantly, 2 core histone mutations (HIST1H3A: NM_003529: exon1: c.T289A: p.C97S and HIST2H3D: NM_001123375: exon1: c.G54C: p.R18S) were detected in the GCB cells of AITL6 (supplemental Figure 12G). In summary, the B-cell fraction in human AITL has also acquired unique mutations during clonal evolution.
Discussion
Homeostatic TFH cells support the positive selection of GCB cells in a contact-dependent manner.11, 12, 13,32 The transient arrest of GCB cells in the LZ11,32 and molecular interactions between GCB–TFH cells (eg, that via Cd40–Cd40lg13); B7 family members, including Icosl–Icos,12 play crucial roles in the maturation of physiological GCB cells as well as the clonal expansion of TFH cells.14 ACH-derived GCB cells with TET2 mutations could imitate but have far greater proliferative and activating capacities than physiological GCB cells, and they facilitate the expansion of TFH tumor cells, possibly through more robust Cd40–Cd40lg interaction. Disruption of the follicular structure could enable ACH-derived GCB cells with TET2 mutations to interact with TFH tumor cells at various sites in mouse TFH-like lymphomas. A significant interaction between GCB and TFH tumor cells has been noted in an AITL model in Roquinsan/+ mice33; however, ROQUIN mutations are not identified in human AITL samples.34
Similar to that in previous studies, Irf4 hypermethylation and downregulation were observed in Tet2-deficient GCB cells in mouse TFH-like lymphomas in this study.25 Three genes (Atp13a2, Pdzd2, and Rapgef4) were hypermethylated and downregulated specifically in GCB1 to 3, which specifically expanded in mouse TFH-like lymphomas; their downregulation possibly enabled the expansion of these clusters.
Mutations in the core histones were recurrent in the GCB of mouse TFH-like lymphomas. Mutations in genes encoding histone H1 isoforms occur across various lymphoma subtypes, and they alter the 3D structure of DNA, resulting in the respective gain and loss of H3K36 and H3K27 methylation.35 The specific distribution of histone mutations in B cells suggests their essential contribution to AITL development. Indeed, mice expressing the H3S87N mutant exhibited expansion of GCB cells.
Epstein Barr virus (EBV) infection is associated with not only severe immunodeficiency in AITL9,36 but also disease activity, including the progression of histological patterns and B-cell clonality.37, 38, 39 However, it is difficult to reproduce EBV infection in mouse TFH-like lymphomas, which is a limitation of this study.
Conclusions
ACH-derived GCB cells harboring TET2 mutations can independently undergo clonal evolution and function as microenvironmental cells to support AITL tumorigenesis. The interactions between ACH-derived microenvironmental cells and tumor cells could serve as a unique therapeutic target.
Conflict-of-interest disclosure: The authors declare no competing financial interests.
Acknowledgments
The authors thank the staff at the associated institutions and departments for helping with the collection of human samples; Yukari Sakashita, Hiroko Kunifuda, and Eiko Matsuzawa for technical assistance; Kaoru Uchimaru and Makoto Yamagishi (University of Tokyo) for their kind discussions; and Olivier A. Bernard for Tet2flox/flox mice. Finally, the authors acknowledge Elise Lamar for her outstanding editorial assistance.
This work was supported by Grants-in-Aid for Scientific Research (KAKENHI: JP21K16239 [M.F.], JP22K19451 and JP21H02945 [M.S.-Y.], and JP19H03683 [S.C.]) from the Ministry of Education, Culture, Sports, and Science of Japan; AMED(JP21cm0106585 [M.F.], JP20ck0106544 and JP21ck0106644 [M.S.-Y.], and JP21cm 0106505 [S.C.]); Nippon Shinyaku Research Grant (M.F.); the MSD Life Science Foundation; the Mochida Memorial Foundation for Medical and Pharmaceutical Research; the Cell Science Research Foundation; Princess Takamatsu Cancer Research Fund; the Naito Foundation; and Kobayashi Foundation for Cancer Research [M.S.-Y.]. This research was partially supported by the Platform Project for Supporting Drug Discovery and Life Science Research (Basis for Supporting Innovative Drug Discovery and Life Science Research [BINDS]) from Japan Agency to Medical Research and Development (AMED) under grant number JP21am0101103.
Authorship
Contribution: M.F. performed the experiments as well as computational analysis and generated all figures and tables; M.S.-Y. and M.F. developed the experimental and analytical scRNA-seq systems; Y.A., Y. Suehara, K.F., S.S., K. Makishima., C.K., and Y.T.M.N. supported the experiments and computational analyses; S.I. analyzed the 3D structure of the nucleosomes; F.M. and T.I. contributed to WGBS analysis; A.S. and Y. Suzuki contributed to scRNA-seq analysis; M.F., T.B.N., and N.N. performed immunostaining; K.U., K.N., and K. Matsue contributed to human sample collection; S.M. and S.T. provided H3S87N KI; M.S.-Y. conceptualized this study; M.F., M.S.-Y., and S.C. designed the project and wrote the manuscript; M.S.-Y. and S.C. led the entire project; and all authors participated in the discussion and interpretation of the data and results.
Footnotes
∗S.C. and M.S.-Y. contributed equally to this study.
The online version of this article contains a data supplement.
There is a Blood Commentary on this article in this issue.
The publication costs of this article were defrayed in part by page charge payment. Therefore, and solely to indicate this fact, this article is hereby marked “advertisement” in accordance with 18 USC section 1734.
Contributor Information
Shigeru Chiba, Email: schiba-t@md.tsukuba.ac.jp.
Mamiko Sakata-Yanagimoto, Email: sakatama@md.tsukuba.ac.jp.
Supplementary Material
References
- 1.Jaiswal S, Fontanillas P, Flannick J, et al. Age-related clonal hematopoiesis associated with adverse outcomes. N Engl J Med. 2014;371(26):2488–2498. doi: 10.1056/NEJMoa1408617. [DOI] [PMC free article] [PubMed] [Google Scholar]
- 2.Coombs CC, Zehir A, Devlin SM, et al. Therapy-related clonal hematopoiesis in patients with non-hematologic cancers is common and associated with adverse clinical outcomes. Cell Stem Cell. 2017;21(3):374–382. doi: 10.1016/j.stem.2017.07.010. e4. [DOI] [PMC free article] [PubMed] [Google Scholar]
- 3.Pan W, Zhu S, Qu K, et al. The DNA methylcytosine dioxygenase Tet2 sustains immunosuppressive function of tumor-infiltrating myeloid cells to promote melanoma progression. Immunity. 2017;47(2):284–297. doi: 10.1016/j.immuni.2017.07.020. e5. [DOI] [PMC free article] [PubMed] [Google Scholar]
- 4.Nguyen YTM, Fujisawa M, Nguyen TB, et al. Tet2 deficiency in immune cells exacerbates tumor progression by increasing angiogenesis in a lung cancer model. Cancer Sci. 2021;112(12):4931–4943. doi: 10.1111/cas.15165. [DOI] [PMC free article] [PubMed] [Google Scholar]
- 5.Swerdlow SH, Campo E, Harris NL, et al. In: World Health Organization Classification of Tumours. 4th ed. Swerdlow SH, Campo E, Harris NL, et al., editors. Vol. 2. IARC; Lyon, France: 2017. WHO classification of tumours of haematopoietic and lymphoid tissues. (Revised). [Google Scholar]
- 6.Nguyen TB, Sakata-Yanagimoto M, Asabe Y, et al. Identification of cell-type-specific mutations in nodal T-cell lymphomas. Blood Cancer J. 2017;7(1):e516. doi: 10.1038/bcj.2016.122. [DOI] [PMC free article] [PubMed] [Google Scholar]
- 7.Sakata-Yanagimoto M, Enami T, Yoshida K, et al. Somatic RHOA mutation in angioimmunoblastic T cell lymphoma. Nat Genet. 2014;46(2):171–175. doi: 10.1038/ng.2872. [DOI] [PubMed] [Google Scholar]
- 8.Palomero T, Couronné L, Khiabanian H, et al. Recurrent mutations in epigenetic regulators, RHOA and FYN kinase in peripheral T cell lymphomas. Nat Genet. 2014;46(2):166–170. doi: 10.1038/ng.2873. [DOI] [PMC free article] [PubMed] [Google Scholar]
- 9.de Leval L, Gisselbrecht C, Gaulard P. Advances in the understanding and management of angioimmunoblastic T-cell lymphoma. Br J Haematol. 2010;148(5):673–689. doi: 10.1111/j.1365-2141.2009.08003.x. [DOI] [PubMed] [Google Scholar]
- 10.de Leval L, Rickman DS, Thielen C, et al. The gene expression profile of nodal peripheral T-cell lymphoma demonstrates a molecular link between angioimmunoblastic T-cell lymphoma (AITL) and follicular helper T (TFH) cells. Blood. 2007;109(11):4952–4963. doi: 10.1182/blood-2006-10-055145. [DOI] [PubMed] [Google Scholar]
- 11.Allen CDC, Okada T, Tang HL, Cyster JG. Imaging of germinal center selection events during affinity maturation. Science. 2007;315(5811):528–531. doi: 10.1126/science.1136736. [DOI] [PubMed] [Google Scholar]
- 12.Liu D, Xu H, Shih C, et al. T-B-cell entanglement and ICOSL-driven feed-forward regulation of germinal centre reaction. Nature. 2015;517(7533):214–218. doi: 10.1038/nature13803. [DOI] [PubMed] [Google Scholar]
- 13.Liu B, Lin Y, Yan J, et al. Affinity-coupled CCL22 promotes positive selection in germinal centres. Nature. 2021;592(7852):133–137. doi: 10.1038/s41586-021-03239-2. [published correction appears in Nature. 2021;592(7852):E6] [DOI] [PubMed] [Google Scholar]
- 14.Merkenschlager J, Finkin S, Ramos V, et al. Dynamic regulation of TFH selection during the germinal centre reaction. Nature. 2021;591(7850):458–463. doi: 10.1038/s41586-021-03187-x. [DOI] [PMC free article] [PubMed] [Google Scholar]
- 15.Kuhn R, Schwenk F, Aguet M, Rajewsky K. Inducible gene targeting in mice. Science. 1995;269(5229):1427–1429. doi: 10.1126/science.7660125. [DOI] [PubMed] [Google Scholar]
- 16.Quivoron C, Couronné L, Della Valle V, et al. TET2 inactivation results in pleiotropic hematopoietic abnormalities in mouse and is a recurrent event during human lymphomagenesis. Cancer Cell. 2011;20(1):25–38. doi: 10.1016/j.ccr.2011.06.003. [DOI] [PubMed] [Google Scholar]
- 17.Nguyen TB, Sakata-Yanagimoto M, Fujisawa M, et al. Dasatinib is an effective treatment for angioimmunoblastic T-cell lymphoma. Cancer Res. 2020;80(9):1875–1884. doi: 10.1158/0008-5472.CAN-19-2787. [DOI] [PubMed] [Google Scholar]
- 18.Lee PP, Fitzpatrick DR, Beard C, et al. A critical role for Dnmt1 and DNA methylation in T cell development, function, and survival. Immunity. 2001;15(5):763–774. doi: 10.1016/s1074-7613(01)00227-8. [DOI] [PubMed] [Google Scholar]
- 19.Hänzelmann S, Castelo R, Guinney J. GSVA: gene set variation analysis for microarray and RNA-seq data. BMC Bioinformatics. 2013;14(1):7. doi: 10.1186/1471-2105-14-7. [DOI] [PMC free article] [PubMed] [Google Scholar]
- 20.Godec J, Tan Y, Liberzon A, et al. Compendium of immune signatures identifies conserved and species-specific biology in response to inflammation. Immunity. 2016;44(1):194–206. doi: 10.1016/j.immuni.2015.12.006. [DOI] [PMC free article] [PubMed] [Google Scholar]
- 21.Trapnell C, Cacchiarelli D, Grimsby J, et al. The dynamics and regulators of cell fate decisions are revealed by pseudotemporal ordering of single cells. Nat Biotechnol. 2014;32(4):381–386. doi: 10.1038/nbt.2859. [DOI] [PMC free article] [PubMed] [Google Scholar]
- 22.Holmes AB, Corinaldesi C, Shen Q, et al. Single-cell analysis of germinal-center B cells informs on lymphoma cell of origin and outcome. J Exp Med. 2020;217(10) doi: 10.1084/jem.20200483. [DOI] [PMC free article] [PubMed] [Google Scholar]
- 23.Ochiai K, Maienschein-Cline M, Simonetti G, et al. Transcriptional regulation of germinal center B and plasma cell fates by dynamical control of IRF4. Immunity. 2013;38(5):918–929. doi: 10.1016/j.immuni.2013.04.009. [DOI] [PMC free article] [PubMed] [Google Scholar]
- 24.Bolotin DA, Poslavsky S, Mitrophanov I, et al. MiXCR: software for comprehensive adaptive immunity profiling. Nat Methods. 2015;12(5):380–381. doi: 10.1038/nmeth.3364. [DOI] [PubMed] [Google Scholar]
- 25.Dominguez PM, Ghamlouch H, Rosikiewicz W, et al. TET2 deficiency causes germinal center hyperplasia, impairs plasma cell differentiation, and promotes B-cell lymphomagenesis. Cancer Discov. 2018;8(12):1632–1653. doi: 10.1158/2159-8290.CD-18-0657. [DOI] [PMC free article] [PubMed] [Google Scholar]
- 26.Reddy A, Zhang J, Davis NS, et al. Genetic and functional drivers of diffuse large B cell lymphoma. Cell. 2017;171(2):481–494. doi: 10.1016/j.cell.2017.09.027. e15. [DOI] [PMC free article] [PubMed] [Google Scholar]
- 27.Vento-Tormo R, Efremova M, Botting RA, et al. Single-cell reconstruction of the early maternal-fetal interface in humans. Nature. 2018;563(7731):347–353. doi: 10.1038/s41586-018-0698-6. [DOI] [PMC free article] [PubMed] [Google Scholar]
- 28.Fujisawa M, Sakata-Yanagimoto M, Nishizawa S, et al. Activation of RHOA-VAV1 signaling in angioimmunoblastic T-cell lymphoma. Leukemia. 2018;32(3):694–702. doi: 10.1038/leu.2017.273. [DOI] [PMC free article] [PubMed] [Google Scholar]
- 29.Pritchett JC, Yang Z-Z, Kim HJ, et al. High-dimensional and single-cell transcriptome analysis of the tumor microenvironment in angioimmunoblastic T cell lymphoma (AITL) Leukemia. 2022;36(1):165–176. doi: 10.1038/s41375-021-01321-2. [DOI] [PubMed] [Google Scholar]
- 30.Chung W, Eum HH, Lee H-O, et al. Single-cell RNA-seq enables comprehensive tumour and immune cell profiling in primary breast cancer. Nat Commun. 2017;8(1) doi: 10.1038/ncomms15081. [DOI] [PMC free article] [PubMed] [Google Scholar]
- 31.Liberzon A, Birger C, Thorvaldsdóttir H, Ghandi M, Mesirov JP, Tamayo P. The Molecular Signatures Database (MSigDB) hallmark gene set collection. Cell Syst. 2015;1(6):417–425. doi: 10.1016/j.cels.2015.12.004. [DOI] [PMC free article] [PubMed] [Google Scholar]
- 32.Shulman Z, Gitlin AD, Weinstein JS, et al. Dynamic signaling by T follicular helper cells during germinal center B cell selection. Science. 2014;345(6200):1058–1062. doi: 10.1126/science.1257861. [DOI] [PMC free article] [PubMed] [Google Scholar]
- 33.Witalis M, Chang J, Zhong M-C, et al. Progression of AITL-like tumors in mice is driven by Tfh signature proteins and T-B cross talk. Blood Adv. 2020;4(5):868–879. doi: 10.1182/bloodadvances.2019001114. [DOI] [PMC free article] [PubMed] [Google Scholar]
- 34.Auguste T, Travert M, Tarte K, et al. ROQUIN/RC3H1 alterations are not found in angioimmunoblastic T-cell lymphoma. PLoS One. 2013;8(6) doi: 10.1371/journal.pone.0064536. [DOI] [PMC free article] [PubMed] [Google Scholar]
- 35.Yusufova N, Kloetgen A, Teater M, et al. Histone H1 loss drives lymphoma by disrupting 3D chromatin architecture. Nature. 2021;589(7841):299–305. doi: 10.1038/s41586-020-3017-y. [DOI] [PMC free article] [PubMed] [Google Scholar]
- 36.Weiss LM, Jaffe ES, Liu XF, Chen YY, Shibata D, Medeiros LJ. Detection and localization of Epstein-Barr viral genomes in angioimmunoblastic lymphadenopathy and angioimmunoblastic lymphadenopathy-like lymphoma. Blood. 1992;79(7):1789–1795. [PubMed] [Google Scholar]
- 37.Bräuninger A, Spieker T, Willenbrock K, et al. Survival and clonal expansion of mutating “forbidden” (immunoglobulin receptor-deficient) Epstein-Barr virus-infected B cells in angioimmunoblastic T cell lymphoma. J Exp Med. 2001;194(7):927–940. doi: 10.1084/jem.194.7.927. [DOI] [PMC free article] [PubMed] [Google Scholar]
- 38.Zhou Y, Attygalle AD, Chuang S-S, et al. Angioimmunoblastic T-cell lymphoma: histological progression associates with EBV and HHV6B viral load. Br J Haematol. 2007;138(1):44–53. doi: 10.1111/j.1365-2141.2007.06620.x. [DOI] [PubMed] [Google Scholar]
- 39.Delfau-Larue M-H, de Leval L, Joly B, et al. Targeting intratumoral B cells with rituximab in addition to CHOP in angioimmunoblastic T-cell lymphoma. A clinicobiological study of the GELA. Haematologica. 2012;97(10):1594–1602. doi: 10.3324/haematol.2011.061507. [DOI] [PMC free article] [PubMed] [Google Scholar]
Associated Data
This section collects any data citations, data availability statements, or supplementary materials included in this article.


