

Abstract
Objective
This study aimed to investigate the risk of second primary malignancy after radioiodine (RAI) therapy in patients with thyroid cancer, using the National Health Insurance Service (NHIS) database.
Methods
We extracted data from the NHIS database of South Korea, which covers the entire population of the nation. Risk of second primary malignancy in the thyroid cancer patients who received RAI therapy were compared with the thyroid cancer patients who received surgery only.
Results
Between January 1, 2004, and December 31, 2018, we identified 363,155 patients who underwent thyroid surgery due to thyroid cancer for analysis. The surgery only cohort was 215,481, and the RAI cohort was 147,674 patients. A total of 19,385 patients developed second primary malignancy (solid cancer, 18,285; hematologic cancer, 1,100). There was no significant increase in the risk of second primary malignancy in patients who received a total cumulative dose of 100 mCi or less (hazard ratio [HR], 1.013; 95% confidence interval [CI], 0.979–1.049). However, a statistically significant increase in the risk of second primary malignancy was observed in patients who received 101–200 mCi (HR, 1.214; 95% CI, 1.167–1.264), 201–300 mCi (HR, 1.422; 95% CI, 1.258–1.607), and > 300 mCi (HR, 1.693; 95% CI, 1.545–1.854).
Conclusion
Total cumulative doses of 100 mCi or less of RAI can be safely administered without concerns about second primary malignancy. However, the risk of second primary malignancy increases in a dose-dependent manner, and the risk–benefit needs to be considered for doses over 100 mCi of RAI therapy.
Keywords: Thyroid cancer, Radioiodine therapy, Second primary malignancy, Radiation
Introduction
Total thyroidectomy and radioiodine (RAI) treatment are widely used standard care for intermediate or high-risk patients of differentiated thyroid cancer (DTC) [1]. Recent advances in early diagnosis and appropriate management of DTC have led to extremely good survival rates, and RAI treatment has played a significant role in achieving this outcome [2]. However, concerns have been raised about the side effects of ionizing radiation from RAI therapy [3].
Second primary malignancy (SPM) has been reported as a serious side effect of ionizing radiation [4, 5]. However, the relationship between RAI therapy and the SPM is still controversial in patients with DTC [6–9].
Yu et al. performed a systematic review and meta-analysis, but they described the difficulty in concluding the relationship between the two due to heterogeneous and low-quality data [9]. Nevertheless, excessive concerns about radiation exposure have led to a decrease in the administered dose of radioiodine during RAI therapy [1]. To provide optimal therapy for DTC patients, the relationship between RAI therapy and SPM needs to be elucidated.
Therefore, the objective of this study is to evaluate the risk of SPM after RAI therapy through a nationwide population-based study in thyroid cancer patients. We analyzed National Health Insurance service (NHIS) database of South Korea.
Materials and Methods
Data Collection
We extracted data from the NHIS database of South Korea, which covers the entire population. We identified 776,398 patients who were treated as thyroid cancer (ICD-10 code, C73) between January 1, 2002 and December 31, 2018. The sample was narrowed down to 412,806 patients who underwent thyroid surgery (P4551, P4552, P4553, P4554, P4561) between January 1, 2004 and December 31, 2018. The exclusion criteria were a history of antecedent malignancies (every C code, except C73, C76-C80) within 2 years prior to the diagnosis of thyroid cancer (n = 48,480), missing data of age (n = 788) or data error of date of death (n = 23). Finally, 363,155 patients were included for analysis. We defined the patients who received RAI therapy as RAI dose > 0.93 GBq (25 mCi). The population was divided into two groups (Fig. 1); the surgery only cohort was composed of patients who underwent thyroidectomy alone (n = 215,481) and the RAI cohort of patients who underwent thyroidectomy followed by RAI treatment (n = 147,614). The latency period was from the date of first RAI (RAI cohort) or the date of surgery (surgery-only cohort) to the date of SPM development.
Fig. 1.
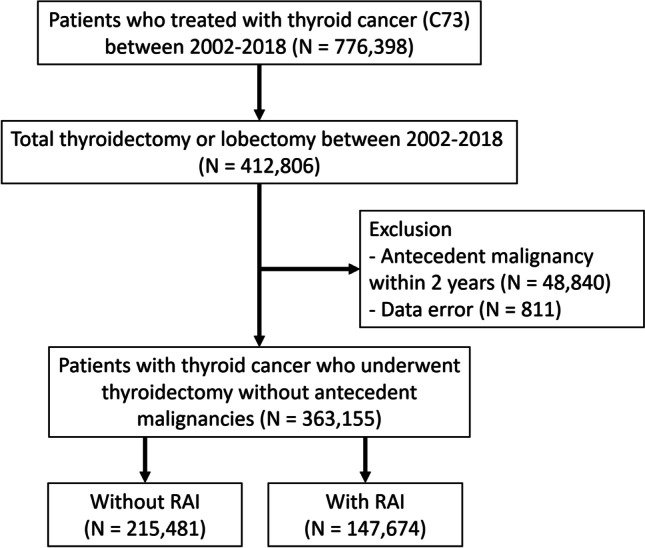
Study scheme
The RAI therapy cohort was further divided into three subgroups by the total cumulative RAI dose (0.93–3.7 GBq [25–100 mCi], 3.7–7.4 GBq [101–200 mCi], 7.4–11.1 GBq [201–300 mCi], and > 11.1 GBq [> 300 mCi]). The follow- up duration was calculated from the date of thyroid surgery in the surgery cohort and from the date of initial RAI administration in the RAI therapy cohort. And end of follow-up was defined as development of SPM, first exposure of external radiotherapy or last follow-up of clinic. We defined development of SPM as at least 3 visits of outpatient clinic or at least 1 admission for main diagnosis of solid cancer (C00-C26, C30-34, C37-C41, C43-C58, C60-C72, C74-C75) or hematologic cancer (C81-C86, C88, C90-96). We defined other and ill-defined solid cancer as C17, C26, C30-C31, C37-C39, C45-49, C51-C52, C57-C58, C60, C63, C65-C66, C68-C69, C74-C75. Follow-up data were collected from January 2004 to December 2018.
The institutional review board approved this study with waiver of the need for informed consent (KNUH 2019–06-030–011). And this study was conducted in accordance with the Declaration of Helsinki.
Statistical Analysis
Continuous and categorical variables are presented as means ± standard deviations (SDs) and numbers (%). The chi-squared test was used for comparing categorical variables, while the t-test or one-way analysis of variance (ANOVA) were utilized for continuous variables. Cox's proportional-hazards regression was performed to calculate hazard ratios (HR) with 95% confidence intervals (95% CI), using the surgical cohort (no RAI) as the reference. Age-sex adjustment was applied in this analysis. A two-tailed p-value < 0.05 was considered statistically significance.
Results
Patient Population
Between January 2002 and December 2018, total of 363,155 patients underwent thyroidectomy without any antecedent malignancy. Of these patients, 67,634 patients were men and 295,521 patients were women. Among them, 147,674 received RAI therapy, and 215,481 did not receive RAI therapy. The mean age of patients who received RAI was 48.15 ± 11.95, and that of patients who did not receive RAI was 47.38 ± 12.10. Patient characteristics are summarized in Table 1. Among the patients who received RAI therapy, 29,887 (20.24%) were male, and 117,787 (79.76%) were female. The mean age at the first RAI therapy was 47.88 ± 12.09 years. The mean number of days from surgery to RAI therapy was 128.28 ± 255.38 days. The mean number of RAI therapies was 1.91 ± 1.10. A total of 96,037 (65.03%) patients received a first dose of 100 mCi or less of RAI therapy, 51,235 (34.69%) received 101–200 mCi, and 402 (0.27%) received over 200 mCi. The mean first dose of RAI was 97.79 ± 51.11 mCi. As for cumulative doses of RAI, 85,454 patients (57.87%) received 100 mCi or less, 52,109 (35.29%) received 101–200 mCi, 4,017 (2.27%) received 201–300 mCi, and 6,094 (4.13%) received over 300 mCi. The mean cumulative RAI dose was 117.31 ± 83.93 mCi (Table 2).
Table 1.
Patient characteristics
| Characteristics | Total (N = 363,155) |
Men (n = 67,634) |
Women (n = 295,521) |
|||
|---|---|---|---|---|---|---|
| Without RAI (n = 215,481) | With RAI (n = 147,674) |
Without RAI (n = 37,747) | With RAI (n = 29,887) |
Without RAI (n = 177,734) | With RAI (n = 117,787) |
|
| No. of patients, n (%) | 215,481 (59.34%) | 147,674 (40.66%) | 37,747 (55.81%) | 29,887 (44.19%) | 177,734 (60.14%) | 117,787 (39.86%) |
| age at diagnosis, mean ± SD | 48.15 ± 11.95 | 47.38 ± 12.10 | 47.6 ± 11.90 | 46.29 ± 12.12 | 48.26 ± 11.96 | 47.66 ± 12.09 |
| age at diagnosis group, n (%) | ||||||
| < 45 | 85,110 (39.50%) | 60,564 (41.01%) | 16,149(42.78%) | 13,849 (46.34%) | 68,961 (38.80%) | 46,715 (39.66%) |
| 45–55 | 67,305 (31.23%) | 45,837 (31.04%) | 10,987 (29.11%) | 8,550 (28.61%) | 56,318 (31.69%) | 37,287 (31.66%) |
| 55–65 | 42,972 (19.94%) | 28,929 (19.59%) | 7,256 (19.22%) | 5,166 (17.29%) | 35,716 (20.10%) | 23,763 (20.17%) |
| ≥ 65 | 20,094 (9.33%) | 12,334 (8.36%) | 3,355 (8.89%) | 2,322 (7.77%) | 16,739 (9.42%) | 10,022 (8.51%) |
| follow-up period (year), mean ± SD | 7.13 ± 3.76 | 8.11 ± 3.48 | 6.53 ± 3.68 | 7.50 ± 3.48 | 7.25 ± 3.76 | 8.26 ± 3.4) |
RAI, radioactive iodine; SD, standard deviation
Table 2.
The profile of radioactive iodine therapy
| Therapy characteristics | Total Population (n = 147,674) |
||
|---|---|---|---|
| No. of patients receiving RAI therapy, n (%) | 147,674 | ||
| Age at 1st RAI therapy, mean ± SD | 47.88 ± 12.09 | ||
| Sex | male, n (%) | 29,887 | (20.24%) |
| female, n (%) | 117,787 | (79.76%) | |
| Days from surgery to RAIT, mean ± SD, day | 128.28 ± 255.38 | ||
| No. of RAI treatment | |||
| mean ± SD | 1.91 ± 1.10 | ||
| 1, n (%) | 59,703 | (40.43%) | |
| 2, n (%) | 60,652 | (41.07%) | |
| > = 3, n (%) | 27,319 | (18.50%) | |
| First dose of RAI therapy, n (%) | |||
| ≤ 3.7 GBq (≤ 100 mCi) | 96,037 | (65.03%) | |
| 3.71—7.40 GBq (101–200 mCi) | 51,235 | (34.69%) | |
| > 7.4 GBq (> 200 mCi) | 402 | (0.27%) | |
| mean (SD), GBq | 3.62 ± 1.89 | ||
| Cumulative dose of RAI, n (%) | |||
| ≤ 100 mCi (≤ 3.7 GBq) | 85,454 | (57.87%) | |
| 101–200 mCi (3.7—7.4 GBq) | 52,109 | (35.29%) | |
| 201–300 mCi (7.4 – 10.1 GBq) | 4,017 | (2.72%) | |
| > 300 mCi (> 10.1 GBq) | 6,094 | (4.13%) | |
| mean ± SD, GBq | 117.31 ± 83.93 | ||
RAI, radioiodine; SD, standard deviation
Second Primary Malignancy
A total 19,385 SPM was developed during follow-up period. 18,285 was solid cancer and 1,100 was hematologic cancer. Latency period to development of SPM was 7.11 ± 3.66 years, that of second solid cancer was 7.12 ± 3.66 years and that of second hematologic cancer was 7.37 ± 3.65 years.
During the follow-up period, a total of 19,385 SPMs developed. Among these, 18,285 were solid cancers, and 1,100 were hematologic cancers. The latency period for the development of SPM was 7.11 ± 3.66 years, and that for the second solid cancer was 7.12 ± 3.66 years, while that for the second hematologic cancer was 7.37 ± 3.65 years.
Patients who received RAI showed an increased hazard ratio (HR) of SPM (HR, 1.099; 95% confidence interval [CI],1.068–1.131), but patients who received 100 mCi or less RAI did not show any statistical difference compared to patients who did not receive RAI (HR, 1.02; 95% CI, 0.985–1.056). Patients who received 101–200 mCi (HR, 1.157; 95% CI, 1.112–1.205), 201–300 mCi (HR, 1.287; 95% CI, 1.138–1.454), and > 300 mCi (HR, 1.612; 95% CI, 1.472–1.766) showed statistically increased SPM compared to those who did not receive RAI in our population.
For all cases of second primary solid cancer, patients who received 100 mCi or less of RAI did not have any significant difference compared to those who did not receive RAI (HR, 1.024; 95% CI, 0.988 – 1.061). However, patients who received 101 – 200 mCi (HR, 1.155; 95% CI, 1.108 – 1.203), 201 – 300 mCi (HR, 1.265; 95% CI, 1.113 – 1.436), and > 300 mCi (HR, 1.609; 95% CI, 1.465 – 1.767) had a statistically significant increase in second primary solid cancer compared to those who did not receive RAI. Similarly, for all cases of second primary hematologic cancer, patients who received 100 mCi or less of RAI did not have any significant difference compared to those who did not receive RAI (HR, 0.955; 95% CI, 0.823 – 1.109). However, patients who received 101 – 200 mCi (HR, 1.193; 95% CI, 1.012 – 1.407), 201 – 300 mCi (HR, 1.621; 95% CI, 1.027 – 2.559), and > 300 mCi (HR, 1.618; 95% CI, 1.108 – 2.363) had a statistically significant increase in second primary hematologic cancer compared to those who did not receive RAI. These findings were presented in Table 3 and Fig. 2.After age and sex adjustment, patients who received 100 mCi or less of RAI did not have any significant difference compared to those who did not receive RAI (HR, 1.013; 95% CI, 0.979 – 1.049). However, patients who received 101 – 200 mCi (HR, 1.214; 95% CI, 1.167 – 1.264), 201 – 300 mCi (HR, 1.422; 95% CI, 1.258 – 1.607), and > 300 mCi (HR, 1.693; 95% CI, 1.545 – 1.854) had a statistically significant increase in second primary hematologic cancer compared to patients who did not receive RAI or who received 100 mCi or less of RAI. The incidences of all second primary solid cancer and second primary hematologic cancer were significantly increased in patients who received more than 100 mCi of RAI compared to those who did not receive RAI (Table 4).
Table 3.
Hazard ratio for specific cancer types
| Total cumulative dose of RAI | ||||||||||||||||||||||
|---|---|---|---|---|---|---|---|---|---|---|---|---|---|---|---|---|---|---|---|---|---|---|
| Total | No RAI | RAI | 3.7 GBq or less | 3.71–7.40 GBq | 7.41–11.10 GBq | > 11.10 GBq | ||||||||||||||||
| Type of SPM | No. of cancers |
No. of cancers |
No. of cancers |
HR* | 95% CI | p-value | No. of cancers |
HR* | 95% CI | p-value | No. of cancers |
HR* | 95% CI | p-value | No. of cancers |
HR* | 95% CI | p-value | No. of cancers |
HR* | 95% CI | p-value |
| Any SPM | 19,385 | 11,063 | 8,322 | 1.099 | 1.068–1.131 | < .0001 | 4,492 | 1.02 | 0.985–1.056 | 0.2646 | 3,084 | 1.157 | 1.112–1.205 | < .0001 | 262 | 1.287 | 1.138–1.454 | < .0001 | 484 | 1.612 | 1.472–1.766 | < .0001 |
| All solid cancer | 18,285 | 10,432 | 7,853 | 1.1 | 1.068–1.132 | < .0001 | 4,252 | 1.024 | 0.988–1.061 | 0.1917 | 2,902 | 1.155 | 1.108–1.203 | < .0001 | 243 | 1.265 | 1.113–1.436 | 0.0003 | 456 | 1.609 | 1.465–1.767 | < .0001 |
| Lip, oral cavity, and pharynx (C00-C14) | 2,084 | 1,185 | 899 | 1.106 | 1.014–1.206 | 0.0224 | 429 | 0.911 | 0.816–1.018 | 0.0987 | 381 | 1.33 | 1.185–1.492 | < .0001 | 35 | 1.588 | 1.135–2.222 | 0.007 | 54 | 1.623 | 1.236–2.132 | 0.0005 |
| Esophagus (C15) | 93 | 61 | 32 | 0.765 | 0.499–1.173 | 0.2195 | 15 | 0.618 | 0.351–1.087 | 0.0948 | 12 | 0.814 | 0.438–1.511 | 0.5135 | 1 | 0.882 | 0.122–6.363 | 0.901 | 4 | 2.388 | 0.868–6.566 | 0.0917 |
| Stomach (C16) | 1,634 | 912 | 722 | 1.155 | 1.047–1.273 | 0.0039 | 388 | 1.069 | 0.949–1.204 | 0.2703 | 267 | 1.211 | 1.057–1.388 | 0.0059 | 14 | 0.826 | 0.487–1.4 | 0.4776 | 53 | 2.124 | 1.61–2.802 | < .0001 |
| Colon and rectum (C18-C21) | 2,243 | 1,281 | 962 | 1.096 | 1.008–1.192 | 0.0317 | 520 | 1.021 | 0.922–1.13 | 0.694 | 367 | 1.185 | 1.055–1.331 | 0.0041 | 28 | 1.176 | 0.809–1.71 | 0.3964 | 47 | 1.326 | 0.991–1.774 | 0.0574 |
| Liver (C22) | 788 | 465 | 323 | 1.013 | 0.879–1.167 | 0.86 | 176 | 0.952 | 0.8–1.132 | 0.5751 | 115 | 1.023 | 0.834–1.254 | 0.8306 | 8 | 0.925 | 0.46–1.861 | 0.8272 | 24 | 1.87 | 1.24–2.818 | 0.0028 |
| Gallbladder and biliary tract (C23-24) | 267 | 153 | 114 | 1.087 | 0.853–1.385 | 0.4996 | 60 | 0.985 | 0.731–1.328 | 0.9233 | 46 | 1.244 | 0.894–1.729 | 0.1948 | 3 | 1.055 | 0.337–3.308 | 0.9264 | 5 | 1.189 | 0.488–2.897 | 0.7034 |
| Pancreas (C25) | 415 | 243 | 172 | 1.032 | 0.849–1.255 | 0.7508 | 105 | 1.085 | 0.863–1.364 | 0.4834 | 54 | 0.919 | 0.684–1.234 | 0.5753 | 4 | 0.886 | 0.33–2.379 | 0.81 | 9 | 1.356 | 0.697–2.636 | 0.3699 |
| Larynx (C32) | 76 | 48 | 28 | 0.851 | 0.534–1.356 | 0.496 | 12 | 0.628 | 0.334–1.183 | 0.1501 | 8 | 0.689 | 0.326–1.457 | 0.3296 | 3 | 3.361 | 1.047–10.791 | 0.0416 | 5 | 3.772 | 1.502–9.475 | 0.0047 |
| Lung(C33-C34) | 1,949 | 1,037 | 912 | 1.283 | 1.174–1.403 | < .0001 | 465 | 1.127 | 1.01–1.257 | 0.0324 | 331 | 1.321 | 1.167–1.495 | < .0001 | 37 | 1.925 | 1.387–2.672 | < .0001 | 79 | 2.788 | 2.218–3.505 | < .0001 |
| Bone and soft tissue (C40-C41) | 96 | 43 | 53 | 1.797 | 1.202–2.687 | 0.0043 | 22 | 1.286 | 0.769–2.15 | 0.3373 | 13 | 1.25 | 0.672–2.325 | 0.4805 | 3 | 3.755 | 1.165–12.101 | 0.0267 | 15 | 12.67 | 7.039–22.806 | < .0001 |
| Skin (C43-C44) | 425 | 256 | 169 | 0.963 | 0.793–1.169 | 0.701 | 96 | 0.942 | 0.745–1.191 | 0.6163 | 59 | 0.953 | 0.718–1.265 | 0.74 | 7 | 1.472 | 0.695–3.119 | 0.3128 | 7 | 1.001 | 0.472–2.12 | 0.9989 |
| Breast (C50) | 4,439 | 2,667 | 1,772 | 0.969 | 0.912–1.029 | 0.2985 | 1,050 | 0.989 | 0.921–1.062 | 0.7598 | 616 | 0.955 | 0.875–1.043 | 0.3036 | 51 | 1.03 | 0.781–1.358 | 0.8358 | 55 | 0.751 | 0.575–0.981 | 0.0355 |
| Cervix (C53) | 400 | 236 | 164 | 1.013 | 0.83–1.237 | 0.8972 | 90 | 0.958 | 0.752–1.222 | 0.7315 | 66 | 1.157 | 0.88–1.519 | 0.2962 | 2 | 0.456 | 0.113–1.833 | 0.2685 | 6 | 0.923 | 0.411–2.076 | 0.8468 |
| Uterus (C54-C55) | 421 | 225 | 196 | 1.27 | 1.049–1.538 | 0.0143 | 123 | 1.373 | 1.102–1.711 | 0.0047 | 61 | 1.121 | 0.845–1.488 | 0.4273 | 2 | 0.479 | 0.119–1.925 | 0.2993 | 10 | 1.624 | 0.862–3.059 | 0.1337 |
| Ovary (C56) | 399 | 220 | 179 | 1.186 | 0.974–1.445 | 0.0894 | 106 | 1.21 | 0.96–1.526 | 0.1066 | 63 | 1.185 | 0.895–1.567 | 0.2359 | 3 | 0.735 | 0.236–2.296 | 0.5967 | 7 | 1.164 | 0.548–2.47 | 0.6929 |
| Prostate (C61) | 555 | 291 | 264 | 1.323 | 1.12–1.563 | 0.001 | 140 | 1.209 | 0.988–1.479 | 0.0654 | 98 | 1.393 | 1.108–1.752 | 0.0045 | 7 | 1.295 | 0.612–2.74 | 0.4992 | 19 | 2.391 | 1.504–3.802 | 0.0002 |
| Testis (C62) | 8 | 6 | 2 | 0.486 | 0.098–2.408 | 0.3769 | 1 | 0.418 | 0.05–3.476 | 0.42 | 1 | 0.689 | 0.083–5.727 | 0.7306 | - | - | ||||||
| Kidney (C64) | 636 | 340 | 296 | 1.27 | 1.087–1.484 | 0.0027 | 153 | 1.131 | 0.934–1.368 | 0.207 | 120 | 1.46 | 1.186–1.798 | 0.0004 | 13 | 2.061 | 1.185–3.586 | 0.0105 | 10 | 1.072 | 0.572–2.011 | 0.8275 |
| Bladder (C67) | 262 | 139 | 123 | 1.29 | 1.012–1.645 | 0.0394 | 79 | 1.428 | 1.083–1.882 | 0.0115 | 33 | 0.982 | 0.672–1.435 | 0.9252 | 3 | 1.162 | 0.37–3.647 | 0.797 | 8 | 2.107 | 1.033–4.296 | 0.0404 |
| Brain and CNS (C70-72) | 266 | 138 | 128 | 1.352 | 1.063–1.72 | 0.0139 | 50 | 0.91 | 0.659–1.258 | 0.5699 | 59 | 1.768 | 1.304–2.399 | 0.0002 | 4 | 1.56 | 0.577–4.215 | 0.3807 | 15 | 3.956 | 2.322–6.74 | < .0001 |
| Other and ill-defined | 829 | 486 | 343 | 1.029 | 0.896–1.182 | 0.683 | 172 | 0.889 | 0.747–1.058 | 0.1864 | 132 | 1.123 | 0.927–1.362 | 0.2357 | 15 | 1.662 | 0.994–2.778 | 0.0527 | 24 | 1.795 | 1.191–2.704 | 0.0051 |
| All hematologic cancer | 1,100 | 631 | 469 | 1.084 | 0.962–1.222 | 0.1842 | 240 | 0.955 | 0.823–1.109 | 0.5474 | 182 | 1.193 | 1.012–1.407 | 0.0359 | 19 | 1.621 | 1.027–2.559 | 0.0379 | 28 | 1.618 | 1.108–2.363 | 0.0127 |
| Non-Hodgkin's lymphoma (C82-C86, C88, C96) | 576 | 389 | 187 | 0.701 | 0.589–0.834 | < .0001 | 99 | 0.639 | 0.513–0.797 | < .0001 | 70 | 0.744 | 0.577–0.96 | 0.0227 | 4 | 0.553 | 0.206–1.481 | 0.2384 | 14 | 1.31 | 0.769–2.233 | 0.3206 |
| Hodgkin's Disease (C81) | 25 | 17 | 8 | 0.686 | 0.296–1.59 | 0.3796 | 6 | 0.887 | 0.35–2.25 | 0.8006 | 1 | 0.243 | 0.032–1.828 | 0.1695 | - | 1 | 2.137 | 0.284–16.056 | 0.4606 | |||
| Multiple myeloma (C90) | 145 | 86 | 59 | 1 | 0.718–1.393 | 1 | 38 | 1.11 | 0.758–1.626 | 0.5927 | 21 | 1.01 | 0.627–1.627 | 0.9674 | - | - | ||||||
| Leukemia (C91-C95) | 354 | 139 | 215 | 2.256 | 1.823–2.792 | < .0001 | 97 | 1.753 | 1.353–2.272 | < .0001 | 90 | 2.679 | 2.055–3.493 | < .0001 | 15 | 5.816 | 3.414–9.908 | < .0001 | 13 | 3.415 | 1.934–6.029 | < .0001 |
SPM, second primary malignancy
*Reference: non-treatment (No RAI)
Fig. 2.
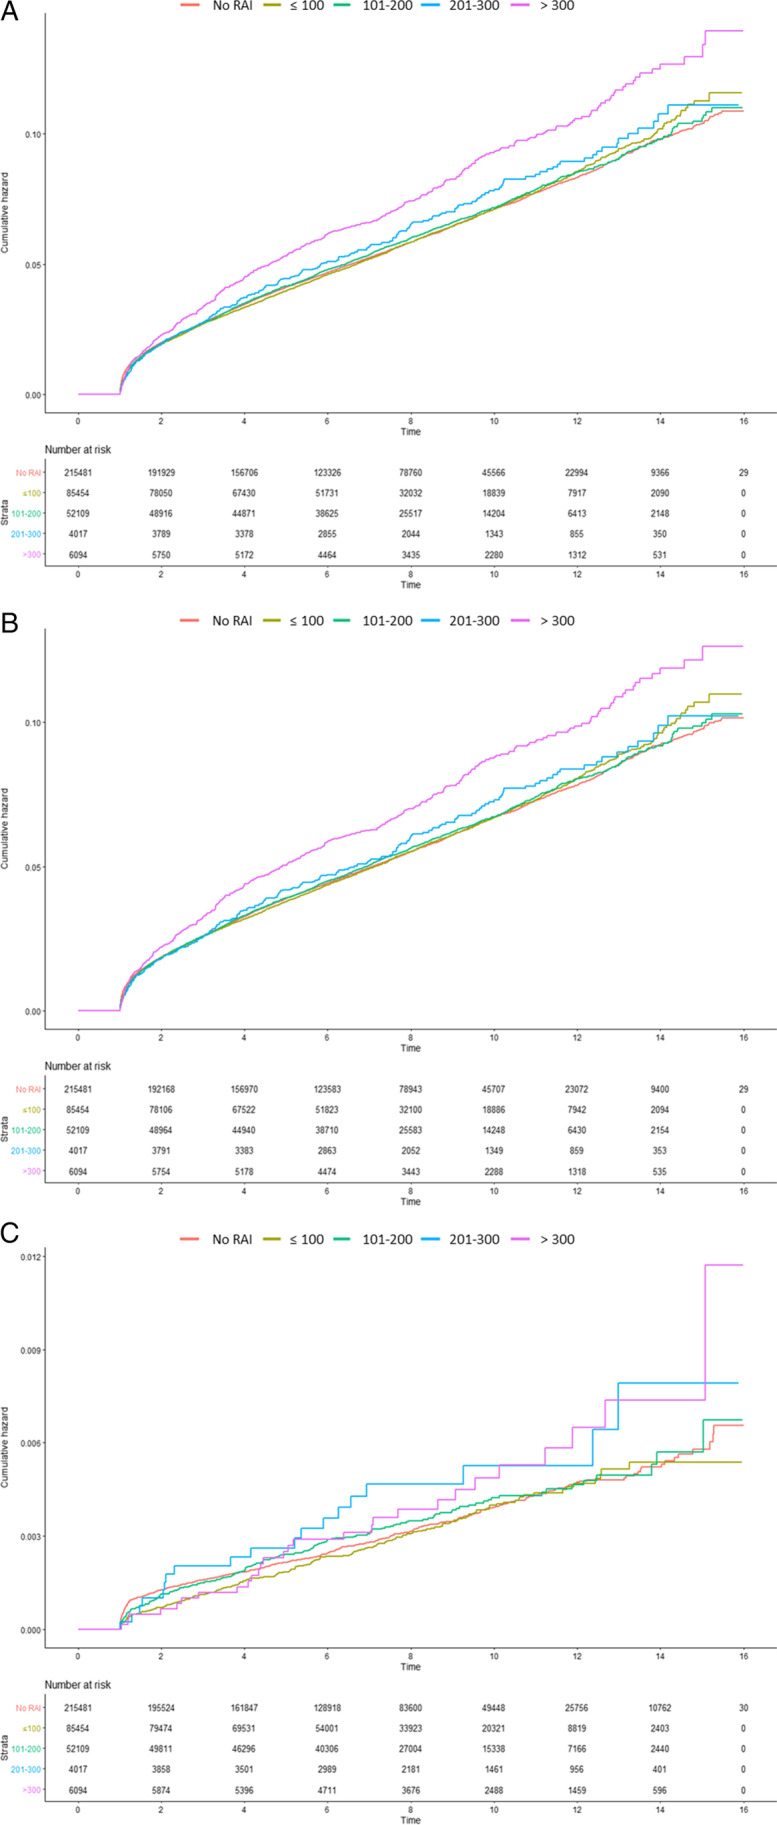
Cumulative incidence of second primary malignancy Cumulative incidence of (A) all second primary malignancy, (B) second solid cancer, (C) hematologic cancer are presented (< 3.7 GBq [< 100 mCi], 3.7–7.4 GBq [101–200 mCi], 7.4–11.1 GBq [201–300 mCi], and > 11.1 GBq [> 300 mCi]).
Table 4.
Hazard ratios of cumulative radioactive iodine dose for all cancer combined and specific cancer types
| Adjusted HR according to dose level (95% CI) | Adjusted HR according to dose level (95% CI) | Adjusted HR according to dose level (95% CI) | ||||||||||
|---|---|---|---|---|---|---|---|---|---|---|---|---|
| Total* | Male** | Female** | ||||||||||
| Type of SPM | 3.7 GBq or less | 3.71–7.40 GBq | 7.41–11.10 GBq | > 11.10 GBq | 3.7 GBq or less | 3.71–7.40 GBq | 7.41–11.10 GBq | > 11.10 GBq | 3.7 GBq or less | 3.71–7.40 GBq | 7.41–11.10 GBq | > 11.10 GBq |
| Any SPM |
1.013 (0.979–1.049) |
1.214 (1.167–1.264) |
1.422 (1.258–1.607) |
1.693 (1.545–1.854) |
0.962 (0.885–1.046) |
1.172 (1.072–1.281) |
1.083 (0.836–1.403) |
1.769 (1.505–2.079) |
1.028 (0.99–1.068) |
1.231 (1.177–1.287) |
1.553 (1.351–1.785) |
1.651 (1.478–1.844) |
| All solid cancer |
1.017 (0.982–1.054) |
1.212 (1.163–1.263) |
1.402 (1.234–1.592) |
1.696 (1.544–1.863) |
0.98 (0.899–1.068) |
1.195 (1.089–1.31) |
1.086 (0.828–1.423) |
1.809 (1.531–2.138) |
1.03 (0.99–1.071) |
1.223 (1.168–1.28) |
1.52 (1.316–1.756) |
1.642 (1.465–1.84) |
| Lip, oral cavity, and pharynx (C00-C14) |
0.906 (0.811–1.012) |
1.404 (1.251–1.576) |
1.812 (1.294–2.536) |
1.792 (1.363–2.355) |
0.672 (0.472–0.957) |
1.219 (0.886–1.677) |
1.213 (0.497–2.959) |
2.131 (1.252–3.627) |
0.94 (0.837–1.056) |
1.435 (1.268–1.625) |
1.952 (1.358–2.807) |
1.667 (1.21–2.295) |
| Esophagus (C15) |
0.618 (0.351–1.087) |
0.82 (0.441–1.524) |
0.805 (0.111–5.816) |
1.872 (0.679–5.163) |
0.468 (0.209–1.048) |
0.9 (0.435–1.862) |
0.588 (0.081–4.282) |
0.868 (0.388–1.941) |
0.635 (0.191–2.117) |
3.419 (0.461–25.336) |
6.054 (1.815–20.191) |
|
| Stomach (C16) |
1.062 (0.943–1.196) |
1.249 (1.09–1.432) |
0.859 (0.507–1.457) |
2.047 (1.551–2.702) |
1 (0.796–1.256) |
1.232 (0.967–1.569) |
0.572 (0.213–1.536) |
1.807 (1.158–2.819) |
1.092 (0.95–1.255) |
1.263 (1.07–1.49) |
1.066 (0.571–1.991) |
2.223 (1.559–3.17) |
| Colon and rectum (C18-C21) |
1.014 (0.916–1.123) |
1.26 (1.122–1.416) |
1.337 (0.919–1.945) |
1.406 (1.05–1.882) |
0.928 (0.723–1.192) |
1.093 (0.835–1.431) |
0.971 (0.431–2.184) |
1.145 (0.641–2.047) |
1.035 (0.925–1.157) |
1.306 (1.149–1.486) |
1.474 (0.966–2.248) |
1.508 (1.077–2.113) |
| Liver (C22) |
0.945 (0.794–1.124) |
1.054 (0.859–1.294) |
0.969 (0.482–1.951) |
1.803 (1.195–2.72) |
1.037 (0.751–1.433) |
1.173 (0.824–1.669) |
0.884 (0.281–2.778) |
2.281 (1.288–4.039) |
0.913 (0.743–1.122) |
1.008 (0.784–1.296) |
1.046 (0.432–2.53) |
1.481 (0.812–2.701) |
| Gallbladder and biliary tract (C23-24) |
0.981 (0.728–1.322) |
1.377 (0.99–1.915) |
1.276 (0.407–4.005) |
1.258 (0.515–3.069) |
0.947 (0.459–1.958) |
1.527 (0.757–3.081) |
2.359 (0.715–7.782) |
0.987 (0.711–1.37) |
1.339 (0.92–1.947) |
1.851 (0.589–5.817) |
0.742 (0.184–3.001) |
|
| Pancreas (C25) |
1.076 (0.856–1.353) |
0.997 (0.742–1.34) |
1.031 (0.384–2.771) |
1.421 (0.73–2.766) |
0.896 (0.515–1.559) |
1.221 (0.693–2.152) |
1.804 (0.65–5.004) |
1.121 (0.871–1.442) |
0.926 (0.654–1.311) |
1.544 (0.574–4.158) |
1.205 (0.496–2.927) |
|
| Larynx (C32) |
0.632 (0.336–1.19) |
0.674 (0.318–1.425) |
2.896 (0.9–9.318) |
2.757 (1.094–6.949) |
0.538 (0.238–1.216) |
0.67 (0.281–1.601) |
2.309 (0.554–9.624) |
2.643 (0.936–7.466) |
0.834 (0.303–2.296) |
0.66 (0.151–2.888) |
5.421 (0.716–41.039) |
3.079 (0.406–23.337) |
| Lung(C33-C34) |
1.118 (1.002–1.247) |
1.42 (1.255–1.608) |
2.192 (1.578–3.044) |
2.862 (2.276–3.601) |
0.937 (0.737–1.189) |
1.219 (0.95–1.565) |
2.256 (1.339–3.798) |
2.527 (1.72–3.712) |
1.176 (1.039–1.33) |
1.493 (1.295–1.722) |
2.094 (1.371–3.199) |
3.009 (2.26–4.005) |
| Bone and soft tissue (C40-C41) |
1.296 (0.775–2.166) |
1.267 (0.681–2.358) |
3.751 (1.161–12.12) |
12.226 (6.759–22.117) |
0.821 (0.265–2.545) |
0.811 (0.229–2.878) |
2.741 (0.356–21.115) |
1.73 (0.225–13.322) |
1.48 (0.828–2.645) |
1.446 (0.709–2.95) |
4.065 (0.972–17.01) |
18.855 (10.013–35.506) |
| Skin (C43-C44) |
0.939 (0.742–1.187) |
1.041 (0.784–1.382) |
1.725 (0.814–3.659) |
1.048 (0.494–2.223) |
1.128 (0.674–1.886) |
0.923 (0.489–1.741) |
0.785 (0.108–5.688) |
0.463 (0.064–3.354) |
0.896 (0.688–1.167) |
1.075 (0.783–1.475) |
2.156 (0.957–4.856) |
1.325 (0.589–2.985) |
| Breast (C50) |
0.989 (0.921–1.062) |
1.015 (0.93–1.108) |
1.215 (0.921–1.603) |
0.916 (0.701–1.196) |
0.841 (0.087–8.087) |
0.989 (0.921–1.063) |
1.016 (0.931–1.109) |
1.217 (0.922–1.605) |
0.918 (0.703–1.199) |
|||
| Cervix (C53) |
0.96 (0.753–1.224) |
1.237 (0.942–1.626) |
0.539 (0.134–2.17) |
1.115 (0.496–2.507) |
0.96 (0.753–1.224) |
1.237 (0.942–1.626) |
0.54 (0.134–2.17) |
1.115 (0.496–2.507) |
||||
| Uterus (C54-C55) |
1.367 (1.097–1.703) |
1.201 (0.905–1.594) |
0.581 (0.144–2.338) |
2.031 (1.078–3.828) |
1.367 (1.097–1.703) |
1.201 (0.905–1.594) |
0.581 (0.144–2.338) |
2.031 (1.078–3.828) |
||||
| Ovary (C56) |
1.209 (0.959–1.524) |
1.28 (0.967–1.694) |
0.898 (0.287–2.808) |
1.44 (0.678–3.056) |
1.209 (0.959–1.524) |
1.28 (0.967–1.694) |
0.899 (0.288–2.808) |
1.44 (0.678–3.057) |
||||
| Prostate (C61) |
1.232 (1.007–1.507) |
1.298 (1.032–1.632) |
0.931 (0.44–1.97) |
1.462 (0.919–2.326) |
1.232 (1.007–1.507) |
1.298 (1.032–1.632) |
0.931 (0.44–1.97) |
1.462 (0.919–2.326) |
||||
| Testis (C62) |
0.408 (0.049–3.391) |
0.546 (0.066–4.545) |
0.408 (0.049–3.391) |
0.546 (0.066–4.545) |
||||||||
| Kidney (C64) |
1.118 (0.923–1.353) |
1.453 (1.179–1.79) |
2.013 (1.156–3.505) |
0.986 (0.526–1.852) |
1.106 (0.801–1.529) |
1.424 (1.021–1.987) |
1.194 (0.441–3.234) |
1.661 (0.843–3.272) |
1.124 (0.887–1.423) |
1.473 (1.128–1.925) |
2.888 (1.482–5.628) |
0.212 (0.03–1.512) |
| Bladder (C67) |
1.43 (1.085–1.885) |
0.968 (0.662–1.416) |
1.032 (0.329–3.242) |
1.648 (0.807–3.366) |
1.502 (1.039–2.172) |
0.869 (0.52–1.454) |
0.488 (0.068–3.506) |
1.716 (0.747–3.94) |
1.351 (0.89–2.051) |
1.126 (0.641–1.977) |
2.322 (0.568–9.495) |
1.453 (0.355–5.941) |
| Brain and CNS (C70-72) |
0.908 (0.657–1.255) |
1.847 (1.361–2.507) |
1.693 (0.626–4.58) |
4.065 (2.381–6.941) |
0.598 (0.245–1.458) |
2.188 (1.167–4.104) |
2.761 (0.653–11.665) |
3.376 (1.174–9.709) |
0.977 (0.689–1.384) |
1.744 (1.227–2.479) |
1.218 (0.301–4.931) |
4.38 (2.357–8.139) |
| Other and ill-defined |
0.885 (0.744–1.053) |
1.157 (0.954–1.403) |
1.757 (1.05–2.939) |
1.81 (1.2–2.729) |
0.754 (0.51–1.112) |
0.975 (0.654–1.454) |
0.958 (0.304–3.018) |
1.372 (0.639–2.946) |
0.924 (0.76–1.122) |
1.219 (0.978–1.518) |
2.17 (1.221–3.856) |
2.032 (1.25–3.304) |
| All hematologic cancer |
0.949 (0.818–1.102) |
1.236 (1.048–1.458) |
1.717 (1.087–2.712) |
1.602 (1.097–2.341) |
0.781 (0.572–1.067) |
0.928 (0.665–1.294) |
1.059 (0.435–2.579) |
1.272 (0.672–2.409) |
1.01 (0.853–1.197) |
1.368 (1.131–1.655) |
2.121 (1.246–3.61) |
1.785 (1.114–2.859) |
| Non-Hodgkin's lymphoma (C82-C86, C88, C96) |
0.636 (0.51–0.793) |
0.766 (0.593–0.988) |
0.576 (0.215–1.544) |
1.274 (0.746–2.173) |
0.471 (0.295–0.751) |
0.405 (0.228–0.719) |
0.937 (0.298–2.952) |
0.746 (0.275–2.022) |
0.701 (0.546–0.902) |
0.945 (0.711–1.257) |
0.253 (0.036–1.805) |
1.663 (0.884–3.126) |
| Hodgkin's Disease (C81) |
0.894 (0.352–2.268) |
0.237 (0.031–1.782) |
1.86 (0.246–14.063) |
1.001 (0.194–5.159) |
0.86 (0.277–2.668) |
0.362 (0.047–2.783) |
3.262 (0.423–25.136) |
|||||
| Multiple myeloma (C90) |
1.101 (0.751–1.612) |
1.104 (0.685–1.78) |
1.273 (0.596–2.72) |
1.902 (0.89–4.066) |
1.049 (0.674–1.632) |
0.812 (0.429–1.537) |
||||||
| Leukemia (C91-C95) |
1.741 (1.343–2.257) |
2.759 (2.116–3.599) |
6.202 (3.635–10.581) |
3.505 (1.982–6.198) |
1.578 (0.888–2.804) |
2.42 (1.384–4.231) |
2.328 (0.556–9.749) |
4.306 (1.791–10.351) |
1.789 (1.337–2.392) |
2.869 (2.122–3.88) |
8.137 (4.574–14.474) |
2.941 (1.369–6.317) |
SPM, Second primary malignancy;
Reference: non-treatment (No RAI)
*Adjusted for age and sex
**Adjusted for age
In the subgroup analysis of SPM after adjusting for age and sex, patients who received 100 mCi or less had a significantly increased incidence of lung, uterus, prostate, and bladder cancer and leukemia compared to those who did not receive RAI (Table 4). However, patients who received 101–300 mCi RAI did not show an increased incidence of uterus cancer, patients who received more than 200 mCi did not show an increased incidence of prostate cancer, and patients who received more than 100 mCi RAI did not show an increased incidence of bladder cancer. Interestingly, a decreased incidence of non-Hodgkin’s lymphoma was observed in patients who received 200 mCi or less.
Discussion
Previous studies that conducted a systematic reviews and meta-analyses on the development of SPMs after RAI therapy have produced inconclusive results, attributed to the heterogeneity and low quality of data included. [9, 10]. To address these limitations, our study utilized the Korean NHIS database, which covers the entire population of the Republic of Korea (over 51 million). We analyzed 363,155 thyroid patients and identified 19,385 cases of SPM. Our results indicated that a total cumulative dose of 100 mCi or less of RAI did not significantly increase the incidence of SPM. However, patients who received more than 100 mCi of RAI had a significantly higher incidence of SPM.
In the subgroup analysis of each solid cancer subtype, our study found that patients who received 100 mCi or less of RAI had a higher incidence of uterus, prostate, and bladder cancer, compared to patients who did not receive RAI. However, there was no significant increase in the incidence of these cancers in patients who received more than 100 mCi of RAI. It should be noted that due to the low incidence of each SPM, small changes in the number of cases can be easily misinterpreted as large changes in proportions.
As RAI is physiologically accumulated in the salivary glands and gastric mucosa, there is concern about an increased risk of salivary gland and gastric cancer after RAI therapy. However, previous studies have produced mixed results [9, 11]. Sawka et al. reported a pooled analysis that did not show a significant increase in the risk of second stomach cancer in patients who received RAI [11]. Yu et al. conducted a meta-analysis of three studies (54,850 thyroid cancer patients, including a total of 39 s salivary gland cancer cases) and found no significant increase in the risk of salivary gland cancer [9]. Due to the low incidence of salivary gland cancer, we analyzed cancers that developed in nearby structures, including the lip, oral cavity, and pharynx (C00-C14). Our study found no significant increase in the incidence of lip, oral cavity, pharynx, and stomach cancer in patients who received 100 mCi or less of a total cumulative radioiodine dose. However, patients who received more than 100 mCi of radioiodine had a significantly increased risk of developing these cancers.
Our study found an increased incidence of lung cancer after RAI therapy, even in patients who received 100 mCi or less of radioiodine. However, due to the lack of information on smoking status in our cohort, there is a possibility that the incidence of lung cancer may have been overestimated by the combined carcinogenic effects of smoking and radiation. Similar concerns have been raised in a recent study of atomic bomb survivors in Japan, where the joint effects of smoking and radiation may have led to an overestimation of the risk for lung cancer Interestingly, our study did not find a significant increase in the incidence of breast cancer as a secondary primary malignancy after RAI therapy, despite some previous studies suggesting a link [12, 13], and others not [9, 14]. The relatively high number of breast cancer cases in our cohort (4,439 SPMs) supports the notion that there is no relationship between RAI use and the development of breast cancer.
Our study found a higher incidence of hematologic cancer in patients who received over 100 mCi of RAI, and leukemia was significantly increased after RAI treatment, which is consistent with previous studies [9, 15, 16]. Seo et al. also reported an increased overall incidence of leukemia using the Korean NHIS database, but they found no significant increase in patients who received 100 mCi or less [17]. While our study included a larger number of subjects by extending the follow-up period in the entire population, the total number of leukemia patients was only 354 out of 363,155 patients (97 out of 96,037 patients who received 100 mCi or less) in this cohort. Therefore, we could not obtain a sufficient number of each subtype of leukemia for statistical analysis using the NHIS database. Although there is a statistical difference in leukemia development between the two groups, the absolute number is still relatively small, and the clinical significance needs to be cautiously interpreted. Molenaar et al. reported a decreased incidence of multiple myeloma and no significant difference in non-Hodgkin's lymphoma [15], but our study showed no significant difference in multiple myeloma and a decreased incidence of non-Hodgkin's lymphoma. However, as the incidence of each SPM is relatively low, it is difficult to analyze the effect of RAI use on each SPM separately.
Recently, Kim et al. conducted a study analyzing SPM in 217,777 newly diagnosed thyroid cancer patients using the NHIS database at similar period [18]. However, there are differences in the operational definitions of newly diagnosed thyroid cancer between their study and ours. Specifically, they excluded patients with a history of levothyroxine prescription (n = 126,060), resulting in significant differences in the patient population compared to our study. Although some studies have shown an increased cancer risk after levothyroxine treatment, the mechanism of the association between cancer development and levothyroxine is unclear [19]. Despite these differences of operational definitions, they also found no significant increase of SPM after administration of 100 mCi or less RAI [18].
This study suggests that RAI ablation (30 – 100 mCi) can be safely performed. However, there is a need for caution with regards to additional doses of RAI, as they may increase the risk of SPM development. Previously, adjuvant RAI therapy was commonly used but has decreased in recent years due to concerns about SPM development [1]. It should be noted that patients with distant metastases have shown survival benefits with high-dose RAI therapy [3], and thus, concerns about SPM development in these patients may be limited.
Recently, use of recombinant human thyroid stimulation hormone (rhTSH) for preparation of radioiodine therapy is increasing due to less side effects, compared to the classical thyroid hormone withdrawal (THW) method. As renal function is decreased under THW status, renal clearance of RAI is much higher and radiation exposure is relatively lower under rhTSH [20]. As insurance coverage of rhTSH is started at 2013 for 100 mCi or less RAI administration, there is possibility of higher radiation exposure to study population compared to recent procedures using rhTSH.
This study has several limitations. As we used the NHIS database, we were unable to evaluate important risk factors for cancer, such as smoking, family history, and genetic status. These factors can affect the development of cancer and should be evaluated in future studies. Additionally, since the NHIS system is designed for insurance claims, there is a possibility of data contamination. While we analyzed the entire national population, the low incidence of SPM makes it difficult to analyze the differential effect of each solid cancer subtype. To differentiate the SPMs related and unrelated to the RAI therapy, further studies are required. In addition, the life span study of atomic bomb survivors, an increased risk of cancer was observed even after 50 years [4, 21], that further studies are needed to clarify the long-term effects of radioiodine.
Conclusion
The administration of a total cumulative dose of 100 mCi or less of RAI appears to be safe and without concerns of SPM. However, a dose-dependent increase in the risk of SPM was observed, indicating that the risk–benefit should be carefully considered when administering doses over 100 mCi of RAI therapy.
Acknowledgements
This study was performed based on memorandum of understanding (MOU) between Korean Thyroid Association and National Health Insurance Service.
Authors' Contributions
J Lee and CM Hong participated in the study design, drafting of the manuscript, and data acquisition and analysis. MK Hyun and JW Lee participated in data acquisition and data analysis. J Son participated in data analysis, manuscript revision, and approval of the final content of the manuscript. All authors read and approved the final manuscript.
Funding
Korean Thyroid Association supported this study.
Data Availability
The data that support the findings of this study are available from the corresponding author (J.L.) upon reasonable request.
Declarations
Ethics Approval and Consent to Participate
The institutional review board of Kyungpook National University Hospital approved this retrospective study with waiver of the need for informed consent (KNUH 2019–06-030–011). And this study was conducted in accordance with the Declaration of Helsinki.
Consent for Publication
The institutional review board at our institution approved this retrospective study, and the requirement to obtain informed consent was waived.
Conflict of Interest
Chae Moon Hong, Junik Son, Min Kyung Hyun, Jang Won Lee, and Jaetae Lee declare that they have no conflict of interest.
Footnotes
Publisher's Note
Springer Nature remains neutral with regard to jurisdictional claims in published maps and institutional affiliations.
References
- 1.Haugen BR, Alexander EK, Bible KC, Doherty GM, Mandel SJ, Nikiforov YE, et al. 2015 American Thyroid Association Management Guidelines for Adult Patients with Thyroid Nodules and Differentiated Thyroid Cancer: The American Thyroid Association Guidelines Task Force on Thyroid Nodules and Differentiated Thyroid Cancer. Thyroid. 2016;26:1–133. doi: 10.1089/thy.2015.0020. [DOI] [PMC free article] [PubMed] [Google Scholar]
- 2.Hong CM, Jeong YJ, Kim HW, Ahn BC. KSNM60 in Nuclear Endocrinology: from the Beginning to the Future. Nucl Med Mol Imaging. 2022;56:17–28. doi: 10.1007/s13139-021-00728-0. [DOI] [PMC free article] [PubMed] [Google Scholar]
- 3.Durante C, Haddy N, Baudin E, Leboulleux S, Hartl D, Travagli JP, et al. Long-term outcome of 444 patients with distant metastases from papillary and follicular thyroid carcinoma: benefits and limits of radioiodine therapy. J Clin Endocrinol Metab. 2006;91:2892–2899. doi: 10.1210/jc.2005-2838. [DOI] [PubMed] [Google Scholar]
- 4.Hsu WL, Preston DL, Soda M, Sugiyama H, Funamoto S, Kodama K, et al. The incidence of leukemia, lymphoma and multiple myeloma among atomic bomb survivors: 1950–2001. Radiat Res. 2013;179:361–382. doi: 10.1667/RR2892.1. [DOI] [PMC free article] [PubMed] [Google Scholar]
- 5.Preston DL, Ron E, Tokuoka S, Funamoto S, Nishi N, Soda M, et al. Solid cancer incidence in atomic bomb survivors: 1958–1998. Radiat Res. 2007;168:1–64. doi: 10.1667/RR0763.1. [DOI] [PubMed] [Google Scholar]
- 6.Kim S, Bang JI, Boo D, Kim B, Choi IY, Ko S, et al. Second primary malignancy risk in thyroid cancer and matched patients with and without radioiodine therapy analysis from the observational health data sciences and informatics. Eur J Nucl Med Mol Imaging. 2022;49:3547–3556. doi: 10.1007/s00259-022-05779-9. [DOI] [PubMed] [Google Scholar]
- 7.Hong CM, Shin JY, Kim BI, Song HC, Yoon JK, Won KS, et al. Incidence rate and factors associated with the development of secondary cancers after radioiodine therapy in differentiated thyroid cancer: a multicenter retrospective study. Eur J Nucl Med Mol Imaging. 2022;49:1661–1670. doi: 10.1007/s00259-021-05608-5. [DOI] [PubMed] [Google Scholar]
- 8.Seo GH, Kong KA, Kim BS, Kang SY, Moon BS, Yoon HJ, et al. Radioactive Iodine Treatment for Children and Young Adults with Thyroid Cancer in South Korea: A Population-based Study. J Clin Endocrinol Metab. 2021;106:e2580–e2588. doi: 10.1210/clinem/dgab192. [DOI] [PubMed] [Google Scholar]
- 9.Yu CY, Saeed O, Goldberg AS, Farooq S, Fazelzad R, Goldstein DP, et al. A Systematic Review and Meta-Analysis of Subsequent Malignant Neoplasm Risk After Radioactive Iodine Treatment of Thyroid Cancer. Thyroid. 2018;28:1662–1673. doi: 10.1089/thy.2018.0244. [DOI] [PubMed] [Google Scholar]
- 10.Mei X, Yao X, Feng F, Cheng W, Wang H. Risk and outcome of subsequent malignancies after radioactive iodine treatment in differentiated thyroid cancer patients. BMC Cancer. 2021;21:543. doi: 10.1186/s12885-021-08292-8. [DOI] [PMC free article] [PubMed] [Google Scholar]
- 11.Sawka AM, Thabane L, Parlea L, Ibrahim-Zada I, Tsang RW, Brierley JD, et al. Second primary malignancy risk after radioactive iodine treatment for thyroid cancer: a systematic review and meta-analysis. Thyroid. 2009;19:451–457. doi: 10.1089/thy.2008.0392. [DOI] [PubMed] [Google Scholar]
- 12.Goldman MB, Maloof F, Monson RR, Aschengrau A, Cooper DS, Ridgway EC. Radioactive iodine therapy and breast cancer A follow-up study of hyperthyroid women. Am J Epidemiol. 1988;127:969–980. doi: 10.1093/oxfordjournals.aje.a114900. [DOI] [PubMed] [Google Scholar]
- 13.Lin CY, Lin CL, Huang WS, Kao CH. Risk of Breast Cancer in Patients with Thyroid Cancer Receiving or Not Receiving 131I Treatment: A Nationwide Population-Based Cohort Study. J Nucl Med. 2016;57:685–690. doi: 10.2967/jnumed.115.164830. [DOI] [PubMed] [Google Scholar]
- 14.Ahn HY, Min HS, Yeo Y, Ma SH, Hwang Y, An JH, et al. Radioactive Iodine Therapy Did Not Significantly Increase the Incidence and Recurrence of Subsequent Breast Cancer. J Clin Endocrinol Metab. 2015;100:3486–3493. doi: 10.1210/JC.2014-2896. [DOI] [PubMed] [Google Scholar]
- 15.Molenaar RJ, Sidana S, Radivoyevitch T, Advani AS, Gerds AT, Carraway HE, et al. Risk of Hematologic Malignancies After Radioiodine Treatment of Well-Differentiated Thyroid Cancer. J Clin Oncol. 2018;36:1831–1839. doi: 10.1200/JCO.2017.75.0232. [DOI] [PMC free article] [PubMed] [Google Scholar]
- 16.Teng CJ, Hu YW, Chen SC, Yeh CM, Chiang HL, Chen TJ, et al. Use of Radioactive Iodine for Thyroid Cancer and Risk of Second Primary Malignancy: A Nationwide Population-Based Study. J Natl Cancer Inst. 2016;108:djv314. doi: 10.1093/jnci/djv314. [DOI] [PubMed] [Google Scholar]
- 17.Seo GH, Cho YY, Chung JH, Kim SW. Increased Risk of Leukemia After Radioactive Iodine Therapy in Patients with Thyroid Cancer: A Nationwide. Population-Based Study in Korea Thyroid. 2015;25:927–934. doi: 10.1089/thy.2014.0557. [DOI] [PubMed] [Google Scholar]
- 18.Kim KJ, Kim KJ, Choi J, Kim NH, Kim SG. Linear Association between Radioactive Iodine Dose and Second Primary Malignancy Risk in Thyroid Cancer. J Natl Cancer Inst. 2023;115(6):695–702. doi: 10.1093/jnci/djad040. [DOI] [PMC free article] [PubMed] [Google Scholar]
- 19.Wu CC, Islam MM, Nguyen PA, Poly TN, Wang CH, Iqbal U, et al. Risk of cancer in long-term levothyroxine users: Retrospective population-based study. Cancer Sci. 2021;112:2533–2541. doi: 10.1111/cas.14908. [DOI] [PMC free article] [PubMed] [Google Scholar]
- 20.Taieb D, Sebag F, Farman-Ara B, Portal T, Baumstarck-Barrau K, Fortanier C, et al. Iodine biokinetics and radioiodine exposure after recombinant human thyrotropin-assisted remnant ablation in comparison with thyroid hormone withdrawal. J Clin Endocrinol Metab. 2010;95(7):3283–3290. doi: 10.1210/jc.2009-2528. [DOI] [PubMed] [Google Scholar]
- 21.Grant EJ, Brenner A, Sugiyama H, Sakata R, Sadakane A, Utada M, et al. Solid Cancer Incidence among the Life Span Study of Atomic Bomb Survivors: 1958–2009. Radiat Res. 2017;187:513–537. doi: 10.1667/RR14492.1. [DOI] [PMC free article] [PubMed] [Google Scholar]
Associated Data
This section collects any data citations, data availability statements, or supplementary materials included in this article.
Data Availability Statement
The data that support the findings of this study are available from the corresponding author (J.L.) upon reasonable request.