

Abstract
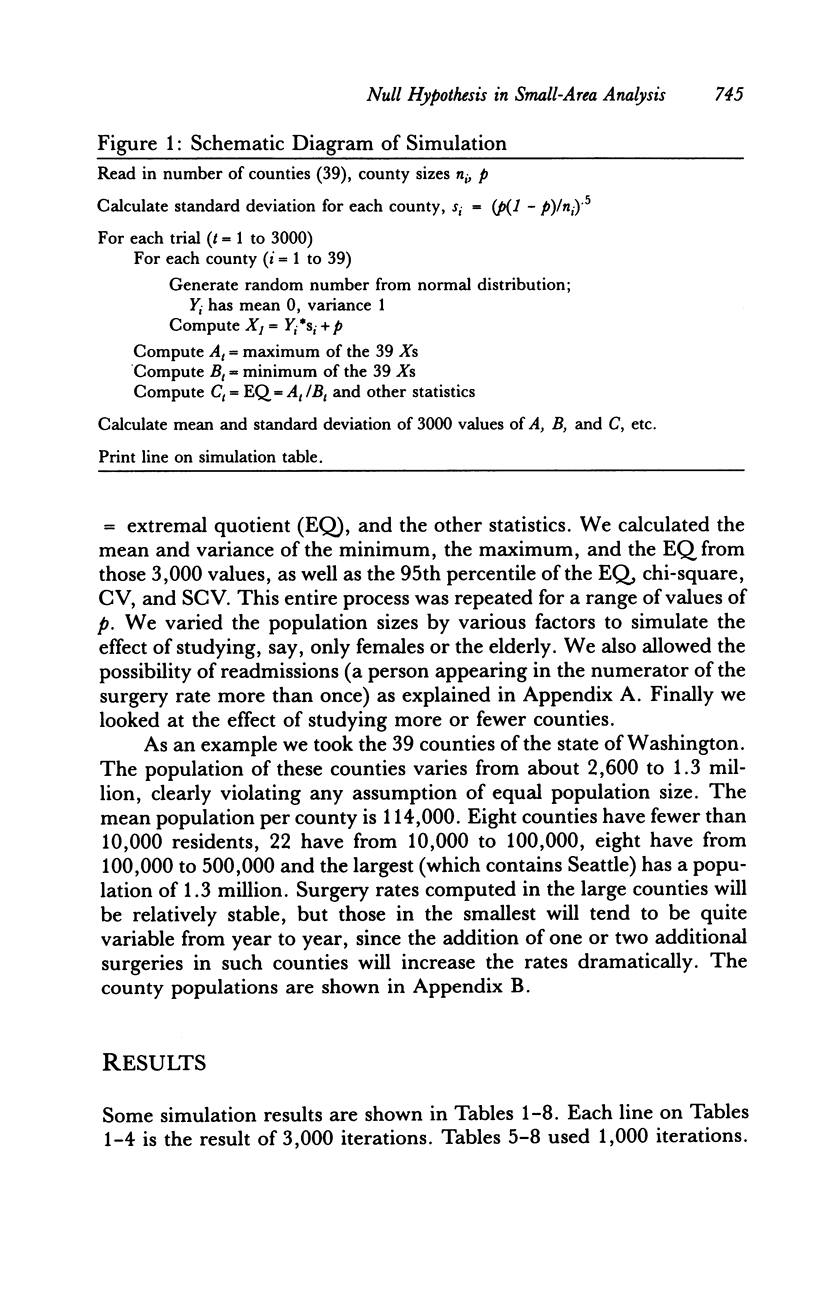
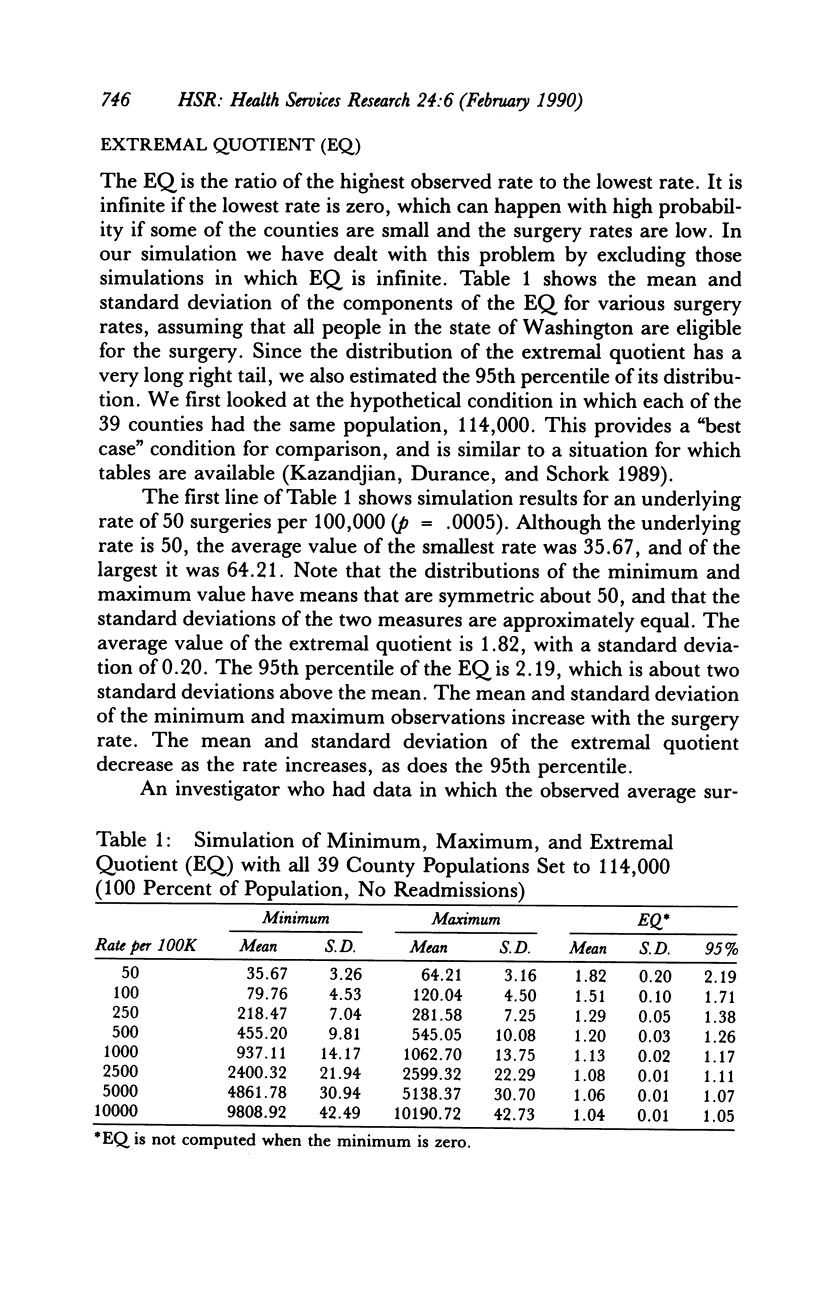
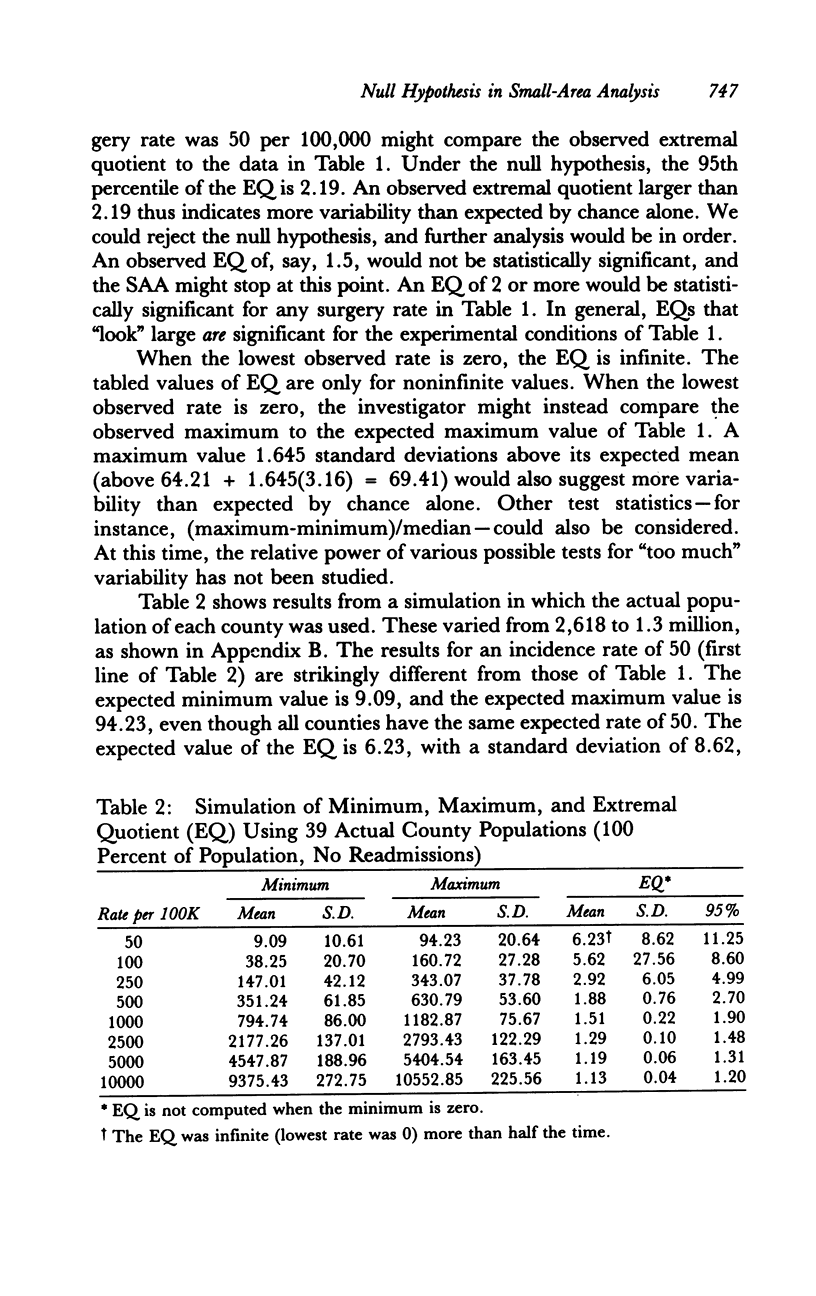
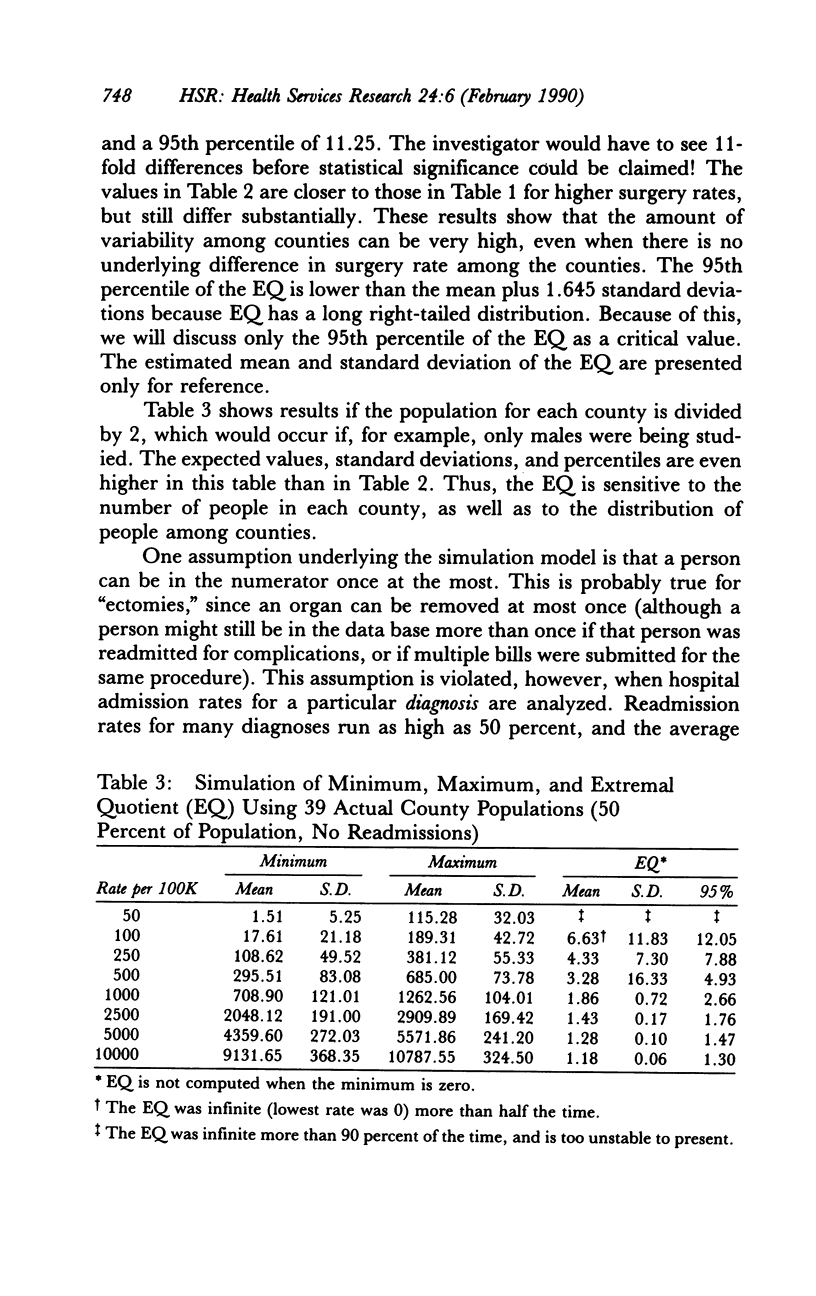
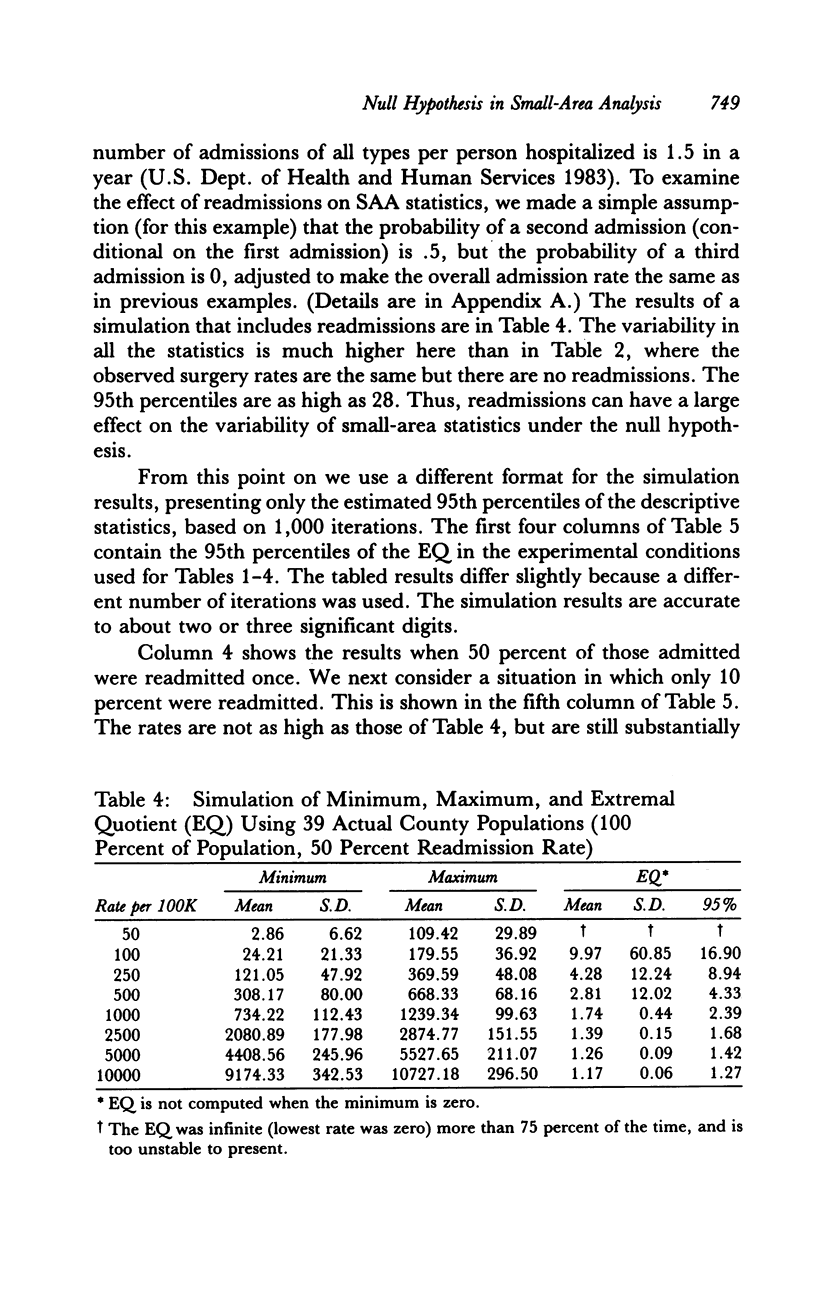
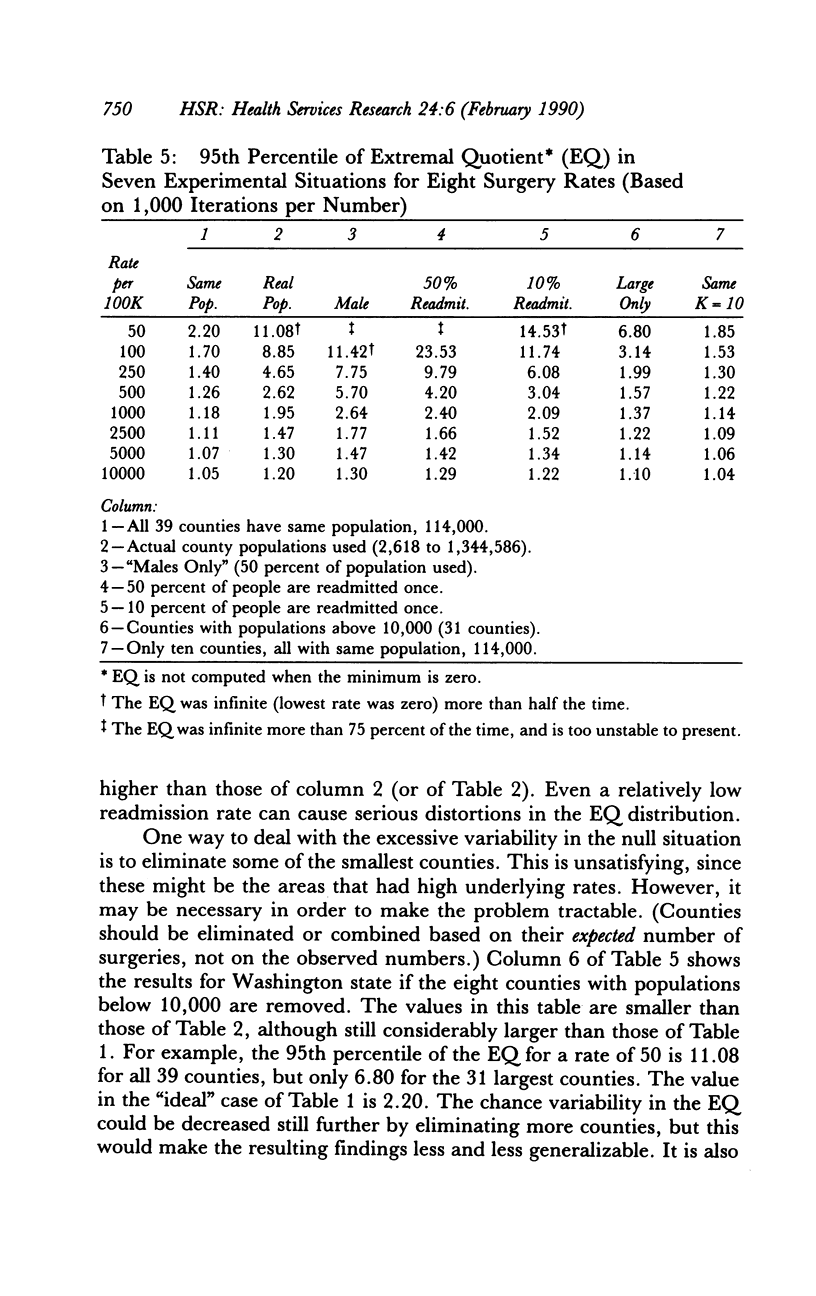
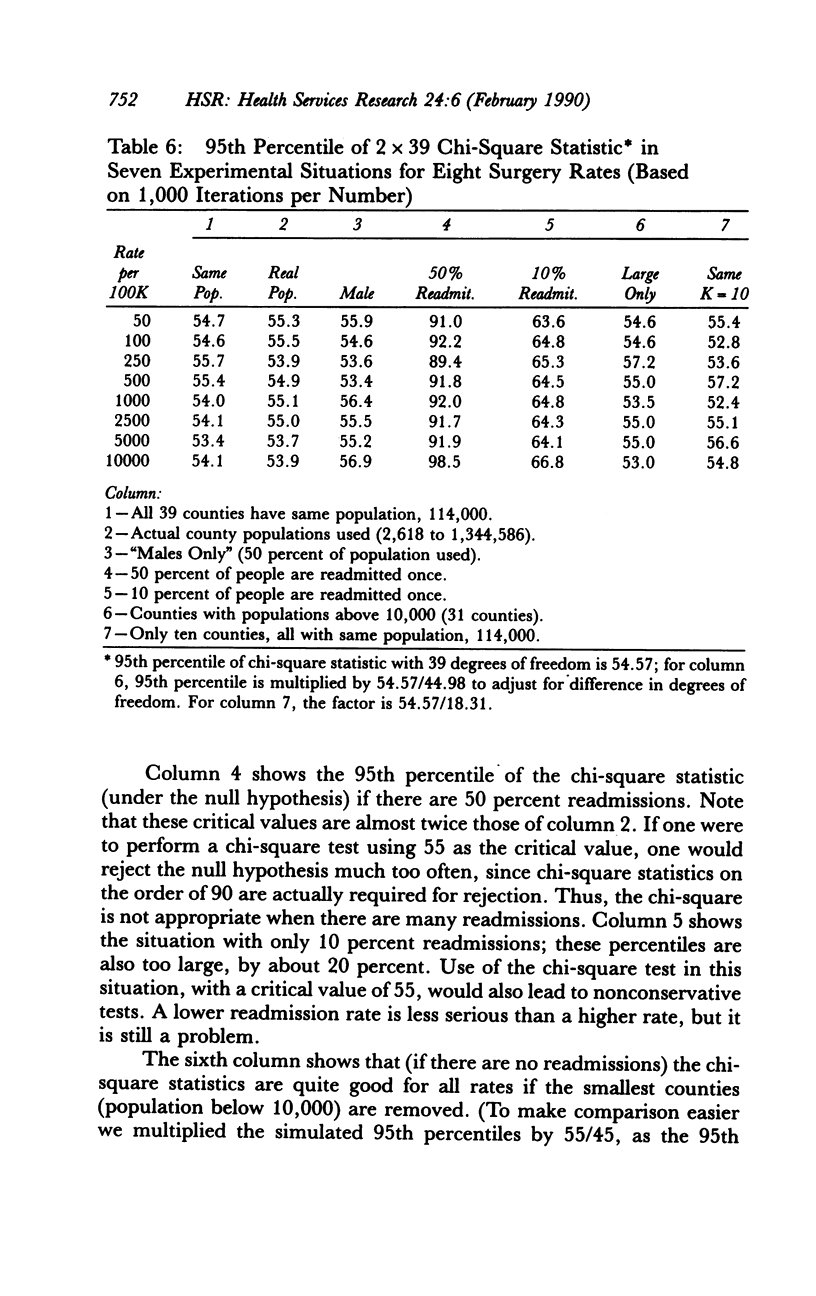
A small-area analysis (SAA) in health services research often calculates surgery rates for several small areas, compares the largest rate to the smallest, notes that the difference is large, and attempts to explain this discrepancy as a function of service availability, physician practice styles, or other factors. SAAs are often difficult to interpret because there is little theoretical basis for determining how much variation would be expected under the null hypothesis that all of the small areas have similar underlying surgery rates and that the observed variation is due to chance. We developed a computer program to simulate the distribution of several commonly used descriptive statistics under the null hypothesis, and used it to examine the variability in rates among the counties of the state of Washington. The expected variability when the null hypothesis is true is surprisingly large, and becomes worse for procedures with low incidence, for smaller populations, when there is variability among the populations of the counties, and when readmissions are possible. The characteristics of four descriptive statistics were studied and compared. None was uniformly good, but the chi-square statistic had better performance than the others. When we reanalyzed five journal articles that presented sufficient data, the results were usually statistically significant. Since SAA research today is tending to deal with low-incidence events, smaller populations, and measures where readmissions are possible, more research is needed on the distribution of small-area statistics under the null hypothesis. New standards are proposed for the presentation of SAA results.
Full text
PDF
Selected References
These references are in PubMed. This may not be the complete list of references from this article.
- Chassin M. R., Brook R. H., Park R. E., Keesey J., Fink A., Kosecoff J., Kahn K., Merrick N., Solomon D. H. Variations in the use of medical and surgical services by the Medicare population. N Engl J Med. 1986 Jan 30;314(5):285–290. doi: 10.1056/NEJM198601303140505. [DOI] [PubMed] [Google Scholar]
- Diehr P. Small area statistics: large statistical problems. Am J Public Health. 1984 Apr;74(4):313–314. doi: 10.2105/ajph.74.4.313. [DOI] [PMC free article] [PubMed] [Google Scholar]
- Kazandjian V. A., Durance P. W., Schork M. A. The extremal quotient in small-area variation analysis. Health Serv Res. 1989 Dec;24(5):665–684. [PMC free article] [PubMed] [Google Scholar]
- Knickman J. R., Foltz A. M. Regional differences in hospital utilization. How much can be traced to population differences? Med Care. 1984 Nov;22(11):971–986. doi: 10.1097/00005650-198411000-00001. [DOI] [PubMed] [Google Scholar]
- Lewis C. E. Variations in the incidence of surgery. N Engl J Med. 1969 Oct 16;281(16):880–884. doi: 10.1056/NEJM196910162811606. [DOI] [PubMed] [Google Scholar]
- McPherson K., Wennberg J. E., Hovind O. B., Clifford P. Small-area variations in the use of common surgical procedures: an international comparison of New England, England, and Norway. N Engl J Med. 1982 Nov 18;307(21):1310–1314. doi: 10.1056/NEJM198211183072104. [DOI] [PubMed] [Google Scholar]
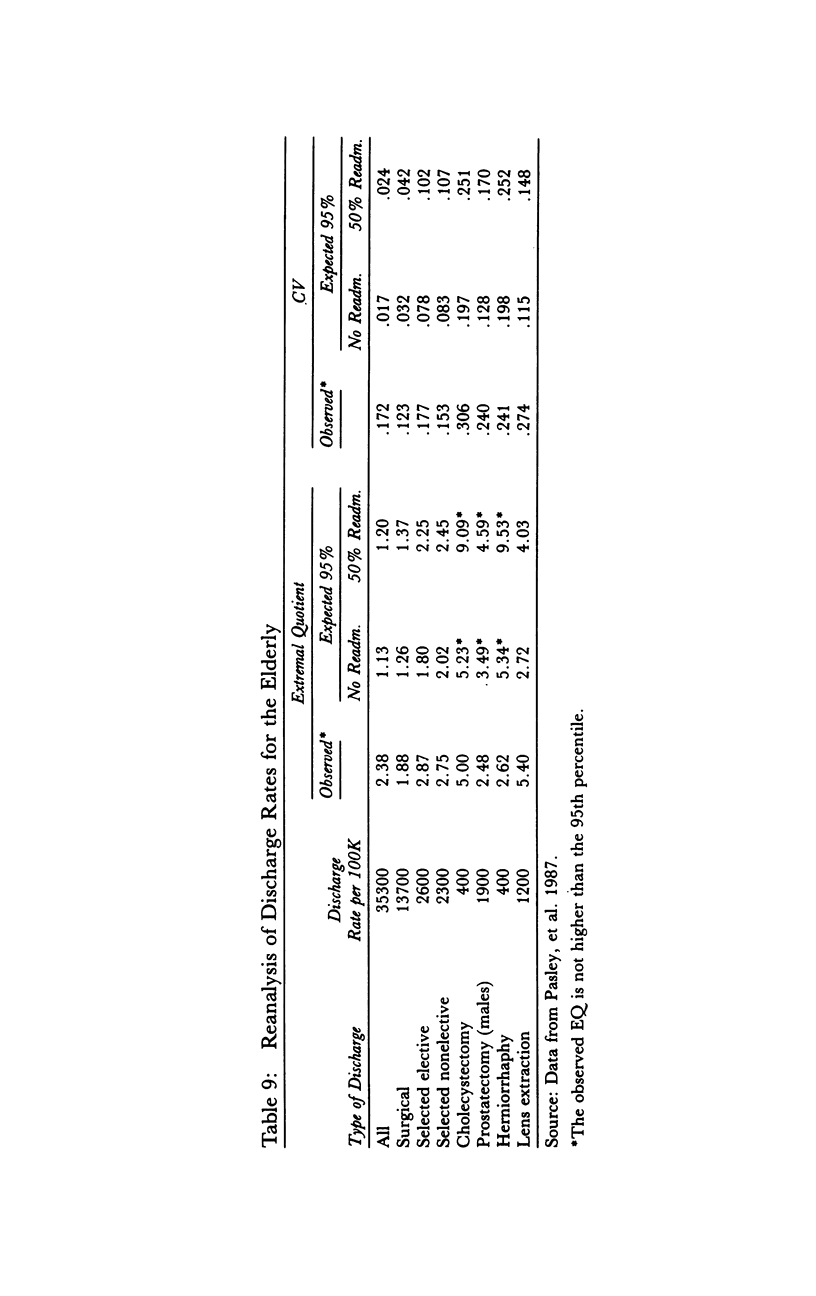
- Pasley B., Vernon P., Gibson G., McCauley M., Andoh J. Geographic variations in elderly hospital and surgical discharge rates, New York State. Am J Public Health. 1987 Jun;77(6):679–684. doi: 10.2105/ajph.77.6.679. [DOI] [PMC free article] [PubMed] [Google Scholar]
- Paul-Shaheen P., Clark J. D., Williams D. Small area analysis: a review and analysis of the North American literature. J Health Polit Policy Law. 1987 Winter;12(4):741–809. doi: 10.1215/03616878-12-4-741. [DOI] [PubMed] [Google Scholar]
- Pocock S. J., Cook D. G., Beresford S. A. Regression of area mortality rates on explanatory variables: what weighting is appropriate? J R Stat Soc Ser C Appl Stat. 1981;30(3):286–295. [PubMed] [Google Scholar]
- Tsutakawa R. K. Mixed model for analyzing geographic variability in mortality rates. J Am Stat Assoc. 1988 Mar;83(401):37–42. doi: 10.1080/01621459.1988.10478562. [DOI] [PubMed] [Google Scholar]
- Wennberg J., Gittelsohn A. Variations in medical care among small areas. Sci Am. 1982 Apr;246(4):120–134. doi: 10.1038/scientificamerican0482-120. [DOI] [PubMed] [Google Scholar]