Abstract
Purpose:
To monitor the metabolic turnover of β-hydroxybutyrate (BHB) oxidation using 2H magnetic resonance spectroscopy (2H-MRS) in conjunction with intravenous administration of 2H labeled BHB.
Methods:
Nine-month-old mice were infused with [3,4,4,4]-2H4-BHB (d4-BHB; 3.11 g/kg) through the tail vein using a bolus variable infusion rate for a period of 90 minutes. The labeling of downstream cerebral metabolites from the oxidative metabolism of d4-BHB was monitored using 2H-MRS spectra acquired with a home-built 2H surface coil on a 9.4T preclinical MR scanner with a temporal resolution of 6.25 minutes. An exponential model was fit to the BHB and glutamate/glutamine (Glx) turnover curves to determine rate constants of metabolite turnover and to aid in the visualization of metabolite time courses.
Results:
Deuterium label was incorporated into Glx from BHB metabolism through the tricarboxylic acid (TCA) cycle, with an increase in the level of [4,4]-2H2-Glx (d2-Glx) over time and reaching a quasi-steady state concentration of ~0.6±0.1 mM following 30 minutes of infusion. Complete oxidative metabolic breakdown of d4-BHB also resulted in the formation of semi-heavy water (HDO), with a four-fold (10.1 to ~42.1±7.3 mM) linear (R2=0.998) increase in its concentration by the end of infusion. The rate constant of Glx turnover from d4-BHB metabolism was determined to be 0.034±0.004 min-1.
Conclusion:
2H-MRS can be used to monitor the cerebral metabolism of BHB with its deuterated form by measuring the downstream labeling of Glx. The integration of 2H-MRS with deuterated BHB substrate provides an alternative and clinically promising MRS tool to detect neurometabolic fluxes in healthy and disease conditions.
Keywords: d4-BHB, 2H-MRS, Brain, TCA, Ketone bodies, Metabolism
Introduction
Although the human brain contributes ~2% to the entire body weight, the energy needed to support its functions is much higher (~20%) than other organs1, 2. In a healthy brain, most of this energy is derived from the oxidative metabolism of glucose, with a small fraction (3%) derived from the metabolism of ketone bodies3. However, under prolonged fasting/hypoglycemic conditions, the level of ketone bodies in blood plasma increases from <0.5 to 6.0–7.5 mM4 and their utilization can increase up to 40% to support the brain’s energy requirements5. D-β-hydroxybutyrate (BHB) is one such ketone body, which is synthesized in the liver from fatty acids and converted into acetoacetate (AcAc) by the action of BHB dehydrogenase (BDH). BHB and AcAc are released into the bloodstream and transported to the brain, kidneys, skeletal muscle, and heart where they are used as energy substrates. At target organs, BHB is converted to AcAc by BDH which is further converted into acetyl-Coenzyme A (acetyl-CoA) by the sequential actions of acetoacetate-succinyl-CoA transferase and acetoacetyl-CoA-thiolase and fed into TCA cycle to support oxidative metabolism4, 6. The presence of BDH in the brain indicates its unique capability to utilize BHB apart from AcAc. It has been shown that under fasting conditions, the concentration and activity of BDH increase substantially, further enhancing the capability of the brain to metabolize BHB7.
Impaired brain energy metabolism has been consistently observed in a variety of neurodegenerative8 and neuropsychiatric disorders9, 10, and in a majority of such conditions, it is attributed to altered glucose transport and glycolytic and TCA flux9. Because BHB is directly metabolized to acetyl-CoA in mitochondria and enters the TCA cycle, it potentially circumvents metabolic deficiencies due to dysfunctional glycolytic flux. This results in an improved cellular redox state due to decreased NAD+/NADH ratio, thus improving mitochondrial efficiency11.
Ketone bodies, BHB and AcAc, have gained traction as a potential therapeutic for a wide array of neurodegenerative and neuropsychiatric disorders such as Alzheimer’s, Parkinson’s and Huntington’s diseases, epilepsy, amyotrophic lateral and multiple sclerosis, traumatic brain injury, stroke, and alcohol use disorder 11–13. The use of ketone bodies to treat neurological disorders has been shown in early studies using the ketogenic diet and exogenous ketone administration for the treatment of epilepsy14. The proposed mechanism of action in reducing seizure occurrence is attributed to the role of BHB as a signaling molecule, binding to receptors on transporters responsible for neuronal excitability and regulating γ-amino butyric acid (GABA) levels15–17.
Oxidative cerebral metabolism and TCA flux (VTCA) are responsible for synthesizing energy-rich molecules such as NADH, FADH2 and GTP and show a strong linear correlation with brain activity. VTCA can be measured in vivo through metabolic fate studies with labeled precursors e.g., labeled glucose18, 19. Similarly, the cerebral metabolic rate of BHB oxidation (CMRBHB) in vivo reflects the extent to which this metabolite is utilized in healthy and pathological brains. Prior studies have used 1H magnetic resonance spectroscopy (MRS) to detect signals corresponding to BHB in the brain following fasting, exogenous ketone administration, and the ketogenic diet20–22. In addition, metabolic fate studies using quantitative autoradiography following infusion of [3-14C] BHB3, [1-11C] BHB positron emission tomography (PET)23, 13C and 1H-MRS following the administration of [2,4-13C2]-BHB5, 24, 25 to monitor the real-time metabolism of BHB and AcAc in human and rodent brains have also been performed. However, inherent limitations, including the need to administer a radioactive tracer or the intrinsically low sensitivity of 13C and the technical complexity associated with these modalities, have limited their clinical translation as a diagnostic tool.
Another promising approach for metabolic mapping uses 2H-MRS, termed DMRS, to observe the downstream labeling of glutamate/glutamine (Glx), as well as other metabolites, following the administration of 2H labeled substrates26–29. Monitoring Glx labeling from a 2H labeled substrate allows the estimation of VTCA28. Although 2H has low MR sensitivity due to its low gyromagnetic ratio (6.54 MHz/T), its short longitudinal (T1) relaxation time can be exploited by rapid signal averaging to increase the signal-to-noise ratio (SNR). In addition, the low natural abundance (0.01156%) of 2H results in nearly undetectable metabolite background signals, while 10.12 mM naturally abundant semi-heavy water (HDO) in the brain serves as an internal reference for quantification26, 28.
BHB metabolism occurs exclusively in the mitochondria and thereby bypasses the glycolytic pathway and pyruvate dehydrogenase flux12. Thus, in addition to quantifying ketone metabolism as it relates to ketogenic therapies, the use of labeled BHB may provide a better insight into TCA cycle flux through the oxidative flow of acetyl-CoA into downstream TCA metabolites. In the current study, we monitored the cerebral oxidative metabolism of d4-BHB for the first time using in vivo 2H-MRS by observing label accumulation in Glx and HDO. A preliminary model was used to assess rates of BHB and Glx turnover.
Methods
Animal preparation
The protocol used for animal experiments was approved by the Institutional Animal Care and Use Committee (IACUC) of the University of Pennsylvania. The study was performed using 9-month-old C57BL6/J mice (n = 5; 3 male and 2 female). Mice were procured from Jackson laboratory and maintained in a 12/12-hour light/dark cycle and an ad libitum access to food and water in the institutional animal care facility. Mice were fasted with access to water ~10 hours before the experiment. Prior to spectroscopic acquisitions, mice were anesthetized using isoflurane (1.6%) mixed with Air: O2 (70:30). The tail vein was catheterized using a 27-gauge IV catheter and secured once the free flow of blood through the catheter was achieved. Using a thin tubing (inner diameter 0.38 mm; Scientific Commodities, Inc., Arizona, USA), the catheter was attached to an infusion pump (Harvard Apparatus, Holliston, MA, USA) for the administration of the d4-BHB tracer (1 mol/L in normal saline; pH 7.0; Cayman Chemical Company, MI, USA). The mouse head was placed inside a custom-designed 3D printed conical head restrainer mounted with a home-built four-turn 2H surface coil (diameter: 10 mm) tuned to 61.33 MHz (Figure 1A). A pressure pillow beneath the chest and a thermal rectal probe was placed for continuous monitoring of mouse respiration and body temperature. The restrainer was placed inside a 20 mm diameter volume 1H transceiver coil (m2m Imaging Corp, USA) such that the center of the 2H surface coil aligned with the isocenter of the 1H volume coil. This setup was placed inside a 9.4T horizontal preclinical magnet (diameter 30 cm) interfaced with an Avance III HD console (Bruker BioSpin, Ettlingen, Germany; running ParaVision 6.1) for MRI/MRS scans. The animal body temperature was maintained at 37⁰C and respiration was maintained between 70–100 breaths per minute throughout the experiment by adjusting levels of isoflurane.
Figure 1. A.
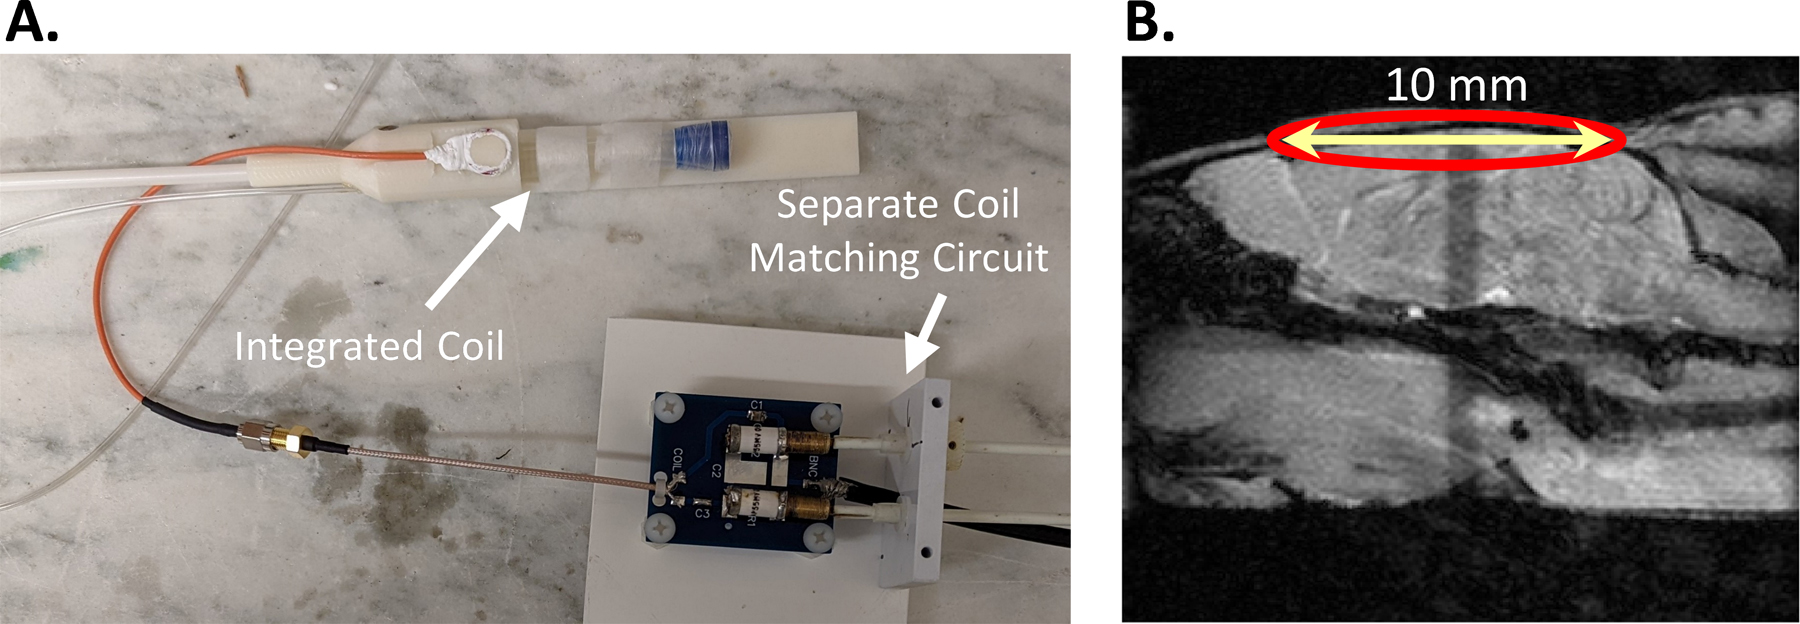
Shows the 3D printed mouse head restrainer mounted with a home-built 2H surface coil connected with a matching circuit and B. A sagittal anatomical image showing the position of the coil.
Substrate Infusion and 2H-MRS Acquisition
The mouse head position inside the magnet was centered using 1H localizer images followed by the acquisition of axial T1-FLASH and T2-MSME images using 1H volume transceiver coil. A schematic showing the position of the coil with respect to anatomical images is shown in Figure 1B. Magnetic field homogeneity was optimized over the entire brain volume under the surface coil using localized 1st and 2nd order shimming with the MapShim Bruker Macro. The 2H flip angle was optimized to maximize the SNR. 2H MRS was performed using a pulse-acquire sequence (bandwidth = 1500 Hz, FA = 50°, 256 points, 2500 averages, and TR = 150 ms; acquisition time: 6 minutes 15 seconds). A baseline spectrum was acquired to detect background 2H signals, where we observed only a clear resonance of semi-heavy water (HDO) at 4.8 ppm with a linewidth of ~ 20 Hz and an estimated SNR of ~ 15 (Figure 2A). Subsequently, d4-BHB was administered using an infusion protocol, designed so that the d4-BHB level attains a steady state at around 15 minutes and remains stable throughout the remainder of the infusion. The infusion was started with administration at a rate of 8.4 ml/min/kg for 15 seconds and was reduced to 1.68 ml/min/kg for the next 3.75 minutes. The rate was further stepped down to 0.84 and 0.42 µl/min by the end of the 4th and 8th minute, respectively, and was maintained till the end of the acquisition (90 minutes). 2H MRS acquisition was started at the beginning of the infusion, and a total of 15 spectra including the baseline were acquired with a temporal resolution of 6.25 minutes for a total scan time of 87.5 minutes. As a control experiment, one mouse was also infused with unlabeled BHB (1M, pH 7.0) and 2H MRS data was acquired in a similar fashion for 60 minutes. For further comparison of the extent of Glx labeling from BHB to that from glucose, we infused one mouse with 1M [6,6]-d2-glucose (d2-Glc; Cambridge Isotope Laboratories, MA, USA) with a dose of 4.34 g/kg. The infusion protocol for glucose was that same as that described above for d4-BHB.
Figure 2. A.
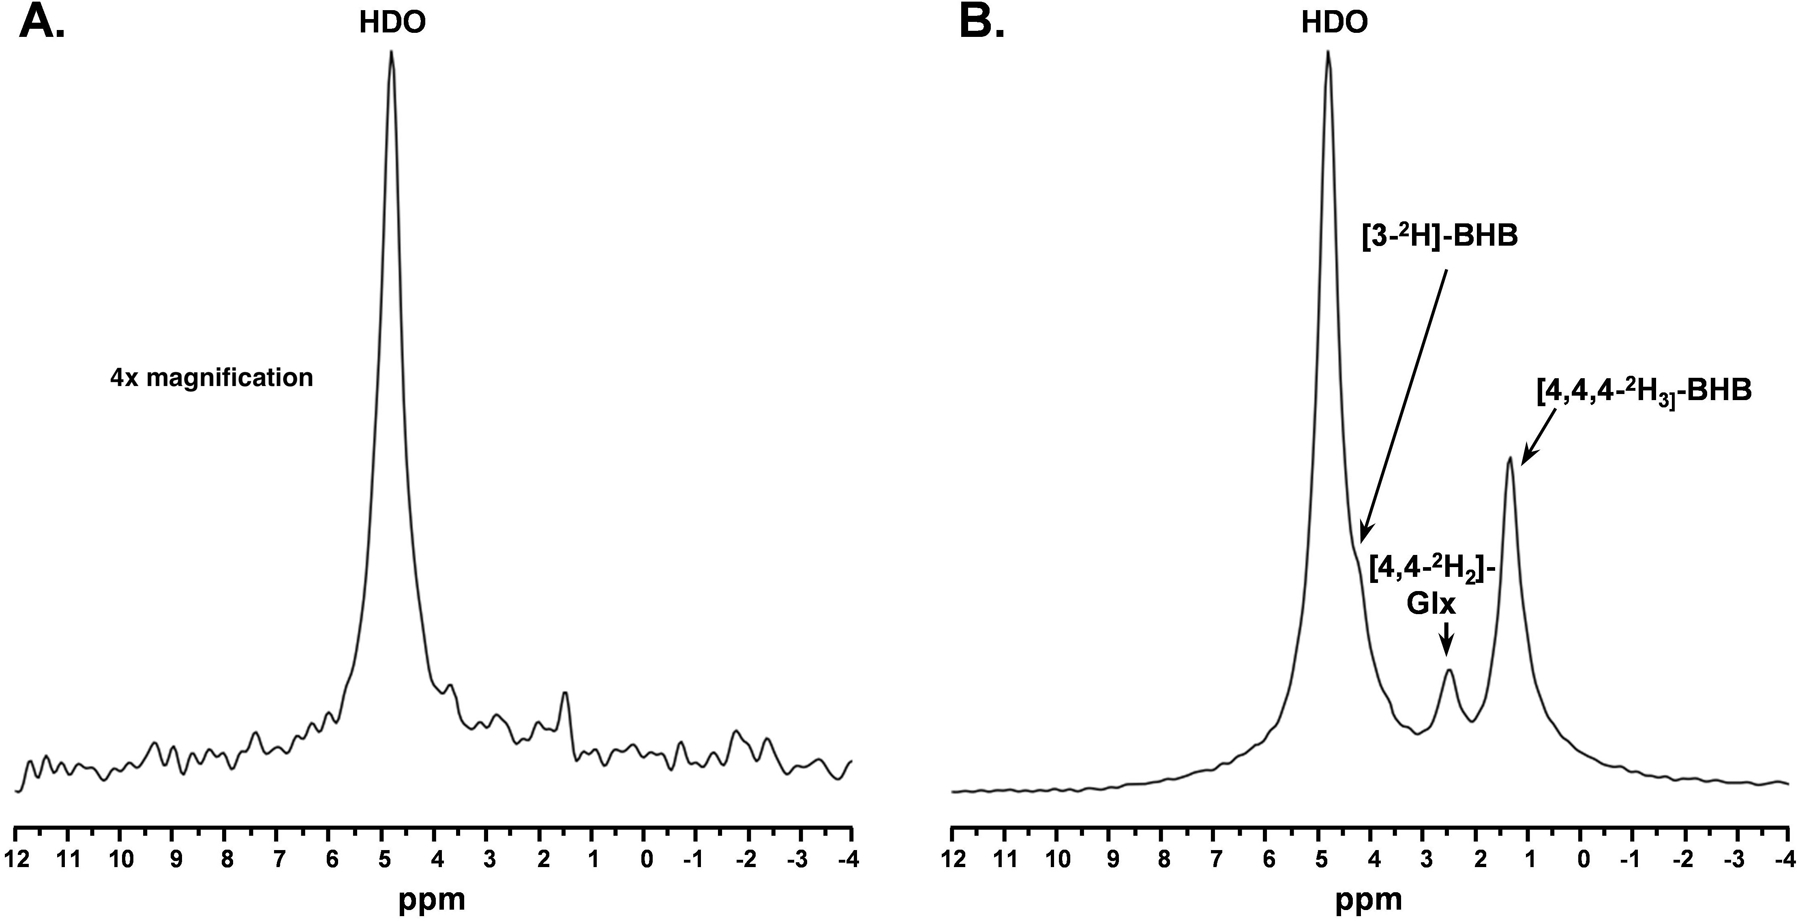
Baseline 2H MR spectra (4x vertically magnified) prior to infusion of d4-BHB and B. A representative spectrum was acquired 43.75 minutes post-infusion with three observable peaks corresponding to HDO (4.8ppm), 3-CD-BHB (4.2ppm), 4,4-CD2-Glx (2.4ppm), and 4,4,4-CD3-BHB (1.3ppm).
Spectral processing, metabolite quantification, and time course analysis
Raw FID signals were transformed into the frequency domain with a 5 Hz exponential line broadening filter to increase SNR using Mnova 14.3.0 (Mestrelab, Spain). To further improve the SNR, all 2H spectra were denoised using singular value decomposition (SVD)30 in the frequency domain (Figure 3). A Casorati matrix was constructed with the FID points along one dimension and the temporal array of spectra along the other dimension (m x n: 15 × 512). SVD was performed on this matrix, and the first three singular values were selected for the reconstruction of the denoised matrix under the assumption that three resonance signals were expected following the infusion of the substrate. All resonance signals were fitted using the Lmfit package in Python 3.9.7 using Lorentzian line shapes. To determine the effects of the denoising method, the SNR (ratio of signal amplitude to standard deviation in the noise) was calculated for the baseline spectra pre- and post-denoising, yielding a ~five-fold increase in SNR. The fitted peak integrals of HDO, BHB, and Glx were normalized to that of the baseline HDO signal. The signal from the deuteron at C3 of BHB is not identifiable in the spectrum due to overlap with the large HDO peak. To correct for this overlap, the peak integral of the observed BHB signal corresponding to the deuterons attached to C4 was divided by three (accounting for the ratio of deuterons between carbons) and subtracted from the HDO peak integral. The concentration of the naturally abundant HDO was determined to be 10.12 mM27 based on prior studies using the natural abundance of 2H and the tissue water fraction in a mouse brain. To determine the T1 saturation effects of each metabolite, we utilized previously measured T1 values for deuterated Glc, Glx, and HDO27. For the T1 measurement of BHB, we utilized a vertical 9.4T Bruker Avance III magnet with a nonselective adiabatic inversion pulse followed by 12 inversion times logarithmically spaced from 10 milliseconds (ms) to 3000 ms with a TR of 3000 ms. The T1 of the signal corresponding to the [4,4,4]-2H3C deuterons of BHB was determined to be 264 ms at 37⁰C. The concentration of the metabolites was subsequently calculated as follows:
| (1) |
where Aream: metabolite peak integral, AreaHDO: HDO peak integral, dHDO: number of magnetically equivalent deuterons in HDO, dmet: number of magnetically equivalent deuterons in metabolite, T1met: the correction factor for T1 saturation of the metabolite, defined as (1 – exp{-TR/T1})/(1 – cos(⍺)exp{-TR/T1}), where ⍺ is the nominal flip angle used for excitation, T1HDO: the correction factor for the T1 saturation of HDO, defined with the same function as T1met.
Figure 3.
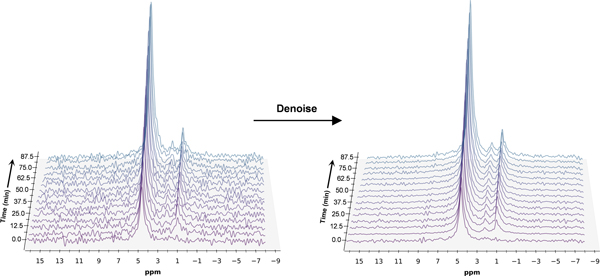
Time series plot of 2H spectra obtained with a temporal resolution of 6.25 minutes, showing the evolution of BHB, Glx, and HDO. Spectra are presented before and after denoising, with substantial improvement in SNR for all observable metabolite peaks
To derive the turnover curves of d4-BHB, d2-Glc, and d2-Glx, their concentrations were fit using a standard exponential model defined as follows:
where Cmax is the maximum concentration in mM and k is the rate of increase in min-1.
Results
A representative spectrum taken at 43.75 minutes post-infusion of d4-BHB is shown in Figure 2B, where three distinct resonances corresponding to semi-heavy water (HDO, 4.8 ppm), [4,4-2H2] -(glutamate/glutamine) (d2-Glx, 2.4 ppm), and [4,4,4-2H3]-BHB (d3-BHB, 1.3 ppm) are clearly visible. A time-course spectrum with a temporal resolution of 6.25 minutes shows the evolution of the signals of the identified resonances following the infusion. After denoising, a significant improvement in SNR can be seen (Figure 3). The average concentrations of d2-Glx and d3-BHB for each time point are plotted over the course of the d4-BHB infusion as shown in Figure 4A. The average concentrations of HDO from unlabeled and d4-BHB for each time point are plotted over the course of the infusion as shown in Figure 4B. The level of d4-BHB in the brain steeply increased to ~2.4 ± 0.9 mM within ~15 minutes of infusion and remained steady throughout the course of the infusion. As a result of BHB metabolism, an increase in the level of d2-Glx was observed with time until a quasi-steady state concentration of ~1.32±0.06 mM was attained following 30 minutes of infusion (Figure 4A). Also, the level of HDO continued to increase linearly (R2 = 0.998) throughout the infusion with an approximately four-fold increase (10.1 to ~42.1 ± 7.3 mM) in concentration. As expected, the level of HDO from the mouse infused with unlabeled BHB remained constant for the 60 min measurement period (Figure 4B) and no other resonance was observed.
Figure 4 A.
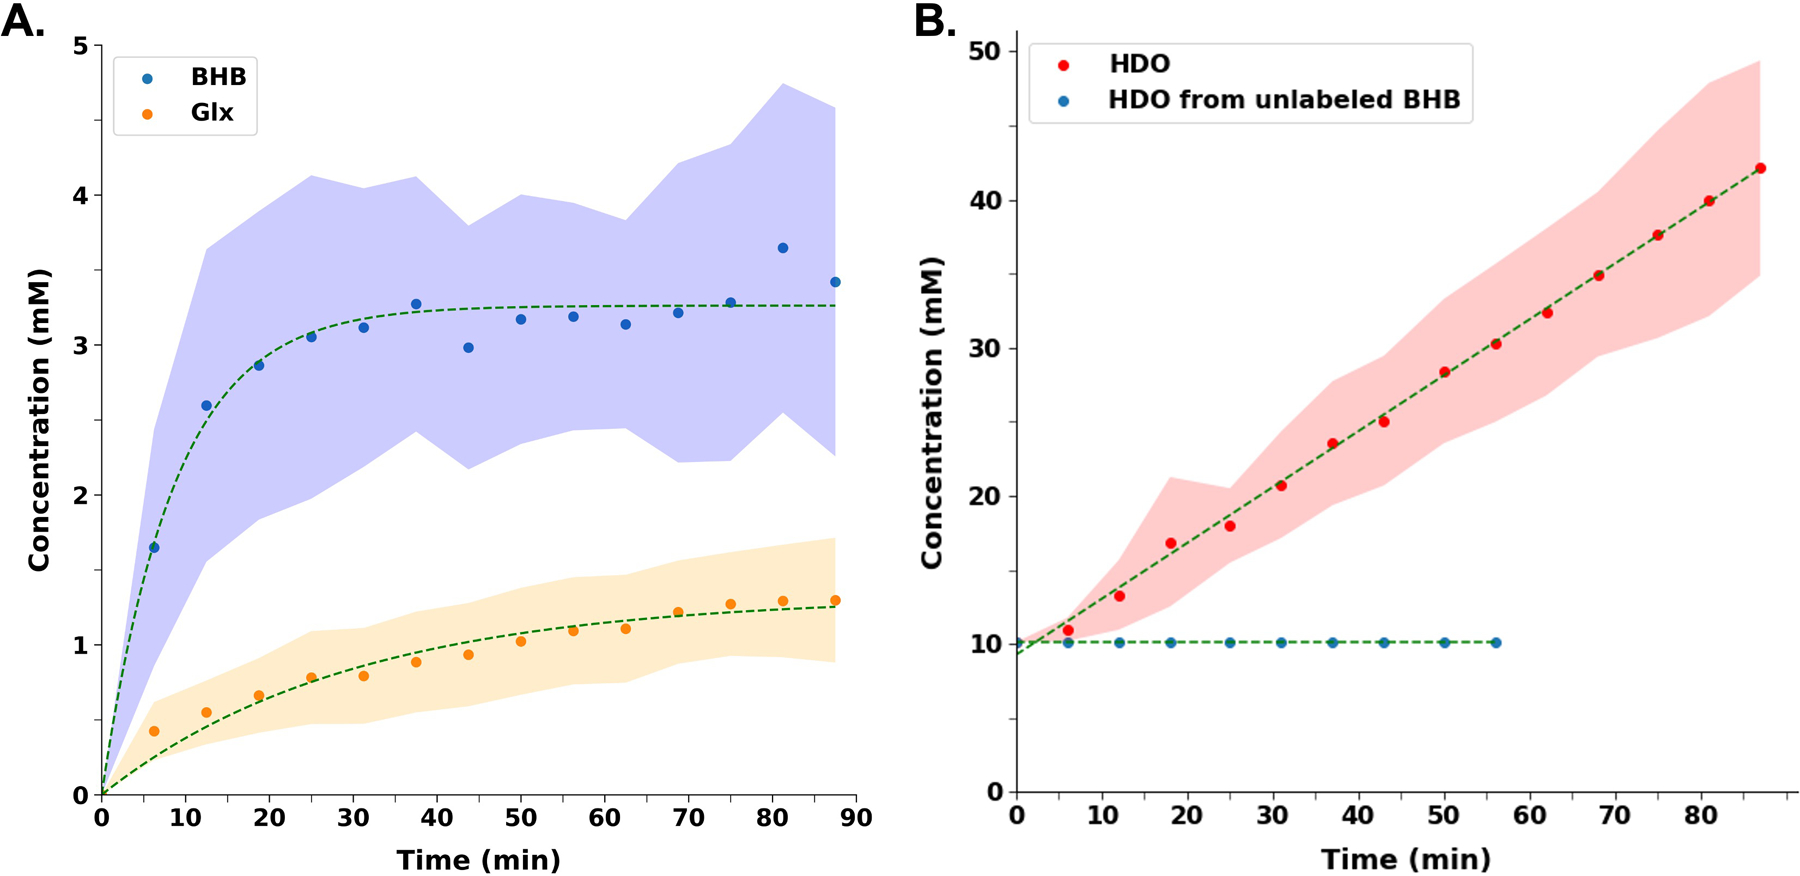
Turnover curves showing the concentration of d4-BHB (blue dots) and d2-Glx (orange dots) as a function of time. BHB concentration increases until a stable concentration is reached, while Glx concentration increases until a quasi-steady state concentration is reached. B. Concentration of HDO (red dots) as a function of time following d4-BHB infusion. HDO concentration continues to increase linearly until the end of the infusion with an approximately four-fold increase in concentration. HDO from unlabeled BHB (blue dots) remains constant at approximately 10.12 mM, with infusion stopping at 56.25 minutes since no observable changes in the HDO signal were detected. In both plots, dots represent the mean value and shaded regions represent standard deviations for each time point and are interpolated between time points to achieve a smooth curve
A time series spectrum is shown in Figure 5 where evolution of [6,6-2H2]-glucose (d2-Glc; 3.8ppm), d2-Glx (2.4ppm), [3,3-2H2]-lactate (1.4 ppm) and HDO (4.8ppm) resonances can be seen. Following the infusion of labeled Glc, the level of labeled d2-Glc reached a steady-state concentration of 10.1±0.1 mM within ~25 minutes of infusion (Figure 6A). Furthermore, the level of labeled d2-Glx reached a steady state of 1.99±0.01 mM within ~30 minutes of infusion (Figure 6B). The rate constants of BHB and Glx turnover from d4-BHB were determined to be 0.12±0.01 min−1 and 0.034±0.004 min-1. In comparison, the rates of Glc and Glx turnover from d2-Glc were determined to be 0.063±0.008 min−1 and 0.060±0.006 min−1, respectively.
Figure 5.
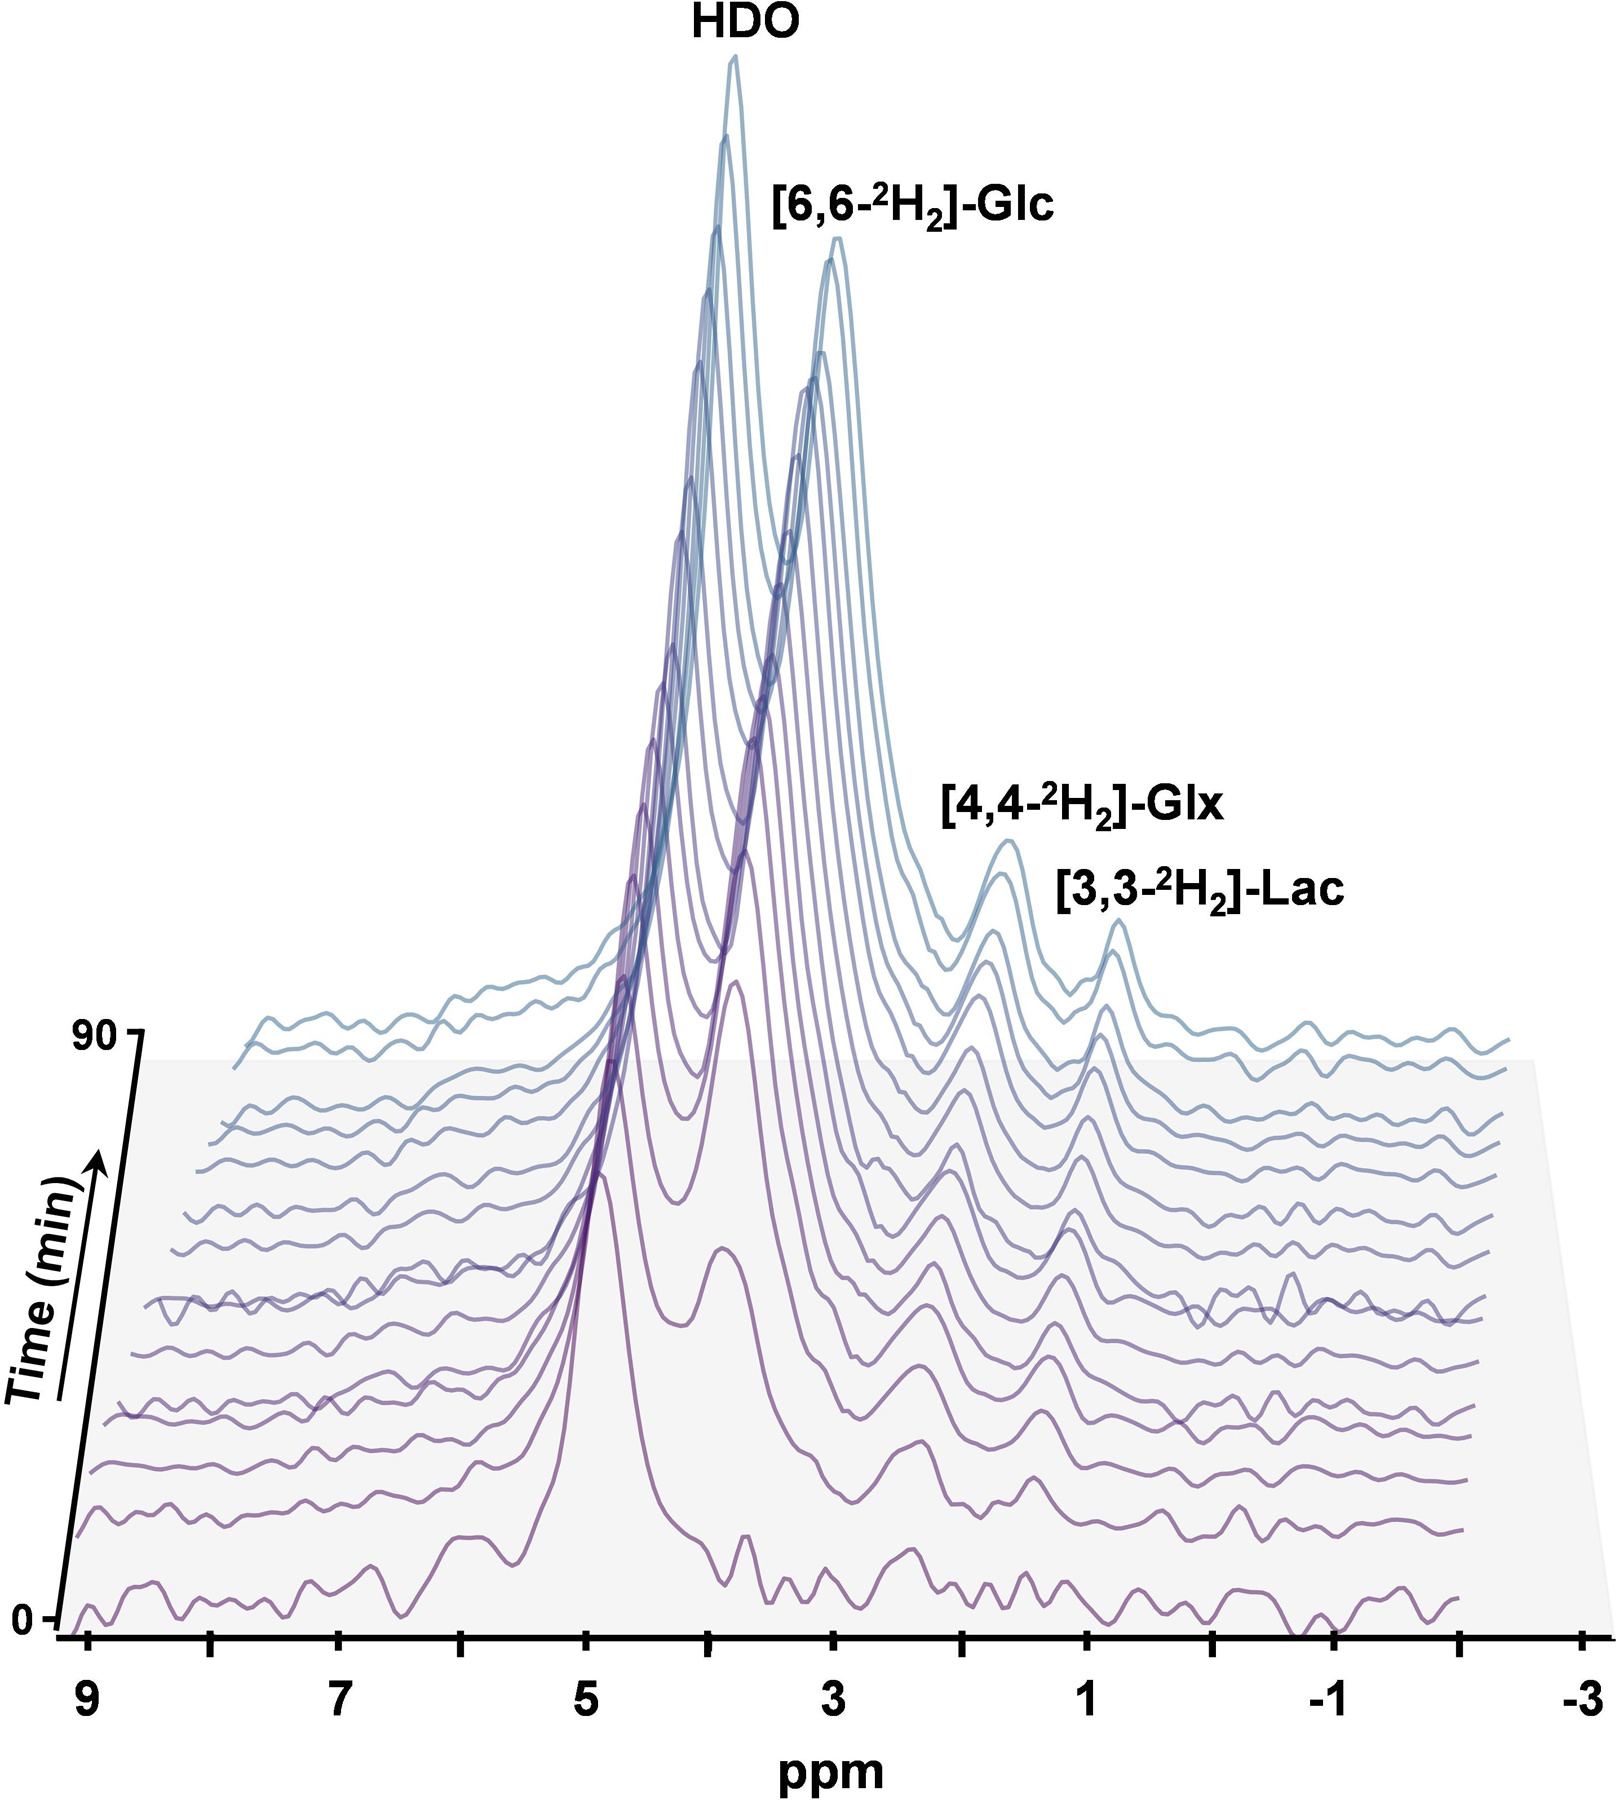
Time series plot of denoised 2H spectra obtained after the infusion of d2-glucose with a temporal resolution of 6.25 minutes, showing the evolution of [6,6-2H2]-glucose (3.8ppm), [4,4-2H2]-Glx (2.4ppm), [3,3-2H2] Lactate (1.4 ppm) and HDO (4.8ppm).
Figure 6 A.
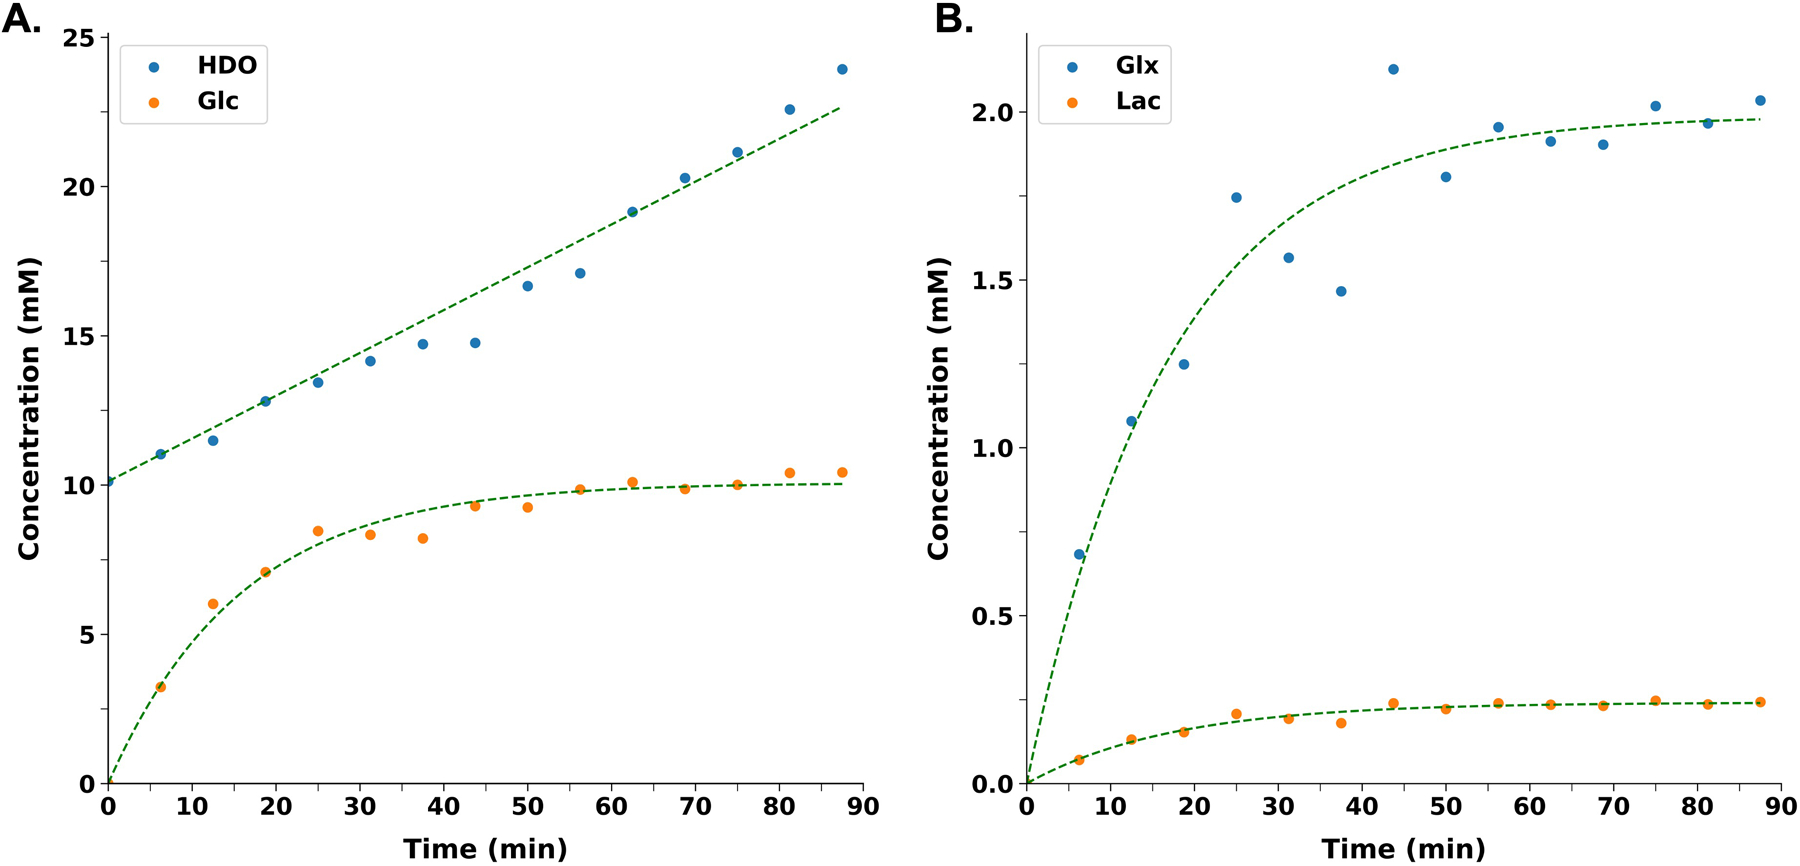
Turnover curves showing an increase in the level of d2-Glc (orange dots) following the infusion as a function of time, until a stable concentration is reached. Metabolism of d2-glucose yields water at last and a linear increase in the level of HDO (blue dots) can also be seen in the plot. B. Metabolism of d2-Glucose results into labeling of Glx and lactate. Curves presented show the exponential increase in the levels of d2-Glx (blue dots) and d2-lactate (orange dots) with time until a quasi-steady state concentration is reached. In both plots, dots represent the value from one mouse for each time point and are interpolated between time points to achieve a smooth curve
Discussion and Conclusions
In this study, for the first time, we report the use of d4-BHB infusion during 2H-MRS to observe the cerebral ketone body metabolism. Existing literature on measurements of cerebral metabolic rates and TCA cycle using BHB precursors is very limited. To determine cerebral metabolic rates of substrate utilization and TCA cycle flux, a known input function of the labeled substrate as a time-dependent function is required. These input functions are often models of substrate concentration in the blood plasma following infusion, with blood collected at regular intervals during infusion. Due to the non-trivial methods of blood collection from mice, and the significant volume of blood necessary for quantitative measures, this study did not use a kinetic model to calculate CMRBHB and VTCA. A standard exponential model was fit to the data to determine the rate of label turnover and to aid in the visualization of the metabolite time courses. Based on the determined turnover rates from BHB metabolism, the rate of BHB turnover (0.12±0.01 min−1) was higher than the rate of Glx turnover (0.034±0.004 min−1), which is expected due to relatively low ketone body metabolism and competitive dilution from glucose metabolism. In comparison, the rate of labeled glucose turnover (0.063±0.008 min−1) and Glx turnover (0.060±0.006 min−1) from d2-Glc metabolism were similar, which shows a rapid conversion of glucose to Glx in the brain and suggests glucose as the preferred substrate to fulfill cerebral energy demand. Interestingly, the rate of BHB turnover was higher than the rate of glucose turnover, which may be attributed to the higher fractional enrichment of labeled BHB in the blood compared to labeled glucose. Consequently, the uptake of labeled BHB by the brain may be higher, but due to competing effects of glucose metabolism, its conversion to downstream Glx is much slower than that observed from labeled glucose infusion. Although glucose is readily metabolized, prolonged fasting and conditions of glucose hypometabolism may alter cerebral tissue preferences for alternative energy substrates, such as ketone bodies and BHB. Consequently, it remains an important task to monitor rates of BHB uptake and metabolism in both normal and pathological conditions.
Compromised brain glucose metabolism has been associated with a variety of neurological conditions and can be attributed to impaired glucose transport, glycolysis, or oxidative phosphorylation (OXPHOS). Some reports suggest a decoupling between glucose transport, glycolysis, and OXPHOS in neurodegenerative disorders such as AD31–33 and other neurodegenerative diseases34. Measurement of VTCA using a labeled glucose tracer may be affected due to such decoupling. Since, ketone bodies bypass glycolysis and enter the TCA cycle directly after getting converted into Acetyl-CoA, the use of labeled BHB for the measurement of oxidative metabolic fluxes might serve as an alternative and promising strategy. Metabolism of d2-glucose via glycolysis and pyruvate dehydrogenase yields 2,2-d2-Acetyl-CoA which enters the TCA cycle and loses 1/3rd label in the very first step and forms 4,4-d2-Glx (66.6%) and non-deuterated Glx (33.3%). Despite of the fact that the contribution from ketone bodies/BHB metabolism towards cerebral energy needs is lower than that of glucose, a 100% yield of 2,2,2-d3-Acetyl-CoA and hence 4,4-d2-Glx from metabolism of d4-BHB is helpful in improving the signal. In this study, we observed that the d4-BHB was readily utilized, and the deuterons were incorporated into detectable d2-Glx and HDO signals within 6.25 minutes.
Metabolism of BHB forms AcAc and acetone prior to downstream metabolism. In the current study, the metabolism of d4-BHB will form acetoacetate ([4,4,4-2H3]-AcAc) and [1,1,1/3,3,3-2H3]-acetone resonating at 2.27 and 2.22 ppm, respectively, in the 2H-NMR spectra. Given the limited spectral resolution of 2H MR, these signals will overlap with and be indistinguishable from Glx at 2.34 ppm. Consequently, it is very important to address the extent of contamination from these metabolites. To understand the extent of contamination, previous studies were explored in which [2,4-13C2] BHB was infused to measure BHB metabolism in rats5 and humans24, with an expected labeling from [2,4-13C2] BHB metabolism into downstream [2,4-13C2]-AcAc. The study conducted on humans used 13C MRS to monitor BHB metabolism, and in the presented 13C MR spectrum, resonances of [2,4-13C2]-AcAc (30.1 and 54.0 ppm) could not be seen. In addition, the authors stated that no detectable labeling of AcAc was observed. Another study conducted on hyperketonemic rats used 1H-[13C] MR spectroscopy, in which [2,4-13C2]-AcAc resonates at 3.44 ([2,2]-H213C) and 2.27 ([4,4,4]-H313C) ppm. The signal at 2.27 ppm overlaps with [4,4-H213C] glutamate, so in the presented edited difference spectrum, this signal cannot be used to quantify [2,4-13C2]-AcAc levels. However, the other signal appearing at 3.44 ppm is relatively unconfounded by other labeled metabolite resonances and can be used to monitor the level of [2,4-13C2]-AcAc in the brain. Interestingly, a very low intensity signal was present at 3.44 ppm following 72 minutes of infusion. Authors also report about the level of labeled AcAc in the blood plasma but not in the cerebral cortex. In the same spectrum, very minimal labeling of acetone has been shown towards the end of the infusion (0.025mmol/L), which is very low compared to labeled glutamate (2.5 mmol/L) and should not affect the results significantly. As per our understanding, AcAc is an intermediate formed from BHB metabolism, but is readily metabolized to acetyl-CoA and is thus not accumulated. At any given time, the amount of AcAc and acetone present in the brain is not sufficient to confound labeled d2-Glx signal in 2H-MR spectra.
As an interesting outcome of this study, we observed a four-fold increase in the level of HDO as the ultimate metabolic fate of d4-BHB. We tried to address the generation of HDO from d4-BHB metabolism based on existing literature35 as demonstrated in Figure 7. As per our understanding, the complete metabolism of one molecule of d4-BHB yields 1 molecule of HDO, 1.5 molecules of NADD, and 1 molecule of FADHD in the first round of the TCA cycle (Figure 7A), with a subsequent release of 0.25 molecules of HDO and NADD each in the second turn of TCA cycle (Figure 7B). Ultimately, NADD and FADHD are oxidized to NAD+ and FAD in ETC to form ATP and release 2.5 molecules of HDO. Hence complete metabolism of d4-BHB would generate a total of 4 molecules of HDO. The rate of HDO formation may be used as a parameter for direct monitoring of the efficiency of ETC. Despite our observation of a robust, linear behavior of the HDO signal inflow from peripheral tissue via blood cannot be excluded as prior studies monitoring cerebral perfusion have observed similar linear behaviors36,37. Consequently, more detailed studies are needed to address the different contributions to the HDO signal.
Figure 7.

A schematic depiction of the metabolism of [3,4,4,4]-2H4 -BHB (d4-BHB) in mitochondria and incorporation of deuterium label (represented in red color alphabet D) into different downstream metabolites. A. Figure shows the conversion of d4-BHB to [2,2-D2]-acetyl-CoA which enters the TCA cycle for further metabolism and forms [4,4-D2]-α-ketoglutarate. A reversible reaction between α-ketoglutarate and glutamate results in the formation of [4,4-D2]-glutamate both in neurons and astroglia. Neuronal [4,4-D2]-glutamate is transported to astroglia via the glutamate-glutamine cycle. [4,4-D2]-glutamate is further converted into [4,4-D2]-glutamine in astroglia to be transported back to neurons. [4,4-D2]-α-ketoglutarate is further metabolized in the TCA cycle to ultimately form [3-D]-oxaloacetate which enters the second round of the TCA cycle. During the first turn of the TCA cycle, 87.5% deuterium label is lost in the form of NADD, FADHD and HDO, which is shown in the figure. B. In the second turn of the TCA cycle, by the time [3-D]-oxaloacetate is converted to α-ketoglutarate, all the deuterium label is lost in the form of NADD and HDO. Abbreviations used are cit. syn., citrate synthetase; isocit. dehy., isocitrate dehydrogenase; AT, aminotransferase; Glu dehy., glutamate dehydrogenase; Gln syn., glutamine synthetase; α-KGD, α-ketoglutarate dehydrogenase; suc-CoA syn., succinyl-CoA synthetase; suc. dehy., succinate dehydrogenase; mal. dehy., malate dehydrogenase
The availability and cost of d4-BHB present limitations but increased interest in the study of ketone body metabolism will encourage increased use and demand for this substrate and a subsequent decrease in future costs. Also, the deuterium label present at [3-2H]-BHB has no role in monitoring the Glx labeling, and [4,4,4-2H3]-BHB can serve the same purpose. As such, in this study, the selection of d4-BHB was driven by availability. This study provides preliminary results on the incorporation of labeled BHB into downstream metabolites, specifically Glx. For future studies, and for direct comparison to studies using 13C-labeled BHB, a kinetic model will be proposed along with a protocol for deriving the input function and a method to determine fractional enrichments. In addition, a more rigorous study of the origin of HDO is necessary to identify, and potentially separate, HDO generation from metabolism and that from peripheral tissue inflow. In the end, our presented time courses and rates derived from an exponential model provide a preliminary assessment of cerebral metabolism of BHB. In addition, comparison of the rates reported in this study to those reported in other studies (e.g., 13C-labeled substrates) is difficult as models proposed in other studies account for enzyme kinetics and metabolite exchange. To make better and more direct comparisons, a comprehensive kinetic model and modified protocol will be implemented in future studies.
In conclusion, we demonstrated the feasibility of measuring brain energy metabolism by tracing the downstream labeling of Glx and HDO from d4-BHB metabolism using 2H-MRS in a mouse model. Given the noninvasive nature of the study and the availability of high-field MRI scanners with multinuclear capabilities, it can be readily translated to clinical research to probe ketone body metabolism in the healthy brain and in different neurological disease conditions.
Acknowledgement:
Research reported in this work was supported by the National Institute of Biomedical Imaging and Bioengineering of the National Institutes of Health under Award Number P41EB029460 (RR) and by the National Institute of Aging of the National Institutes of Health under Award Numbers R01AG063869 (RR) and R01AG071725 (RR). 3D printed nose cone was produced courtesy of the University of Pennsylvania Libraries’ Biotech Commons.
References
- 1.Rolfe DF and Brown GC. Cellular energy utilization and molecular origin of standard metabolic rate in mammals. Physiol Rev 1997; 77: 731–758. DOI: 10.1152/physrev.1997.77.3.731. [DOI] [PubMed] [Google Scholar]
- 2.Raichle ME and Gusnard DA. Appraising the brain’s energy budget. Proc Natl Acad Sci U S A 2002; 99: 10237–10239. 20020729. DOI: 10.1073/pnas.172399499. [DOI] [PMC free article] [PubMed] [Google Scholar]
- 3.Hawkins RA, Mans AM and Davis DW. Regional ketone body utilization by rat brain in starvation and diabetes. Am J Physiol 1986; 250: E169–178. DOI: 10.1152/ajpendo.1986.250.2.E169. [DOI] [PubMed] [Google Scholar]
- 4.Kanikarla-Marie P and Jain SK. Hyperketonemia and ketosis increase the risk of complications in type 1 diabetes. Free Radic Biol Med 2016; 95: 268–277. 20160329. DOI: 10.1016/j.freeradbiomed.2016.03.020. [DOI] [PMC free article] [PubMed] [Google Scholar]
- 5.Jiang L, Mason GF, Rothman DL, et al. Cortical substrate oxidation during hyperketonemia in the fasted anesthetized rat in vivo. J Cereb Blood Flow Metab 2011; 31: 2313–2323. 20110706. DOI: 10.1038/jcbfm.2011.91. [DOI] [PMC free article] [PubMed] [Google Scholar]
- 6.Jensen NJ, Wodschow HZ, Nilsson M, et al. Effects of Ketone Bodies on Brain Metabolism and Function in Neurodegenerative Diseases. Int J Mol Sci 2020; 21 20201120. DOI: 10.3390/ijms21228767. [DOI] [PMC free article] [PubMed] [Google Scholar]
- 7.Smith AL, Satterthwaite HS and Sokoloff L. Induction of brain D(--)-beta-hydroxybytrate dehydrogenase activity by fasting. Science 1969; 163: 79–81. DOI: 10.1126/science.163.3862.79. [DOI] [PubMed] [Google Scholar]
- 8.Soni ND, Ramesh A, Roy D, et al. Brain energy metabolism in intracerebroventricularly administered streptozotocin mouse model of Alzheimer’s disease: A (1)H-[(13)C]-NMR study. J Cereb Blood Flow Metab 2021; 41: 2344–2355. 20210303. DOI: 10.1177/0271678X21996176. [DOI] [PMC free article] [PubMed] [Google Scholar]
- 9.Zilberter Y and Zilberter M. The vicious circle of hypometabolism in neurodegenerative diseases: Ways and mechanisms of metabolic correction. J Neurosci Res 2017; 95: 2217–2235. . DOI: 10.1002/jnr.24064. [DOI] [PubMed] [Google Scholar]
- 10.Volkow ND, Wiers CE, Shokri-Kojori E, et al. Neurochemical and metabolic effects of acute and chronic alcohol in the human brain: Studies with positron emission tomography. Neuropharmacology 2017; 122: 175–188. 20170118. DOI: 10.1016/j.neuropharm.2017.01.012. [DOI] [PubMed] [Google Scholar]
- 11.Norwitz NG, Jaramillo JG, Clarke K, et al. Ketotherapeutics for neurodegenerative diseases. Int Rev Neurobiol 2020; 155: 141–168. 20200811. DOI: 10.1016/bs.irn.2020.02.003. [DOI] [PMC free article] [PubMed] [Google Scholar]
- 12.Koppel SJ and Swerdlow RH. Neuroketotherapeutics: A modern review of a century-old therapy. Neurochem Int 2018; 117: 114–125. 20170601. DOI: 10.1016/j.neuint.2017.05.019. [DOI] [PMC free article] [PubMed] [Google Scholar]
- 13.Wiers CE, Vendruscolo LF, van der Veen JW, et al. Ketogenic diet reduces alcohol withdrawal symptoms in humans and alcohol intake in rodents. Sci Adv 2021; 7 20210409. DOI: 10.1126/sciadv.abf6780. [DOI] [PMC free article] [PubMed] [Google Scholar]
- 14.Neal EG, Chaffe H, Schwartz RH, et al. The ketogenic diet for the treatment of childhood epilepsy: a randomised controlled trial. Lancet Neurol 2008; 7: 500–506. 20080502. DOI: 10.1016/S1474-4422(08)70092-9. [DOI] [PubMed] [Google Scholar]
- 15.Erecinska M, Nelson D, Daikhin Y, et al. Regulation of GABA level in rat brain synaptosomes: fluxes through enzymes of the GABA shunt and effects of glutamate, calcium, and ketone bodies. J Neurochem 1996; 67: 2325–2334. DOI: 10.1046/j.1471-4159.1996.67062325.x. [DOI] [PubMed] [Google Scholar]
- 16.Wang ZJ, Bergqvist C, Hunter JV, et al. In vivo measurement of brain metabolites using two-dimensional double-quantum MR spectroscopy--exploration of GABA levels in a ketogenic diet. Magn Reson Med 2003; 49: 615–619. DOI: 10.1002/mrm.10429. [DOI] [PubMed] [Google Scholar]
- 17.Cicek E and Sanlier N. The place of a ketogenic diet in the treatment of resistant epilepsy: a comprehensive review. Nutr Neurosci 2022: 1–14. 20220705. DOI: 10.1080/1028415X.2022.2095819. [DOI] [PubMed] [Google Scholar]
- 18.Sibson NR, Dhankhar A, Mason GF, et al. Stoichiometric coupling of brain glucose metabolism and glutamatergic neuronal activity. Proc Natl Acad Sci U S A 1998; 95: 316–321. DOI: 10.1073/pnas.95.1.316. [DOI] [PMC free article] [PubMed] [Google Scholar]
- 19.Patel AB, De Graaf RA, Mason GF, et al. Coupling of glutamatergic neurotransmission and neuronal glucose oxidation over the entire range of cerebral cortex activity. Ann N Y Acad Sci 2003; 1003: 452–453. DOI: 10.1196/annals.1300.050. [DOI] [PubMed] [Google Scholar]
- 20.Plecko B, Stoeckler-Ipsiroglu S, Schober E, et al. Oral beta-hydroxybutyrate supplementation in two patients with hyperinsulinemic hypoglycemia: monitoring of beta-hydroxybutyrate levels in blood and cerebrospinal fluid, and in the brain by in vivo magnetic resonance spectroscopy. Pediatr Res 2002; 52: 301–306. DOI: 10.1203/00006450-200208000-00025. [DOI] [PubMed] [Google Scholar]
- 21.Wright JN, Saneto RP and Friedman SD. beta-Hydroxybutyrate Detection with Proton MR Spectroscopy in Children with Drug-Resistant Epilepsy on the Ketogenic Diet. AJNR Am J Neuroradiol 2018; 39: 1336–1340. 20180503. DOI: 10.3174/ajnr.A5648. [DOI] [PMC free article] [PubMed] [Google Scholar]
- 22.Zhang F, Wu H, Jin Y, et al. Proton Magnetic Resonance Spectroscopy (H1-MRS) Study of the Ketogenic Diet on Repetitive Mild Traumatic Brain Injury in Adolescent Rats and Its Effect on Neurodegeneration. World Neurosurg 2018; 120: e1193–e1202. 20180917. DOI: 10.1016/j.wneu.2018.09.037. [DOI] [PubMed] [Google Scholar]
- 23.Blomqvist G, Thorell JO, Ingvar M, et al. Use of R-beta-[1-11C]hydroxybutyrate in PET studies of regional cerebral uptake of ketone bodies in humans. Am J Physiol 1995; 269: E948–959. DOI: 10.1152/ajpendo.1995.269.5.E948. [DOI] [PubMed] [Google Scholar]
- 24.Pan JW, de Graaf RA, Petersen KF, et al. [2,4–13 C2 ]-beta-Hydroxybutyrate metabolism in human brain. J Cereb Blood Flow Metab 2002; 22: 890–898. DOI: 10.1097/00004647-200207000-00014. [DOI] [PMC free article] [PubMed] [Google Scholar]
- 25.Roy M, Beauvieux MC, Naulin J, et al. Rapid adaptation of rat brain and liver metabolism to a ketogenic diet: an integrated study using (1)H- and (13)C-NMR spectroscopy. J Cereb Blood Flow Metab 2015; 35: 1154–1162. 20150318. DOI: 10.1038/jcbfm.2015.29. [DOI] [PMC free article] [PubMed] [Google Scholar]
- 26.Simoes RV, Henriques RN, Cardoso BM, et al. Glucose fluxes in glycolytic and oxidative pathways detected in vivo by deuterium magnetic resonance spectroscopy reflect proliferation in mouse glioblastoma. Neuroimage Clin 2022; 33: 102932. 20220105. DOI: 10.1016/j.nicl.2021.102932. [DOI] [PMC free article] [PubMed] [Google Scholar]
- 27.De Feyter HM, Behar KL, Corbin ZA, et al. Deuterium metabolic imaging (DMI) for MRI-based 3D mapping of metabolism in vivo. Sci Adv 2018; 4: eaat7314. 20180822. DOI: 10.1126/sciadv.aat7314. [DOI] [PMC free article] [PubMed] [Google Scholar]
- 28.Lu M, Zhu XH, Zhang Y, et al. Quantitative assessment of brain glucose metabolic rates using in vivo deuterium magnetic resonance spectroscopy. J Cereb Blood Flow Metab 2017; 37: 3518–3530. 20170515. DOI: 10.1177/0271678X17706444. [DOI] [PMC free article] [PubMed] [Google Scholar]
- 29.Mateescu GD, Ye A, Flask CA, et al. In vivo assessment of oxygen consumption via Deuterium Magnetic Resonance. Adv Exp Med Biol 2011; 701: 193–199. DOI: 10.1007/978-1-4419-7756-4_26. [DOI] [PubMed] [Google Scholar]
- 30.Brender JR, Kishimoto S, Merkle H, et al. Dynamic Imaging of Glucose and Lactate Metabolism by (13)C-MRS without Hyperpolarization. Sci Rep 2019; 9: 3410. 20190304. DOI: 10.1038/s41598-019-38981-1. [DOI] [PMC free article] [PubMed] [Google Scholar]
- 31.Theurey P, Connolly NMC, Fortunati I, et al. Systems biology identifies preserved integrity but impaired metabolism of mitochondria due to a glycolytic defect in Alzheimer’s disease neurons. Aging Cell 2019; 18: e12924. 20190221. DOI: 10.1111/acel.12924. [DOI] [PMC free article] [PubMed] [Google Scholar]
- 32.Yao J, Irwin RW, Zhao L, et al. Mitochondrial bioenergetic deficit precedes Alzheimer’s pathology in female mouse model of Alzheimer’s disease. Proc Natl Acad Sci U S A 2009; 106: 14670–14675. 20090810. DOI: 10.1073/pnas.0903563106. [DOI] [PMC free article] [PubMed] [Google Scholar]
- 33.Peng Y, Gao P, Shi L, et al. Central and Peripheral Metabolic Defects Contribute to the Pathogenesis of Alzheimer’s Disease: Targeting Mitochondria for Diagnosis and Prevention. Antioxid Redox Signal 2020; 32: 1188–1236. 20200316. DOI: 10.1089/ars.2019.7763. [DOI] [PMC free article] [PubMed] [Google Scholar]
- 34.Area-Gomez E, Guardia-Laguarta C, Schon EA, et al. Mitochondria, OxPhos, and neurodegeneration: cells are not just running out of gas. J Clin Invest 2019; 129: 34–45. 20190102. DOI: 10.1172/JCI120848. [DOI] [PMC free article] [PubMed] [Google Scholar]
- 35.Voet D, Voet JG and Pratt CW. Fundamentals of biochemistry: life at the molecular level John Wiley & Sons, 2016. [Google Scholar]
- 36.Ackerman JJH, Ewy CS, Becker NN, & Shalwitz RA Deuterium nuclear magnetic resonance measurements of blood flow and tissue perfusion employing 2H2O as a freely diffusible tracer. Proceedings of the National Academy of Sciences 1987; 84: 4099–4102. DOI: 10.1073/PNAS.84.12.4099. [DOI] [PMC free article] [PubMed] [Google Scholar]
- 37.Wang FN, Peng SL, Lu CT, Peng HH, & Yeh TC Water signal attenuation by D2O infusion as a novel contrast mechanism for 1H perfusion MRI. NMR in Biomedicine 2013; 26: 692–698. DOI: 10.1002/NBM.2914. [DOI] [PubMed] [Google Scholar]


