

Abstract
In this quantum approach, by adding bridge/π-spacer fragments between the donor and acceptor parts of a newly constructed DF-PCIC (A–D–A type) molecule, it is the aim to improve the photovoltaic characteristics of organic solar cells (OSCs). After π-spacer insertion into the reference molecule (DF-R), six new molecules (DF-M1 to DF-M6) were designed. The optoelectronic attributes of newly inspected molecules were theoretically calculated using MPW1PW91/6-31G(d,p) level of theory. All newly proposed molecules possessed a lower band gap (Eg), a higher value of absorption, lower reorganization energy, greater dipole moment, and lower energies of excitations than the DF-R molecule. The frontier molecular orbital study proclaimed that the DF-M1 molecule has the lowest band gap of 1.62 eV in comparison to the 2.41 eV value of DF-R. Absorption properties represented that DF-M1 and DF-M2 molecules show the highest absorption values of up to 1006 and 1004 nm, respectively, in the near-infrared region. Regarding the reorganization energy, DF-M2 has the lowest value of λe (0.0683896 eV) and the lowest value of λh (0.1566471 eV). DF-M2 and DF-M5 manifested greater dipole moments with the values of 5.514665 and 7.143434 D, respectively. The open circuit voltage (VOC) of all the acceptors was calculated with J61, a donor complex. DF-M4 and DF-M6 molecules showed higher values of VOC and fill factor than the DF-R molecule. Based on the given results, it was supposed that all the newly presented molecules might prove themselves to be better than the reference and thus might be of great interest to experimentalists. Thus, they are suggested to be used to develop proficient OSC devices with improved photovoltaic prospects in the near future.
1. Introduction
Organic solar cells (OSCs) have gained noteworthy attention in recent years because of their potential as a significant source of renewable energy.1,2 Despite the low power conversion efficiency (PCE) of primitive OSCs, they have shown a tremendous improvement in efficiency in a very short period of time. OSCs are better in terms of having a low fabrication cost, mechanical flexibility, and low weight, have easily tunable properties, and have a variety of techniques for the processing of different solutions.3−6 However, there is still a huge need to improve the efficiency of OSCs for commercial applications. In order to enhance the performance of OSCs, various approaches have been established, including the use of nonfullerene acceptors (NFAs) as an alternative to traditional fullerene acceptors.7−9 But minimizing the energy loss of nonfullerene OSCs is still a critical challenge for researchers working in this field.
Recent research reports suggest that minimizing energy loss is critical in achieving high-performance OSCs. The energy loss in OSCs is the difference between the energy of lowest photogenerated exciton of material and the associated open circuit energy.10 It sets a fundamental limit to the open-circuit voltage and hence the efficiency of organic photovoltaic cells (OPVs). The understanding of the relationship between the reorganization energy (RE) and energy losses has resulted in minimizing energy loss up to 0.6 eV.11 Some π-extended NFAs have shown a low energy loss of 0.48 eV.12 Additionally, the use of narrow band gap NFAs can broaden the absorption spectrum of OSCs to the near-infrared region, reducing energy loss.13
For proper tuning the energy levels and upgrading the efficiency of OSCs, various approaches have been developed, such as end-capped modification, π-spacer insertion, and side chain engineering.14−17 The π-spacer insertion technique is a relatively new approach that has shown potential in improving the performance of OSCs based on NFAs. The π-spacer insertion technique involves the insertion of a π-spacer unit between the donor and the acceptor materials in the active layer of the OSCs. This π-spacer unit helps adjust the intermolecular distance between the donor and acceptor, which can improve the charge transfer efficiency and reduce recombination losses, thereby increasing the PCE and stability of the OSCs. The π-bridges enhance absorptions, lower the band gap, increase the fill factor (FF), prolong the conjugation, lessen the charge recombination of the molecules, and play a role in reducing the energy loss.18,19 All of these factors contribute to improve the overall performance of OSCs.
In 2018, Zhang and co-workers reported an improvement in the PCE of a nonfullerene OSC based on the acceptor IDTBR when a π-spacer unit was inserted between the donor material PBDB-T and the acceptor. The device with the π-spacer exhibited a PCE of 11.3%, compared to 8.2% for a control device without the π-spacer.20 They found that the chemical structure of the π-spacer unit can also have a significant impact on the performance of nonfullerene OSCs. Besides improving the working potential of nonfullerene OSCs, the π-spacer insertion technique has also been shown to improve the stability of these devices. For example, Lin along with colleagues reported that the use of a π-spacer unit in a nonfullerene OSC based on the acceptor ITIC improved the device stability under continuous light soaking.21
Li and co-workers developed an unfused core-based NFA molecule (DF-PCIC) in 2018, which possessed remarkable properties such as high stability due to noncovalent interactions, a high FF of 0.72, and an improved PCE of 10.4%.22 This molecule consists of an A–D–A configuration with planar acceptors and donor parts. The two 4H-cyclopenta[2,1-b:3,4-b′]dithiophene groups with large alkyl chains attached on both sides of 2,5-difluorobenzene (DFB) contribute to its electron-rich properties acting like donor moieties. The acceptor, 2-(3-oxo-indan-1-ylidene)-malononitrile, attached on the periphery of both sides of the donor is a highly electron-withdrawing species. This molecule exhibited efficient charge mobility with a broad absorption spectrum having λmax at 671 nm in chloroform.22
With an intention of further improving the optoelectronic attributes and thus the efficiency of the presynthesized DF-PCIC molecule, we have investigated the effect of insertion of different bridges in this study as shown in Figure 1. The six novel π-spacer/bridges inserted in the DF-R molecule are 2-oxa-4,6,9-triaza-cyclopenta[b]naphthalene resulting in DF-M1, thia-4,6,9-triaza-cyclopenta[b]naphthalene to develop DF-M2,23 [1,2,5]thiadiazolo[3,4-d]pyridazine to develop DF-M3,24 3-methoxy-thiophene to fabricate DF-M4, 4,6-dimethyl-thieno[3,4-b]thiophene-2-carboxylic acid methyl ester to form DF-M5,25 and 3,4-dihydro-2H-thieno[3,4-b][1,4]dioxepine to fabricate DF-M6.26 The insertion of six different π-spacers between the core and acceptors of the DF-R molecule has a prominent effect on optoelectronic attributes, electron and hole RE, and photovoltaic (PV) performance of all designed molecules. These bridges due to their electron-donating attributes could also increase the donor/acceptor ratio of the molecules. This increased ratio could help in better charge transfer and broader absorption spectra in the visible region. Additionally, it can help the molecules attain better generation of free electrons and free holes through lowered ionization potential and electron affinity values.27
Figure 1.

Molecular structural design of DF-R and (DF-M1 to DF-M6) six designed molecules.
2. Computational Methodology
Gaussian 09 was used for all computations in this approach.28 The results of the computations were visualized by the GaussView 6.0.16 system.29DF-R was investigated by implementing four different functionals. These functionals include B3LYP,30 CAM-B3LYP,31 MPW1PW91,32 and wB97XD33 with the 6-31G(d,p) basis set. The ulltraviolet–visible (UV–vis) absorption characteristics of DF-R were predicted using time-dependent self-consistent field (TDSCF) calculations.34 The maximum absorption (λmax) of DF-R from the aforementioned four functionals was compared to experimental λmax values (671 nm) found in the literature to ensure that the computational aspect was feasible. The best matched functional that was opted for this analysis is MPW1PW91 with a wavelength of 651.52 nm, while the λmax values of all other applied methods for this selected molecule came out to be 700.30 nm (B3LYP), 527.24 nm (CAM-B3LYP), and 500.71 nm (wB97XD), respectively.35 The absorption spectra and λmax comparison of different functionals are shown in Figure 2.
Figure 2.

Absorption spectra of the DF-R molecule utilizing four DFT-based functionals.
The λmax of all molecules obtained by plotting UV–vis graphs was projected by operating Origin 6.0 software.36 The maps for evaluating the density of states (DOS) of these molecules were executed by the PyMOlyze1.1 program.37 The plots of the transition density matrix (TDM) were plotted by Multiwfn 3.8 operating software.38 In this paper, the planarity of the molecules is examined through the VMD operating system.39 Geometrical analysis of noncovalent interactions (NCI)-reduced density gradient analysis was performed to analyze various interactions in proposed molecules.
The REs perform a critical role in calculating the overall efficiency of an OSC. This energy fluctuates by internal as well as external factors, but herein, we have merely counted in the internal factors. The internal reorganization values are determined by the symmetry of molecules. eqs 1 and 2 are quite helpful in computing the RE of electrons (λe) and holes (λh).40
| 1 |
| 2 |
where E+ represents the energy of neutral molecules at the ground state. E+0 specifies the energy of the cation by optimizing the molecule at neutral state, whereas E–0 is the energy of the anion by utilizing a neutral molecule.41,42
3. Results and Discussion
3.1. Ground State Geometric Optimization
Molecular geometry has a significant impact on optical and electrical characteristics.43 Consequently, all of the compounds were optimized in their ground state, and the bond length and dihedral angle were approximated to explain the differences brought about by the incorporation of various π-bridges between the core and acceptor of the DF-R molecule. The calculated bond lengths and dihedral angles of studied molecules are summarized in Table 1. For DF-R and all designed molecules from DF-M1 to DF-M6, La represents the bond length between the terminal acceptors and the π-bridges, whereas Ld reveals the bond length between the donor and the π-bridge. It was perceived that all dihedral angles were in the range of 1.39–1.44 Å. Comparatively speaking, it falls within the typical range of single and double bond lengths between carbon atoms, which represents that higher conjugation is present in the designed molecules. The designed molecules DF-M1, DF-M2, DF-M5, and DF-M6 have lower bond length values than the DF-R molecule, indicating higher conjugation being present in these molecules.
Table 1. Calculated Bond Length and Dihedral Angle of DF-R and All Analyzed Molecules.
| molecules | bond length (Lb) (Å) | dihedral angle (θs°) | dihedral angle (θa°) |
|---|---|---|---|
| DF-R | 1.41 | 0.012 | |
| DF-M1 | 1.39 | 0.58 | 0.02 |
| DF-M2 | 1.40 | 0.40 | 0.006 |
| DF-M3 | 1.44 | 0.28 | 28.000 |
| DF-M4 | 1.41 | 0.68 | 0.009 |
| DF-M5 | 1.40 | 17.00 | 12.00 |
| DF-M6 | 1.40 | 1.30 | 0.099 |
The dihedral angle of all the molecules between the π-spacer/bridges and acceptor is shown with θa and that between the donor and π-spacer is shown with θs, in Figure 3. The dihedral angle is helpful in describing the planarity of the molecule. The planarity of the molecules also helps us improve the conjugation and π–π assembling of the molecules.44 The increasing order of the dihedral angle θa of designed molecules is as DF-M2 < DF-M4 < DF-M1 < DF-M6 < DF-M5 < DF-M3, possessing values 0.006, 0.009, 0.02, 0.099, 12, and 28° respectively. The DF-M2 molecule has the lowest dihedral angle of 0.006°, thus indicating the greater planarity in this molecule. DF-M3 shows a comparatively higher dihedral angle of 28° than the reference due to C–C bond between the π-spacer and terminal group; this molecule shows a deviation from planarity. The designed molecule DF-M5 shows the highest dihedral angle and deviation from planarity due to the presence of a bulky ester-containing π-spacer. The main reason is the presence of stearic hindrance between the bulky π-spacer and acceptor groups; thus, to minimize the steric hindrance, these show a high dihedral angle with a twisted acceptor part in the DF-M5 molecule. DF-M1, DF-M2, DF-M4, and DF-M6 molecules show lower dihedral angle values than the reference, thus exhibiting the higher planarity and high charge transfer properties throughout the molecules.
Figure 3.

Optimized geometries of DF-R and all newly scrutinized molecules.
3.2. Planarity Analysis
To study the planarity of the molecules in detail, calculations of the molecular planarity parameter (MPP) and the span of deviation from the plane (SDP) were performed. The MPP represents the overall planarity of molecules, while the SDP represents the mean deviation of all atoms from the central plane of molecule.45 The observed MPP outcomes of DF-R and DF-M1 to DF-M6 are within the range of 0.2958–1.0192 Å. A molecule with a lower value of the MPP shows less deviance from planarity, and a higher value of the MPP leads to nonplanarity of that molecule. DF-M4 shows the lowest MPP value and, thus, the highest planarity among all newly presented molecules. Moreover, a highly planar structure exhibits high conjugation and charge transfer properties. DF-M3 has the highest value of the MPP, and thus, its structure is represented as slightly nonplanar with respect to other molecules, as shown in Figure S1 (Supporting Information).
Analyzing the SDP, the same types of outcomes are obtained. The observed results are in the range of 1.319–5.6813 Å. The lowest deviation from the planarity is seen in DF-M4, while the largest deviation from the planarity is observed in DF-M5. This deviation from the plane is as ester groups exist in the π-spacer, which minimizes the steric hindrance between the acceptor and π-spacer part and leads toward nonplanarity of acceptors; the greater value of the SDP indicates that more parts of the designed molecules have deviated from the plane and vice versa. Atoms that are in a single plane are shown with white color, while the atoms slightly above or below the plane are represented with light blue and light red, respectively. The dark blue and darkest red atoms are elevated over the plane (positive deviation) and below the plane (negative deviation), respectively.46 The pragmatic results of the MPP and SDP are correlated with each other, and DF-M5 shows the highest deviation from the plane, which might be due to its acetyl group being attached at the periphery.
3.3. Frontier Molecular Orbitals
The highest occupied molecular orbital (HOMO) and lowest unoccupied molecular orbital (LUMO) are called the frontier molecular orbitals (FMOs). These two levels are helpful in studying electronic clouds at different states, which elaborate the OSCs performance.45 The HOMO present on the donor part acts like a valence band, and the LUMO present on the acceptor part acts as a conduction band. The band gap (Eg) occurs due to the difference in energy levels of the HOMO and LUMO.47,48 Molecular Eg and reactivity have an inverse relationship with each other. The molecules with low Eg values are less stable and soft and possess a compound with a strong charge transport rate. The HOMO and LUMO values have a direct effect on PV properties.49
To comprehend the effect of π-bridges on the acceptor and donor part, values for the HOMO and LUMO and associated, as well as Eg were calculated using the MPW1PW91 functional. The FMO structures with their Eg values of all molecules are exposed in Figure 4. Green and red colors in HOMO and LUMO structures represent negative and positive phases, respectively.50 In the DF-R molecule, the charge potential is confined to the donor and cyanide group of the acceptor region in the HOMO, and in the LUMO, the charge potential shifts from the central region to the outer regions of the molecule. In designed molecules, charge density in the HOMO is spread on the donor and slightly on the π-spacer and acceptor part of DF-M1, DF-M2, DF-M3, DF-M4, DF-M5, and DF-M6 molecules. However, charge is spread on the π-spacer in the LUMO, which results in better charge transfer of all molecules. Charge potential is also spread on the π-bridges, showing their importance in charge transfer and related Eg. The HOMO–LUMO charge transition is facilitated by π-bridges. These π-bridges also have an electronegative element that helps in the transfer of electrons from a molecule’s donor to its acceptor due to conjugation which helps in charge transfer from the HOMO to LUMO. The ELUMO energy level is reciprocal to the strength of the electron acceptor.51
Figure 4.

HOMO–LUMO representation of DF-R and (DF-M1–DF-M6) molecules with concerned Eg values.
The ratio of electron densities on the π-bridges is positively associated with the HOMO. The HOMO and LUMO energies of DF-R and DF-M1 to DF-M6 are summarized in Table 3. The order of reducing Eg is DF-R > DF-M6 > DF-M5 > DF-M4 > DF-M3 > DF-M2 > DF-M1. As per the given order, DF-M1 has the lowest band gap of 1.62 eV with respect to the DF-R molecule. The reason behind this reduced Eg is the electron-withdrawing effect of the (2-oxa-4,6,9-triaza-cyclopenta[b]naphthalene) type π-spacer owing to its more electronegative oxygen atom, which enhanced conjugation, facilitating its movement toward the acceptor. The slight difference between the band gap of DF-M1 and DF-M2 could just be because of the more electronegative oxygen atom in the five membered ring of the former molecule as opposed to the sulfur atom in the latter. This slight modification led DF-M1 to have more electron-extracting properties, making it easier for electrons to pass from the ground state to excited state.
Table 3. HOMO and LUMO Energies and Band Gap Values of All of the Studied Molecules.
| molecules | EHOMO (eV) | ELUMO (eV) | Eg (eV) |
|---|---|---|---|
| DF-R | –5.70 | –3.29 | 2.41 |
| DF-M1 | –5.50 | –3.88 | 1.62 |
| DF-M2 | –5.48 | –3.85 | 1.63 |
| DF-M3 | –5.61 | –3.71 | 1.90 |
| DF-M4 | –5.21 | –3.22 | 1.99 |
| DF-M5 | –5.47 | –3.38 | 2.09 |
| DF-M6 | –5.22 | –3.09 | 2.13 |
3.4. Quantum Chemical Study
The ionization potential (IP) and electron affinity (EA) are helpful in elaborating the charge transfer properties of organic species.52 Molecules having a little IP possess an elevated HOMO energy level and the molecules having a high EA exhibits lower LUMO energy values, possessing efficient charge transfer properties.53Equations 3 and 4 may be used to determine the values of the investigated compounds.
| 3 |
| 4 |
Table 4 summarizes the calculated values of IP and EA. In comparison with DF-R, DF-M1, DF-M2, DF-M3, and DF-M5 exhibit lower IP values, but DF-M4 and DF-M6 have the lowest values and thus exhibit a high HOMO value. DF-M1, DF-M2, DF-M3, and DF-M5 molecules possess greater EA values than the DF-R molecule. Therefore, these molecules have lower LUMO energy values, resultantly having efficient charge transfer properties.
Table 4. Calculated IP, EA, and Chemical Hardness and Softness of DF-R and All Six Reported Molecules.
| molecules | IP (eV) | EA (eV) | hardness (η) | softness (S) |
|---|---|---|---|---|
| DF-R | 6.2583 | 2.4489 | 1.90 | 0.26 |
| DF-M1 | 5.9862 | 3.2652 | 1.36 | 0.36 |
| DF-M2 | 5.9862 | 3.2652 | 1.36 | 0.36 |
| DF-M3 | 5.9862 | 2.9931 | 1.49 | 0.33 |
| DF-M4 | 5.7141 | 2.4489 | 1.63 | 0.31 |
| DF-M5 | 5.9862 | 2.721 | 1.63 | 0.31 |
| DF-M6 | 5.7141 | 2.4489 | 1.63 | 0.31 |
Chemical hardness and softness play an efficient role in estimating the reactivity and stability of organic moieties. The molecules with large Eg exhibit greater stability and are known as hard molecules, and those molecules possessing small Eg are less stable but exhibit prominent charge transfer characteristics. The IP and EA have a difference of half, which is termed chemical hardness. The molecules having less hardness (η) and greater softness values (S) have strong electron accepting and light-harvesting efficiency (LHE) that show smooth transitions of electrons.46
The EA and IP, in relation to chemical softness and hardness, can be calculated from eqs 5 and 6.
| 5 |
| 6 |
Here, η represents the molecule’s chemical hardness, whereas S denotes the molecule’s relative pliability. Softness has an inverse relation with twice the value of hardness.54 The obtained values are listed in Table 2. Table 2 shows that all developed compounds are softer than DF-R, while in the case of softness, all studied molecules DF-M1–DF-M6 have greater softness than DF-R. However, DF-M1 and DF-M2 molecules have the highest softness values. Resultantly, due to less hardness and greater softness, DF-M1 and DF-M2 have efficient light harvesting and electron-accepting properties than others. This could be due to the more conjugated π-linkers attached in their structures. Overall, it can be seen that the additional bridges helped the molecules in attaining greater generation of electron sand holes, in addition to increased reactivity.
Table 2. Calculated MPP and SDP Values of DF-R and All Scrutinized Molecules.
| molecules | MPP (Å) | SDP (Å) |
|---|---|---|
| DF-R | 0.924161 | 3.487054 |
| DF-M1 | 0.334913 | 1.587155 |
| DF-M2 | 0.802052 | 3.466552 |
| DF-M3 | 1.019253 | 4.883185 |
| DF-M4 | 0.295848 | 1.319465 |
| DF-M5 | 0.8168812 | 5.681340 |
| DF-M6 | 0.499424 | 2.633065 |
3.5. Density of States Analysis
The DOS explains the contribution of HOMO and LUMO energy levels in different excited states. It represents the density of electronic states at different energy levels. It helps identify the regions of the energy spectrum in which the material has a high density of electronic states. This information is relevant for understanding charge transport as it indicates the availability of states for charge carriers.55 DOS calculations of DF-R and all the newly presented molecules DF-M1–DF-M6 were executed using the MPW1PW91/6-31(d,p) level. For the ease of understanding the DOS, there are three distinct components of a molecule: donor, π-spacer, and acceptor, as shown in Figure 5. In DF-R, the participations of the acceptor and donor are shown by black and red colored lines, accordingly. The participation of the donor is shown with a black line, that of the acceptor is shown with a green line, and that of the π-spacer is shown with a red line. The blue line represents the total DOS (TDOS). Furthermore, the peaks shown from −5.70 eV to −16 eV on the x-axis are considered as the HOMO, and peaks shown on the right side from −.329 to 6 eV are considered as the LUMO. The area where no peaks are available is the Eg between the elaborated HOMO and LUMO energy levels.56
Figure 5.

DOS plots of DF-R and all studied (DF-M1 to DF-M6) molecules.
The involvement of every fragment to a corresponding energy level is obtained by Mullikan’s calculations, as illustrated in Table 5. In DF-M1, the donor part has a 44.1% contribution in the HOMO region, and the π-spacer part has a 59.0% contribution in the LUMO region. In DF-M2, the donor part has a in the HOMO region, and the π-spacer has a 57.9% contribution in the LUMO region of this molecule. In DF-M3, 80.0% of the influence of the donor part is in the HOMO region, and the contribution of the π-spacer part is 49.3% in raising the LUMO region. In DF-M4, the donor part has a 68.3% contribution in the 50.6% participation HOMO part, and the acceptor has a major 53.8% contribution in the LUMO region. In DF-M5, there is a 60.2% contribution of donors in increasing the HOMO relative intensity level, and the acceptor has 42.2% participation in increasing the LUMO intensity. In DF-M6, the donor has a 70.1% involvement in the HOMO, while, the acceptor has a 52.8% contribution in the LUMO region of this molecule. The DF-M1 molecule revealed that with better charge density present in the LUMO region, a higher concentration of charge transfer takes place. It is elaborated that the involvement of the donor in DF-R has higher energy level in HOMO, while the addition of bridges in DF-M1 to DF-M,6 results in efficient contribution in increasing both HOMO and LUMO peaks, and it shows their somewhat planar configuration compared to the DF-R molecule. It could be seen from Table 5 that the additional bridges have effectively shifted the LUMO density from the donor region of the molecules toward the peripheries, thus improving the intramolecular charge transferring aptitude of the molecules.
Table 5. DOS Calculation Representing the Percentage Participation of Donors, π-Spacers, and Acceptors of Designed and DF-R in Developing the HOMO and LUMO.
| molecules | energy states | donor (%) | π-spacer (%) | acceptor (%) |
|---|---|---|---|---|
| DF-R | HOMO | 75.9 | 24.1 | |
| LUMO | 47.7 | 52.3 | ||
| DF-M1 | HOMO | 44.1 | 26.5 | 29.4 |
| LUMO | 25.9 | 59.0 | 15.2 | |
| DF-M2 | HOMO | 50.6 | 25.4 | 24.1 |
| LUMO | 25.9 | 57.9 | 16.2 | |
| DF-M3 | HOMO | 80.0 | 14.1 | 5.9 |
| LUMO | 19.8 | 49.3 | 31.0 | |
| DF-M4 | HOMO | 68.3 | 17.1 | 14.6 |
| LUMO | 23.3 | 23.0 | 53.8 | |
| DF-M5 | HOMO | 60.2 | 22.9 | 16.9 |
| LUMO | 31.6 | 28.3 | 40.2 | |
| DF-M6 | HOMO | 70.1 | 16.3 | 13.6 |
| LUMO | 24.4 | 22.8 | 52.8 |
3.6. Optical Properties
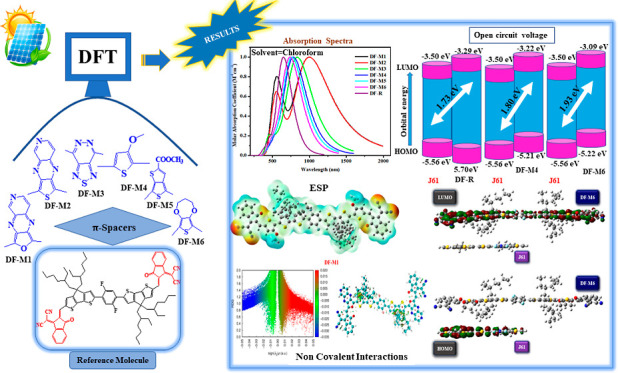
An absorption spectrum is very effective in elaborating the optoelectronic properties of the molecules. A chromophore absorbs only that part of radiation whose energy matches their band gaps and enters an excited state. To study the utilization of solar energy by these molecules that result in better charge transfer, the maximum absorption (λmax), oscillator strength (f), dipole moment (μ), and excitation energy values are observed.57 All of the spectral values of chromophore analysis in the gaseous phase are presented in Figure 6. The probability of transition is known as the oscillator strength, and the energy obligatory for transition is called excitation; therefore, a molecule with la ow excitation energy (Ex), high f, and enhanced absorption at a higher molar absorption coefficient (ε) is expected to produce prominent intramolecular charge transfer (ICT).58−60 The absorption profiles of molecules involved in current study are represented in Figure 6. The electron-withdrawing moieties and π-bridges have a significant effect on the absorption maximum and band gap of the molecules. This is because of the cumulative impact of auxochromes and chromophores,61 and all the designed molecules show maximum absorption in the visible region and the two designed molecules DF-M1 and DF-M2 show absorption in the near-IR region. The λmax values of molecules in the gaseous state follow the increasing order of DF-R < DF-M6 < DF-M5 < DF-M4 < DF-M3 < DF-M2 < DF-M1 and are 613, 694, 718, 735, 783, 931, and 958 nm, respectively, as mentioned in Table 6. However, in the chloroform solvent, the absorption maximum was shifted in the decreasing order of DF-M1 > DF-M2 > DF-M3 > DF-M4 > DF-M5 > DF-M6 and DF-R molecules, with values of 1006, 1004, 841, 792, 771, 745, and 651 nm, respectively. DF-R in the gaseous state and solvent state has a low value of maximum absorption wavelength compared to the designed molecules due to less conjugation than the designed molecules containing the π-bridges because these provide better space for conjugation, where all the proposed molecules have a larger value of λmax and increased absorbance in the UV–vis spectrum, and in the near-IR region, this is because of the presence of electron-drawing groups and π-bridge insertion in designed molecules compared to the DF-R molecule without any pi bridges. DF-M4, DF-M5, and DF-M6 have strong electron-withdrawing groups and π-bridges, but they do not provide larger sites for conjugation and have a low value of λmax and a low red shift value compared to the other designed molecules but a high value compared to that of DF-R molecules.
Figure 6.

(a) Absorption spectra of DF-R and all studied molecules in the gas phase and (b) absorption spectra of DF-R and all studied molecules in chloroform solvent.
Table 6. λmax, Ex, Osscillator Strength (f), and Assignment of DF-R and Studied Molecules in Gaseous Medium.
| molecules | exp. λmax (nm) | calculated λmax (nm) | excitation energies Ex (eV) | oscillator strength (f) | assignment |
|---|---|---|---|---|---|
| DF-R | 671 | 613 | 2.02 | 3.06 | H–L (+99%) |
| DF-M1 | 958 | 1.29 | 1.78 | H–L (+99%) | |
| DF-M2 | 931 | 1.33 | 2.40 | H–L (+99%) | |
| DF-M3 | 783 | 1.58 | 2.56 | H–L (+97%) | |
| DF-M4 | 735 | 1.68 | 3.49 | H–L (+98%) | |
| DF-M5 | 718 | 1.72 | 3.17 | H–L (+99%) | |
| DF-M6 | 694 | 1.78 | 3.50 | H–L (+96%) |
DF-M1 and DF-M2 show maximum red shift values because of the presence of an electron-pulling group on the acceptor part of the molecule. These molecules are efficient in trapping a broad range of wavelengths in visible and IR regions from electromagnetic radiation. By comparing the values of the gaseous phase and solvent phase (chloroform), a strong red shift is shown by all the molecules in the solution form, which shows the efficient effect of the solvent in increasing the λmax values. Eg and λmax are inversely proportional, and the higher value of λmax causes a narrowing of theEg, causing the absorption spectra to redshift.62 As may be seen from the foregoing discussion, the designed molecules show greater absorption with respect to the DF-R molecule in both the solvent and gaseous phases. Thus, scrutinized molecules would be considered better molecules for the fabrication of OSCs. Since the DF-M1 and DF-M2 molecules had the biggest red shift absorption and the smallest Eg in the gas phase and the chloroform solvent, respectively, they should have been chosen as the best molecules for production and testing in PV systems. However, it should be kept in mind that all other molecules fall in the range of the visible region, where photon flux density is maximum, i.e., between 500 and 800 nm.35 This shows that the effectiveness of the other four molecules cannot be negated as they, in addition to falling in range, also have higher absorption maxima than the reference. So, it could be assumed that DF-M3 to DF-M6 might have an even greater aptitude than the other two in the sense of PV properties.
Another main optical property of the molecules is the oscillator strength “f”. Eg and f have linear relationships. DF-R has a low value of oscillation strength compared to the newly designed molecule except DF-M1, DF-M2, and DF-M3 molecules. Higher values of oscillating strength of our DF-M4, DF-M5, and DF-M6 molecules than that of DF-R shows that these designed molecules have greater efficiency and a greater ability to exploit the absorbed radiation, tend to provide better sites for intermolecular charge transfer, and show greater electronic transitions. The increasing order of oscillator strength of the molecules is DF-M1 < DF-M5 < DF-M6 < DF-M2 < DF-M3 < DF-M4 in chloroform, as mentioned in Table 7. Among all the newly designed molecules, DF-M4 has the highest value of oscillator strength.
Table 7. λmax, Ex, f, and Assignment of DF-R and Studied Molecules in Solvent (Chloroform) Medium.
| molecules | exp. λmax (nm) | calculated λmax (nm) | excitation energies Ex (eV) | oscillator strength (f) | assignment |
|---|---|---|---|---|---|
| DF-R | 671 | 651 | 1.90 | 3.32 | H–L (+96%) |
| DF-M1 | 1006 | 1.23 | 2.24 | H–L (+99%) | |
| DF-M2 | 1004 | 1.23 | 2.78 | H-L (+99%) | |
| DF-M3 | 841 | 1.47 | 2.84 | H–L (+97%) | |
| DF-M4 | 792 | 1.56 | 3.82 | H–L (+99%) | |
| DF-M5 | 771 | 1.60 | 3.39 | H–L (+97%) | |
| DF-M6 | 745 | 1.66 | 3.74 | H–L (+98%) |
The amount of minimal energy required for the electrical transfer from the ground to the excited state is the excitation energy (Ex). If a molecule’s band gap is large, value of Ex will be larger.63DF-R has a higher Ex value (1.90 eV) than any developed compound, which shows great charge transferring ability and easy excitation of an electron compared to DF-R. The Ex of the DF-MR is 2.02 eV, the highest value among the newly designed molecules, which shows that our proposed molecules have efficient charge mobility in both the solvent and gaseous phases. DF-M1 and DF-M2 have the lowest value of Ex and low Eg because of the presence of an electronegative element on the acceptor part and π-spacer part of the molecules and have greater capability to pull the electron toward themselves, leading to better charge shifting in molecules, and smooth electronic transitions occur in these two molecules.
3.7. Dipole Moment (μ)
The dipole moment is useful in elaborating on the efficacy of any organic PV cell. It has a straight relation to the polarity of molecules. Therefore, polar solvents are optimal for dissolving compounds with a high degree of polarity. The polarity helps in the self-aggregation, and side chains act as pathways for charge transformations.64 The highly symmetrical molecules have the advantage of enhanced conjugation and effective light absorption abilities.65 The dipole moment is useful in elaborating on the efficacy of any OSC because it affects the charge separation and exciton dissociation processes, which are crucial for the photovoltaic performance of the cell.66−68 The dipole moment difference between ground and excited states can influence the degree of photoinduced charge transfer and the Coulombic binding energy of the exciton, which can facilitate or hinder charge separation.69 A larger dipole moment difference can lower the Coulombic binding energy and enhances the exciton dissociation and charge generation, leading to a higher PCE.70
By comparing the μ of considered molecules DF-M1 to DF-M6 with that of the DF-R molecules, the increasing order of the dipole moment is DF-M1 < DF-M3 < DF-M6 < DF-M4 < DF-M2 and DF-M5. Each of the engineered molecules has a greater μ than the DF-R molecule except DF-M1 in the gaseous phase but has slightly increased values in the solvent phase. Table 8 lists the values for the dipole moments in the gaseous and solvent forms for all designed and DF-R compounds. DF-M2, DF-M5, and DF-M6 show greater dipole moment values in both the gaseous and chloroform phase. Therefore, these are efficient molecules with reduced disorders found between donor and acceptor parts. Moreover, these molecules also have reduced charge recombination to the exciton.
Table 8. Calculated μ of All Considered Molecules in Gas and Solvent Phases and the Difference between Them.
| molecules | dipole moment (μg) | dipole moment (μs) | μs – μg |
|---|---|---|---|
| DF-R | 0.386188 | 0.365837 | 0.020351 |
| DF-M1 | 0.387047 | 0.194964 | 0.192083 |
| DF-M2 | 5.514665 | 4.394846 | 1.119819 |
| DF-M3 | 0.610954 | 0.519741 | 0.091213 |
| DF-M4 | 1.954687 | 1.670631 | 0.284056 |
| DF-M5 | 7.143434 | 5.551181 | 1.592253 |
| DF-M6 | 1.528283 | 1.312200 | 0.216083 |
3.8. Molecular Electrostatic Potential
The molecular electrostatic potential (MEP) helps us visualize the 3-D display of the dispersion of charges over the molecules. The presence of lone pairs, electrons, and electrophilic species indicates that these are electron-rich sites. Charge distribution in the MEP is represented by red, blue, and green colors. The red areas have a negative potential and are rich in electrons. The color blue indicates an area with a positive potential and the absence of electrons. The green color represents zero potential. It gives an understanding of electrophilic and nucleophilic attacking sites. Electron-rich red color performs as an area for electrophile attack, and the electron-deficient blue color performs as an area for nucleophile attack.71 The more distance between positive and negative potentials, the greater will be the charge separation.72
The MEP plots of reference DF-R and all of the investigated DF-M1–DF-M6 molecules are shown in Figure 7. In the designed molecules, the red color is represented around all the unsaturated and electronegative atoms like nitrogen (N) and oxygen (O) atoms. However, all of the π-bridges show a blue color and act as an electrophile. In DF-M1 and DF-M2 molecules, efficient charge separation is present between the core, π-spacer, and end groups of these molecules. There is a prominent red color present on the end groups with powerful electron-withdrawing ability; thus, better electron density separation occurs. There is a green color present on the alkyl chains on the thiophene rings that shows neutral regions.
Figure 7.

MEP maps of DF-R and DF-M1 to DF-M6 molecules under analysis.
3.9. Exciton Binding Energy (Eb)
On the absorption of electromagnetic radiations, electron–hole pairs are generated for a short time and the energy required to dissociate this exciton pair is called electron dissociation energy or binding energy (Eb).23 The exciton splitting probability is inversely proportional to the dissociation energy of the exciton and proportional to the Columbic forces. The lower the Eb of the electron and the hole, the weaker the Coulombic forces present between them; thus, proper charge dissociation occurs and these excitons can easily move toward their respective electrodes; and resultantly, maximum photocurrent will be generated. As shown in eq 7 below, the values are derived by subtracting the exciton and electronic Eg values.
| 7 |
For the above equation, Ex is the optical band ga,p Eg is the electronic band gap, and Eb is the dissociation or binding energy of the exciton.73 In the gaseous medium, the Eb values of the newly designed molecules (DF-M1 to DF-M6) along with the DF-R molecule are in the decreasing order of DF-R > DF-M5 > DF-M6 > DF-M1 > DF-M3 > DF-M4 > DF-M2, and in the solvent phase, the decreasing order is DF-R > DF-M5 > DF-M6 > DF-M4 = DF-M3 > DF-M2 > DF-M1. From these obtained values, it has been observed that each molecule has a lower value for Eb than the DF-R molecule. DF-M2 has the lowest Eb value (0.29 eV), thus representing the improved capability of exciton dissociation in the gaseous phase. Moreover, in the solvent phase, DF-M1 has lowest Eb value (0.38 eV) due to its lowest band gap and excitation energy, attributed to its highly conjugated and electron-withdrawing bridge group, which represents its prominent ability to charge transfer toward electrodes in the solvent phase (Table 9).
Table 9. Calculated Eb of DF-R and DF-M1 to DF-M6 Molecules in the Gas Phase and Solvent along with the IC.
| molecules | EH–L (eV) | Eb (eV) gaseous | Eb (eV) solvent | IC |
|---|---|---|---|---|
| DF-R | 2.41 | 0.38 | 0.50 | 0.68520 |
| DF-M1 | 1.62 | 0.32 | 0.38 | 0.66975 |
| DF-M2 | 1.63 | 0.29 | 0.39 | 0.67709 |
| DF-M3 | 1.90 | 0.31 | 0.42 | 0.68424 |
| DF-M4 | 1.99 | 0.30 | 0.42 | 0.68006 |
| DF-M5 | 2.09 | 0.36 | 0.48 | 0.66852 |
| DF-M6 | 2.13 | 0.34 | 0.46 | 0.67358 |
The interaction coefficient (IC) quantifies the molecular interactions within these materials, affecting charge separation, transport, and recombination processes. The IC values of the acceptor molecules are as follows: DF-M5 (0.66852) < DF-M1 (0.66975) < DF-M6 (0.67358) < DF-M2 (0.67709) < DF-M4 (0.68006) < DF-R (0.68520) < DF-M3 (0.68424). The order of IC values suggests that DF-M5 has the weakest interactions, while DF-R has the strongest interactions. DF-M2 and DF-M4 exhibit promising IC values, indicating potential for efficient charge separation and transport. Therefore, for enhancing the efficiency of OSCs, it is advisable to select acceptor molecules with optimized IC values, such as DF-M2 and DF-M4, to achieve a balance between charge separation and recombination processes.
3.10. Analysis of the TDM
TDM analysis is an effective method of proving the existence of the S0–S1 transition state in a vacuum, as well as the detected electron excitation and charge density and the existence as well as the mobility of the exciton throughout the donor, π-spacer and acceptor part.74,75 The TDM plots of DF-R and the designed molecules DF-M1–DF-M6 are shown in Figure 9. All the atoms present in the molecule represent the migration of charge density instead of the hydrogen atom; thus, hydrogen atoms are removed by default in analysis, as shown in Figure 8. For the study of transitions, the scrutinized molecules are partitioned into donor (D), π-spacer (S), and acceptor (A) parts. The numbers on the x-axes and y-axes, respectively, show the total number of atoms in the molecule in question. The density coefficient is shown by the vertical bar in blue that gradually becomes red on the right-hand side of the diagrams.
Figure 9.

Electronic transition of DF-R and charge transfer from the donor to end group of all designed molecules under investigation by utilizing TDM plots.
Figure 8.

Representing the division of DF-R and designed molecules into different regions for the TDM study.
In the DF-R molecule, the charge density is spread diagonally and off-diagonally all over the molecule. In DF-M1 and DF-M2, the highest charge density is present in the π-spacer region, which could reduce their efficiency in terms of effective charge transfer from the donating center toward the peripheral acceptors. In DF-M3, charge density is present in the donor and π-spacer parts of this molecule, as shown by bright areas in plots. But in DF-M4, DF-M5, and DF-M6, charge density is spread on the donor, π-spacer, and acceptor parts of these molecules, represented by bright fringes in the molecules. Thus, it could be said that the bridges attached in these molecules, due to their greater charge transfer ability and smaller size, might help the molecules in effective charge transferring properties. This elaborates the significant effect of different π-spacers on efficient charge transfer between different regions of the molecules.
3.11. Light-Harvesting Efficiency
By estimating the LHE, we can analyze the efficacy of the material, short circuit current (JSC), and optical property of the material.49 Its significance is proportional to the magnitude of the oscillator in the solvent phase. Increasing the oscillator’s strength results in a higher LHE of the materials, and it tends to increase the JSC and PCE of the materials.76 There is no unit of LHE because it is calculated from the oscillator strength of the molecules, and by itself, the LHE has no unit and is dimensionless.77 The LHE can be calculated by eq 8.
| 8 |
Here, f denotes the oscillator strength, and values are listed in Table 10. The result shows that DF-M4 and DF-M6 have the highest values of the LHE and hence show a greater ability to harvest the light than DF-R because of higher oscillator strength. DF-M5 has a comparable value of the LHE to DF-R. The order of increasing efficiency of the molecules to harvest the light is DF-M1 < DF-M2 < DF-M3 < DF-M5 < DF-M6 < DF-M4. DF-M4 to DF-M6 might be outperforming the other three due to their better π-linkers, which instead of shifting the charge density toward themselves could effectively transfer it toward the peripheral acceptors of the molecules.
Table 10. Tabulated Oscillator Strength (f) and LHE Values of All Studied Molecules.
| molecules | f | LHE |
|---|---|---|
| DF-R | 3.32 | 0.9995 |
| DF-M1 | 2.24 | 0.9942 |
| DF-M2 | 2.78 | 0.9983 |
| DF-M3 | 2.84 | 0.9985 |
| DF-M4 | 3.82 | 0.9998 |
| DF-M5 | 3.39 | 0.9995 |
| DF-M6 | 3.74 | 0.9998 |
3.12. Reduced Density Gradient Inspection
To study the NCI more efficiently, a visualization method is utilized, known as the reduced density gradient (RDG). The scattered graphs and gradient isosurfaces of DF-R and DF-M1–DF-M6 molecules are shown in Figure 10. The RDG spectra are divided into three colors blue, green, and red, in which function λ2(r) lies in a range between −0.035 and 0.000 au. The represented peaks having a region of λ2(r) < 0 (least value −0.05 au as in our case) are blue in color, which indicates strong electrostatic interactions such as hydrogen bonding, etc. In the area of λ2(r) = 0, the green color spikes are present, which indicate NCI, i.e., London dispersion forces, dipole–dipole interactions, etc. The red color spikes are present in the region λ2(r) > 0, indicating the stearic repulsion between atoms of all the molecules. In RDG analysis of all designed molecules (DF-M1–DF-M6), green color appears between the graphdiyne surface and blistering agents, which represents weak non-NCI.78 These interactions can also be visualized by RDG plots from −0.02 to 0.01 au. All scrutinized molecules have weak participation of London dispersion forces, quite similar to the SAPT analysis. Moreover, C–H and π interactions are represented by red and green flasky regions from 0.00 to 0.01 au, respectively. There is the absence of hydrogen bonding and NCI between graphdiyne surfaces and blistering agents because there are no blue peaks from −0.01 to 0.05 au. The red spikes in the RDG plots represent the exchange of forces by repulsion between carbon atoms on a graphdiyne sheet. The higher exchange rate energy of these molecules is due to the involvement of intermolecular repulsion instead of intramolecular.
Figure 10.

Scatter graphs and gradient isosurfaces of DF-R and DF-M1 to DF-M6 molecules.
3.13. Reorganization Energy
The RE is another helpful tool for determining the efficiency of OSCs. Smaller values of the RE tend to generate a higher mobility rate of charge transfer.79 There are two forms of RE, i.e., external and internal. Our main emphasis is on the internal RE of the molecules.80 The result shows that the value of λe of DF-M1, DF-M2, DF-M4, and DF-M6 are lower than that of DF-R, demonstrating a greater flow of electrons in these molecules (Table 11). DF-M2 has the lowest value of λe, owing to its planarity of structure compared to that of other molecules. The order of increasing values of λe of newly proposed molecules is DF-M2 < DF-M4 < DF-M6 < DF-M1 < DF-5 < DF-M3. The values of λh of DF-M1, DF-M2, DF-4, and DF-M5 are lower than that of DF-R. Individually, DF-M2 has the lowest λh than all other molecules. The increasing order of value of λh of molecules is DF-M2 < DF-M1 < DF-M5 < DF-M4 < DF-M6 < DF-M3, as shown in Figure 11. The values of λe are low, as compared to the λh values, confirming that these molecules might be acceptors owing to their lower electron REs in the BHJ layer of organic PV cells.
Table 11. RE Values of DF-R and DF-M1–DF-M6 Molecules.
| molecules | λe (eV) | λh (eV) |
|---|---|---|
| DF-R | 0.1913679 | 0.2134259 |
| DF-M1 | 0.1411818 | 0.1683049 |
| DF-M2 | 0.0683896 | 0.1566471 |
| DF-M3 | 0.2003499 | 0.2400578 |
| DF-M4 | 0.1065734 | 0.2037914 |
| DF-M5 | 0.1978983 | 0.1869113 |
| DF-M6 | 0.1313589 | 0.2182036 |
Figure 11.
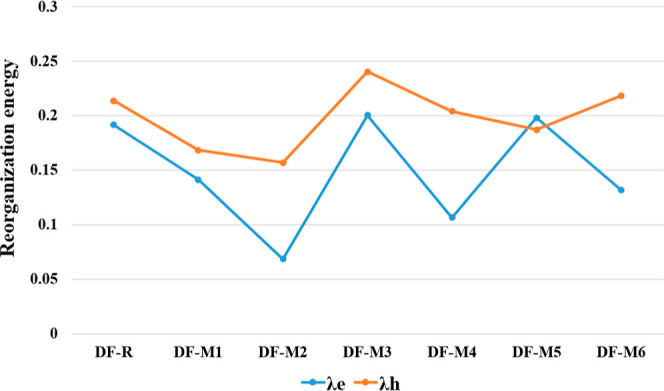
Scatter plot of λe and λh values of all of the examined molecules.
3.14. Device Efficiency
The extreme voltage achieved while no external current is flowing is known as the open circuit voltage (VOC). The VOC can be calculated by using eq 9.81
| 9 |
where VOC is the open-circuit voltage, and 0.3 is a practical adjustment. Moreover, in this theoretical study work’s constructed molecules, e is taken into consideration to be a standard charge with a value of 1. The values of VOC, normalized VOC, and FF are written in Table 12. These values are obtained by taking our studied molecules as acceptors. The energy levels of the studied molecules as well as the J61 donor with the estimated VOC, are shown in Figure 12. Therefore, their LUMO values are used for the estimation of VOC by using the HOMO of J61, which has a LUMO energy value of −3.08 eV and a HOMO energy value of −5.32 eV.82 In comparison with the DF-R molecule, the two newly designed molecules (DF-M4 and DF-M6) have higher VOC due to an upshift in the LUMO energy level, attributed to their charge transferring bridges, which indicates their good voltage generation property. Thus, it could be said that from DF-M1 to DF-M3, due to the greater electron-accepting properties of these bridges instead of charge transferring, their lowered LUMO level has reduced their VOC, despite the greater conjugation present in them.
Table 12. Calculated VOC, Normalized VOC, FF, and Energy Loss of All the Analyzed Molecules.
| molecules | Voc (eV) | normalized Voc | FF | energy loss (eV) |
|---|---|---|---|---|
| DF-R | 1.73 | 66.8899 | 0.9232 | 0.68 |
| DF-M1 | 1.14 | 44.0580 | 0.8934 | 0.48 |
| DF-M2 | 1.17 | 45.2174 | 0.8956 | 0.46 |
| DF-M3 | 1.31 | 50.6280 | 0.9043 | 0.59 |
| DF-M4 | 1.80 | 69.5652 | 0.9256 | 0.19 |
| DF-M5 | 1.64 | 63.3816 | 0.9198 | 0.45 |
| DF-M6 | 1.93 | 74.5894 | 0.9296 | 0.20 |
Figure 12.

Comparison between open circuit voltages of values of all scrutinized molecules and combined donor J61.
The PCE of the engineered molecules is proportional to the FF of the designed molecules. This value has no dimension and can be calculated by employing eq 10.
 |
10 |
In the above equation, normalized VOC = eVoc/KBT, where KB is the Boltzmann constant in eV, T shows the room temperature up to 300 K, and e is the charge with a value of 1.35,83,84DF-M4 and DF-M6 molecules show maximum values of the FF (Table 12); thus, these can be used in the active layer of OSCs to enhance OSC efficiencies.
Energy loss is a crucial parameter that affects the OSCs functionality. The amount of energy converted from light energy to electrical energy has a direct effect on the extent of energy generated by OSC molecules. The higher energy loss results in a decreased overall performance and a lowered PCE of OSCs. Reducing the energy loss is a critical problem for the production of OSCs exhibiting excellent efficiencies. Energy loss values of all the examined molecules were determined by using eq 11.
| 11 |
where Eg shows the orbital band gap and “q” represents the elementary charge. The examined energy loss values of all modeled molecules are listed in Table 12. The total Eloss value in the DF-R molecule is 0.68 eV, while in newly presented molecules (DF-M1 to DF-M6), the values of energy loss are 0.48, 0.46, 0.59, 0.19, 0.45, and 0.20 eV, respectively. Thus, all the designed chromophores exhibit lower Eloss values than DF-R. This can be due to the low band gap of the newly designed molecules. Designing NFA molecules with a narrow band gap can minimize energy losses due to thermalization. This can also be due to the proper energy level alignment between the donor and acceptor materials, which is essential to minimize energy losses. By matching the energy levels and reducing the energy offset between donors and acceptors, the energy loss due to charge transfer can be reduced, leading to improved device performance.85,86
Furthermore, longer conjugation allows for a broader absorption spectrum, enabling the utilization of a larger portion of the solar spectrum and minimizing energy losses due to underutilized photons.87 The insertion of π-spacers has resulted in extended conjugation, narrowing the band gap, improving the light absorption, and increasing the charge mobility in newly designed molecules.10,88 These spacers can enhance the intermolecular π–π stacking interactions, leading to better charge transfer and reduced energy losses due to charge recombination.89 All these factors contribute toward minimizing the energy loss in OSCs. Among all scrutinized molecules, DF-M4 exhibited a prominent reduction in the Eloss value. Consequently, all novel scrutinized molecules exhibit greater functioning qualities than the DF-R molecule because of lowered Eloss values.
3.15. Charge Transfer Analysis of the J61:DF-M6 Complex
In order to analyze charge transfer analysis between the donor (J61) and designed molecules, DF-M6 was selected due to its extra ordinary charge transporting properties, higher Voc, and comparatively reduced Eloss values. In NFAs, the J61 polymer acts as a donor in OSCs. The theoretically determined charge transfer analysis between J61 and the DF-M6 donor complex and acceptor molecules, respectively, is illustrated in Figure 13.
Figure 13.

HOMO/LUMO charge transfer between the J61 polymer and DF-M6 designed molecule.
It can be seen that excellent charge transfer occurred from J61 to DF-M6. The FMO pattern revealed that the HOMO density resides on the polymer donor (J61) and the LUMO density is present on the acceptor (DF-M6) molecule, which validates charge transfer from the donor to DF-M6. These outcomes confirm that these newly designed molecules can be utilized for the manufacture of proficient OSC devices in future.
4. Conclusions
Six A–π–D–π–A type molecules (DF-M1 to DF-M6) were proposed theoretically, and their photovoltaic properties are studied using DFT approaches. All the scrutinized molecules having π–π-spacers shows greater absorption than DF-R in the UV and near-infrared regions. Here, DF-M1 and DF-M2 show absorption at 1006 and 1004 nm, respectively, in the chloroform solvent and have the smallest HOMO and LUMO band gap (1.62 and 1.63 eV, respectively) compared to other molecules. DF-M1 shows the lowest binding energy, 0.38 eV, in the solvent phase; thus, easier exciton dissociation takes place. In the case of the dipole moment, DF-M2, DF-M5, and DF-M6 have the highest dipole moment; therefore, these molecules have better aggregation properties with little defects in the donor and acceptor parts of these molecules. RE analysis indicated that DF-M2 has its least value for electrons (0.0683896 eV) and also has the lowest hole RE (0.1566471 eV). DF-M4 and DF-M6 showed higher VOC (1.80 and 1.93 eV, respectively) than the DF-R molecule, exhibiting improved efficiency for organic photovoltaic cells. Furthermore, because all of these molecules show reduced energy loss as compared to the reference molecule, these molecules can be used to replace the pre-existing DF-R molecule to develop efficient solar devices. Results indicate that the spacers used in DF-M1 and DF-M2 are more efficient in lowering the band gap, improving light absorption, and increasing the charge mobility. On the spacer (π-linkers) used in the DF-M6 molecule is most proficient for lowering the energy loss in OSCs. Here, it is concluded that the π-linkers having extended conjugation and a low band gap can be utilized as bridges in order to develop solar cells with reduced energy losses.
Acknowledgments
The authors express their gratitude to Princess Nourah bint Abdulrahman University Researchers Supporting Project number (PNURSP2023R58), Princess Nourah bint Abdulrahman University, Riyadh, Saudi Arabia, and the authors also express their appreciation to the Deanship of Scientific Research at King Khalid University, Saudi Arabia, for funding this work through the research group program under grant number RGP. 2/522/44.
Supporting Information Available
The Supporting Information is available free of charge at https://pubs.acs.org/doi/10.1021/acsomega.3c05665.
Geometries of DF-R and DF-M1 to DF-M6 molecules exhibiting the planarity in molecules and Cartesian coordinates of the reference molecule and the designed molecules (PDF)
The authors declare no competing financial interest.
Supplementary Material
References
- Upama M. B.; Mahmud M. A.; Conibeer G.; Uddin A. Trendsetters in High-Efficiency Organic Solar Cells: Toward 20% Power Conversion Efficiency. Sol. RRL 2020, 4 (1), 1900342. 10.1002/solr.201900342. [DOI] [Google Scholar]
- Qin J.; Lan L.; Chen S.; Huang F.; Shi H.; Chen W.; Xia H.; Sun K.; Yang C. Recent progress in flexible and stretchable organic solar cells. Adv. Funct. Mater. 2020, 30 (36), 2002529. 10.1002/adfm.202002529. [DOI] [Google Scholar]
- Waqas M.; Hadia N.; Hessien M.; Iqbal J.; Mersal G. A.; Hameed S.; Shawky A. M.; Aloui Z.; Ibrahim M. A.; Ahmad Khera R. End-group modification of terminal acceptors on benzothiadiazole-based BT2F-IC4F molecule to establish efficient organic solar cells. J. Mol. Liq. 2022, 368, 120770. 10.1016/j.molliq.2022.120770. [DOI] [Google Scholar]
- Wu J.; Gao M.; Chai Y.; Liu P.; Zhang B.; Liu J.; Ye L. Towards a bright future: The versatile applications of organic solar cells. Mater. Rep.: Energy 2021, 1 (4), 100062. 10.1016/j.matre.2021.100062. [DOI] [Google Scholar]
- Zhang T.; Chen Y.; Chu Y.; Ding S. J.; Liu W.; Wu X. Flexible Perovskite and Organic Semiconductor Heterojunction Devices for Tunable Band-Selective Photodetection. ACS Appl. Electron. Mater. 2022, 4 (6), 2805–2814. 10.1021/acsaelm.2c00322. [DOI] [Google Scholar]
- Yang Y.; Xu B.; Hou J. Solution-Processed Silver Nanowire as Flexible Transparent Electrodes in Organic Solar Cells. Chin. J. Chem. 2021, 39 (8), 2315–2329. 10.1002/cjoc.202000696. [DOI] [Google Scholar]
- Xiao B.; Tang A.; Yang J.; Mahmood A.; Sun X.; Zhou E. Quinoxaline-containing nonfullerene small-molecule acceptors with a linear A2-A1-D-A1-A2 skeleton for poly (3-hexylthiophene)-based organic solar cells. ACS Appl. Mater. Interfaces 2018, 10 (12), 10254–10261. 10.1021/acsami.8b00216. [DOI] [PubMed] [Google Scholar]
- Majeed M.; Waqas M.; Mehmood R. F.; Alatawi N. S.; Essid M.; Khera R. A. Modified optoelectronic parameters by end-group engineering of A-D-A type non-fullerene-based small symmetric acceptors constituting IBDT core for high-performance photovoltaics. J. Phys. Chem. Solids 2023, 181, 111495. 10.1016/j.jpcs.2023.111495. [DOI] [Google Scholar]
- Sadiq S.; Waqas M.; Zahoor A.; Mehmood R. F.; Essid M.; Aloui Z.; Khera R. A.; Akram S. J. Synergistic modification of end groups in Quinoxaline fused core-based acceptor molecule to enhance its photovoltaic characteristics for superior organic solar cells. J. Mol. Graphics Modell. 2023, 123, 108518. 10.1016/j.jmgm.2023.108518. [DOI] [PubMed] [Google Scholar]
- Menke S. M.; Ran N. A.; Bazan G. C.; Friend R. H. Understanding energy loss in organic solar cells: toward a new efficiency regime. Joule 2018, 2 (1), 25–35. 10.1016/j.joule.2017.09.020. [DOI] [Google Scholar]
- Shi Y.; Chang Y.; Lu K.; Chen Z.; Zhang J.; Yan Y.; Qiu D.; Liu Y.; Adil M. A.; Ma W.; et al. Small reorganization energy acceptors enable low energy losses in non-fullerene organic solar cells. Nat. Commun. 2022, 13 (1), 3256. 10.1038/s41467-022-30927-y. [DOI] [PMC free article] [PubMed] [Google Scholar]
- Xie Y.; Wu H. Balancing charge generation and voltage loss toward efficient nonfullerene organic solar cells. Mater. Today Adv. 2020, 5, 100048. 10.1016/j.mtadv.2019.100048. [DOI] [Google Scholar]
- Ji Y.; Xu L.; Hao X.; Gao K. Energy loss in organic solar cells: mechanisms, strategies, and prospects. Sol. RRL 2020, 4 (7), 2000130. 10.1002/solr.202000130. [DOI] [Google Scholar]
- Piradi V.; Zhang G.; Li T.; Zhang M.; Peng Q.; Zhan X.; Zhu X. Side-Chain Engineering of Benzodithiophene-Bridged Dimeric Porphyrin Donors for All-Small-Molecule Organic Solar Cells. ACS Appl. Mater. Interfaces 2020, 12 (37), 41506–41514. 10.1021/acsami.0c11410. [DOI] [PubMed] [Google Scholar]
- Zhang G.; Zhao J.; Chow P. C. Y.; Jiang K.; Zhang J.; Zhu Z.; Zhang J.; Huang F.; Yan H. Nonfullerene Acceptor Molecules for Bulk Heterojunction Organic Solar Cells. Chem. Rev. 2018, 118 (7), 3447–3507. 10.1021/acs.chemrev.7b00535. [DOI] [PubMed] [Google Scholar]
- Suman S. P.; Singh S. P. Impact of end groups on the performance of non-fullerene acceptors for organic solar cell applications. J. Mater. Chem. A 2019, 7 (40), 22701–22729. 10.1039/c9ta08620j. [DOI] [Google Scholar]
- Lee J.-W.; Sun C.; Lee S. W.; Kim G. U.; Li S.; Wang C.; Kim T. S.; Kim Y. H.; Kim B. J. Sequentially regular polymer acceptors featuring flexible spacers for high-performance and mechanically robust all-polymer solar cells. Energy Environ. Sci. 2022, 15 (11), 4672–4685. 10.1039/D2EE02523J. [DOI] [Google Scholar]
- Hai J.; Luo S.; Yu H.; Chen H.; Lu Z.; Li L.; Zou Y.; Yan H. Achieving ultra-narrow bandgap non-halogenated non-fullerene acceptors via vinylene π-bridges for efficient organic solar cells. Mater. Adv. 2021, 2 (6), 2132–2140. 10.1039/D0MA01017K. [DOI] [Google Scholar]
- Tong J.; Huang Y.; Liu W.; Shou M.; An L.; Jiang X.; Guo P.; Han Y.; Liang Z.; Li J.; et al. Optimized molecular aggregation and photophysical process synergistically promoted photovoltaic performance in low-regularity benzo[c] [1,2,5]thiadiazole-based medium-bandgap copolymers via modulating π bridges. J. Mater. Chem. C 2022, 10 (42), 16028–16039. 10.1039/D2TC02786K. [DOI] [Google Scholar]
- Zhang W.; Wang Y.; Li X.; Song C.; Wan L.; Usman K.; Fang J. Recent Advance in Solution-Processed Organic Interlayers for High-Performance Planar Perovskite Solar Cells. Adv. Sci. 2018, 5 (7), 1800159. 10.1002/advs.201800159. [DOI] [PMC free article] [PubMed] [Google Scholar]
- Gao W.; Lin F. R.; Jen A. K.-Y. Near-Infrared Absorbing Nonfullerene Acceptors for Organic Solar Cells. Sol. RRL 2022, 6 (1), 2100868. 10.1002/solr.202100868. [DOI] [Google Scholar]
- Li S.; Zhan L.; Liu F.; Ren J.; Shi M.; Li C.; Russell T. P.; Chen H. An unfused-core-based nonfullerene acceptor enables high-efficiency organic solar cells with excellent morphological stability at high temperatures. Adv. Mater. 2018, 30 (6), 1705208. 10.1002/adma.201705208. [DOI] [PubMed] [Google Scholar]
- Akram S. J.; Hadia N. M. A.; Iqbal J.; Mehmood R. F.; Iqbal S.; Shawky A. M.; Asif A.; Somaily H. H.; Raheel M.; Khera R. A. Impact of various heterocyclic π-linkers and their substitution position on the opto-electronic attributes of the A−π–D−π–A type IECIO-4F molecule: a comparative analysis. RSC Adv. 2022, 12 (32), 20792–20806. 10.1039/D2RA04097B. [DOI] [PMC free article] [PubMed] [Google Scholar]
- Chmovzh T. N.; Knyazeva E. A.; Tanaka E.; Popov V. V.; Mikhalchenko L. V.; Robertson N.; Rakitin O. A. [1, 2, 5] Thiadiazolo [3, 4-d] pyridazine as an internal acceptor in the DA-π-A organic sensitizers for dye-sensitized solar cells. Molecules 2019, 24 (8), 1588. 10.3390/molecules24081588. [DOI] [PMC free article] [PubMed] [Google Scholar]
- Biehl E. R.Five-Membered Ring Systems: Thiophenes and Se/Te Derivatives. Progress in Heterocyclic Chemistry; Elsevier, 2011; pp 109–141. [Google Scholar]
- Luo D.; Zhang Y.; Li L.; Shan C.; Liu Q.; Wang Z.; Choy W. C.; Kyaw A. K. K. Near-infrared non-fused ring acceptors with light absorption up to 1000 nm for efficient and low-energy loss organic solar cells. Mater. Today Energy 2022, 24, 100938. 10.1016/j.mtener.2021.100938. [DOI] [Google Scholar]
- Zheng H.; Zhao Y.; Song M. X.; Wang J.; Chen L. Q.; Sun L.; Bai F. Q. Influences of donor/acceptor ratio on the optical and electrical properties of the D/A alternating model oligomers: A density functional theory study. Spectrochim. Acta, Part A 2018, 199, 260–270. 10.1016/j.saa.2018.03.067. [DOI] [PubMed] [Google Scholar]
- Frisch A.Gaussian 09W Reference; Wallingford: USA, 2009; Vol. 470, p 25.
- Dennington R.; Keith T. A.; Millam J. M.. GaussView 6.0. 16; Semichem Inc.: Shawnee Mission: KS, USA, 2016.
- Paier J.; Marsman M.; Kresse G. Why does the B3LYP hybrid functional fail for metals?. J. Chem. Phys. 2007, 127 (2), 024103. 10.1063/1.2747249. [DOI] [PubMed] [Google Scholar]
- Yanai T.; Tew D. P.; Handy N. C. A new hybrid exchange–correlation functional using the Coulomb-attenuating method (CAM-B3LYP). Chem. Phys. Lett. 2004, 393 (1–3), 51–57. 10.1016/j.cplett.2004.06.011. [DOI] [Google Scholar]
- Adamo C.; Barone V. Exchange functionals with improved long-range behavior and adiabatic connection methods without adjustable parameters: The m PW and m PW1PW models. J. Chem. Phys. 1998, 108 (2), 664–675. 10.1063/1.475428. [DOI] [Google Scholar]
- Chai J.-D.; Head-Gordon M. Long-range corrected hybrid density functionals with damped atom–atom dispersion corrections. Phys. Chem. Chem. Phys. 2008, 10 (44), 6615–6620. 10.1039/b810189b. [DOI] [PubMed] [Google Scholar]
- Gerber R. B.; Buch V.; Ratner M. A. Time-dependent self-consistent field approximation for intramolecular energy transfer. I. Formulation and application to dissociation of van der Waals molecules. J. Chem. Phys. 1982, 77 (6), 3022–3030. 10.1063/1.444225. [DOI] [Google Scholar]
- Sun L.; Bai F. Q.; Zhao Z. X.; Zhang H. X. Design of new benzothiadiazole-based linear and star molecules with different functional groups as solar cells materials: A theoretical approach. Sol. Energy Mater. Sol. Cells 2011, 95 (7), 1800–1810. 10.1016/j.solmat.2011.02.003. [DOI] [Google Scholar]
- Deschenes L. A.; David A.; Vanden A.; BoutUniversity of Texas . Origin 6.0: Scientific Data Analysis and Graphing Software Origin Lab Corporation (formerly Microcal Software, Inc.), 2000; ACS Publications. https://www.originlab.com/. Commercial price: 595.Academicprice: 446.
- Ayub A.; Ans M.; Gul S.; Shawky A. M.; Ayub K.; Iqbal J.; Hashmi M. A.; Lakhani A. Toward High-Performance Quinoxaline Based Non-fullerene Small Molecule Acceptors for Organic Solar Cells. Electron. Mater. Lett. 2022, 19, 38–54. 10.1007/s13391-022-00378-0. [DOI] [Google Scholar]
- Lu T.; Chen F. Multiwfn: a multifunctional wavefunction analyzer. J. Comput. Chem. 2012, 33 (5), 580–592. 10.1002/jcc.22885. [DOI] [PubMed] [Google Scholar]
- Lu T. Simple, reliable, and universal metrics of molecular planarity. J. Mol. Model. 2021, 27 (9), 263. 10.1007/s00894-021-04884-0. [DOI] [PubMed] [Google Scholar]
- Khan M. I.; Hadia N.; Shawky A. M.; Hessien M.; Essid M.; Akram S. J.; Iqbal J.; Alatawi N. S.; Mersal G. A.; Khera R. A. Quantum mechanical modeling of fused rings-based small-donor molecules with enhanced optoelectronic attributes for high performance organic photovoltaic cells. J. Phys. Chem. Solids 2023, 174, 111140. 10.1016/j.jpcs.2022.111140. [DOI] [Google Scholar]
- Rani S.; Al-Zaqri N.; Iqbal J.; Akram S. J.; Boshaala A.; Mehmood R. F.; Saeed M. U.; Rashid E. U.; Khera R. A. Designing dibenzosilole core based, A2−π–A1−π–D−π–A1−π–A2 type donor molecules for promising photovoltaic parameters in organic photovoltaic cells. RSC Adv. 2022, 12 (45), 29300–29318. 10.1039/D2RA05934G. [DOI] [PMC free article] [PubMed] [Google Scholar]
- Waqas M.; Hadia N. M. A.; Shawky A. M.; Mahmood R. F.; Essid M.; Aloui Z.; Alatawi N. S.; Iqbal J.; Khera R. A. Theoretical framework for achieving high Voc in non-fused non-fullerene terthiophene-based end-capped modified derivatives for potential applications in organic photovoltaics. RSC Adv. 2023, 13 (11), 7535–7553. 10.1039/D3RA00038A. [DOI] [PMC free article] [PubMed] [Google Scholar]
- Ullah Rashid E.; Iqbal J.; Farhat Mehmood R.; El-Badry Y. A.; Javaid Akram S.; Ahmad Khera R. Depicting the role of end-capped acceptors to amplify the photovoltaic properties of benzothiadiazole core-based molecules for high-performance organic solar cell applications. Comput. Theor. Chem. 2022, 1211, 113669. 10.1016/j.comptc.2022.113669. [DOI] [Google Scholar]
- Che Y.; Perepichka D. F. Quantifying planarity in the design of organic electronic materials. Angew. Chem., Int. Ed. 2021, 60 (3), 1364–1373. 10.1002/anie.202011521. [DOI] [PubMed] [Google Scholar]
- Zubair H.; Mahmood R. F.; Waqas M.; Ishtiaq M.; Iqbal J.; Ibrahim M. A. A.; Sayed S. R. M.; Noor S.; Khera R. A. Effect of tailoring π-linkers with extended conjugation on the SJ-IC molecule for achieving high VOC and improved charge mobility towards enhanced photovoltaic applications. RSC Adv. 2023, 13 (37), 26050–26068. 10.1039/D3RA03317A. [DOI] [PMC free article] [PubMed] [Google Scholar]
- Saeed M. U.; Iqbal J.; Mehmood R. F.; Riaz M.; Akram S. J.; Somaily H.; Shawky A. M.; Raheel M.; Khan M. I.; Rashid E. U.; et al. Structural modification on Dimethoxythienothiophene based non-fullerene acceptor molecule for construction of high-performance organic chromophores by employing DFT approach. J. Phys. Chem. Solids 2022, 170, 110906. 10.1016/j.jpcs.2022.110906. [DOI] [Google Scholar]
- Huang Y.; Rong C.; Zhang R.; Liu S. Evaluating frontier orbital energy and HOMO/LUMO gap with descriptors from density functional reactivity theory. J. Mol. Model. 2017, 23 (1), 3. 10.1007/s00894-016-3175-x. [DOI] [PubMed] [Google Scholar]
- Zahoor A.; Sadiq S.; Khera R. A.; Essid M.; Aloui Z.; Alatawi N. S.; Ibrahim M. A.; Hasanin T. H.; Waqas M. A DFT study for improving the photovoltaic performance of organic solar cells by designing symmetric non-fullerene acceptors by quantum chemical modification on pre-existed LC81 molecule. J. Mol. Graphics Modell. 2023, 125, 108613. 10.1016/j.jmgm.2023.108613. [DOI] [PubMed] [Google Scholar]
- Salim M.; Rafiq M.; Khera R. A.; Arshad M.; Iqbal J. Amplifying the photovoltaic properties of azaBODIPY core based small molecules by terminal acceptors modification for high performance organic solar cells: A DFT approach. Sol. Energy 2022, 233, 31–45. 10.1016/j.solener.2022.01.016. [DOI] [Google Scholar]
- Akram M.; Siddique S. A.; Iqbal J.; Hussain R.; Mehboob M. Y.; Siddique M. B. A.; Naveed S.; Ali B.; Hanif A.; Sajid M.; et al. End-capped engineering of bipolar diketopyrrolopyrrole based small electron acceptor molecules for high performance organic solar cells. Comput. Theor. Chem. 2021, 1201, 113242. 10.1016/j.comptc.2021.113242. [DOI] [Google Scholar]
- Kim Y.; Hwang H.; Kim N.; Hwang K.; Park J.; Shin G.; Kim D. π-Conjugated Polymers Incorporating a Novel Planar Quinoid Building Block with Extended Delocalization and High Charge Carrier Mobility. Adv. Mater. 2018, 30 (22), 1706557. 10.1002/adma.201706557. [DOI] [PubMed] [Google Scholar]
- Liang Z.; Yan L.; Si J.; Gong P.; Li X.; Liu D.; Li J.; Hou X. Rational Design and Characterization of Symmetry-Breaking Organic Semiconductors in Polymer Solar Cells: A Theory Insight of the Asymmetric Advantage. Materials 2021, 14 (21), 6723. 10.3390/ma14216723. [DOI] [PMC free article] [PubMed] [Google Scholar]
- Rani M.; Iqbal J.; Mehmood R. F.; Akram S. J.; Ghaffar K.; El-Bahy Z. M.; Khera R. A. Engineering of A-π-D-π-A system based non-fullerene acceptors to enhance the photovoltaic properties of organic solar cells; A DFT approach. Chem. Phys. Lett. 2022, 801, 139750. 10.1016/j.cplett.2022.139750. [DOI] [Google Scholar]
- Parr R. G.; Gazquez J. L. Hardness functional. J. Phys. Chem. 1993, 97 (16), 3939–3940. 10.1021/j100118a003. [DOI] [Google Scholar]
- Abbas F.; Ali U.; Muhammad Rizwan Ahmad H.; Tallat A.; Shehzad A.; Zeb Z.; Hussain I.; Saeed A.; Tariq M. Role of Iodo-Substituted Subphthalocyanine (Subpcs) π-conjugated aromatic N-fused di-Iminoisonidole units on the performance of non-fullerene small organic solar cells. Comput. Theor. Chem. 2022, 1207, 113508. 10.1016/j.comptc.2021.113508. [DOI] [Google Scholar]
- Ishtiaq M.; Waqas M.; Zubair H.; Mehmood R. F.; Al-Zaqri N.; Khera R. A.; Ibrahim M. A.; Iqbal J. Theoretical designing of symmetrical non-fullerene acceptor molecules by end-capped modification for promising photovoltaic properties of organic solar cells. J. Mol. Liq. 2023, 386, 122473. 10.1016/j.molliq.2023.122473. [DOI] [Google Scholar]
- Zahid S.; Rasool A.; Ans M.; Yaseen M.; Iqbal J. Quantum chemical approach of donor– π–acceptor based arylborane–arylamine macrocycles with outstanding photovoltaic properties toward high-performance organic solar cells. Energy Fuels 2021, 35 (18), 15018–15032. 10.1021/acs.energyfuels.1c02260. [DOI] [Google Scholar]
- Wang C.; Qiao Q.; Chi W.; Chen J.; Liu W.; Tan D.; McKechnie S.; Lyu D.; Jiang X.; Zhou W.; et al. Quantitative design of bright fluorophores and AIEgens by the accurate prediction of twisted intramolecular charge transfer (TICT). Angew. Chem. 2020, 132 (25), 10246–10258. 10.1002/ange.201916357. [DOI] [PubMed] [Google Scholar]
- Li Y.; Zhang J.; Liu S.; Zhang C.; Chuah C.; Tang Y.; Kwok R. T. K.; Lam J. W. Y.; Ou H.; Ding D.; et al. Enlarging the Reservoir: High Absorption Coefficient Dyes Enable Synergetic Near Infrared-II Fluorescence Imaging and Near Infrared-I Photothermal Therapy. Adv. Funct. Mater. 2021, 31 (29), 2102213. 10.1002/adfm.202102213. [DOI] [Google Scholar]
- Maqsood M. H.; Khera R. A.; Mehmood R. F.; Akram S. J.; Al-Zaqri N.; Ibrahim M. A.; Noor S.; Waqas M. End-cap modeling on the thienyl-substituted benzodithiophene trimer-based donor molecule for achieving higher photovoltaic performance. J. Mol. Graphics Modell. 2023, 124, 108550. 10.1016/j.jmgm.2023.108550. [DOI] [PubMed] [Google Scholar]
- Raikwar M. M.; Patil D. S.; Mathew E.; Varghese M.; Joe I. H.; Sekar N. Influence of thiophene spacer and auxiliary acceptor on the optical properties of 4-(Diethylamino)-2-hydroxybenzaldehyde based D-π-A-π-D Colorants with N-alkyl donors: Experimental, DFT and Z-scan study. J. Photochem. Photobiol., A 2019, 373, 45–58. 10.1016/j.jphotochem.2018.12.035. [DOI] [Google Scholar]
- Adnan M.; Mehboob M. Y.; Hussain R.; Irshad Z. In silico designing of efficient C-shape non-fullerene acceptor molecules having quinoid structure with remarkable photovoltaic properties for high-performance organic solar cells. Optik 2021, 241, 166839. 10.1016/j.ijleo.2021.166839. [DOI] [Google Scholar]
- Grancini G.; Maiuri M.; Fazzi D.; Petrozza A.; Egelhaaf H. J.; Brida D.; Cerullo G.; Lanzani G. Hot exciton dissociation in polymer solar cells. Nat. Mater. 2013, 12 (1), 29–33. 10.1038/nmat3502. [DOI] [PubMed] [Google Scholar]
- Haedler A. T.; Meskers S. C. J.; Zha R. H.; Kivala M.; Schmidt H. W.; Meijer E. W. Pathway complexity in the enantioselective self-assembly of functional carbonyl-bridged triarylamine trisamides. J. Am. Chem. Soc. 2016, 138 (33), 10539–10545. 10.1021/jacs.6b05184. [DOI] [PubMed] [Google Scholar]
- Haiduke R. L.; Bruns R. E. An Atomic Charge– Charge Flux– Dipole Flux Atom-in-Molecule Decomposition for Molecular Dipole-Moment Derivatives and Infrared Fundamental Intensities. J. Phys. Chem. A 2005, 109 (11), 2680–2688. 10.1021/jp045357u. [DOI] [PubMed] [Google Scholar]
- Liao X.; Cui Y.; Shi X.; Yao Z.; Zhao H.; An Y.; Zhu P.; Guo Y.; Fei X.; Zuo L.; et al. The role of dipole moment in two fused-ring electron acceptor and one polymer donor based ternary organic solar cells. Mater. Chem. Front. 2020, 4 (5), 1507–1518. 10.1039/D0QM00016G. [DOI] [Google Scholar]
- Ji X.; Wang T.; Fu Q.; Liu D.; Wu Z.; Zhang M.; Woo H. Y.; Liu Y. Deciphering the Effects of Molecular Dipole Moments on the Photovoltaic Performance of Organic Solar Cells. Macromol. Rapid Commun. 2023, 2300213. 10.1002/marc.202300213. [DOI] [PubMed] [Google Scholar]
- Privado M.; de la Cruz P.; Malhotra P.; Sharma G. D.; Langa F. Influence of the dipole moment on the photovoltaic performance of polymer solar cells employing non-fullerene small molecule acceptor. Sol. Energy 2021, 221, 393–401. 10.1016/j.solener.2021.04.049. [DOI] [Google Scholar]
- Li M.; Zhou Y.; Zhang J.; Song J.; Bo Z. Tuning the dipole moments of nonfullerene acceptors with an asymmetric terminal strategy for highly efficient organic solar cells. J. Mater. Chem. A 2019, 7 (15), 8889–8896. 10.1039/C8TA12530A. [DOI] [Google Scholar]
- Chen Q.; Wang C.; Li Y.; Chen L. Interfacial Dipole in Organic and Perovskite Solar Cells. J. Am. Chem. Soc. 2020, 142 (43), 18281–18292. 10.1021/jacs.0c07439. [DOI] [PubMed] [Google Scholar]
- Zhao D.; Lu Q.; Su R.; Li Y.; Zhao M. Light harvesting and optical-electronic properties of two quercitin and rutin natural dyes. Appl. Sci. 2019, 9 (12), 2567. 10.3390/app9122567. [DOI] [Google Scholar]
- Cui Y.; Yao H.; Zhang J.; Zhang T.; Wang Y.; Hong L.; Xian K.; Xu B.; Zhang S.; Peng J.; et al. Over 16% efficiency organic photovoltaic cells enabled by a chlorinated acceptor with increased open-circuit voltages. Nat. Commun. 2019, 10 (1), 2515. 10.1038/s41467-019-10351-5. [DOI] [PMC free article] [PubMed] [Google Scholar]
- Moses D.; Wang J.; Heeger A. J.; Kirova N.; Brazovski S. Singlet exciton binding energy in poly (phenylene vinylene). Proc. Natl. Acad. Sci. U.S.A. 2001, 98 (24), 13496–13500. 10.1073/pnas.241497098. [DOI] [PMC free article] [PubMed] [Google Scholar]
- Mark M. F.Excited state dynamics of organic chromophores used in solar hydrogen production. Ph.D. Thesis, University of Rochester, 2018. [Google Scholar]
- Waqas M.; Hadia N.; Hessien M.; Javaid Akram S.; Shawky A. M.; Iqbal J.; Ibrahim M. A.; Ahmad Khera R. Designing of symmetrical A-D-A type non-fullerene acceptors by side-chain engineering of an indacenodithienothiophene (IDTT) core based molecule: A computational approach. Comput. Theor. Chem. 2022, 1217, 113904. 10.1016/j.comptc.2022.113904. [DOI] [Google Scholar]
- Zhou J.; Guo Q.; Zhang B.; Cheng S. X.; Hao X. T.; Zhong Y.; Tang A.; Sun X.; Zhou E. Improving the Photovoltaic Performance of Dithienobenzodithiophene-Based Polymers via Addition of an Additional Eluent in the Soxhlet Extraction Process. ACS Appl. Mater. Interfaces 2022, 14 (46), 52244–52252. 10.1021/acsami.2c14280. [DOI] [PubMed] [Google Scholar]
- Esteso V.; Caliò L.; Espinós H.; Lavarda G.; Torres T.; Feist J.; García-Vidal F. J.; Bottari G.; Míguez H. Light-Harvesting Properties of a Subphthalocyanine Solar Absorber Coupled to an Optical Cavity. Sol. RRL 2021, 5 (8), 2100308. 10.1002/solr.202100308. [DOI] [Google Scholar]
- Contreras-García J.; Boto R. A.; Izquierdo-Ruiz F.; Reva I.; Woller T.; Alonso M. A benchmark for the non-covalent interaction (NCI) index or··· is it really all in the geometry?. Theor. Chem. Acc. 2016, 135 (10), 242. 10.1007/s00214-016-1977-7. [DOI] [Google Scholar]
- Benatto L.; Moraes C. A. M.; Candiotto G.; Sousa K. R. A.; Souza J. P. A.; Roman L. S.; Koehler M. Conditions for efficient charge generation preceded by energy transfer process in non-fullerene organic solar cells. J. Mater. Chem. A 2021, 9 (48), 27568–27585. 10.1039/D1TA06698F. [DOI] [Google Scholar]
- Saleem R.; Farhat A.; Khera R. A.; Langer P.; Iqbal J. Designing of small molecule non-fullerene acceptors with cyanobenzene core for photovoltaic application. Comput. Theor. Chem. 2021, 1197, 113154. 10.1016/j.comptc.2021.113154. [DOI] [Google Scholar]
- Rafiq M.; Salim M.; Noreen S.; Ahmad Khera R.; Noor S.; Yaqoob U.; Iqbal J. End-capped modification of dithienosilole based small donor molecules for high performance organic solar cells using DFT approach. J. Mol. Liq. 2022, 345, 118138. 10.1016/j.molliq.2021.118138. [DOI] [Google Scholar]
- Wu X.; Wang W.; Hang H.; Li H.; Chen Y.; Xu Q.; Tong H.; Wang L. Star-Shaped Fused-Ring Electron Acceptors with a C3h-Symmetric and Electron-Rich Benzotri(cyclopentadithiophene) Core for Efficient Nonfullerene Organic Solar Cells. ACS Appl. Mater. Interfaces 2019, 11 (31), 28115–28124. 10.1021/acsami.9b08017. [DOI] [PubMed] [Google Scholar]
- Khan M. I.; Iqbal J.; Akram S. J.; El-Badry Y. A.; Yaseen M.; Khera R. A. End-capped group modification on cyclopentadithiophene based non-fullerene small molecule acceptors for efficient organic solar cells; a DFT approach. J. Mol. Graphics Modell. 2022, 113, 108162. 10.1016/j.jmgm.2022.108162. [DOI] [PubMed] [Google Scholar]
- Miryuk O. A. Phase composition of belite cements of increased hydraulic activity. Mag. Civ. Eng. 2022, 112 (4), 11201. 10.34910/MCE.112.1. [DOI] [Google Scholar]
- Wang J.; Jiang X.; Wu H.; Feng G.; Wu H.; Li J.; Yi Y.; Feng X.; Ma Z.; Li W.; et al. Increasing donor-acceptor spacing for reduced voltage loss in organic solar cells. Nat. Commun. 2021, 12 (1), 6679. 10.1038/s41467-021-26995-1. [DOI] [PMC free article] [PubMed] [Google Scholar]
- Gu X.; Wei Y.; Yu N.; Qiao J.; Han Z.; Lin Q.; Han X.; Gao J.; Li C.; Zhang J.; et al. High-Efficiency and Low-Energy-Loss Organic Solar Cells Enabled by Tuning Conformations of Dimeric Electron Acceptors. CCS Chem. 2023, 1–13. 10.31635/ccschem.023.202202575. [DOI] [Google Scholar]
- Chen H.; Zou Y.; Liang H.; He T.; Xu X.; Zhang Y.; Ma Z.; Wang J.; Zhang M.; Li Q.; et al. Lowing the energy loss of organic solar cells by molecular packing engineering via multiple molecular conjugation extension. Sci. China: Chem. 2022, 65 (7), 1362–1373. 10.1007/s11426-022-1264-y. [DOI] [Google Scholar]
- He D.; Zhao F.; Wang C.; Lin Y. Non-Radiative Recombination Energy Losses in Non-Fullerene Organic Solar Cells. Adv. Funct. Mater. 2022, 32 (19), 2111855. 10.1002/adfm.202111855. [DOI] [Google Scholar]
- Zhang L.; Deng W.; Wu B.; Ye L.; Sun X.; Wang Z.; Gao K.; Wu H.; Duan C.; Huang F.; et al. Reduced Energy Loss in Non-Fullerene Organic Solar Cells with Isomeric Donor Polymers Containing Thiazole π-Spacers. ACS Appl. Mater. Interfaces 2020, 12 (1), 753–762. 10.1021/acsami.9b18048. [DOI] [PubMed] [Google Scholar]
Associated Data
This section collects any data citations, data availability statements, or supplementary materials included in this article.