Abstract
Abundant high-molecular-mass hyaluronic acid (HMM-HA) contributes to cancer resistance and possibly to the longevity of the longest-lived rodent—the naked mole-rat1,2. To study whether the benefits of HMM-HA could be transferred to other animal species, we generated a transgenic mouse overexpressing naked mole-rat hyaluronic acid synthase 2 gene (nmrHas2). nmrHas2 mice showed an increase in hyaluronan levels in several tissues, and a lower incidence of spontaneous and induced cancer, extended lifespan and improved healthspan. The transcriptome signature of nmrHas2 mice shifted towards that of longer-lived species. The most notable change observed in nmrHas2 mice was attenuated inflammation across multiple tissues. HMM-HA reduced inflammation through several pathways, including a direct immunoregulatory effect on immune cells, protection from oxidative stress and improved gut barrier function during ageing. These beneficial effects were conferred by HMM-HA and were not specific to the nmrHas2 gene. These findings demonstrate that the longevity mechanism that evolved in the naked mole-rat can be exported to other species, and open new paths for using HMM-HA to improve lifespan and healthspan.
Naked mole-rats are mouse-size rodents that display exceptional longevity, with the maximum lifespan of over 40 years3. Naked mole-rats are protected from multiple age-related diseases 4,5. Previously, we have identified a novel anticancer mechanism in the naked mole-rat named early contact inhibition1 that is mediated by abundant HMM-HA2. Naked mole-rat tissues are highly enriched for HMM-HA compared with mouse and human tissues.
Hyaluronan is a non-protein component of the extracellular matrix consisting of repeating disaccharide chains of N-acetyl-glucosamine and glucuronic acid that affects biomechanical properties of tissues and interacts with cell receptors 6,7. The length of hyaluronan can range from an oligomer to an extremely long-form up to millions of Daltons, and the biological functions of hyaluronan depend on its molecular mass. Low-molecular-mass HA (LMM-HA) is associated with inflammation, tissue injury and cancer metastasis8–11, whereas HMM-HA improves tissue homeostasis12 and shows anti-inflammatory13,14 and antioxidant properties15. The HMM-HA (>6.1 MDa) produced by naked mole-rats has unique cytoprotective properties16. The hyaluronan content is determined by the balance of hyaluronan synthesis and degradation17. Has2 mainly produces HMM-HA and shows higher expression in naked mole-rats compared with in mice and humans2. Naked mole-rat tissues also show lower activity of hyaluronidases, resulting in the massive accumulation of HMM-HA2. Age-related sterile inflammation has emerged as an important driving force of aging and age-related diseases18,19. Thus, the anti-inflammatory functions of HMM-HA may confer anti-ageing effects. To test whether anti-cancer and potential anti-ageing effects of HMM-HA can be recapitulated in species other than the naked mole-rat, we generated and characterized a mouse model overexpressing naked mole-rat Has2 gene (nmrHas2 mice).
Generation of nmrHAS2 mice
As naked mole-rats accumulate HMM-HA in the majority of their tissues, to recreate this phenotype in mice, we chose to express the naked mole-rat Has2 gene (nmrHas2) in mice using a ubiquitous CAG promoter. In the naked mole-rat, HMM-HA begins to accumulate postnatally1 as it is not compatible with rapid cell proliferation required during embryogenesis. We therefore controlled nmrHas2 expression temporally using a Lox-STOP cassette. Expression of the nmrHas2 gene was induced by injections of tamoxifen at 3 months of age (Fig. 1a). Both nmrHas2 and control mice received tamoxifen injections.
Figure 1. Transgenic mice overexpressing nmrHas2 are resistant to both spontaneous and induced cancer.
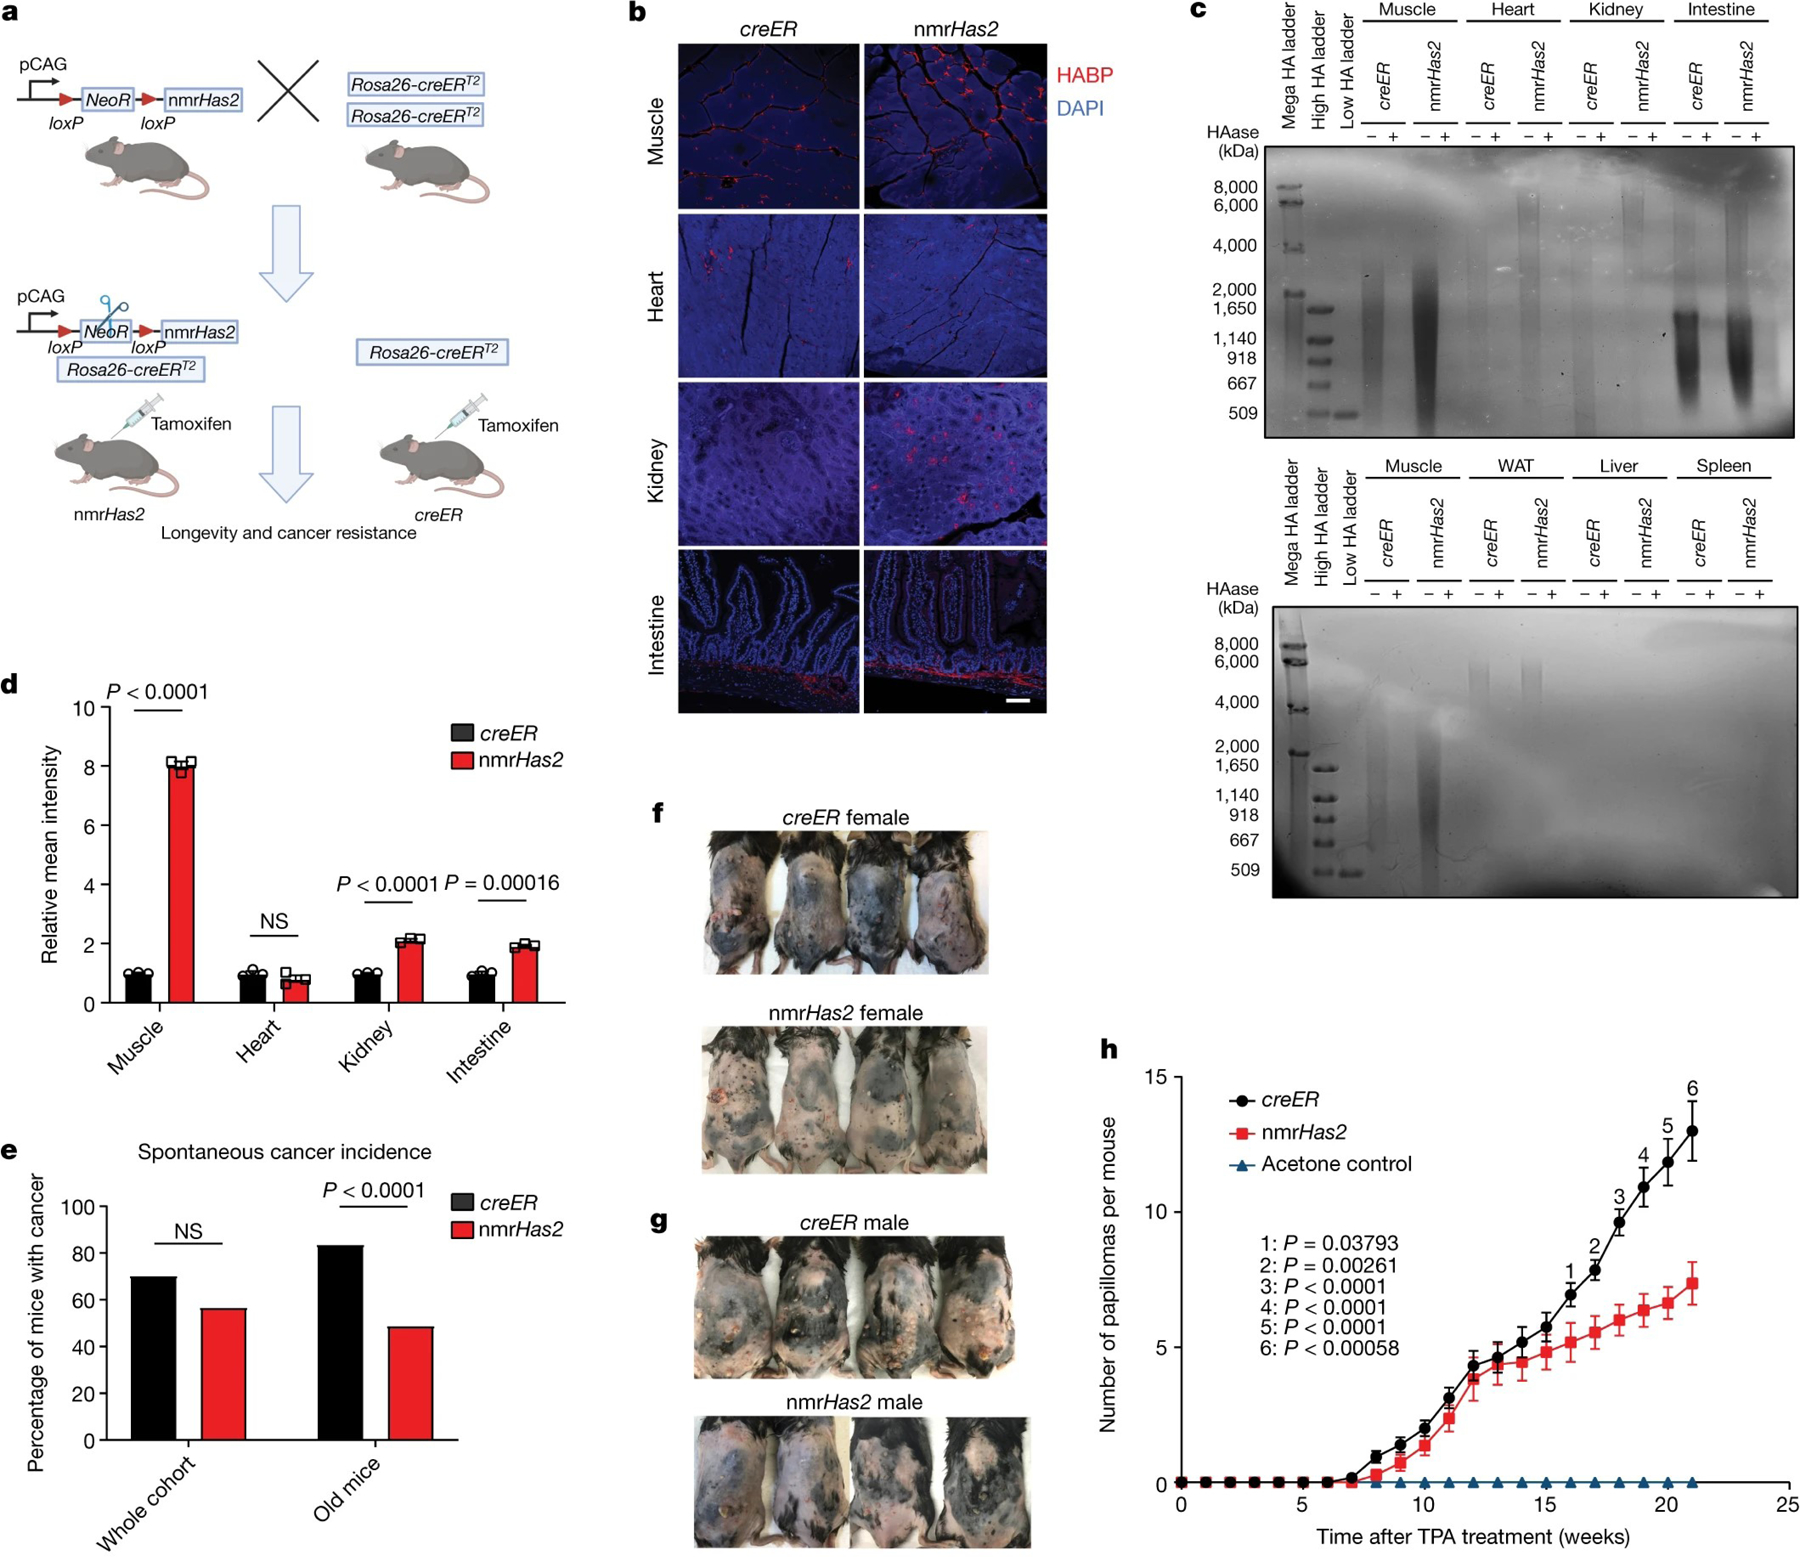
a. The breeding strategy for nmrHas2 mice. Mice heterozygous for the nmrHas2 transgene were bred with mice homozygous for Rosa26-creERT2 to obtain double-heterozygous nmrHas2; creER progeny. Single-heterozygous creER progeny were used as controls. Tamoxifen was injected at 2–3 months of age to induce nmrHas2 expression. creER mice also received tamoxifen.
b. Representative pictures of HABP staining in multiple organs of female mice. Scale bar, 50 μm.
c. Pulse-field gel showing that nmrHas2 mice have higher molecular mass and more abundant HA in multiple tissues (female mice are shown). HA was extracted from 200 mg of pooled tissue from two individuals. HAase-treated samples were run in parallel to confirm the specificity of HA staining. HA from the muscle was loaded onto both gels as a cross reference. WAT, white adipose tissue.
d. Quantification of relative HABP fluorescence intensity shown in b. n = 3 biological replicates (squares).
e. Old nmrHas2 mice (n = 74) have a much lower spontaneous cancer incidence compared with creER mice (n = 81). Pooled female and male mice. Old mice were older than 27 months. Statistical analysis was performed using a two-tailed χ2 test.
f. Representative pictures of female mice after 20 weeks of DMBA/TPA treatment.
g. Representative pictures of male mice after 20 weeks of DMBA/TPA treatment.
h. nmrHas2 mice are more resistant to DMBA/TPA-induced skin papilloma. Pooled female and male mice. n = 7 (acetone treated), n = 13 (creER) and n = 11 (nmrHas2) mice. P values were calculated using two-tailed unpaired t-tests and are indicated in the graphs. NS, not significant. For d, e and h, data are mean ± s.e.m. (d and h) or mean (e).
Overexpression of nmrHas2 mRNA was detected in multiple tissues of nmrHas2 mice (Extended Data Table 1). HABP staining showed a stronger hyaluronan signal in the muscle, kidneys and intestines of both male and female nmrHas2 mice compared with the controls (Fig. 1b–d, Extended Data Fig. 1a–c). Furthermore, analysis using pulse-field gel electrophoresis showed that hyaluronan extracted from the tissues of nmrHas2 mice was more abundant and had a higher molecular mass in the muscle, heart, kidneys and small intestine (Fig. 1c, Extended Data Fig. 1b). Hyaluronan levels in the liver and spleen were very low, which is consistent with these tissues being the sites of hyaluronan breakdown20. Notably, despite the high nmrHas2 mRNA levels in most mouse organs, we observed only a mild increase in hyaluronan, probably due to high hyaluronidase activity in mouse tissues compared with the naked mole-rat2.
nmrHAS2 mice are resistant to both spontaneous and induced cancer
To examine the effect of HMM-HA on lifespan and spontaneous cancer incidence, we set up aging cohorts of 80–90 mice of both genotypes. The majority of mice died from cancer, which is consistent with earlier reports that lymphomas are the common endpoint for aged C57BL/6 mice21nmrHas2 mice showed lower spontaneous cancer incidence, with 57% of nmrHas2 mice dying from cancer compared with 70% of the mice in the control creER group (Fig. 1e). This difference was further amplified for the oldest age group. For mice older than 27 months, cancer incidence was 83% for creER mice and 49% for nmrHas2 mice (Fig. 1e). This phenotype was the same across both sexes (Extended Data Fig. 1d, e).
nmrHas2 mice showed accumulation of HA in the skin (Extended Data Fig. 1f.). To test the resistance of nmrHas2 mice to chemically induced skin tumorigenesis, we treated young mice with DMBA/TPA. Sixteen weeks after TPA treatment, nmrHas2 mice formed significantly fewer papillomas compared with age matched controls for females, males, and two sexes combined (Fig. 1f–h, Extended Data Fig. 1g, h). These results indicate that production of HMM-HA protected mice from both spontaneous and induced cancer.
nmrHas2 mice have increased lifespan
Mice of both genotypes had a similar body weight throughout their life (Fig. 2a). nmrHas2 mice showed an increase of 4.4% in median lifespan and 12.2% in maximum lifespan (Fig. 2b). The lifespan increase was different for each sex. While females showed a more prominent 9% increase in median lifespan (Extended Data Fig. 2a), males showed a more prominent 16% increase in the maximum lifespan (Extended Data Fig. 2b). Furthermore, nmrHas2 mice exhibited a younger biological age, as determined by measuring the epigenetic age in livers of 24 months old mice using HorvathMammalMethylChip4022,23. Epigenetic age was compared to chronological age to quantify age acceleration. The methylation age of creER mice was close to their chronological age, whereas nmrHas2 mice showed approximately −0.2 years of age acceleration in both sexes (Fig. 2c, Extended Data Fig. 2c–e). This result indicates that old nmrHas2 mice have a significantly younger biological age than their chronological age. We also examined methylation levels of the 6,553 CpG sites that were previously shown to undergo methylation changes during ageing24. Our analysis revealed that, of the 6,553 CpG sites, 165 were differentially methylated between nmrHas2 mice and creER mice. Among these sites, 145 sites that gain methylation during ageing showed lower methylation in nmrHas2 mice compared with in the age-matched controls; and 20 CpG sites that lose methylation during ageing showed higher methylation in nmrHas2 mice compared with in the age-matched controls (Extended Data Fig. 2f, g; Supplementary Table 2).
Figure 2. nmrHas2 mice have an extended lifespan and improved healthspan.
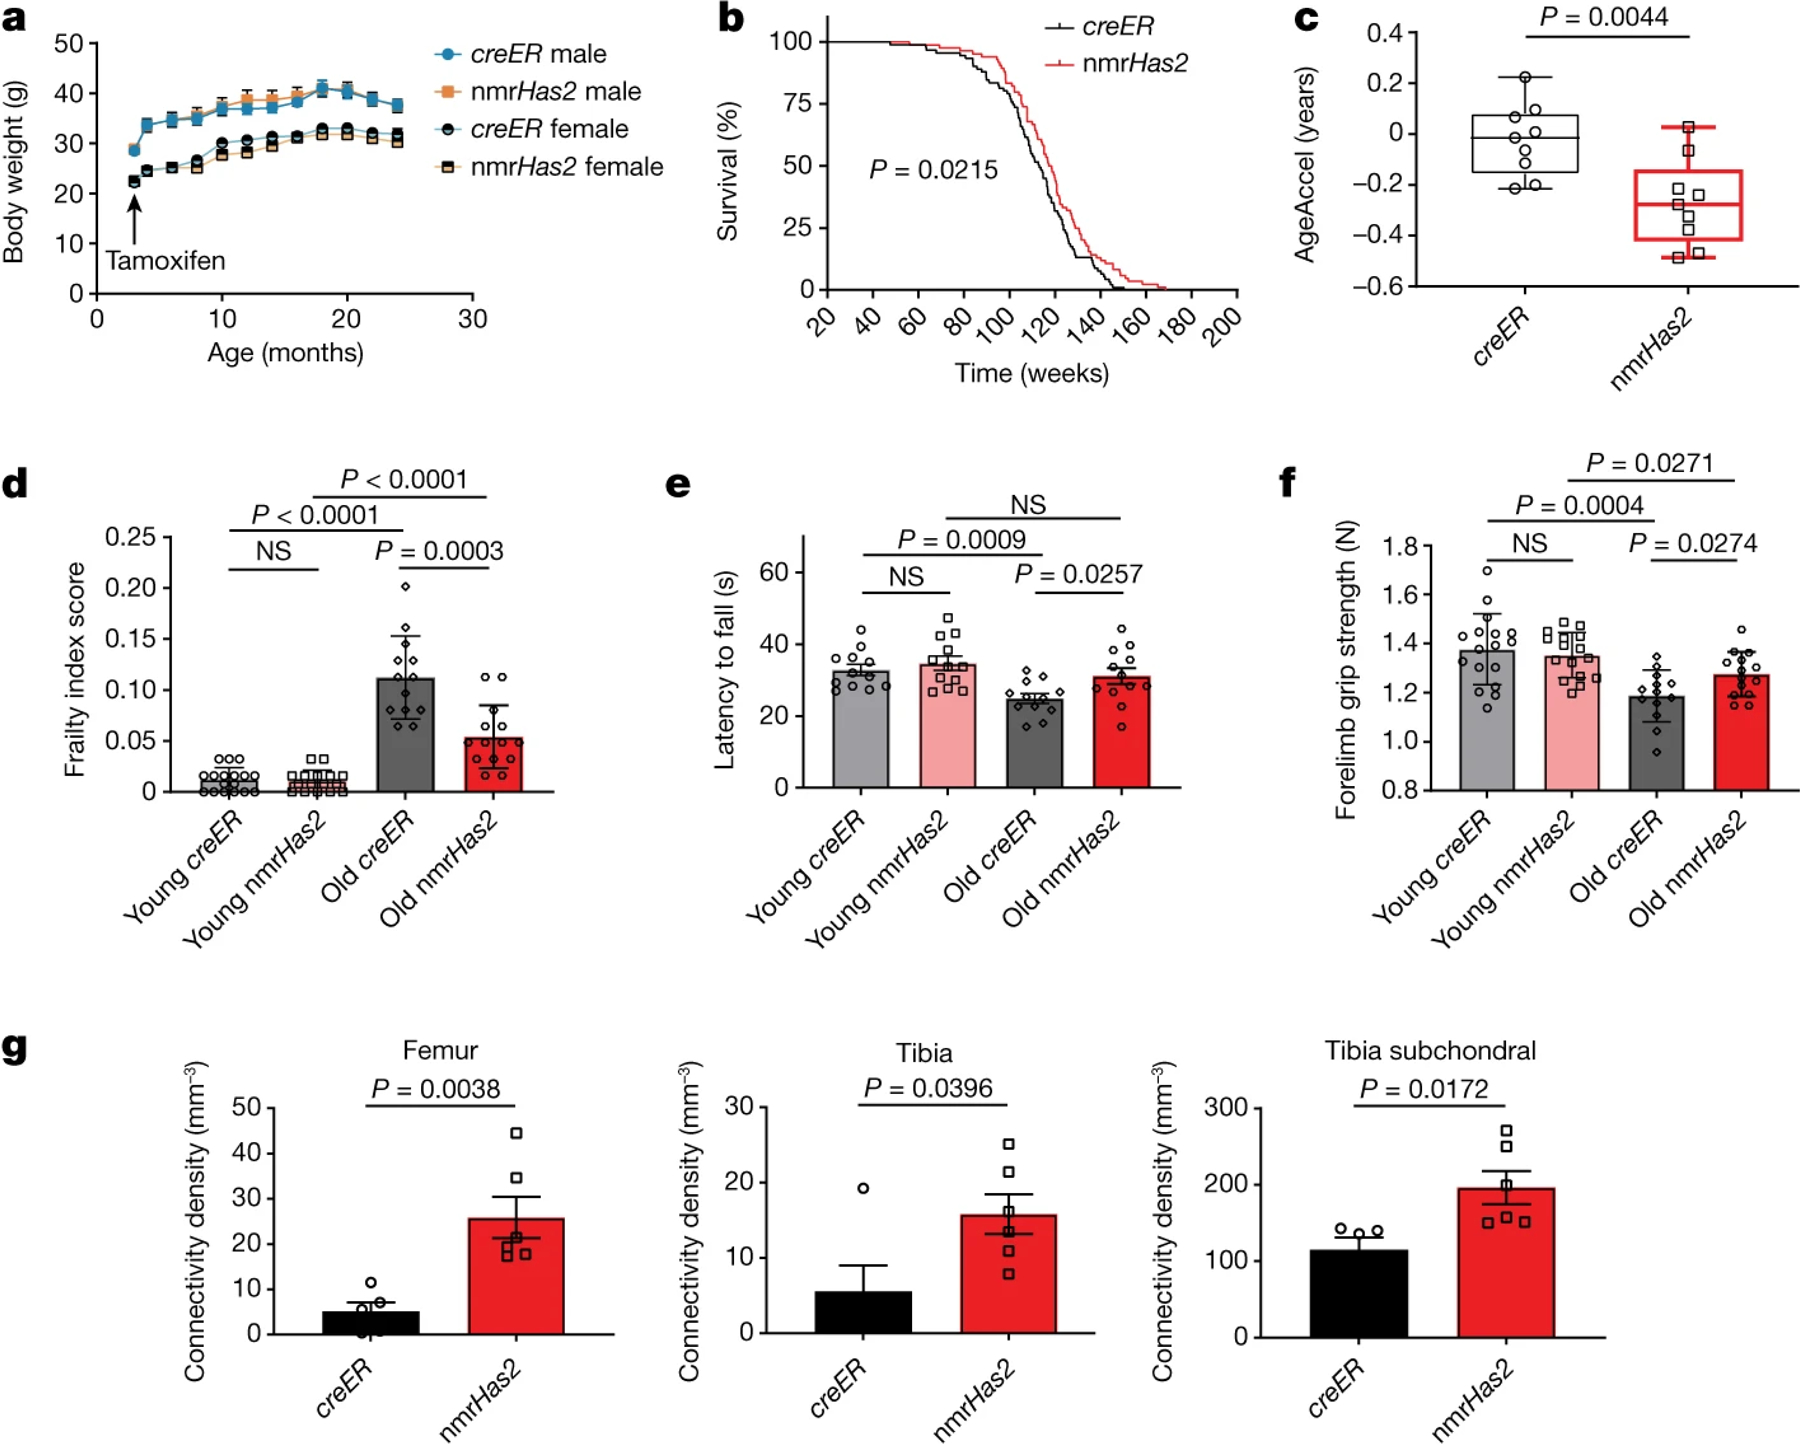
a. Overexpression of nmrHas2 did not affect the body weight of the mice. The body weight of mice was measured before tamoxifen injection, then once every month until the mice reached 24 months of age. n = 10 (creER male and female), n = 9 (nmrHas2 female) and n = 11 (nmrHas2 male) mice.
b. nmrHas2 mice (n = 84) have an extended median and maximum lifespan compared with creER mice (n = 91). Pooled female and male mice. The P value was calculated using a two-tailed log-rank test.
c. Old nmrHas2 mice display a younger biological age. Liver DNA from 24-month-old nmrHas2 (n = 9) and age-matched creER (n = 9) mice was used for the methylation clock assay. The methylation age of each mouse was normalized to its chronological age to calculate AgeAccel. The box plot shows the median (centre line), the first to third quartiles (box limits), and the minimum and maximum values (whiskers). P values were calculated using two-tailed unpaired t-tests.
d. Frailty index scores of creER and nmrHas2 mice at 5 and 24 months of age. Pooled female and male mice. n = 17 (young creER), n = 16 (young nmrHas2), n = 13 (old creER) and n = 14 (old nmrHas2) mice.
e. Rotarod performance of creER and nmrHas2 mice at 5 and 24 months of age. Six female mice and six male mice were used for each group.
f. The forelimb grip strength performance of creER and nmrHas2 mice at 5 and 24 months of age. Pooled female and male mice. n = 17 (young creER), n = 16 (young nmrHas2), n = 13 (old creER) and n = 14 (old nmrHas2) mice.
g. Old female nmrHas2 mice have a higher bone connectivity density. Hindlimb bones from 24-month-old animals were taken for micro-CT scan. n = 5 (creER) and n = 6 (nmrHas2) mice. P values were calculated using two-tailed unpaired t-tests; P values are indicated in the graphs. For a and c–g, data are mean ± s.e.m. The symbols in c–g represent biological replicates. Adjustments were made for multiple comparisons.
nmrHas2 mice have an improved healthspan
To provide a quantitative measure of health, we used a mouse frailty index25, which combined 31 parameters, including body weight, temperature, coat condition, grip strength, mobility, vision and hearing. The frailty index score increased with age for both nmrHas2 and creER mice. However, the frailty index score of old nmrHas2 mice was substantially lower than that of the age-matched control group (Fig. 2d).
Rotarod performance26 was assessed to measure the locomotion and coordination of mice. The latency-to-fall time became significantly shorter for old creER mice compared with the young creER mice. However, old nmrHas2 mice maintained youthful performance (Fig. 2e). The grip strength of both creER and nmrHas2 mice decreased with age but old nmrHas2 mice maintained a better performance compared with the old creER mice (Fig. 2f).
Osteoporosis is an important component of health span in females27, with connectivity density decreasing during aging28. Old nmrHas2 female, but not male, mice showed higher connectivity density in the femur, tibia, and tibia subchondral region than age-matched controls (Fig. 2g, Extended Data Fig. 2h). Cumulatively, our results show that increased levels of HMM-HA in mice improves multiple parameters of healthspan.
Gene expression analysis points to the reduced inflammation in nmrHas2 mice
For most organs, nmrHas2 mice showed fewer transcriptome changes during ageing compared with the creER controls, in both female and male mice, which means that the transcriptome of nmrHas2 mice is less perturbed during ageing (Fig. 3a–d). We next examined whether the transcriptome of nmrHas2 mice shares any common features with transcriptomic changes induced by other pro-longevity interventions such as rapamycin, calorie restriction and growth-hormone receptor knockout. We performed a hierarchical clustering analysis using RNA-sequencing (RNA-seq) data from livers of young and old nmrHas2 mice with expression data published for other interventions29. We built a heatmap based on Pearson correlation coefficients across all datasets (Extended Data Fig. 3a). Notably, the transcriptomes of neither young nor old nmrHas2 mice showed a clear correlation with any transcriptome data derived from the livers of mice subjected to other pro-longevity interventions. This result may suggest that increased levels of HMM-HA generated a new pro-longevity transcriptomic signature (Extended Data Fig. 3a). To test whether the observed outcome is not due to noise generated by using the entire transcriptome data, we calculated the Spearman correlation between the top 400 gene expression changes induced by nmrHas2 expression in old mice and those associated with ageing and established lifespan-extending interventions30. We observed significant positive correlations between the transcriptomic profiles of nmrHas2 mice and the signatures of rapamycin and mouse maximum lifespan affected by longevity interventions (Fig. 3e). On the other hand, the effect of nmrHas2 expression was negatively associated with multiple signatures of ageing and biomarkers of interventions associated with growth hormone deficiency. The observed correlations were further amplified at the level of enriched pathways, estimated using gene set enrichment analysis (GSEA). Thus, at the functional level, nmrHas2 signatures were positively associated with patterns of maximum and median lifespan, caloric restriction and rapamycin, and negatively correlated with all ageing signatures (Extended Data Fig. 3b). The pro-longevity and anti-ageing effects of nmrHas2 expression were driven by significant downregulation of pathways associated with interleukin and interferon signalling, and by upregulation of genes involved in oxidative phosphorylation, respiratory electron transport and mitochondrial translation (Extended Data Fig. 3c, d). Notably, nmrHas2 mice demonstrated stronger downregulation of inflammation and senescence compared with other examined lifespan-extending interventions. Taken together, our results suggest that nmrHas2 expression in mice generates both pro-longevity and anti-ageing transcriptomic changes, some of which are shared with other established interventions while others appear to be unique characteristics of nmrHas2 model.
Figure 3. The transcriptome of nmrHas2 mice undergoes fewer changes during ageing compared with the transcriptome of creER controls.
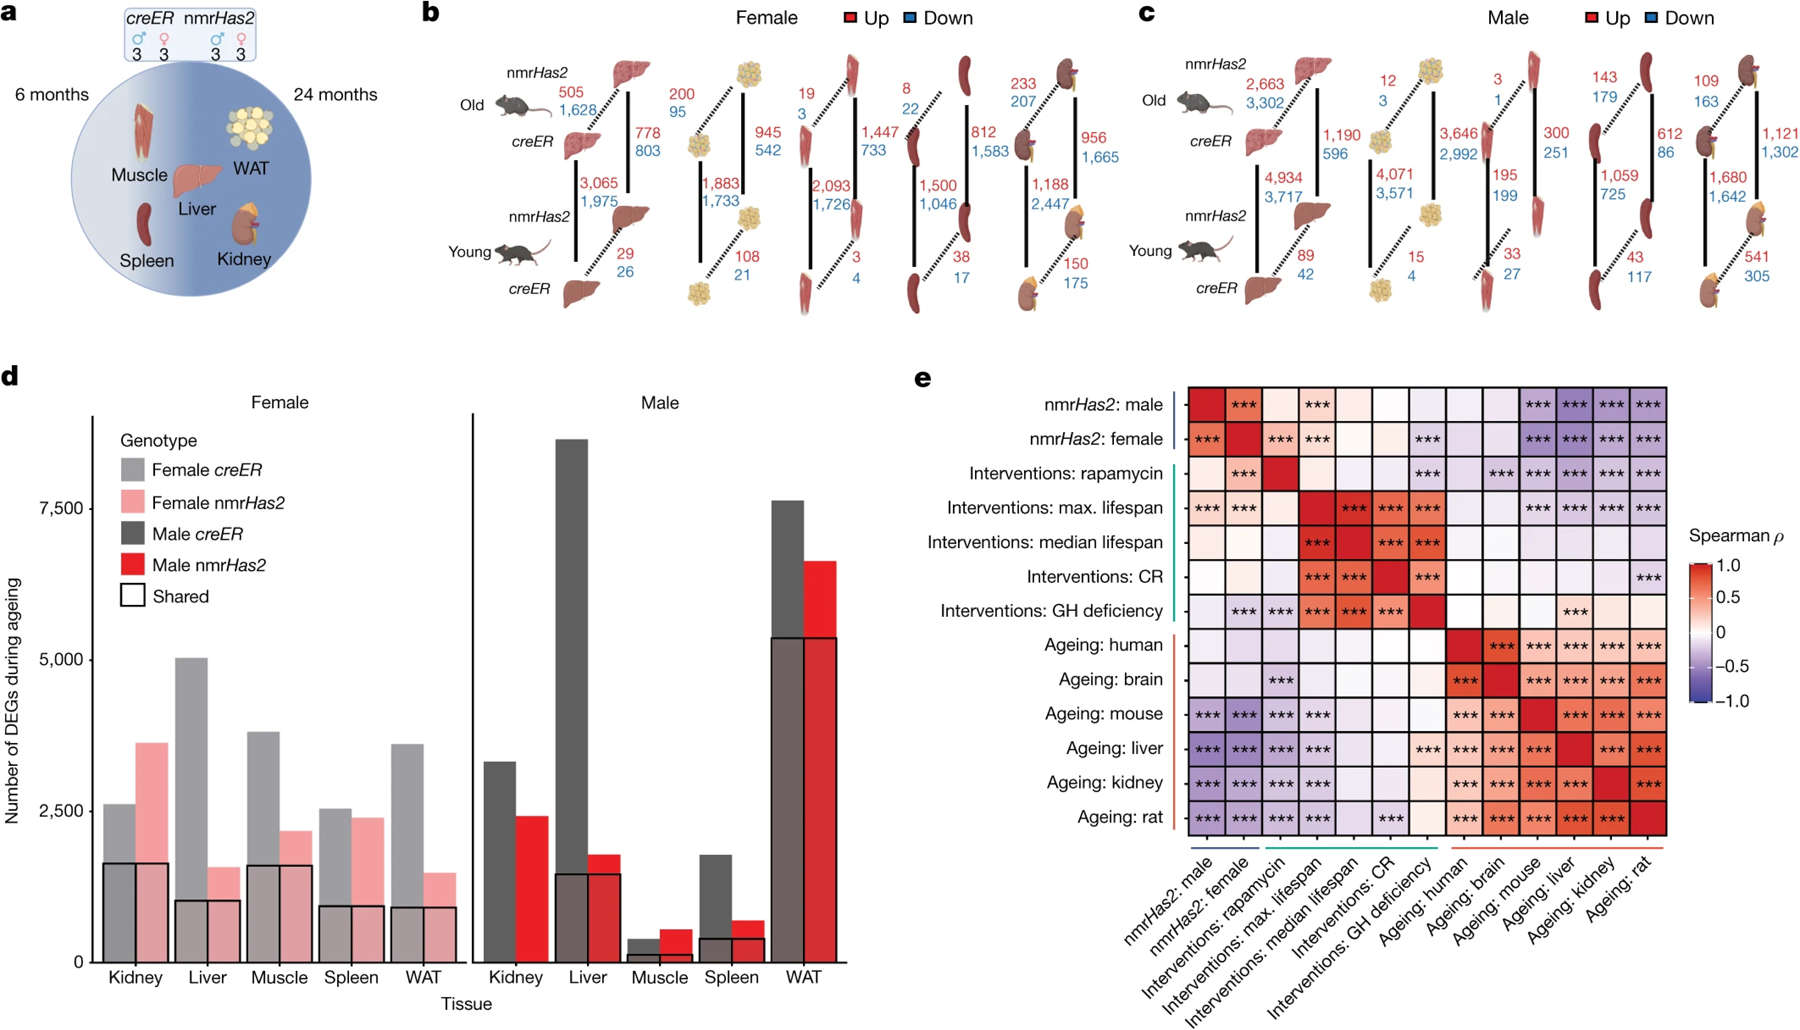
a. The sequencing and sampling strategy. The liver, muscle, white adipose tissue, kidneys and spleen of 6- and 24-month-old creER and nmrHas2 mice were analysed using RNA-seq. Three biological replicates for each sex, age group and genotype were used.
b. Gene expression changes in female mice. Two parameters were compared: genotype (dashed lines) and age (solid lines).
c. Gene expression changes in male mice. Two parameters were compared: genotype (dashed lines) and age (solid lines).
d. The effects of ageing on the transcriptome. The number of genes of which the expression changed with age in either direction; the boxed areas represent genes that underwent changes in both genotypes.
e. The association between nmrHas2 effect on liver gene expression in old mice and signatures of lifespan-extending interventions and mammalian ageing. Signatures of ageing, lifespan-extending interventions and nmrHas2 are shown in red, green and blue, respectively. CR, caloric restriction; GH, growth hormone. Adjusted P values are shown in Supplementary Table 3.
By reanalyzing the published transcriptome data from mice of different ages31, we determined the signature of gene expression changes during aging. The genes upregulated in old mice were defined as the ‘old’ gene set and the genes upregulated in young mice were defined as the ‘young’ gene set. Compared with old creER mice that showed upregulation of old gene sets in the liver, old nmrHas2 mice liver showed upregulation of the young gene set (Fig. 4a). Although some tissues did not exhibit statistical significance, the trend displays high consistency across all of the tissues that we sequenced (Extended Data Fig. 4a–e). This result indicates that tissues of old nmrHas2 mice were shifted towards the young state in both sexes at the transcriptomic level.
Figure 4. nmrHas2 mice display a younger transcriptome signature and reduced inflammation during ageing.
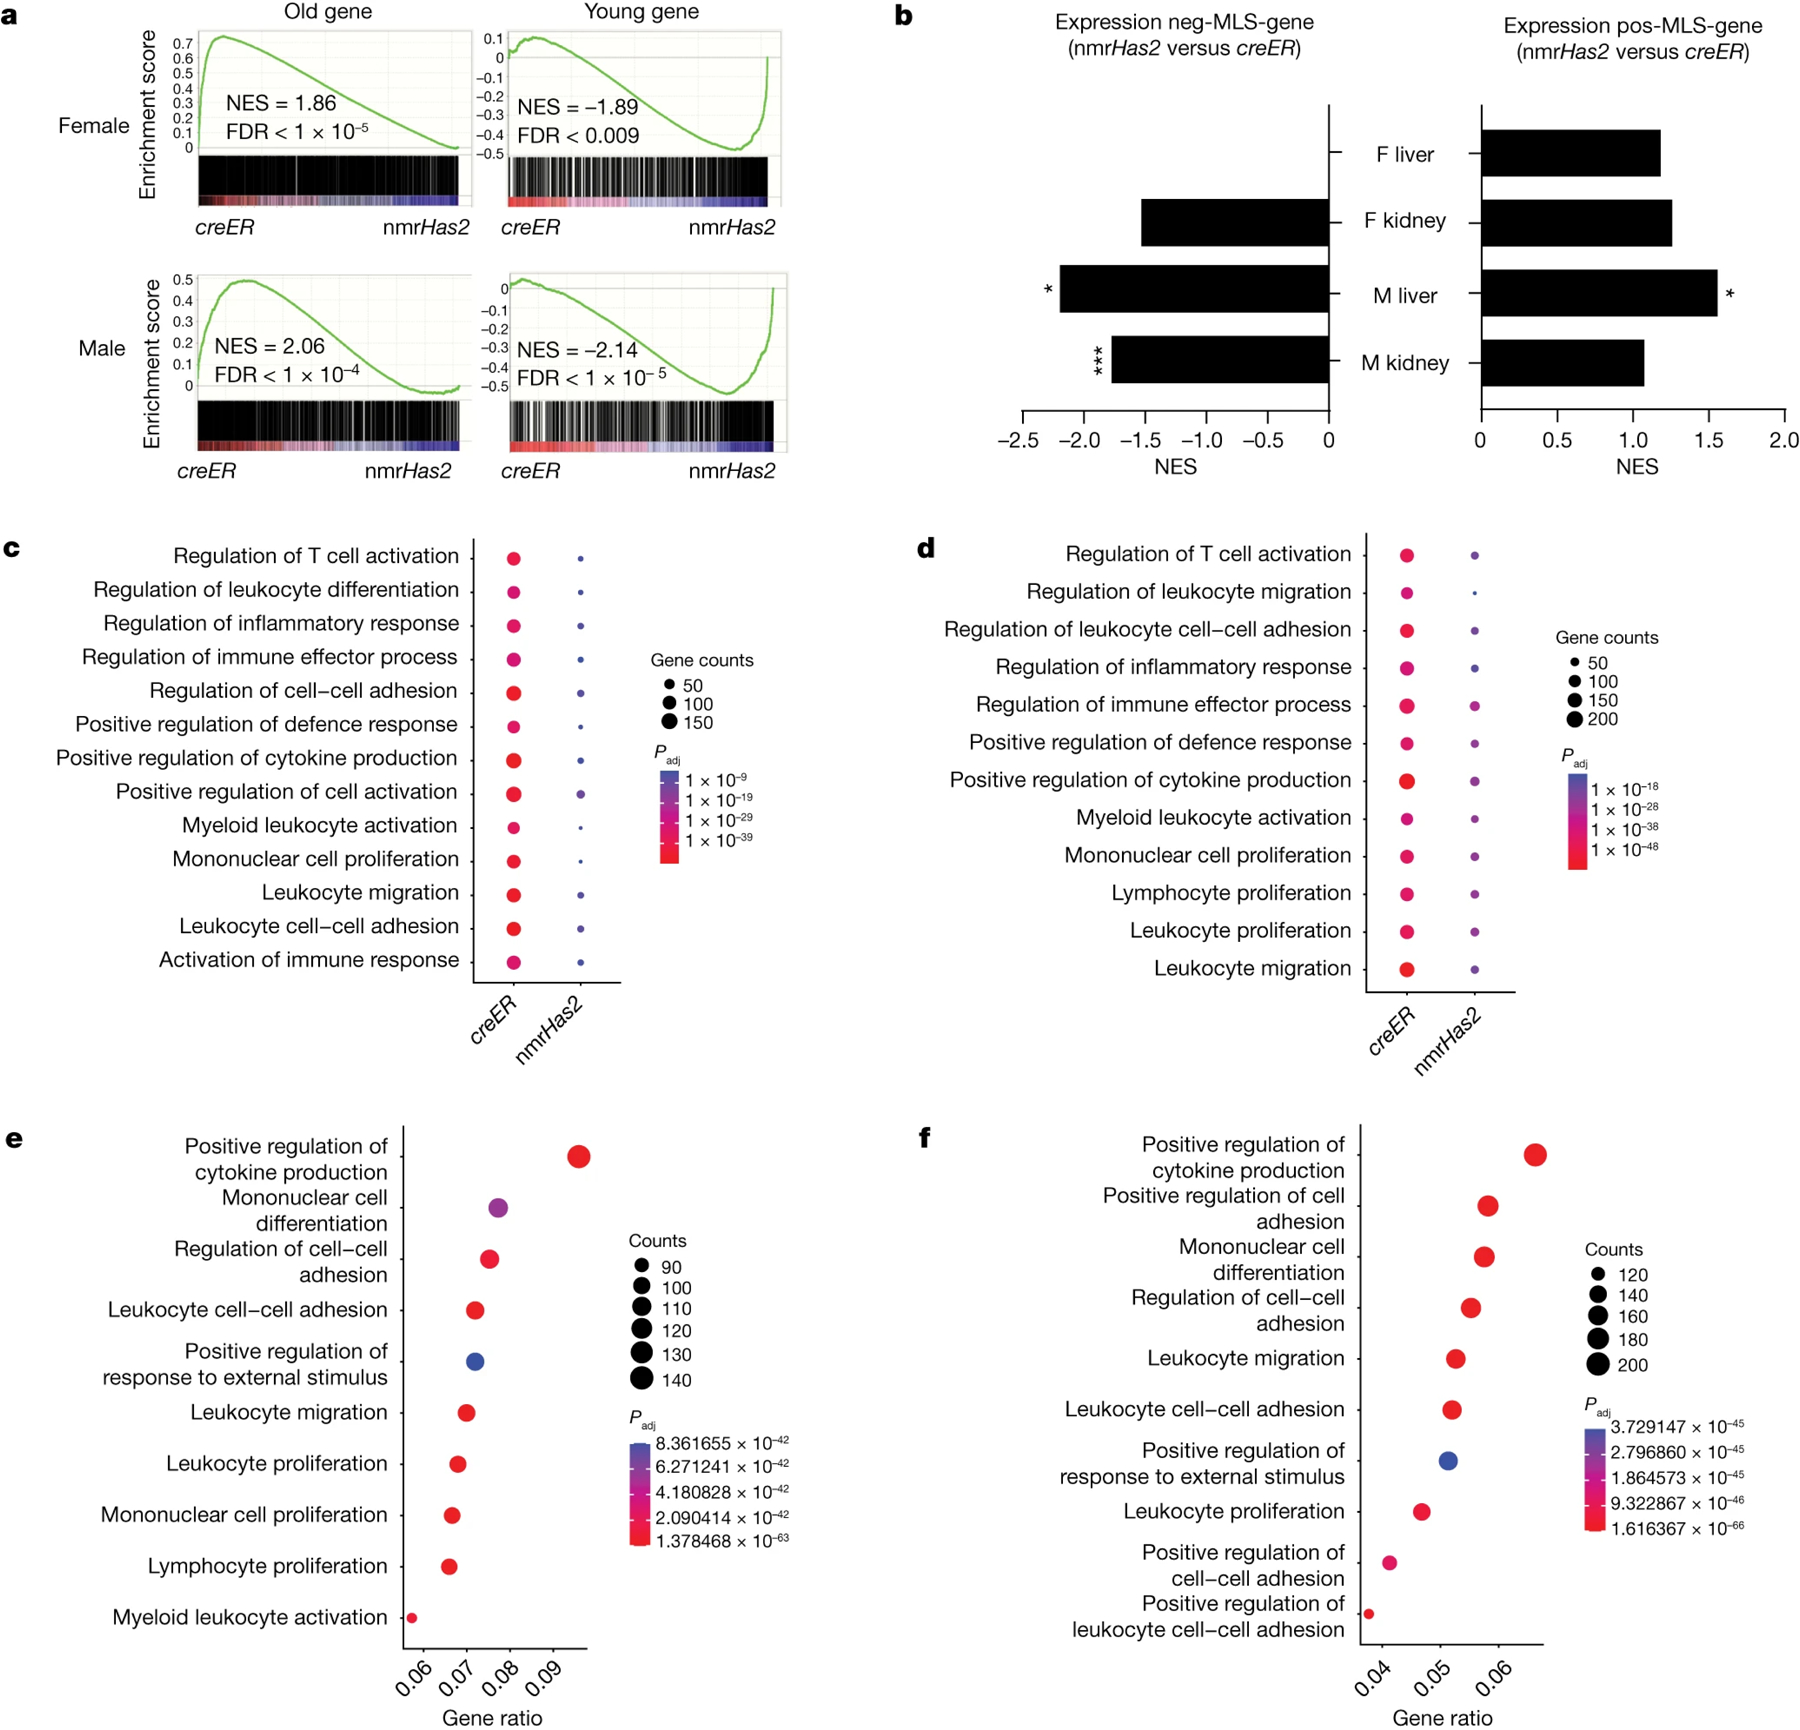
a. GSEA plots showing that the young gene set is upregulated, and the old gene set is downregulated in the liver of old nmrHas2 mice of both sexes. NES, normalized enrichment score.
b. GSEA shows that the pos-MLS gene set was upregulated in the liver and kidneys of nmrHas2 mice. The neg-MLS gene set was downregulated in the liver and kidneys of old nmrHas2 mice. *False-discovery rate (FDR)-adjusted P < 0.05, ***FDR-adjusted P < 1 × 10⁻⁵.
c-d. GO term enrichment analysis shows that the livers of old female (c) and male (d) nmrHas2 mice have fewer inflammation-related pathways upregulated during ageing.
e-f. GO term enrichment analysis shows that inflammation-related pathways are downregulated in the livers of old female (e) and male (f) nmrHas2 mice.
n our previous comparative cross-species study, by analysing the transcriptomes of 26 species, we obtained gene sets of which the expression positively or negatively correlates with maximum lifespan, named the pos-MLS gene set and neg-MLS gene set, respectively32. By using those gene sets for the GSEA, we found that the pos-MLS gene set is upregulated in the livers and kidneys of old nmrHas2 mice of both sexes. By contrast, the neg-MLS gene set was downregulated in the liver and kidneys of old male nmrHas2 mice and in the kidneys of old female nmrHas2 mice (Fig. 4b). This result suggests that the nmrHas2 transgene facilitates the expression of pro-longevity genes (genes that are highly expressed in long-lived species) and represses the expression of genes that are more highly expressed in short-lived species.
By comparing genes of which the expression changed with ageing within each genotype, we found that creER mice have more upregulated genes involved in the inflammatory response in the liver and spleen of both sexes, in the kidneys of male mice and in the white adipose tissue and muscle of female mice (Fig. 4c, d, Extended Data Fig. 5a–h). This result indicates that HMM-HA attenuates age-related inflammation in multiple tissues.
Moreover, we analysed the differentially expressed genes (DEGs) between two genotypes of mice at the same age. Expression of nmrHas2 had very mild effects on the overall transcriptome of young mice, and there were very few DEGs observed between young nmrHas2 and creER mice (Fig. 3b, c). For old mouse organs, we picked the liver that showed most DEGs between nmrHas2 and creER mice for the Gene Ontology (GO) term enrichment analysis. Our results revealed that both female and male nmrHas2 liver showed reduced expression of inflammatory-related genes and higher expression of genes involved in normal liver functions such as nutrient metabolism. This result indicates that the liver of old nmrHas2 mice showed reduced inflammation and better-preserved functions compared with the controls (Fig. 4e, f; Extended Data Fig.5 i, j). Overall, these results demonstrate that nmrHas2 mice display reduced age-related inflammation.
HA reduces inflammation and oxidative stress
An analysis of 36 cytokines and chemokines in mouse plasma showed upregulation of several targets in male mice, but the trend did not reach statistical significance due to high individual variability (Extended Data Fig. 6). In female mice, almost all cytokine and chemokine levels were increased during ageing, which is consistent with the effect of sex hormones on immunity during ageing33. Notably, the majority of pro-inflammatory cytokines and chemokines were lower in old nmrHas2 mice compared with in the age-matched controls (Extended Data Fig. 7). The differences for the pro-inflammatory cytokines IL-12p40, MIP1α and MIP1β, and the chemokine CCL7 reached statistical significance (Fig. 5a). Collectively, the transcriptome and cytokine data show that overexpression of nmrHas2 attenuates inflammaging in mice.
Figure 5. nmrHas2 reduces the pro-inflammatory response in vitro and in vivo and protects cells from oxidative stress.
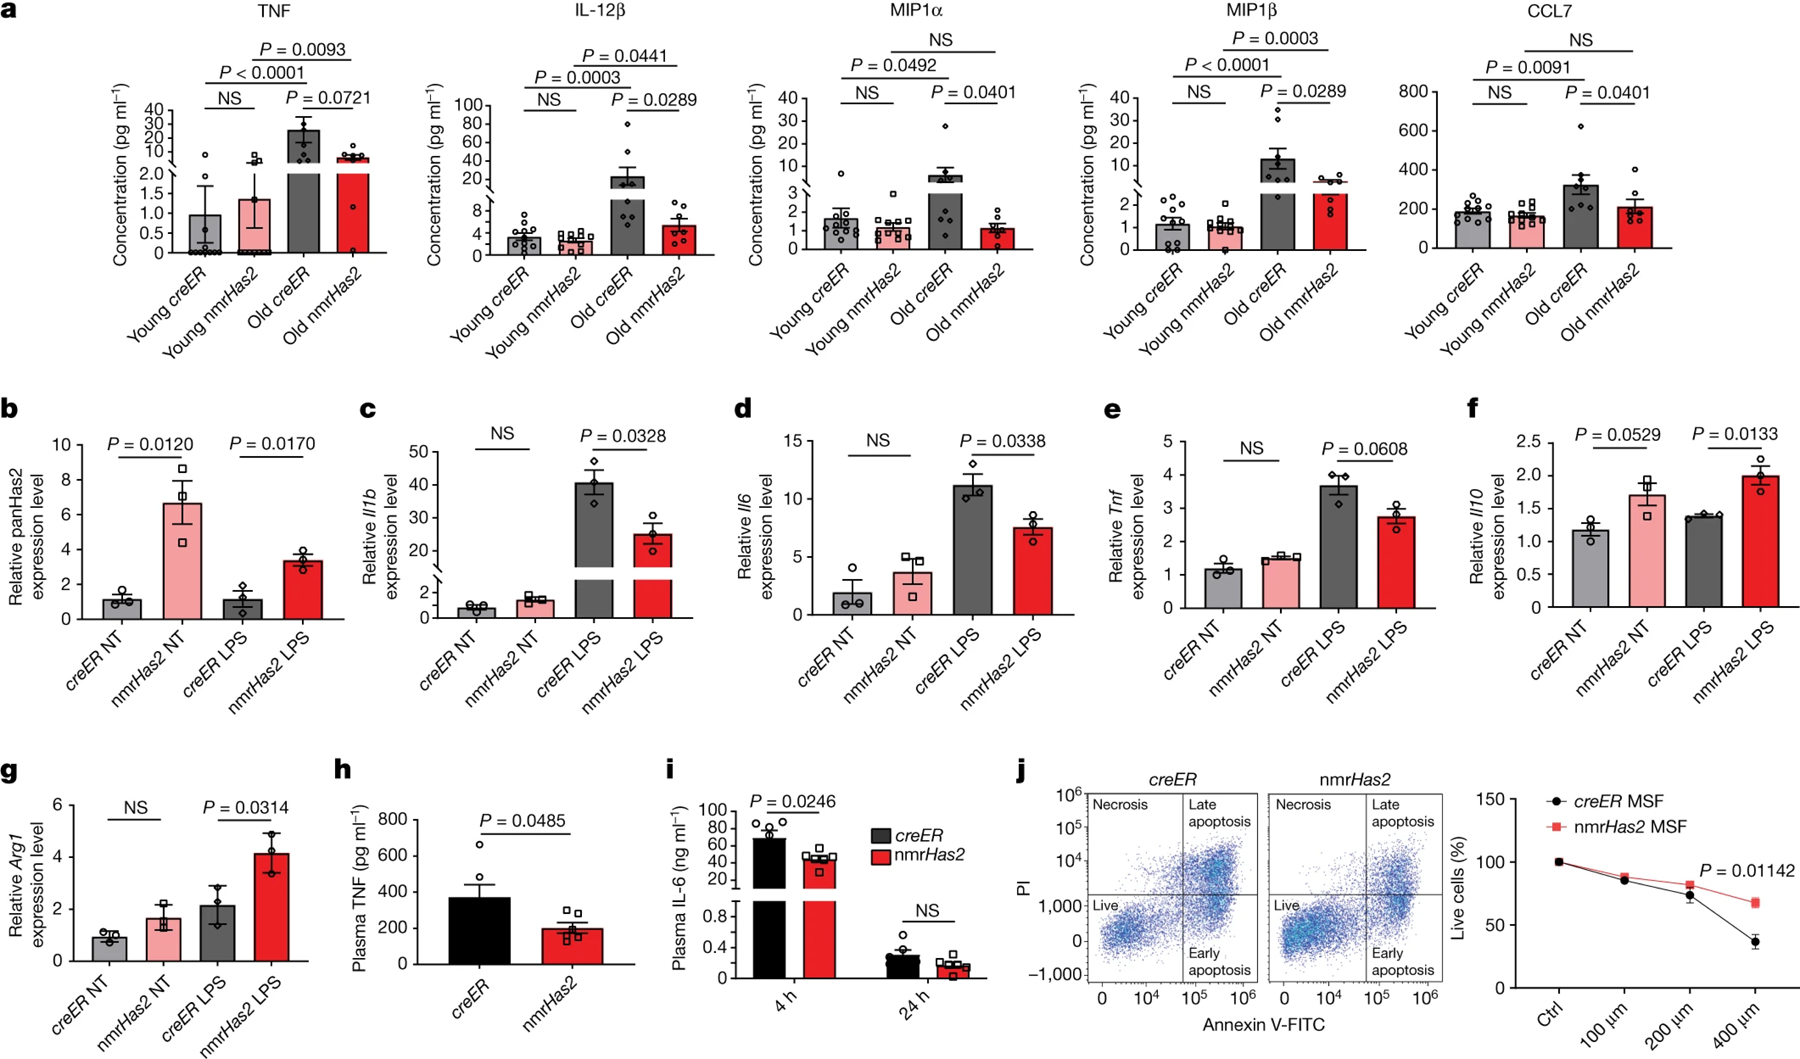
a. Luminex multiplex immunoassay shows that old female nmrHas2 mice have reduced levels of multiple inflammatory cytokines and chemokines. n = 11 (young creER and nmrHas2), n = 8 (old creER) and n = 7 (old nmrHas2) mice.
b. BMDMs from nmrHas2 mice have significantly upregulated Has2 levels. NT, not treated with LPS.
c–e. BMDMs from nmrHas2 mice have lower levels of pro-inflammatory Il1b (c), Il6 (d) and Tnf (e) mRNA after LPS challenge.
f-g. BMDMs from nmrHas2 mice have higher levels of anti-inflammatory Il10 (f) and Arg1 (g) mRNA after LPS challenge.
h-i. nmrHas2 mice have significantly lower plasma TNF (h) and IL-6 (i) levels 4 h after LPS challenge. n = 3 5-month-old male mice.
j. Skin fibroblast cells isolated from nmrHas2 mice are more resistant to H2O2 treatment. Skin fibroblasts were isolated from 5-months old male mice, n=3. MSF, mouse skin fibroblast.
For b–g, BMDMs were isolated from 5-month-old male mice (n = 3). P values were calculated using two-tailed unpaired Mann–Whitney U-tests (a) and two-tailed unpaired t-tests (b–j); P values are indicated in the graphs. For a–j, data are mean ± s.e.m. The symbols in a–i represent biological replicates.
HMM-HA molecules exert anti-inflammatory and immunoregulatory effects34. It was reported that HMM-HA represses classic pro-inflammatory M1 macrophage activation but promotes an anti-inflammatory alternative M2 macrophage activation35. We isolated bone-marrow-derived macrophages (BMDMs) from young creER and nmrHas2 mice and cultured them in vitro. Macrophages from male nmrHas2 mice showed a sixfold increase in panHas2 mRNA expression compared with macrophages from male creER mice (Fig. 5b). To check the activation of macrophages, we treated BMDMs with Escherichia coli lipopolysaccharide (LPS). The level of Has2 decreased after LPS treatment but remained significantly higher for nmrHas2 macrophages isolated from male mice. The level of two major HAases, HYAL1 and HYAL2, also decreased after LPS treatment (Extended data Fig. 8c–f). nmrHas2 macrophages from male mice produced significantly lower levels of pro-inflammatory Il1b and Il6 (Fig. 5c, d) compared with the creER macrophages. Tnf also showed lower levels in nmrHas2 cells but the effect did not reach statistical significance (Fig. 5e). Notably, male nmrHas2 macrophages produced higher levels of anti-inflammatory Il10 and Arg1 (encoding arginase 1) after LPS challenge (Fig. 5f, g). To test whether the anti-inflammatory effect is due to increased HMM-HA rather than to an unknown function of nmrHas2, we generated Raw264.7 macrophage cell lines overexpressing either mouse Has2 or nmrHas2 under the control of the same CAG promoter and challenged them with LPS. Macrophages overexpressing any form of HAS2 exhibited an anti-inflammatory effect similar to that seen in primary macrophages, implying that the anti-inflammatory effect arose from the production of HMM-HA (Extended data Fig. 8b).
Macrophages from female nmrHas2 mice had a lower HAS2 level compared with macrophages from nmrHas2 male mice. After treatment with LPS, nmrHas2 levels in female nmrHas2 macrophages dropped to the same level as that in female creER macrophages (Extended Data Fig. 8a). As a consequence, female mice did not show expression differences in cytokines after LPS challenge (data not shown). LPS stimulation triggered similar HAS2 and hyaluronidase (HAase) changes in both BMDMs and macrophage cell lines (Extended Data Fig. 8g–i). The elevation of HA levels after LPS challenge could be attributed to the decline in hyaluronidase (HYAL) expression. Moreover, the LPS-treated medium derived from HAS2-overexpressing macrophages exhibited a substantial accumulation of HMM-HA (Extended Data Fig. 8j, k). As a consequence, the accumulation of HMM-HA produced by HAS2 during macrophage activation probably accounts for the anti-inflammatory effects.
To test this effect in vivo, young mice were injected intraperitoneally with a low dose of LPS. Male mice had a stronger response compared with female mice as evidenced by the higher level of plasma TNF 4 h after the treatment (Fig. 5h, Extended Data Fig. 9a). Consistent with the in vitro results, both male and female nmrHas2 mice showed reduced plasma TNF levels 4 h after LPS injection (Fig. 5h, Extended Data Fig. 9a). Female nmrHas2 mice had lower levels of plasma TNF 24 h after the injection (Extended Data Fig. 9a). Moreover, both male and female nmrHas2 mice produced less IL-6 in the plasma 4 h after LPS treatment (Fig. 5i, Extended Data Fig. 9b). We observed reduced inflammation in multiple tissues of female nmrHas2 mice 24 h after injection. The liver, spleen and kidneys from female nmrHas2 mice showed significantly lower pro-inflammatory Il1b and Tnf mRNA levels, but similar Il6 mRNA levels (Extended Data Fig. 9c–e). These results indicate that HMM-HA suppresses the pro-inflammatory response of nmrHas2 mice both in vitro and in vivo, contributing to reduced inflammation in old nmrHas2 mice.
HMM-HA protects cells from oxidative stress13. Primary fibroblasts from nmrHas2 mice produced more abundant hyaluronan (Extended Data Fig. 9f, g). Consistently, nmrHas2 cells showed higher survival after H2O2 treatment indicating the protective effect of HMM-HA against oxidative stress (Fig. 5j, Extended Data Fig. 9h). To test that the protective effect is conferred by HMM-HA and not by another function of nmrHas2 gene, we generated a mouse-Has2-overexpressing fibroblast cell line. Overexpression of mouse Has2 also resulted in an increased production of HMM-HA, similar to nmrHas2, and also exhibited a similar protective effect against oxidative stress (Extended Data Fig. 10a–c). As oxidative stress is linked to inflammation, we hypothesize that there is an additional pathway by which HMM-HA counteracts inflammation through reducing oxidative stress.
HMM-HA preserves intestinal health during ageing
Disruption of the gut barrier in older individuals contributes to chronic inflammation during ageing and promotes age-related diseases36,37. We compared the gut barrier function of nmrHas2 and control mice. The gut permeability increased with age in creER mice as measured by the gut to blood transfer of FITC–dextran signal. Notably, gut permeability remained unchanged between the old and young nmrHas2 mice (Fig. 6a). Transcriptome analysis of the small intestine from young and old mice showed that the nmrHas2 mouse transcriptome is shifted towards the younger state (Fig. 6b), with reduced inflammation during ageing in nmrHas2 mice of both sexes (Fig. 6c,d).
Figure 6. nmrHas2 mice are protected from age-related loss of gut barrier function.
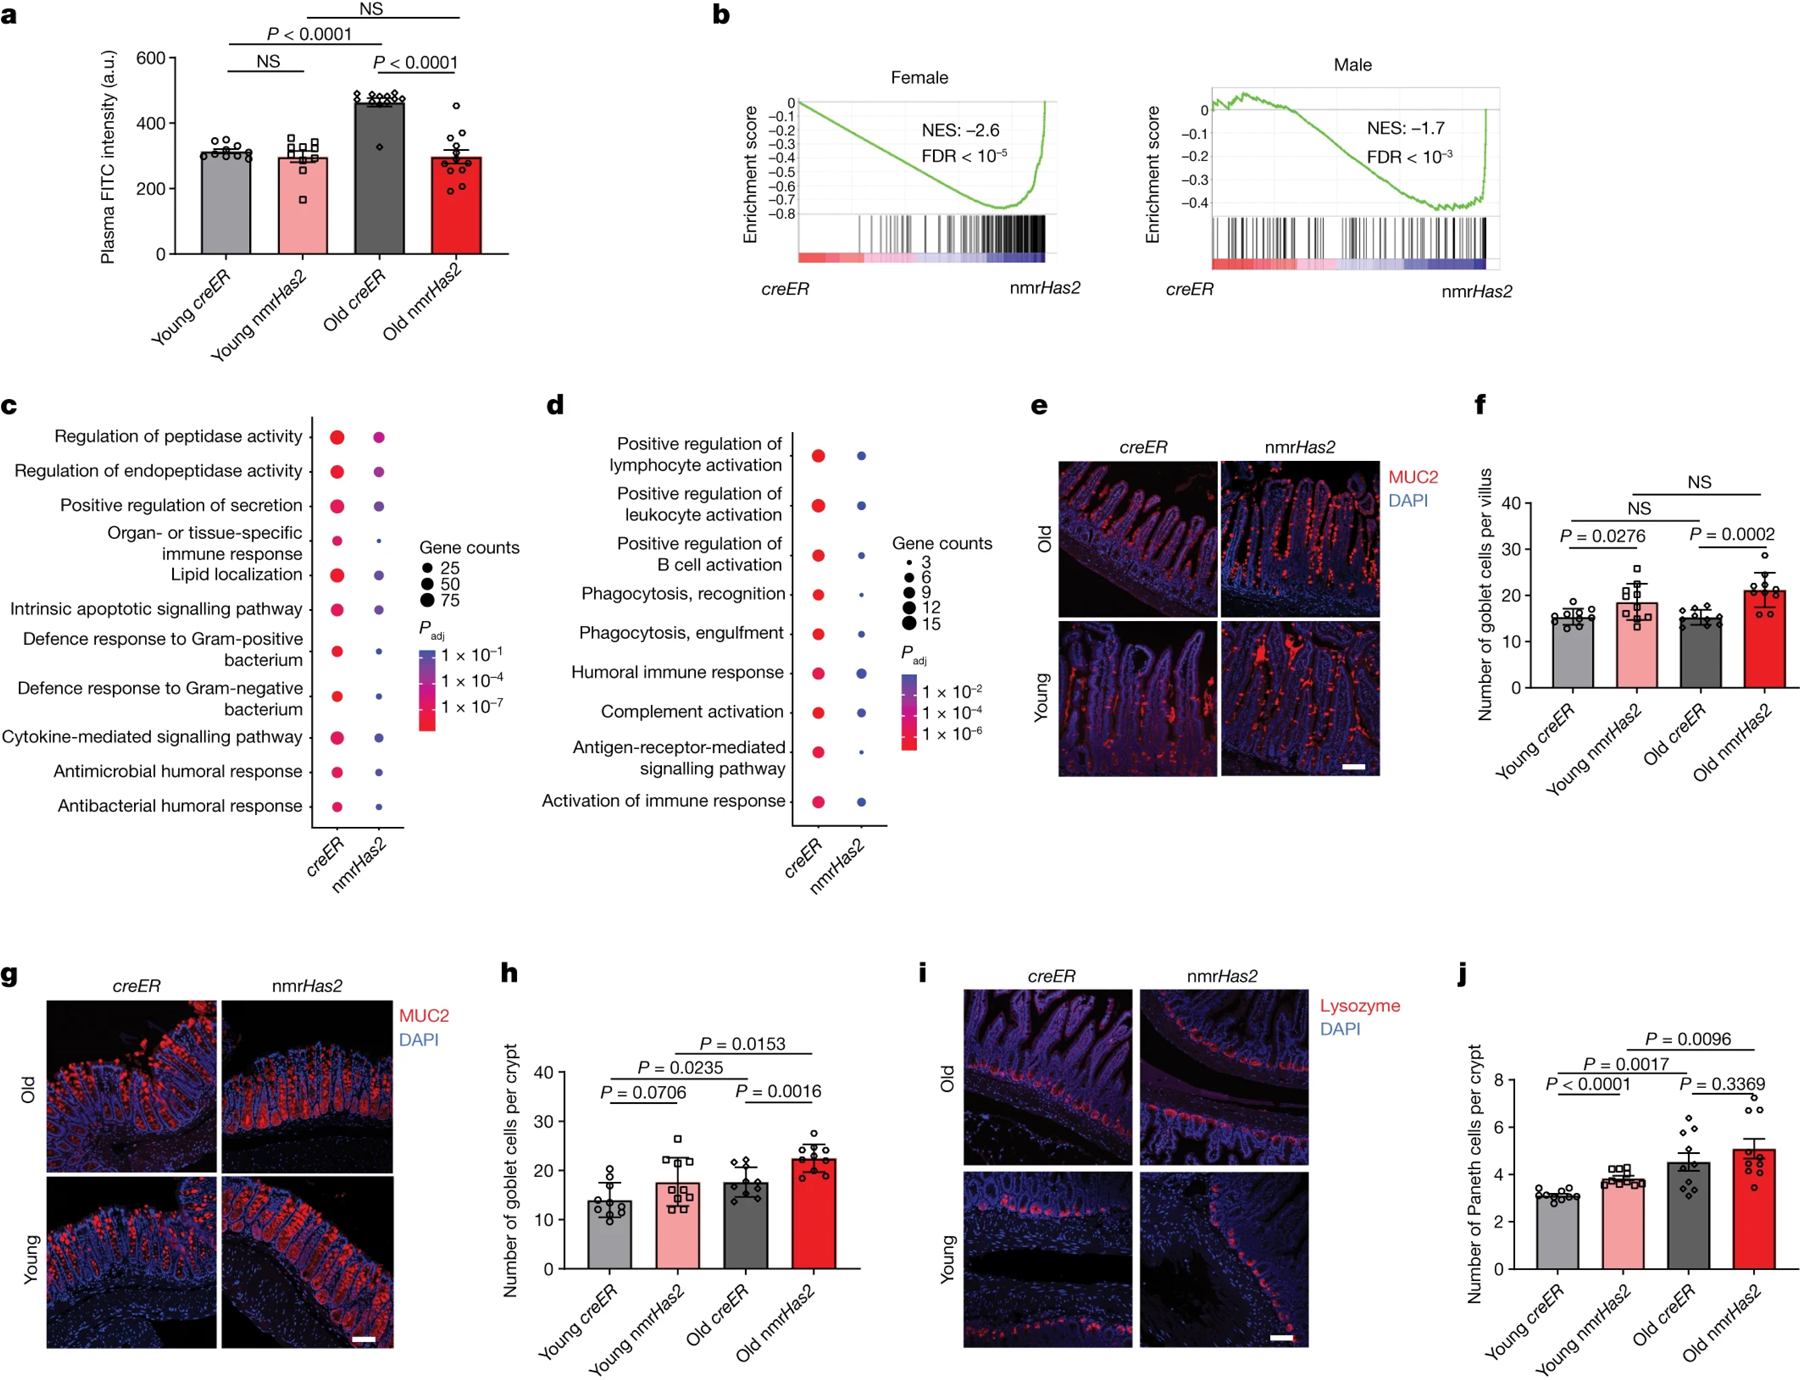
a. nmrHas2 mice have a less leaky gut compared with the age-matched controls. Pooled female and male mice. n = 10 (young creER and nmrHas2) and n = 12 (old creER and old nmrHas2) mice. a.u., arbitrary units.
b. GSEA shows that old nmrHas2 mice have a younger intestine at the transcriptome level for both sexes.
c, d. GO term analysis shows that small intestine of old nmrHas2 mice has fewer inflammatory-related pathways upregulated during aging for both female (c) and male (d) mice.
e. Representative pictures of Goblet cell staining in the small intestine of nmrHas2 and creER mice. Scale bar, 50 μm.
f. Quantification of goblet cells in the small intestine of 7- and 24-months old mice (shown in e). Pooled females and males (n=10).
g. Representative pictures of Goblet cell staining in the distal colon of nmrHas2 and creER mice. Scale bar, 50 μm.
h. Goblet cell counts in the distal colon of 7- and 24-month-old mice (shown in g). Pooled female and male mice (n = 10).
i. Representative pictures of Paneth cell staining in the small intestine of nmrHas2 and creER mice. Scale bar, 50 μm.
j. Paneth cells counts in the small intestine of 7- and 24-months old mice. Pooled females and males (n=10).
For a, f, h and j, P values were calculated using two-tailed unpaired t-tests; P values are indicated in the graphs. For a, f, h and j, data are mean ± s.e.m. The symbols represent biological replicates. Adjustments were made for multiple comparisons.
The intestinal epithelium contributes to the maintenance of intestinal barrier function. Loss of functional epithelial cells leads to a leaky gut38. The mucus layer secreted by goblet cells provides a physical barrier preventing interactions between gut bacteria and intestinal epithelial cells. Notably, both young and old nmrHas2 mice had more goblet cells in their small intestine and colon compared with the age-matched creER control mice (Fig. 6e–h). Paneth cells secrete antibacterial peptides, which provide a chemical barrier in the small intestine39. Paneth cell number increased with age in both nmrHas2 and creER mice, which is believed to be an adaptive response to age-associated gut dysbiosis40. Interestingly, young nmrHas2 mice had more Paneth cells compared with the young control mice and displayed a lower relative increase in the Paneth cell number with age (Fig. 6i, j). he smaller age-related increase in the Paneth cell number in nmrHas2 mice may be due to improved intestinal health.
Intestinal stem cells (ISCs) located in the crypts give rise to the goblet cells, Paneth cells and absorptive enterocytes. The loss of functional ISCs during ageing is an important contributor to age-associated gut dysbiosis41. nmrHas2 and control mice had similar numbers of ISCs in young age and old age (Fig. 7a, b). However, we observed higher expression of WNT- and Notch-pathway-related genes in the intestines of old nmrHas2 mice, suggesting better stem cell maintenance (Extended Data Fig. 11a). Consistent with this, crypts from old creER mice formed far fewer organoids compared with the crypts from young creER and nmrHas2 mice. Notably, the crypts isolated from nmrHas2 mice showed strong expression of Has2 (Fig. 7c), and the ability of those crypts to form organoids did not decrease with age (Fig. 7d, e). To test whether the improved stemness of ISCs in nmrHas2 mice was due to hyaluronan, we added HMM-HA or LMM-HA into the Matrigel used to culture organoids. Supplying HMM-HA was sufficient to reactivate ISCs from old creER mice and resulted in a higher number of organoids (Fig. 7e, f). This result indicates that HMM-HA produced by nmrHas2 helps to maintain the stemness of ISCs during ageing.
Figure 7. HMM-HA improves the maintenance of ISCs during ageing.
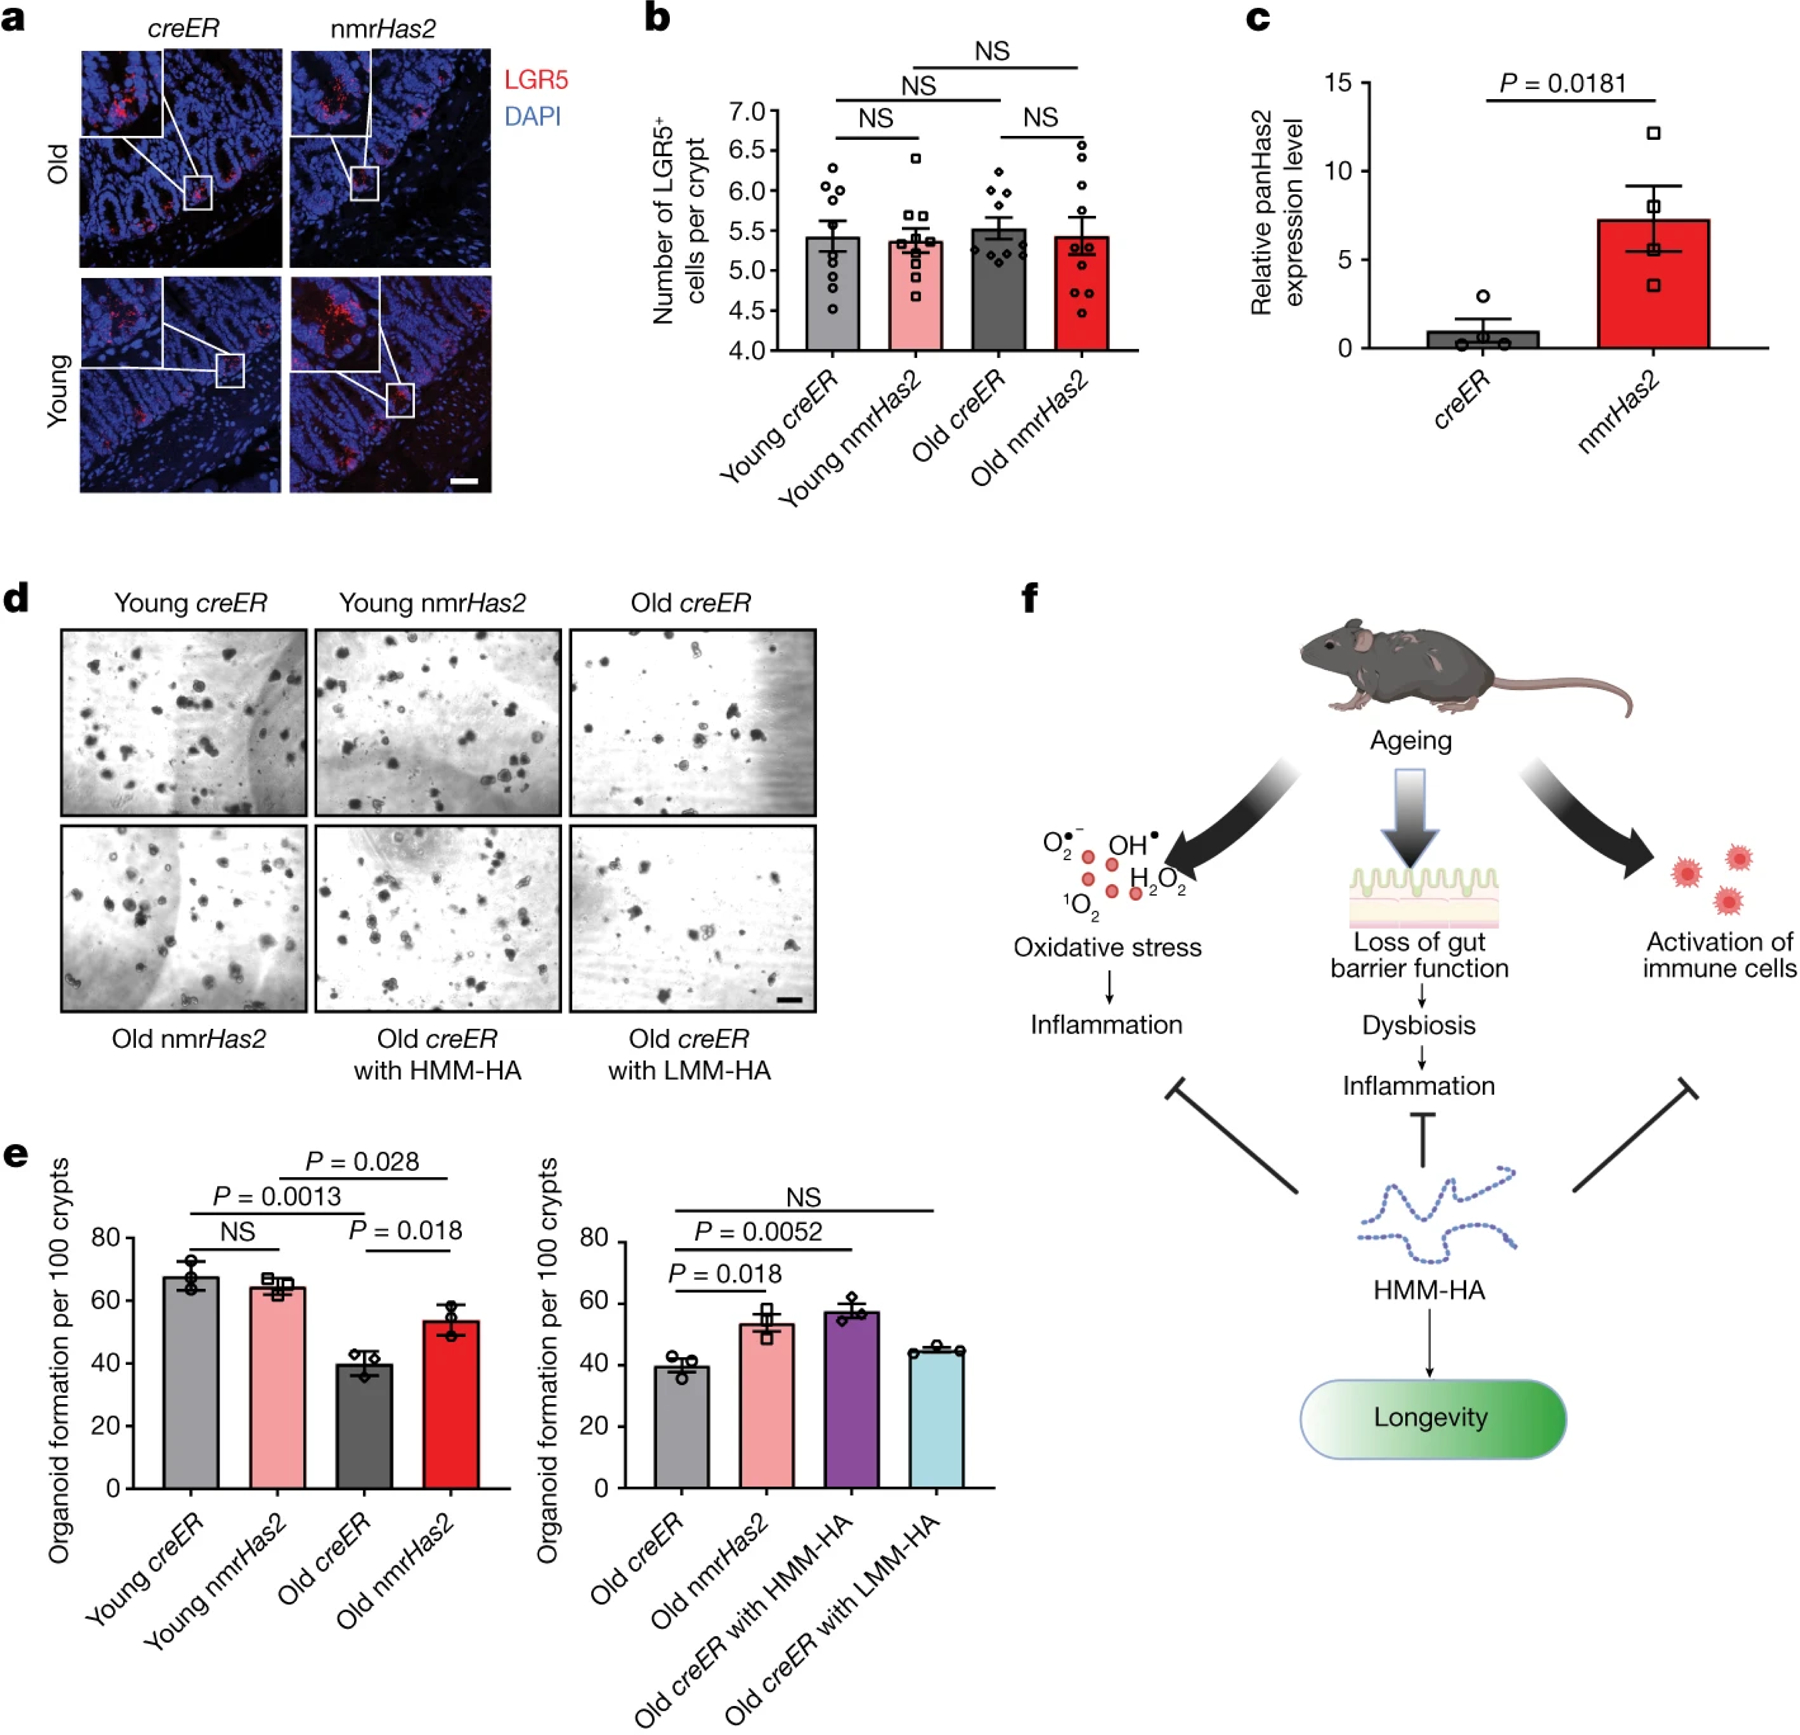
a. Representative pictures of LGR5 in situ hybridization in the small intestine of young and old nmrHas2 and creER mice. Scale bar, 50 μm.
b. Lgr5+ intestinal stem cell counts in the small intestines of 7- and 24-months old mice. Pooled females and males (n=10).
c. Intestinal crypts isolated from nmrHas2 mice have significantly upregulated Has2 levels. Intestinal crypts were isolated from 5-months old mice (n=4).
d. Intestinal crypts from old nmrHas2 mice form more intestinal organoids in vitro n=3. Addition of HMM-HA, but not LMM-HA, to creER crypts resulted in a greater number of organoids. Scale bar, 100 μm.
e. Organoid quantification in 7- and 24-months old mice (n=3).
f. Model for the anti-ageing effects of HMM-HA. HMM-HA produced by overexpression of the nmrHas2 gene protects tissues from oxidative stress, improves maintenance of ISCs to provide a better gut barrier function during ageing and reduces the production of pro-inflammatory molecules by immune cells. The beneficial effects of HMM-HA further contribute to the longevity and healthspan of the mice. For b, c and e, P values were calculated using two-tailed unpaired t-tests; P values are indicated in the graphs. For b, c and e, data are mean ± s.e.m. The symbols represent biological replicates. Adjustments were made for multiple comparisons.
The gut microbiome undergoes changes during aging and gut dysbiosis can further contribute to systemic inflammation42. We compared the microbial composition between 7- and 24-month-old nmrHas2 and control mice. At the phylum level, the operational taxonomic units (OTUs) showed that both young and old nmrHas2 mice had increased Bacteroidetes and decreased Firmicutes levels compared with the age-matched control mice. However, only the old groups reached statistical significance (Extended Data Fig. 11b, c). A decrease in the ratio of Bacteroidetes to Firmicutes was shown to correlate with gut dysbiosis in hypertension and metabolic disorders43,44. At the family level, Deferribacteraceae, Streptococcaceae and Lachnospiraceae, which are known to positively correlate with inflammation, showed higher abundance in old creER mice. Muribaculaceae which was linked to longevity of Spalax leucodon45, was found at higher levels in old nmrHas2 mice (Extended Data Fig. 11d, e). Collectively, our results indicate that old nmrHas2 mice have improved intestinal health, contributing to reduced age-related inflammation.
Discussion
Our results demonstrate that HMM-HA produced by the nmrHas2 gene extends the lifespan and improves the healthspan of mice by ameliorating age-related inflammation. This is achieved by directly suppressing the production of pro-inflammatory factors by immune cells, and by promoting stemness of ISCs preventing age-related decline in the intestinal barrier (Fig. 7f). These findings demonstrate that evolutionary adaptations found in long-lived species such as the naked mole-rat can be exported and adapted to benefit human health. Moreover, these findings underscore the use of HMM-HA for treating age-related inflammation in the intestine and other tissues (further discussion is provided in the Supplementary Discussion).
Methods
Animal husbandry
All animal experiments were approved and performed in accordance with guidelines set forth by the University of Rochester Committee on Animal Resources with protocol number 2017-033 (mouse). Mice were group housed in IVC cages (up to 5 animals/cage) in a specific pathogen-free environment and fed standard chow diet (Altromin 1324; total pathogen free, irradiated with 25 kGy) and water ad libitum. Animal rooms were maintained at 21–24 °C and 35–75% relative humidity, with 12/12 h (6 a.m. to 6 p.m.) dark–light cycle. Cages were routinely replaced every 10–14 days.
Mice and lifespan study
C57BL/6 mice were from Charles River Labs, R26-CreERT2 mice were from the JAX. To generate nmrHAS2 conditional transgenic mice, nmrHAS2 coding sequence was subcloned into the pCALNL-GFP plasmid (Addgene plasmid # 13770) to replace GFP. Transgenic mice were made by UC-Irvine Transgenic Mouse Facility. nmrHAS2 and control CreER mice were obtained by crossing mice heterozygous for nmrHAS2 gene with homozygous R26-CreERT2 mice. At the age of 1 month, progenies were separated by sex, ear tagged, and distal tail (~2 mm) was cut for genotyping determination. All mice received 80mg/kg tamoxifen at 3 months of age for 5 consecutive days. CreER and nmrHAS2 mice were housed in the same cage for all experiments. None of the animals entered into the aging study were allowed to breed. Mice were inspected daily for health issues, and any death was recorded. Animals showing significant signs of morbidity, based on the AAALAC guidelines, were euthanized for humane reasons and were used for lifespan analysis since they were deemed to live to their full lifespan. No mice were censored from analysis. Lifespan was analyzed by Kaplan–Meier survival curves, and p-values were calculated by log-rank test using Graphpad prism.
Necropsy
Cages were inspected every night. Dead animals were removed from cages, opened, and examined macroscopically by a trained person. A fraction of animals could not be examined because they were too decomposed or disturbed by other animals. Organs were moved, turned, or lifted with forceps for the examination but were not removed. All visible tumors, as well as any other observations were noted.
Tissue and plasma collection
Animals were brought to the laboratory in their holding cages and euthanized one by one for dissection. Mice were euthanized by isofluorane anesthesia followed by cervical dislocation. The dissection was performed as rapidly as possible following euthanasia by several trained staff members working in concert on one mouse. Tissue samples were either rapidly frozen in liquid nitrogen (for HA amount and MW determination, and RNA sequencing) or fixed in 4% formalin (for histology). Blood was collected by cardiac puncture into EDTA-coated tubes, centrifuged, and the plasma was aliquoted and rapidly frozen in liquid nitrogen. All frozen samples were stored at −80℃.
HA preparation
For purifying HA from tissues, 200mg of pulverized tissue from 5 months old mice were mixed with proteinase K solution (final concentrations of 1 mM Tris-Cl pH 8.0, 2.5 mM EDTA, 10 mM NaCl, 0.05% SDS, 2 mg/ml proteinase K), and incubated at 55 °C overnight followed by saturated phenol-chloroform-isoamyl alcohol (Sigma) extraction. HA was precipitated with isopropanol and centrifugation (12,000 × g for 15 min) then wash with 70% ethanol (12,000g 10min) and dissolved in 600ul 10mM Tris buffer at PH 8 overnight at RT. The purified HA was digested with SuperNuclease (final concentration of 50U/ml, Lucerna-chem) overnight at 37℃ to eliminate nucleic acid contamination. HA was extracted by saturated phenol-chloroform-isoamyl alcohol (Sigma), precipitated by isopropanol, and washed with 70% ethanol again. The pellet was dissolved in 30ul 10mM Tris buffer at PH 8 overnight at RT.
For HA purification from media, conditioned media were first mixed with proteinase K solution (final concentrations of 1 mM Tris-Cl pH 8.0, 2.5 mM EDTA, 10 mM NaCl, 0.05% SDS, 1 mg/ml proteinase K) and incubated at 55 °C for 4 h. Following protein digestion, media were extracted with saturated phenol-chloroform-isoamyl alcohol (Sigma). HA was precipitated with ethanol and centrifugation (4,000 × g for 45 min). HA pellet was dissolved in PBS and then extracted with 1/100 volume of Triton-X114. After Triton-X114 extraction, HA was precipitated again with ethanol. Finally, HA pellet was washed with 70% ethanol and dissolved in PBS.
Pulse-field gel electrophoresis
Purified HA was mixed with sucrose solution (final concentration of 333 mM) and loaded to a 0.4% SeaKem Gold agarose gel (Lonza). HA-Ladders (Hyalose) were run alongside the samples. Samples were run 16 h at 9 °C at 4 V with a 1–10 running ratio in TBE buffer using CHEF-DRII system (Bio-Rad). After the run, the gel was stained with 0.005% (w/v) Stains-All (Santa Cruz) in 50% ethanol overnight. Then the gel was washed twice with 10% ethanol for 12h, exposed to light to decrease background, and photographed with ChemiDoc Imaging System (Bio-Rad).
HA ELISA
Hyaluronan concentration in the media was quantified using the hyaluronan ELISA kit (R&D systems) following the manufacturer’s instructions.
Rotarod performance
Motor performance was assessed using the protocol described before46. Briefly, gross motor control was measured using the rotarod (IITC Life Science, CA, USA). For this test, each mouse was placed on a cylindrical dowel (95.525 mm in diameter) raised ~30 cm above the floor of a landing platform. Mice were placed on the dowels for 3 min to allow them to acclimatize to the test apparatus. Once initiated the cylindrical dowels began rotating and accelerated from 5 rpm to a final speed of 20 rpm over 60 s. During this time, mice were required to walk in a forward direction on the rotating dowels for as long as possible. When the mice were no longer able to walk on the rotating dowels, they fell onto the landing platform below. This triggered the end of the trial for an animal and measurements of time to fall (TTF) were collected. Passive rotations where mice clung to and consequently rotated with the dowel were also used to define the end of the trial. Mice were then returned to their cages with access to food and water for 10 min. This procedure was repeated for a total of six trials, with the first three trials used for training and subsequent trials used for data analysis.
Forelimb grip strength
The forelimb grip strength of mice was measured using a grip strength meter (Columbus instrument, USA). Mice were held by the base of the tail close to the horizontal bar to allow them to reach and grab onto the bar with their forelimbs. Mice were then positioned so that their body was horizontal and in line with the bar. They were then pulled horizontally away from the bar by the tail until their grip was released. The tension was measured and defined as grip strength. Mice were given 1 min inter-trial intervals (ITI) during which they were returned to their cages with access to food and water. This procedure was repeated for a total of nine trials for each mouse (with the mean value of nine trials used for analysis).
Frailty index assessment
The Frailty Index (FI) was assessed as described previously47. In brief, 31 health-related deficits were assessed for each mouse. A mouse was weighed, and body surface temperature was measured three times with an infrared thermometer (Fisher scientific). Bodyweight and temperature were scored based on their deviation from the mean weight and temperature of young mice47. Twenty-nine other items across the integument, physical/musculoskeletal, ocular/nasal, digestive/urogenital, and respiratory systems were scored as 0, 0.5, and 1 based on the severity of the deficit. The total score across the items was divided by the number of items measured to give a frailty index score between 0 and 1.
MicroCT scan
Both femurs and tibia of the mice were analyzed in a Micro Computed Tomography (micro-CT) Facility (Tissue Imaging (BBMTI) Core in Center for Musculoskeletal Research, University of Rochester). Micro-CT was performed with a state-of-the-art scanner (VivaCT 40, Scanco USA, Inc.) for live small animals and specimens, without contrast agents. The scanner was fitted with an adjustable X Ray Source Energy (30 – 70 kVp) and scan (using Scancocone beam geometry) specimens in a field of view (FOV) of up to 39 mm and a scan length of 145 mm at a nominal resolution of 10 microns. Scan acquisition, reconstruction, analysis, and measurements are performed using a specialized suite of 64 bit software applications running on an open VMS platform.
The relevant 3D-images were imported after processing into the scan software and the parameters such as bone mass density (BMD), bone volume/tissue volume (BV/TV), bone surface/bone volume (BS/BV), bone surface/total volume (BS/TV), trabecular number (Tb.N), Trabecular separation (Tb-Sp) and connectivity density (Conn.Dn) were measured.
Methylation clock
Genomic DNA from 24 months old CreER and nmrHAS2 mouse livers was purified using a DNeasy Blood & Tissue Kit (Qiagen). One hundred nanograms of purified genomic DNA were used for the methylation measurement. All DNAm data used was generated using the custom Illumina chip “HorvathMammalMethylChip40” so-called the mammalian methylation array. The particular subset of species for each probe is provided in the chip manifest file can be found at Gene Expression Omnibus (GEO) at NCBI as platform GPL28271. The SeSaMe normalization method was used to define beta values for each probe48. The methylation age was normalized to chronological age to calculate the age acceleration value.
To investigate the CpG sites that drive the epigenetic age difference between experimental and control groups, we tested the methylation levels of CpG sites reported to change during mouse aging in a previous study49. Paired Student t-test was used to calculate the statistical significance.
7,12-Dimethylbenz(a)anthracene/12-O-tetradecanoylphorbol-13-acetate (DMBA/TPA) treatment
Thirteen young CreER and eleven nmrHAS2 mice were topically treated with DMBA and TPA. A single dose of DMBA (7.8 mM dissolved in acetone) was topically treated to mice on the dorsal trunk. Three days after, 0.4 mM of TPA was treated 3 times per week. The formation of papilloma was quantified 20 weeks after TPA treatment.
Measurement of cytokines and chemokines in plasma
Thirty-six cytokines and chemokines were measured in young and old mouse plasma by luminex multiplex technique using a Cytokine & Chemokine 36-Plex Mouse ProcartaPlex™ Panel 1A kit (Thermo Fisher Scientific). The luminex multiplex assay was performed using undiluted plasma samples following the manufactures instruction.
Tissue section, immunofluorescence, and RNAscope in situ hybridization
Paraffin-embedded specimens were sectioned at 10 μm thickness. Tissue sections were deparaffinized with xylene and dehydrated in a descending alcohol series of 100, 95, 80, 70, and 50%. These initial processing steps were the same for all the staining procedures described below and all staining procedures were performed on the same samples, samples were rehydrated in PBS for 30min before performing immunofluorescence. For antibody-based assays, the sections were incubated twice in antigen retrieval buffer (0.1 M sodium citrate, 0.1 M citric acid, pH 6.0) for 15 min at 90‑100°C before blocking. All slides were blocked in TBS-T which contains 5% FBS and 1% BSA for 2 h at room temperature. Subsequently, sections were incubated overnight at 4°C with the following primary antibodies: Anti-MUC2 (1:1500, GeneTex), Anti-Lyzozyme (1:500, Abcam). Following the primary antibody incubation, the slides were washed three times in PBS-T and incubated with goat anti rabbit IgG (H+L) secondary antibody conjugated with Alexa Fluor 568(1:1000, Invitrogen) for 1h at room temperature. After a 5 times wash, slides were stained with DAPI (BioLegend) for 1min at room temperature, mounted with mounting media (Vector Laboratories) and observed under the confocal microscope at x40 magnification.
For HABP staining, after deparaffinization, slides were rehydrated in PBS for 30min at room temperature then blocked in TBS-T which contains 5% FBS and 1% BSA for 2h at room temperature. Then all slides were incubated with biotinylated hyaluronan binding protein (1:100 for small intestine and 1:200 for other tissues, Amsbio) overnight at 4°C. Following the HABP incubation, slides were washed and incubated with Streptavidin conjugated with Alexa Fluor 647(1:500, Thermo Fisher Scientific) for 1h at room temperature. Then the slides will be washed, counterstained with DAPI, mounted, and observed under the confocal microscope at x40 magnification. At least three random fields of each sample were captured for quantification of fluorescence signals. The average intensities of HA signals were quantified using ImageJ. Experiment was repeated from at least three animals of each group to confirm the reproducibility.
RNAscope assay was performed using RNAscope Multiplex Fluorescent Detection Kit v2 according to the manufacturer’s protocol. All pictures were required under the confocal microscope at x40 magnification.
Preparation of RNA for RT-qPCR and RNA sequencing
All frozen tissues were pulverized using the cell crusher. For preparing RNA from tissues, pulverized frozen tissues in the range of 10–15 mg were removed from samples kept at −80°C and extracted using Trizol reagent according to the supplier’s instructions. After recovery of total RNA from the Trizol reagent by isopropanol precipitation, RNA was digested with DNaseI for 30min at room temperature and further purified by RNeasy plus mini kit according to the instruction. For purifying RNA from cells, the RNeasy plus mini kit was used according to the user manual. The yield and quality were checked using Nano Drop.
Reverse transcription quantitative PCR (RT-qPCR)
For RT-qPCR, ~300ng of purified RNA was revers transcribed into cDNA in the 20 μL using iScript cDNA synthesis kit (Bio-Rad). 2 μL of this reaction was used for subsequent qPCR reactions, which were performed using SYBR green system (Bio-Rad). The primer sequences were listed in Supplementary Table 1. The actin beta gene was used as internal normalization control.
RNA sequencing
The RNA samples were processed with the Illumina TruSeq stranded total RNA RiboZero Gold kit and then subjected to Illumina HiSeq 4000 single-end 150bp sequencing at University of Rochester Genomics Research Center. Over 50 million reads per sample were obtained. The RNA-seq experiment was performed in three biological replicates for all tissues.
The RNA-seq reads were first processed using Trim_Galore (version 0.6.6), which trimmed both adapter sequences and low-quality base calls (Phred quality score < 20). The clean RNA-seq reads were used to quantify the gene expression with Salmon (version 1.4.0)50. Specific parameters (--useVBOpt --seqBias --gcBias) were set for sequence-specific bias correction and fragment GC bias correction. Gencode51 ( version M25) was used for the genome-wide annotation of the gene in the mouse. The reads counts for genes were used as the input for differential expression analysis by DESeq252. Low-expression genes with reads counts less than 10 were excluded. The cutoff for p-value and fold change was shown in the figure or figure legend.
For the hierarchical clustering analysis, we reanalyzed published gene expression data of mice treated with rapamycin, calorie restriction, growth hormone knockout, etc. To minimize the potential batch effect, we directly compared the gene expression data of mice with intervention treatments to its corresponding control. Fold changes (intervention / control) of gene expression level were calculated for each gene. Log2 scaled fold changes of gene expression were used to perform the analysis.
Gene set enrichment analysis (GSEA)53 was performed with “Preranked” model (version 4.1.0). All genes were preranked by the values of −log10 (adjusted p value)*(fold change)/abs(fold change). Adjusted p values and fold change were obtained from DEseq2. Normalization mode was set to “meandiv”. Only those gene set with a size more than 15 genes were kept for the further analysis.
GO analysis were performed by R package clusterProfiler (Release version 3.14)54. GO comprises of three orthogonal ontologies, i.e. molecular function (MF), biological process (BP), and cellular component (CC). All the p-values are adjusted following Benjamini –Hochberg (BH) correction.
Association of gene expression log-fold changes induced by nmrHas2 expression in mouse livers with previously established transcriptomic signatures of aging and lifespan-extending interventions was examined as described in the previous study55 separately for males and females. Utilized signatures of aging included tissue-specific brain, liver and kidney signatures as well as multi-tissue signatures of mouse, rat and human. Signatures of lifespan-extending interventions included genes differentially expressed in mouse tissues in response to individual interventions, including caloric restriction (CR), rapamycin (Rapamycin), and mutations associated with growth hormone deficiency (GH deficiency), along with common patterns of lifespan-extending interventions (Common) and expression changes associated with the mouse maximum (Max lifespan) and median lifespan (Median lifespan).
Pairwise Spearman correlation between logFC induced by nmrHas2 expression and associated with signatures of aging and longevity was calculated based on the union of top 400 statistically significant genes (with the lowest p-value) for each pair of signatures.
For the identification of enriched functions affected by nmrHas2 expression in mouse livers we performed Fisher exact test and functional GSEA (10.1073/pnas.0506580102) on a pre-ranked list of genes based on log10(p-value) corrected by the sign of regulation, calculated as:
where pv and lfc are p-value and logFC of a certain gene, respectively, obtained from edgeR output, and sgn is the signum function (equal to 1, −1 and 0 if value is positive, negative or equal to 0, respectively). HALLMARK, KEGG and REACTOME ontologies from the Molecular Signature Database (MSigDB) were used as gene sets. Fisher exact test and GSEA were performed separately for each sex using gprofile2 and fgsea R packages, respectively. A q-value cutoff of 0.1 was used to select statistically significant functions.
Similar analysis was performed for gene expression signatures of aging and lifespan-extending interventions. Pairwise Spearman correlation was calculated for individual signatures of nmrHas2 expression, aging and lifespan-extending interventions based on NES estimated with GSEA. A heatmap colored by NES was built for manually chosen statistically significant functions (adjusted p-value < 0.1). Complete list of functions enriched by genes perturbed by nmrHas2 expression in mouse livers is included in Supplementary Table 3.
Primary fibroblast isolation and cell culture
Primary skin fibroblasts were isolated from under-arm skin from 5 months old CreER and nmrHAS2 mice. Skin tissues were shaved and cleaned with 70% ethanol then minced and incubated in DMEM/F-12 medium (ThermoFisher) with Liberase (Millipore Sigma) at 37℃ on a stirrer for 40min. Tissues were then washed and plated with DMEM/F-12 medium containing 15% fetal bovine serum (GIBCO) and Antibiotic-Antimycotic (GIBCO). When cells are 80% confluent, isolated cells were frozen in liquid nitrogen within 2 passages. All subsequent fibroblast cultures were performed in EMEM (ATCC) supplemented with 10% fetal bovine serum (GIBCO), 100 units/mL penicillin, and 100 mg/mL streptomycin (GIBCO). Raw264.7 cell line was purchased from ATCC and maintained using DMEM (Gibco) supplemented with 10% fetal bovine serum (GIBCO), 100 units/mL penicillin, and 100 mg/mL streptomycin (GIBCO). The Raw cells used for all experiments are all under passage four. All primary cells were cultured at 37℃ with 5% CO2 and 3% O2.
Apoptosis assay
Skin fibroblast cells under population doubling 15 were used for H2O2 treatment. Cells with ~80% confluency were treated with H2O2 at concentrations of 100 µM, 200 µM, and 400 µM for 24h. Cells were collected, and apoptotic cells were quantified using Annexin V FLUOS Staining Kit (Roche) following the manufacturer’s instructions. After staining, cells were analyzed with CytoFlex flow cytometer (Beckman). Cells which are double negative for Annexin-V and PI signals were defined as live cells.
Bone marrow derived macrophage isolation, culture, and LPS challenge
Bone marrow derived macrophages were isolated from 5 months old CreER and nmrHAS2 mice. Mice were sacrificed via cervical dislocation and hind legs were dissected. Using aseptic technique, bone marrow was extracted from tibia and femur bones following removal of surrounding muscle. To do so, joints were cut using a scalpel and the exposed bone marrow was flushed out the ends of the bones using a 27-gauge needle and a 10 ml syringe filled with cold RPMI-1640 media. Clumps were gently disaggregated using a needle-less syringe and passed through a 70 μm cell strainer. The cell suspension was centrifuged at 250 g for 5 min at room temperature to pellet cells. Bone marrow cells were subsequently cultured in RPMI-164 (GIBCO) supplemented with 10% fetal bovine serum (GIBCO), 100 units/mL penicillin, 100 mg/mL streptomycin (GIBCO), and 10ng/mL recombinant mouse M-CSF(R&D) at 37℃ with 5% CO2 and 3% O2 on Day 0. Fresh media were changed every 48h, Double volume of media were used on Day 4 and M-CSF was supplemented on Day 6 to avoid removing the HA produced by cells. 10ng/mL LPS was used to treat macrophages on Day 7. Cells were harvest 24h after LPS treatment for RNA extraction.
Gut permeability assay
Tracer FITC-labeled dextran (4kDa; Sigma-Aldrich) was used to assess in vivo intestinal permeability. Mice were deprived of food 8 h prior to and both food and water following an oral gavage using 200 ml of 80 mg/ml FITC-dextran. Blood was retro-orbitally collected after 4 h, and fluorescence intensity was measured on fluorescence plates using an excitation wavelength of 493nm and an emission wavelength of 518 nm. The untreated mouse plasma was used as blank.
Isolation and culture of primary intestinal crypts
Around 20 cm small intestines from 7- and 18- months old mice were removed and flushed using 10 mL syringe with clear lumenal contents. Then the intestines were opened longitudinally, washed in 20 mL cold PBS and cut into ~5 mm sections, and placed into the 50 mL canonical tube which contains 15 mL cold PBS. Intestinal crypts were mechanically released from the lamina propria by vigorous pipetting and washed using PBS for twenty times followed by incubating in 25 mL gentle cell dissociation reagent (STEMCELL Technology) for 15min at room temperature. After that, the dissociation reagent was neutralized by adding 10 mL of cold PBS containing 1% BSA. The supernatants containing crypts were filtered through a 70‑µm cell strainer and centrifuged at 290 xg for 5 min at 4°C then washed one more time with cold PBS containing 1% BSA. Isolated crypts were counted and embedded in Matrigel (Corning) on the ice at ~12.5 crypts per µl and mixed with the same volume of IntestiCult Organoid Growth medium (STEMCELL Technology). Matrigel beads occupying the center of the well were constructed using 40 µl of Matrigel to form a solid dome‑like structure in an 8‑well chamber slide and were subsequently overlaid with 400 µl IntestiCult Organoid Growth medium. For the HA treatment, 20 µg/mL HMW or LMW HA (R&D) were directly added to the Matrigel crypts mixture. Primary intestinal crypts were incubated in a fully humidified culture chamber with 5% CO2 at 37°C. The culture medium was changed every 48 h, and the organoid‑forming efficiency was calculated on days 4.
Microbiota analysis
Fresh fecal samples from 9- and 23-months old animals were obtained in the morning, immediately snap freeze in liquid nitrogen, and stored in −80℃. These samples were used for 16S rRNA gene analysis for microbiota profiling from the V1–V2 region of 16S rRNA genes. DNA extraction was performed using QIAamp DNA Stool Mini Kit (Qiagen) following the manufacture’s instruction. DNA was eluted in 50 µl DNAse free water. Twenty nanograms of DNA were used for the amplification of the 16S rRNA gene with primers 27F-DegS (5’-TCGTCGGCAGCGTCAGATGTGTATAAGAGACAGGTTYGATYMTGGCTCAG-3’) and 338R I (5’-GTCTCGTGGGCTCGGAGATGTGTATAAGAGACAGGCWGCCTCCCGTAGGAGT-3’) + 338R II (5’- GTCTCGTGGGCTCGGAGATGTGTATAAGAGACAGGCWGCCACCCGTAGGTGT-3’)56 for 25 cycles. Primers have Illumina sequencing index attached; Index forward (5’- TCGTCGGCAGCGTCAGATGTGTATAAGAGACAG-3’) and index reverse (5’- GTCTCGTGGGCTCGGAGATGTGTATAAGAGACAG-3’). The PCR was performed in a total volume of 50 µl containing 1× HF buffer (New England BioLabs), 1 µl dNTP Mix (New England BioLabs), 1 U of Phusion® Hot Start II High-Fidelity DNA polymerase (New England BioLabs), 500 nM of the 27F-DegS primer, 500 nM of an equimolar mix of two reverse primers, 338R I and II. The size of the PCR products (~375 bp) was confirmed by gel electrophoresis using 5 µl of the amplification reaction mixture on a 1% (w/v) agarose gel. The PCR products were purified using QIAquick PCR Purification Kit (Qiagen). Then, the dual indices and Illumina sequencing adapters were attached using the Nextera XT index kit (Illumina) following the manufacture’s instruction. Purified amplicon pools were 250 bp paired end sequenced using Illumina Miseq.
The Illumina Miseq data analysis was carried out with a workflow employing the Quantitative Insights Into Microbial Ecology (QIIME2) pipeline57. The reads were processed the as following: reads were filtered for not matching barcodes; OTU picking and chimera removal was done via matching the sequences to the Silva 111 database, with only one mismatch allowed, and a biom and with clustalw a multiple alignment and phylogenetic tree file was generated. Further outputs were generated via QIIME, such as filtered reads per sample, PD whole tree diversity measurements and the level 1–6 taxonomic distributions with relative abundances. 37,000 reads cutoff was used for all the samples.
Statistical and demographic analysis
Data are shown as means with SEM (unless stated otherwise). N indicates the number of animals per test group; age and sex are also noted. The number of animals chose for each experiment was calculated using power analysis. Randomly picked littermates were used for all the experiments. Student’s t test (unpaired, two-tailed, equal variance) was used for all pairwise comparisons which satisfied with normal distribution. Mann-Whitney u test was used for data which is not satisfied with normal distribution. All relevant p values are shown in the figures; p<0.0001 was displayed as ‘p<0.0001’, and ns means no significance. Demographic data were processed with GraphPad Prism software to compute mean and median lifespans, SEM, percent increase of the median, and p values (log-rank test) for each cohort.
Extended Data
Extended Data Figure 1. nmrHAS2 mice exhibit resistance to spontaneous and induced cancer.
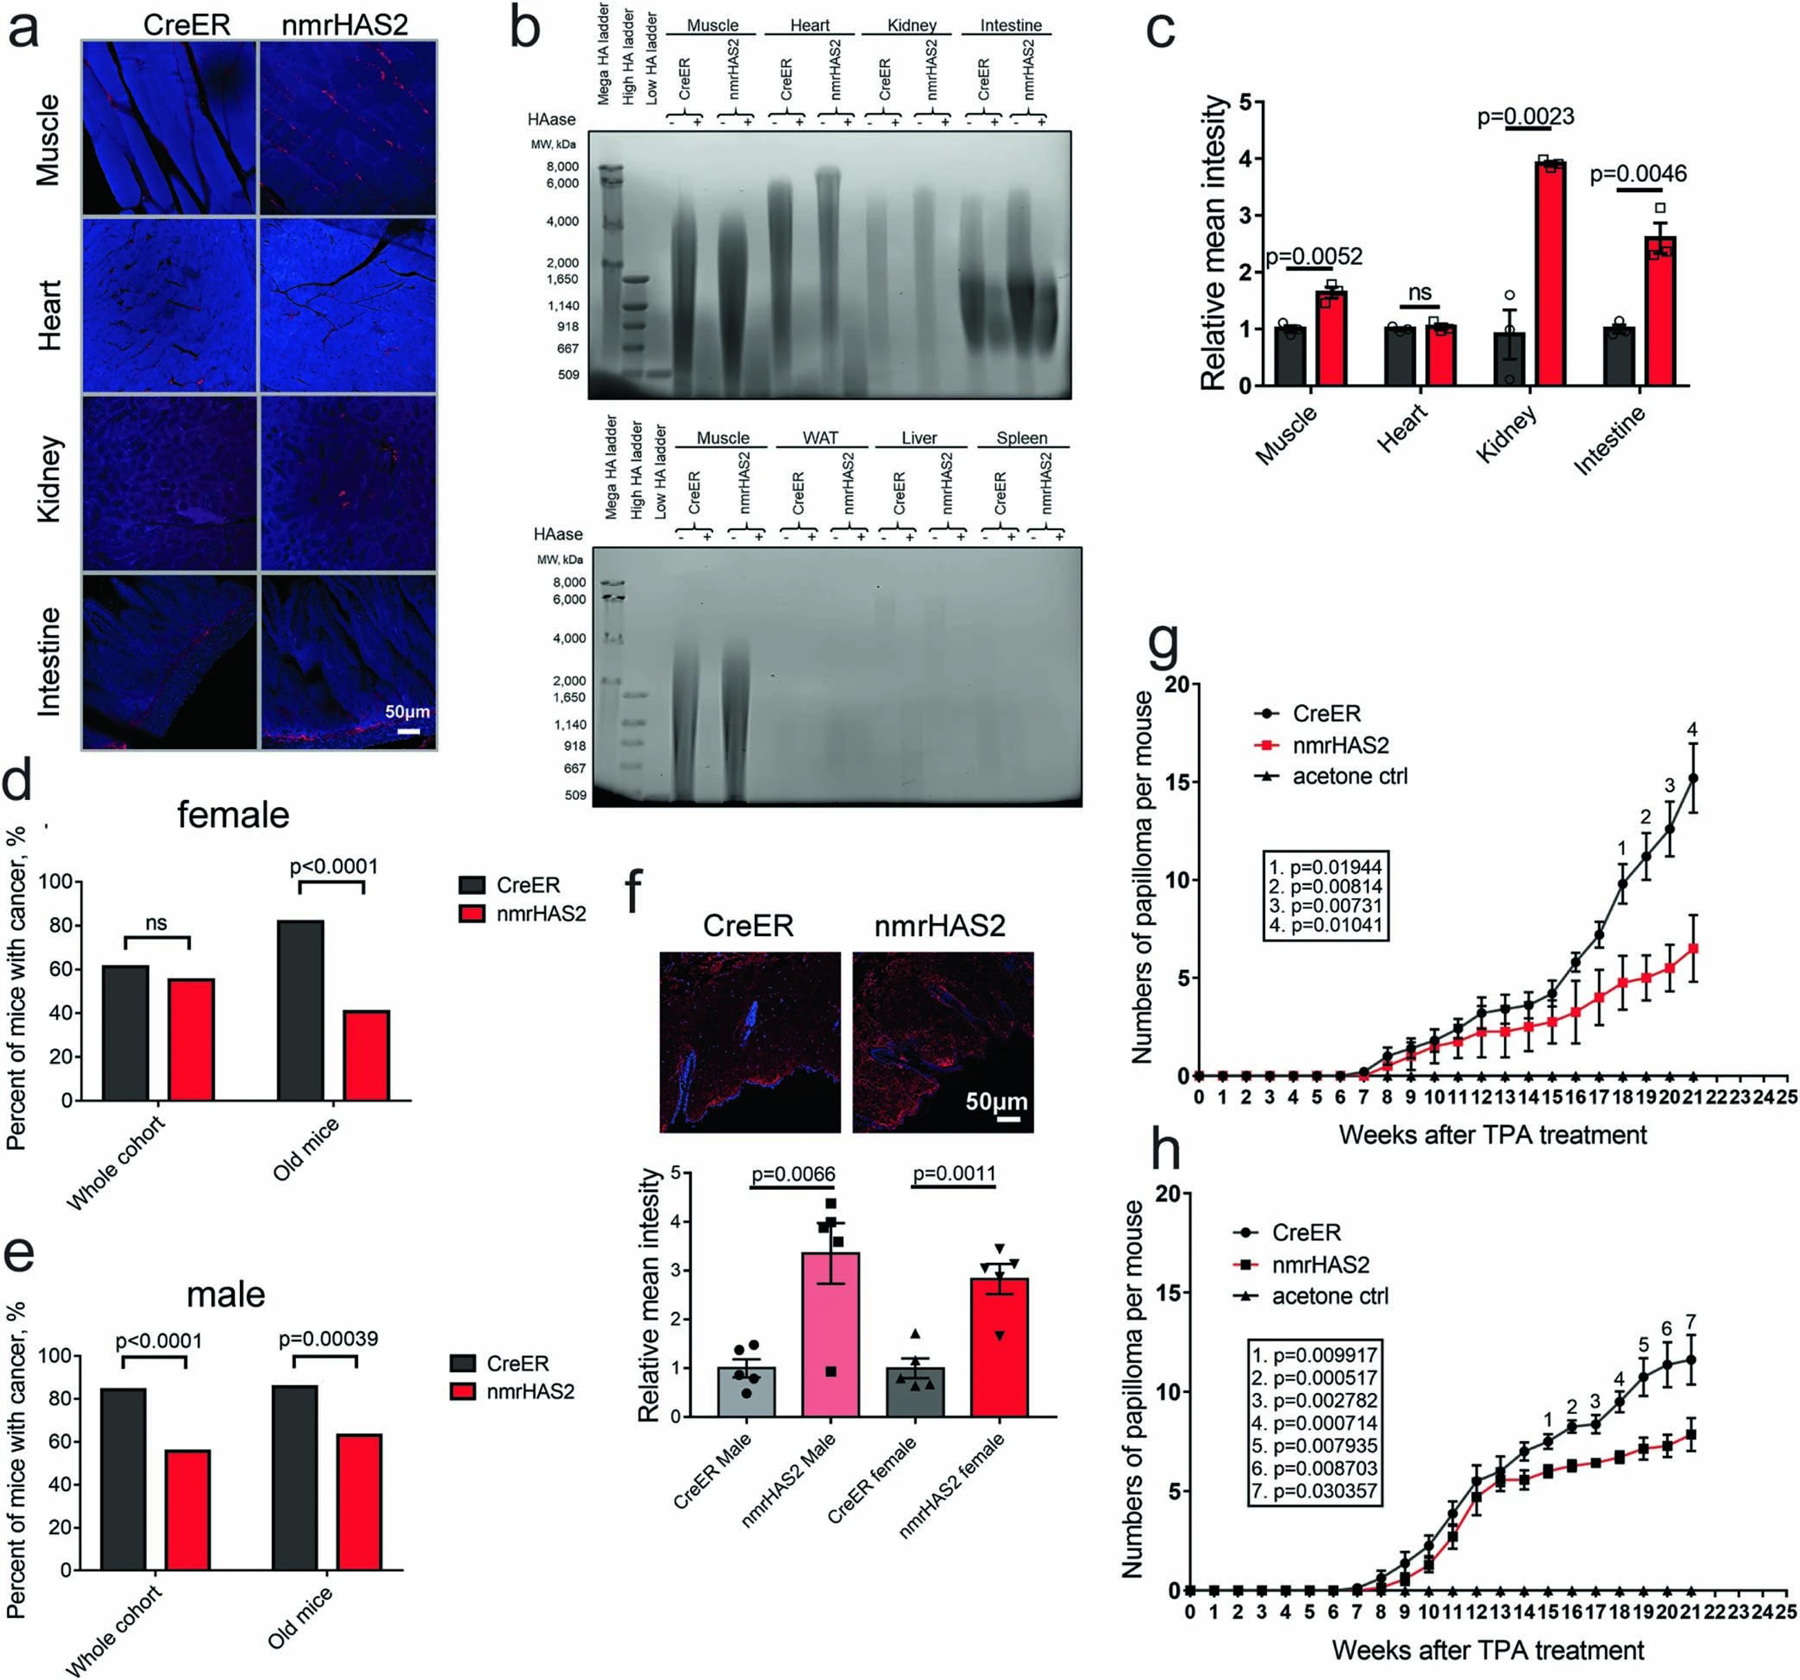
a. Representative stainings of HABP staining in organs of male nmrHAS2 and CreER mice.
b. Pulse field gel shows that male nmrHAS2 mice have higher molecular weight and more abundant hyaluronic acid than CreER control mice. HA was extracted from 200 mg of pooled tissue from two individuals. HAase treated samples were run in parallel to confirm the specificity of HA staining.
c. Quantification of relative HABP fluorescence intensity shown in b. n=3.
d. Old female nmrHAS2 mice have much lower spontaneous cancer incidence n=47 for CreER and n=49 for nmrHAS2.
e. Old male nmrHAS2 mice have much lower spontaneous cancer incidence n=27 for CreER and n=32 for nmrHAS2.
f. HABP staining shows that skin of nmrHAS2 mice has higher hyaluronan levels, n=5.
g. Quantification of papilloma formation in DMBA/TPA treated female mice. n=3 for acetone treated mice, n=5 for CreER, and n=4 for nmrHAS2.
h. Quantification of papilloma formation in DMBA/TPA treated male mice. n=4 for acetone treated mice, n=8 for CreER, and n=7 for nmrHAS2.
c, f, g, h. p-values were calculated by two-tailed unpaired t-test (p-values are indicated in the graphs). Bars represent the means, error bar displays the standard error, dots represent biological replicates.
d-e. Old mice are older than 27 months. P-values were calculated by two tailed Chi-square test.
Extended Data Figure 2. nmrHAS2 mice show extended lifespan and healthspan.
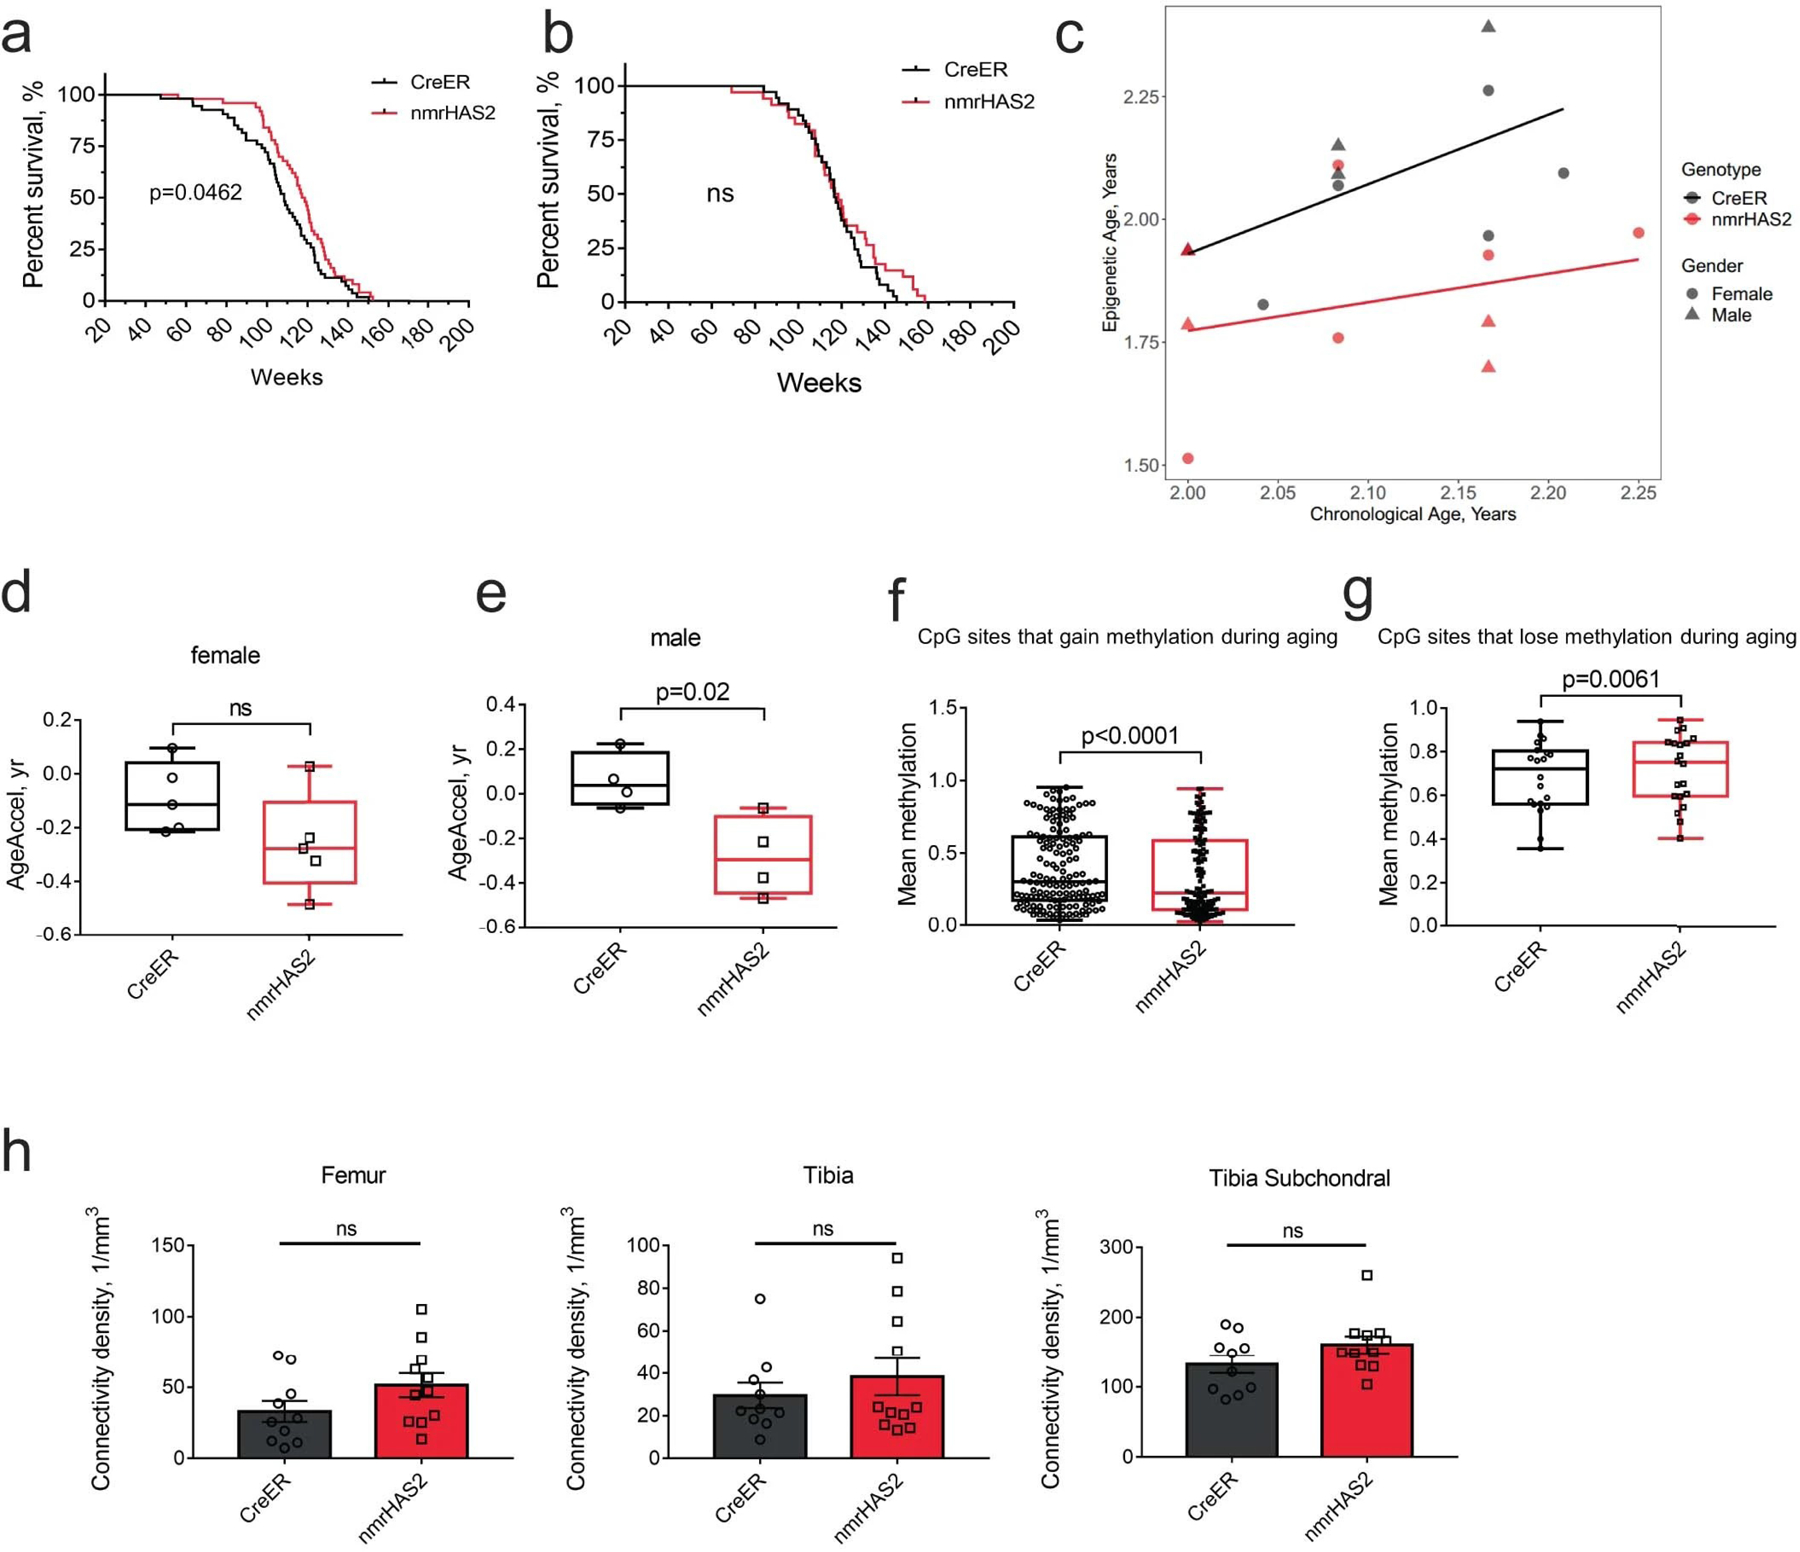
a. Female nmrHAS2 mice (n=50) have extended median lifespan compared to female CreER mice (n=54). p-value for median lifespan was calculated using two tailed log-rank test.
b. Male nmrHAS2 (n=34) mice have extended maximum lifespan compared to male CreER mice (n=37). p-value for median lifespan was calculated using two tailed log-rank test.
c. Old nmrHAS2 mice display younger epigenetic age.
d-e. Old nmrHAS2 female mice (d) and old nmrHAS2 male mice (e) display lower age acceleration, or younger biological age than CreER controls.
f. Mean methylation level of CpG sites that gain methylation during aging. Analysis was performed based on 9 animals.
g. Mean methylation level of CpG sites that lose methylation during aging. Analysis was performed based on 9 animals
h. Old male nmrHAS2 mice (n=11) have the same level of bone connectivity density compared to age-matched controls (n=10). p-values were calculated by two-tailed unpaired t-test (p-values are indicated in the graphs). Bars represent the means, error bars show standard errors, dots represent biological replicates.
d, e. The five-number summary on the boxplot displays the minimum, first quartile, median, third quartile, and maximum. p-values were calculated by two-tailed unpaired t-test.
f, g. The five-number summary on the boxplot displays the minimum, first quartile, median, third quartile, and maximum. p-values were calculated by two-tailed paired t-test.
Extended Data Figure 3. nmrHAS2 mice showed a distinct transcriptomic signature.
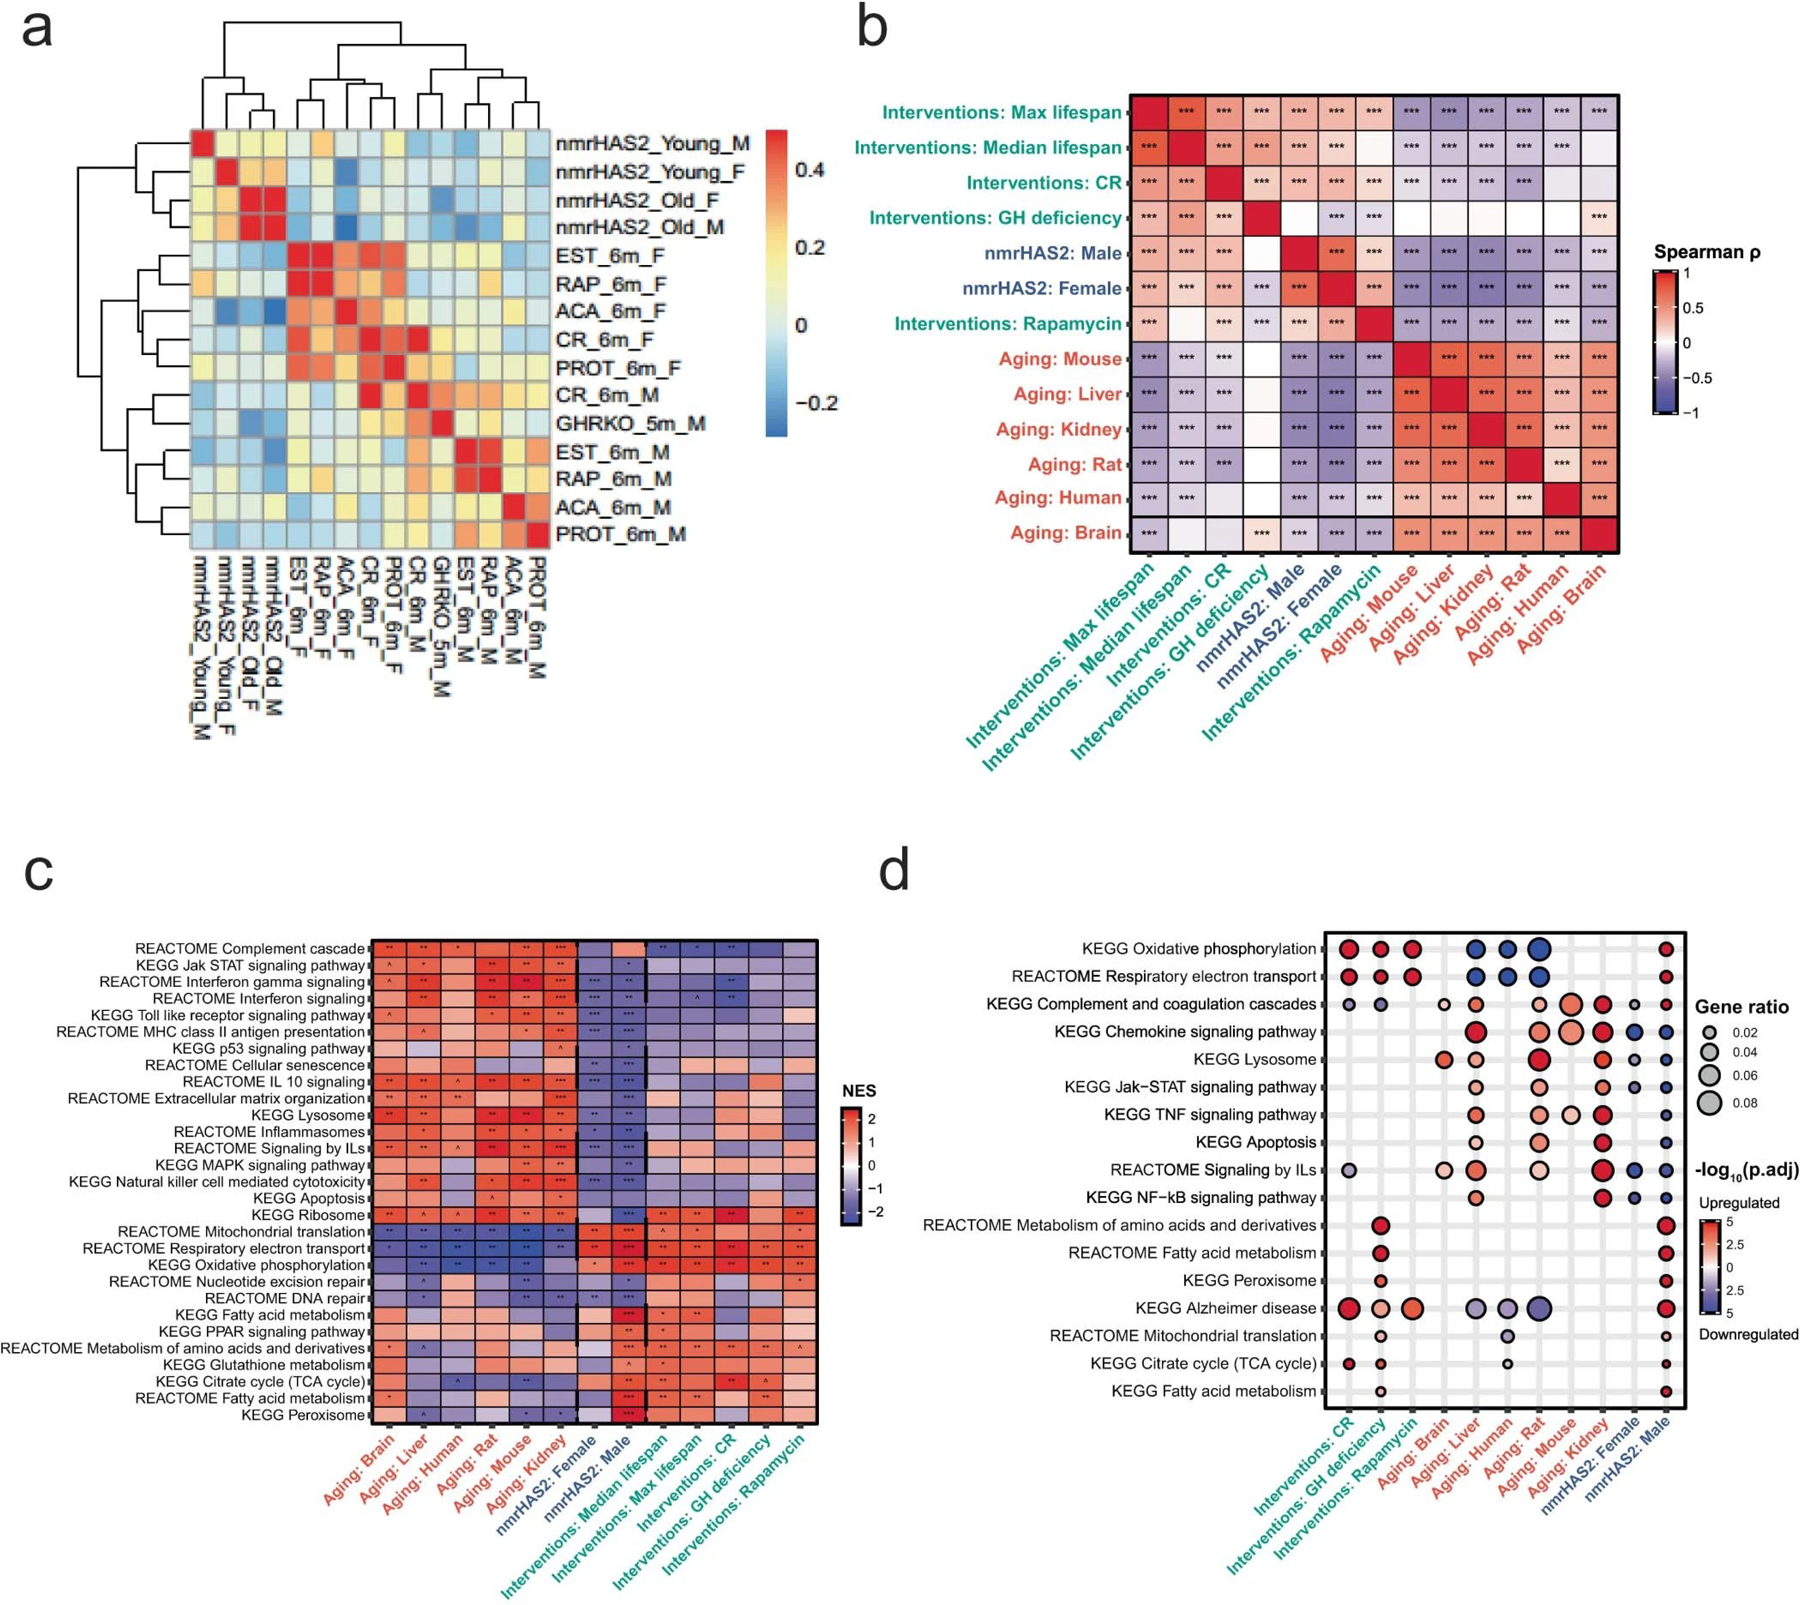
a. nmrHAS2 mice display an expression signature distinct form mice subjected to other pro-longevity interventions. A heatmap of correlation analysis performed on liver whole transcriptomes.
b. Association between nmrHAS2 effect and signatures of lifespan-extending interventions and mammalian aging based on functional enrichment (GSEA) scores. Only functions enriched by at least one signature (adjusted p-value < 0.1) were used for the calculation. Exact adjusted p-values are shown in Extended Data table 2.
c. Functional enrichment (GSEA) of gene expression signatures associated with nmrHAS2, mammalian aging and established lifespan-extending interventions. Only functions significantly enriched by at least one signature (adjusted p-value < 0.1) are presented. Exact adjusted p-values are shown in Supplementary Table 4.
d. Functional enrichment (Fisher exact test) of genes significantly associated with the effect of nmrHAS2, mammalian aging and established lifespan-extending interventions. Only functions enriched by at least one aggregated signature (adjusted p-value < 0.1) are shown. Proportion of pathway-associated genes is reflected by bubble size. Exact adjusted p-values are shown in Supplementary Table 5.
b-d. ^ p.adjusted < 0.1; * p.adjusted < 0.05; ** p.adjusted < 0.01; *** p.adjusted < 0.001.
Extended Data Figure 4. nmrHAS2 mice showed a younger transcriptomic state.
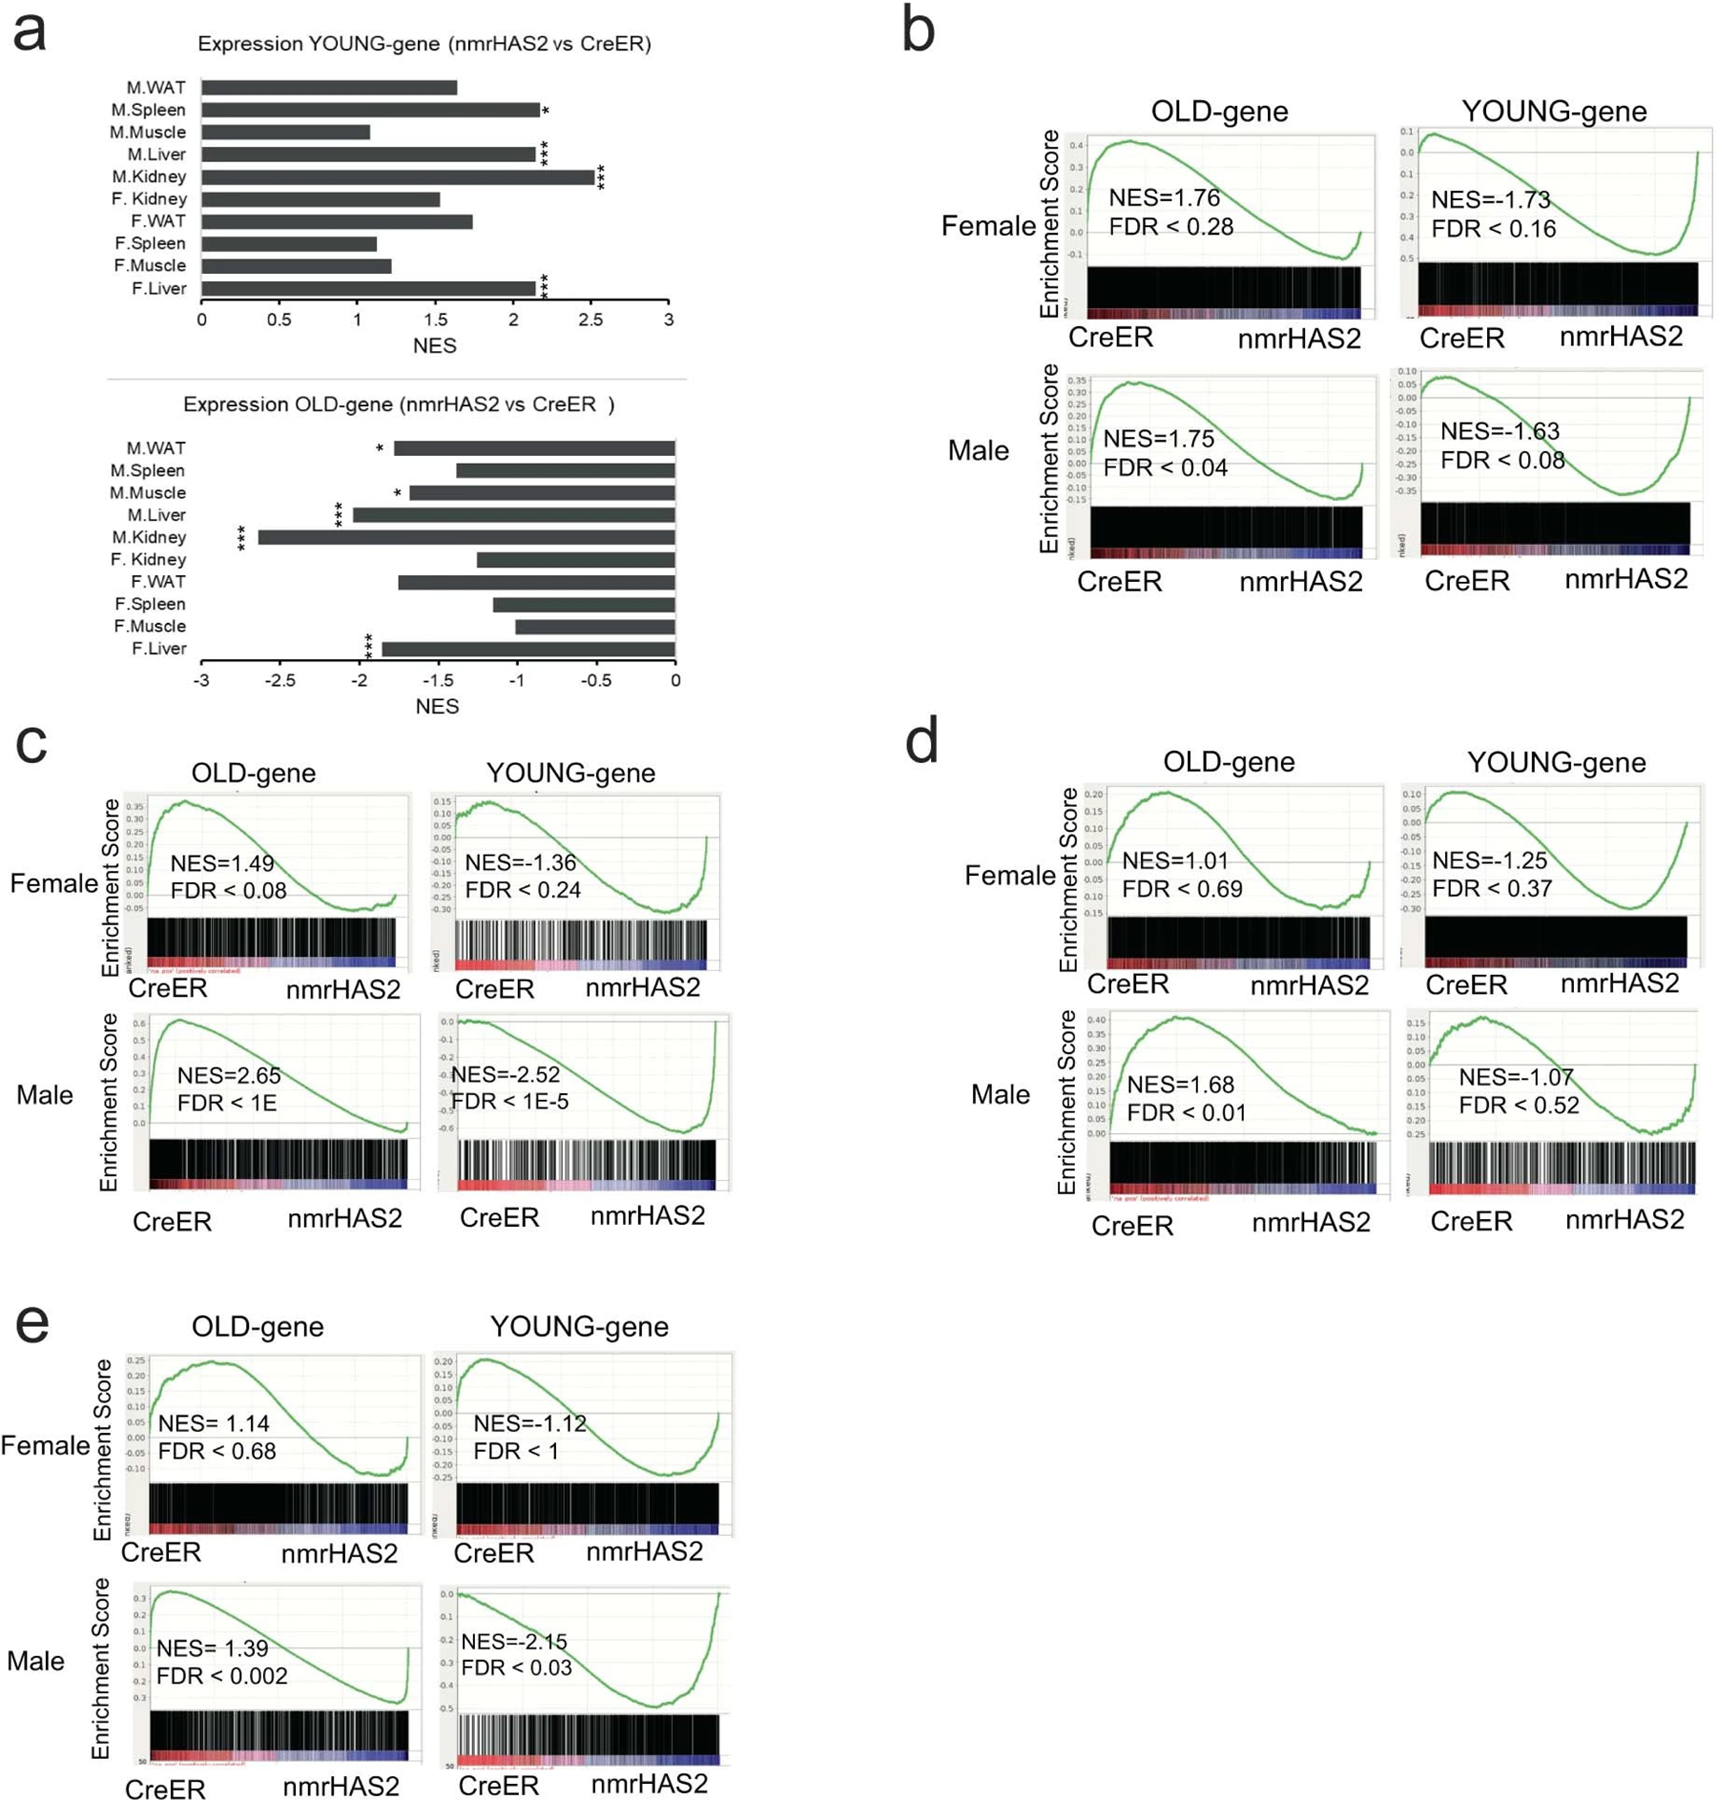
a. GSEA plots show that YOUNG gene set is upregulated, and OLD gene set is downregulated in all sequenced old nmrHAS2 mice of both sexes. * FDR<0.05, *** FDR<0.001. Exact FDR values are shown in Extended Data Figure 4 b–e.
b. GSEA plots showing that OLD gene set is downregulated in WAT of old male nmrHAS2 mice.
c. GSEA plots showing that that YOUNG gene set is upregulated, and OLD gene set is downregulated in the kidney of old male nmrHAS2 mice.
d. GSEA plots showing that OLD gene set is downregulated in the muscle of old male nmrHAS2 mice.
e. GSEA plots showing that that YOUNG gene set is upregulated, and OLD gene set is downregulated in the spleen of old male nmrHAS2 mice.
Extended Data Figure 5. RNAseq shows reduced inflammation during aging in nmrHAS2 mice.
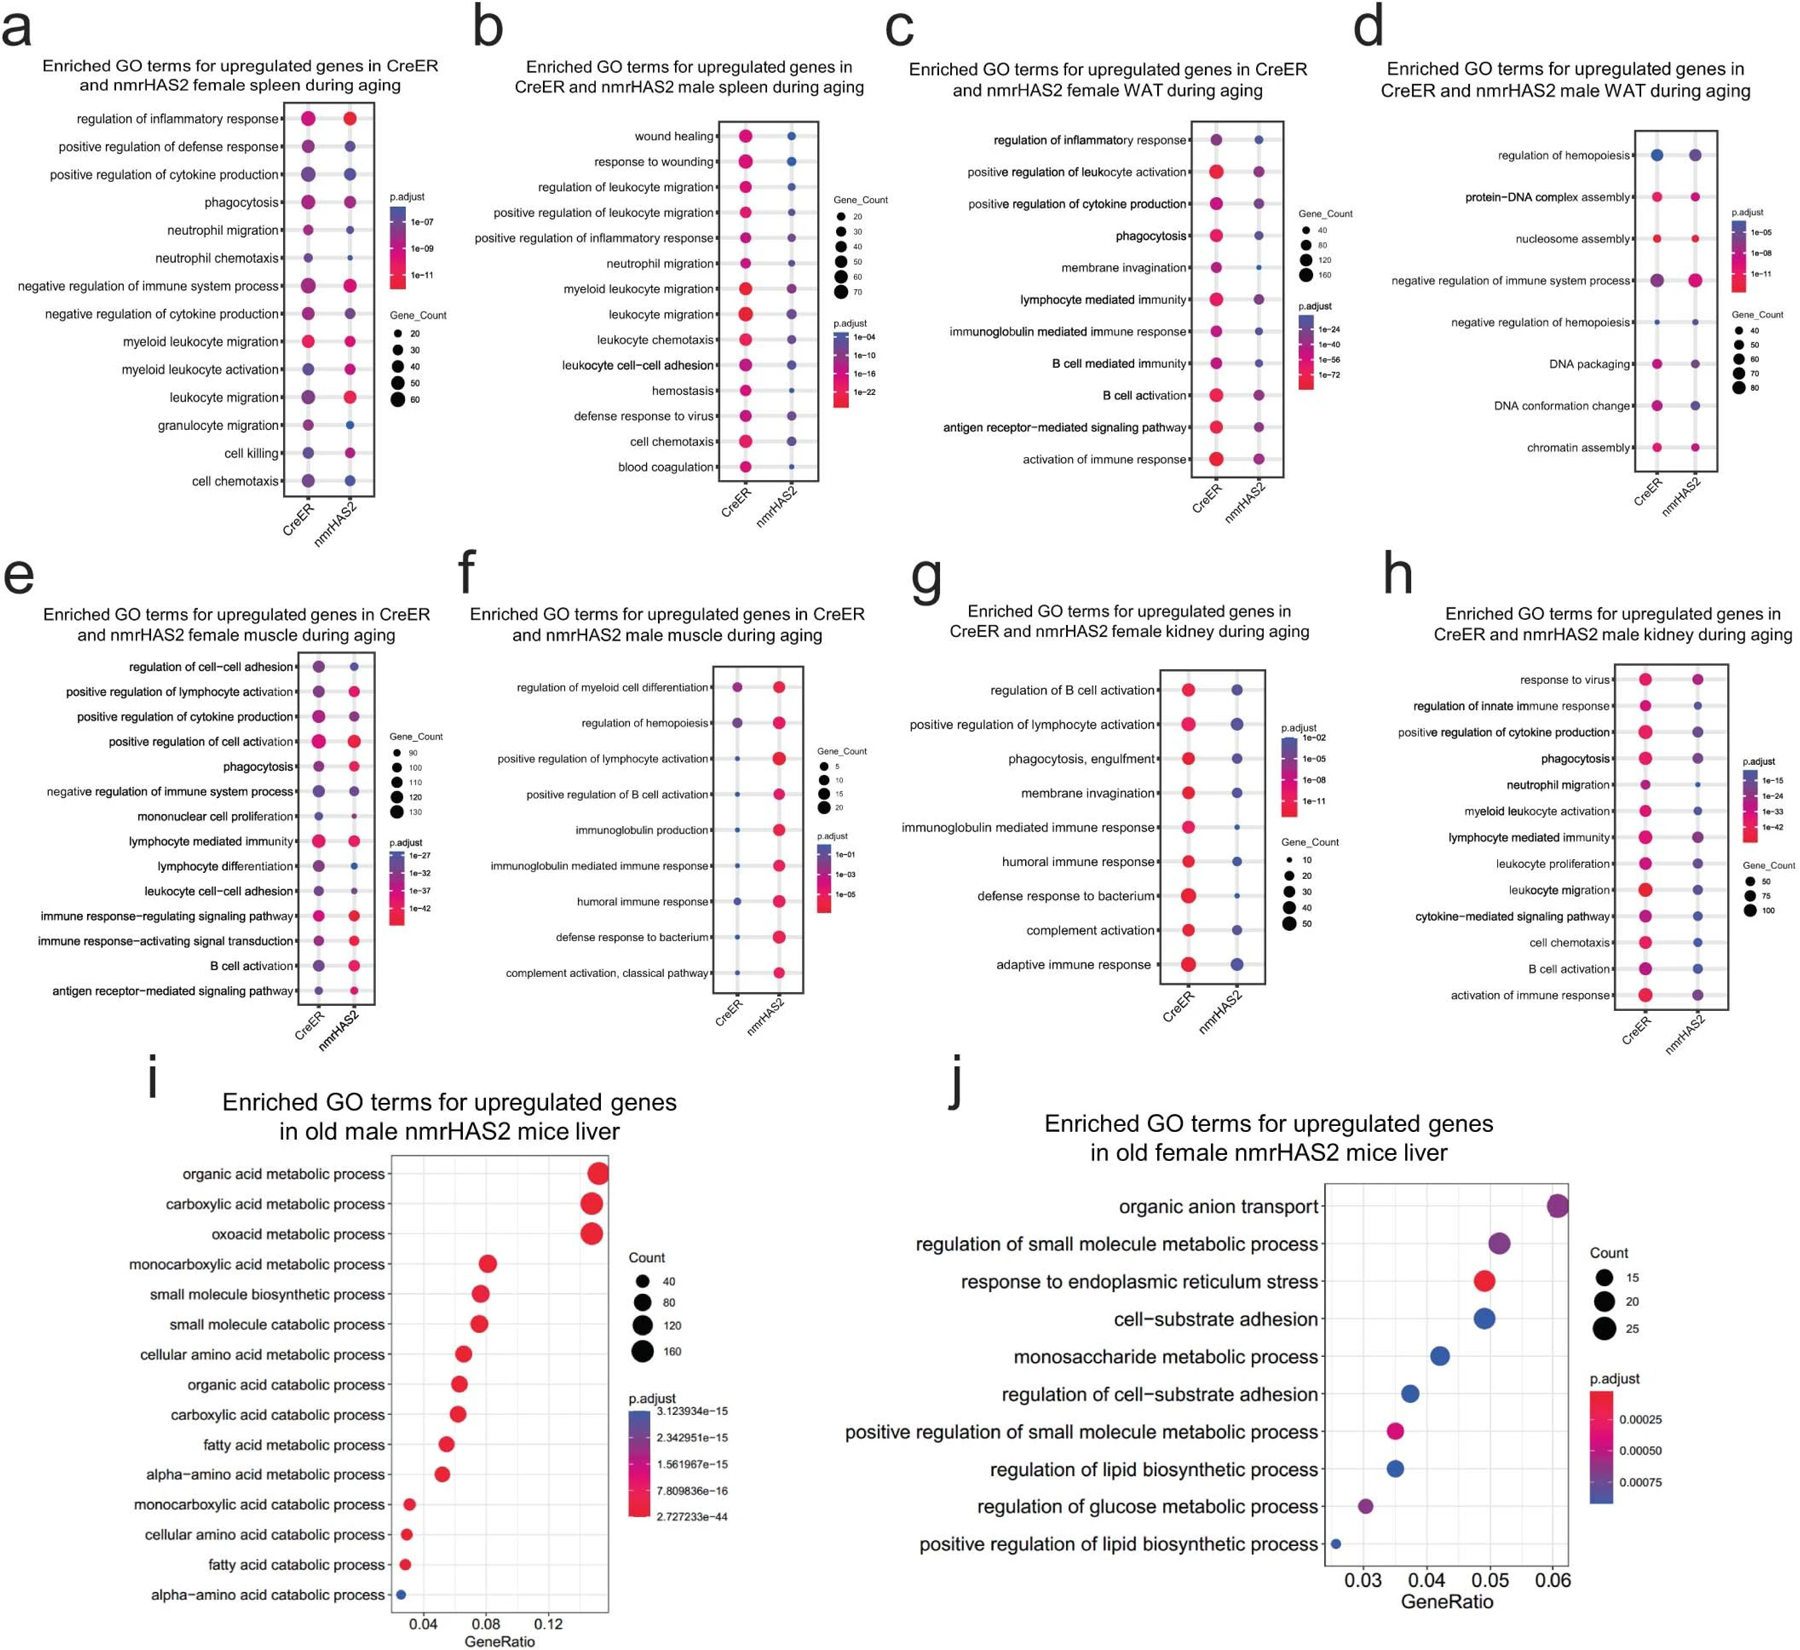
a-b. Enriched GO terms for upregulated genes in the spleens of CreER and nmrHAS2 female (a) and male mice (b) during aging.
c-d. Enriched GO terms for upregulated genes in the WAT of CreER and nmrHAS2 female (c) and male (d) mice during aging.
e-f. Enriched GO terms for upregulated genes in the muscle of CreER and nmrHAS2 female (e) and male (f) mice during aging.
g-h. Enriched GO terms for upregulated genes in the kidneys of CreER and nmrHAS2 females (g) and males (h) during aging.
i-j. Enriched GO terms for upregulated genes in the livers of old male (i) and female (j) nmrHAS2 mice
Extended Data Figure 6. Mean plasma concentrations of 36 inflammatory cytokines in nmrHAS2 and CreER male mice.
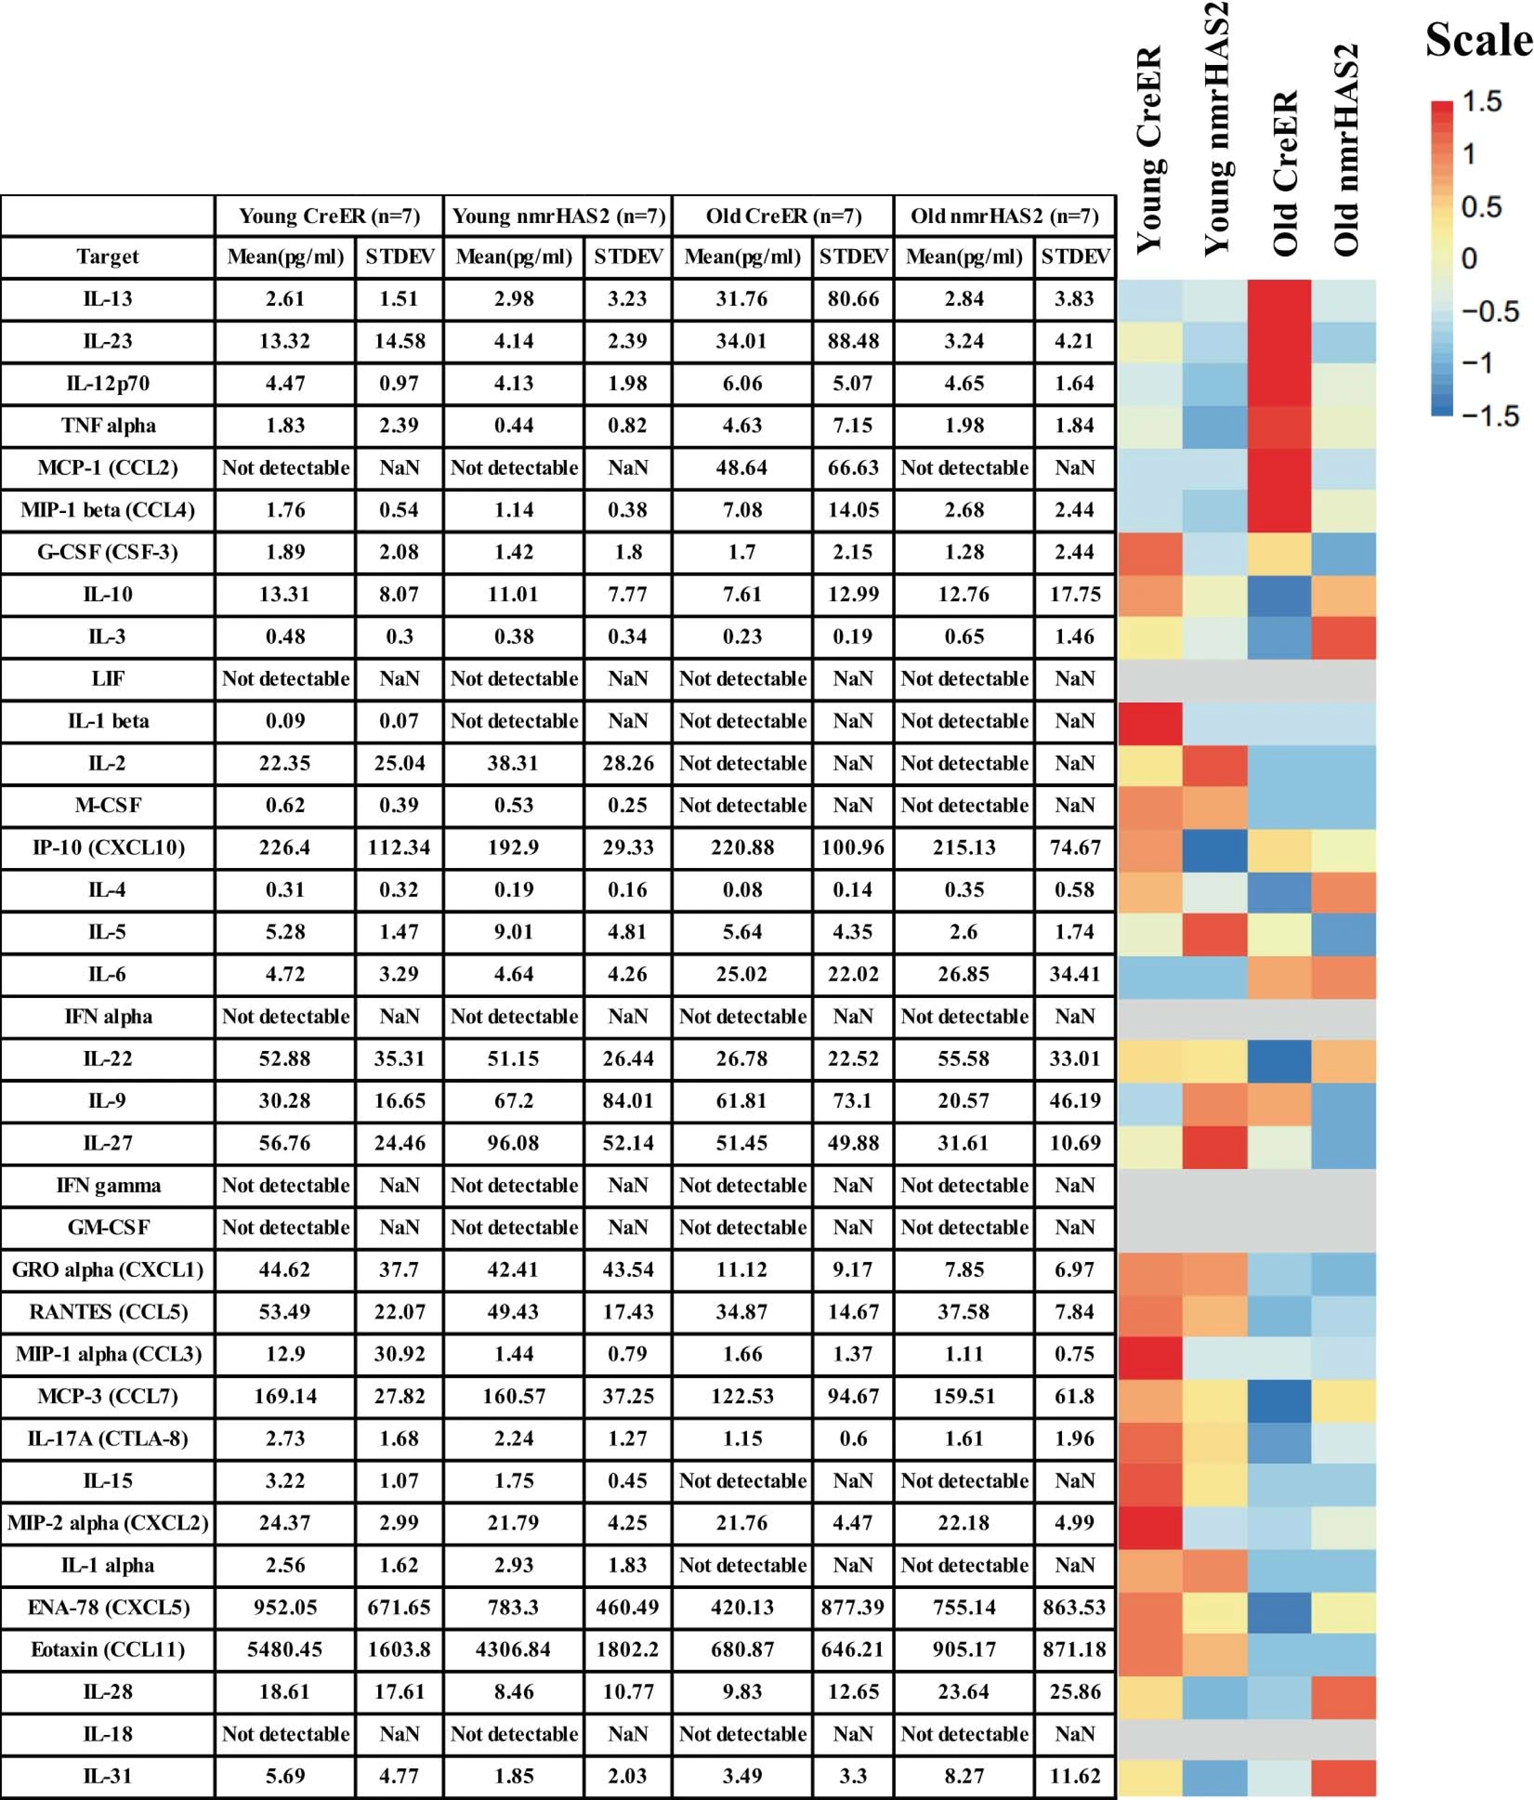
Mean plasma concentrations of 36 inflammatory cytokines and chemokines of young (5-months) and old (24-months) male mice. The heatmap is presented alongside the value chart. In the heatmap, the levels of each target were scale automatically using R.
Extended Data Figure 7. Mean plasma concentrations of 36 inflammatory cytokines in nmrHAS2 and CreER female mice.
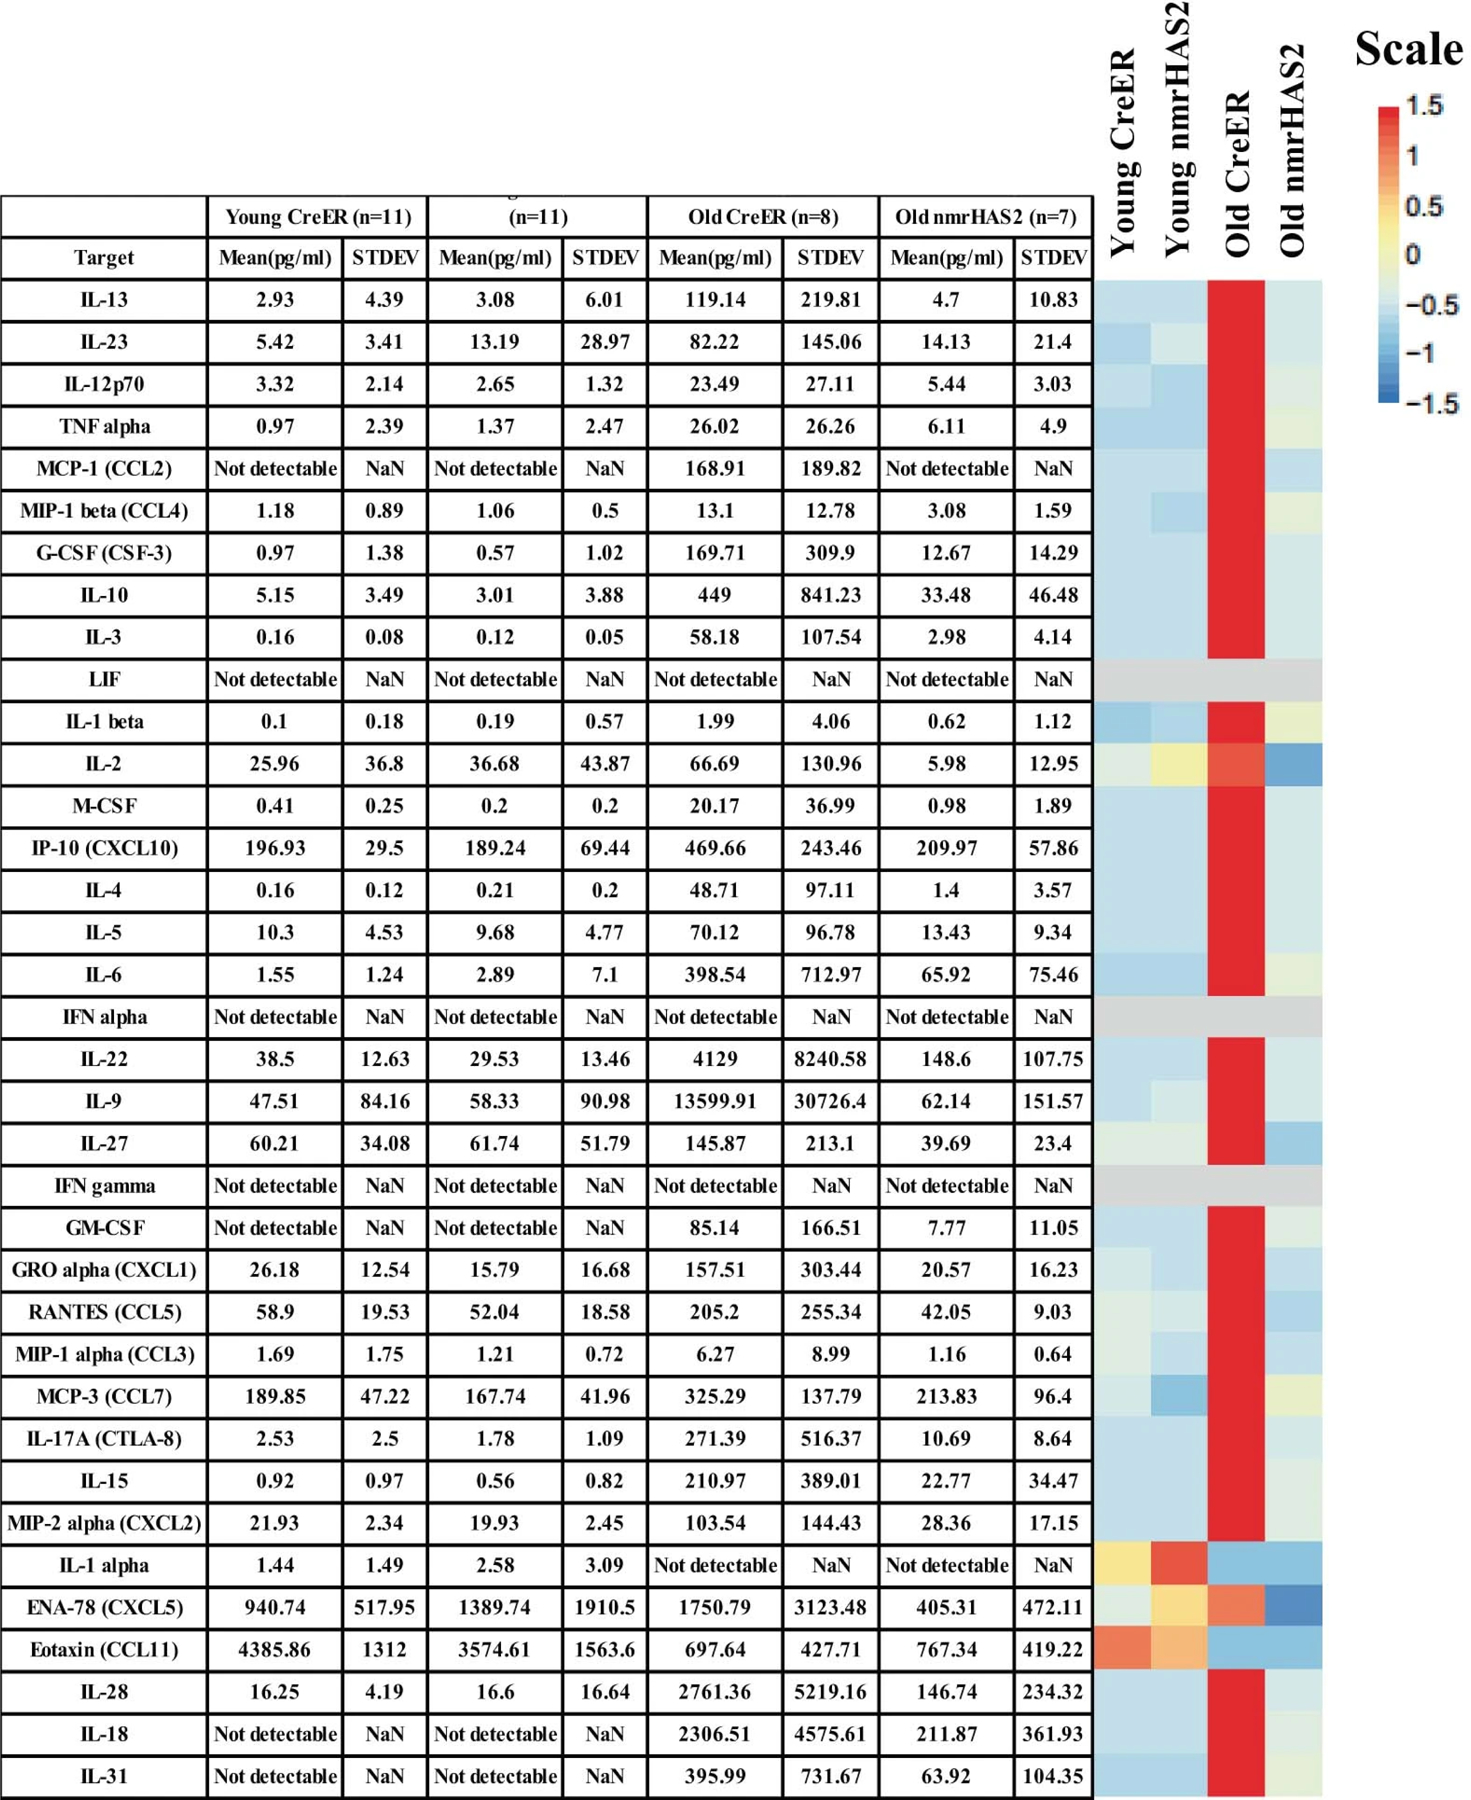
The mean plasma concentrations of 36 inflammatory cytokines and chemokines in young (5-months) and old (24-months) female mice. The heatmap is presented alongside the value chart. In the heatmap, the levels of each target were scaled automatically using R.
Extended Data Fig. 8. nmrHAS2 reduces pro-inflammatory response in vitro.
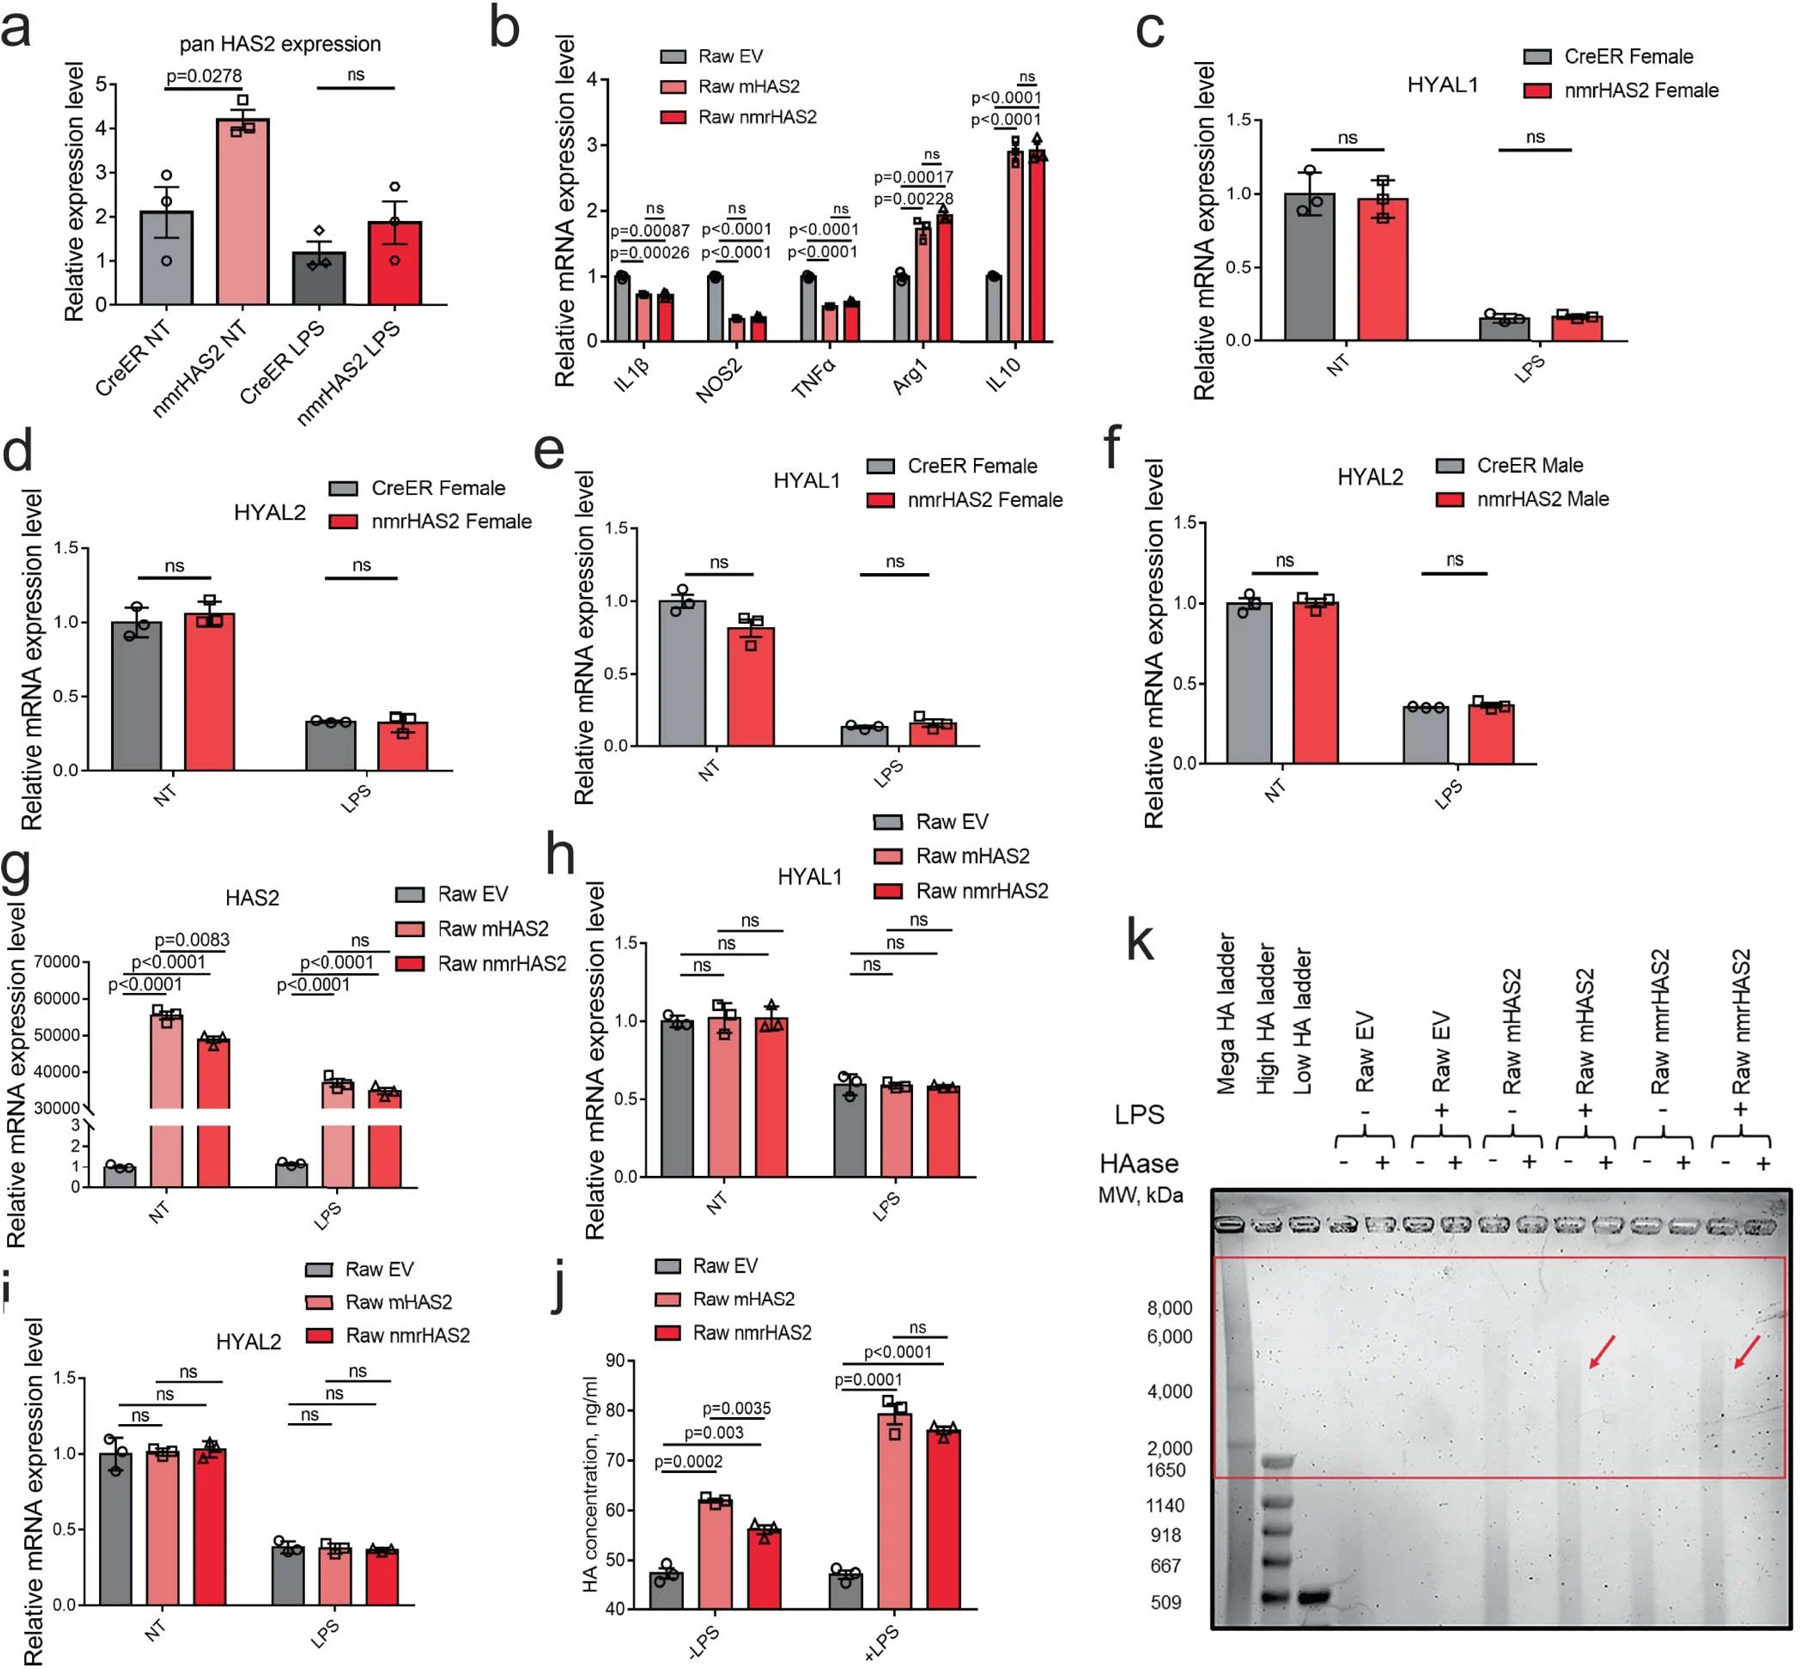
a. BMDM from nmrHAS2 mice have significantly upregulated HAS2 levels. BMDM were isolated from 5-months old female mice (n=3).
b. Raw264.7 cells overexpressing mHAS2 or nmrHAS2 show lower levels of pro-inflammatory cytokines and higher levels of anti-inflammatory cytokines. Data was normalized to Raw EV. n=3.
c. HYAL1 levels decrease after LPS treatment in BMDM from female mice. Normalization to CreER NT. n=3.
d. HYAL2 levels decrease after LPS treatment in BMDM from female mice. Normalization to CreER NT. n=3.
e. HYAL1 levels decrease after LPS treatment in BMDM from male mice. Normalization to CreER NT. n=3.
f. HYAL2 levels decrease after LPS treatment in BMDM from male mice. Normalization to CreER NT. n=3.
g. HAS2 levels decrease in LPS treated HAS2 expressing Raw264.7 cells. Normalization to Raw EV NT. n=3.
h. HYAL1 levels decrease after LPS treatment in HAS2 expressing Raw264.7 cells. Normalization to Raw EV NT. n=3.
i. HYAL2 levels decrease after LPS treatment in HAS2 expressing Raw264.7 cells. Normalization to Raw EV NT. n=3.
j. Raw264.7 cells overexpressing HAS2 produce more HA. HA ELISA was used to quantify the HA level in the media. n=3.
k. Raw264.7 cells overexpressing HAS2 produce more HMW-HA in the media after LPS treatment. Red square indicates the HMW-HA. Experiments were repeated for three times and showed a similar result.
a-j. p values were calculated by two-tailed unpaired Student’s t-test (p values are indicated in the graphs). Bars represent the means, error bar displays the standard error, dots represent biological replicates. Adjustments were made for multiple comparisons.
Extended Data Fig. 9. nmrHAS2 reduces pro-inflammatory response in vivo and protects cells from oxidative stress.
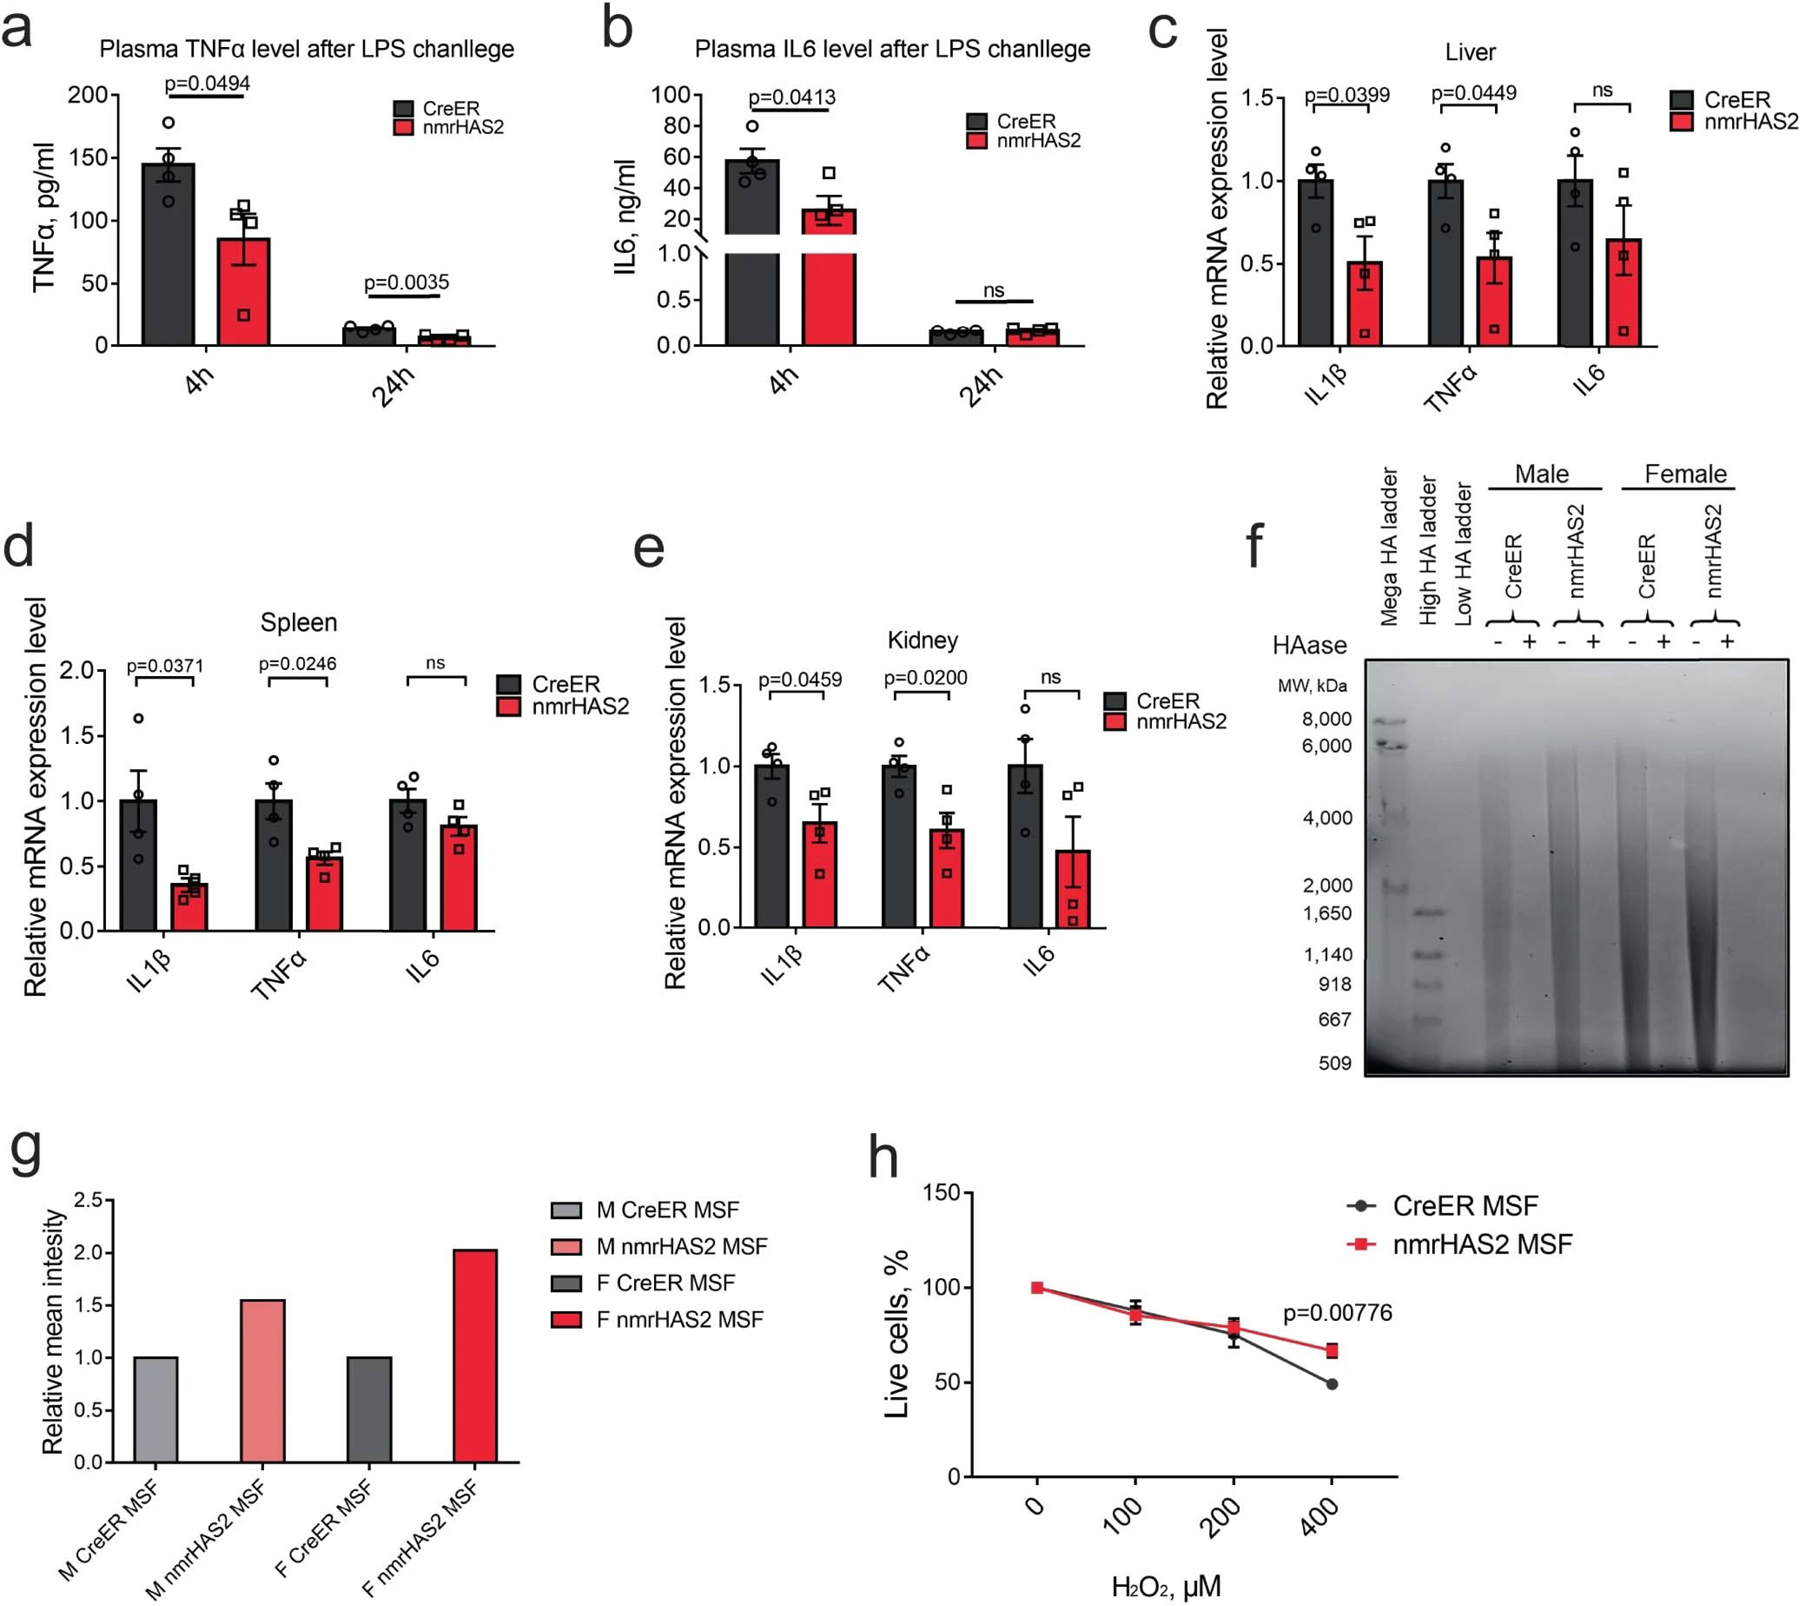
a. nmrHAS2 mice produce significantly lower plasma TNFα levels 4 h and 24 h after LPS challenge in 5-months old female mice (n=4).
b. nmrHAS2 mice produce significantly lower plasma IL6 levels 4 h after LPS challenge in 5- months old female mice (n=4).
c. nmrHAS2 mice show lower IL1β and TNFα levels in liver 24 h post LPS challenge in 5-months old female mice (n=4).
d. nmrHAS2 mice show lower IL1β and TNFα levels in the spleen 24 h post LPS challenge in 5- months old female mice (n=4).
e. nmrHAS2 mice show lower IL1β and TNFα levels in kidney 24 h post LPS challenge in 5- months old female mice (n=4).
f. Pulse field gel shows nmrHAS2 skin fibroblasts produce more hyaluronic acid. compared to CreER fibroblasts. HAase treated samples were run in parallel to confirm the specificity of HA staining. Media from three different cell lines was pooled for HA extraction. Experiments were repeated for three times and showed a similar result.
g. Levels of relative on gel HA intensity. The intensity of HA was quantified using ImageJ. Intensity of nmrHAS2 group was normalized to the CreER group.
h. Skin fibroblasts isolated from nmrHAS2 mice are more resistant to H2O2 treatment. Fibroblasts were isolated from 5-months old female mice (n=4). p-values were calculated using unpaired two-tailed t-test.
a-e. p values were calculated by two-tailed unpaired t-test. Bars represent the means, error bars show the standard errors, dots represent biological replicates.
Extended Data Fig. 10. Overexpression of mouse or nmrHAS2 protects cells from oxidative stress.
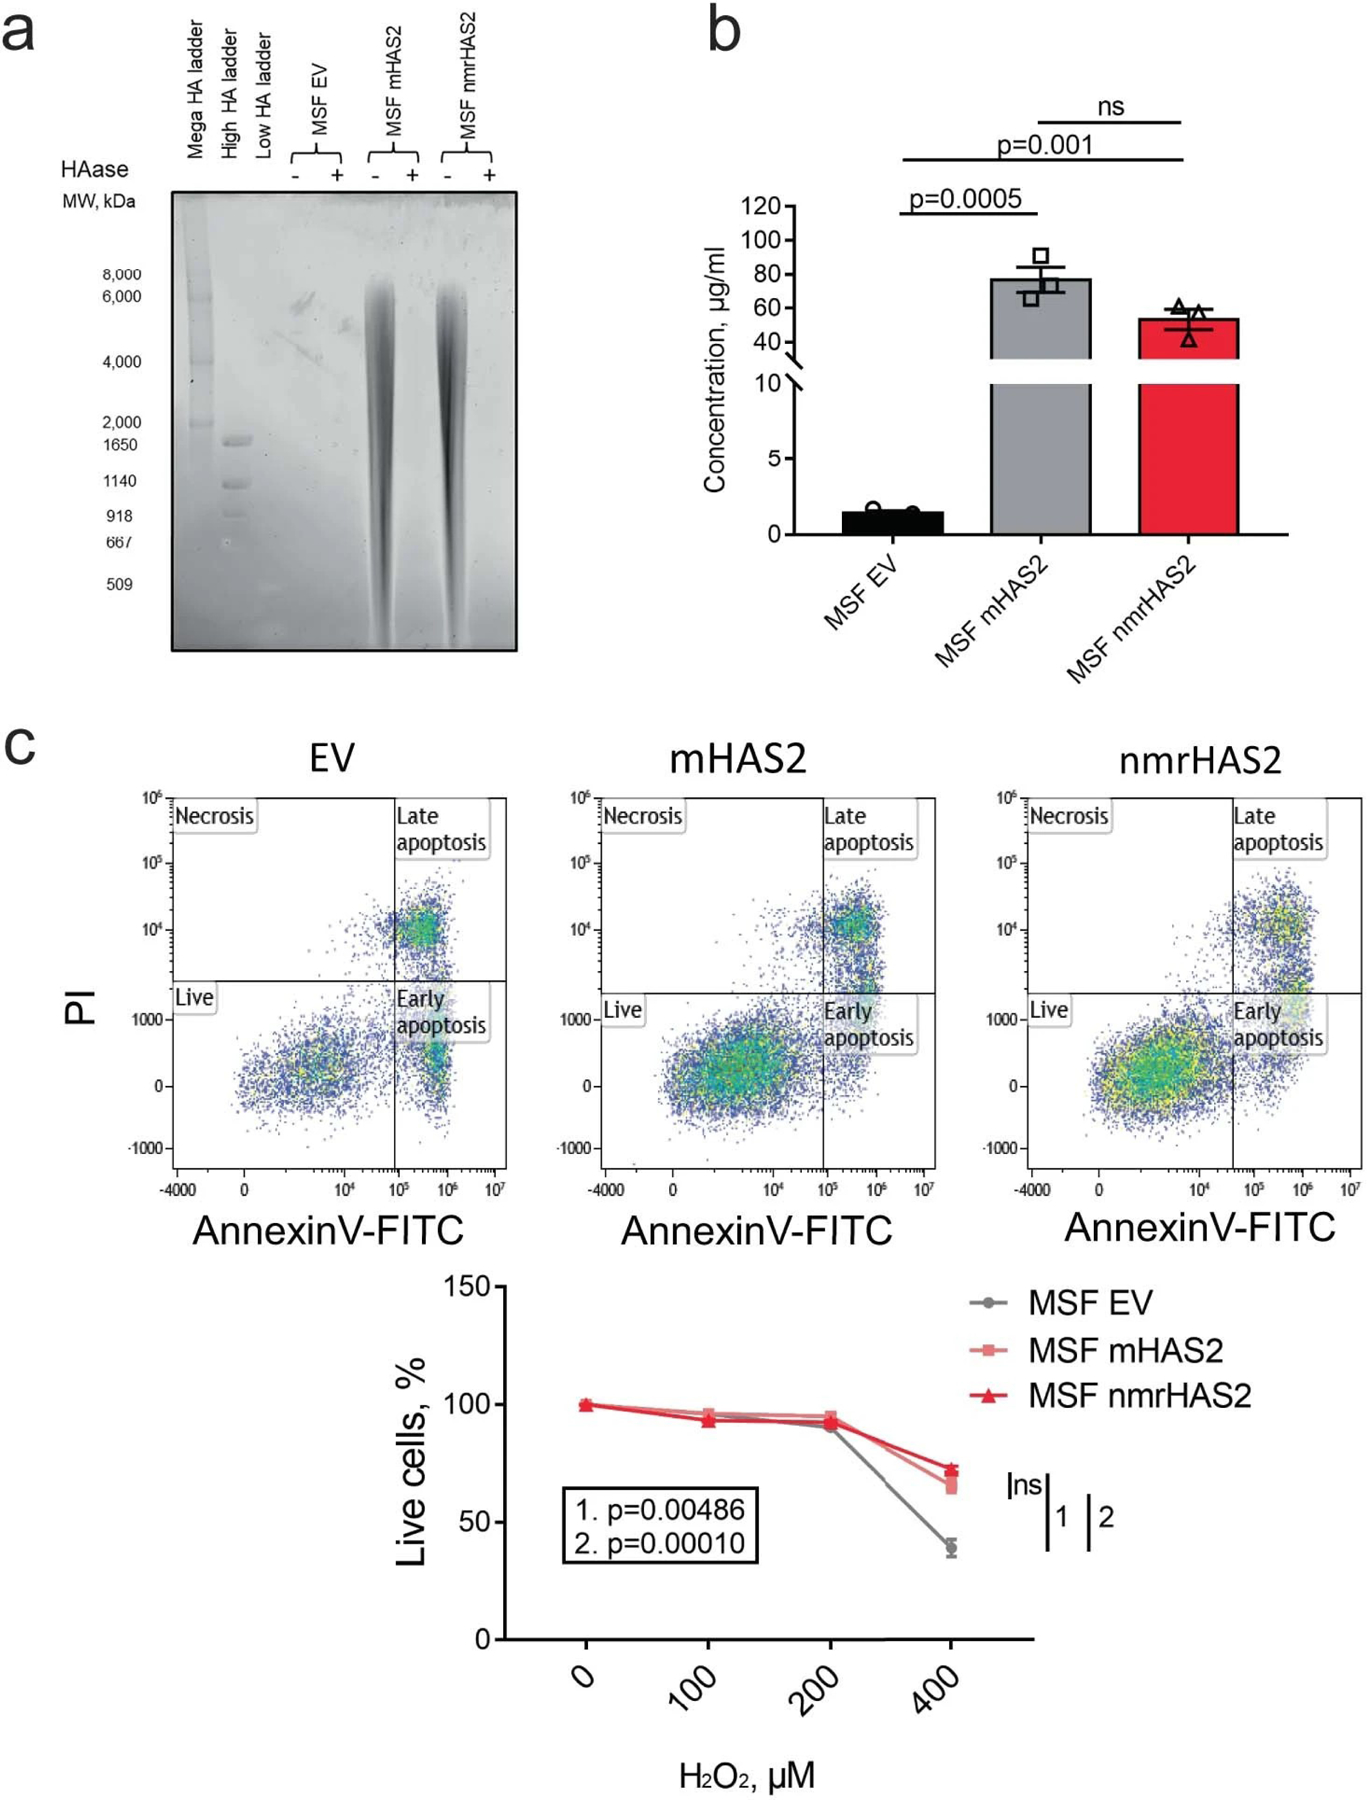
a. Pulse field gel shows that mouse skin fibroblasts (MSF) overexpressing mouse HAS2 (mHAS2) or nmrHAS2 produce more hyaluronic acid compared to fibroblasts transfected with empty vector (EV). HAase-treated samples were run in parallel to confirm the specificity of HA staining. Media from three different cell lines was pooled for HA extraction.
b. HA ELISA shows that mouse skin fibroblasts (MSF) overexpressing mHAS2 or nmrHAS2 produce more hyaluronic acid compared to fibroblasts transfected with empty vector (EV). p-values were calculated using unpaired two-tailed t-test, bars represent the means, error bars show standard errors, dots represent technical replicates.
c. Mouse skin fibroblasts overexpressing mHAS2 or nmrHAS2 are more resistant to H2O2 treatment. p-values were calculated using unpaired two-tailed t-test, error bars show standard errors, dots represent technical replicates.
Extended Data Figure 11. Old nmrHAS2 mice differ from age matched CreER controls in their gut microbiome composition.
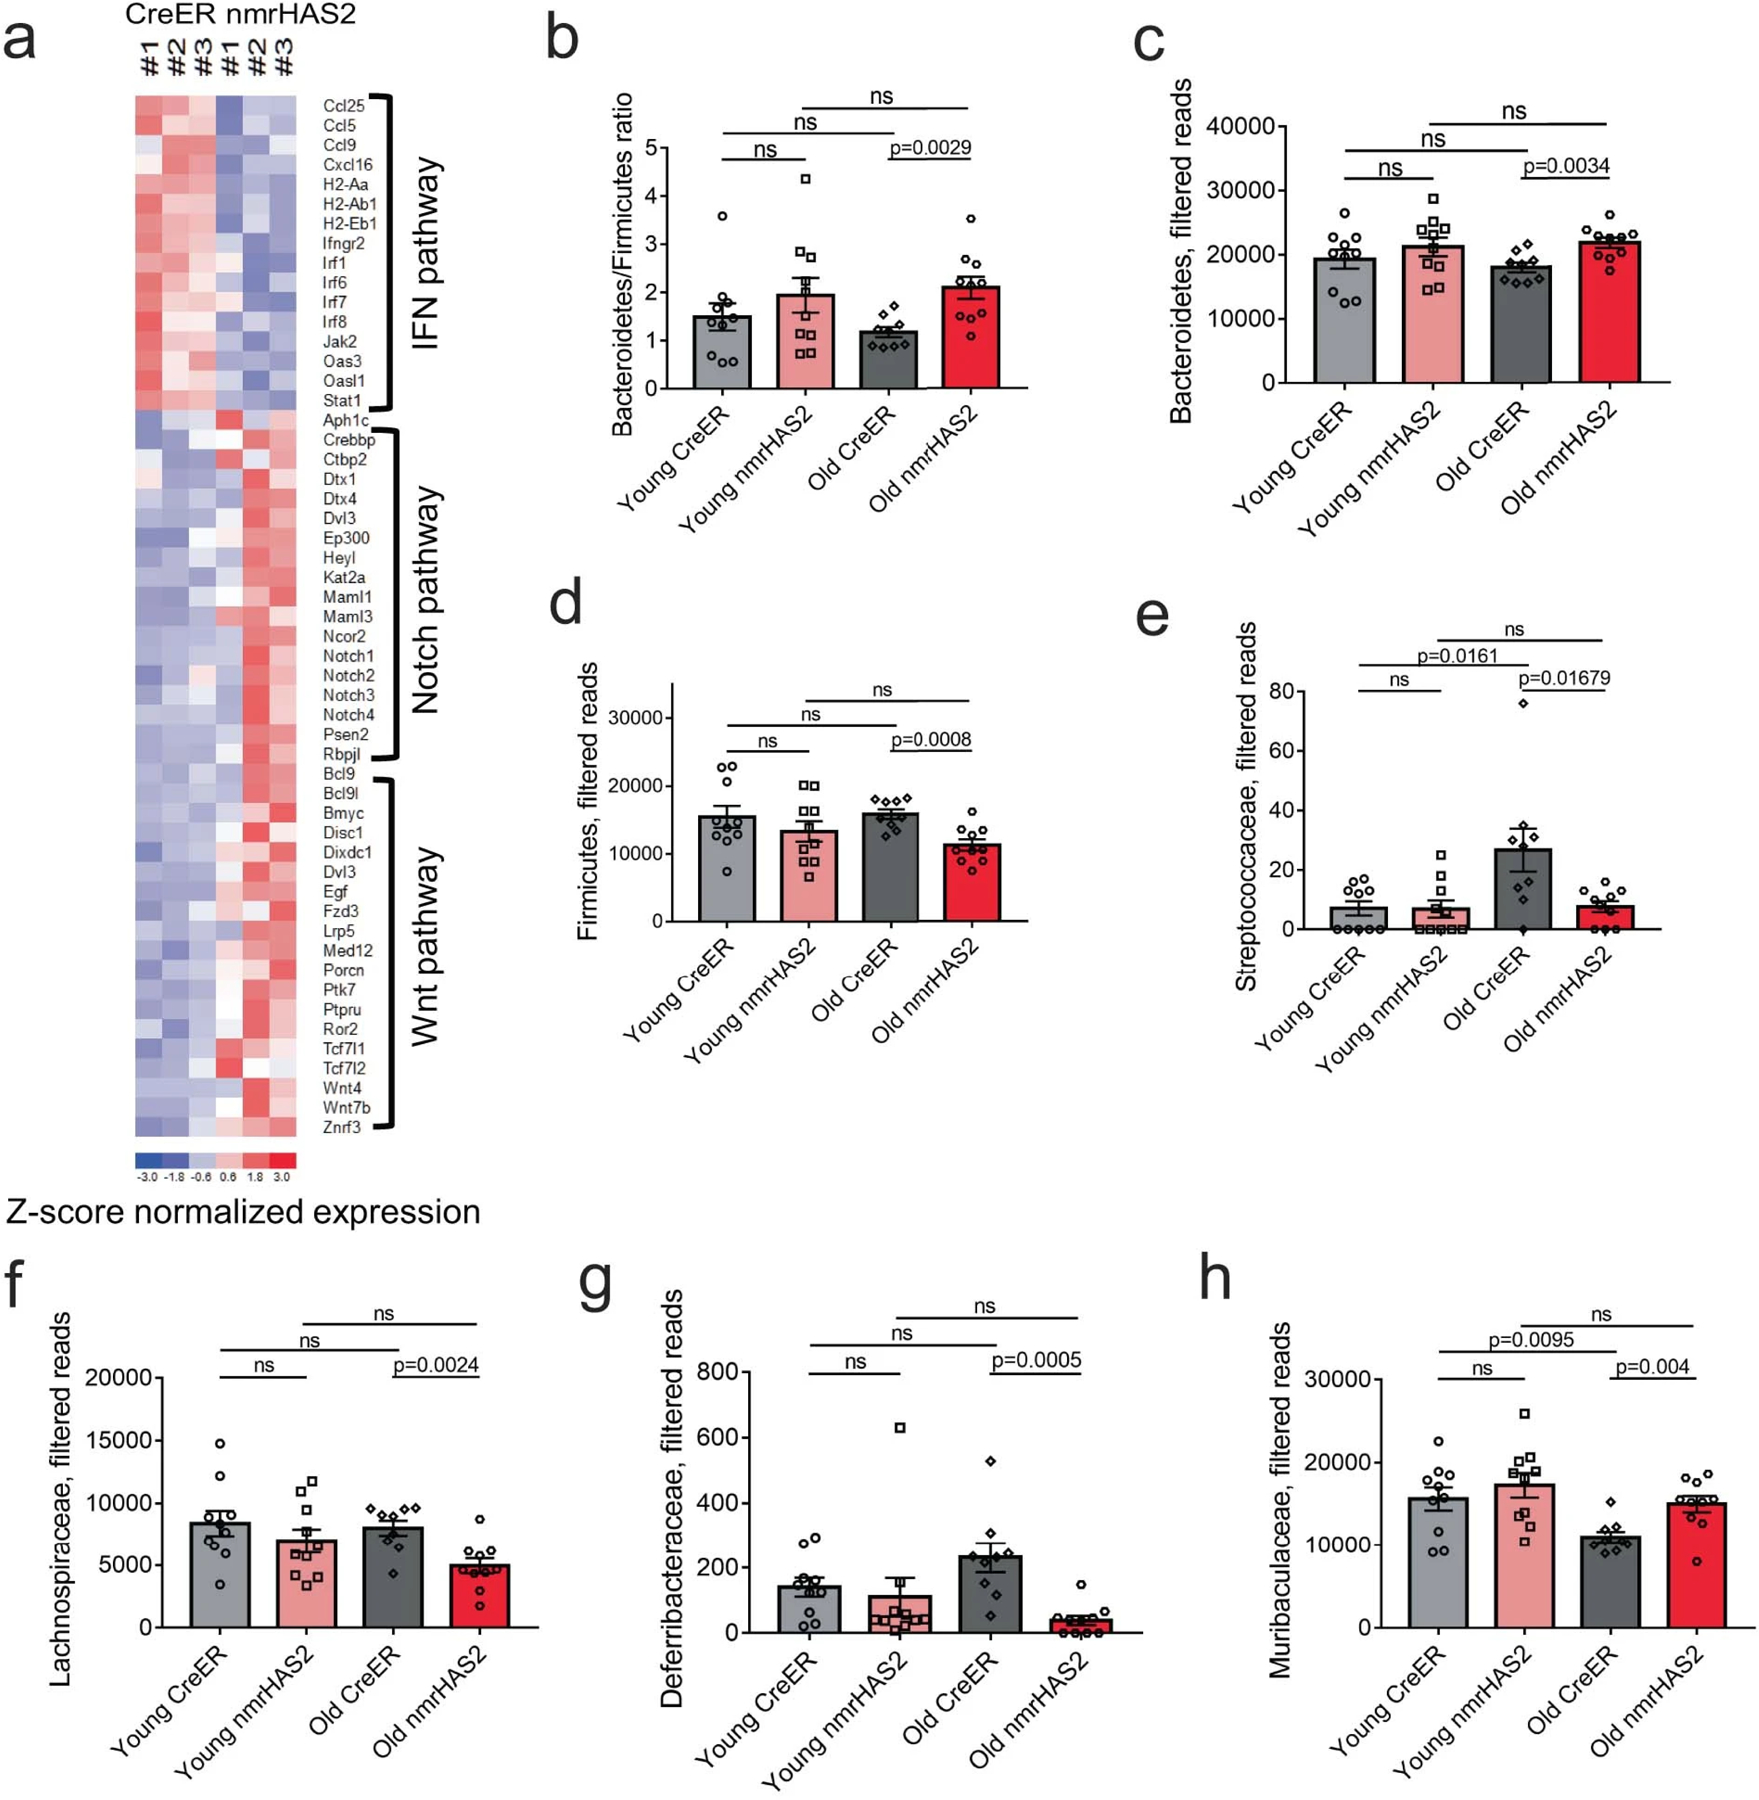
a. Heatmap of genes involve in IFN, WNT, and Notch pathways.
b.16s rRNA sequencing shows old nmrHAS2 mice (n=9) have a higher B/F ratio compared to age-matched controls (n=10). Pooled females and males.
c. 16s rRNA sequencing shows that at the phylum level old nmrHAS2 mice (n=9) have more abundant Bacteroidetes and less abundant Firmicutes compared to age-matched controls (n=10). 7- and 24-month-old mice were used. Pooled females and males.
d. 16s rRNA sequencing shows that at family level, old nmrHAS2 mice (n=9) have less abundant pro-inflammatory Streptococcaceae, Lachnospiraceae, and Deferribacteraceae compared to age-matched controls (n=10). 7- and 24-month-old mice were used. Pooled females and males.
e. 16s rRNA sequencing shows that at family level, old nmrHAS2 mice (n=9) have more Muribaculaceae compared to the age-matched controls (n=10). Pooled females and males.
b-e. p-values were calculated by two-tailed unpaired t-test (p-values are indicated in the graphs). Bars represent the means, error bars show standard errors, dots represent biological replicates. Adjustments were made for multiple comparisons.
Extended Data Table 1.
nmrHAS2 mRNA level in different organs
| Tissue | Gender | Log2(nmrHAS2/CreER) | p value |
|---|---|---|---|
| Liver | Female | 7.7 | 2E-09 |
| Muscle | Female | 9.5 | 2E-136 |
| Spleen | Female | 3.9 | 3E-38 |
| WAT | Female | 1.8 | 3E-04 |
| Kidney | Female | 10.6 | 1.77E-15 |
| Intestine | Female | 5.7 | 9E-54 |
| Liver | Male | Not detectable | N/A |
| Muscle | Male | 8.7 | 1E-17 |
| Spleen | Male | 3.0 | 4E-05 |
| WAT | Male | 3.2 | 3E-08 |
| Kidney | Male | 10.4 | 8.02E-08 |
| Intestine | Male | 5.1 | 2E-22 |
Extended Data Table 2.
correlation functions signatures Spearman Padjusted values
| Interventions: Median lifespan | Interventions: Max lifespan | Interventions: CR | Interventions: GH deficiency | Interventions: Rapamycin | Aging: Brain | Aging: Liver | Aging: Human | Aging: Rat | Aging: Mouse | Aging: Kidney | nmrHAS2: Female | nmrHAS2: Male | |
|---|---|---|---|---|---|---|---|---|---|---|---|---|---|
| Interventions: Median lifespan | 0 | 0 | 9.13E-204 | 1.85E-199 | 0.036999 | 0.002766 | 1.28E-41 | 2.85E-22 | 8.19E-34 | 7.94E-28 | 3.62E-31 | 1.33E-25 | 1.36E-81 |
| Interventions: Max lifespan | 0 | 0 | 7.08E-222 | 4.12E-79 | 1.26E-57 | 1.15E-52 | 1.68E-178 | 2.04E-46 | 1.63E-92 | 7.58E-160 | 1.03E-122 | 3.74E-85 | 9.57E-113 |
| Interventions: CR | 2.13E-204 | 1.36E-222 | 0 | 5.75E-42 | 9.34E-18 | 1.41E-10 | 5.89E-26 | 9.50E-08 | 9.74E-97 | 4.34E-12 | 6.67E-45 | 3.86E-92 | 2.87E-76 |
| Interventions: GH deficiency | 4.47E-200 | 2.09E-79 | 3.64E-42 | 0 | 6.09E-14 | 3.62E-14 | 0.038717 | 0.951229 | 0.678059 | 0.412574 | 0.073541 | 1.40E-26 | 0.328249 |
| Interventions: Rapamycin | 0.033299 | 7.33E-58 | 6.93E-18 | 4.67E-14 | 0 | 5.32E-75 | 4.02E-107 | 4.98E-13 | 4.40E-62 | 1.71E-109 | 6.39E-84 | 3.34E-112 | 6.98E-23 |
| Aging: Brain | 0.002351 | 6.90E-53 | 1.13E-10 | 2.74E-14 | 2.80E-75 | 0 | 1.03E-212 | 8.94E-256 | 1.42E-197 | 3.08E-271 | 2.39E-227 | 3.19E-86 | 1.80E-22 |
| Aging: Liver | 8.21E-42 | 4.47E-179 | 4.08E-26 | 0.035168 | 1.58E-107 | 2.23E-213 | 0 | 3.83E-66 | 0 | 0 | 0 | 5.65E-259 | 4.89E-189 |
| Aging: Human | 2.07E-22 | 1.24E-46 | 8.00E-08 | 0.945147 | 3.86E-13 | 1.49E-256 | 2.11E-66 | 0 | 2.47E-21 | 1.60E-68 | 7.24E-66 | 6.54E-41 | 6.31E-68 |
| Aging: Rat | 5.39E-34 | 7.19E-93 | 4.06E-97 | 0.661107 | 2.53E-62 | 3.55E-198 | 0 | 1.81E-21 | 0 | 2.71E-274 | 0 | 2.13E-209 | 2.42E-123 |
| Aging: Mouse | 5.36E-28 | 2.15E-160 | 3.40E-12 | 0.395383 | 6.41E-110 | 4.36E-272 | 0 | 8.55E-69 | 3.62E-275 | 0 | 0 | 9.21E-216 | 1.08E-145 |
| Aging: Kidney | 2.41E-31 | 3.44E-123 | 4.11E-45 | 0.067412 | 3.14E-84 | 4.18E-228 | 0 | 4.04E-66 | 0 | 0 | 0 | 1.96809782313729e-310 | 2.85E-224 |
| nmrHAS2: Female | 9.33E-26 | 1.78E-85 | 1.74E-92 | 9.55E-27 | 1.22E-112 | 1.46E-86 | 8.95E-260 | 4.25E-41 | 4.79E-210 | 1.92E-216 | 1.96809782313729e-311 | 0 | 0 |
| nmrHAS2: Male | 6.81E-82 | 3.43E-113 | 1.48E-76 | 0.311837 | 4.94E-23 | 1.29E-22 | 1.26E-189 | 3.42E-68 | 7.86E-124 | 3.34E-146 | 5.23E-225 | 0 | 0 |
Supplementary Material
Acknowledgements
This work was supported by grants from the National Institutes of Health to V.N.G., A.S. and V.G.
Footnotes
Competing interests
The authors declare no competing interests.
Data availability
The RNA-Seq data, epigenetic clock data, and 16S rDNA sequencing data produced in this paper have been deposited in the Gene Expression Omnibus (GSE234563, GSE234154, GSE234286).
References
- 1.Seluanov A et al. Hypersensitivity to contact inhibition provides a clue to cancer resistance of naked mole-rat. Proceedings of the National Academy of Sciences 106, 19352–19357 (2009). [DOI] [PMC free article] [PubMed] [Google Scholar]
- 2.Tian X et al. High-molecular-mass hyaluronan mediates the cancer resistance of the naked mole rat. Nature 499, 346–349 (2013). [DOI] [PMC free article] [PubMed] [Google Scholar]
- 3.Lewis KN & Buffenstein R in Handbook of the Biology of Aging 179–204 (Elsevier, 2016). [Google Scholar]
- 4.Buffenstein R Negligible senescence in the longest living rodent, the naked mole-rat: insights from a successfully aging species. Journal of Comparative Physiology B 178, 439–445 (2008). [DOI] [PubMed] [Google Scholar]
- 5.O’Connor TP, Lee A, Jarvis JU & Buffenstein R Prolonged longevity in naked mole-rats: age-related changes in metabolism, body composition and gastrointestinal function. Comparative Biochemistry and Physiology Part A: Molecular & Integrative Physiology 133, 835–842 (2002). [DOI] [PubMed] [Google Scholar]
- 6.Weissmann B & Meyer K The structure of hyalobiuronic acid and of hyaluronic acid from umbilical Cord1, 2. Journal of the american chemical society 76, 1753–1757 (1954). [Google Scholar]
- 7.Fennouri A et al. Single molecule detection of glycosaminoglycan hyaluronic acid oligosaccharides and depolymerization enzyme activity using a protein nanopore. ACS nano 6, 9672–9678 (2012). [DOI] [PubMed] [Google Scholar]
- 8.Jiang D, Liang J & Noble PW Hyaluronan as an immune regulator in human diseases. Physiological reviews 91, 221–264 (2011). [DOI] [PMC free article] [PubMed] [Google Scholar]
- 9.Cyphert JM, Trempus CS & Garantziotis S Size matters: molecular weight specificity of hyaluronan effects in cell biology. International journal of cell biology 2015 (2015). [DOI] [PMC free article] [PubMed] [Google Scholar]
- 10.Wu M et al. A novel role of low molecular weight hyaluronan in breast cancer metastasis. The FASEB Journal 29, 1290–1298 (2015). [DOI] [PubMed] [Google Scholar]
- 11.Zhang G et al. Colorectal cancer‐associated~ á6ákDa hyaluronan serves as a novel biomarker for cancer progression and metastasis. The FEBS Journal 286, 3148–3163 (2019). [DOI] [PubMed] [Google Scholar]
- 12.Ruppert S, Hawn T, Arrigoni A, Wight T & Bollyky P Tissue integrity signals communicated by high-molecular weight hyaluronan and the resolution of inflammation. Immunologic research 58, 186–192 (2014). [DOI] [PMC free article] [PubMed] [Google Scholar]
- 13.Strachan RK, Smith P & Gardner DL Hyaluronate in rheumatology and orthopaedics: is there a role? Annals of the rheumatic diseases 49, 949 (1990). [DOI] [PMC free article] [PubMed] [Google Scholar]
- 14.Muto J, Yamasaki K, Taylor KR & Gallo RL Engagement of CD44 by hyaluronan suppresses TLR4 signaling and the septic response to LPS. Molecular immunology 47, 449–456 (2009). [DOI] [PMC free article] [PubMed] [Google Scholar]
- 15.Šoltés L et al. Degradative action of reactive oxygen species on hyaluronan. Biomacromolecules 7, 659–668 (2006). [DOI] [PubMed] [Google Scholar]
- 16.Takasugi M et al. Naked mole-rat very-high-molecular-mass hyaluronan exhibits superior cytoprotective properties. Nature communications 11, 1–10 (2020). [DOI] [PMC free article] [PubMed] [Google Scholar]
- 17.Garantziotis S & Savani RC Hyaluronan biology: A complex balancing act of structure, function, location and context. Matrix Biology 78, 1–10 (2019). [DOI] [PMC free article] [PubMed] [Google Scholar]
- 18.Ferrucci L & Fabbri E Inflammageing: chronic inflammation in ageing, cardiovascular disease, and frailty. Nature Reviews Cardiology 15, 505–522 (2018). [DOI] [PMC free article] [PubMed] [Google Scholar]
- 19.Franceschi C & Campisi J Chronic inflammation (inflammaging) and its potential contribution to age-associated diseases. Journals of Gerontology Series A: Biomedical Sciences and Medical Sciences 69, S4–S9 (2014). [DOI] [PubMed] [Google Scholar]
- 20.Fraser J & Laurent T in Ciba Foundation Symposium 143‐The Biology of Hyaluronan: The Biology of Hyaluronan: Ciba Foundation Symposium 143 41–59 (Wiley Online Library; ). [Google Scholar]
- 21.Ward JM Lymphomas and leukemias in mice. Experimental and Toxicologic Pathology 57, 377–381 (2006). [DOI] [PubMed] [Google Scholar]
- 22.Horvath S et al. DNA methylation clocks tick in naked mole rats but queens age more slowly than nonbreeders. Nature Aging 2, 46–59 (2022). [DOI] [PMC free article] [PubMed] [Google Scholar]
- 23.Arneson A et al. A mammalian methylation array for profiling methylation levels at conserved sequences. Biorxiv (2021). [DOI] [PMC free article] [PubMed] [Google Scholar]
- 24.Mozhui K et al. Genetic loci and metabolic states associated with murine epigenetic aging. Elife 11, e75244 (2022). [DOI] [PMC free article] [PubMed] [Google Scholar]
- 25.Whitehead JC et al. A clinical frailty index in aging mice: comparisons with frailty index data in humans. Journals of Gerontology Series A: Biomedical Sciences and Medical Sciences 69, 621–632 (2014). [DOI] [PMC free article] [PubMed] [Google Scholar]
- 26.Shiotsuki H et al. A rotarod test for evaluation of motor skill learning. Journal of neuroscience methods 189, 180–185 (2010). [DOI] [PubMed] [Google Scholar]
- 27.Maddatu TP, Grubb SC, Bult CJ & Bogue MA Mouse phenome database (MPD). Nucleic acids research 40, D887–D894 (2012). [DOI] [PMC free article] [PubMed] [Google Scholar]
- 28.Chen H, Zhou X, Shoumura S, Emura S & Bunai Y Age-and gender-dependent changes in three-dimensional microstructure of cortical and trabecular bone at the human femoral neck. Osteoporosis international 21, 627–636 (2010). [DOI] [PubMed] [Google Scholar]
- 29.Tyshkovskiy A et al. Identification and application of gene expression signatures associated with lifespan extension. Cell metabolism 30, 573–593. e578 (2019). [DOI] [PMC free article] [PubMed] [Google Scholar]
- 30.Tyshkovskiy A et al. Distinct longevity mechanisms across and within species and their association with aging. Cell (2023). [DOI] [PMC free article] [PubMed] [Google Scholar]
- 31.Schaum N et al. Ageing hallmarks exhibit organ-specific temporal signatures. Nature 583, 596–602 (2020). [DOI] [PMC free article] [PubMed] [Google Scholar]
- 32.Lu JY et al. Comparative transcriptomics reveals circadian and pluripotency networks as two pillars of longevity regulation. Cell Metabolism (2022). [DOI] [PMC free article] [PubMed] [Google Scholar]
- 33.Gubbels Bupp MR, Potluri T, Fink AL & Klein SL The confluence of sex hormones and aging on immunity. Frontiers in immunology, 1269 (2018). [DOI] [PMC free article] [PubMed] [Google Scholar]
- 34.Litwiniuk M, Krejner A, Speyrer MS, Gauto AR & Grzela T Hyaluronic acid in inflammation and tissue regeneration. Wounds 28, 78–88 (2016). [PubMed] [Google Scholar]
- 35.Rayahin JE, Buhrman JS, Zhang Y, Koh TJ & Gemeinhart RA High and low molecular weight hyaluronic acid differentially influence macrophage activation. ACS biomaterials science & engineering 1, 481–493 (2015). [DOI] [PMC free article] [PubMed] [Google Scholar]
- 36.Biragyn A & Ferrucci L Gut dysbiosis: a potential link between increased cancer risk in ageing and inflammaging. The Lancet Oncology 19, e295–e304 (2018). [DOI] [PMC free article] [PubMed] [Google Scholar]
- 37.Thevaranjan N et al. Age-associated microbial dysbiosis promotes intestinal permeability, systemic inflammation, and macrophage dysfunction. Cell host & microbe 21, 455–466. e454 (2017). [DOI] [PMC free article] [PubMed] [Google Scholar]
- 38.Sovran B et al. Age-associated impairment of the mucus barrier function is associated with profound changes in microbiota and immunity. Scientific reports 9, 1–13 (2019). [DOI] [PMC free article] [PubMed] [Google Scholar]
- 39.Bevins CL & Salzman NH Paneth cells, antimicrobial peptides and maintenance of intestinal homeostasis. Nature Reviews Microbiology 9, 356–368 (2011). [DOI] [PubMed] [Google Scholar]
- 40.Moorefield EC et al. Aging effects on intestinal homeostasis associated with expansion and dysfunction of intestinal epithelial stem cells. Aging (Albany NY) 9, 1898 (2017). [DOI] [PMC free article] [PubMed] [Google Scholar]
- 41.Funk MC, Zhou J & Boutros M Ageing, metabolism and the intestine. EMBO reports 21, e50047 (2020). [DOI] [PMC free article] [PubMed] [Google Scholar]
- 42.DeJong EN, Surette MG & Bowdish DM The gut microbiota and unhealthy aging: disentangling cause from consequence. Cell Host & Microbe 28, 180–189 (2020). [DOI] [PubMed] [Google Scholar]
- 43.Yang T et al. Gut dysbiosis is linked to hypertension. hypertension 65, 1331–1340 (2015). [DOI] [PMC free article] [PubMed] [Google Scholar]
- 44.Ley RE, Turnbaugh PJ, Klein S & Gordon JI Human gut microbes associated with obesity. nature 444, 1022–1023 (2006). [DOI] [PubMed] [Google Scholar]
- 45.Sibai M et al. Microbiome and longevity: high abundance of longevity-linked Muribaculaceae in the gut of the long-living rodent spalax leucodon. OMICS: A Journal of Integrative Biology 24, 592–601 (2020). [DOI] [PubMed] [Google Scholar]
Methods references
- 46.Tung VW, Burton TJ, Dababneh E, Quail SL & Camp AJ Behavioral assessment of the aging mouse vestibular system. Journal of visualized experiments: JoVE (2014). [DOI] [PMC free article] [PubMed] [Google Scholar]
- 47.Whitehead JC et al. A clinical frailty index in aging mice: comparisons with frailty index data in humans. Journals of Gerontology Series A: Biomedical Sciences and Medical Sciences 69, 621–632 (2014). [DOI] [PMC free article] [PubMed] [Google Scholar]
- 48.Zhou W, Triche TJ Jr, Laird PW & Shen H SeSAMe: reducing artifactual detection of DNA methylation by Infinium BeadChips in genomic deletions. Nucleic acids research 46, e123-e123 (2018). [DOI] [PMC free article] [PubMed] [Google Scholar]
- 49.Mozhui K et al. Genetic loci and metabolic states associated with murine epigenetic aging. Elife 11, e75244 (2022). [DOI] [PMC free article] [PubMed] [Google Scholar]
- 50.Patro R, Duggal G, Love MI, Irizarry RA & Kingsford C Salmon provides fast and bias-aware quantification of transcript expression. Nature methods 14, 417–419 (2017). [DOI] [PMC free article] [PubMed] [Google Scholar]
- 51.Frankish A et al. GENCODE reference annotation for the human and mouse genomes. Nucleic acids research 47, D766–D773 (2019). [DOI] [PMC free article] [PubMed] [Google Scholar]
- 52.Anders S & Huber W Differential expression analysis for sequence count data. Nature Precedings, 1–1 (2010). [DOI] [PMC free article] [PubMed] [Google Scholar]
- 53.Subramanian A et al. Gene set enrichment analysis: a knowledge-based approach for interpreting genome-wide expression profiles. Proceedings of the National Academy of Sciences 102, 15545–15550 (2005). [DOI] [PMC free article] [PubMed] [Google Scholar]
- 54.Wu T et al. clusterProfiler 4.0: A universal enrichment tool for interpreting omics data. The Innovation 2, 100141 (2021). [DOI] [PMC free article] [PubMed] [Google Scholar]
- 55.Tyshkovskiy A et al. Identification and application of gene expression signatures associated with lifespan extension. Cell metabolism 30, 573–593. e578 (2019). [DOI] [PMC free article] [PubMed] [Google Scholar]
- 56.Fransen F et al. β2→ 1-fructans modulate the immune system in vivo in a microbiota-dependent and-independent fashion. Frontiers in immunology 8, 154 (2017). [DOI] [PMC free article] [PubMed] [Google Scholar]
- 57.Caporaso JG et al. QIIME allows analysis of high-throughput community sequencing data. Nature methods 7, 335–336 (2010). [DOI] [PMC free article] [PubMed] [Google Scholar]
Associated Data
This section collects any data citations, data availability statements, or supplementary materials included in this article.
Supplementary Materials
Data Availability Statement
The RNA-Seq data, epigenetic clock data, and 16S rDNA sequencing data produced in this paper have been deposited in the Gene Expression Omnibus (GSE234563, GSE234154, GSE234286).


