

Abstract
Background
Ethnic minority groups in upper‐middle‐income and high‐income countries tend to be socioeconomically disadvantaged and to have a higher prevalence of type 2 diabetes than is seen in the majority population.
Objectives
To assess the effectiveness of culturally appropriate health education for people in ethnic minority groups with type 2 diabetes mellitus.
Search methods
A systematic literature search was performed of the following databases: The Cochrane Library, MEDLINE, EMBASE, PsycINFO, the Education Resources Information Center (ERIC) and Google Scholar, as well as reference lists of identified articles. The date of the last search was July 2013 for The Cochrane Library and September 2013 for all other databases. We contacted authors in the field and handsearched commonly encountered journals as well.
Selection criteria
We selected randomised controlled trials (RCTs) of culturally appropriate health education for people over 16 years of age with type 2 diabetes mellitus from named ethnic minority groups residing in upper‐middle‐income or high‐income countries.
Data collection and analysis
Two review authors independently assessed trial quality and extracted data. When disagreements arose regarding selection of papers for inclusion, two additional review authors were consulted for discussion. We contacted study authors to ask for additional information when data appeared to be missing or needed clarification.
Main results
A total of 33 trials (including 11 from the original 2008 review) involving 7453 participants were included in this review, with 28 trials providing suitable data for entry into meta‐analysis. Although the interventions provided in these studies were very different from one study to another (participant numbers, duration of intervention, group versus individual intervention, setting), most of the studies were based on recognisable theoretical models, and we tried to be inclusive in considering the wide variety of available culturally appropriate health education.
Glycaemic control (as measured by glycosylated haemoglobin A1c (HbA1c)) showed improvement following culturally appropriate health education at three months (mean difference (MD) ‐0.4% (95% confidence interval (CI) ‐0.5 to ‐0.2); 14 trials; 1442 participants; high‐quality evidence) and at six months (MD ‐0.5% (95% CI ‐0.7 to ‐0.4); 14 trials; 1972 participants; high‐quality evidence) post intervention compared with control groups who received 'usual care'. This control was sustained to a lesser extent at 12 months (MD ‐0.2% (95% CI ‐0.3 to ‐0.04); 9 trials; 1936 participants) and at 24 months (MD ‐0.3% (95% CI ‐0.6 to ‐0.1); 4 trials; 2268 participants; moderate‐quality evidence) post intervention. Neutral effects on health‐related quality of life measures were noted and there was a general lack of reporting of adverse events in most studies — the other two primary outcomes for this review. Knowledge scores showed improvement in the intervention group at three (standardised mean difference (SMD) 0.4 (95% CI 0.1 to 0.6), six (SMD 0.5 (95% CI 0.3 to 0.7)) and 12 months (SMD 0.4 (95% CI 0.1 to 0.6)) post intervention. A reduction in triglycerides of 24 mg/dL (95% CI ‐40 to ‐8) was observed at three months, but this was not sustained at six or 12 months. Neutral effects on total cholesterol, low‐density lipoprotein (LDL) cholesterol or high‐density lipoprotein (HDL) cholesterol were reported at any follow‐up point. Other outcome measures (blood pressure, body mass index, self‐efficacy and empowerment) also showed neutral effects compared with control groups. Data on the secondary outcomes of diabetic complications, mortality and health economics were lacking or were insufficient.
Because of the nature of the intervention, participants and personnel delivering the intervention were rarely blinded, so the risk of performance bias was high. Also, subjective measures were assessed by participants who self‐reported via questionnaires, leading to high bias in subjective outcome assessment.
Authors' conclusions
Culturally appropriate health education has short‐ to medium‐term effects on glycaemic control and on knowledge of diabetes and healthy lifestyles. With this update (six years after the first publication of this review), a greater number of RCTs were reported to be of sufficient quality for inclusion in the review. None of these studies were long‐term trials, and so clinically important long‐term outcomes could not be studied. No studies included an economic analysis. The heterogeneity of the studies made subgroup comparisons difficult to interpret with confidence. Long‐term, standardised, multi‐centre RCTs are needed to compare different types and intensities of culturally appropriate health education within defined ethnic minority groups, as the medium‐term effects could lead to clinically important health outcomes, if sustained.
Plain language summary
Culturally appropriate health education for people in ethnic minority groups with type 2 diabetes mellitus
Review question
Does culturally appropriate diabetes health education lead to better outcomes than 'usual care' for people in ethnic minority groups with type 2 diabetes?
Background
In upper‐middle‐income and high‐income countries, minority ethnic groups often have a higher prevalence of type 2 diabetes mellitus than is seen in the local population. They also tend to come from lower socioeconomic backgrounds, with attendant difficulties in accessing good‐quality health care. In some cases, cultural and communication barriers increase the problems that minority ethnic communities experience when attempting to access good‐quality diabetes health education, which is vital for those who wish to understand diabetes and use available services to gain empowerment and bring about behaviour change toward a healthier lifestyle. In this review, 'culturally appropriate' health education is taken to mean any type of health education that has been specifically tailored to the cultural needs of a target minority group with type 2 diabetes mellitus.
Study characteristics
This updated review found in the world literature 33 randomised controlled trials (RCTs) of culturally appropriate health education on diabetes that met the selection criteria (participants from a defined ethnic minority group living in a upper‐middle‐income or high‐income country, over 16 years of age, diagnosed with type 2 diabetes mellitus and receiving a culturally tailored health education intervention). The median duration of the intervention was six months, and a total of 7453 participants were involved in the studies.
Key results
Culturally appropriate health education improved blood sugar control among participants, compared with those receiving 'usual' care, at three, six, 12 and 24 months after the intervention was provided. Knowledge about diabetes improved, and participants attained healthier lifestyles. No information was available regarding complications of diabetes and death from any cause, and there was a general lack of reporting of adverse effects in most studies. Neutral effects were observed for health‐related quality of life, blood lipids like cholesterol, blood pressure and weight. The costs of educational programmes were rarely analysed. Compared with the first review, performed in 2008 (11 studies), many more published studies were identified in this review (altogether 33 studies), strengthening the original findings that blood sugar control and knowledge of diabetes are improved when culturally appropriate health education is provided to people in ethnic minority groups diagnosed with diabetes. The effects of this improvement are shown in this update as lasting longer — up to 24 months after health education was provided in some trials. However, additional high‐quality standardised RCTs of longer duration are needed, along with full evaluation of costs.
Quality of the evidence
Heterogeneity of the studies, in terms of populations studied, type and duration of health education provided, variety of outcomes measured and differences in timing of assessment, limits interpretation of our findings. Also, risk of bias was judged to be high for many outcomes.
Currentness of evidence
This evidence is up‐to‐date as of September 2013.
Summary of findings
for the main comparison.
| Culturally appropriate health education for type 2 diabetes mellitus in ethnic minority groups | ||||||
|
Population: ethnic minority groups with type 2 diabetes mellitus Settings: primary healthcare centres or hospital clinics Intervention: culturally appropriate health education (education tailored to the cultural or religious beliefs and linguistic skills of the community being approached, taking into account likely literacy skills) Comparison: conventional diabetes education | ||||||
| Outcomes | Culturally appropriate health education | Conventional diabetes education | Relative effect (95% CI) | No. of participants (studies) | Quality of the evidence (GRADE) | Comments |
| Complications of diabetes mellitus | See comment | See comment | Not estimable | See comment | See comment | 2 studies provided limited data on complications (microalbuminuria, new cardiovascular events) |
|
Health‐related quality of life Follow‐up: 3, 6 and 12 months |
See comment | See comment | Not estimable | 224 (3) | ⊕⊕⊝⊝ lowa |
Neutral effects on health‐related quality of life; only 3/7 studies reporting this outcome contained data that could be incorporated into meta‐analysis |
| All‐cause and specific mortality | See comment | See comment | Not estimable | See comment | See comment | Not investigated |
| Adverse events | See comment | See comment | Not estimable | See comment | See comment | There was a general lack of reporting of adverse events in most studies |
| (a) Self‐efficacy and empowerment
Follow‐up: 3, 6 and 12 months (b) Participant satisfaction |
(a) See comment (b) See comment |
(a) See comment (b) See comment |
(a) See comment (b) Not estimable |
(a) 720 (6) at 3 months, 422 (4) at 6 months, 497 (2) at 12 months (b) See comment |
(a) ⊕⊕⊝⊝
lowa (b) See comment |
(a) Statistically significant difference at 6 months (SMD 0.49 (0.18 to 0.80)), but not at 3 and 12 months (b) Two studies had undertaken some form of participant satisfaction assessment but did not provide participant satisfaction scores |
|
HbA1c [%] Follow‐up: 6 and 12 months |
Mean HbA1c ranged across control groups from 7.8% to 12.2% at 6 months and 7.6% to 11.6% at 12 months | Mean HbA1c in the intervention groups was0.5% lower (0.7% to 0.4% lower) at 6 months and 0.2% lower (0.3% to 0.04% lower) at 12 months | ‐ | 1972 (14) at 6 months 1966 (9) at 12 months |
⊕⊕⊕⊕ high | ‐ |
|
Health economics: cost‐effectiveness [QALY] Follow‐up: 6 months |
Intervention vs control resulted in £28,933 per QALY gained | 417 (1) |
⊕⊕⊝⊝ lowb | Five studies provided rough estimates of costs ranging from $250 per participant over 6 weeks to $701 per participant over 2 years | ||
| *The basis for the assumed risk (e.g. median control group risk across studies) is provided in footnotes. The corresponding risk (and its 95% confidence interval) is based on the assumed risk in the comparison group and the relative effect of the intervention (and its 95% CI). CI: confidence interval; QALY: quality‐adjusted life years; RR: risk ratio; SMD: standardised mean difference. | ||||||
| GRADE Working Group grades of evidence. High quality: Further research is very unlikely to change our confidence in the estimate of effect. Moderate quality: Further research is likely to have an important impact on our confidence in the estimate of effect and may change the estimate. Low quality: Further research is very likely to have an important impact on our confidence in the estimate of effect and is likely to change the estimate. Very low quality: We are very uncertain about the estimate. | ||||||
aDowngraded by two levels because of inconsistency and risk of performance and detection bias. bDowngraded by two levels because of one study with only a few participants and short follow‐up, as well as risk of performance bias.
Background
Description of the condition
Diabetes mellitus is a metabolic disorder resulting from a defect in insulin secretion, insulin action or both. A consequence of this is chronic hyperglycaemia (i.e. elevated levels of plasma glucose) with disturbances of carbohydrate, fat and protein metabolism. Long‐term complications of diabetes mellitus include retinopathy, nephropathy and neuropathy. The risk of cardiovascular disease is increased. For a detailed overview of diabetes mellitus, please see 'Additional information' provided by the Metabolic and Endocrine Disorders Group in The Cochrane Library (see 'About,' 'Cochrane Review Groups (CRGs)'). For an explanation of methodological terms, see the main glossary in The Cochrane Library.
Although several specific causes of diabetes mellitus have been identified, most cases of diabetes fall into one of two categories, now called type 1 and type 2 diabetes mellitus.
Type 1 diabetes mellitus has as its main aetiology the destruction of pancreatic islet beta‐cells. People with type 1 diabetes mellitus usually need insulin treatment to replace the insulin they can no longer make themselves. Type 1 diabetes tends to occur at an earlier age than type 2 diabetes.
Type 2 diabetes mellitus is the more common type of diabetes. It includes the common major form of diabetes that results from defect(s) in insulin secretion, almost always combined with insulin resistance (WHO 1999). The risk of developing type 2 diabetes increases with age, obesity and physical inactivity.
Type 2 diabetes mellitus is more common among people from certain ethnic backgrounds
On a global scale, diabetes is estimated to be the fifth leading cause of death (Roglic 2005). The global burden of diabetes is increasing. The prevalence of diabetes for all age groups worldwide has been estimated as 6.4% in 2010, rising to 7.7% in 2030 (Shaw 2010), which has increased from Wild's (Wild 2004) estimate of an expected rise to 4.4% in 2030. However, this is a simplification of a more complex problem, as illustrated by the UK experience. The prevalence of type 2 diabetes can be as high as 4.3% in UK communities (Simmons 1989), but in certain ethnic minority communities in the same country, it has been found to be as high as 11.2%, or up to four to five times more common than in the indigenous white population (Fischbacher 2009; Mather 1985). In addition, people from some ethnic minority communities appear to develop diabetes at a younger age (Raleigh 1997; Simmons 1993). Similar findings are reported for American Indian and Hispanic communities in the USA, South Asian communities in South Africa and Scandinavia and Maori and Aboriginal communities in New Zealand and Australia (Abate 2003).
People from ethnic minority communities living in upper‐middle‐income or high‐income countries (World Bank Classification) tend to be at a disadvantage in accessing health care for a variety of reasons
These communities tend to have the disadvantage that they lack knowledge of the main language of the country, and they are often relatively deprived in comparison with the majority community (Cooper 2002; Nazroo 1997). They are less likely to know about available services or to use them for preventive care (Hoare 1992; Molokhie 2000; Naish 1994). Even when service provision is equal or higher in an ethnic minority group, outcomes are worse (Fischbacher 2009). Not being able to read or understand the main language results in difficulty accessing health information (Lip 1996). As a result, the focus of specific public health measures for minority communities tends to be decided by health professionals, with little or no reference to the needs of the communities themselves (Bhatt 1992; Bhopal 1988).
The cost of poorly controlled diabetes is high in some of these communities
Diabetes is a progressive disease with disabling long‐term complications if not properly managed. Persistently high blood sugar levels and high blood pressure can result in damage to both large and small blood vessels with ensuing eye, kidney, nerve, heart and circulatory complications; tight control of these parameters and other risk factors such as cholesterol and triglyceride levels can reduce or delay their progression (DCCT 1993; UKPDS 1991; UKPDS 1998). In particular, the presence of diabetes increases the risk of death from cardiovascular disease by three‐ to four‐fold, and morbidity and mortality are significantly higher in people of South Asian origin living in the UK than in their white counterparts (Mather 1998a; Wilkinson 1996). People with diabetes from ethnic minorities in the UK and in North America have been found to be at higher risk for developing complications (Harris 1999; Lanting 2005; Office of Minority Health 2012). Blood sugar control has been shown to be poorer in several studies of South Asian individuals in the UK (Mather 1998b), contributing to an additional increased prevalence of microalbuminuria and diabetic retinopathy in this group. Along with the cost of diabetic morbidity and mortality for patients and their families, treatment of diabetes in the UK takes up a not insignificant 10% of total health resource expenditures. The vast majority of this is attributed to type 2 diabetes and is due to the treatment of complications of diabetes (Hex 2012).
Description of the intervention
Limited evidence suggests that ethnic minority communities benefit from health education programmes
The recommended approach to the management of diabetes is multi‐factorial, consisting of optimising blood sugar levels and blood pressure, managing risk factors for heart disease, providing motivational counselling to encourage patients to choose healthier lifestyles and performing regular screening and monitoring for diabetic complications. In addition, providing information about self‐management and available services contributes to patient empowerment and facilitates access to services. The Royal Colleges of Physicians and General Practitioners in the UK and the British Diabetic Association (1998) have reported that "the twin cornerstones of treatment of type 2 diabetes mellitus are patient education and lifestyle modification (primarily diet and exercise)" (Calman 1994), and a meta‐analysis of studies of educational interventions and outcomes in diabetic adults concluded that these interventions were effective in producing positive patient outcomes (Brown 1990). However, research also suggests that many of these programmes are considerably less successful in patients from ethnic minority groups, with worse outcomes, lower rates of participation and higher attrition rates (Coonrod 1994; Wierenga 1995). In addition, ethnic minority groups often are not included as a subgroup in large trials, and little evidence indicates that their outcomes are similarly influenced by health education (Mukhopadhyay 2005). Surveys of people from ethnic minority groups in the UK have shown that they are likely to know little about diabetes and its management or the services available for screening and management of complications, even when offered the same health care as the indigenous population (Hawthorne 1990; Leedham 2000; Majeed‐Ariss 2013). In the UK, the problem is much worse if patients are unable to speak English well, or to read in English. Study participants tended to place greater emphasis on cultural beliefs about disease and medication, and they found adhering to dietary measures difficult within their ethnic community (Majeed‐Ariss 2013).
Adverse effects of the intervention
As this review concerns an educational intervention, serious adverse effects for study participants are unlikely. However, as adverse events were one of the primary outcomes of the study, these were searched for in the studies selected.
How the intervention might work
Substantial evidence shows that structured educational programmes such as the X‐PERT patient programme and the DESMOND programme can be very effective for patients with type 2 diabetes (Deakin 2006; Norris 2001; Skinner 2006). Behaviour‐oriented patient education enhances patient empowerment, which enables patients to take responsibility for their diabetes and for other improvements in outcomes such as quality of life and lifestyle change (Lacey 2000; Norris 2002). National guidelines such as those of the National Institute for Health and Care Excellence (NICE) (NICE 2008) emphasise the need to utilise such programmes to improve patient outcomes. However, NICE also stresses that the success of such programmes is dependent on the personal and sociological background of patients, and that any such educational intervention should be tailored to patient groups or individuals.
Why it is important to do this review
In the first review, which included 11 studies (Hawthorne 2008), culturally appropriate health education provided to study participants with type 2 diabetes from ethnic minority communities produced a clinically significant improvement in glycaemic control (glycosylated haemoglobin (HbA1c)) at three and six months, yet this improvement was not sustained at one year. Other improvements were noted in total cholesterol levels at one year post intervention and in knowledge scores at three, six and 12 months post intervention. No significant differences in other outcome measures were reported. Since the time of the first review, research into the impact of culturally appropriate diabetes education has continued. The National Standards for Diabetes Self‐Management Education in America now considers determining "the diabetes educational needs of the target population....such as ethnic background" as an essential standard in diabetes self‐management education (Funnell 2009).
Given the burden of disease of type 2 diabetes in ethnic minority groups, it is important to evaluate the effectiveness of health interventions such as culturally appropriate health education. It is also important that those aspects of health education interventions that are effective in improving outcomes in ethnic minority communities are identified, so that lessons learned in one place and by one community can be adapted and used to benefit others, in terms of improving health outcomes and quality of life. One caveat to this philosophy is that it must be remembered that all minority communities are not the same, nor are all individuals within a community the same. Stereotyping can be avoided by taking generic messages from research and applying them in a culturally sensitive manner, working in partnership with minority communities to achieve the best outcomes (Leedham 2000). Another important aspect of health education to take into account is the possibility of negative or adverse effects of the intervention(s) and how these can be identified, thereby improving educational interventions (Pill 1998).
Objectives
To assess the effectiveness of culturally appropriate health education for people in ethnic minority groups with type 2 diabetes mellitus.
Methods
Criteria for considering studies for this review
Types of studies
Only randomised controlled trials (RCTs) and quasi‐RCTs are included in this review.
Types of participants
Study participants were people with type 2 diabetes mellitus of any duration of diagnosis, with or without complications of diabetes. To be consistent with changes in classification and diagnostic criteria of type 2 diabetes mellitus through the years, the diagnosis should have been established using the standard criteria valid at the time of the beginning of the trial (e.g. ADA 1997; ADA 1999; WHO 1980; WHO 1985; WHO 1998). Ideally, diagnostic criteria should have been described. If necessary, authors' definitions of diabetes mellitus were used. Diagnostic criteria were eventually subjected to a sensitivity analysis. Both male and female patients over 16 years of age were considered. Participants belonged to ethnic minority communities residing in upper‐middle‐income and high‐income countries (World Bank 2013). "Ethnic minority communities" refers to upper‐middle‐income and high‐income countries with large numbers of residents from other countries, with identifiable differences in culture, religion or language, from the majority (or dominant) population and likely to be at a health disadvantage. The search for evidence of culturally appropriate health education was restricted to the following countries: European Economic Area (EEA), Switzerland, USA, Canada, South Africa, New Zealand and Australia. We have limited the review to these countries for the following reasons: Increased prevalence of type 2 diabetes mellitus amongst ethnic minority communities in these countries has been shown, large minority communities reside there (making it a significant public health issue) and these countries have a greater chance of having in place systematic population‐based diabetes educational programmes. In addition, it is known that people from ethnic minority communities are often disadvantaged socioeconomically, have poorer linguistic abilities in the main language of the country and often poorer educational status and have greater difficulty accessing the healthcare provisions of the country in which they live. The ethnic minority group was considered in relationship to the ethnic dominant group.
Types of interventions
Intervention
The effects of culturally appropriate (or adapted) health education for ethnic minority communities with type 2 diabetes mellitus were considered, both separately and in comparison with conventional diabetes health education. One of the interventions should be culturally appropriate to the intervention group or groups. We also considered interventions that compared two different types of culturally appropriate health education.
'Culturally appropriate' health education is defined here as education that is tailored to the cultural or religious beliefs and linguistic skills of the community being approached, taking into account likely literacy skills (Overland 1993). It could include adapting established health education to innovative delivery methods, such as using community‐based health advocates, delivering the information to same‐gender groups or adapting dietary advice to fit the likely diet of a particular community.
Comparator
We anticipate that 'conventional' diabetes education varies from one country to another, also acknowledging the different models of health education interventions. Therefore we are defining 'conventional' diabetes health education as 'any mode of delivery of health education that does not take into account the cultural background and context of the individual or group to whom the intervention is directed.' Thus conventional diabetes health education should be the 'usual' health education offered to patients with type 2 diabetes mellitus in the country being investigated. Educational intervention(s) could include any of the following: dietary advice; healthy lifestyle; information on smoking, exercise and weight reduction; and information on the use of screening services, foot care and self‐monitoring of blood sugars and blood pressure.
Types of outcome measures
Important clinical outcome measures for diabetes health education include morbidity and mortality rates, incidence and progression of diabetic complications and improvements in patient empowerment and health‐related quality of life. However, the priority attached to these may vary, both among patients and within the healthcare system, for example, after the introduction of new guidelines in diabetes care, new treatments for diabetes are provided, along with additional financial incentives for healthcare staff for improving care provided to patients with diabetes. In addition, it is difficult to quantify knowledge, skills and attitudes, although several validated questionnaires attempt to do so. Also various qualitative measures are available that can indicate the value and effectiveness of health education interventions. The patient group consulted with regard to development of the protocol (Diabetes UK) has agreed with the proposed outcome measures.
Primary outcomes
Glycosylated haemoglobin A1c (HbA1c).
Health‐related quality of life.
Adverse events.
Secondary outcomes
All‐cause and specific mortality.
Complications of diabetes mellitus.
Participant satisfaction.
Measures of participant empowerment and self‐efficacy.
Measures of attitude.
Measures of knowledge of disease.
Blood pressure.
Body mass index (BMI).
Lipid levels.
Health economics.
Some instruments and scales of knowledge assessment might not have been validated for use with the minority group in the study; when these studies are included, they are assessed in a sensitivity analysis. We acknowledge the difficulty involved in interpreting the results of some of these outcomes and their comparisons.
Co‐variates, confounders and effect modifiers
We examined the following variables in terms of overall findings on the effectiveness of interventions discussed in the review: type of intervention, duration of intervention, type of educator, validated questionnaires and different ethnic groups.
Method and timing of outcome measurement
Time intervals at which outcome assessment takes place may influence the apparent effect of the intervention. All of the outcome measures listed above were measured at the same time intervals as in the original review (three, six, 12 and 24 months) (Hawthorne 2008).
Search methods for identification of studies
Electronic searches
For the purposes of this re‐review, searches were conducted from June 2007 until September 2013. The original review (Hawthorne 2008) covered the period until August 2007. We used electronic search strategies to identify relevant RCTs, as well as reviews and meta‐analyses (for identification of additional trials). We used the following sources.
Cochrane Central Register of Controlled Trials (CENTRAL) (2007 until July 2013).
MEDLINE (June 2007 until September 2013).
EMBASE (June 2007 until September 2013).
PsycINFO, Ovid interface (June 2007 until September 2013).
Education Resources Information Center (ERIC) (Cambridge Scientific Abstracts) (June 2007 until September 2013).
Google Scholar (November 2011 until September 2013).
We also searched databases of ongoing trials (ClinicalTrials.gov (www.clinicaltrials.gov/), Current Controlled Trials metaRegister (www.controlled‐trials.com/), the EU Clinical Trials register (www.clinicaltrialsregister.eu/) and the World Health Organization (WHO) International Clinical Trials Registry Platform (ICTRP) (http://apps.who.int/trialsearch/)). In future updates of this review, we will provide information including trial identifiers for potentially relevant ongoing studies in the Characteristics of ongoing studies table and in an appendix titled 'Matrix of study endpoints (protocol/trial documents).'
For detailed search strategies, please see Appendix 1. We continuously applied the PubMed 'My NCBI' (National Center for Biotechnology Information) email alert service to identify newly published studies using a basic search strategy (see Appendix 1).
If we had detected additional relevant key words during any of the electronic or other searches, we would have modified the electronic search strategies to incorporate these terms and document the changes. We placed no restrictions on the language of publication when searching the electronic databases or reviewing reference lists of identified studies.
Searching other resources
We handsearched journals commonly encountered in the search strategy (Diabetes Educator, Diabetic Medicine and Ethnicity and Health). Commonly encountered authors and experts in the field (researchers with a number of trials on culturally appropriate health education or on healthcare professionals working with ethnic groups) were contacted to ask for help in identifying further relevant published and unpublished trials. We checked the reference lists of included studies and papers. Studies published in any language were included.
Data collection and analysis
Two review groups from The Cochrane Collaboration were asked for support and advice on the methodology of the review: The Metabolic and Endocrine Disorders Group is hosting the review and provided the bulk of support; the Consumers and Communication Review Group also provided valuable input and support for the patients' perspective in the review. In addition, opinion on the methodology of the review and in particular on the main outcome measures was given by Diabetes UK, the main UK diabetes consumer group. Diabetes UK read through the protocol and gave its opinion on which of the main outcome measures would be likely to be most relevant to consumers.
Selection of studies
To determine which studies should be assessed further, two review authors (JC and MA) independently scanned the abstract, title or both sections of every record retrieved by the searches. JC was involved as the lead review author until November 2011, and MA was the lead review author between November 2011 and December 2013. KH was involved as a co‐review author throughout the update. When differences in opinion were expressed, they were resolved by consensus. If resolving the disagreement was not possible, the article was added to the list of those 'awaiting assessment,' and we contacted study authors for clarification. An article was rejected during this initial screening if the review author could determine from the title or abstract, or from both, that it did not meet the inclusion criteria. If rejection was not possible, full‐text copies were retrieved. Differences between review authors' extraction results were resolved by discussion within the larger group. Study authors were contacted for clarification. All studies fulfilling the inclusion criteria were included unless serious methodological flaws made the data unreliable.
With guidance from the Metabolic and Endocrine Disorders Review Group, trials that had only an abstract available were treated with caution and were included only if it appeared that they were relevant to the review and after the study authors were contacted to obtain the full version. A PRISMA (Preferred Reporting Items for Systematic Reviews and Meta‐Analyses) flow chart of study selection is attached (Liberati 2009).
Data extraction and management
For studies that fulfilled the inclusion criteria, three review authors (JC, MA and MR) independently abstracted relevant population and intervention characteristics using standard data extraction templates with disagreements resolved by discussion or, if required, by consultation with a third party (KH) (for details, see Characteristics of included studies; Table 2; Appendix 2; Appendix 3; Appendix 4; Appendix 5; Appendix 6; and Appendix 7).
1. Overview of study populations.
| Characteristic | Intervention(s) and comparator(s) | Sample sizea | Screened/eligible [N] | Randomised [N] | Safety [N] | Finishing study [N] | Randomised finishing study [%] | Follow‐upb |
| (1) Agurs Collins 1997 | I: individual and group sessions | 40 | 87 | 32 | 30 | 93.8 | 6 mo | |
| C: 1 class and info leaflet | 40 | 32 | 25 | 78.1 | ||||
| total: | 64 | 55 | 90.6 85.9 |
|||||
| (2) Anderson 2005 | I: group sessions | ‐ | ‐ | 125 | ‐ | ‐ | 3 mo | |
| C: usual care plus feedback on baseline bloods | 114 | ‐ | ‐ | |||||
| total: | 239 | 194 | 81.2 | |||||
| (3) Babamoto 2009 | I1: individual sessions plus telephone calls | ‐ | 1352/354 | 106 | 60 | 56.6 | 6 mo | |
| I2: case management | 106 | |||||||
| C: usual care | 106 | 54 | 50.9 | |||||
| total: | 318 | 189 | 59.4 | |||||
|
(4) Baradaran 2006 |
I1: group sessions | ‐ | 299 | 59 | 44 | 74.6 | 6 mo | |
| C1: usual care—South Asian | 59 | 36 | 61.0 | |||||
| C2: usual care—White Caucasian | 27c | 21 | 77.8 | |||||
| total: | 118 | 101 | 85.6 | |||||
| (5) Bellary 2008 | I: treatment protocols and extra clinics plus link workers | 16‐18 clusters of 80‐100 participants | 3571/2426 | 868 | 747 | 86.1 | 24 mo | |
| C: treatment protocols only | 618 | 531 | 85.9 | |||||
| total: | 1486 | 1278 | 86.0 | |||||
| (6) Brown 2002 | I: group sessions | ‐ | ‐ | 126 | 89 | 70.6 | 12 mo | |
| C: usual care—wait‐listed control group | 126 | 89 | 70.6 | |||||
| total: | 252 | 178 | 70.6 | |||||
| (7) Carter 2011 | I: Internet and videoconferencing with nurse | ‐ | ‐ | ‐ | 26 | ‐ | 9 mo | |
| C: usual care | ‐ | 21 | ‐ | |||||
| total: | 74 | 47 | 63.5 | |||||
| (8) Crowley 2013 | I: individual sessions via telephone | 200 | 2153/1508 | 182 | 166 | 91.2 | 12 mo | |
| C: usual care + leaflet | 177 | 164 | 92.7 | |||||
| total: | 359 | 329 | 91.6 | |||||
|
(9) D'Eramo Melkus 2010 |
I: group sessions | 129 | 236/119 | 57 | 40 | 70.2 | 24 mo | |
| C: conventional (not culturally appropriate) group sessions | 52 | 37 | 71.2 | |||||
| total: | 109 | 77 | 70.6 | |||||
| (10) DePue 2013 | I: Nurse‐led self‐management education and medication management facilitation components | 362 | 406/312 | 104 | 95 | 91.3 | 12 mo | |
| C: usual care | 164 | 148 | 90.2 | |||||
| total: | 268 | 243 | 90.7 | |||||
|
(11) Gary 2009 |
I: individual visits to CHW and nurse following culturally appropriate clinical algorithms | ‐ | 2450/955 | 269 | 235 | 87.4 | 24 mo | |
| C: telephone calls and information leaflets | ‐ | 273 | 253 | 92.7 | ||||
| total: | 542 | 488 | 90.0 | |||||
|
(12) Gucciardi 2007 |
I1: group sessions | ‐ | 233 | 41 | 25 | 61.0 | 3 mo | |
| I2: individual sessions | 46 | 36 | 78.3 | |||||
| total: | 87 | 61 | 70.1 | |||||
|
(13) Hawthorne 1998 |
I: individual session with CHW—flashcards | 100 | ‐/201 | 112 | 106 | 94.6 | 6 mo | |
| C: usual care in clinics | 100 | 89 | 86 | 96.6 | ||||
| total: | 201 | 192 | 95.5 | |||||
|
(14) Kattelmann 2009 |
I: group sessions | 57 | ‐ | 57 | 51 | 89.5 | 6 mo | |
| C: standard dietary education and health care | 57 | 57 | 53 | 92.9 | ||||
| total: | 114 | 104 | 91.2 | |||||
|
(15) Keyserling 2002 |
I1: individual and group sessions | 210 | 219 | 66 | 54 | 81.8 | 12 mo | |
| I2: individual—not included in meta‐analysis | 67 | 59 | 88.1 | |||||
| C: usual care | 67 | 58 | 86.6 | |||||
| total: | 200 | 171 | 85.5 | |||||
|
(16) Khan 2011 |
I: individual computer‐based | ‐ | 146/129 | 67 | 53 | 79.1 | 3 mo | |
| C: brochure with crossword puzzle | 62 | 47 | 75.8 | |||||
| total: | 129 | 100 | 77.5 | |||||
|
(17) Kim 2009 |
I: group sessions and telephone calls | 40 | 224/83 | 41 | 40 | 97.6 | 30 wk | |
| C: usual care (wait‐listed) | 40 | 42 | 39 | 95.1 | ||||
| total: | 83 | 79 | 95.2 | |||||
|
(18) Lorig 2008 |
I: group sessions | ‐ | ‐ | 219 | 179 | 81.7 | 6 mo | |
| C: usual care (wait‐listed) | 198 | 173 | 87.4 | |||||
| total: | 417 | 352 | 84.4 | |||||
|
(19) Lujan 2007 |
I1: group sessions, telephone calls and inspirational postcards | 75 | ‐/160 | 75 | 70 | 93.3 | 6 mo | |
| C1: usual care—individual sessions and info leaflets | 75 | 75 | 71 | 94.7 | ||||
| total: | 150 | 143 | 95.3 | |||||
|
(20) Middelkoop 2001 |
I: group sessions | ‐ | ‐ | 53 | 53 | 100 | 6 mo | |
| C: usual care (wait‐listed) | 60 | 60 | 100 | |||||
| total: | 113 | 113 | 100 | |||||
|
(21) O'Hare 2004 |
I: treatment protocols plus extra diabetes clinics and link workers | 64 | 401 | 180 | 165 | 91.7 | 12 mo | |
| C: treatment protocols only | 64 | 181 | 160 | 88.4 | ||||
| total: | 361 | 325 | 90.0 | |||||
|
(22) Osborn 2010 |
I: individual education session | ‐ | ‐/129 | 59 | 48 | 81.4 | 3 mo | |
| C: usual care—access to monthly support group facilitated by Puerto‐Rican worker | 59 | 43 | 72.9 | |||||
| total: | 118 | 91 | 77.1 | |||||
| (23) Philis‐Tsimikas 2011 | I: group education sessions and support group | 210 | ‐/961 | 104 | 56 | 53.8 | 10 mo | |
| C: usual care | 103 | 72 | 69.9 | |||||
| total: | 207 | 156 | 75.4 | |||||
|
(24) Rosal 2005 |
I: individual and group sessions | ‐ | 54 | 15 | ‐ | ‐ | 6 mo | |
| C: usual care plus feedback of test results | 10 | ‐ | ‐ | |||||
| total: | 25 | ‐ | 92 | |||||
|
(25) Rosal 2011 |
I: individual and group sessions | 250 | 592/276 | 124 | 106 | 85.5 | 12 mo | |
| C: usual care | 128 | 105 | 82.0 | |||||
| total: | 252 | 211 | 83.7 | |||||
| (26) Rothschild 2012 | I: home visits | ‐ | 343/‐ | 73 | 58 | 79.5 | ??? | |
| C: mailed information leaflets | 71 | 61 | 85.9 | |||||
| total: | 144 | 119 | 82.6 | |||||
|
(27) Samuel‐Hodge 2009 |
I: individual, group and telephone calls | 280 | 284/260 | 117 | 101 | 86.3 | 12 mo | |
| C: minimal intervention: leaflets and newsletters | 84 | 69 | 82.1 | |||||
| total: | 201 | 170 | 84.6 | |||||
|
(28) Sixta 2008 |
I: group sessions | ‐ | 734/135 | 63 | 6 mo | |||
| C: usual care (wait‐listed) | 68 | |||||||
| total: | 131 | 60 | 45.8 | |||||
|
(29) Skelly 2005 |
I: home visits | 20 | 52 | ‐ | 23 | ‐ | 12 wk 12 wk |
|
| C: usual care plus telephone call (wait‐listed) | 20 | ‐ | 18 | ‐ | ||||
| total: | 47 | 41 | 87.2 | |||||
|
(30) Skelly 2009 |
I1: home visits—symptom focused | ‐ | 308/180 | 60 | 60 | 100 | 9 mo | |
| I2: home visits with booster (not used in the meta‐analysis) | 60 | 55 | 91.7 | |||||
| C1: nurse home visits—non‐symptom focused | 60 | 59 | 98.3 | |||||
| total: | 180 | 174 | 96.7 | |||||
| (31) Spencer 2011 | I: group meetings, home visit and accompanied clinic visit | ‐ | 1719/183 | 84 | 59 | 70.2 | 6 mo | |
| C: usual care (wait listed) | 99 | 77 | 77.8 | |||||
| total: | 164 | 136 | 82.9 | |||||
|
(32) Toobert 2011 |
I: group meetings | ‐ | 4045/680 | 142 | ‐ | 24 mo | ||
| C: usual care | 138 | ‐ | ||||||
| total: | 280 | ‐ | 61.4 | |||||
|
(33) Vincent 2007 |
I: group sessions | ‐ | 60/30 | 10 | 9 | 90 | 3 mo | |
| C: usual care | 10 | 8 | 80 | |||||
| total: | 20 | 17 | 85 | |||||
| Grand total | All interventions | N/A | ||||||
| All comparators | ||||||||
| All interventions and comparators | 7453 | |||||||
aAccording to power calculation in study publication or report. bDuration of intervention and/or follow‐up under randomised conditions until end of study. cNot used in the meta‐analysis.
"‐" denotes not reported.
C: comparator; CHW: community health worker; I: intervention; ITT: intention‐to‐treat; mo: month; N/A: not applicable; wk: weeks
We sent an email to study authors of included studies to enquire whether they were willing to answer questions regarding their trials. We present the results of this survey in Appendix 8. Furthermore, we sought key unpublished information that was missing from the reports of included studies.
Dealing with duplicate and companion publications
In the event of duplicate publications, companion documents or multiple reports of a primary study, we maximised the yield of information by collating all available data. In case of doubt, the publication reporting the longest follow‐up associated with our primary or secondary outcomes was assigned priority.
Data concerning participants, interventions and outcomes, as described in the selection criteria, were extracted. In addition, data were collected on potential covariates such as age, gender, ethnic group, newly diagnosed or established diabetes, presence of diabetic complications, educational status and linguistic abilities, when available.
The full list of data extracted, when possible, follows.
General information: published or unpublished, title, authors, reference/source, contact address, country, urban or rural, language of publication, duplicate publications, sponsoring, setting (primary or secondary care).
Trial characteristics: design, duration, randomisation (and method), allocation concealment (and method), blinding (participants, people administering the education, outcome assessors), check of blinding.
Intervention(s): placebo included, intervention(s) (nature and content of health education intervention and timing), co‐intervention(s) (nature and content of intervention and timing), duration of intervention, health professional group involved.
Participants: sampling (random or convenience), exclusion criteria, total number and numbers in comparison groups, sex, age, biomedical and diabetes parameters, existence of diabetic complications, sociodemographic and ethnic characteristics, literacy or educational level.
Outcomes: outcomes specified above: quality of reporting outcomes, validation or not of scales and questionnaires; health economics; evaluating resources (implications if data allow); main outcome measures of glycosylated haemoglobin and participant knowledge of disease; qualitative data, if available, extracted for summary.
Results: absolute changes in dichotomous outcomes; mean change or mean difference (MD) and standard deviation for continuous outcomes; times of assessment.
Assessment of risk of bias in included studies
Two review authors (MA and MR) assessed each trial independently. Possible disagreements were resolved by consensus, or with consultation of a third party (KH). In cases of disagreement, the rest of the group was consulted and a judgement was made that was based on consensus.
We assessed risk of bias using the tool of The Cochrane Collaboration (Higgins 2011a; Higgins 2011b). We used the following bias criteria.
Random sequence generation (selection bias).
Allocation concealment (selection bias).
Blinding (performance bias and detection bias), separated for blinding of participants and personnel and blinding of outcome assessment.
Incomplete outcome data (attrition bias).
Selective reporting (reporting bias).
Other bias.
We assessed outcome reporting bias (Kirkham 2010) by integrating the results of 'Examination of outcome reporting bias' (Appendix 6), 'Matrix of study endpoints (trial documents)' (Appendix 5) and 'Outcomes (outcomes reported in abstract of publication)' sections of the Characteristics of included studies table. This analysis formed the basis for the judgement of selective reporting (reporting bias).
We judged risk of bias criteria as 'low risk,' 'high risk' or 'unclear risk' and evaluated individual bias items as described in the Cochrane Handbook for Systematic Reviews of Interventions (Higgins 2011a). We present a 'Risk of bias' graph and a 'Risk of bias summary' figure.
We assessed the impact of individual bias domains on study results at endpoint and on study levels.
For blinding of participants and personnel (performance bias), detection bias (blinding of outcome assessors) and attrition bias (incomplete outcome data), we evaluated risk of bias separately for subjective and objective outcomes (Hrobjartsson 2013). We considered the implications of missing outcome data from individual participants.
We defined the following endpoints as subjective outcomes.
Health‐related quality of life.
Adverse events.
Disease‐specific mortality.
Participant satisfaction.
Measures of participant empowerment and self‐efficacy.
Measures of attitude.
Measures of knowledge of disease.
We defined the following endpoints as objective outcomes.
HbA1c.
All‐cause mortality.
Complications of diabetes mellitus.
Blood pressure.
Body mass index.
Lipid levels.
Health economics.
Measures of treatment effect
We expressed dichotomous data as odds ratios (ORs) or risk ratios (RRs) with 95% confidence intervals (CIs). We expressed continuous data as mean differences (MDs) with 95% CIs. We considered standardised effect sizes of around 0.2 to be 'small,' 0.5 'moderate' and 0.8 or greater 'large' (Cohen 1988).
Unit of analysis issues
We took into account the level at which randomisation occurred, such as cross‐over trials, cluster‐randomised trials and multiple observations for the same outcome.
Dealing with missing data
We obtained relevant missing data from study authors, if feasible, and evaluated important numerical data, such as screened, eligible and randomly assigned participants, as well as intention‐to‐treat (ITT), as‐treated and per‐protocol (PP) populations. We investigated attrition rates, for example, dropouts, losses to follow‐up and withdrawals, and critically appraised issues of missing data and imputation methods (e.g. last observation carried forward (LOCF)).
Assessment of heterogeneity
In the event of substantial clinical, methodological or statistical heterogeneity, we did not report study results as meta‐analytically pooled effect estimates.
We identified heterogeneity by visually inspecting forest plots and by using a standard Chi² test with a significance level of α = 0.1, in view of the low power of this test. We examined heterogeneity by using the I² statistic, which quantifies inconsistency across studies, to assess the impact of heterogeneity on the meta‐analysis (Higgins 2002; Higgins 2003); an I² statistic of 75% or greater indicates a considerable level of inconsistency (Higgins 2011a; Higgins 2011b ).
When we found heterogeneity, we attempted to determine potential reasons for it by examining individual study and subgroup characteristics.
We expected the following characteristics to introduce clinical heterogeneity.
Type of intervention.
Duration of intervention.
Health organisation delivering the intervention, educator, venue.
Different ethnic group.
Literacy.
Age and gender of participants (and match with gender of 'educators').
Newly diagnosed or established diabetic participants.
Presence or absence of diabetic complications.
Stage of disease and the existence of complications.
Assessment of reporting biases
Small‐study bias was assessed graphically through funnel plots. We acknowledge the limitations of such analysis, and if asymmetry was found, possible reasons were explored (Cochrane Handbook for Systematic Reviews of Interventions).
If we included 10 or more studies for a given outcome, we used funnel plots to assess small‐study effects. Because several explanations were suggested for funnel plot asymmetry, we interpreted the results carefully (Sterne 2011).
Data synthesis
Unless good evidence was found for homogeneous effects across studies, we primarily summarised low risk of bias data by using a random‐effects model (Wood 2008). We interpreted random‐effects meta‐analyses with due consideration of the whole distribution of effects, ideally by presenting a prediction interval (Higgins 2009). A prediction interval specifies a predicted range for the true treatment effect in an individual study (Riley 2011). In addition, we performed statistical analyses according to the statistical guidelines referenced in the latest version of the Cochrane Handbook for Systematic Reviews of Interventions (Higgins 2011a).
Subgroup analysis and investigation of heterogeneity
We carried out the following subgroup analyses and planned to investigate the same analyses in the repeat review.
We anticipated the need to stratify participants by age groups, as this can be an important effect modifier of outcomes; the effect of gender of participants, matched with gender of educators, was also analysed to assess differences.
We planned to analyse subgroups of participants with newly diagnosed (in the first year of diagnosis), established type 2 diabetes mellitus and participants already suffering from diabetes complications.
We analysed subgroups of different types of health education interventions, different types of healthcare providers (e.g. nurse, dietician, community health worker) and different settings where the intervention took place (community‐ or hospital‐based interventions).
We tried to explore differences between different literacy subgroups, ability to speak the language of the majority population and countries where the interventions took place.
We stratified participants by ethnic groups to identify differences, if they exist, between different ethnic groups.
Sensitivity analysis
We performed sensitivity analyses to explore the influence of the following factors on effect size.
Restricting the analysis to published studies.
Restricting the analysis by taking into account risk of bias, as specified in the section, Assessment of risk of bias in included studies.
Restricting the analysis to very long or large studies to establish how much they dominate the results.
Restricting the analysis to studies using the following filters: diagnostic criteria, language of publication, source of funding (industry vs other), country.
We tested the robustness of results by repeating the analysis using different measures of effect size (RR, OR, etc.) and different statistical models (fixed‐effect and random‐effects models).
Results
Description of studies
For a detailed description of studies, see Characteristics of included studies and Characteristics of excluded studies,
Results of the search
For details regarding results of the original search, please refer to Hawthorne 1997. The protocol search strategy applied to the following databases revealed 1857 citations: CENTRAL, MEDLINE, EMBASE, PsycINFO, ERIC and Google Scholar (June 2007 to September 2013 only). An additional 45 citations were found in the reference lists of literature reviews and by handsearching of Diabetes Educator, Diabetic Medicine and Ethnicity and Health. After duplicates were removed, the abstracts of 1314 records were screened independently by JC and MA (with KH as a co‐review author for consistency). Of these, 1181 records were excluded as unrelated to the focus of the systematic review or as not meeting the inclusion criteria. Full‐text copies of the remaining potentially eligible 133 studies were retrieved and were assessed independently by JC, MA and KH. In addition, six literature reviews on the topic were identified, and their reference sections were handsearched. For an overview, see Figure 1.
1.

Study flow diagram.
Reasons for exclusion of papers from the analysis
A total of 37 papers were not true RCTs. 30 papers did not include defined ethnic groups in their presentation of data (people from ethnic minority backgrounds may have been present in the study population, but their outcomes were not analysed according to their ethnic groups). In 23 papers, participants did not have type 2 diabetes (or the paper included mixed diabetic populations, which were not separated in the reporting of outcomes). Two studies were excluded because the intervention described was not culturally adapted (Heudebert 2013; Phumipamorn 2008). Eight studies were excluded as they did not include clearly defined diabetes health education (Amaoko 2007; Amaoko 2008; Batik 2008; Bogner 2010; Calles‐Escandon 2010; Hotu 2010; Murrock 2009; Ruelas 2009). Six studies appeared ongoing, and no results were available at that time (Egede 2010; Ell 2009; Henderson 2012; Palmas 2012; Rosal 2009; Rothschild 2012). Four studies appeared relevant but did not contain any of the outcomes from our protocol (Barrera 2012; Boudreau 2011; Calle 2009; Fernandez 2011). Three studies were excluded because the interventions compared within these studies, although fulfilling the criteria for culturally appropriate health education, did not have a 'usual care' control group (Davidson 2007; Latham 2009; Welch 2011). In all three of these studies, the interventions within each study were essentially the same, and they differed only in terms of the intensity of the intervention and follow‐up, thus data on the effects of the intervention itself were not provided. Two papers initially excluded were later included after the study authors provided a breakdown of included ethnic groups (Khan 2011 ‐ African Ameri; Khan 2011‐ Hispanic; Spencer 2011 African‐Amer; Spencer 2011 Hispanic). Data from both of these studies were therefore analysed as data from two separate smaller trials.
In all, 26 study authors (from 13 excluded studies and 13 included studies) were contacted by the review team. Three studies were excluded because the study authors were unable to provide missing data (Trief 2013; Weinstock 2011) or because information provided excluded them on the basis of the inclusion criteria (Hill‐Briggs 2011). Seven studies were excluded because the study authors did not reply to requests for missing data (Anderson 2010; Bravis 2010; Cramer 2007; Crasto 2011; Davis 2009a; Egede 2010; Walker 2011). One study author was initially contacted after our electronic search was completed, as the search located the protocol for that trial, which sounded suitable for inclusion (Powers 2009). As the results of this study had not yet been published at this point, the study authors were contacted to provide preliminary results of their trial for inclusion in the review. They said that this may be possible; however, as our update took longer than anticipated, the results of this study were published in time for inclusion in our review (Crowley 2013). One study author (Jernigan 2011) replied and referenced another trial (Lorig 2008), which provided study data. Another study (Rothschild 2012) provided the reference to the full, now published results (Rothschild 2013).
Twenty‐two new studies (analysed as 24 separate trials because of the two trials for which study authors provided us with separate data for Hispanic and African American participants) plus 11 studies from the original review were included in the review analysis. The total number of participants in these studies was 7453, with studies ranging in size from 20 to 1486 participants. Some studies were quite small and were designed as pilot studies. Four study authors provided additional data for the meta‐analysis (Bellary 2008; Khan 2011 ‐ African Ameri; Khan 2011‐ Hispanic; Rosal 2011; Spencer 2011 African‐Amer; Spencer 2011 Hispanic).
Included studies
Summary of included studies
Agurs‐Collins 1997 provided to older African Americans group and individual sessions aimed at weight reduction and increase in physical activity, with follow‐up at three and six months. Hawthorne 1997 used a non‐clinical link worker and pictorial flashcards to deliver a single one‐to‐one health education session to British South Asians, with a six‐month follow‐up. Middelkoop 2001 used audiocassettes, dietary booklets and diabetes specialist nurses and dieticians to provide interventions to Surinam Asians in the Netherlands. Follow‐up took place six months later, when the control group also received the intervention. Keyserling 2002 used a locally developed healthy living programme for diabetes to work with African American women (the New Leaf Programme), with follow‐up at six and 12 months. Three groups were compared: a group receiving one‐to‐one health education, a group receiving one‐to‐one and group education and a 'usual management' group. Brown 2002 provided an intensive three‐month course of diabetes knowledge and self‐management group sessions to Mexican Americans, followed by nine months of support group work, with assessments at three, six and 12 months. The control group received the intervention at the end of 12 months. O'Hare 2004 provided extra nursing and link worker input to South Asians attending six family practices in the UK, working to protocols to achieve defined blood biochemistry and blood pressure targets, with 12‐month follow‐up. Anderson 2005 provided six weekly group discussion sessions to urban African Americans based on diabetes knowledge and self‐management. At the end of six weeks, this intervention was offered to the control group as well. Rosal 2005 (pilot study) and Rosal 2011 used a combination of individual and group sessions over 10 weeks with Puerto Ricans living in the USA targeted at diabetes‐related knowledge, attitudes and self‐management skills, with follow‐up by telephone three and six months later. Skelly 2005 (pilot study) and Skelly 2009 used an intervention of home visits over 12 weeks for African American women. They used the New Leaf Diabetes Knowledge questionnaire developed by Keyserling 2002. Baradaran 2006 based their intervention for South Asians in the UK on baseline questionnaire results on diet, knowledge of diabetes and diabetes self‐management, providing three group education sessions. Vincent 2007 looked at the effects of a culturally adapted eight‐week group session programme for Mexican Americans in Arizona, USA. Gucciardi 2007 is a pilot study comparing group education classes with group education and individual counselling interventions as a combined package, in Portuguese Canadians, but with no 'usual management' group, over three months. Lujan 2007 used "promotoras" to deliver two months of participative group classes, fortnightly telephone follow‐ups and inspirational faith‐based health behaviour change postcards to Mexican Americans. Lorig 2008 used a six‐week programme of group sessions for the Hispanic community of the San Francisco Bay area, USA. Bellary 2008 is the follow‐up study and extension of O'Hare 2004, which used more study centres and longer outcome measures. It provides data on nearly 1500 participants, making it by far the largest study in this review. Sixta 2008 used a 10‐week diabetes self‐management programme for Hispanic participants. Kim 2009 provided weekly educational classes for six weeks and monthly telephone counselling and remote monitoring of blood glucose using teletransmission devices for 24 weeks in Korean Americans. Babamoto 2009 focused on the effects of community health workers delivering individual educational sessions to Hispanics. Gary 2009 provided individual case management and advice via both a nurse and a community health worker to African American participants. Samuel‐Hodge 2009 provided a group‐based intervention based in churches for African Americans, focusing on light exercise and diet. Kattelmann 2009 investigated the impact of 12 hours of group education based on the Medicine Wheel Nutritional model among Native Americans of the Cheyenne River Sioux Reservation. Osborn 2010 used a single interventional session based on the Information‐Behavioural Skills (IMB) model in Americans of Puerto Rican heritage. Its control group received usual care, including an optional diabetes support group. D'Eramo Melkus 2010 looked at culturally appropriate group sessions on self‐management and coping skills over three months in African American women. Carter 2011 provided computer‐based learning and social networking programmes for African American participants to assist patient self‐management in the home setting. Philis‐Tsimikas 2011 also focused on Mexican Americans, delivering eight weekly diabetes self‐management classes and subsequent monthly support groups. Spencer 2011 African‐Amer and Spencer 2011 Hispanic is a single paper that used a combination of group and individual interventions on African American and Hispanic participants. We have presented these data separately using unpublished data provided by the study author. Toobert 2011 developed the Viva Bien programme, a culturally adapted version of the previously established Mediterranean Lifestyle Program for diabetes. This involved a 2.5‐day retreat and follow‐up meetings for Hispanic women in Denver, Colarado, USA. Khan 2011 ‐ African Ameri and Khan 2011‐ Hispanic is one paper that looked at the use of bilingual computer multimedia lessons for diabetes self‐management within African American and Hispanic diabetic individuals. We have presented the data for both ethnic cohorts separately using unpublished data. Rothschild 2013 (pilot study) used a long intervention of 36 visits over two years for a community health worker who delivered behavioural self‐management training using a curriculum derived from recommendations of the American Academy of Diabetes Educators. This programme was used to educate Mexican Americans in the Chicago area. Data obtained from the study author were derived from the follow‐up paper. Crowley 2013 conducted the Cholesterol, Hypertension and Glucose Education (CHANGE) study on African Americans in Durham, North Carolina, USA. Finally, DePue 2013 worked with the people of American Samoa, an unincorporated territory of the USA in the South Pacific Ocean.
Two papers were 'secondary papers' and were found to contain data already included in their respective primary trials in our update. Leeman 2008 provided results of a pilot intervention, which was already discussed by Skelly 2005. Toobert 2011 published two papers with short‐ and long‐term outcomes from the same study population.
Clinical heterogeneity
Of the included studies, all but six were carried out in the USA. The remaining six were conducted in South Asian individuals (with 'South Asian' defined as people originating from the Indian subcontinent) in the UK (Baradaran 2006; Bellary 2008; Hawthorne 1997; O'Hare 2004) and the Netherlands (Middelkoop 2001), and with Portuguese Hispanic people in Canada (Gucciardi 2007). Twelve of the USA‐based studies conducted their research with African American populations (Agurs‐Collins 1997; Anderson 2005; Carter 2011; Crowley 2013; D'Eramo Melkus 2010; Gary 2009; Keyserling 2002; Khan 2011 ‐ African Ameri; Samuel‐Hodge 2009; Skelly 2005; Skelly 2009; Spencer 2011 African‐Amer), whilst 14 focused on people of Hispanic identity (Babamoto 2009; Brown 2002; Khan 2011‐ Hispanic; Lorig 2008; Lujan 2007; Osborn 2010; Philis‐Tsimikas 2011; Rosal 2005; Rosal 2011; Rothschild 2013; Sixta 2008; Spencer 2011 Hispanic; Toobert 2011; Vincent 2007). Investigators in the remaining studies worked mostly with those of South Asian descent, with the exception of DePue 2013 (American Samoans), Kattelmann 2009 (Native Americans) and Kim 2009 (those of Korean descent). Most of the studies were set in deprived areas of these four countries, in rural or inner city urban settings, and investigators discussed the difficulties faced by communities with a high prevalence of type 2 diabetes, in which poor dietary habits, low levels of physical activity and communication barriers made access to good‐quality diabetes education problematic.
Study methodology heterogeneity
How participants were identified for the studies
Participants were identified and recruited for the studies by several different methods and from different sources depending on the healthcare system of the host country, which determined where the target groups were likely to be found in the highest concentrations. In Britain and the Netherlands, studies recruited participants attending their general practitioners (or family doctors) (Baradaran 2006; Hawthorne 1997; Middelkoop 2001; O'Hare 2004), secondary care diabetes clinics (Hawthorne 1997) and day care centres (Baradaran 2006).
Brown 2002 and Kim 2009 identified participants, from rosters of previous research studies in the area, who had not taken part in a similar study before. Some studies used medical records from primary care providers to identify eligible participants before contacting them directly (Crowley 2013; Gary 2009; Rosal 2011; Vincent 2007). Family doctors or community clinics were used in many studies to recruit participants (Babamoto 2009; Carter 2011; DePue 2013; Keyserling 2002; Lujan 2007; Osborn 2010; Rosal 2005; Sixta 2008; Skelly 2005; Skelly 2009; Vincent 2007) via primary referral or advertising in the clinic. Other studies recruited participants through private practice and secondary care clinics (Agurs‐Collins 1997; Gucciardi 2007),and by outreach through community and church bulletins (Agurs‐Collins 1997; Anderson 2005; D'Eramo Melkus 2010; Kattelmann 2009; Kim 2009; Lorig 2008; Rothschild 2013). Samuel‐Hodge 2009 used an entirely church‐based method of recruitment.
Types of interventions
Just more than half of the studies based their health education on previous relevant qualitative work and experience in working with the communities they were studying. Five studies referred to or in some cases used methodologies taken from earlier work in similar populations (Rosal 2005 working with Hispanic persons refers to work by Brown 2002 with Mexican Americans, Skelly 2005 used the New Leaf Diabetes Knowledge instrument developed by Keyserling 2002 to measure diabetes knowledge in African American women and DePue 2013 worked with American Samoans and based this study on Project Sugar 2, developed by Gary 2009).
Six studies tailored health education to a preliminary, baseline evaluation of the level of knowledge of their target group. Two‐thirds of the studies grounded part or all of their culturally appropriate health education in one of a number of recognised theoretical models. Specific models and theories that were focused on in more than one study included the following: empowerment theories (Anderson 2005; Lujan 2007; Spencer 2011 Hispanic); behaviour change theories (Anderson 2005; Keyserling 2002; Toobert 2011), specifically the transtheoretical model of behaviour change (Babamoto 2009; Crowley 2013; D'Eramo Melkus 2010); and social‐cognitive theory (Rosal 2005; Rosal 2011; Rothschild 2013; Samuel‐Hodge 2009). Four of these studies were pilot studies assessing the feasibility of a future RCT (Gucciardi 2007; O'Hare 2004; Rosal 2005; Skelly 2005), whilst one study (Vincent 2007) described itself as a feasibility study.
Eleven studies used a group intervention method to deliver culturally appropriate health education (Anderson 2005; Baradaran 2006; Brown 2002; D'Eramo Melkus 2010; Kattelmann 2009; Lorig 2008; Philis‐Tsimikas 2011; Samuel‐Hodge 2009; Sixta 2008; Toobert 2011; Vincent 2007), 13 studies provided one‐to‐one sessions (Babamoto 2009; Carter 2011; Crowley 2013; Gary 2009; Hawthorne 1997; Khan 2011‐ Hispanic; Middelkoop 2001; O'Hare 2004; Bellary 2008; Osborn 2010; Rothschild 2013; Skelly 2005; Skelly 2009) and nine studies used a mixture of the two methods (Agurs‐Collins 1997; DePue 2013; Gucciardi 2007; Keyserling 2002; Kim 2009; Lujan 2007; Rosal 2005; Rosal 2011; Spencer 2011 Hispanic). Only two studies (Skelly 2005; Skelly 2009) were deemed by the study authors to use a purely interactive patient‐centred method. Nine studies (Babamoto 2009; Bellary 2008; Hawthorne 1997; Khan 2011‐ Hispanic: Lorig 2008; Lujan 2007; Middelkoop 2001; O'Hare 2004; Sixta 2008) used a semi‐structured didactic format, and the remaining 22 studies used a combination of the two methods.
Health education interventions were delivered by various combinations of healthcare workers, including link or community health workers (16 studies), dieticians (12 studies), nurses (16 studies), podiatrists (one study), psychologists (two studies), lay workers (four studies) and exercise physiologists (two studies). One study used a solely multimedia‐based intervention (Khan 2011‐ Hispanic). Appendix 9 shows the range of health education teams used to provide the programmes in these RCTs.
Duration of interventions and follow‐up
The interventions lasted from one session (Hawthorne 1997) to 24 months (Gary 2009; Toobert 2011). The median duration of interventions was six months, whilst the mean duration was roughly eight months. Twelve studies followed up participants between one and three months after the start of the intervention. Twenty‐two studies followed up participants between three and nine months after the intervention. Twelve studies collected data between nine and 18 months after the intervention. Only four studies (Bellary 2008; D'Eramo Melkus 2010; Gary 2009; Rothschild 2013) followed up participants for longer than 18 months from the start of the interventions. In two cases, the intervention groups were reassessed immediately after the intervention phase had been completed (Babamoto 2009; Skelly 2005). Several studies mentioned the ethical dilemma they faced in asking a control group from a community that was needy and deprived to wait a significant period of time before they could benefit from the intervention, and serious worries arose that people would refuse to enter an RCT if they believed there was a good chance they would not benefit from it. Six studies used a delayed intervention for the control group (Brown 2002; DePue 2013; Kim 2009; Lorig 2008; Middelkoop 2001; Spencer 2011 Hispanic). Middelkoop 2001 was the only paper offering delayed intervention that collected data on that group afterwards, in the style of a cross‐over study.
Types of outcome measures used
A variety of outcome measures were used by the various trials: diabetes‐related biochemical blood values (HbA1c levels, lipid levels, blood glucose levels); results of validated attitudinal and behavioural questionnaires; knowledge of different diabetes‐related topics; health‐related quality of life measures; weight, body mass index (BMI) or waist‐to‐hip ratios; and blood pressure measurements. HbA1c was the most commonly measured outcome, as it was included in all but one study (Baradaran 2006). Seventeen studies used blood pressure measurements as outcome measures, and 26 studies used a variety of different, but validated, before and after questionnaires asking for behavioural and attitudinal measures. The degree of heterogeneity of the outcome measures in these studies is illustrated by the following example of assessing knowledge about diabetes, although some improvement has been described in studies using similar instruments since the time of the first review, thereby allowing a better comparison. Eighteen of the 33 studies assessed knowledge, and we identified 11 different instruments used to collect these data. The 24‐item Diabetes Knowledge Questionnaire specifically adapted for Hispanics was used most by various studies, with five studies utilising it (Babamoto 2009; Brown 2002; Lujan 2007; Sixta 2008; Vincent 2007). The Diabetes Knowledge Scale was used by three different studies (Carter 2011; Keyserling 2002; Samuel‐Hodge 2009).
Seven studies (D'Eramo Melkus 2010; Keyserling 2002; Kim 2009; Rosal 2005; Skelly 2005; Skelly 2009; Toobert 2011) used validated quality of life measures, and most papers used different instruments. As the Diabetes Quality of Life Measure (DQOL) used in Kim 2009 had a scale wherein a lower value inferred a positive outcome (which was opposite to results in the other studies), this value was inverted in the analysis. Five studies recorded hospital admissions (Babamoto 2009; DePue 2013; Gary 2009; Lorig 2008; Rothschild 2013). Two studies recorded hypoglycaemic/hyperglycaemic episodes (Lorig 2008; Philis‐Tsimikas 2011). No studies really addressed the long‐term incidence of complications of diabetes or mortality rates (although 18 studies provided data on the number of participants who died during the study period); however given their relatively short follow‐up times, this is not too surprising. Still only seven studies included in their discussions a rough estimate of the costs of the interventions post hoc, with only Bellary 2008 providing sufficient detail.
With respect to follow‐up times, a variety of subtly different timings were used. The study authors, for the sake of some clarity, grouped these into immediate and three, six, 12 and 24 months by rounding them to the nearest point. For instance, an outcome measure at eight weeks would be rounded into the three‐month category. This was seen as essential for any meaningful meta‐analysis.
Comparison groups
The comparison groups in the selected studies tended to receive 'usual' care, which varied depending on the country of origin of the study and its healthcare system. Half of the studies' control groups received their usual care alone, with roughly half of those being "wait‐listed" for the intervention, as described above. Control groups of the other studies received usual care plus a token non–culturally adapted intervention, such as mailed leaflets, newsletters and occasional telephone calls, to maintain interest. D'Eramo Melkus 2010 actually held group sessions for the control group, whilst Skelly 2009 delivered nurse‐led home visits to the control group.
Adverse effects
Although some data could be determined from 18 studies with losses to follow‐up reasons, only four studies investigated adverse events specifically and reported on whether they were secondary to the intervention (Bellary 2008; DePue 2013; Rothschild 2013; Spencer 2011 African‐Amer; Spencer 2011 Hispanic).
Outcome measures
Data from 28 of the 33 studies could be included in the meta‐analyses. One paper could not be included, as no results were provided in the paper and the study author was not able to provide further information (Skelly 2009). Three studies did not provide enough statistical information (e.g. no standard deviation/error, using a different method such as fixed‐effect regression models) to be incorporated into the meta‐analysis (Babamoto 2009; Carter 2011; DePue 2013). Again study authors were contacted to provide the missing data, but we received no response. The other study (Gucciardi 2007) could not be included in the meta‐analysis because it was comparing group versus group and individual counselling and had no comparable study (the only other study to include this comparison was Keyserling 2002, but the outcomes for the latter study were taken at six and 12 months, not at three months as in Gucciardi 2007, and therefore were not statistically comparable).
Some sections of data were excluded from some studies, as they were a hybrid of two methodologies: Middelkoop 2001 used an RCT method for the first six months, then changed to a 'controlled before and after study' method for the next 12 months; Lorig 2008 used an RCT of a diabetes self‐management group intervention for the first six months, followed by telephone reinforcement of only the intervention arm assessed at 18 months. For Anderson 2005, we used data from the first six weeks of the study only, as the wait‐list control group was offered the culturally appropriate health education intervention at this point and from then on was no longer a control group. Baradaran 2006 included more than two arms in the RCT: the intervention group and two control groups—one local white Caucasian and one South Asian. Participants in the white control group were not randomly assigned, and the results for that group were excluded from the meta‐analysis. Keyserling 2002 also had three arms: an intervention group that received care in the clinic and community, an intervention group that received care in the clinic only and the control group (minimal intervention). We decided to compare the most intensive intervention (clinical plus community care) with the control (usual care) group, as part of the main analysis.
Outcomes related to dietary recall or intake (Agurs‐Collins 1997; Babamoto 2009; Carter 2011; Kattelmann 2009; Keyserling 2002; Osborn 2010; Rosal 2005; Samuel‐Hodge 2009; Toobert 2011; Vincent 2007), physical activity (Babamoto 2009; Carter 2011; Kattelmann 2009; Lorig 2008; Osborn 2010; Rosal 2011; Samuel‐Hodge 2009; Skelly 2005; Toobert 2011; Vincent 2007), blood glucose monitoring (Lorig 2008; Rosal 2011), blood glucose level (Vincent 2007), circulating blood insulin (Kattelmann 2009) and reported symptoms related to diabetes (Lorig 2008; Skelly 2005) were not included in the analysis, as they had not been specified in the review protocol. Bellary 2008 included data related to complications of diabetes, such as microalbuminuria and coronary heart disease risk, but these could not be included in the meta‐analysis, as no comparable groups were available.
Psychosocial measures such as health‐related quality of life (QoL), knowledge of diabetes and so forth were assessed by various studies using a diversity of questionnaires, each assessing different aspects of these outcomes (e.g. knowledge of nutrition, knowledge of disease, knowledge of complications, monitoring of blood glucose, self‐efficacy in management or in diet). For each study, we chose one psychosocial outcome measure identified from the main focus of the study in question. For example, we included the outcome 'attitudes towards perceived seriousness of diabetes' in the Anderson 2005 study, omitting other attitudinal outcome measures. For the Keyserling 2002 and Skelly 2005 studies, we included results for mental QoL but did not include social QoL. For Rosal 2005, we included the Audit of Diabetes‐Dependent Quality of Life (ADDQoL), but not global or specific QoL scores. For Baradaran 2006, we selected attitudes towards seriousness of the condition and omitted attitudes towards complications. For Kim 2009, Vincent 2007 and Toobert 2011, we included results for self‐efficacy but excluded those for self‐care management, problem solving and stress management practice.
We excluded data that were outside of the outcome assessment points and could not be incorporated into the existing ones. Although both Lorig 2008 and Gary 2009 presented data on emergency department visits, this information was provided at different time frames and not in statistically comparable formats. For example, Gary 2009 presented data at 36 months, which was well beyond the two‐year outcome assessment point; Vincent 2007 presented data at eight and 12 weeks, so we included just the 12‐week data. Lorig 2008 presented data on satisfaction, but these could not be included, as no comparable data were provided by other studies. Kim 2009 presented what the study authors believed were anomalous data for baseline values and standard deviations of low‐density lipoprotein (LDL) cholesterol and serum triglyceride values of the control groups, so all data for LDL cholesterol and serum triglycerides were excluded from the analysis.
Excluded studies
A total of 135 full‐text articles describing studies were excluded; the main reasons for exclusion were a non‐randomised study design, trials without a specific ethnic minority group and trials in which not all participants had type 2 diabetes mellitus (for details, see Characteristics of excluded studies).
Risk of bias in included studies
2.
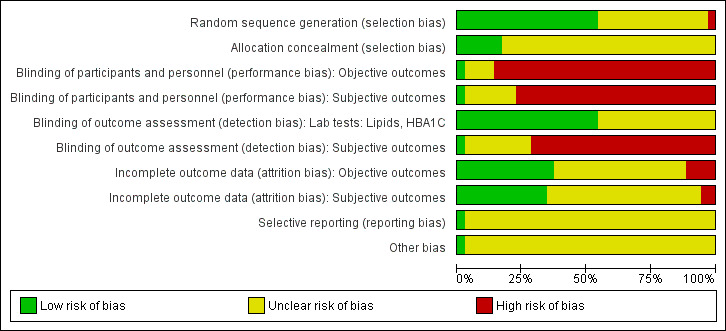
Risk of bias graph: review authors' judgements about each risk of bias item presented as percentages across all included studies.
3.
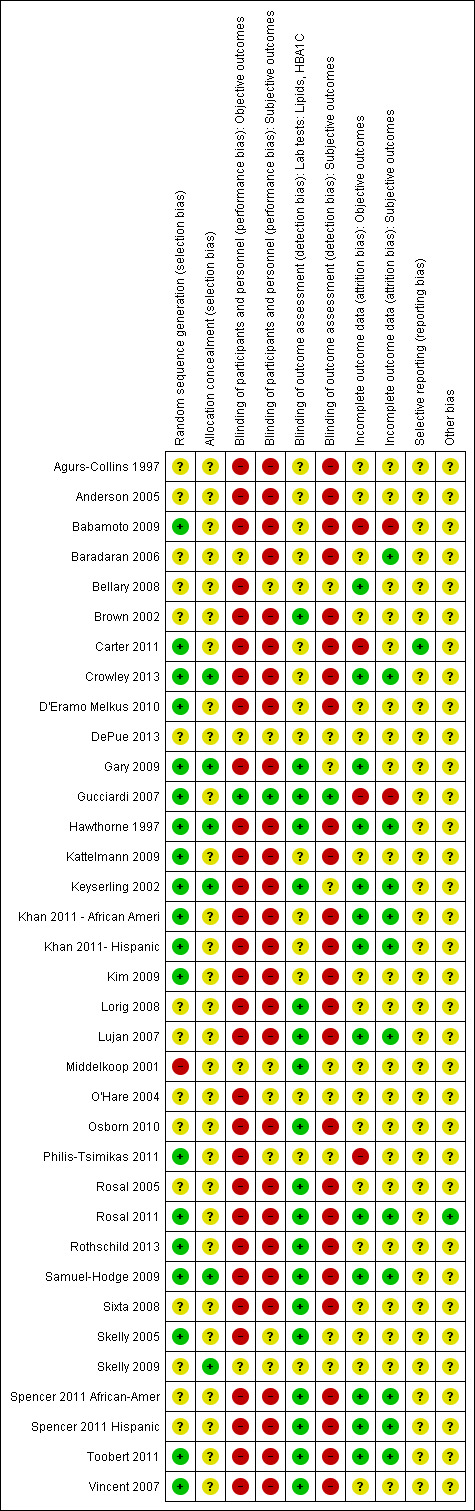
Risk of bias summary: review authors' judgements about each risk of bias item for each included study.
Allocation
Minimisation of selection bias
All studies included in the meta‐analysis were RCTs; therefore selection bias should have been minimised. Half of these studies adequately explained their randomisation process using an approved method, whilst the other half did not adequately describe their method of randomisation. Only one study (Middelkoop 2001) described an inadequate method of randomisation (using alternative dates of birth). In contrast, only six studies adequately described their allocation concealment (Crowley 2013; Gary 2009; Hawthorne 1997; Keyserling 2002; Samuel‐Hodge 2009; Skelly 2009).
Most studies published detailed baseline data, often with P values or similarities between groups to highlight pre‐intervention differences. Several studies demonstrated statistically significant differences between intervention and control groups in baseline characteristics such as gender and, most commonly, age (Gary 2009; Samuel‐Hodge 2009; Spencer 2011 Hispanic; Toobert 2011), but none seemed so different as to warrant concern for the validity of the study. Perhaps more likely to influence the results was the large variance in pre‐intervention mean HbA1c between studies. These ranged from 6.6% (Vincent 2007) to 11.8% (Brown 2002). Other variables that had significant stated inter‐study variation at baseline included mean body mass index (25.7 (Kim 2009) to 36.7 kg/m2 (Osborn 2010)), mean age (45 (D'Eramo Melkus 2010) to 68.5 years (Skelly 2009)) and gender ratio (100% female (D'Eramo Melkus 2010; Skelly 2005; Skelly 2009; Toobert 2011) to 37.5% female (Kim 2009)).
Blinding
The studies used various outcomes, both subjective and objective. HbA1c, blood pressure, body mass index, serum cholesterol and hospital visits were among those classed as objective, whilst health‐related quality of life, knowledge and self‐efficacy were the main subjective outcomes. Objective measures with standardised methods of collecting, such as blood tests and automated blood pressure readings, were deemed at low risk of detection bias, as knowledge of a participant's group was considered unlikely to affect the outcome. Those that required levels of rounding (such as BMI and waist circumference) and a more subjective method of measurement (such as manual blood pressure) were deemed at unclear risk of detection bias when performed by non‐blinded staff. All subjective measures used self‐reporting as a method of detection (such as using questionnaires) and thus were deemed at high risk of detection bias, as the participants were never blinded. As all studies fell into this category, data were comparable, if not likely to overestimate the effects of the intervention. Those that were deemed to have an unclear risk of bias included no subjective measures or no relevant data in the meta‐analysis.
Minimisation of detection and performance bias
No studies explicitly stated that blinding of participants was undertaken. This type of intervention makes it impossible for participants to be 'blind' to their group status, and assessors are likely to learn the status of participants at the outcome measurement interviews.
However, 11 studies reported that single blinding of some or all of the outcome assessors was undertaken (Babamoto 2009; Gary 2009; Gucciardi 2007; Kattelmann 2009; Rosal 2011; Rothschild 2013; Samuel‐Hodge 2009; Sixta 2008; Skelly 2009; Spencer 2011 Hispanic; Toobert 2011).
The remaining 22 studies did not provide sufficient information about blinding procedures, and so it is assumed that neither participants nor assessors were blinded.
Incomplete outcome data
Numbers of study withdrawals were adequately described in 15 studies that had losses to follow‐up (Agurs‐Collins 1997; Baradaran 2006; Bellary 2008; D'Eramo Melkus 2010; Hawthorne 1997; Kattelmann 2009; Keyserling 2002; Khan 2011 ‐ African Ameri; Kim 2009; Lujan 2007; O'Hare 2004; Samuel‐Hodge 2009; Skelly 2005; Skelly 2009; Spencer 2011 African‐Amer).
Analysis was reported as intention‐to‐treat in 10 studies (Bellary 2008; Brown 2002; D'Eramo Melkus 2010; Gary 2009; Keyserling 2002; O'Hare 2004; Rosal 2011; Samuel‐Hodge 2009; Spencer 2011 African‐Amer; Toobert 2011). The remaining studies either did not specify their method of analysis or used a per‐protocol analysis.
Seven studies did not report losses to follow‐up (Brown 2002; Gucciardi 2007; Kim 2009; Middelkoop 2001; Rosal 2005; Rosal 2011; Sixta 2008).
Detailed descriptions of participant withdrawals and reasons underpinning them were not provided in studies by Anderson 2005; Babamoto 2009; Brown 2002; Carter 2011; Crowley 2013; Gary 2009; Gucciardi 2007; Lorig 2008; Middelkoop 2001; Osborn 2010; Philis‐Tsimikas 2011; Rosal 2005; Rosal 2011; Sixta 2008; Toobert 2011; and Vincent 2007.
Minimisation of attrition bias
Much variation in the degree of attrition was noted between studies. Twenty papers reported relatively low numbers that had withdrawn, had been lost to follow‐up or had died during the course of the study (less than 20% attrition at follow‐up: Agurs‐Collins 1997; Anderson 2005; Bellary 2008; Brown 2002; Crowley 2013; D'Eramo Melkus 2010; Gary 2009; Hawthorne 1997; Kattelmann 2009; Keyserling 2002; Kim 2009; Lorig 2008; Lujan 2007; O'Hare 2004; Rosal 2005; Rosal 2011; Samuel‐Hodge 2009; Skelly 2005; Skelly 2009; Vincent 2007). Eight studies achieved attrition rates of between 20% and 30% (Carter 2011; D'Eramo Melkus 2010; Gucciardi 2007; Osborn 2010; Philis‐Tsimikas 2011; Sixta 2008; Spencer 2011 African‐Amer; Toobert 2011). The reasons for those lost to follow‐up were largely heterogeneous and ranged from family crises to emigration. None of the withdrawals or losses to follow‐up were likely to be due to any interventional harm, given its nature, but more likely reflected differing local communities, the tenacity of the study authors and the nature of the intervention in engaging participants. As all studies used subtly different methodologies and interventions, it was impossible to correlate the attrition rate with a particularly successful method of intervention. The effects of the attrition rate can be examined by using a sensitivity analysis to eliminate those studies with high attrition rates.
Selective reporting
In nearly all studies, all outcomes appeared to have been reported; however, we did not view the trial protocol documents for most of these. Rothschild 2013 did provide a large quantity of baseline data for which follow‐up data were not adequately provided. However, this study had only recently been published, and further results may become available in the future. As only one paper did not provide some form of data for HbA1c, this would be the least likely value to be subject to reporting bias. Regarding the other objective measures, their tendency to be largely statistically insignificant on meta‐analysis would render a reporting bias unlikely to affect the end result. In summary, the authors did not have significant concern over reporting bias in this meta‐analysis.
Other potential sources of bias
Twelve studies (Agurs‐Collins 1997; Bellary 2008; Crowley 2013; D'Eramo Melkus 2010; Hawthorne 1997; Kattelmann 2009; Keyserling 2002; Kim 2009; Philis‐Tsimikas 2011; Samuel‐Hodge 2009; Skelly 2005; Toobert 2011) included power calculations in their methodology. Three studies (Bellary 2008; O'Hare 2004; Samuel‐Hodge 2009) were designed as cluster RCTs, although the statistical analysis was based on individual participant data. This was taken into account in our sensitivity analyses. The remaining studies used individual participants as the unit of randomisation and assessment.
Effects of interventions
See: Table 1
Baseline characteristics
For details of baseline characteristics, see Appendix 3 and Appendix 4.
Culturally appropriate health education compared with conventional diabetes education
Primary outcomes
Glycaemic control
Glycaemic control, as measured by HbA1c levels, showed improvement following culturally appropriate health education interventions compared with 'usual care' received by control groups at three months (data from 13 studies), six months (13 studies), 12 months (nine studies) and 24 months (four studies): MD ‐0.4% (95% CI ‐0.5 to ‐0.2); MD ‐0.5% (95% CI ‐0.7 to ‐0.4); MD ‐0.2% (95% CI ‐0.3 to ‐0.04); and MD ‐0.3% (95% CI ‐0.6 to ‐0.1), respectively. See Figure 4 and Figure 5 and Analysis 1.1 to Analysis 1.5.
4.
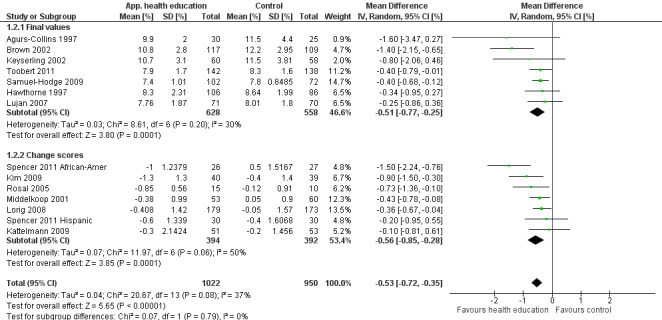
Forest plot of comparison: 1 Culturally tailored health education compared with conventional or usual diabetes health care, outcome: 1.2 Mean HbA1c up to 6 months [%].
5.
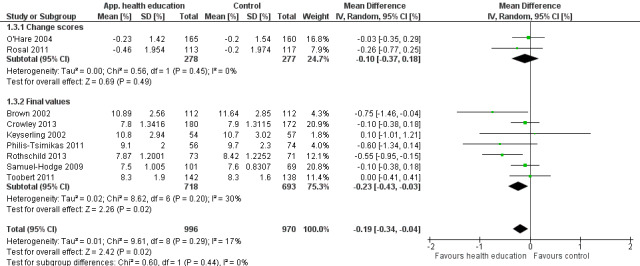
Forest plot of comparison: 1 Culturally tailored health education compared with conventional or usual diabetes health care, outcome: 1.3 Mean HbA1c up to 1 year [%].
1.1. Analysis.
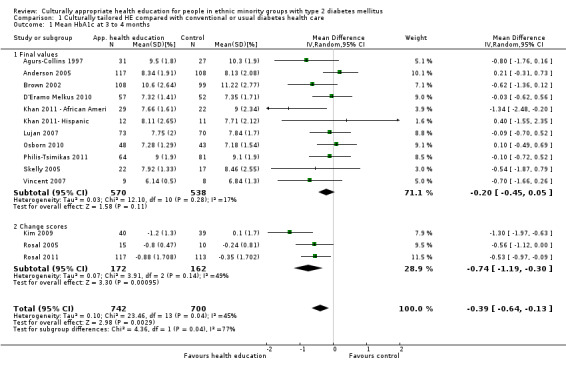
Comparison 1 Culturally tailored HE compared with conventional or usual diabetes health care, Outcome 1 Mean HbA1c at 3 to 4 months.
1.5. Analysis.
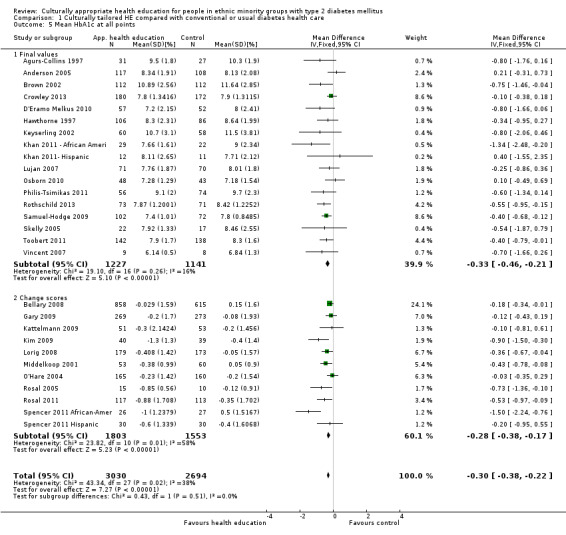
Comparison 1 Culturally tailored HE compared with conventional or usual diabetes health care, Outcome 5 Mean HbA1c at all points.
Health‐related quality of life measures
Only three of the seven studies reporting this outcome provided data that we could incorporate into the meta‐analysis. No statistically significant effects of the interventions on health‐related quality of life measures were noted at any of the time points (three, six and 12 months post intervention) in the three studies reporting these outcomes (Analysis 1.6 to Analysis 1.11).
1.6. Analysis.
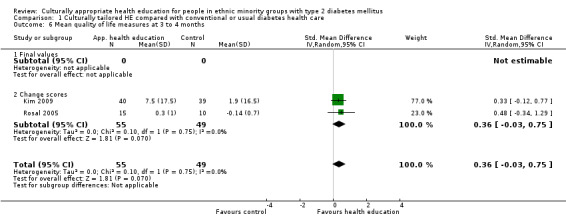
Comparison 1 Culturally tailored HE compared with conventional or usual diabetes health care, Outcome 6 Mean quality of life measures at 3 to 4 months.
1.11. Analysis.

Comparison 1 Culturally tailored HE compared with conventional or usual diabetes health care, Outcome 11 Mean quality of life at all endpoints.
Adverse events
Although some data were able to be extrapolated regarding particular adverse events such as hypoglycaemic episodes, mortality during the intervention and illness leading to losses to follow‐up; only four studies reported on the overall adverse events specifically. In all four studies no adverse events were noted which were felt to be a result of the intervention (Bellary 2008; DePue 2013; Rothschild 2013; Spencer 2011 Hispanic).
Secondary outcomes
Knowledge scores
Participants receiving culturally appropriate health education interventions improved their knowledge scores at three months (nine studies), six months (nine studies) and 12 months (two studies) post intervention (SMD 0.35 (95% CI 0.10 to 0.59); SMD 0.50 (95% CI 0.33 to 0.68); SMD 0.35 (95% CI 0.13 to 0.57), respectively). See Figure 6 and Analysis 1.10 to Analysis 1.13. However, because different tools of assessment were used, we cannot determine the extent of the improvement, only that an improvement did occur.
6.
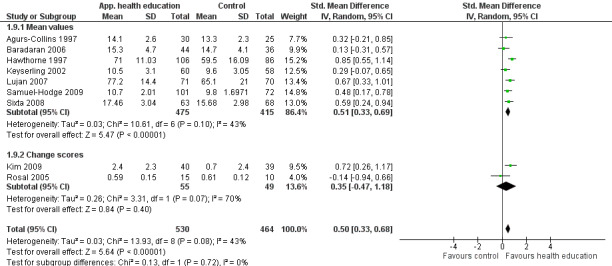
Forest plot of comparison: 1 Culturally tailored HE compared with conventional or usual diabetes health care, outcome: 1.9 Final mean knowledge (diabetes and nutrition knowledge) at up to 6 months.
1.10. Analysis.
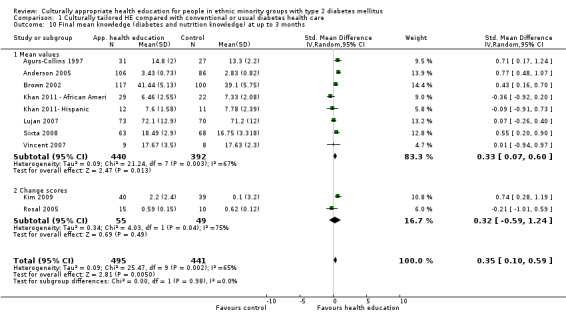
Comparison 1 Culturally tailored HE compared with conventional or usual diabetes health care, Outcome 10 Final mean knowledge (diabetes and nutrition knowledge) at up to 3 months.
1.13. Analysis.
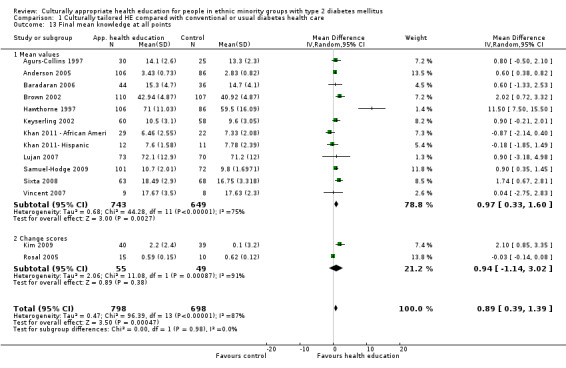
Comparison 1 Culturally tailored HE compared with conventional or usual diabetes health care, Outcome 13 Final mean knowledge at all points.
Patient empowerment and self‐efficacy
A statistically significant difference in measures of self‐efficacy was observed at six months (four studies) post intervention (SMD 0.49 (95% CI 0.18 to 0.80)). However, differences were inconclusive at three (six studies) and 12 months (two studies) (see Analysis 1.14 to Analysis 1.18).
1.14. Analysis.
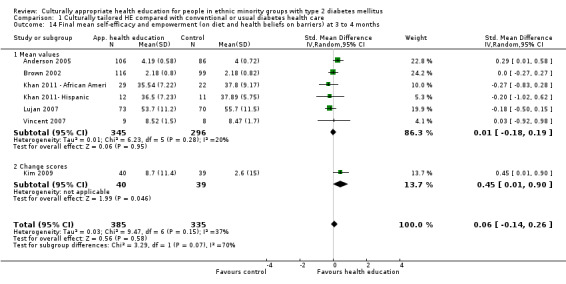
Comparison 1 Culturally tailored HE compared with conventional or usual diabetes health care, Outcome 14 Final mean self‐efficacy and empowerment (on diet and health beliefs on barriers) at 3 to 4 months.
1.18. Analysis.
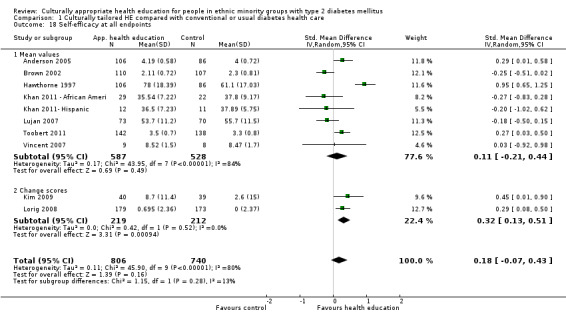
Comparison 1 Culturally tailored HE compared with conventional or usual diabetes health care, Outcome 18 Self‐efficacy at all endpoints.
Lipid levels
No statistically significant differences between intervention and control groups in total cholesterol, LDL and HDL levels were noted at three, six and 12 months post intervention (Analysis 1.19 to Analysis 1.28). A statistically significant difference in triglyceride levels was observed between intervention and control groups at three months (five studies) (MD ‐24 mg/dL (95% CI ‐40 to ‐8)). However, this was not sustained at six and 12 months (four and three studies, respectively). Some indication of skewness was seen (mean difference divided by its SD was less than two) in the triglyceride data, which may make these results misleading and difficult to interpret (Analysis 1.29 to Analysis 1.31).
1.19. Analysis.
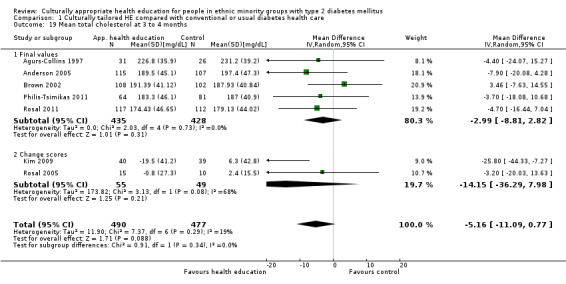
Comparison 1 Culturally tailored HE compared with conventional or usual diabetes health care, Outcome 19 Mean total cholesterol at 3 to 4 months.
1.28. Analysis.
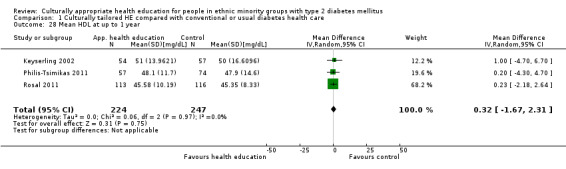
Comparison 1 Culturally tailored HE compared with conventional or usual diabetes health care, Outcome 28 Mean HDL at up to 1 year.
1.29. Analysis.
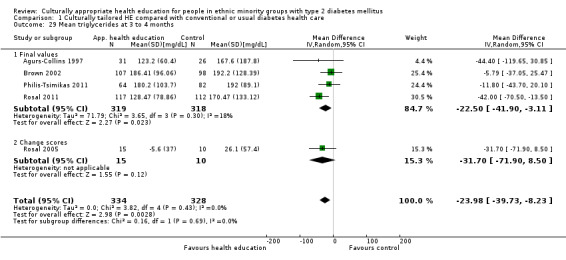
Comparison 1 Culturally tailored HE compared with conventional or usual diabetes health care, Outcome 29 Mean triglycerides at 3 to 4 months.
1.31. Analysis.
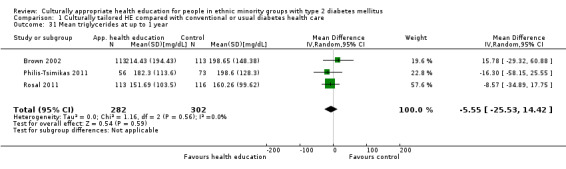
Comparison 1 Culturally tailored HE compared with conventional or usual diabetes health care, Outcome 31 Mean triglycerides at up to 1 year.
Other secondary outcome measures
Other secondary outcome measures that showed neutral effects of health education interventions included participant‐based outcomes: BMI measurements (three studies: Analysis 1.32 to Analysis 1.35), systolic blood pressure (three studies: Analysis 1.36 to Analysis 1.39) and diastolic blood pressure (four studies: Analysis 1.40 to Analysis 1.43). No studies included participant satisfaction scores, although Keyserling 2002 and Skelly 2005 stated that they had undertaken some form of participant satisfaction assessment. Three studies (Anderson 2005; Baradaran 2006; Hawthorne 1997) provided data on participant attitudes; however these data were not comparable, as they were very different outcomes (e.g. seriousness vs refusing food) or were assessed at different time points. Two studies (Bellary 2008; Toobert 2011) described complications of diabetes such as microalbuminuria or coronary heart disease risk, but none of these were the same complications at the same time points. Three studies provided data on emergency department visits (Analysis 1.44; Analysis 1.45), but this was not given in a comparable format and reflected different outcome points. Only one paper provided data on number of hospitalisations (Gary 2009; Analysis 1.46).
1.32. Analysis.
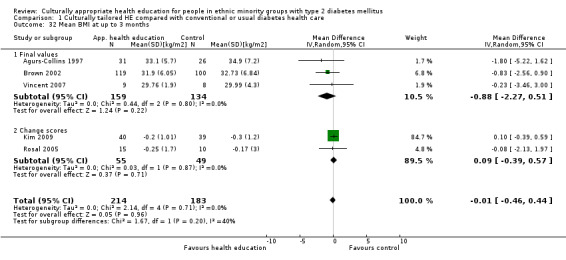
Comparison 1 Culturally tailored HE compared with conventional or usual diabetes health care, Outcome 32 Mean BMI at up to 3 months.
1.35. Analysis.
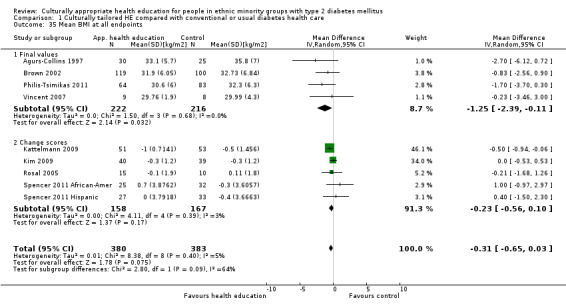
Comparison 1 Culturally tailored HE compared with conventional or usual diabetes health care, Outcome 35 Mean BMI at all endpoints.
1.36. Analysis.
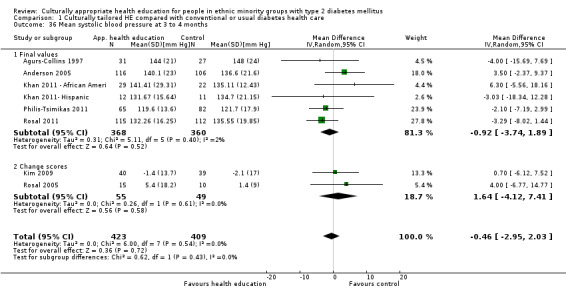
Comparison 1 Culturally tailored HE compared with conventional or usual diabetes health care, Outcome 36 Mean systolic blood pressure at 3 to 4 months.
1.39. Analysis.
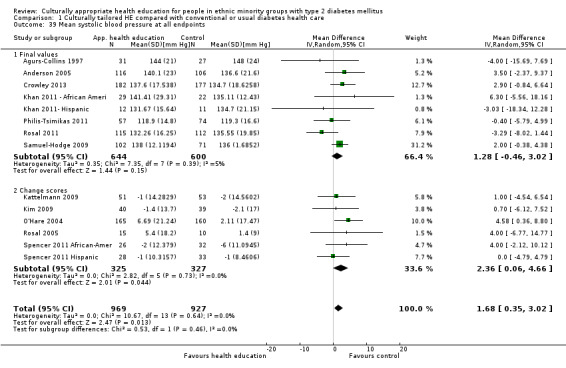
Comparison 1 Culturally tailored HE compared with conventional or usual diabetes health care, Outcome 39 Mean systolic blood pressure at all endpoints.
1.40. Analysis.
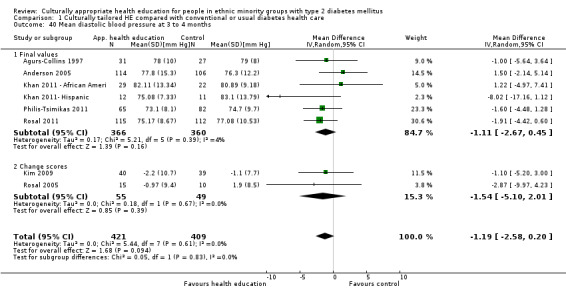
Comparison 1 Culturally tailored HE compared with conventional or usual diabetes health care, Outcome 40 Mean diastolic blood pressure at 3 to 4 months.
1.43. Analysis.
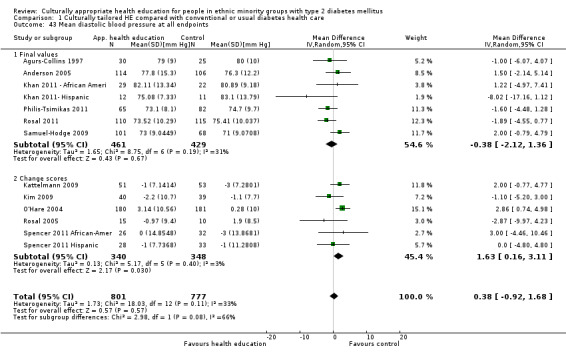
Comparison 1 Culturally tailored HE compared with conventional or usual diabetes health care, Outcome 43 Mean diastolic blood pressure at all endpoints.
1.44. Analysis.
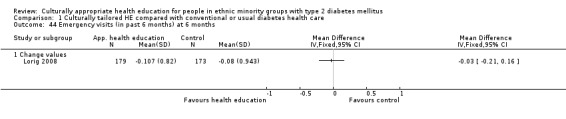
Comparison 1 Culturally tailored HE compared with conventional or usual diabetes health care, Outcome 44 Emergency visits (in past 6 months) at 6 months.
1.45. Analysis.
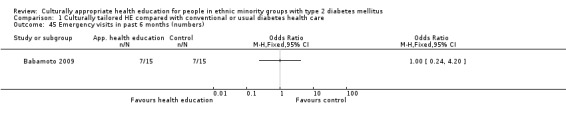
Comparison 1 Culturally tailored HE compared with conventional or usual diabetes health care, Outcome 45 Emergency visits in past 6 months (numbers).
1.46. Analysis.
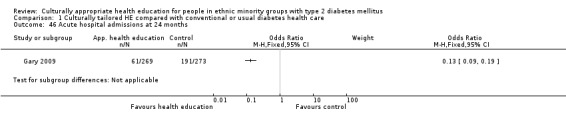
Comparison 1 Culturally tailored HE compared with conventional or usual diabetes health care, Outcome 46 Acute hospital admissions at 24 months.
Only one paper (Lorig 2008) looked at the cost‐effectiveness of its intervention compared with control, which was £28,933 per quality‐adjusted life‐year (QALY) gained. A few studies had discussed rough estimates of cost in their discussions (in the USA, Agurs‐Collins 1997 estimated costs to be $150 per participant over six months, Brown 2002 estimated costs at $384 per participant for a 12‐month period and Lorig 2008 estimated costs at $250 per participant over six weeks; in the UK, O'Hare 2004 estimated costs per participant as £365 (approx. $590) per year and Bellary 2008 as £434 (approx. $701) per participant over two years).
Outcomes specified by the protocol but not measured by the included studies
None of the studies reported longer‐term measures of diabetes outcomes, such as incidence of long‐term complications of diabetes. Total or specific mortality rates from causes attributable to diabetes was not an outcome for any of the studies. However, 18 studies gave information on participants who had died and were lost to follow‐up, but reasons were only given for five participants in three studies (Hawthorne 1997, Lujan 2007, Samuel‐Hodge 2009).
Sensitivity analyses
Several of the studies had methodological or reporting issues that led to sensitivity analyses of the main meta‐analyses. In particular, the following studies were identified for sensitivity analyses (see Analysis 2.1 to Analysis 2.23).
2.1. Analysis.
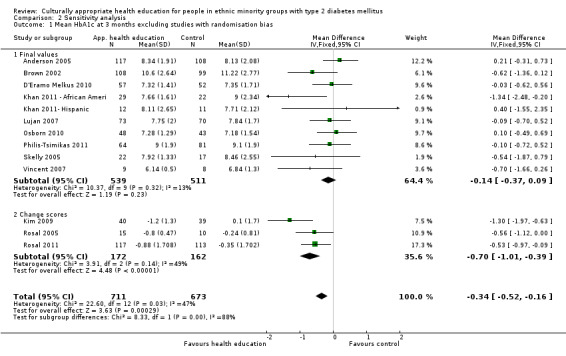
Comparison 2 Sensitivity analysis, Outcome 1 Mean HbA1c at 3 months excluding studies with randomisation bias.
2.23. Analysis.
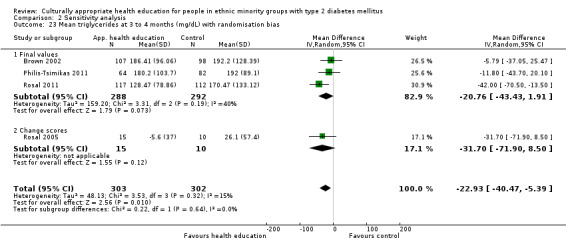
Comparison 2 Sensitivity analysis, Outcome 23 Mean triglycerides at 3 to 4 months (mg/dL) with randomisation bias.
-
Anderson 2005. Excluded from analyses at three months on HbA1c, mean systolic and diastolic blood pressures, mean cholesterol, self‐efficacy and knowledge due to:
different time frame of assessment (six weeks);
subjective measures with no scale direction (positive/negative); or
unsure validity of self‐efficacy assessment tool.
-
Agurs‐Collins 1997. Excluded from analyses for HbA1c and diabetes knowledge at three and six months because of:
significant differences between baseline HbA1c data at three and six months; or
no scale direction given for diabetes knowledge.
Baradaran 2006. Excluded from analysis of diabetes knowledge at six months as no mention of validity for study population.
Bellary 2008. Excluded from analysis for blood pressure, total cholesterol, HbA1c and BMI as used cluster randomisation.
Brown 2002. Excluded from analysis for self‐efficacy at 12 months as no description of scale direction (although this was assumed to be positive in the original review).
Gary 2009. Excluded for HbA1c at 24 months as we felt this was a very complex intervention with many confounding factors aside from health education.
-
Keyserling 2002. Excluded at six‐ and twelve‐month analyses for:
quality of life because of significant differences in baseline data and no mention of scale direction; or
diabetes knowledge because of no mention of validity of assessment of diabetes knowledge.
Khan 2011 ‐ African Ameri and Khan 2011‐ Hispanic. Excluded from analysis of self‐efficacy at three months. No mention of scale direction or validity of assessment tool.
-
Kim 2009. Excluded from analysis for HbA1c, systolic and diastolic blood pressures, total and HDL cholesterol, health‐related quality of life, self‐efficacy and diabetes knowledge at six and twelve months because of:
change values given for diabetes knowledge that cannot be used with SMD;
different time frames of outcome assessment (18 and 30 weeks); or
no mention of the validity of the modified version of the quality of life questionnaire.
O'Hare 2004. Excluded from analyses of HbA1c at one year and total cholesterol at one year as used cluster randomisation.
Rosal 2005. Excluded from analyses of diabetes knowledge at three and six months as used change values that cannot be used with SMD.
-
Samuel‐Hodge 2009. Excluded from analyses of HbA1c, blood pressure and diabetes knowledge at six and 12 months as:
this study used cluster randomisation;
a non‐standard time frame assessment was performed (eight months); or
no mention was made of validity of assessment for diabetes knowledge.
Toobert 2011. Excluded from analyses of self‐efficacy at six and 12 months as no mention of validity of the assessment tool.
Concealment of allocation sensitivity analysis. Only seven studies (Crowley 2013; Gary 2009; Gucciardi 2007; Hawthorne 1997; Keyserling 2002; Samuel‐Hodge 2009; Skelly 2009) provided enough information to assess allocation concealment, which was appropriate in all seven studies. We assessed the effect of including only these studies for primary and statistically significant outcomes.
We tested the robustness of the analysis by changing all outcomes from a random‐effects to a fixed‐effect model to see whether this produced a significant effect.
We looked at the results of meta‐analysis of outcome measures when the heterogeneity score (I2 ) was high (greater than 75%). These were self‐efficacy at six and 12 months and diastolic blood pressure at 12 months.
Results of sensitivity analyses for outcome effects
Because of the size of the analysis, we have given a detailed description of the primary outcome measures and those with a statistically significant effect in the meta‐analysis.
-
HbA1c
Excluding studies with randomisation bias (see above and Analysis 2.1, Analysis 2.3, Analysis 2.6 and Analysis 2.9) decreased the effect of improvement in mean difference (MD) in HbA1c seen in the main analysis at three months from ‐0.39% to ‐0.34%. However, this improved at six months (‐0.53% changing to ‐0.55%), 12 months (‐0.19% to ‐0.27%) and 24 months (‐0.33% to ‐0.47%).
-
Excluding studies with non‐standard time frames (see Analysis 2.2 and Analysis 2.4) increased the effect of MD at three months (‐0.39% changing to ‐0.43%) but slightly decreased the effect of the intervention at six months (‐0.53% changing to ‐0.52%).
Excluding studies with inadequate description of allocation concealment (see Analysis 2.5, Analysis 2.7 and Analysis 2.10) decreased the effect of improvement in MD at six months (‐0.53% changing to ‐0.41%), 12 months (‐0.19% changing to ‐0.09%) and 24 months (‐0.33% changing to ‐0.12%).
Excluding studies with complex interventions (Gary 2009; see Analysis 2.8) increased the effect of the intervention from MD ‐0.33% to ‐0.47%. Changing the model from random‐effects to fixed‐effect made the confidence interval smaller at all time points.
-
Health‐related quality of life
Because only three studies with usable data measured this outcome, data were insufficient for a sensitivity analysis, as zero or one study only was left when studies were excluded.
-
Knowledge
Excluding studies with randomisation bias (see above and Analysis 2.12 and Analysis 2.16) decreased the effect of the intervention on knowledge at three months (SMD 0.35 changing to 0.31). However, this increased at six months (SMD 0.50 changing to 0.51).
Excluding studies with non‐standard time frames (see above and Analysis 2.15) decreased the effect of the intervention at three months (SMD 0.35 changing to 0.28) and had no effect at six months.
Excluding studies for which the tool was not validated and/or we were unable to determine the direction of the scale (see above and Analysis 2.15, Analysis 2.17 and Analysis 2.20) meant that the outcome changed to a non–statistically significant effect at three months (SMD 0.35 changing to ‐0.19). However, an increased effect was seen at six months (SMD 0.50 changing to 0.62). As only one study was left at 24 months, no analysis could be made.
Excluding studies with inadequate description of allocation concealment (see above) increased the effect of the intervention at six months (SMD 0.50 changing to 0.55). No studies were left at three months and only one study was left at 12 months, so no analysis was performed for these points.
-
Excluding those studies with change scores (see above and Analysis 2.14 and Analysis 2.19) decreased the effect of the intervention at three months (SMD 0.35 changing to 0.33). However, the effect increased at six months (SMD 0.50 changing to 0.51).
Changing from a random‐effects to a fixed‐effect model led to a smaller confidence interval at three and six months post intervention but no effect at one year.
-
Other outcome measures showing change
Excluding studies with randomisation bias (Agurs‐Collins 1997; see Analysis 2.23) decreased the effect of the intervention on serum triglycerides at three months post intervention (MD ‐23.98 mg/dL changing to ‐22.93 mg/dL). No changes to the outcome effect were noted for triglycerides when a sensitivity analysis was done by changing from a random‐effects to a fixed‐effect model. Removing studies with inadequate descriptions of allocation concealment for triglycerides left no studies remaining, so no further analysis could be done for this outcome.
Excluding studies with non‐standard time frames from the meta‐analyses (Kim 2009; see Analysis 2.21; and Anderson 2005; see Analysis 2.22) meant that a statistically significant improvement was now shown for BMI at six months (MD ‐0.31 changing to MD ‐0.47) and for diastolic blood pressure at three months (MD ‐1.19 changing to MD ‐1.64).
None of the other outcome measures at any time points in the sensitivity analyses led to a change in the statistical outcome (improved or not) affected by the sensitivity analyses.
2.3. Analysis.
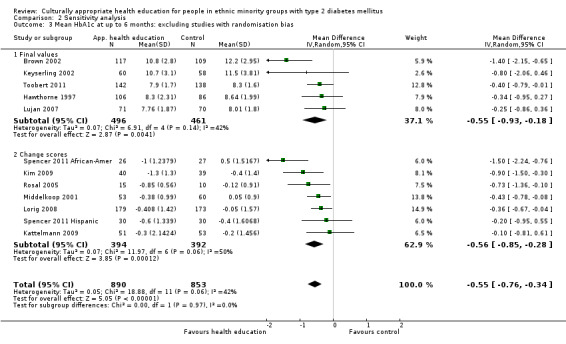
Comparison 2 Sensitivity analysis, Outcome 3 Mean HbA1c at up to 6 months: excluding studies with randomisation bias.
2.6. Analysis.
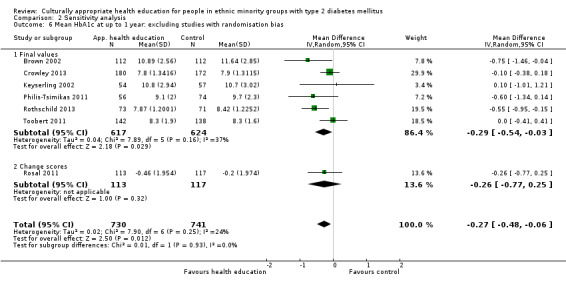
Comparison 2 Sensitivity analysis, Outcome 6 Mean HbA1c at up to 1 year: excluding studies with randomisation bias.
2.9. Analysis.
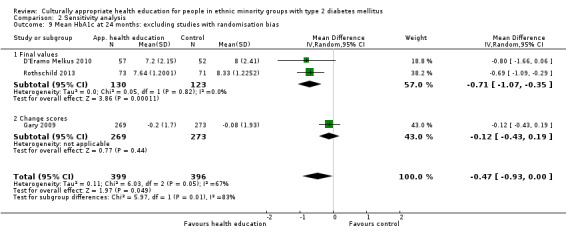
Comparison 2 Sensitivity analysis, Outcome 9 Mean HbA1c at 24 months: excluding studies with randomisation bias.
2.2. Analysis.
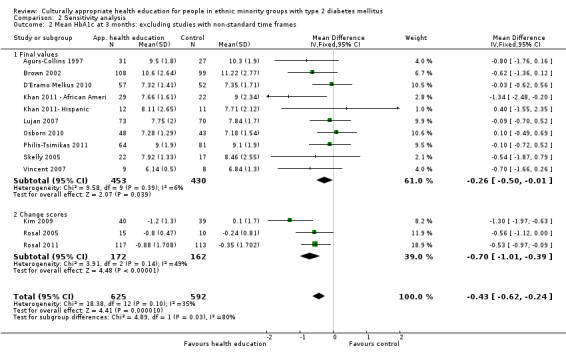
Comparison 2 Sensitivity analysis, Outcome 2 Mean HbA1c at 3 months: excluding studies with non‐standard time frames.
2.4. Analysis.
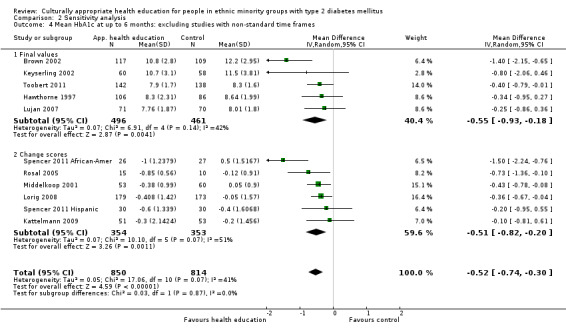
Comparison 2 Sensitivity analysis, Outcome 4 Mean HbA1c at up to 6 months: excluding studies with non‐standard time frames.
2.5. Analysis.
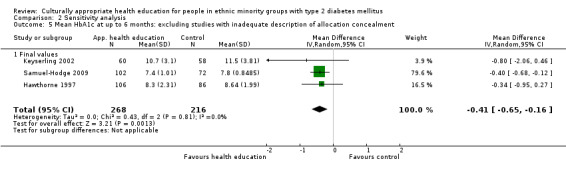
Comparison 2 Sensitivity analysis, Outcome 5 Mean HbA1c at up to 6 months: excluding studies with inadequate description of allocation concealment.
2.7. Analysis.
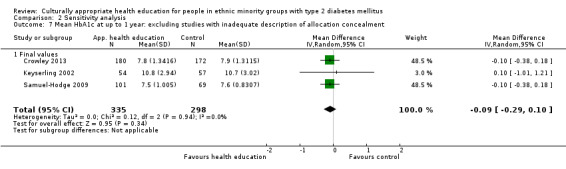
Comparison 2 Sensitivity analysis, Outcome 7 Mean HbA1c at up to 1 year: excluding studies with inadequate description of allocation concealment.
2.10. Analysis.
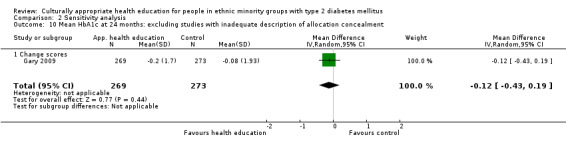
Comparison 2 Sensitivity analysis, Outcome 10 Mean HbA1c at 24 months: excluding studies with inadequate description of allocation concealment.
2.8. Analysis.

Comparison 2 Sensitivity analysis, Outcome 8 Mean HbA1c at 24 months: excluding studies with complex interventions: Gary 2009.
2.12. Analysis.
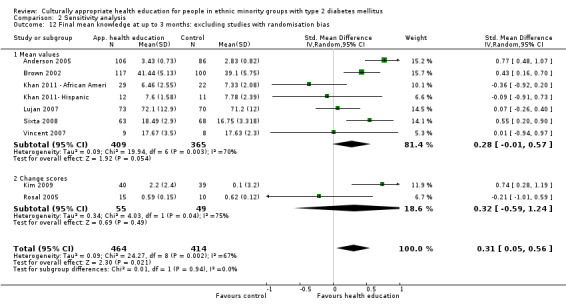
Comparison 2 Sensitivity analysis, Outcome 12 Final mean knowledge at up to 3 months: excluding studies with randomisation bias.
2.16. Analysis.
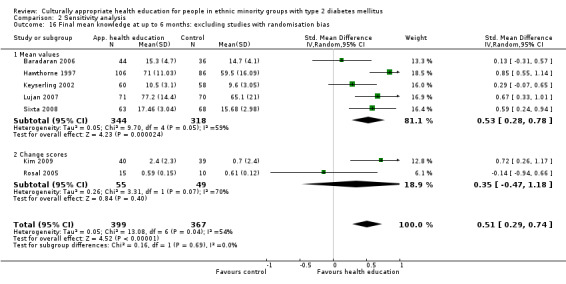
Comparison 2 Sensitivity analysis, Outcome 16 Final mean knowledge at up to 6 months: excluding studies with randomisation bias.
2.15. Analysis.
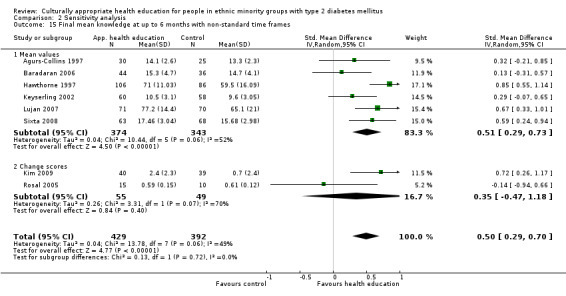
Comparison 2 Sensitivity analysis, Outcome 15 Final mean knowledge at up to 6 months with non‐standard time frames.
2.17. Analysis.
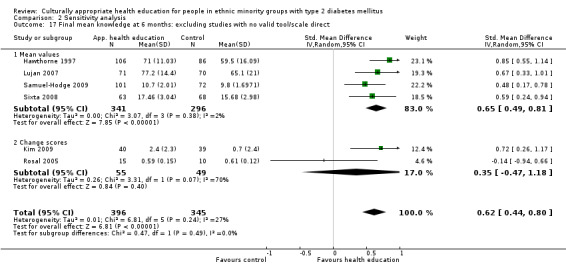
Comparison 2 Sensitivity analysis, Outcome 17 Final mean knowledge at 6 months: excluding studies with no valid tool/scale direct.
2.20. Analysis.
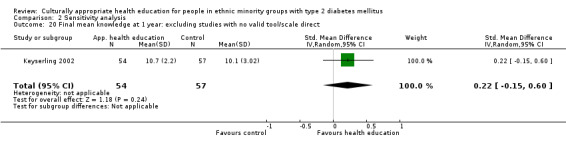
Comparison 2 Sensitivity analysis, Outcome 20 Final mean knowledge at 1 year: excluding studies with no valid tool/scale direct.
2.14. Analysis.
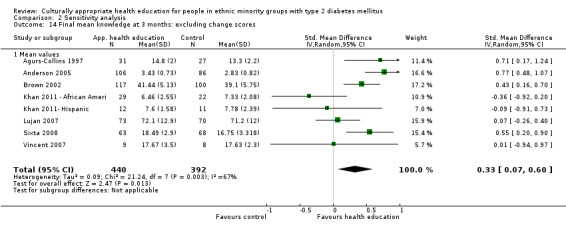
Comparison 2 Sensitivity analysis, Outcome 14 Final mean knowledge at 3 months: excluding change scores.
2.19. Analysis.
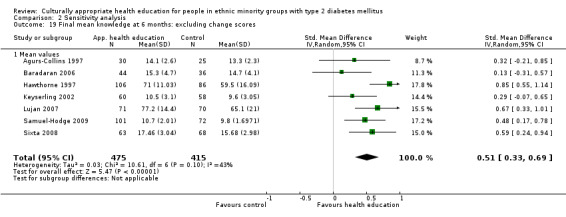
Comparison 2 Sensitivity analysis, Outcome 19 Final mean knowledge at 6 months: excluding change scores.
2.21. Analysis.
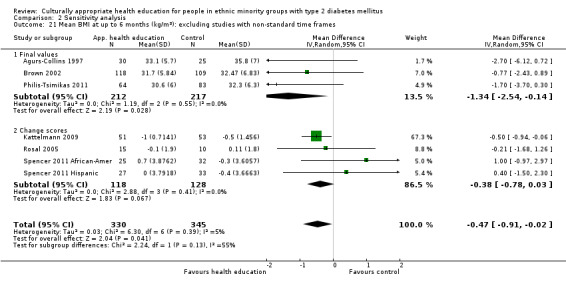
Comparison 2 Sensitivity analysis, Outcome 21 Mean BMI at up to 6 months (kg/m2): excluding studies with non‐standard time frames.
2.22. Analysis.
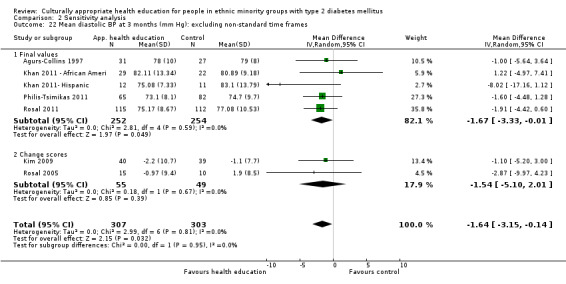
Comparison 2 Sensitivity analysis, Outcome 22 Mean diastolic BP at 3 months (mm Hg): excluding non‐standard time frames.
Tests for heterogeneity
We examined those results with high indices for heterogeneity (self‐efficacy and diastolic blood pressure where I2 values were greater than 75%). Removing individual studies for outcome assessment of blood pressure at 12 months made little effect on the heterogeneity. For self‐efficacy, if Hawthorne 1997 was removed from the analysis, heterogeneity significantly improved from 80% to 0%. A possible explanation may be that different measures of knowledge were being used in the studies compared. At one year, although self‐efficacy showed significant heterogeneity, only two studies were compared.
Subgroup analyses
Several possible subgroup analyses were identified in the protocol, to look at covariates, but data provided by the studies selected were not sufficient for evaluation of all. As a result, the following covariates were not investigated in the data: age, gender, educational status of participants, length of time since diagnosis of diabetes or presence or absence of diabetic complications. In addition, it was not always possible to identify the venue(s) at which the health education intervention took place, and indeed in some studies, a mixture of primary and secondary care venues was used for the convenience of participants, so venue could not be assessed. However, it was possible to perform the following subgroup analyses (Analysis 3.1 to Analysis 15.32 and Appendix 10), making some pragmatic decisions based on the low number of included studies and the different timing of collection of outcome measures, resulting in limitations to the types of comparisons that could be made.
3.1. Analysis.
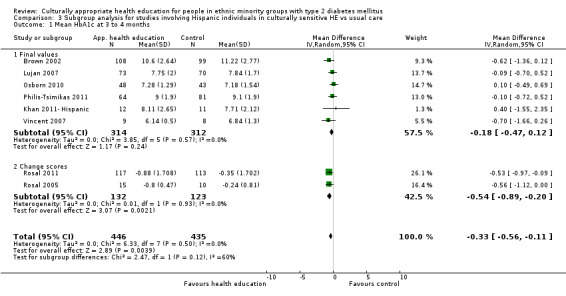
Comparison 3 Subgroup analysis for studies involving Hispanic individuals in culturally sensitive HE vs usual care, Outcome 1 Mean HbA1c at 3 to 4 months.
15.32. Analysis.
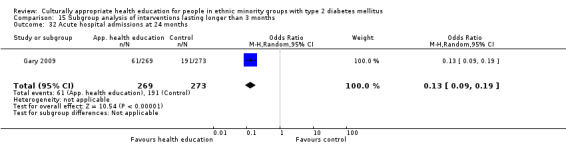
Comparison 15 Subgroup analysis of interventions lasting longer than 3 months, Outcome 32 Acute hospital admissions at 24 months.
Type of intervention used (comparison between studies): group, individual or combined. Combined education seemed to give the best short‐term benefit for HbA1c, whereas group education seemed to give a more prolonged and cumulative benefit for HbA1c. Individual education in general was less effective at comparable endpoints; however it was the only method to show a statistically significant effect at two years because more data were available. The combined HbA1c was no longer statistically significant at one year, whereas the group showed its biggest reduction at one year. Scant data were available for comparison of total cholesterol or diabetes knowledge between these groups.
Type of health educator: Use of a community worker or a link worker showed a reduction in HbA1c at all endpoints, which was sustained at two years to almost the same degree as at three months and one year. A consistent increase in diabetes knowledge was demonstrated, although a significant reduction in cholesterol was evident only at one year. Use of a diabetes nurse also created a good reduction in HbA1c initially, but this finding was no longer significant at one year and was much reduced at two years. Participants showed little improvement in knowledge, but again cholesterol did become significantly reduced after one year, to the same extent as with community/link workers. Use of a dietician yielded the least reduction in HbA1c and cholesterol but did seem to increase knowledge to a comparable effect as the community/link workers. Based on this limited evidence, it seems that use of a community/link worker is more effective than use of a diabetes nurse, which in turn is more effective than use of a dietician.
Duration of intervention: Interventions that lasted less than three months lacked sufficient follow‐up for study authors to comment on their effectiveness past six months. Meta‐analysis of these studies showed no statistically significant change in HbA1c, knowledge or total cholesterol at three‐month follow‐up, although it did show some effects at six months in HbA1c and knowledge. Data for studies with an intervention lasting longer than three months are more convincing. They show a decrease in HbA1c at all follow‐up points up to two years and an increase in knowledge at all follow‐up points lasting up to one year. Again a reduction in cholesterol is seen but is not noticed until one year of follow‐up. Based on these data, interventions lasting beyond three months seem to be more effective than shorter ones.
Healthcare system delivering the intervention (USA 27 studies vs remaining countries six studies; see Appendix 10 and Discussion section): The paucity of data from outside of North America made comparing health systems virtually impossible. North American results largely tied in with results of the main analysis, with the exception of loss of statistical significance of improvement in HbA1c at two years because of the omission of the large‐scale UK study (Bellary 2008). When individual studies are taken into account, available data from Europe do seem broadly in line with those from the USA and Canada. However, the differing ethnic make‐up in Europe as opposed to North America does mean that the two are not directly comparable, and so this is an area that needs further study. More research is needed to look at effects in different cultural contexts.
Differences between health education supplied to different ethnic minority groups—for these purposes, we have subdivided the studies into those aimed at South Asians, African Americans and Hispanic individuals: Most of the US studies looked at effects on Hispanic or African American populations, whilst all five European studies worked with South Asians. Broadly, the evidence appears to suggest that Hispanic populations are most likely to benefit in terms of glycaemic control from a culturally appropriate healthcare intervention and to maintain that improvement. These individuals showed a growing reduction in HbA1c sustained at one year. Although African Americans showed the largest reduction in HbA1c of nearly 1% at six months, no statistically significant changes were noted at one or two years. Data were insufficient for a clear analysis of differences in knowledge improvement between these ethnic groups, whilst cholesterol showed no statistically significant changes across the board. Available data were also insufficient for comparison of African American and Hispanic populations versus the South Asian population.
Discussion
Summary of main results
Thirty‐three RCTs of culturally appropriate health education for ethnic minority communities with diabetes from around the world were included in the review, including 11 from the original 2008 review. Culturally appropriate health education programmes improved glycaemic control (glycosylated haemoglobin A1c (HbA1c)) in participants from ethnic minority communities with type 2 diabetes mellitus, compared with those receiving 'usual care.' This improvement was seen at three (MD ‐0.4%, 95% CI ‐0.5 to ‐0.2), six (MD ‐0.5%, 95% CI ‐0.7to ‐0.4), 12 (MD ‐0.2%, 95% CI ‐0.3 to ‐0.04) and indeed 24 months (MD ‐0.3%, 95% CI ‐0.6 to ‐0.1) post intervention. No studies followed up participants beyond two years or looked at diabetic complication rates. Of our other primary outcome measures, three studies reported on health‐related quality of life and showed a significant improvement, and only four studies reported some data on adverse events.
No statistically significant change in total cholesterol, LDL or HDL was seen at any follow‐up point. A statistically significant reduction in triglycerides of 24 mg/dL (95% CI ‐40 to ‐8) was noted at three months, but this was not sustained at six or 12 months, and so its clinical significance is doubted. Knowledge scores improved in the intervention group at three (SMD 0.4, 95% CI 0.1 to 0.6), six (SMD 0.5, 95% CI 0.3 to 0.7) and 12 months (SMD 0.4, 95% CI 0.1 to 0.6) post intervention, thus showing a relatively stable retention of knowledge up to one year. No other differences were found in the other secondary outcome measures (participant‐based outcomes or body mass index measurements), except for an increase in self‐efficacy at six months (SMD 0.5, 95% CI 0.2 to 0.8). This was no longer present at the one‐year follow‐up point and therefore has doubtful clinical significance.
Some secondary outcome measures (such as development of diabetic complications and death rates) selected by the review authors at the protocol stage were not reported in any of the selected studies. Although rough estimates of cost per participant (ranging from $150 to $701, depending on the length of the intervention) were described in five studies, only one study included a cost‐effectiveness comparison, so no meta‐analysis could be done. Examination of various subgroups (see Appendix 10 or 'Subgroup analyses' above) yielded results (weighted towards HbA1c) in favour of using community health or link workers or nurses as a medium for the intervention, employing group or both group and individual sessions and using an intervention that lasted longer than three months. However, not enough comparable data were available to allow any strong recommendations from these analyses.
Overall completeness and applicability of evidence
We aimed to identify the efficacy of using a culturally appropriate healthcare intervention for ethnic minority members with type 2 diabetes. The main limitation of the review was the variation between studies in terms of their interventions, differing outcomes and follow‐up points and participant populace. This made highly powered meta‐analysis difficult, as few of the 33 studies could offer results for all aspects of the review. However, the total number of included trials has tripled since the original review, allowing better quality data than were available before.
The review authors have attempted to minimise factors that may affect external validity: All trials are randomised, minimising selection bias; the trials were conducted at a variety of geographical locations across the world and within the United States itself; and studies with overlapping study groups have not been included in the same analysis (e.g. pilot studies and their follow‐ups). In terms of external validity, results of this review apply most strongly to culturally appropriate healthcare interventions within North America, largely to Hispanic and African American groups, on which 24 of the 33 studies focused. There is nothing to suggest that the results could not be generalised to European South Asian minority groups; however we do not have sufficient data to confidently assert this (only five studies). Even a couple of study authors (Samuel‐Hodge 2009; Rosal 2011) stated that their intervention probably would not be as successful in a different community, even if participants were of the same ethnicity. The existence of such heterogeneity between and within ethnic groups means that we would not be confident in generalising these results to smaller minority groups, those in less developed countries or those in countries with otherwise dramatically different cultures and/or healthcare approaches.
Another problem associated with trying to evaluate complex interventions is that we were highly inclusive in the variety of educational interventions permitted in the review. Although we have attempted to perform subgroup analyses, it is sometimes difficult to work out which aspects of the educational intervention or study population have generated the significant effect. Although previous evidence has suggested better outcomes with behaviour‐centred interventions (Glazier 2006; Lacey 2000), we did not attempt to perform any analysis of the type of educational intervention or theory that was most effective, and it may not be true that all 'culturally appropriate health education' in type 2 diabetic individuals is effective.
Quality of the evidence
The body of evidence presented here does confirm a prolonged decrease in HbA1c when a culturally adapted method of health care is used. The figures point to a reduction, maintained at two years post intervention, in the region of 0.2% to 0.5%. This is based on data from 26 studies with a total of 5724 participants. The consistent increase in knowledge was based upon available data from 13 of the 18 studies that measured it, with a total of 1496 participants. The endpoints for which no consistent change was observed were based on the following data: total cholesterol (11 studies; 1705 participants), systolic blood pressure (12 studies; 1896 participants), diastolic blood pressure (11 studies; 1578 participants), BMI (eight studies; 763 participants), self‐efficacy (nine studies; 1546 participants) and health‐related quality of life (three studies; 224 participants). As is evident, our HbA1c result is based on nearly three times more data than any other endpoint. The other outcomes are based on roughly similar numbers, with the notable exception being health‐related quality of life, with only three of the seven studies reporting it providing adequate data. Increased risk of detection and experimenter bias noted by the study authors for all subjective outcomes in an unblinded intervention group diminishes reliability relative to the objective laboratory‐based outcomes.
Although no adverse events occurred which were felt to be secondary to the intervention (and there are unlikely to be any due to the nature of the intervention); there was a general lack of reporting of adverse effects in most studies. Although data were available from 15 studies in the lost to follow‐up information, mortality rates were not specified or investigated entirely in any of the studies meaning some information may have been missed. Furthermore, reasons for death were often not given and no long term reporting of mortality rate was carried out.
This review aimed to assess patient‐based outcomes including health‐related quality of life, diabetes knowledge, patient satisfaction, self‐efficacy and patient attitudes. However, one key issue with this is that the study authors often used different tools and scales in their assessments, making comparability questionable (see Appendix 7). Although we attempted to minimise this effect by researching the direction of the scale and its validity and by carrying out a sensitivity analysis of those studies providing inadequate information, the number of studies remaining often decreased the power of any effect found. Another limitation of the subjective measures is that when different assessment tools were used, it is not possible to quantify the magnitude of the improvement, only that an improvement was seen.
The sensitivity analyses carried out showed marginal and variable (increased or decreased) changes in effect size when certain studies were excluded, but this did not affect the overall outcome in most cases. The only situations in which the sensitivity analyses led to change in statistical significance of outcomes were diabetes knowledge at three months (a change to no significant effect, which changed to an improved effect at a later time point); BMI at six months (a change to a significant effect) and diastolic blood pressure at three months (a change to a significant effect).
In summary, we believe this leads to relatively high internal validity for HbA1c, a medium/high‐strength judgement on knowledge and all other objective measures and weaker validity for health‐related quality of life and self‐efficacy, the latter being due to high risk of bias because of subjective variables and lower study numbers.
Potential biases in the review process
Although we did not restrict the search strategy to publications in English, all papers eventually included were published in English. Our inclusion criteria for the review were strict, particularly regarding randomisation of participants; this may have led to exclusion of non‐randomised studies that potentially could have provided relevant information on the issues discussed in our review. However, an effort was made to analyse any non‐randomised trials located, in case they could contribute to the discussion of our findings in context with other literature.
Although selection was discussed with a second review author (KH) and following a set protocol, different review authors (JC and MA) were responsible for selecting trials at different points in the update, which may have introduced some subjectivity in the selection of suitable studies. Also studies were excluded if health education was not 'clearly defined' or 'culturally adapted,' which was affected by subjective assessment of these definitions and may have led to unnecessary exclusion of some trials. We excluded studies with no clearly defined ethnic group; however the results may have offered some worthwhile information on the impact of culturally appropriate diabetes education on ethnic minorities as a whole. Also some studies were excluded as we were unable to obtain missing data after we failed to receive a reply from the study author.
Factors that may affect the internal validity of this review include experimenter bias, as all study groups were unblinded; differences in baseline characteristics between study groups (e.g. age of participants, gender ratio, BMI, pre‐intervention HbA1c); smaller study numbers for certain outcomes; compensatory rivalry of the control group for the same blinding reason; and diffusion as ethnic groups are often close‐knit communities and the studies are often carried out in the same city.
Agreements and disagreements with other studies or reviews
A recent systematic review by Glasgow et al (Glasgow 2013) of non‐pharmacological interventions in people of African descent has shown evidence of improved outcomes. The results of this review were also similar in that the power of the review was limited by significant heterogeneity between interventions and poor methodology and reporting of studies. A systematic review of strategies to improve response to cultural interventions in type 2 diabetes by Glazier et al (Glazier 2006) showed that more successful interventions used a community educator or layperson; were of high intensity (more than 10 contacts) and longer duration (longer than six months); and were provided one‐to‐one with individualised assessment. This correlates well with our review, except for the last point; our review was in favour of using either group or a combination of group and individual education. Evidence for group‐based education has been found in other systematic reviews, meta‐analyses and controlled trials, as described by Lirussi (Lirussi 2010).
A systematic review of health education for patients with type 2 diabetes (not necessarily ethnic minorities) conducted on behalf of the Health Technology Assessment (HTA) programme (Loveman 2008) showed the greatest improvement when a team of educators was used with a degree of reinforcement. As we did not consider an analysis of a combination of healthcare professionals/lay workers, we are unable to comment additionally on this evidence. Although this review showed a more variable effect on HbA1c than ours, it was similar in reporting improved knowledge but little effect on other outcomes such as BMI and lipid concentrations.
A realistic version of the original review showed increased retention of participants with one‐to‐one programmes and greater sustainability of long‐term interventions, yet it also emphasised that no generic culturally appropriate education programme could be used with and between ethnic communities (Pottie 2013). We again have questioned the generalisability of some of the interventions in this review. However, many of the systematic reviews mentioned include studies up until 2008 and are based on studies from the original review; therefore this review provides additional and more robust evidence of effect.
Authors' conclusions
Implications for practice.
Culturally appropriate diabetes health education in ethnic minority groups has results in significant improvements in HbA1c, triglycerides and knowledge about diabetes and its management. The 0.2% to 0.5% reduction in HbA1c due to the intervention with culturally appropriate diabetes education may contribute to a reduction of diabetic complications. With the results of this systematic review, it should be an integral part of evidence‐based treatment recommendations. While pharmacotherapy may appear to achieve greater improvements in biochemical measures, we would argue that culturally appropriate diabetes education (both for ethnic minority groups and indeed for all people with type 2 diabetes) is vital to compliance with pharmacotherapy. Educational programmes should be an integral part of every treatment for diabetes.
In line with this, we have noticed a shift towards using multi‐dimensional interventions (involving both health education and physician adjustment of medication) to target ethnic minority patients with poor diabetes self‐management. This is demonstrated in two of the new trials that we identified (Bellary 2008; Gary 2009), both of which used clinical algorithms to govern participant treatment. However, although no significant improvement was seen in the intervention group, multi‐faceted interventions that combine culturally appropriate health education with monitoring of clinical risk factors and pharmacological therapy when indicated need further assessment in future randomised trials.
Although it is difficult to quantify the effects of improved participant knowledge, this in turn may have effects on other measures such as medication compliance, adverse events, hospital admissions and diabetic complications (all outcomes not analysed in our meta‐analysis). It has been known for some time that diabetes health education improves knowledge about diabetes and about blood glucose control (ADA 1995; Deakin 2005; Griffin 1998; Norris 2002; Padgett 1988), but this review has shown that culturally appropriate health education is better than 'normal' practice for minority communities. This does not mean only delivery of health education in the patients' mother tongue, but also adaptation of teaching and learning methods to suit cultural and community needs, as well as the content of the education itself (e.g. in dietary programmes) (Oomen 1999). The results strengthen the belief, based on educational theory (Knight 2006; Rogers 1994), that health education should be coached in a learner‐centred manner that respects religious, social and cultural values to have the greatest impact.
Given the available evidence, it is difficult to suggest a specific theoretical model as the most effective, and in light of the considerable overlap between various theories, it is likely that many models can be used with success. We would recommend that health education theory be considered when study authors are designing a culturally appropriate health education intervention, so that thought is given to the many factors besides knowledge that influence an individual’s behaviour. However, it is more important that interventions are designed on the basis of prior research or experience working with the target community, so that every intervention can be specifically tailored to the needs and requirements of each community.
We cannot yet identify which aspects of culturally tailored health education make the difference, although it appears from our subgroup analyses that use of a community health worker is the most effective means of delivering culturally appropriate health education, and it is likely to be the most cost‐effective approach. However, the success of a community health worker in delivering health education is likely to depend on a number of factors, such as personal characteristics of the worker, quality of the training received and communities’ attitudes towards education delivered by a non‐professional. Therefore we would suggest that before community health workers are used to deliver education, they should receive substantial training from a certified diabetes educator, their work should be quality assured and prior research should determine whether their use in this way will be accepted by the specific community involved. This is in keeping with guidance provided by the UK Department of Health and Diabetes UK Patient Education Working Group (PEWG 2005), which recommends four essential aspects of any educational intervention for diabetic persons: a structured written curriculum, trained educators, quality assurance and audit.
Although the original review showed that a combination of one‐to‐one and group education is better than either used on its own, this update has found mixed results; therefore it is difficult to make any recommendations in this area. Interventions over three months seemed to produce more effective outcomes than shorter interventions. However, we did not analyse the quantity of contact time needed to produce a significant effect.
Implications for research.
Following on from the first review (Hawthorne 2008), this update on the effectiveness of culturally appropriate health education in ethnic minorities with type 2 diabetes has shown just how multi‐faceted and complex analysis of educational interventions can be. More data are needed to determine which aspects of culturally appropriate health education are most effective. For example, a comparison of educational theories used or comparisons of different educational programmes should be performed. Data presented in the trials did not allow us to perform subgroup analyses of effects according to age or gender, and further information is needed as to whether culturally appropriate health education is still effective depending on age or gender.
With inclusion of data from 33 trials, we have presented evidence for the effect of culturally appropriate health education on HbA1c. However, given some doubt over the effects of intensively lowering HbA1c (Hemmingsen 2013), we need further evidence on long‐term real patient‐important parameters, such as incidence of diabetic complications, especially cardiovascular effects and long term mortality for causes attributable to diabetes. In addition, lack of high‐quality data about other outcomes such as health‐related quality of life and self‐efficacy is notable. The previous review highlighted the need to develop reliable and valid measurement tools in assessing such patient‐centred outcomes; however, with often no mention of scale direction and validity for the study group being tested, this needs to be implemented further in future studies. In addition, utilising assessment questionnaires from previous trials will allow comparability between studies. Further qualitative reviews of studies looking at patient‐centred outcomes are needed.
The problem of questionable external validity for some of the trials in this review could be overcome by completion of multi‐centre trials, which would add greater strength to any argument of generalisability. Although we had an increased number of trials reporting the costs of their interventions, more information on this and more in‐depth cost analyses would be useful in future trials. Many of the included studies did not report in sufficient detail their methodology (such as how participants were randomly assigned) or statistical analysis (such as power calculations or intention‐to‐treat). High‐quality trials are needed to reduce the risk of bias that we witnessed in our meta‐analysis. As with most interventions, adequate reporting of adverse events is essential to ensure no negative effect of the intervention has occurred, especially as desirable outcomes such as a reduction in HbA1c could result in life‐threatening hypoglycaemic episodes. Investigating for adverse events should be part of the design for all such trials.
Final conclusions
With the addition of 22 new studies to the previous 11, research on culturally appropriate health education for type 2 diabetes in ethnic minority groups has grown considerably since the time of the first review (Hawthorne 2008). This has strengthened the findings of the previous review of a significant effect on blood sugar control and knowledge and has shown a longer‐lasting effect for blood sugar control of up to two years post intervention. However, the question remains as to how this translates into real health benefits over the long term (over two years) and how cost‐effective such interventions are. More data are needed on other effects of culturally appropriate health education, such as effects on individuals and their attitudes toward diabetes.
If an intervention has been shown to improve patient care for ethnic minorities, then healthcare organisations need to take steps to facilitate its provision to ensure equality and fairness for ethnic minority populations. Therefore, when diabetic services are planned, culturally appropriate health education needs to be considered. However, there is still a need to ensure that the content of what is being delivered is based on educational theory, is structured and shows evidence of effectiveness for the target population.
What's new
| Date | Event | Description |
|---|---|---|
| 17 December 2013 | New search has been performed | 22 new studies added to the 11 studies from the original review |
| 17 December 2013 | New citation required and conclusions have changed | Longer‐lasting effect on HbA1c. Stronger evidence of effect for improved knowledge. Significant effect on triglycerides at 3 months and self‐efficacy at 6 months. Effect of improved cholesterol at 1 year no longer shown |
Acknowledgements
Ms Lesley Sander from SURE, College of Medicine, Biology, Life & Health Sciences, Cardiff University, for her contribution to the development of the search strategy. Diabetes UK for its opinion on the objectives of the project. The Cochrane Metabolic and Endocrine Disorders Review Group for support provided throughout the process of development of this literature review, and the Consumers and Communication Review Group for further input. We are grateful to all study authors who very kindly replied to our requests for further information.
Appendices
Appendix 1. Search strategies
| Search terms and databases |
| Unless otherwise stated, search terms are free‐text terms. Abbreviations: '$': stands for any character; '?': substitutes one or no character; adj: adjacent (i.e. number of words within range of search term); exp: exploded MeSH; MeSH: medical subject heading (MEDLINE medical index term); pt: publication type; sh: MeSH; tw: text word. |
| The Cochrane Library |
| #1 MeSH descriptor Diabetes mellitus, type 2 explode all trees #2 (MODY in All Text or NIDDM in All Text or TDM2 in All Text or TD2 in All Text) #3 ( (non in All Text and insulin* in All Text and depend* in All Text) or (noninsulin* in All Text and depend* in All Text) or (non in All Text and insulindepend* in All Text) or noninsulindepend* in All Text) #4 (typ? in All Text and (2 in All Text near/6 diabet* in All Text) ) #5 (typ? in All Text and (II in All Text near/6 diabet* in All Text) ) #6 (adult* in All Text near/6 diabet* in All Text) #7 (matur* in All Text near/6 diabet* in All Text) #8 (late in All Text near/6 diabet* in All Text) #9 (slow in All Text near/6 diabet* in All Text) #10 (stabl* in All Text near/6 diabet* in All Text) #11 (#1 or #2 or #3 or #4 or #5 or #6 or #7 or #8 or #9 or #10) #12 MeSH descriptor Diabetes insipidus explode all trees #13 (diabet* in All Text and insipidus in All Text) #14 (#12 or #13) #15 (#11 and not #14) #16 MeSH descriptor Education explode all trees #17 MeSH descriptor Educational status explode all trees #18 MeSH descriptor Self care explode all trees #19 MeSH descriptor Self‐Help Groups explode all trees #20 MeSH descriptor Self efficacy explode all trees #21 MeSH descriptor Health Knowledge, attitudes, practice explode all trees #22 MeSH descriptor health promotion explode all trees #23 MeSH descriptor Life style explode all trees #24 MeSH descriptor Rehabilitation explode all trees #25 MeSH descriptor Communication explode all trees #26 MeSH descriptor Social support explode all trees #27 MeSH descriptor Patient participation explode all trees #28 MeSH descriptor Patient compliance explode all trees #29 MeSH descriptor Consumer participation explode all trees #30 MeSH descriptor Counseling explode all trees #31 MeSH descriptor Community Mental Health Services explode all trees #32 MeSH descriptor Community Health services explode all trees #33 MeSH descriptor Community Health nursing explode all trees #34 MeSH descriptor Communication barriers explode all trees #35 (complianc* in All Text or adherenc* in All Text) #36 (educat* in All Text or cultur* in All Text or instruct* in All Text or information* in All Text or program* in All Text) #37 ( (self* in Title, Abstract or Keywords near/6 care in Title, Abstract or Keywords) or (self* in Title, Abstract or Keywords near/6 efficac* in Title, Abstract or Keywords) or (self in Title, Abstract or Keywords near/6 group* in Title, Abstract or Keywords) or (self* in Title, Abstract or Keywords near/6 manag* in Title, Abstract or Keywords) or (self* in Title, Abstract or Keywords near/6 monitor* in Title, Abstract or Keywords) ) #38 ( (health in All Text and knowledge* in All Text) or rehabilitation* in All Text or communication* in All Text) #39 ( (life in All Text and styl* in All Text) or lifestyl* in All Text) #40 counsel* in All Text #41 ( (structured in All Text and treatment* in All Text) or (teaching in All Text and program* in All Text) ) #42 (#16 or #17 or #18 or #19 or #20 or #21 or #22 or #23 or #24 or #25 or #26 or #27 or #28 or #29 or #30) #43 (#31 or #32 or #33 or #34 or #35 or #36 or #37 or #38 or #39 or #40 or #41) #44 (#42 or #43) #45 MeSH descriptor Minority groups explode all trees #46 MeSH descriptor Ethnic groups explode all trees #47 MeSH descriptor Multilingualism explode all trees #48 MeSH descriptor Refugees explode all trees #49 MeSH descriptor Population groups explode all trees #50 MeSH descriptor Continental population groups explode all trees #51 MeSH descriptor Hispanic Americans explode all trees #52 MeSH descriptor African Continental Ancestry Group explode all trees #53 MeSH descriptor American native continental ancestry group explode all trees #54 MeSH descriptor Asian Continental ancestry group explode all trees #55 MeSH descriptor European Continental Ancestry Group explode all trees #56 MeSH descriptor Oceanic ancestry group explode all trees #57 MeSH descriptor African Americans explode all trees #58 MeSH descriptor Arabs explode all trees #59 MeSH descriptor Asian Americans explode all trees #60 MeSH descriptor Gypsies explode all trees #61 MeSH descriptor Mexican Americans explode all trees #62 MeSH descriptor Inuits explode all trees #63 MeSH descriptor Jews explode all trees #64 MeSH descriptor Indians, South American explode all trees #65 MeSH descriptor Indians, North American explode all trees #66 MeSH descriptor Cultural Characteristics explode all trees #67 ( (underserve* in All Text near/6 group* in All Text) or (underserve* in All Text near/6 population* in All Text) ) #68 ( (Disadvantage* in All Text near/6 group* in All Text) or (disadvantage* in All Text near/6 population* in All Text) ) #69 ethnic* in All Text #70 ( (multi in All Text and ethnic* in All Text) or multiethnic* in All Text) #71 (multiracial* in All Text or (multi in All Text and racial* in All Text) ) #72 (migrant* in All Text or immigrant* in All Text) #73 refugees in All Text #74 (asylum in All Text and seeker* in All Text) #75 (cultural in All Text and diversit* in All Text) #76 (multilingual in All Text or (multi in All Text and lingual in All Text) ) #77 ( (multi in All Text and cultural in All Text) or multicultural in All Text or crosscultural in All Text or (cross in All Text and cultural in All Text) or transcultural in All Text or (trans in All Text and cultural in All Text) ) #78 MeSH descriptor Islam explode all trees #79 MeSH descriptor Hinduism explode all trees #80 MeSH descriptor Buddhism explode all trees #81 (islam* in All Text or hindu* in All Text or sikh* in All Text or buddhism* in All Text) #82 (#45 or #46 or #47 or #48 or #49 or #50 or #51 or #52 or #53 or #54 or #55 or #56 or #57 or #58 or #59 or #60 or #61 or #62 or #63 or #64 or #65) #83 (#66 or #67 or #68 or #69 or #70 or #71 or #72 or #73 or #74 or #75 or #76 or #77 or #78 or #79 or #80 or #81) #84 (#82 or #83) #85 (#15 and #44 and #84) |
| MEDLINE |
| 1 exp Diabetes Mellitus, Type 2/ 2 (MODY or NIDDM or T2DM or T2D).tw,ot. 3 (non insulin$ depend$ or noninsulin$ depend$ or noninsulin?depend$ or non insulin?depend$).tw,ot. 4 ((typ? 2 or typ? II or typ?2 or typ?II) adj3 diabet$).tw,ot. 5 (((late or adult$ or matur$ or slow or stabl$) adj3 onset) and diabet$).tw,ot. 6 or/1‐5 7 exp Diabetes Insipidus/ 8 diabet$ insipidus.tw,ot. 9 7 or 8 10 6 not 9 11 Education/ 12 exp Educational Status/ 13 exp Self Care/ 14 exp Self‐Help Groups/ 15 exp Self Efficacy/ 16 exp Health Knowledge, Attitudes, Practice/ 17 exp Health Promotion/ 18 exp Life Style/ 19 exp Rehabilitation/ 20 exp Communication/ 21 exp Social Support/ 22 exp Patient Participation/ 23 exp Patient Compliance/ 24 exp Consumer Participation/ 25 exp Counseling/ 26 exp Community Mental Health Services/ or exp Community Health Services/ or exp Community Health Nursing/ 27 exp Communication Barriers/ 28 (complianc* or adherenc*).tw,ot. 29 (educat* or cultur* or instruct* or information* or program*).tw,ot. 30 (self adj6 (care or efficac* or group* or manag* or monitor*)).tw,ot. 31 (health knowledge* or rehabilitation* or communication*).tw,ot. 32 (life style or life?style).tw,ot. 33 counsel*.tw,ot. 34 (structured treatment* or teaching program*).tw,ot. 35 or/11‐34 36 exp Minority Groups/ 37 exp Ethnic Groups/ 38 exp Multilingualism/ 39 exp Refugees/ 40 exp Population Groups/ 41 exp Continental Population Groups/ 42 exp Hispanic Americans/ 43 exp African Continental Ancestry Group/ 44 exp American Native Continental Ancestry Group/ 45 exp Asian Continental Ancestry Group/ 46 exp European Continental Ancestry Group/ 47 exp Oceanic Ancestry Group/ 48 exp African Americans/ 49 exp Arabs/ 50 exp Asian Americans/ 51 exp Gypsies/ 52 exp Mexican Americans/ 53 exp Inuits/ 54 exp Jews/ 55 exp Indians, South American/ or exp Indians, North American/ 56 exp Cultural Characteristics/ 57 ((underserve* or disadvantage*) adj6 (group* or population*)).tw,ot. 58 ethnic*.tw,ot. 59 (multi ethnic* or multi?ethnic*).tw,ot. 60 (multi?racial* or multi racial*).tw,ot. 61 (migrant* or immigrant*).tw,ot. 62 refugees.tw,ot. 63 asylum seeker*.tw,ot. 64 cultural diversit*.tw,ot. 65 (multi?lingual or multi lingual).tw,ot. 66 (multi?cultural or multi cultural or cross?cultural or cross cultural or trans?cultural or transcultural).tw,ot. 67 exp Islam/ 68 exp Hinduism/ 69 exp Buddhism/ 70 (islam* or hindu* or sikh* or buddhism*).tw,ot. 71 or/36‐70 72 10 and 35 and 71 73 randomized controlled trial.pt. 74 controlled clinical trial.pt. 75 randomi?ed.ab. 76 placebo.ab. 77 drug therapy.fs. 78 randomly.ab. 79 trial.ab. 80 groups.ab. 81 or/73‐80 82 Meta‐analysis.pt. 83 exp Technology Assessment, Biomedical/ 84 exp Meta‐analysis/ 85 exp Meta‐analysis as topic/ 86 hta.tw,ot. 87 (health technology adj6 assessment$).tw,ot. 88 (meta analy$ or metaanaly$ or meta?analy$).tw,ot. 89 ((review$ or search$) adj10 (literature$ or medical database$ or medline or pubmed or embase or cochrane or cinahl or psycinfo or psyclit or healthstar or biosis or current content$ or systemat$)).tw,ot. 90 or/82‐89 91 81 or 90 92 (comment or editorial or historical‐article).pt. 93 91 not 92 94 72 and 93 |
| EMBASE |
| 1 exp Diabetes Mellitus, Type 2/ 2 (MODY or NIDDM or T2D or T2DM).tw,ot. 3 ((typ? 2 or typ? II or typ?II or typ?2) adj3 diabet*).tw,ot. 4 (obes* adj3 diabet*).tw,ot. 5 (non insulin* depend* or non insulin?depend* or noninsulin* depend* or noninsulin?depend*).tw,ot. 6 ((adult* or matur* or late or slow or stabl*) adj3 diabet*).tw,ot. 7 or/1‐6 8 Diabetes insipidus {No Related Terms} 9 diabet* insipidus.tw,ot. 10 8 or 9 11 7 not 10 12 exp education/ 13 exp self care/ 14 exp self help/ 15 exp self concept/ 16 exp attitude to health/ 17 exp health promotion/ 18 exp lifestyle/ 19 exp rehabilitation/ 20 exp interpersonal communication/ 21 exp social support/ 22 exp patient participation/ 23 exp patient compliance/ 24 exp consumer/ 25 exp counseling/ 26 exp community health nursing/ or exp community care/ 27 exp communication disorder/ 28 (complianc* or adherenc*).tw,ot. 29 (educat* or cultur* or instruct* or information* or program*).tw,ot. 30 (self adj6 (care or efficac* or group* or manag* or monitor*)).tw,ot. 31 (health knowledge* or rehabilitation* or communication*).tw,ot. 32 (life styl* or lifestyl*).tw,ot. 33 counsel*.tw,ot. 34 (structured treatment* or teaching program*).tw,ot. 35 or/12‐34 36 exp minority group/ 37 exp ethnic group/ 38 exp refugee/ 39 exp "ethnic and racial groups"/ 40 exp race/ 41 exp Hispanic/ 42 exp Negro/ 43 exp American Indian/ 44 exp Asian/ 45 exp Caucasian/ 46 exp Aborigine/ 47 exp African American/ 48 exp Arab/ 49 exp Asian American/ 50 exp gipsy/ 51 exp Hispanic/ 52 exp Eskimo/ 53 exp jew/ 54 ((underserve* or disadvantage*) adj6 (group* or population*)).tw,ot. 55 ethnic*.tw,ot. 56 (multiethnic* or multi ethnic*).tw,ot. 57 (multiracial* or multi racial*).tw,ot. 58 (migrant* or immigrant*).tw,ot. 59 (refugee* or asylum seeker*).tw,ot. 60 cultural diversit*.tw,ot. 61 (multilingual or multi lingual).tw,ot. 62 (multicultural or multi cultural or crosscultural or cross cultural or transcultural or trans cultural).tw,ot. 63 exp religion/ 64 (islam* or hinduism* or buddhism* or sikh).tw,ot. 65 or/36‐64 66 11 and 35 and 65 67 exp Randomized Controlled Trial/ 68 exp Controlled Clinical Trial/ 69 exp Clinical Trial/ 70 exp Comparative Study/ 71 exp Drug comparison/ 72 exp Randomization/ 73 exp Crossover procedure/ 74 exp Double blind procedure/ 75 exp Single blind procedure/ 76 exp Placebo/ 77 exp Prospective Study/ 78 ((clinical or control$ or comparativ$ or placebo$ or prospectiv$ or randomi?ed) adj3 (trial$ or stud$)).ab,ti. 79 (random$ adj6 (allocat$ or assign$ or basis or order$)).ab,ti. 80 ((singl$ or doubl$ or trebl$ or tripl$) adj6 (blind$ or mask$)).ab,ti. 81 (cross over or crossover).ab,ti. 82 or/67‐81 83 exp meta analysis/ 84 (metaanaly$ or meta analy$ or meta?analy$).ab,ti,ot. 85 ((review$ or search$) adj10 (literature$ or medical database$ or medline or pubmed or embase or cochrane or cinahl or psycinfo or psyclit or healthstar or biosis or current content$ or systematic$)).ab,ti,ot. 86 exp Literature/ 87 exp Biomedical Technology Assessment/ 88 hta.tw,ot. 89 (health technology adj6 assessment$).tw,ot. 90 or/83‐89 91 82 or 90 92 (comment or editorial or historical‐article).pt. 93 91 not 92 94 66 and 93 |
| ERIC |
| 1 (MODY or NIDDM or T2DM or T2D).tw,ot. 2 (non insulin$ depend$ or noninsulin$ depend$ or noninsulin?depend$ or non insulin?depend$).tw,ot. 3 ((typ? 2 or typ? II or typ?2 or typ?II) adj3 diabet$).tw,ot. 4 (((late or adult$ or matur$ or slow or stabl$) adj3 onset) and diabet$).tw,ot. 5 or/1‐4 6 diabet$ insipidus.tw,ot. 7 5 not 6 8 Education/ 9 exp Educational Status/ 10 exp Self Care/ 11 exp Self Efficacy/ 12 exp Health Promotion/ 13 exp Life Style/ 14 exp Rehabilitation/ 15 exp Social Support/ 16 exp Counseling/ 17 exp Community Mental Health Services/ or exp Community Health Services/ or exp Community Health Nursing/ 18 (complianc* or adherenc*).tw,ot. 19 (educat* or cultur* or instruct* or information* or program*).tw,ot. 20 (self adj6 (care or efficac* or group* or manag* or monitor*)).tw,ot. 21 (health knowledge* or rehabilitation* or communication*).tw,ot. 22 (life style or life?style).tw,ot. 23 counsel*.tw,ot. 24 (structured treatment* or teaching program*).tw,ot. 25 or/8‐24 26 exp Minority Groups/ 27 exp Ethnic Groups/ 28 exp Multilingualism/ 29 exp Refugees/ 30 exp Population Groups/ 31 exp Hispanic Americans/ 32 exp African Americans/ 33 exp Arabs/ 34 exp Asian Americans/ 35 exp Mexican Americans/ 36 exp Jews/ 37 exp Cultural Characteristics/ 38 ((underserve* or disadvantage*) adj6 (group* or population*)).tw,ot. 39 ethnic*.tw,ot. 40 (multi ethnic* or multi?ethnic*).tw,ot. 41 (multi?racial* or multi racial*).tw,ot. 42 (migrant* or immigrant*).tw,ot. 43 refugees.tw,ot. 44 asylum seeker*.tw,ot. 45 cultural diversit*.tw,ot. 46 (multi?lingual or multi lingual).tw,ot. 47 (multi?cultural or multi cultural or cross?cultural or cross cultural or trans?cultural or transcultural).tw,ot. 48 exp Islam/ 49 exp Hinduism/ 50 exp Buddhism/ 51 (islam* or hindu* or sikh* or buddhism*).tw,ot. 52 or/26‐51 53 randomi?ed.ab. 54 placebo.ab. 55 randomly.ab. 56 trial.ab. 57 groups.ab. 58 or/53‐57 59 exp Meta‐analysis/ 60 hta.tw,ot. 61 (health technology adj6 assessment$).tw,ot. 62 (meta analy$ or metaanaly$ or meta?analy$).tw,ot. 63 or/59‐62 64 58 or 63 65 7 and 25 and 52 and 64 |
| PsycInfo |
| 1 (MODY or NIDDM or T2DM or T2D).tw,ot. 2 (non insulin$ depend$ or noninsulin$ depend$ or noninsulin?depend$ or non insulin?depend$).tw,ot. 3 ((typ? 2 or typ? II or typ?2 or typ?II) adj3 diabet$).tw,ot. 4 (((late or adult$ or matur$ or slow or stabl$) adj3 onset) and diabet$).tw,ot. 5 or/1‐4 6 exp Diabetes Insipidus/ 7 diabet$ insipidus.tw,ot. 8 6 or 7 9 5 not 8 10 Education/ 11 exp Self Care/ 12 exp Self Efficacy/ 13 exp Health Promotion/ 14 exp Rehabilitation/ 15 exp Communication/ 16 exp Social Support/ 17 exp Patient Participation/ 18 exp Counseling/ 19 exp Community Mental Health Services/ or exp Community Health Services/ or exp Community Health Nursing/ 20 exp Communication Barriers/ 21 (complianc* or adherenc*).tw,ot. 22 (educat* or cultur* or instruct* or information* or program*).tw,ot. 23 (self adj6 (care or efficac* or group* or manag* or monitor*)).tw,ot. 24 (health knowledge* or rehabilitation* or communication*).tw,ot. 25 (life style or life?style).tw,ot. 26 counsel*.tw,ot. 27 (structured treatment* or teaching program*).tw,ot. 28 or/10‐27 29 exp Minority Groups/ 30 exp Ethnic Groups/ 31 exp Multilingualism/ 32 exp Refugees/ 33 exp African Americans/ 34 exp Arabs/ 35 exp Asian Americans/ 36 exp Gypsies/ 37 exp Mexican Americans/ 38 exp Jews/ 39 ((underserve* or disadvantage*) adj6 (group* or population*)).tw,ot. 40 ethnic*.tw,ot. 41 (multi ethnic* or multi?ethnic*).tw,ot. 42 (multi?racial* or multi racial*).tw,ot. 43 (migrant* or immigrant*).tw,ot. 44 refugees.tw,ot. 45 asylum seeker*.tw,ot. 46 cultural diversit*.tw,ot. 47 (multi?lingual or multi lingual).tw,ot. 48 (multi?cultural or multi cultural or cross?cultural or cross cultural or trans?cultural or transcultural).tw,ot. 49 exp Islam/ 50 exp Hinduism/ 51 exp Buddhism/ 52 (islam* or hindu* or sikh* or buddhism*).tw,ot. 53 or/29‐52 54 randomi?ed.ab. 55 placebo.ab. 56 randomly.ab. 57 trial.ab. 58 groups.ab. 59 or/54‐58 60 exp Meta‐analysis/ 61 hta.tw,ot. 62 (health technology adj6 assessment$).tw,ot. 63 (meta analy$ or metaanaly$ or meta?analy$).tw,ot. 64 or/60‐63 65 59 or 64 66 9 and 28 and 53 and 65 |
| 'My NCBI' alert service |
| ("diabetes mellitus, type 2"[MeSH Terms] OR "type 2 diabetes mellitus"[All Fields] OR "type 2 diabetes"[All Fields]) AND (("ethnic groups"[MeSH Terms] OR ("ethnic"[All Fields] AND "groups"[All Fields]) OR "ethnic groups"[All Fields] OR "ethnic"[All Fields]) AND ("minority groups"[MeSH Terms] OR ("minority"[All Fields] AND "groups"[All Fields]) OR "minority groups"[All Fields] OR "minority"[All Fields])) |
Appendix 2. Description of interventions
| Intervention(s) [route, frequency, total dose/d] | Group/Individual/ Combined | Comparator(s) [route, frequency, total dose/d] | |
| Agurs Collins 1997 | Weekly hour‐long nutrition sessions with exercise training (30 minutes) for 3 months; following 3 months on biweekly problem‐solving (90 minutes) sessions. Also 1 individual counselling session | Combined | One class on glycaemic control at 3 weeks from start; 2 letters with written information on nutrition; patients were given the results of blood tests |
| Anderson 2005 | Two‐hour weekly group sessions for 6 weeks | Group | Wait‐listed |
|
Babamoto 2009 |
I1: community health worker (CHW) led individual education sessions and supporting telephone calls at home/clinic/community locations. Format was 10 weeks of educational sessions. Telephone calls were made routinely during this 10‐week period, and for the remaining 14 weeks of the intervention (up to 6 months); sessions were based on ADA standards, and the intervention was based on the trans‐theoretical (stages of change) model | Individual | Standard care only |
| I2: case management—diabetes care and education provided by 2 culturally sensitive nurses, in addition to standard care. Nurses followed standardised clinic protocols for diabetes education and monitoring, working directly with participant. Participants were seen on a monthly basis in the clinic, or as needed; follow‐up calls were made as needed, as determined by the case manager. Protocols based on ADA recommendations | Individual | ||
| Baradaran 2006 | They aimed for 3 group sessions (1‐hour dietician‐led session and 1 hour and a half podiatrist‐led session) in 3 months. The intervention had a didactic component and an interactive group discussion component | Group | C1: usual care (South Asian) |
| C2: usual care (White Caucasian) | |||
| Bellary 2008 | Intervention was "enhanced care"; this included practices receiving an additional practice nurse (4 hours per practice per week) supported by link workers and a community nurse specialising in diabetes. Participants in the intervention group were followed up on average every 2 months in weekly clinics held by the practice nurse (extra practice nurse had protected time to run these clinics). All participants were contacted by a link worker before and between appointments to encourage clinic attendance. In addition, link workers attended clinics and provided interpretation and additional educational input in local languages (Punjabi, Urdu and Mirpuri). All link workers had attended a foundation course in diabetes management and care. Two community nurses (diabetes specialists) covered the 9 intervention practices and attended some of the clinics, providing additional educational and clinical support. The specialist nurse also monitored the standard of care provided by the practice nurse and link workers; the intervention provided protocols and targets to try to achieve | Individual | Control practices received the same treatment protocols but managed participants with their existing resources |
| Brown 2002 | 3‐month weekly group educational sessions; 6‐month biweekly support sessions and thereafter 3‐month monthly support sessions | Combined | Usual care from their private physicians or at local clinics |
| Carter 2011 | Online diabetes self‐management module; all participants in the intervention group were provided with a laptop equipped with a wireless scale, a blood pressure cuff and a glucometer. Weight and BP were advised to be checked weekly and blood glucose 3× a day. Participants had access to 3 online modules—education, self‐management and a social networking module. Education was culturally appropriate and age appropriate. Participants had a half‐hour video conference with a nurse "biweekly"; in these conferences, the nurse reviewed the participant's recently uploaded data and discussed the data with the participant | Individual | Usual care; no other details given |
| Crowley 2013 | Cholesterol, Hypertension and Glucose Education ('CHANGE') study intervention included self‐management education and medication management facilitation components. Both intervention components were delivered by nurse interventionists centred outside the study sites, who communicated remotely with participants and PCPs | Individual | Usual care + leaflet |
| D'Eramo Melkus 2010 | 11‐week (weekly group sessions) culturally relevant diabetes self‐management training, coping skills training and diabetes care intervention. First 6 sessions (2 hours each) provided culturally relevant DSMT. Each session had specific learner objectives addressed by group leaders. The remaining 5 sessions involved cognitive skills training—understanding stress, problem identification and solving, etc.; culturally specific materials used for each session; led by nurses, diabetes educators with a lay health assistant present | Group | 10 weekly sessions of 'conventional' diabetes education and diabetes care. Sessions 1‐5 were 1.5 hours each and provided standardised, culturally neutral usual diabetes education. Sessions 6‐10 were 1 hour each and provided diabetes discussion and Q and A sessions. |
| DePue 2013 | Individual education tailored to a person's self‐goals and diabetes risk over the course of a year. Frequency varied depending on risk, from monthly to yearly. Teaching was delivered by nurses and community health workers. High‐risk patients were also seen in group sessions. Intervention occurred at home, at work or at the Tafuna clinic | Combined | Usual care |
| Gary 2009 | An individualised, culturally tailored care programme provided by a nurse case manager (NCM) and a community health worker (CHW). Higher‐risk participants received more aggressive and more frequent follow‐up to achieve better control. The registered nurse would see the participant at least once a year, primarily helping with issues that require nurse specialist care (e.g. medication management). CHWs scheduled home visits at least 3 times a year; they would conduct glucose tests, examine BP and then give participant feedback on these factors, providing education and problem‐solving help | Individual | Participants in the minimal intervention group received phone calls every 6‐12 months to remind them of important preventative diabetes‐related health care (i.e. HbA1c tests, primary care and speciality visits); in addition, they received DM‐specific information through the mail |
|
Gucciardi 2007 |
I1: group + individual: 3 group meetings of 7 hours and individual meetings of 1 initial assessment + mean no. of visit 2.08 (0.95) | Combined | No control group |
| I2: individual: 1 initial assessment + mean no. of visits 1.83 (0.69) | Individual | ||
| Hawthorne 1997 | One session of 1‐to‐1 pictorial flash cards HE (purpose of glucose monitoring, how to control blood sugar, diabetic complications, and purpose of regular screening) with a trained link worker | Individual | Usual care in clinics |
| Kattelmann 2009 | Monthly group education lessons based on the Medicine Wheel Nutrition Model. Included dietary counselling. After each lesson, participants attended a group support session called a Talking Circle, a method of communication used in many Indian communities; sessions were led by a registered dietician and a tribal member who had learnt the curriculum | Group | Received standardised dietary education provided by personal healthcare providers at the local Indian Services Hospital and offered delayed intervention |
| Keyserling 2002 | I1: clinic‐based education + community‐based education. The clinic component consisted of individual counselling visits at months 1, 2, 3 and 4. The community component included 2 group sessions (90 minutes) and monthly telephone calls for the first 6 months; the second 6 months consisted of 1 group session and monthly telephone calls | Combined | Participants were mailed pamphlets from the ADA ("Staying Active, Healthy Eating," and "What is Non‐Insulin‐Dependent Diabetes?") |
| I2: second intervention was a group who received only the individual counselling described above (clinic component) | Individual | ||
| Khan 2011 | Intervention was the "Living Well with Diabetes Multimedia Program." 19 bilingual computer multimedia lessons on diabetes self‐management. Each lesson targeted a specific self‐care objective. The programme also consisted of more than 160 testimonials from African American and Hispanic patients with diabetes related to diabetes self‐care, emphasising barriers to care, challenges and personalised solutions that they or family members had encountered. Each lesson targeted a specific objective according to Gagne's theory of learning and the component display theory | Individual | Given an American Diabetes Association brochure on self‐management ("Living with Diabetes," written at 6th grade level) |
| Kim 2009 | SHIP‐DM: a 6‐week culturally tailored behavioural intervention programme. Weekly 2‐hour education sessions for 6 weeks aimed at enhancing diabetes knowledge and promoting self‐care. Home glucose monitoring with teletransmission (HGMT) with tele‐transmission (24 weeks). Each participant received a glucometer, an electronic BP monitor and a teletransmission system. This transmission system allowed participant data to be stored on a website, and was used to guide nurse counselling for the participant. Monthly updates were generated. Monthly telephone counselling by a bilingual nurse (24 weeks). This aimed to reinforce new knowledge learned through the education programme, help find solutions to the problems or issues raised and provide emotional support. Each session lasted about 10‐25 minutes | Delayed intervention; received intervention after trial was complete | |
| Lorig 2008 | 2.5‐Hour sessions for 6 weeks; aims to improve participant health behaviours and health status; content involved healthy eating, exercise and stress management, problem solving and strategies of self‐efficacy | Group | Usual care, wait‐listed control group; they were offered the intervention at the end of 6 months; no details given as to what 'usual care' entails |
| Lujan 2007 | Consisting of 8 × weekly 2‐hour participative group classes and fortnightly telephone follow‐up. Following the end of the classes, inspirational faith‐based health behaviour change postcards were sent to participants fortnightly. Classes were interactive, small‐group sessions (23 participants in Spainsh classes, 6 in English class) involving hands‐on demonstrations and handouts. Telephone call by promotor to answer questions and reinforce education. | Combined | Usual care ‐ individual sessions and info leaflets |
| Middelkoop 2001 | Attending to intensive guidance clinics (approximately 4‐7 visits for the first 3 months, with less frequent subsequent visits) provided by trained nurse and dietician | Wait‐listed group that joined the intervention group after 6 months | |
| O'Hare 2004 | Intervention consisted of extra weekly diabetes clinic at the primary care centres (with community diabetes input and 2 link workers with language skills). Frequency of participants' exposure to the intervention has not been stated | Individual | Usual care; practices were provided with protocols; no further resources were provided |
| Osborn 2010 | A single 90‐minute session with a bilingual medical assistant of Puerto Rican heritage. The session was based on the information‐behavioural skills (IMB) model of health behaviour change. Information/Education was provided with use of a flip‐chart and interactive discussion. Culturally appropriate foods were used as examples as to what can raise blood glucose. Motivational interviewing was carried out to try to enhance motivation. Each participant received a personal feedback report immediately after the session (contained self‐generated reasons to change, agreed on goals, etc.) and a culturally tailored, individualised meal plan booklet. Participants were also provided with 0‐3 handouts, depending on personal relevance, as determined by the interventionist. Finally, all participants received a brochure of culturally familiar foods with recommended serving sizes | Individual | Participants in the control group received usual care; however, this included an optional diabetes support group coupled with group‐based didactic education delivered in Spanish. This support group was free, delivered on a monthly basis and facilitated by a bilingual diabetes community health worker of Puerto Rican heritage. This session was not tailored to the individual needs of the participant. Participants in the intervention arm could also attend this session |
| Philis‐Tsimikas 2011 | Intervention consisted of 8 weekly 2‐hour diabetes self‐management classes and subsequent 2‐hour monthly support groups (phoned by peer educator beforehand to encourage attendance). Occasional guest speaker at support groups. Interactive discussion facilitated by peer educator. Self‐management classes covering basics of diabetes and its complications, diet, exercise, medication, blood glucose monitoring and cultural beliefs that interfere with optimum self‐management | Group | Usual care |
| Rosal 2005 | It consisted of an initial 1‐hour individual session, followed by 2 3‐hour weekly group sessions for 10 weeks and 2 15‐minute individual sessions during the 10‐week period. Primary care physicians received copies of laboratory results at each assessment point | Combined | Usual care and primary care physicians received copies of laboratory results as intervention group did |
| Rosal 2011 | 'Latinos en Control' intervention consisted of an intensive phase of 12 weekly sessions and a follow‐up phase of 8 monthly sessions. Using social‐cognitive theory as a framework, it targeted diabetes knowledge, attitudes and self‐management behaviours. Sessions were made literacy and culturally appropriate by simplifying concepts, using an educational soap opera, putting desired behaviours into culturally relevant context, using bingo games and emphasising making traditional foods healthier and other such things. Group sessions were 2.5 hours long, with the 1st hour covering personalised counselling and cooking and the remaining time covering the group protocol and a meal | Combined | No intervention; all primary care providers received laboratory results (HbA1c, lipid profiles, FBG) at baseline and at 4 and 12 months, and were free to provide care as deemed appropriate or as routinely delivered. |
| Rothschild 2012 | The intervention was 36 visits over 2 years from a community health worker (from the same community) who delivered · behavioural self‐management training using a curriculum derived from recommendations of the American Academy of Diabetes Educators (the AADE 7) | Usual care; mailed info leaflets | |
| Samuel‐Hodge 2009 | 12 biweekly group sessions, held at each church. Each session opened with a prayer, followed by the main educational component of the session, a short physical activity segment and taste testing of 1‐2 recipes. The format for sessions included small‐group activities. Before the 12 sessions, participants had a 60‐minute individual counselling session with a registered dietician to assess their usual dietary, physical activity and self‐management behaviours, initiate counselling and facilitate subsequent counselling. The church diabetes adviser also phoned participants monthly to offer support for behaviour change to improve diabetes self‐management. Finally, study staff sent 3 postcard messages of encouragement to participants on behalf of their primary care physician during the first 8 months of the study. The postcard messages were tailored to behavioural goals selected by participants and included brief messages relevant to dietary behaviour, physical activity and HbA1c | Group | Participants in the control group received a minimal intervention, which included a mailing to participants of 2 pamphlets ("Healthy Eating" and "Staying Active"), published by the American Diabetes Association, and 3 bimonthly newsletters providing general information and study updates. |
| Sixta 2008 | Intervention was a 10‐week diabetes self‐management course taught by 2 promotors, who were employed by the clinic and supervised by nurses. There were 10 weekly group sessions that lasted for 90 minutes. A scripted course curriculum was used by the promotors to maintain consistency and accuracy of information. The course was presented in Spanish and was culturally sensitive. The promotors were the primary instructors and presented the information in a manner that participants could understand | Group | Participants in the control group did not receive the intervention until after the trial was complete (wait‐listed control group) |
| Skelly 2005 | Individual biweekly visits to individuals' homes lasting < 1 hour, with 4 achievable modules on teaching and counselling intervention based on participant‐nurse collaboration. Total time spent with participants was 6 hours. The provider was a nurse‐investigator not blinded to participants' group assignment | Individual | Usual care + telephone call (wait‐listed) |
| Skelly 2009 | Intervention was four 60‐minute fortnightly home visits by a nurse to the participant's house. Intervention was symptom‐focused and involved teaching and counselling. Intervention was made culturally appropriate by incorporating women's own coping strategies (e.g. spirituality and importance of family) and allowing time for women to tell their own stories about living with diabetes. In addition, an advisory board of 6 African American women living in similar communities to participants guided development of study materials. I2: booster intervention started after 6 months (about 3 months after intervention finished) and consisted of 4 telephone calls by nurse who had carried out intervention at intervals of about 2‐3 weeks |
Individual | Participants in the control group also received four 60‐minute fortnightly home visits by a nurse (a different nurse to those who carried out the symptom‐focused intervention). However, instead of a symptom‐focused intervention, control group received a weight and diet program; this intervention was also individualised and culturally tailored |
| Spencer 2011 | Trained community health workers (CHWs) A.K.A. “family health advocates” promoted healthy lifestyle and self‐management activities. In addition family health advocates helped participants improve their patient‐provider communication skills and facilitated necessary referrals to other service systems. This took the form of 11 × 2‐hour local community group diabetes education classes, 2 home visits of 60 minutes in length per month, a phone call every 2 weeks and 1 clinic visit accompanied by the family health advocate | Combined | Usual care (wait‐listed); participants in the control group were contacted once per month to update contact information |
| Toobert 2011 | Intervention was the Viva Bien programme, a culturally adapted version of the previously established Mediterranean Lifestyle Program for diabetes. The intervention involved a 2.5‐day retreat, followed by 4‐hour weekly meetings for 6 months, then fortnightly meetings for the remaining 6 months. The intervention was culturally adapted by using information gathered from a literature review and from focus groups | Group | Participants in the control group received usual care only; no details given as to what this involves |
| Vincent 2007 | Intervention consisted of 8 weekly 2‐hour group sessions, which included didactic content, cooking demonstrations and group support. Didactic content considered essential by the ADA and the National Diabetes Education Program (NDEP, 2002) was the foundation for the intervention. Numerous cultural modifications were used | Group | Participants in the control group received usual care and education given at the clinic; this consisted of a 10‐ to 15‐minute encounter with a physician or nurse practitioner 2 to 4 times per year |
| "‐" denotes not reported C: comparator: I: intervention | |||
Appendix 3. Baseline characteristics (I)
| Intervention(s) and comparator(s) | Duration of intervention (duration of follow‐up) | Participating population | Study period [year to year] | Country | Setting | |
|
Agurs Collins 1997 |
I: individual and group sessions | 6 mo (3, 6 mo) | African Americans | 1997 | USA | Clinics |
| C: 1 class and info leaflet | ||||||
|
Anderson 2005 |
I: group sessions | 6 wk (6 wk as RCT; non‐RCT at 12/52, 6/12 and 1 year) | African Americans | 2005 | USA | Convenient community‐based locations |
| C: usual care plus feedback on baseline bloods | ||||||
|
Babamoto 2009 |
I1: individual sessions plus telephone calls | 6 mo (6 mo) | Hispanic, age > 18 years | July 2002 ‐ | USA | Home, clinic and community locations |
| I2: case management | ||||||
| C: usual care | Outpatients when required (routine clinics) | |||||
|
Baradaran 2006 |
I: group sessions | 3 mo (6 mo) | South Asian, age > 30 years | 2006 | United Kingdom | Primary care or day care centres |
| C1: usual care—South Asian | ||||||
| C2: usual care—White Caucasian (not randomised) | Not included in analysis | |||||
| Bellary 2008 | I: treatment protocols and extra clinics plus link workers | 24 mo (24 mo) | South Asians | 2008 | UK | Inner city GP practices |
| C: treatment protocols only | ||||||
|
Brown 2002 |
I: group sessions | 12 mo (6, 12 mo) | Mexican Americans | 2002 | USA | Community sites |
| C: usual care—wait‐listed control group | ||||||
| Carter 2011 | I: Internet and videoconferencing with nurse | 9 mo (9 mo) | African Americans | ‐ | USA | Participant's home |
| C: usual care | ||||||
| Crowley 2013 | I: individual sessions via telephone | 12 mo (12 mo) | African Americans | ‐ | USA | Telephone encounters and primary care clinic |
| C: usual care + leaflet | ||||||
| D'Eramo Melkus 2010 | I: group sessions | 11 wk (3, 12, 24 mo) | "Black women" aged 21‐65 with type 2 diabetes | ‐ | USA | Primary care centre, school or nursing |
| C: conventional (not culturally appropriate) group sessions | 10 wk | |||||
| DePue 2013 | I: nurse‐led self‐management education and medication management facilitation components | 12 mo (12 mo) | Samoan | ‐ | American Samoa (USA) | Remote communication (i.e. participants' homes) |
| C: usual care | ||||||
| Gary 2009 | I: individual visits to CHW and nurse following culturally appropriate clinical algorithms | 24 mo (36 mo) | African Americans with type 2 diabetes living in Baltimore City | Recruitment: Nov. 2001‐May 2003. Intervention time not stated | USA | Participants' homes, community settings and clinics |
| C: telephone calls and info leaflets | ||||||
|
Gucciardi 2007 |
I1: individual and group sessions | 3 days (3 mo) | Portuguese Canadians | Recruitment:Nov 2001‐Nov 2003. Intervention delivery not stated | Canada | Toronto Western Hospital Diabetes Education Centre for both groups |
| I2: individual sessions | Up to 3 mo (3 mo) | |||||
|
Hawthorne 1997 |
I: individual session with CHW—'flashcards' | 1 session (6 mo) | Pakistanis with type 2 DM | Recruitment: Aug. 1992‐Nov.1993 Intervention delivery time not stated |
UK | Secondary care setting or GP practices |
| C: usual care in clinics | ||||||
| Kattelmann 2009 | I: group sessions | 6 mo (6 mo) | Northern Plains Indians from the Cheyenne River Sioux Reservation (Native Americans) with type 2 diabetes | January 2005‐December 2005 | USA | Field site on Indian reservation |
| C: standard dietary education and health care | ||||||
|
Keyserling 2002 |
I1: individual and group sessions | 12 mo (6, 12 mo) | African American women | ‐ | USA | Primary care and community centres |
| I2: individual counselling (not included in meta‐analysis) | 4 mo (6, 12 mo) | |||||
| C: usual care | 12 mo | |||||
| Khan 2011 | I: individual computer‐based | 3 mo (3 mo) | Underserved people with type 2 diabetes | Feb 2007‐June 2008 | USA | Waiting room |
| C: Brochure on self‐management | ||||||
| Kim 2009 | I: group sessions and telephone calls | 30 wk (18 and 30 wk) | Korean Americans | ‐ | USA | Community site—Korean Resource Centre |
| C: usual care (wait‐listed) | ||||||
| Lorig 2008 | I: group sessions | 6 wk (6 mo) | Hispanic | ‐ | USA | Community settings in San Francisco Bay Area |
| C: usual care (wait‐listed) | ||||||
| Lujan 2007 | I: group sessions, telephone calls & inspirational postcards | 6 mo (6 mo) | Mexican Americans | 2007 | USA | Catholic faith‐based community clinic |
| C: usual care—individual sessions & info leaflets | ||||||
|
Middelkoop 2001 |
I: group sessions | 6 mo (6 mo) | Surinam South Asians | 2001 | The Netherlands | Primary care centres and outpatient clinics |
| C: usual care (wait‐listed) | ||||||
| O'Hare 2004 | I: treatment protocols plus extra diabetes clinics and link workers | 12 mo (12 mo) | South Asians | 2004 | UK | Primary care centres |
| C: treatment protocols only | ||||||
| Osborn 2010 | I: individual education session | 90 min (3 mo) | Puerto Ricans | 2010 | USA | Primary care clinic in an urban hospital |
| C: usual care ‐ access to monthly support group facilitated by Puerto‐Rican worker | ||||||
| Philis‐Tsimikas 2011 | I: group education sessions and support group | 10 mo (10 mo) | Mexican Americans | 2011 | USA | Conference room of health clinic |
| C: usual care | ||||||
|
Rosal 2005 |
I: individual and group sessions | 10 wk (3, 6 mo) | Puerto Ricans | 2005 | USA | Community sites familiar to participants |
| C: usual care plus feedback of test results | ||||||
| Rosal 2011 | I: individual and group sessions | 12 mo (4, 12 mo) | Latinos | 2011 | USA | Individual sessions in participants' homes. Group sessions in community locations |
| C: usual care + laboratory results | ||||||
| Rothschild 2013 | I: home visits | 2 years (2 years) | Mexican Americans | 2013 | USA | Participants' homes |
| C: mailed info leaflets | ||||||
| Samuel‐Hodge 2009 | I: individual and group session, telephone calls | 8 mo (8, 12 mo) | African Americans | 2009 | USA | All sessions took place in participants' local church |
| C: minimal intervention: leaflets and newsletters | ||||||
| Sixta 2008 | I: group sessions | 10 wk (3, 6 mo) | Mexican Americans | 2008 | USA | Community health centre |
| C: usual care (wait‐listed) | ||||||
| Skelly 2005 | I: home visits | 12 wk (12 wk) | African Americans | 2005 | USA | Participants' homes |
| C: usual care plus telephone call (wait‐listed) | ||||||
| Skelly 2009 | I: home visits—symptom focused; I2: home visits + booster |
2 mo (3, 6, 9 mo) | African Americans | 2009 | USA | Participants' homes |
| C: nurse home visits—non‐symptom focused | ||||||
| Spencer 2011 | I: CHW: group meetings, home visit and accompanied clinic visit | 6 mo (6 mo) | African American and Hispanic | Recruitment Sept 2004‐July 2006; rest of study period not stated | USA | 'Community locations,' participants' homes and clinic visit |
| C: usual care (wait‐listed) | ||||||
| Toobert 2011 | I: group meetings | 24 mo (6, 12, 24 mo) | Latino | 2011 | USA | Group sessions held in health centres. Unclear where retreat held |
| C: usual care | ||||||
| Vincent 2007 | I: group sessions | 8 wk (3 mo) | Mexican Americans | 2007 | USA | Conference room of health clinic |
| C: usual care and education given at the clinic | ||||||
| "‐" denotes not reported C: comparator: I: intervention; min: minutes; mo: months; N/A: not applicable; RCT: randomised controlled trial; SD: standard deviation; wk: weeks | ||||||
Appendix 4. Baseline characteristics (II)
| Intervention(s) and comparator(s) | Sex [female %] |
Age
[mean/range years (SD), or as reported] |
HbA1c [%] | BMI [mean kg/m² (SD)] | Comorbidities | Comedications | |
|
Agurs Collins 1997 |
I: individual and group sessions | 66 | 62.4 (5.9) | 11 (1.7) | 33.9 (5.1) | Obese individuals | 50 participants in both groups were on insulin I = 47, C = 50 on OAD I = 3 diet controlled |
| C: 1 class and info leaflet | 88 | 61 (5.7) | 10 (1.9) | 34.9 (6.8) | |||
|
Anderson 2005 |
I: group sessions | ‐ | ‐ | 8.7 (2.1) | ‐ | ‐ | 34% in both groups used insulin |
| C: usual care plus feedback on baseline bloods | ‐ | ‐ | 8.4 (2.2) | ‐ | |||
| all: | 82 | 61 (11.4) | 8.6 (2.2) | ‐ | |||
|
Babamoto 2009 |
I1: CHW | 64 | 51 (12.5) | 8.6 (‐) | 32.5 | ‐ | ‐ |
| I2: case management | 52 | 50 (12.1) | 8.5 (‐) | 32.2 | |||
| C: usual care | 78 | 50 (11.0) | 9.5 (‐) | 31.2 | |||
|
Baradaran 2006 |
I: group sessions—ethnic intervention | 52.5 | 57.8 (12.7) | ‐ | ‐ | ‐ | ‐ |
| C1: usual care—ethnic control | 44 | 59.2 (11.3) | ‐ | ‐ | |||
| C2: usual care—white control | 52 | 58 (13.8) | ‐ | ‐ | |||
| all: | 49 | 58.4 (12.3) | ‐ | ‐ | |||
| Bellary 2008 | I: treatment protocols and extra clinics | 46 | < 45 ‐ 15% 45‐64 ‐ 54% > 64 ‐ 31% |
8.2 (1·9) | 28.5 (4·8) | Evidence of existing coronary heart disease or previous CVE: I: 150 (17%), C: 118 (19%) Microalbuminuria: 268 (19%) of participants, I: 161 (20%), C: 107 (28%) Proteinuria: 114 (8%) of participants, I: 61 (8%), C: 53 (9%) |
Taking antihypertensive drugs: 55% 20% of participants were on insulin |
| C: treatment protocols only | 51 | < 45 ‐ 14% 45‐64 ‐ 59% > 64 ‐ 28% |
8.2 (1·8) | 28.6 (4·9) | |||
| all: | 48 | < 45 ‐ 14% 45‐64 ‐ 56% > 64 ‐ 30% |
8.2 (1·9) | 28.5 (4·9) | |||
|
Brown 2002 |
I: group sessions | 60 | 54.7 (8.2) | 11.8 (3) | 32.3 (6) | ‐ | 17 diet alone 169 on OAD 51 on insulin 5 on OAD and insulin |
| C: usual care—wait‐listed control group | 68 | 53.3 (8.3) | 11.8 (2.8) | 32.1 (6.4) | |||
|
Carter 2011 |
I: Internet and videoconferencing with nurse | 69 | 52 (‐) | 8.9 | 35.8 | ‐ | ‐ |
| C: usual care | 57 | 49 (‐) | 8.9 | 35.8 | |||
| Crowley 2013 | I: individual sessions via telephone | 69 | 56 (12) | 8.0 (1.3) | ‐ | ‐ | No. of diabetic agents: C 1.7 (SD 0.9), I 1.6 (SD 0.9) Using insulin: C 52%, I 51% No. of anti‐HTN agents: C 2.9 (SD 1.6), I 2.6 (SD 1.5) No. of cholesterol‐reducing agents: C 0.9 (SD 0.6), I 0.8 (SD 0.6) |
| C: usual care + leaflet | 75 | 57 (12) | 8.0 (1.3) | ‐ | |||
|
D'Eramo Melkus 2010 |
I: group sessions | 100 | 47 (9) | 8.0 (2.1) | ‐ | ‐ | ‐ |
| C: conventional (not culturally appropriate) group sessions | 100 | 45 (10) | 8.3 (2.2) | ‐ | |||
| DePue 2013 | I: nurse‐led self‐management education and medication management facilitation components | 57 | 56 (12.5) | 9.6 (2.1) | 35.6 (6.5) | No serious co‐morbidities | ‐ |
| C: usual care | ‐ | ‐ | ‐ | ‐ | |||
|
Gary 2009 |
I: individual visits to CHW and nurse following culturally appropriate clinical algorithms | 73 | 59 (11) | 7.7 (2.1) | 34 (8) | ‐ | ‐ |
| C: telephone calls and info leaflets | 74 | 56 (11) | 8.0 (2.2) | 35 (8) | |||
|
Gucciardi 2007 |
I1: group sessions | 68 | 60.4 (7.92) | 7.0 (0.02) | 35 (5.6) | ‐ | Diet only: individual + group = 11 (30.6); individual only = 4 (16) OAD: individual + group = 24 (66.7), individual only = 19 (76) Insulin + OAD: individual + group = 1 (2.8), individual = 2 (8.0) |
| I2: individual sessions | 69.4 | 59 (12.1) | 7.0 (0.07) | 35 (6.6) | |||
|
Hawthorne 1997 |
I: individual session with CHW—'flashcards' | 54 | 52 (50‐54) (95%CI) | 8.4 (8.0‐8.9) (95%CI) | ‐ | 53% had more than one diabetic complication | 68% on OAD |
| C: usual care in clinics | 53 | 54 (51‐58) (95%CI) | 8.6 (8.1‐9.0) (95%CI) | ‐ | |||
|
Kattelmann 2009 |
I: group sessions | 76 | ‐ | 8.9 (0.4) | 35 (8) | 72% of participants were obese (BMI > 30), 23% were overweight (BMI > 25) | ‐ |
| C: standard dietary education and health care | 76 | ‐ | 8.6 (0.3) | 34.3 (1.1) | |||
|
Keyserling 2002 |
I1: individual and group sessions | ‐ | 58.5 (‐) | 10.7 (2.3) | 36.2 | 23.5% cardiovascular disease 75.5% hypertension 25% had BMI > 40 |
10% diet only 57% OAD 42% on insulin 10% OAD and insulin |
| I2: individual (not included in meta‐analysis) | ‐ | 59.8 (‐) | 11.0 (3.1) | 34.6 | |||
| C1: usual care | ‐ | 59.2 (‐) | 11.3 (2.3) | 36.5 | |||
| Khan 2011 | I: individual computer‐based (all) | 43 | 52.4 (11.4) | ‐ | 32.4 (6.6) | ‐ | ‐ |
| ‐ African American | ‐ | ‐ | 9.5 (2.6) | ‐ | |||
| ‐ Hispanic | ‐ | ‐ | 8.9 (2.4) | ‐ | |||
| ‐ Asian | |||||||
| C: brochure with self‐management (all) | 42 | 50.5 (12.0) | ‐ | 32.8 (9.1) | |||
| ‐ African American | ‐ | ‐ | 10.4 (2.8) | ‐ | |||
| ‐ Hispanic | ‐ | ‐ | 8.3 (2.2) | ‐ | |||
| ‐ Asian | |||||||
|
Kim 2009 |
I: group sessions and tel. calls | 37.5 | 56.2 (8.4) | 9.4 (1.5) | 25.9 | ‐ | ‐ |
| C: usual care (wait‐listed) | 51.3 | 56.6 (7.6) | 9.1 (1.3) | 25.7 | |||
|
Lorig 2008 |
I: group sessions | 57 | 52.9 (13.2) | 7.4 (2.00) | ‐ | ‐ | ‐ |
| C: usual care (wait‐listed) | 67 | 52.8 (13.4) | 7.4 (1.87) | ‐ | |||
| Lujan 2007 | I1: group sessions, telephone calls and inspirational postcards | ‐ | ‐ | 8.2 (2.2) | ‐ | ‐ | ‐ |
| C1: usual care—individual sessions and info leaflets | ‐ | ‐ | 7.7 (1.5) | ‐ | |||
|
Middelkoop 2001 |
I: group sessions | 51 | 51.7 | 8.4 | ‐ | ‐ | ‐ |
| C: usual care (wait‐listed) | 48 | 54.8 | 8.2 | ‐ | |||
|
O'Hare 2004 |
I: treatment protocols plus extra diabetes clinics and link workers | 47 | < 45 ‐ 9% 45‐64 ‐ 58% > 64 ‐ 32% |
7.8 (1.9) | ‐ | 50%‐60% had raised blood pressure | 10% diet only 72% on OAD 19% on insulin |
| C: treatment protocols only | 51 | < 45 ‐ 14% 45‐64 ‐ 50% > 64 ‐ 36% |
8.1 (2.1) | ‐ | |||
| all: | < 45 ‐ 12% 45‐64 ‐ 54% > 64 ‐ 34% |
8.0 (2.0) | ‐ | ||||
| Osborn 2010 | I: individual education session | 79 | 56.9 (11.3) | 7.8 (1.4) | 35.4 (6.9) | ‐ | ‐ |
| C: usual care—access to monthly support group facilitated by Puerto Rican worker | 70 | 58.4 (10.1) | 7.3 (1.6) | 36.7 (8.7) | |||
| Philis‐Tsimikas 2011 | I: group education sessions and support | 66.3 | 52.2 (9.6) | 10.5 (1.7) | 30.9 (6.3) | ‐ | ‐ |
| C: usual care | 74.8 | 49.2 (11.8) | 10.3 (1.7) | 32.1 (5.9) | |||
|
Rosal 2005 |
I: individual and group sessions | 80 | 62.7 (8.1) | 7.7 (1.2) | 32.4 (4.5) | All participants reported at least 1 diabetes‐related complication | 44% on OAD |
| C: usual care plus feedback of test results | 80 | 62.4 (9.7) | 9.3 (1.8) | 32.7 (7.4) | |||
| all: | 80 | 62.6 (8.6) | ‐ | ‐ | |||
|
Rosal 2011 |
I: individual and group sessions | 78.2 | 18‐44: 15.3 45‐54: 32.3 55‐64: 29 > 64: 23.4 |
8.9 (1.8) | 35.0 (7.4) | 94% of all participants were overweight or obese (74.9% obese) 67.7% of participants had hypertension |
23 participants on insulin alone (9.1%) 100 on insulin plus oral medication (39.7%) 112 (44.4%) on oral medications alone |
| C: usual care | 75 | 18‐44: 17.2 45‐54: 27.3 55‐64: 36.7 > 64: 18.8 |
9.1 (2.0) | 34.5 (6.5) | |||
| all: | 76.6 | 18‐44: 16.3 45‐54: 29.8 55‐64: 32.9 > 64: 21.0 |
9 (1.9) | 34.8 (6.9) | |||
| Rothschild 2012 | I: home visits | 64.4 | 53.7 (11.7) | 8.5 (2.2) | 32.7 (7.4) | No significant comorbidities | I participants were less likely than C patients to have been taking an ACEi or ARB at baseline (OR = 0.6, CI 0.3 to 1.1) |
| C: mailed info leaflets | 70.4 | 53.6 (12.7) | 8.1 (1.6) | 34.2 (9.5) | |||
| all: | 67.4 | 53.7 (12.2) | 8.3 (2.0) | 33.4 (8.5) | |||
| Samuel‐Hodge 2009 | I: individual, group and telephone calls | 64 | 57.0 (9.7) | 7.8 (2.0) | 34.6 (7.6) | ‐ | ‐ |
| C: minimal intervention: leaflets and newsletters | 63 | 61.3 (11.9) | 7.8 (2.5) | 35.1 (7.3) | |||
| Sixta 2008 | I: group sessions | 71 | 54.5 | 7.3 | ‐ | ‐ | ‐ |
| C: usual care (wait‐listed) | 71 | 52.8 | 7.7 | ‐ | |||
| all: | 71 | 56.3 | 7.5 | ‐ | |||
|
Skelly 2005 |
I: home visits | 100 | 60.5 (9.0) | 9.2 (2.5) | Overall intervention group had more % of complications: I: 31.8% peripheral vascular vs C: 17.7% Retinopathy I: 45.5% vs C: 35.3% (Table 2) Reported symptoms by group: 73.9% neurological symptoms in I vs 38.9% in C |
26.1% insulin in I vs 16.7% in C Both 26% I vs 5.6% control |
|
| C:usual care plus telephone call (wait‐listed) | 100 | 63.7 (10.8) | 9.0 (2.8) | ||||
| Skelly 2009 | I: home visits—symptom focused | 100 | 68.5 (med) | 8.4 (1.6) | ‐ | ‐ | ‐ |
| I2: home visits with booster | 100 | 65 (med) | 8.3 (1.6) | ‐ | |||
| C: weight management + diet | 100 | 68 (med) | 8.1 (1.6) | ‐ | |||
| all: | 100 | 67 (med) | 8.3 (1.6) | ‐ | |||
| Spencer 2011 | I: CHW: group meetings, home visit and accompanied clinic visit African American | 75 | 50 (47‐52) (95% CI) | 8.7 (7.9‐9.5) (95% CI) | 33.5 (30.8‐36.2) (95% CI) | No serious diabetes complications | I: 8 (11%) on no medications, 43 (61%) on oral medications only, 19 (27%) on insulin C: 7 (8%) on no medications, 57 (63%) on oral medications only, 26 (29%) on insulin |
| Hispanic | 8.2 (7.5‐9.0) (95% CI) | 31.4 (28.9‐33.9) (95% CI) | |||||
| C: usual care (wait‐listed) African American | 67 | 55 (53‐57) (95% CI) | 8.6 (7.9 ‐ 9.3)(95%CI) | 36.1 (33.7‐38.5) (95% CI) | |||
| Hispanic | 8.2 (7.5 ‐ 8.8)(95%CI) | 31.6 (29.4 ‐ 33.9)(95%CI) | |||||
| Toobert 2011 | I: group meetings | 100 | 55.6 (9.7) | 8.4 (1.9) | 35.3 (7.0) | ‐ | C: 67.8% on none or oral medication only, 13.1% on insulin only, 19% on insulin and oral medication I: 70.9% on none or oral medication only, 5.7% on insulin only, 23.4% on insulin and oral medication |
| C: usual care | 100 | 58.7 (10.3) | 8.2 (1.7) | 33.2 (6.7) | |||
| all: | 100 | 57.1 (10.09) | ‐ | 34.3 | |||
| Vincent 2007 | I: group sessions | 89 | 56.7 (10.6) | 6.6 (0.9) | 30.6 (2.7) | ‐ | ‐ |
| C: usual care | 50 | 55.3 (8.2) | 6.7 (1.2) | 29.8 (4.2) | |||
| all: | 71 | 56 (9.3) | |||||
| "‐" denotes not reported. 95% CI: 95% confidence interval; ACEi: angiotensin converting enzyme inhibitor; ARB: angiotensin receptor blocker; BMI: body mass index; C: comparator; CHW: community health worker; I: intervention (as described in Annexe: description of interventions); med: median; OAD: oral antidiabetic agents; SD: standard deviation. | |||||||
Appendix 5. Matrix of study endpoints (publications)
| Endpoint | Time of measurement | |
| Agurs Collins 1997 | HbA1c Blood pressure Body mass index (BMI) Knowledge—nutrition & diet Lipid profile Physical activity levels Waist/hip ratio Weight |
3, 6 mo |
| Anderson 2005 | Attitudes Blood pressure (BP) Diabetes care profile Empowerment HbA1c Lipids Weight Percentage using insulin Percentage testing blood sugar |
6, 12 wk, 6 mo, 1 year |
| Babamoto 2009 | BMI Diabetes knowledge Dietary intake (incl. fruit and vegetable intake and fatty food intake) Emergency department admissions HbA1c Health status Medication‐taking behaviour Physical activity |
6 mo |
| Baradaran 2006 | Knowledge about diabetes Attitudes towards diabetes: seriousness, complications, practice |
6 mo |
| Bellary 2008 | Blood pressure HbA1c Lipids BMI CHD risk (Framingham) Economic costs Microalbuminuria Plasma creatinine Waist circumference |
24 mo |
| Brown 2002 | BMI Diabetes knowledge Fasting blood glucose HbA1c Health beliefs Lipids |
0, 3, 6, 12 mo |
| Carter 2011 | HbA1c < 7% during last month or longer of study enrolment Blood pressure BMI Weight (pounds) Diabetes knowledge Diabetes management practices Healthy eating Physical activity Positive self‐perceived physical health status Positive self‐perceived mental health status |
9 mo |
| Crowley 2013 | Systolic blood pressure HbA1c Low‐density lipoprotein cholesterol Medication adherence |
12 mo |
| D'Eramo Melkus 2010 | HbA1c BMI Waist circumference Blood pressure |
12 mo |
| DePue 2013 | Anxiety Blood pressure Diabetes knowledge Diabetes self‐efficacy Diabetes‐related emotional distress Diabetes‐specific social support Fasting blood glucose HbA1c Healthcare provider support Lipids Quality of life Weight |
3, 6, 9, 12, 24 mo |
| Gary 2009 | Emergency department (ER) visits Blood pressure BMI Economic data General health status HbA1c Hospitalisations Lipids Medication adherence Diabetes‐related health behaviours Total and HDL cholesterol |
24, 36 mo |
| Gucciardi 2007 | HbA1c Nutrition self‐management attitudes Nutrition self‐reported adherence |
3 mo |
| Hawthorne 1998 | Attitudes to diabetes Cholesterol HbA1c Knowledge of diabetes Self‐efficacy |
6 mo |
| Kattelmann 2009 | Blood pressure BMI Circulating insulin concentration Diet history HbA1c Fasting plasma glucose Lipids Physical activity Satiety survey Weight |
6 mo |
| Keyserling 2002 | Physical activity (PA) Dietary intake HbA1c Lipids (total and HDL cholesterol) Diabetes knowledge Diabetes health status (social and mental well‐being) Weight Subgroups reported in publication: clinic (individual) and community (group) vs clinic only (individual) vs control |
6, 12 mo |
| Khan 2011 | Blood pressure Diabetes knowledge Diabetes self‐care behaviours HbA1c Medications prescribed Self‐efficacy Subgroups reported in publication: African American, Asian, Hispanic |
3 mo |
| Kim 2009 | HbA1c Depression Diabetes knowledge Quality of life Self‐efficacy Self‐care Subgroups reported in publication: blood pressure, BMI, lipids, fasting glucose |
18 wk, 30 wk |
| Lorig 2008 | Activity limitation Aerobic exercise Communication with physician Days in hospital Emergency visits HbA1c Health distress Hypoglycaemia symptoms Hyperglycaemia symptoms Fatigue Glucose monitoring Physician visits Self‐reported global health Stretching/strength exercise |
6 mo |
| Lujan 2007 | HbA1c Diabetes knowledge Diabetes health beliefs |
3, 6 mo |
| Middelkoop 2001 | HbA1c BMI Lipid levels |
6 mo |
| O'Hare 2004 | Blood pressure (BP) HbA1c Lipid control Economic analysis |
1 year |
| Osborn 2010 | Diet adherence Food label reading HbA1c Physical activity |
3 mo |
| Philis‐Tsimikas 2011 | HbA1c Lipids Blood pressure BMI |
4 mo, 10 mo |
| Rosal 2005 | Blood pressure (bp) Depression scale Diabetes knowledge Dietary self‐efficacy Exercise self‐efficacy Feasibility: rates of attendance, recruitment and assessment HbA1c Height, weight, hip ratio Insulin & blood glucose monitoring self‐efficacy Lipid profile Quality of life |
3 mo, 6 mo |
| Rosal 2011 | HbA1c Blood glucose self‐monitoring Blood pressure BMI Diabetes knowledge Dietary knowledge Lipid profile Medication intensity Physical activity Self‐efficacy for dietary and physical activity change |
4, 12 mo |
| Rothschild 2012 | Blood pressure control HbA1c Glucose self‐monitoring Medication adherence Self‐efficacy Self‐management behaviours |
1, 2 years |
| Samuel‐Hodge 2009 | HbA1c Blood pressure Diabetes knowledge Diabetes‐related health status Dietary intake General health status HbA1c (12 months) Physical activity Weight |
8, 12 mo |
| Sixta 2008 | Diabetes knowledge Diabetes health behaviours HbA1c |
3, 6 mo |
| Skelly 2005 | Symptom distress Knowledge Quality of life HbA1c Self‐care practice Participant satisfaction |
End of intervention |
| Skelly 2009 | HbA1c Diabetes self‐care Quality of life Symptom distress Subgroups reported in publication: control, intervention, intervention plus telephone booster |
3, 6, 9 mo |
| Spencer 2011 | HbA1c Blood pressure BMI Lipids Knowledge PAID score (problem areas in diabetes scale) Self‐efficacy |
6 mo |
| Toobert 2011 | Diet (% calories from saturated fat) HbA1c Health‐related quality of life Participant engagement in social‐environmental support activities Physical activity Problem‐solving ability Self‐efficacy Social support Smoking frequency Stress management practice 10‐year heart disease risk |
6, 12 mo |
| Vincent 2007 | Blood glucose BMI HbA1c Diabetes knowledge Diabetes self‐efficacy Diabetes self‐management Weight |
|
| BMI: body mass index; HbA1c: glycosylated haemoglobin A1c; mo: months; N/A: not applicable; wk: weeks. | ||
Appendix 6. Examination of outcome reporting bias
| Clear that outcome was measured and analyseda [trial report states that outcome was analysed but reports only that result was not significant] | Clear that outcome was measured and analysedb [trial report states that outcome was analysed but no results reported] | Clear that outcome was measuredc [clear that outcome was measured but not necessarily analysed (judgement says likely to have been analysed but not reported because of non‐significant results)] | Unclear whether the outcome was measuredd [not mentioned but clinical judgement says likely to have been measured and analysed but not reported on the basis of non‐significant results] | |
| Rothschild 2013 | A large quantity of baseline data was collected, and follow‐up data are not adequately provided. For instance, blood pressure is dichotomised as an outcome, whereas presented as continuous as baseline. Self‐efficacy is reported as "increasing significantly for both study arms," but no further details are provided | N/A | N/A | N/A |
| 'High risk of bias' categories for outcome reporting bias according to the Outcome Reporting Bias In Trials (ORBIT) study classification system for missing or incomplete outcome reporting in reports of randomised trials (Kirkham 2010). aClassification 'A' (Table 2, Kirkham 2010). bClassification 'D' (Table 2, Kirkham 2010). cClassification 'E' (Table 2, Kirkham 2010). dClassification 'G' (Table 2, Kirkham 2010). N/A: not applicable | ||||
Appendix 7. Definition of endpoint measurement
| Disease‐specific mortality | Diabetic complications | Health‐related quality of life | Participant satisfaction | Participant empowerment and self‐efficacy | Attitude | Knowledge of the disease | |
| Agurs Collins 1997 | N/I | N/I | N/I | N/I | N/I | N/I | Nutrition knowledge was assessed with questionnaire adapted by Fanelli for lower reading skills Unable to tell whether higher is positive |
| Anderson 2005 | N/I | N/I | N/I | N/I | Diabetes Empowerment Scale Short Form (DES‐SF). Does not say if validity and reliability for study group No mention if positive or negative |
Seriousness of diabetes from Diabetes Attitudes Scale‐3 | Diabetes Care Profile questionnaire. Unable to tell whether higher is positive |
| Babamoto 2009 | N/I | N/I | N/I | N/I | N/I | N/I | Diabetes Knowledge Questionnaire—a measure of diabetes knowledge that is available in both English and Spanish |
| Baradaran 2006 | N/I | N/I | N/I | N/I | N/I | Specially designed questionnaire for study population tested in a different study Does not say whether tested for validity/reliability Higher=positive |
Specially designed questionnaire for study population tested in a different study Does not say whether tested for validity/reliability Higher=positive |
| Bellary 2008 | N/I | N/I | N/I | N/I | N/I | N/I | N/I |
| Brown 2002 | N/I | N/I | N/I | N/I | Health belief questionnaire was shortened form of existing one, internal consistency checked. Pilot tested. Does not say whether positive or negative |
N/I | Shortened version of 60‐item DKQ Reliable and validated Higher=positive |
| Carter 2011 | N/I | N/I | N/I | N/I | N/I | N/I | Mentions using a "diabetes knowledge scale" in results table but not defined otherwise |
| Crowley 2013 | N/I | N/I | N/I | N/I | N/I | N/I | N/I |
| D'Eramo Melkus 2010 | N/I | N/I | Measured using the Medical Outcomes Study (MOS) SF‐36. A 36‐item measure. Reliability and validity previously established | N/I | Measured using the Diabetes Self‐Efficacy Outcomes Expectancies Questionnaire, a 20‐item measure. Reliability and validity previously established? | N/I | Measured using the Diabetes Knowledge Test, a 25‐item self‐administered test. Internal reliability previously established. |
| DePue 2013 | N/I | N/I | N/I | N/I | N/I | N/I | N/I |
| Gary 2009 | N/I | N/I | N/I | N/I | N/I | N/I | N/I |
| Gucciardi 2007 | N/I | N/I | N/I | N/I | N/I | Attitudes measured as part of "Theory of planned behaviour scale" (no usable data used in meta‐analysis though) | N/I |
| Hawthorne 1998 | N/I | N/I | N/I | N/I | Internally validated, specially prepared, culturally appropriate questionnaire. Tailored to the health education objectives Score as percentage correct: higher=positive |
"And a similar patient knowledge pattern was obtained." Does not say whether the questionnaire used to test knowledge and self‐efficacy was also used for attitudes | Internally validated, specially prepared, culturally appropriate questionnaire, tailored to the health education objectives Higher=positive |
| Kattelmann 2009 | N/I | N/I | N/I | N/I | N/I | N/I | N/I |
| Keyserling 2002 | N/I | N/I | Measured using Diabetes Health Status. Applicable to study group. Has consistency and validity Does not say whether positive or negative |
N/I | N/I | N/I | 15‐item adaptation of Diabetes Knowledge Scale Does not say whether validated Increased score=positive |
| Khan 2011 | N/I | N/I | N/I | N/I | Assessed via a previously validated 12‐item instrument Does not say name of scale or whether higher value is positive Unable to access paper for referencing of scale |
N/I | Spoken knowledge in Diabetes Scale (SKILL‐D) Higher score=better |
| Kim 2009 | N/I | N/I | Translated and modified Diabetes QOL measure (DQOL) Original version demonstrated validity and reliability Unclear whether tested on study population Lower value=positive |
N/I | Self‐efficacy for diabetes scale adapted from Stanford Chronic Disease Efficacy Scale ="Modified Standford Chronic Disease Efficacy Scale" Original scale has construct validity and reliability Higher value=positive |
N/I | Diabetes Knowledge test General version validated Does not say whether positive/negative values But higher=positive |
| Lorig 2008 | N/I | N/I | N/I | A single item from the National Survey of self‐rated health Lower value=desirable |
Spanish diabetes self‐efficacy scale. Tested to be reliable and to have validity for study group Higher value=positive |
N/I | N/I |
| Lujan 2007 | N/I | N/I | N/I | N/I | Patient 'health beliefs' measures using the bilingual DHBM, a 25‐item measure developed to measure overall diabetes health beliefs among Mexican Americans. Used in a previous pilot study at the clinic and found to have adequate psychometric properties |
N/I | Measured using a 24‐item bilingual diabetes knowledge questionnaire designed for Mexican Americans Used by Brown et al Higher=positive |
| Middelkoop 2001 | N/I | N/I | N/I | N/I | N/I | N/I | N/I |
| O'Hare 2004 | N/I | N/I | N/I | N/I | N/I | N/I | N/I |
| Osborn 2010 | N/I | N/I | N/I | N/I | N/I | N/I | N/I |
| Philis‐Tsimikas 2011 | N/I | N/I | N/I | N/I | N/I | N/I | N/I |
| Rosal 2005 | N/I | N/I | Adapted version of Audit of Diabetes Dependent QoL. Assessed for internal validity and reliability Higher value=positive |
N/I | N/I | N/I | Adapted (for target population) version of Audit of Diabetes Knowledge (ADKNOW 1) Preliminary psychometric data provided evidence of adequate internal consistency and test/retest reliability Higher value=positive |
| Rosal 2011 | N/I | N/I | N/I | N/I | Self‐efficacy for dietary and physical activity change measured using a 17‐item tool developed by the research team, which showed adequate psychometric properties on testing | N/I | Measured from subset of items from audit of diabetes knowledge Previously tested and adapted for target population Did not use data, as no sample size or standard deviation |
| Rothschild 2012 | N/I | N/I | N/I | N/I | Measured using Diabetes Empowerment Scale, a previously validated 28‐item questionnaire to assess diabetes‐specific self‐efficacy | N/I | N/I |
| Samuel‐Hodge 2009 | N/I | N/I | N/I | N/I | N/I | N/I | Measured using 16‐item adaptation of the Diabetes Knowledge Scale Higher=positive |
| Sixta 2008 | N/I | N/I | N/I | N/I | N/I | N/I | Measured using a shortened version of the original 60‐item DKQ (Brown et al) Content validity and reliability of this new measure were established Higher value=positive |
| Skelly 2005 | N/I | N/I | QoL diabetes instrument | N/I | N/I | N/I | New‐leaf diabetes knowledge instrument |
| Skelly 2009 | N/I | N/I | Measured using 2 specific diabetes measure: i) Diabetes‐related QoL measured using the Quality of Life in Diabetes Scale. This had been developed for use with older, rural African Americans, previously validated ii) Other aspects of QoL measured using the Problem Areas in Diabetes Survey (PAID) —reliability and validity established. |
N/I | N/I | N/I | N/I |
| Spencer 2011 | N/I | N/I | N/I | N/I | Diabetes self‐efficacy assessed with the Perceived Competence for Diabetes Scale. Previously validated | N/I | Knowledge measured by asking participants, "How well do you understand how to manage your diabetes?" (question previously validated) and by checking their responses to 2 items: i) "I agree that what one eats effects blood sugar" and ii) "Exercise helps to control blood sugar" Response to the previously validated question |
| Toobert 2011 | N/I | N/I | Measured using the CDC Healthy Days measure. Does not say whether previously validated | N/I | Confidence in overcoming challenges to self‐care instrument Does not say whether tested on ethnic study group Higher values=more obstacles top self‐carte and more confidence on all scales Higher=positive |
N/I | N/I |
| Vincent 2007 | N/I | N/I | N/I | N/I | 8‐item version of self‐efficacy for diabetes scale Reliability=0.85 Increased score=increased self‐efficacy. Higher=positive |
N/I | Diabetes Knowledge Questionnaire—Spanish version Reliability=0.88 Higher scores=increased diabetes knowledge Higher=positive |
| N/I: not investigated; DKQ: Diabetes Knowledge Questionnaire; QoL: quality of life. | |||||||
Appendix 8. Survey of authors providing information on included trials
| Study author contacted | Study author replied | Study author asked for additional information | Study author provided data | |
| Agurs Collins 1997 | No | |||
| Anderson 2005 | No | |||
| Babamoto 2009 | Yes ‐ August 2013 | No | ||
| Baradaran 2006 | No | |||
| Bellary 2008 | Yes ‐ March 2012 | Yes ‐ March 2012 | Yes | Provided HbA1c data at 24 months |
| Brown 2002 | No | |||
| Carter 2011 | No | |||
| Crowley 2013 | Yes | Yes | Study author (Powers BJ) was emailed in February 2012 to ask for trial results, as only protocol was initially located. Additional data were not required, as the results were published in time for inclusion in our review anyway | Not required |
| D'Eramo Melkus 2010 | Yes | Yes | Yes | No |
| DePue 2013 | Yes | No | Email failed | |
| Gary 2009 | Yes | Not replied | ||
| Gucciardi 2007 | No | |||
| Hawthorne 1998 | No | |||
| Kattelmann 2009 | No | |||
| Keyserling 2002 | No | |||
| Khan 2011 | March 2012 | March 2012 | Yes | Dr Gerber provided data split into groups by ethnicity |
| Kim 2009 | No | |||
| Lorig 2008 | February 2012 | February 2012 | Yes | Yes ‐ Jernigan replied in reference to earlier trial and said data included in this one |
| Lujan 2007 | No | |||
| Middelkoop 2001 | No | |||
| O'Hare 2004 | No | |||
| Osborn 2010 | No | |||
| Philis‐Tsimikas 2011 | Yes ‐ August 2013 | Yes | Yes | Yes |
| Rosal 2005 | No | |||
| Rosal 2011 | Yes ‐ February 2012 | Yes ‐ February 2012 | Yes | Study author provided means and SDs for cholesterol, BP and HbA1c |
| Rothschild 2012 | July 2013 | July 2013 | Yes | S Rothschild provided results from published paper provided in August 2013 |
| Samuel‐Hodge 2009 | No | |||
| Sixta 2008 | Yes ‐ August 2013 | No | ||
| Skelly 2005 | No | |||
| Skelly 2009 | Yes | Yes | Yes | No ‐ Author now retired |
| Spencer 2011 | May 2013 | May 2013 | Yes | Brandy Sinco (statistician) provided data split by ethnicity |
| Toobert 2011 | February 2012 | February 2012 | Yes | Study author confirmed that health education was provided to participants |
| Vincent 2007 | No |
Appendix 9. Health education teams involved in the educational interventions
| Health education teams | Link worker or community worker | Dietician | Nurse | Other |
| Agurs Collins 1997 | Yes | Exercise physiotherapist | ||
| Anderson 2005 | Yes | Yes | Nurse—certified diabetes educator | |
| Babamoto 2009 | Yes | Yes | ||
| Baradaran 2006 | Yes | Podiatrist | ||
| Bellary 2008 | Yes | Yes | Cultural link worker | |
| Brown 2002 | Yes | Yes | Yes | |
| Carter 2011 | Yes | |||
| Crowley 2013 | Yes | |||
| D'Eramo Melkus 2010 | Yes | Yes | Diabetes educator | |
| DePue 2013 | Yes | Yes | ||
| Gary 2009 | Yes | Yes | ||
| Gucciardi 2007 | Yes | Yes | Psychologist, physiotherapist and pharmacist | |
| Hawthorne 1998 | Yes | |||
| Kattelmann 2009 | Yes | Yes | ||
| Keyserling 2002 | Yes | Yes (Nutritionist) | ||
| Khan 2011 | Multimedia program | |||
| Kim 2009 | Yes | |||
| Lorig 2008 | Yes | Diabetes educator | ||
| Lujan 2007 | Yes | |||
| Middelkoop 2001 | Yes | Yes | ||
| O'Hare 2004 | Yes | Yes | ||
| Osborn 2010 | Medical assistant, health psychologist | |||
| Philis‐Tsimikas 2011 | Yes | |||
| Rosal 2005 | Yes | Yes | ||
| Rosal 2011 | Yes | Lay workers | ||
| Rothschild 2012 | Yes | |||
| Samuel‐Hodge 2009 | Yes | Yes | ||
| Sixta 2008 | Yes | |||
| Skelly 2005 | Yes | |||
| Skelly 2009 | Yes | |||
| Spencer 2011 | Yes | |||
| Toobert 2011 | Clinical staff and community professionals | |||
| Vincent 2007 | Lay educator |
Appendix 10. Effect of subgroup analysis
| Subgroup analysis | ||||
| 1. Results of main meta‐analysis | Number of studiesa | HbA1c [MD (95% CI)] (number of participants) [trials] | Knowledge [SMD (95% CI)] (number of participants) [trials] | Total cholesterol [MD (95% CI)] (number of participants) [trials] |
| 14 (3 mo) | ‐0.36 [‐0.53, ‐0.18] (n = 1442) [14] | 0.35 [0.10, 0.59] (n = 936) [10] | NSS (n = 888) [6] | |
| 22 (6 mo) | ‐0.53 [‐0.72, ‐0.35] (n = 1972) [14] | 0.50 [0.33, 0.68] (n = 994) [9] | NSS (n = 802) [7] | |
| 12 (1 year) | ‐0.19 [‐0.34, ‐0.04] (n = 1966) [9] | 0.35 [0.13, 0.57] (n = 328) [2] | NSS (n = 1019) [5] | |
| 4 (2 years) | ‐0.33 [‐0.61, ‐0.06] (n = 2268) | no data | no data | |
| 2. Type of intervention | Number of studies | HbA1c | Knowledge | Total cholesterol |
| a. Group education | 6 (3 mo) | ‐0.14 [‐0.46, 0.18] (n = 703) [5] | 0.56 [0.34, 0.77] (n = 557) [4] | NSS (n = 577) [3] |
| 11 (6 mo) | ‐0.46 [‐0.74, ‐0.19] (n = 1075) [5] | NSS (n = 211) [2] | 8.92 [7.03, 10.81] (n = 334) [2] | |
| 6 (1 year) | ‐0.68 [‐1.19, ‐0.17] (n = 354) [2] | Only 1 study | NSS (n = 356) [2] | |
| 1 (2 years) | One study | No data | No data | |
| b. One‐to‐one education | 3 (3 mo) | NSS (n = 204) [3] | NSS (n = 74) [2] | No data |
| 4 (6 mo) | ‐0.41 [‐0.71, ‐0.10] (n = 305) [2] | Only 1 study | One study | |
| 3 (1 year) | NSS (n = 496) [2] | No data | One study | |
| 3 (2 years) | ‐0.29 [‐0.57, ‐0.01] (n = 2159) | No data | No data | |
| c. Combined approach | 4 (3 mo) | ‐0.62 [‐0.99, ‐0.25] (n = 535) | NSS (n = 305) | NSS (n = 390) |
| 7 (6 mo) | ‐0.56 [‐0.76, ‐0.36] (n = 705) | 0.47 [0.29, 0.65] (n = 591) [6] | NSS (n = 276) [4] | |
| 3 (1 year) | NSS (n = 511) | Only 1 study | NSS (n = 338) [2] | |
| 0 (2 years) | No data | No data | No data | |
| 3. Type of educator | Number of studies | HbA1c | Knowledge | Total cholesterol |
| a. Link worker/community worker | 7 (3 mo) | ‐0.36 [‐0.59, ‐0.13] (n = 876) | 0.29 [0.04, 0.53] (n = 533) [5] | NSS (n = 399) [3] |
| 9 (6 mo) | ‐0.58 [‐0.89, ‐0.27] (n = 1271) | 0.55 [0.29, 0.80] (n = 607) [5] | NSS (n = 668) [5] | |
| 6 (1 year) | ‐0.33 [‐0.59, ‐0.07] (n = 1164) | 0.35 [0.13, 0.57] (n = 328) [2] | ‐0.39 [‐0.64, ‐0.14] (n = 1019) [5] | |
| 4 (2 years) | ‐0.33 [‐0.61, ‐0.06] (n = 2268) | No data | No data | |
| b. Diabetes nurse | 6 (3 mo) | ‐0.49 [‐0.96, ‐0.03] (n = 684) | 0.54 [0.24, 0.84] (n = 513) [4] | NSS (n = 536) [4] |
| 4 (6 mo) | ‐0.78 [‐1.18, ‐0.39] (n = 443) | NSS (n = 104) [2] | NSS (n = 334) [3] | |
| 3 (1 year) | NSS (n = 901) | One study | ‐0.39 [‐0.64, ‐0.14] (n = 550) [2] | |
| 3 (2 years) | ‐0.18 [‐0.34, ‐0.02] (n = 2124) | No data | No data | |
| c. Dietician | 4 (3 mo) | NSS (n = 515) | 0.53 [0.22, 0.84] (n = 492) [4] | NSS (n = 514) [4] |
| 7 (6 mo) | ‐0.57 [‐0.85, ‐0.29] (n = 815) | 0.31 [0.12, 0.50] (n = 451) [5] | NSS (n = 531) [5] | |
| 3 (1 year) | NSS (n = 505) | 0.35 [0.13, 0.57] (n = 328) [2] | NSS (n = 336) [2] | |
| 0 (2 years) | No data | No data | No data | |
| 4. Duration of the intervention | Number of studies | HbA1c | Knowledge | Total cholesterol |
| Less than 3 months | 9 (3 mo) | NSS (n = 638) | NSS (n = 497) [7] | NSS (n = 304) [3] |
| 5 (6 mo) | ‐0.43 [‐0.64, ‐0.23] (n = 737) | 0.43 [0.11, 0.76] (n = 483) | NSS (n = 80) [2] | |
| 0 | No data | No data | No data | |
| 1 (2 years) | One study | No data | No data | |
| More than 3 months | 5 (3 mo) | ‐0.51 [‐0.92, ‐0.11] (n = 804) | 0.39 [0.05, 0.73] (n = 439) [3] | NSS (n = 663) [4] |
| 8 (6 mo) | ‐0.65 [‐1.00, ‐0.30] (n = 955) | 0.52 [0.34, 0.70] (n = 511) [4] | NSS (n = 530) [4] | |
| 8 (1 year) | ‐0.22 [‐0.38, ‐0.05] (n = 1686) | 0.35 [0.13, 0.57] (n = 328) [2] | ‐0.39 [‐0.64, ‐0.14] (n = 1019) [5] | |
| 3 (2 years) | ‐0.29 [‐0.57, ‐0.01] (n = 2159) | No data | No data | |
| 5. Health system | Number of studies | HbA1c | Knowledge | Total cholesterol |
| United States of America and Canada | 14 (3 mo) | ‐0.47 [‐0.73, ‐0.20] (n = 1442) | 0.35 [0.10, 0.59] (n = 936) [10] | NSS (n = 967) [7] |
| 11 (6 mo) | ‐0.62 [‐0.88, ‐0.36] (n = 1387) | 0.49 [0.34, 0.65] (n = 722) [7] | NSS (n = 610) [6] | |
| 7 (1 year) | ‐0.26 [‐0.45, ‐0.07] (n = 1361) | 0.35 [0.13, 0.57] (n = 328) [2] | NSS (n = 694) [4] | |
| 3 (2 years) | NSS (n = 795) | No data | No data | |
| Europe | 0 (3 mo) | No data | No data | No data |
| 2 (6 mo) | ‐0.41 [‐0.71, ‐0.10] (n = 305) | NSS (n = 272) [2] | One study | |
| 1 (1 year) | One study | No data | One study | |
| 1 (2 years) | One study | No data | No data | |
| 6. Ethnic group | Number of studies | HbA1c | Knowledge | Total cholesterol |
| a. African American | 5 (3 mo) | NSS (n = 482) | NSS (n = 301) [3] | NSS (n = 279) [2] |
| 4 (6 mo) | ‐0.93 [‐1.66, ‐0.21] (n = 400) | 0.39 [0.17, 0.60] (n = 346) [3] | NSS (n = 172) [2] | |
| 3 (1 year) | NSS (n = 633) | One study | One study | |
| 2 (2 years) | NSS (n = 651) | No data | No data | |
| b. Hispanic | 8 (3 mo) | ‐0.33 [‐0.56, ‐0.11] (n = 881) | 0.26 [0.03, 0.49] (n = 556) [6] | NSS (n = 609) [4] |
| 6 (6 mo) | ‐0.49 [‐0.77, ‐0.22] (n = 1084) | NSS (n = 297) [3] | NSS (n = 255) [2] | |
| 4 (1 year) | ‐0.50 [‐0.77, ‐0.24] (n = 728) | Only 1 study | NSS (n = 583) [3] | |
| 1 (2 years) | One study | No data | No data | |
| c. South Asian | 0 (3 mo) | No data | No data | No data |
| 2 (6 mo) | ‐0.41 [‐0.71, ‐0.10] (n = 305) | NSS (n = 272) [2] | One study | |
| 1 (1 year) | One study | No data | One study | |
| 1 (2 years) | One study | No data | No data | |
|
aNumber of studies if different from initially stated. CI: confidence interval; HbA1c: glycosylated haemoglobin A1c; MD: mean difference; mo: month; NSS: not statistically significant; SMD: standardised mean difference | ||||
Data and analyses
Comparison 1. Culturally tailored HE compared with conventional or usual diabetes health care.
| Outcome or subgroup title | No. of studies | No. of participants | Statistical method | Effect size |
|---|---|---|---|---|
| 1 Mean HbA1c at 3 to 4 months | 14 | 1442 | Mean Difference (IV, Random, 95% CI) | ‐0.39 [‐0.64, ‐0.13] |
| 1.1 Final values | 11 | 1108 | Mean Difference (IV, Random, 95% CI) | ‐0.20 [‐0.45, 0.05] |
| 1.2 Change scores | 3 | 334 | Mean Difference (IV, Random, 95% CI) | ‐0.74 [‐1.19, ‐0.30] |
| 2 Mean HbA1c up to 6 months | 14 | 1972 | Mean Difference (IV, Random, 95% CI) | ‐0.53 [‐0.72, ‐0.35] |
| 2.1 Final values | 7 | 1186 | Mean Difference (IV, Random, 95% CI) | ‐0.51 [‐0.77, ‐0.25] |
| 2.2 Change scores | 7 | 786 | Mean Difference (IV, Random, 95% CI) | ‐0.56 [‐0.85, ‐0.28] |
| 3 Mean HbA1c up to 1 year | 9 | 1966 | Mean Difference (IV, Random, 95% CI) | ‐0.19 [‐0.34, ‐0.04] |
| 3.1 Change scores | 2 | 555 | Mean Difference (IV, Random, 95% CI) | ‐0.10 [‐0.37, 0.18] |
| 3.2 Final values | 7 | 1411 | Mean Difference (IV, Random, 95% CI) | ‐0.23 [‐0.43, ‐0.03] |
| 4 Mean HbA1c at 24 months | 4 | 2268 | Mean Difference (IV, Random, 95% CI) | ‐0.33 [‐0.61, ‐0.06] |
| 4.1 Final values | 2 | 253 | Mean Difference (IV, Random, 95% CI) | ‐0.71 [‐1.07, ‐0.35] |
| 4.2 Change scores | 2 | 2015 | Mean Difference (IV, Random, 95% CI) | ‐0.16 [‐0.31, ‐0.02] |
| 5 Mean HbA1c at all points | 28 | 5724 | Mean Difference (IV, Fixed, 95% CI) | ‐0.30 [‐0.38, ‐0.22] |
| 5.1 Final values | 17 | 2368 | Mean Difference (IV, Fixed, 95% CI) | ‐0.33 [‐0.46, ‐0.21] |
| 5.2 Change scores | 11 | 3356 | Mean Difference (IV, Fixed, 95% CI) | ‐0.28 [‐0.38, ‐0.17] |
| 6 Mean quality of life measures at 3 to 4 months | 2 | 104 | Std. Mean Difference (IV, Random, 95% CI) | 0.36 [‐0.03, 0.75] |
| 6.1 Final values | 0 | 0 | Std. Mean Difference (IV, Random, 95% CI) | 0.0 [0.0, 0.0] |
| 6.2 Change scores | 2 | 104 | Std. Mean Difference (IV, Random, 95% CI) | 0.36 [‐0.03, 0.75] |
| 7 Mean quality of life scores at 6 months | 3 | 224 | Std. Mean Difference (IV, Random, 95% CI) | 0.19 [‐0.08, 0.45] |
| 7.1 Mean values | 1 | 120 | Std. Mean Difference (IV, Random, 95% CI) | 0.07 [‐0.29, 0.43] |
| 7.2 Change scores | 2 | 104 | Std. Mean Difference (IV, Random, 95% CI) | 0.33 [‐0.06, 0.72] |
| 8 Mean quality of life scores at 1 year | 1 | Std. Mean Difference (IV, Fixed, 95% CI) | Subtotals only | |
| 9 Final mean knowledge (diabetes and nutrition knowledge) at up to 6 months | 9 | 994 | Std. Mean Difference (IV, Random, 95% CI) | 0.50 [0.33, 0.68] |
| 9.1 Mean values | 7 | 890 | Std. Mean Difference (IV, Random, 95% CI) | 0.51 [0.33, 0.69] |
| 9.2 Change scores | 2 | 104 | Std. Mean Difference (IV, Random, 95% CI) | 0.35 [‐0.47, 1.18] |
| 10 Final mean knowledge (diabetes and nutrition knowledge) at up to 3 months | 10 | 936 | Std. Mean Difference (IV, Random, 95% CI) | 0.35 [0.10, 0.59] |
| 10.1 Mean values | 8 | 832 | Std. Mean Difference (IV, Random, 95% CI) | 0.33 [0.07, 0.60] |
| 10.2 Change scores | 2 | 104 | Std. Mean Difference (IV, Random, 95% CI) | 0.32 [‐0.59, 1.24] |
| 11 Mean quality of life at all endpoints | 3 | 224 | Std. Mean Difference (IV, Random, 95% CI) | 0.19 [‐0.08, 0.45] |
| 11.1 Final values | 1 | 120 | Std. Mean Difference (IV, Random, 95% CI) | 0.07 [‐0.29, 0.43] |
| 11.2 Change scores | 2 | 104 | Std. Mean Difference (IV, Random, 95% CI) | 0.33 [‐0.06, 0.72] |
| 12 Final mean knowledge at 1 year | 2 | 328 | Std. Mean Difference (IV, Random, 95% CI) | 0.35 [0.13, 0.57] |
| 13 Final mean knowledge at all points | 14 | 1496 | Mean Difference (IV, Random, 95% CI) | 0.89 [0.39, 1.39] |
| 13.1 Mean values | 12 | 1392 | Mean Difference (IV, Random, 95% CI) | 0.97 [0.33, 1.60] |
| 13.2 Change scores | 2 | 104 | Mean Difference (IV, Random, 95% CI) | 0.94 [‐1.14, 3.02] |
| 14 Final mean self‐efficacy and empowerment (on diet and health beliefs on barriers) at 3 to 4 months | 7 | 720 | Std. Mean Difference (IV, Random, 95% CI) | 0.06 [‐0.14, 0.26] |
| 14.1 Mean values | 6 | 641 | Std. Mean Difference (IV, Random, 95% CI) | 0.01 [‐0.18, 0.19] |
| 14.2 Change scores | 1 | 79 | Std. Mean Difference (IV, Random, 95% CI) | 0.45 [0.01, 0.90] |
| 15 Final mean self‐efficacy and empowerment (on diet, can choose correct food) at 6 months | 4 | 903 | Std. Mean Difference (IV, Random, 95% CI) | 0.49 [0.18, 0.80] |
| 15.1 Final values | 2 | 472 | Std. Mean Difference (IV, Random, 95% CI) | 0.60 [‐0.07, 1.27] |
| 15.2 Change scores | 2 | 431 | Std. Mean Difference (IV, Random, 95% CI) | 0.33 [0.14, 0.52] |
| 16 Final mean on self‐efficacy and empowerment (health belief on barriers) at 1 year | 0 | 0 | Std. Mean Difference (IV, Random, 95% CI) | 0.0 [0.0, 0.0] |
| 17 Self‐reported global health/satisfaction at 6 months | 1 | Std. Mean Difference (IV, Fixed, 95% CI) | Totals not selected | |
| 17.1 Change values | 1 | Std. Mean Difference (IV, Fixed, 95% CI) | 0.0 [0.0, 0.0] | |
| 18 Self‐efficacy at all endpoints | 10 | 1546 | Std. Mean Difference (IV, Random, 95% CI) | 0.18 [‐0.07, 0.43] |
| 18.1 Mean values | 8 | 1115 | Std. Mean Difference (IV, Random, 95% CI) | 0.11 [‐0.21, 0.44] |
| 18.2 Change scores | 2 | 431 | Std. Mean Difference (IV, Random, 95% CI) | 0.32 [0.13, 0.51] |
| 19 Mean total cholesterol at 3 to 4 months | 7 | 967 | Mean Difference (IV, Random, 95% CI) | ‐5.16 [‐11.09, 0.77] |
| 19.1 Final values | 5 | 863 | Mean Difference (IV, Random, 95% CI) | ‐2.99 [‐8.81, 2.82] |
| 19.2 Change scores | 2 | 104 | Mean Difference (IV, Random, 95% CI) | ‐14.15 [‐36.29, 7.98] |
| 20 Mean total cholesterol at up to 6 months (mg/dL) | 7 | 802 | Mean Difference (IV, Random, 95% CI) | ‐4.67 [‐14.69, 5.34] |
| 20.1 Final values | 4 | 594 | Mean Difference (IV, Random, 95% CI) | 1.62 [‐5.43, 8.67] |
| 20.2 Change scores | 3 | 208 | Mean Difference (IV, Random, 95% CI) | ‐11.54 [‐33.25, 10.17] |
| 21 Mean total cholesterol at up to 1 year | 5 | 1019 | Mean Difference (IV, Random, 95% CI) | ‐5.84 [‐13.19, 1.51] |
| 21.1 Final values | 4 | 694 | Mean Difference (IV, Random, 95% CI) | ‐1.89 [‐8.41, 4.64] |
| 21.2 Change value | 1 | 325 | Mean Difference (IV, Random, 95% CI) | ‐15.08 [‐24.82, ‐5.34] |
| 22 Mean total cholesterol at all endpoints | 11 | 1705 | Mean Difference (IV, Random, 95% CI) | ‐6.14 [‐11.45, ‐0.82] |
| 22.1 Final values | 7 | 1172 | Mean Difference (IV, Random, 95% CI) | ‐3.18 [‐8.29, 1.94] |
| 22.2 Change scores | 4 | 533 | Mean Difference (IV, Random, 95% CI) | ‐10.79 [‐23.58, 2.00] |
| 23 Mean LDL at 3 to 4 months | 4 | 440 | Mean Difference (IV, Random, 95% CI) | ‐0.35 [‐6.65, 5.94] |
| 23.1 Final values | 3 | 415 | Mean Difference (IV, Random, 95% CI) | ‐0.73 [‐7.67, 6.21] |
| 23.2 Change scores | 1 | 25 | Mean Difference (IV, Random, 95% CI) | 1.4 [‐13.55, 16.35] |
| 24 Mean LDL at up to 6 months | 5 | 287 | Mean Difference (IV, Random, 95% CI) | ‐4.28 [‐11.13, 2.57] |
| 24.1 Final values | 1 | 52 | Mean Difference (IV, Random, 95% CI) | 7.80 [‐11.20, 26.80] |
| 24.2 Change scores | 4 | 235 | Mean Difference (IV, Random, 95% CI) | ‐6.09 [‐13.43, 1.25] |
| 25 Mean LDL at up to 12 months | 3 | 687 | Mean Difference (IV, Random, 95% CI) | ‐0.13 [‐5.72, 5.45] |
| 26 Mean HDL at 3 to 4 months | 5 | 536 | Mean Difference (IV, Random, 95% CI) | 0.18 [‐1.49, 1.86] |
| 26.1 Final values | 3 | 432 | Mean Difference (IV, Random, 95% CI) | ‐0.32 [‐3.15, 2.50] |
| 26.2 Change scores | 2 | 104 | Mean Difference (IV, Random, 95% CI) | 0.43 [‐2.69, 3.54] |
| 27 Mean HDL at up to 6 months | 5 | 379 | Mean Difference (IV, Random, 95% CI) | ‐0.54 [‐3.82, 2.75] |
| 27.1 Final scores | 2 | 171 | Mean Difference (IV, Random, 95% CI) | ‐0.36 [‐9.27, 8.55] |
| 27.2 Change scores | 3 | 208 | Mean Difference (IV, Random, 95% CI) | ‐0.75 [‐4.52, 3.02] |
| 28 Mean HDL at up to 1 year | 3 | 471 | Mean Difference (IV, Random, 95% CI) | 0.32 [‐1.67, 2.31] |
| 29 Mean triglycerides at 3 to 4 months | 5 | 662 | Mean Difference (IV, Random, 95% CI) | ‐23.98 [‐39.73, ‐8.23] |
| 29.1 Final values | 4 | 637 | Mean Difference (IV, Random, 95% CI) | ‐22.50 [‐41.90, ‐3.11] |
| 29.2 Change scores | 1 | 25 | Mean Difference (IV, Random, 95% CI) | ‐31.70 [‐71.90, 8.50] |
| 30 Mean triglycerides at up to 6 months | 4 | 413 | Mean Difference (IV, Random, 95% CI) | ‐6.38 [‐42.54, 29.79] |
| 30.1 Final values | 2 | 284 | Mean Difference (IV, Random, 95% CI) | ‐31.26 [‐63.12, 0.59] |
| 30.2 Change scores | 2 | 129 | Mean Difference (IV, Random, 95% CI) | 16.47 [‐39.98, 72.91] |
| 31 Mean triglycerides at up to 1 year | 3 | 584 | Mean Difference (IV, Random, 95% CI) | ‐5.55 [‐25.53, 14.42] |
| 32 Mean BMI at up to 3 months | 5 | 397 | Mean Difference (IV, Random, 95% CI) | ‐0.01 [‐0.46, 0.44] |
| 32.1 Final values | 3 | 293 | Mean Difference (IV, Random, 95% CI) | ‐0.88 [‐2.27, 0.51] |
| 32.2 Change scores | 2 | 104 | Mean Difference (IV, Random, 95% CI) | 0.09 [‐0.39, 0.57] |
| 33 Mean BMI at up to 6 months | 8 | 754 | Mean Difference (IV, Random, 95% CI) | ‐0.31 [‐0.71, 0.09] |
| 33.1 Final values | 3 | 429 | Mean Difference (IV, Random, 95% CI) | ‐1.34 [‐2.54, ‐0.14] |
| 33.2 Change scores | 5 | 325 | Mean Difference (IV, Random, 95% CI) | ‐0.23 [‐0.56, 0.10] |
| 34 Mean BMI at up to 12 months | 2 | 358 | Mean Difference (IV, Random, 95% CI) | ‐0.38 [‐1.70, 0.95] |
| 35 Mean BMI at all endpoints | 9 | 763 | Mean Difference (IV, Random, 95% CI) | ‐0.31 [‐0.65, 0.03] |
| 35.1 Final values | 4 | 438 | Mean Difference (IV, Random, 95% CI) | ‐1.25 [‐2.39, ‐0.11] |
| 35.2 Change scores | 5 | 325 | Mean Difference (IV, Random, 95% CI) | ‐0.23 [‐0.56, 0.10] |
| 36 Mean systolic blood pressure at 3 to 4 months | 8 | 832 | Mean Difference (IV, Random, 95% CI) | ‐0.46 [‐2.95, 2.03] |
| 36.1 Final values | 6 | 728 | Mean Difference (IV, Random, 95% CI) | ‐0.92 [‐3.74, 1.89] |
| 36.2 Change scores | 2 | 104 | Mean Difference (IV, Random, 95% CI) | 1.64 [‐4.12, 7.41] |
| 37 Mean systolic blood pressure at up to 6 months | 7 | 555 | Mean Difference (IV, Random, 95% CI) | 1.74 [‐0.06, 3.54] |
| 37.1 Final values | 2 | 228 | Mean Difference (IV, Random, 95% CI) | 1.88 [‐0.46, 4.21] |
| 37.2 Change scores | 5 | 327 | Mean Difference (IV, Random, 95% CI) | 1.54 [‐1.30, 4.37] |
| 38 Mean systolic blood pressure at up to 1 year | 5 | 1209 | Mean Difference (IV, Random, 95% CI) | 1.43 [‐0.96, 3.81] |
| 38.1 Final values | 4 | 884 | Mean Difference (IV, Random, 95% CI) | 0.66 [‐1.65, 2.97] |
| 38.2 Change scores | 1 | 325 | Mean Difference (IV, Random, 95% CI) | 4.58 [0.36, 8.80] |
| 39 Mean systolic blood pressure at all endpoints | 14 | 1896 | Mean Difference (IV, Random, 95% CI) | 1.68 [0.35, 3.02] |
| 39.1 Final values | 8 | 1244 | Mean Difference (IV, Random, 95% CI) | 1.28 [‐0.46, 3.02] |
| 39.2 Change scores | 6 | 652 | Mean Difference (IV, Random, 95% CI) | 2.36 [0.06, 4.66] |
| 40 Mean diastolic blood pressure at 3 to 4 months | 8 | 830 | Mean Difference (IV, Random, 95% CI) | ‐1.19 [‐2.58, 0.20] |
| 40.1 Final values | 6 | 726 | Mean Difference (IV, Random, 95% CI) | ‐1.11 [‐2.67, 0.45] |
| 40.2 Change scores | 2 | 104 | Mean Difference (IV, Random, 95% CI) | ‐1.54 [‐5.10, 2.01] |
| 41 Mean diastolic blood pressure at up to 6 months | 7 | 555 | Mean Difference (IV, Random, 95% CI) | 1.95 [0.62, 3.28] |
| 41.1 Final values | 2 | 228 | Mean Difference (IV, Random, 95% CI) | 1.73 [‐1.93, 5.38] |
| 41.2 Change scores | 5 | 327 | Mean Difference (IV, Random, 95% CI) | 1.14 [‐0.92, 3.20] |
| 42 Mean diastolic blood pressure at up to 1 year (mm Hg) | 4 | 886 | Mean Difference (IV, Random, 95% CI) | 0.06 [‐2.82, 2.93] |
| 42.1 Final values | 3 | 525 | Mean Difference (IV, Random, 95% CI) | ‐0.97 [‐3.91, 1.96] |
| 42.2 Change scores | 1 | 361 | Mean Difference (IV, Random, 95% CI) | 2.86 [0.74, 4.98] |
| 43 Mean diastolic blood pressure at all endpoints | 13 | 1578 | Mean Difference (IV, Random, 95% CI) | 0.38 [‐0.92, 1.68] |
| 43.1 Final values | 7 | 890 | Mean Difference (IV, Random, 95% CI) | ‐0.38 [‐2.12, 1.36] |
| 43.2 Change scores | 6 | 688 | Mean Difference (IV, Random, 95% CI) | 1.63 [0.16, 3.11] |
| 44 Emergency visits (in past 6 months) at 6 months | 1 | Mean Difference (IV, Fixed, 95% CI) | Totals not selected | |
| 44.1 Change values | 1 | Mean Difference (IV, Fixed, 95% CI) | 0.0 [0.0, 0.0] | |
| 45 Emergency visits in past 6 months (numbers) | 1 | Odds Ratio (M‐H, Fixed, 95% CI) | Totals not selected | |
| 46 Acute hospital admissions at 24 months | 1 | Odds Ratio (M‐H, Fixed, 95% CI) | Subtotals only |
1.2. Analysis.
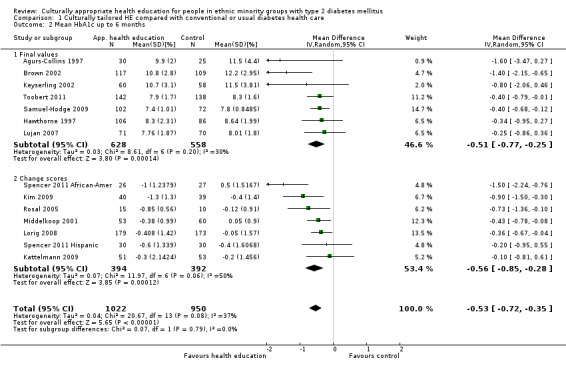
Comparison 1 Culturally tailored HE compared with conventional or usual diabetes health care, Outcome 2 Mean HbA1c up to 6 months.
1.3. Analysis.
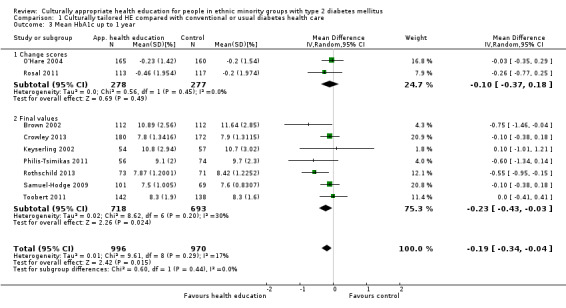
Comparison 1 Culturally tailored HE compared with conventional or usual diabetes health care, Outcome 3 Mean HbA1c up to 1 year.
1.4. Analysis.
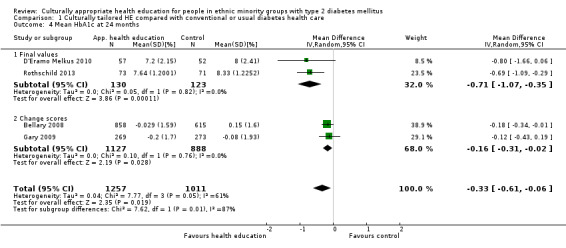
Comparison 1 Culturally tailored HE compared with conventional or usual diabetes health care, Outcome 4 Mean HbA1c at 24 months.
1.7. Analysis.
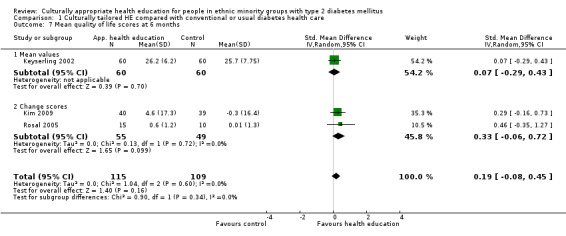
Comparison 1 Culturally tailored HE compared with conventional or usual diabetes health care, Outcome 7 Mean quality of life scores at 6 months.
1.8. Analysis.
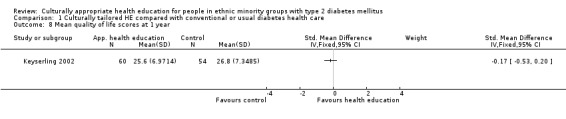
Comparison 1 Culturally tailored HE compared with conventional or usual diabetes health care, Outcome 8 Mean quality of life scores at 1 year.
1.9. Analysis.
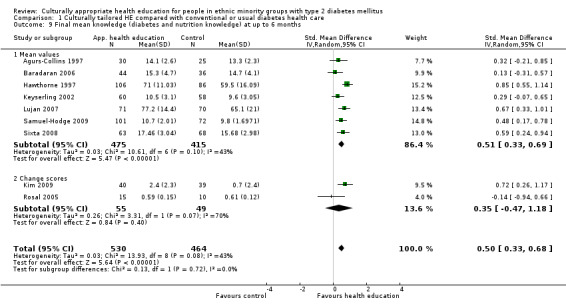
Comparison 1 Culturally tailored HE compared with conventional or usual diabetes health care, Outcome 9 Final mean knowledge (diabetes and nutrition knowledge) at up to 6 months.
1.12. Analysis.
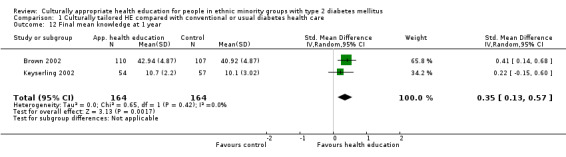
Comparison 1 Culturally tailored HE compared with conventional or usual diabetes health care, Outcome 12 Final mean knowledge at 1 year.
1.15. Analysis.
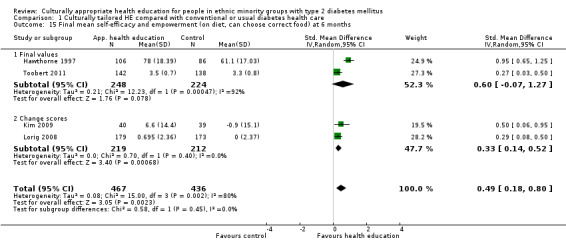
Comparison 1 Culturally tailored HE compared with conventional or usual diabetes health care, Outcome 15 Final mean self‐efficacy and empowerment (on diet, can choose correct food) at 6 months.
1.17. Analysis.
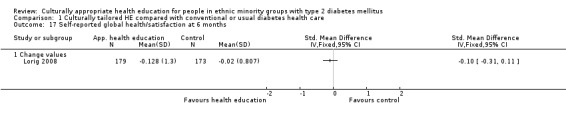
Comparison 1 Culturally tailored HE compared with conventional or usual diabetes health care, Outcome 17 Self‐reported global health/satisfaction at 6 months.
1.20. Analysis.
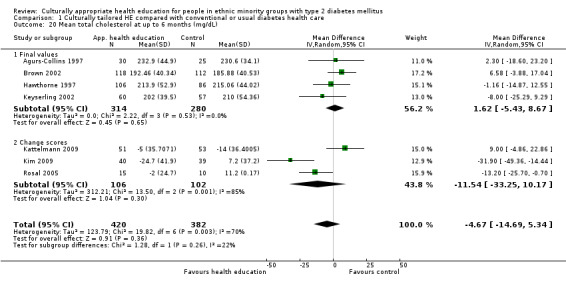
Comparison 1 Culturally tailored HE compared with conventional or usual diabetes health care, Outcome 20 Mean total cholesterol at up to 6 months (mg/dL).
1.21. Analysis.
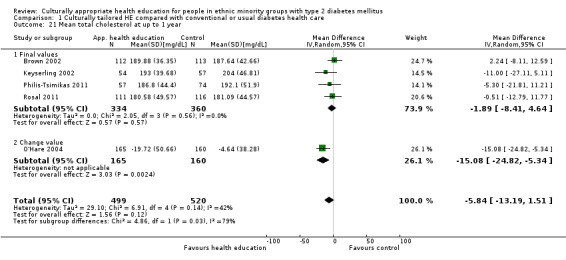
Comparison 1 Culturally tailored HE compared with conventional or usual diabetes health care, Outcome 21 Mean total cholesterol at up to 1 year.
1.22. Analysis.
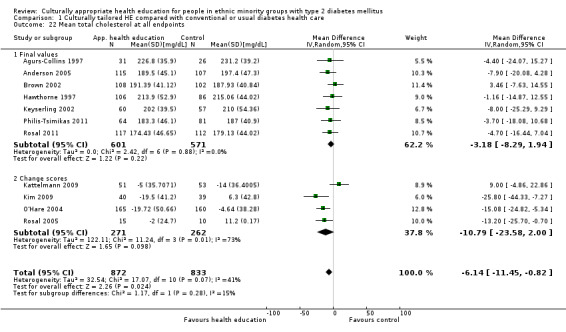
Comparison 1 Culturally tailored HE compared with conventional or usual diabetes health care, Outcome 22 Mean total cholesterol at all endpoints.
1.23. Analysis.
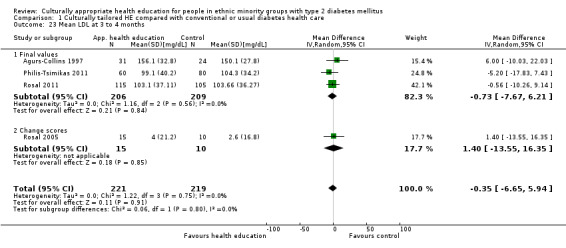
Comparison 1 Culturally tailored HE compared with conventional or usual diabetes health care, Outcome 23 Mean LDL at 3 to 4 months.
1.24. Analysis.
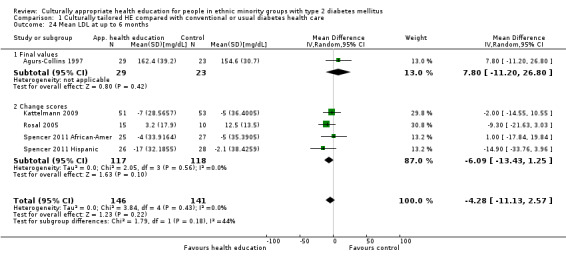
Comparison 1 Culturally tailored HE compared with conventional or usual diabetes health care, Outcome 24 Mean LDL at up to 6 months.
1.25. Analysis.
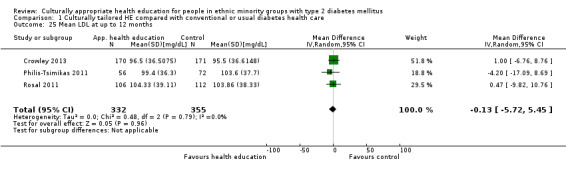
Comparison 1 Culturally tailored HE compared with conventional or usual diabetes health care, Outcome 25 Mean LDL at up to 12 months.
1.26. Analysis.
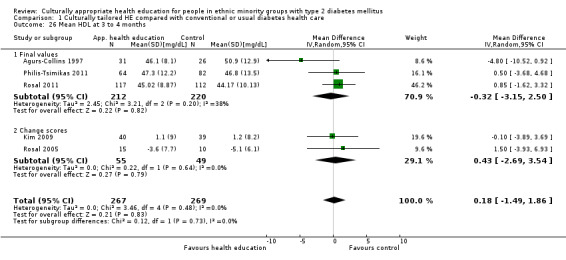
Comparison 1 Culturally tailored HE compared with conventional or usual diabetes health care, Outcome 26 Mean HDL at 3 to 4 months.
1.27. Analysis.
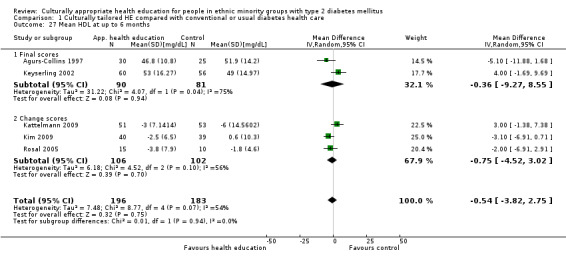
Comparison 1 Culturally tailored HE compared with conventional or usual diabetes health care, Outcome 27 Mean HDL at up to 6 months.
1.30. Analysis.
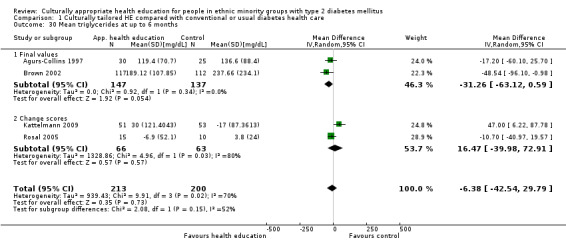
Comparison 1 Culturally tailored HE compared with conventional or usual diabetes health care, Outcome 30 Mean triglycerides at up to 6 months.
1.33. Analysis.
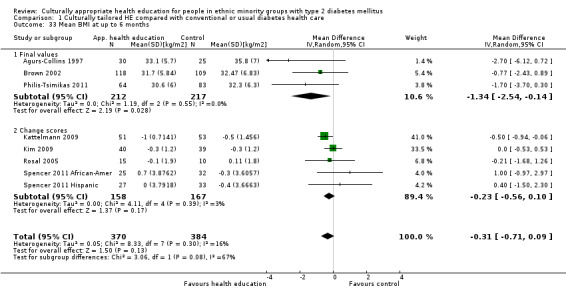
Comparison 1 Culturally tailored HE compared with conventional or usual diabetes health care, Outcome 33 Mean BMI at up to 6 months.
1.34. Analysis.
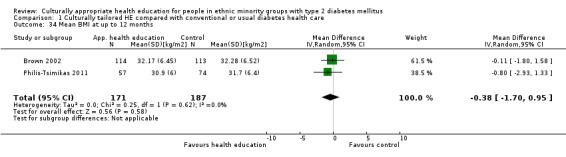
Comparison 1 Culturally tailored HE compared with conventional or usual diabetes health care, Outcome 34 Mean BMI at up to 12 months.
1.37. Analysis.
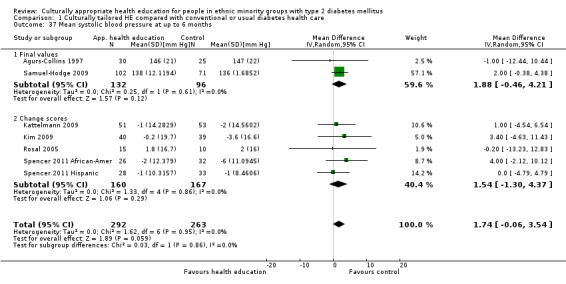
Comparison 1 Culturally tailored HE compared with conventional or usual diabetes health care, Outcome 37 Mean systolic blood pressure at up to 6 months.
1.38. Analysis.
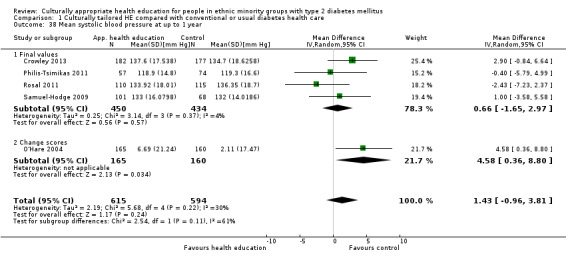
Comparison 1 Culturally tailored HE compared with conventional or usual diabetes health care, Outcome 38 Mean systolic blood pressure at up to 1 year.
1.41. Analysis.
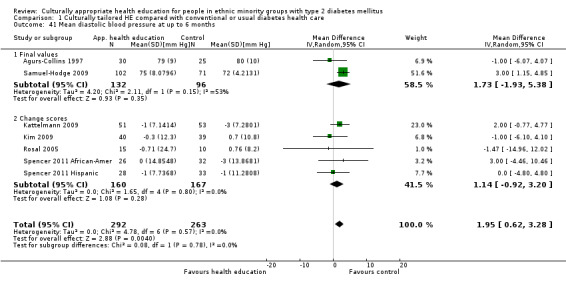
Comparison 1 Culturally tailored HE compared with conventional or usual diabetes health care, Outcome 41 Mean diastolic blood pressure at up to 6 months.
1.42. Analysis.
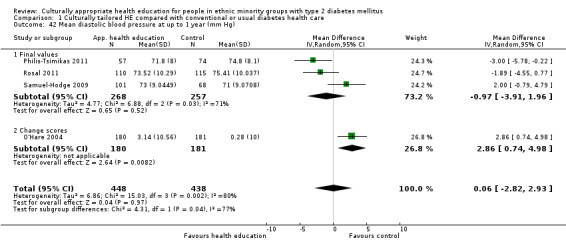
Comparison 1 Culturally tailored HE compared with conventional or usual diabetes health care, Outcome 42 Mean diastolic blood pressure at up to 1 year (mm Hg).
Comparison 2. Sensitivity analysis.
| Outcome or subgroup title | No. of studies | No. of participants | Statistical method | Effect size |
|---|---|---|---|---|
| 1 Mean HbA1c at 3 months excluding studies with randomisation bias | 13 | 1384 | Mean Difference (IV, Fixed, 95% CI) | ‐0.34 [‐0.52, ‐0.16] |
| 1.1 Final values | 10 | 1050 | Mean Difference (IV, Fixed, 95% CI) | ‐0.14 [‐0.37, 0.09] |
| 1.2 Change scores | 3 | 334 | Mean Difference (IV, Fixed, 95% CI) | ‐0.70 [‐1.01, ‐0.39] |
| 2 Mean HbA1c at 3 months: excluding studies with non‐standard time frames | 13 | 1217 | Mean Difference (IV, Fixed, 95% CI) | ‐0.43 [‐0.62, ‐0.24] |
| 2.1 Final values | 10 | 883 | Mean Difference (IV, Fixed, 95% CI) | ‐0.26 [‐0.50, ‐0.01] |
| 2.2 Change scores | 3 | 334 | Mean Difference (IV, Fixed, 95% CI) | ‐0.70 [‐1.01, ‐0.39] |
| 3 Mean HbA1c at up to 6 months: excluding studies with randomisation bias | 12 | 1743 | Mean Difference (IV, Random, 95% CI) | ‐0.55 [‐0.76, ‐0.34] |
| 3.1 Final values | 5 | 957 | Mean Difference (IV, Random, 95% CI) | ‐0.55 [‐0.93, ‐0.18] |
| 3.2 Change scores | 7 | 786 | Mean Difference (IV, Random, 95% CI) | ‐0.56 [‐0.85, ‐0.28] |
| 4 Mean HbA1c at up to 6 months: excluding studies with non‐standard time frames | 11 | 1664 | Mean Difference (IV, Random, 95% CI) | ‐0.52 [‐0.74, ‐0.30] |
| 4.1 Final values | 5 | 957 | Mean Difference (IV, Random, 95% CI) | ‐0.55 [‐0.93, ‐0.18] |
| 4.2 Change scores | 6 | 707 | Mean Difference (IV, Random, 95% CI) | ‐0.51 [‐0.82, ‐0.20] |
| 5 Mean HbA1c at up to 6 months: excluding studies with inadequate description of allocation concealment | 3 | 484 | Mean Difference (IV, Random, 95% CI) | ‐0.41 [‐0.65, ‐0.16] |
| 5.1 Final values | 3 | 484 | Mean Difference (IV, Random, 95% CI) | ‐0.41 [‐0.65, ‐0.16] |
| 6 Mean HbA1c at up to 1 year: excluding studies with randomisation bias | 7 | 1471 | Mean Difference (IV, Random, 95% CI) | ‐0.27 [‐0.48, ‐0.06] |
| 6.1 Final values | 6 | 1241 | Mean Difference (IV, Random, 95% CI) | ‐0.29 [‐0.54, ‐0.03] |
| 6.2 Change scores | 1 | 230 | Mean Difference (IV, Random, 95% CI) | ‐0.26 [‐0.77, 0.25] |
| 7 Mean HbA1c at up to 1 year: excluding studies with inadequate description of allocation concealment | 3 | 633 | Mean Difference (IV, Random, 95% CI) | ‐0.09 [‐0.29, 0.10] |
| 7.1 Final values | 3 | 633 | Mean Difference (IV, Random, 95% CI) | ‐0.09 [‐0.29, 0.10] |
| 8 Mean HbA1c at 24 months: excluding studies with complex interventions: Gary 2009 | 3 | 1726 | Mean Difference (IV, Random, 95% CI) | ‐0.47 [‐0.91, ‐0.03] |
| 8.1 Final values | 2 | 253 | Mean Difference (IV, Random, 95% CI) | ‐0.71 [‐1.07, ‐0.35] |
| 8.2 Change scores | 1 | 1473 | Mean Difference (IV, Random, 95% CI) | ‐0.18 [‐0.34, ‐0.01] |
| 9 Mean HbA1c at 24 months: excluding studies with randomisation bias | 3 | 795 | Mean Difference (IV, Random, 95% CI) | ‐0.47 [‐0.93, ‐0.00] |
| 9.1 Final values | 2 | 253 | Mean Difference (IV, Random, 95% CI) | ‐0.71 [‐1.07, ‐0.35] |
| 9.2 Change scores | 1 | 542 | Mean Difference (IV, Random, 95% CI) | ‐0.12 [‐0.43, 0.19] |
| 10 Mean HbA1c at 24 months: excluding studies with inadequate description of allocation concealment | 1 | 542 | Mean Difference (IV, Random, 95% CI) | ‐0.12 [‐0.43, 0.19] |
| 10.1 Change scores | 1 | 542 | Mean Difference (IV, Random, 95% CI) | ‐0.12 [‐0.43, 0.19] |
| 11 Final mean knowledge at 3 months: excluding studies with no valid tool/scale direction | 8 | 686 | Std. Mean Difference (IV, Random, 95% CI) | 0.23 [‐0.03, 0.49] |
| 11.1 Mean values | 6 | 582 | Std. Mean Difference (IV, Random, 95% CI) | 0.19 [‐0.09, 0.47] |
| 11.2 Change scores | 2 | 104 | Std. Mean Difference (IV, Random, 95% CI) | 0.32 [‐0.59, 1.24] |
| 12 Final mean knowledge at up to 3 months: excluding studies with randomisation bias | 9 | 878 | Std. Mean Difference (IV, Random, 95% CI) | 0.31 [0.05, 0.56] |
| 12.1 Mean values | 7 | 774 | Std. Mean Difference (IV, Random, 95% CI) | 0.28 [‐0.01, 0.57] |
| 12.2 Change scores | 2 | 104 | Std. Mean Difference (IV, Random, 95% CI) | 0.32 [‐0.59, 1.24] |
| 13 Final mean knowledge at 3 months: excluding studies with non‐standard time frames | 9 | 744 | Std. Mean Difference (IV, Random, 95% CI) | 0.28 [0.04, 0.53] |
| 13.1 Mean values | 7 | 640 | Std. Mean Difference (IV, Random, 95% CI) | 0.26 [‐0.01, 0.52] |
| 13.2 Change scores | 2 | 104 | Std. Mean Difference (IV, Random, 95% CI) | 0.32 [‐0.59, 1.24] |
| 14 Final mean knowledge at 3 months: excluding change scores | 8 | 832 | Std. Mean Difference (IV, Random, 95% CI) | 0.33 [0.07, 0.60] |
| 14.1 Mean values | 8 | 832 | Std. Mean Difference (IV, Random, 95% CI) | 0.33 [0.07, 0.60] |
| 15 Final mean knowledge at up to 6 months with non‐standard time frames | 8 | 821 | Std. Mean Difference (IV, Random, 95% CI) | 0.50 [0.29, 0.70] |
| 15.1 Mean values | 6 | 717 | Std. Mean Difference (IV, Random, 95% CI) | 0.51 [0.29, 0.73] |
| 15.2 Change scores | 2 | 104 | Std. Mean Difference (IV, Random, 95% CI) | 0.35 [‐0.47, 1.18] |
| 16 Final mean knowledge at up to 6 months: excluding studies with randomisation bias | 7 | 766 | Std. Mean Difference (IV, Random, 95% CI) | 0.51 [0.29, 0.74] |
| 16.1 Mean values | 5 | 662 | Std. Mean Difference (IV, Random, 95% CI) | 0.53 [0.28, 0.78] |
| 16.2 Change scores | 2 | 104 | Std. Mean Difference (IV, Random, 95% CI) | 0.35 [‐0.47, 1.18] |
| 17 Final mean knowledge at 6 months: excluding studies with no valid tool/scale direct | 6 | 741 | Std. Mean Difference (IV, Random, 95% CI) | 0.62 [0.44, 0.80] |
| 17.1 Mean values | 4 | 637 | Std. Mean Difference (IV, Random, 95% CI) | 0.65 [0.49, 0.81] |
| 17.2 Change scores | 2 | 104 | Std. Mean Difference (IV, Random, 95% CI) | 0.35 [‐0.47, 1.18] |
| 18 Final mean knowledge at 6 months: excluding studies with inadequate description of allocation concealment | 3 | 483 | Std. Mean Difference (IV, Random, 95% CI) | 0.55 [0.23, 0.87] |
| 18.1 Mean values | 3 | 483 | Std. Mean Difference (IV, Random, 95% CI) | 0.55 [0.23, 0.87] |
| 19 Final mean knowledge at 6 months: excluding change scores | 7 | 890 | Std. Mean Difference (IV, Random, 95% CI) | 0.51 [0.33, 0.69] |
| 19.1 Mean values | 7 | 890 | Std. Mean Difference (IV, Random, 95% CI) | 0.51 [0.33, 0.69] |
| 20 Final mean knowledge at 1 year: excluding studies with no valid tool/scale direct | 1 | 111 | Std. Mean Difference (IV, Random, 95% CI) | 0.22 [‐0.15, 0.60] |
| 21 Mean BMI at up to 6 months (kg/m2): excluding studies with non‐standard time frames | 7 | 675 | Mean Difference (IV, Random, 95% CI) | ‐0.47 [‐0.91, ‐0.02] |
| 21.1 Final values | 3 | 429 | Mean Difference (IV, Random, 95% CI) | ‐1.34 [‐2.54, ‐0.14] |
| 21.2 Change scores | 4 | 246 | Mean Difference (IV, Random, 95% CI) | ‐0.38 [‐0.78, 0.03] |
| 22 Mean diastolic BP at 3 months (mm Hg): excluding non‐standard time frames | 7 | 610 | Mean Difference (IV, Random, 95% CI) | ‐1.64 [‐3.15, ‐0.14] |
| 22.1 Final values | 5 | 506 | Mean Difference (IV, Random, 95% CI) | ‐1.67 [‐3.33, ‐0.01] |
| 22.2 Change scores | 2 | 104 | Mean Difference (IV, Random, 95% CI) | ‐1.54 [‐5.10, 2.01] |
| 23 Mean triglycerides at 3 to 4 months (mg/dL) with randomisation bias | 4 | 605 | Mean Difference (IV, Random, 95% CI) | ‐22.93 [‐40.47, ‐5.39] |
| 23.1 Final values | 3 | 580 | Mean Difference (IV, Random, 95% CI) | ‐20.76 [‐43.43, 1.91] |
| 23.2 Change scores | 1 | 25 | Mean Difference (IV, Random, 95% CI) | ‐31.70 [‐71.90, 8.50] |
2.11. Analysis.
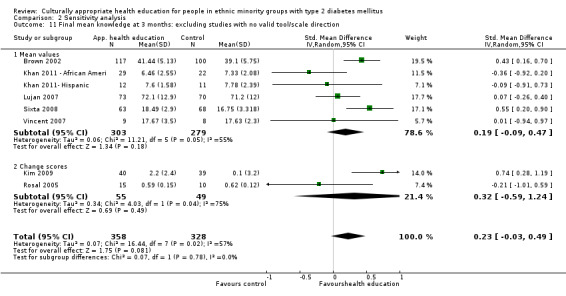
Comparison 2 Sensitivity analysis, Outcome 11 Final mean knowledge at 3 months: excluding studies with no valid tool/scale direction.
2.13. Analysis.
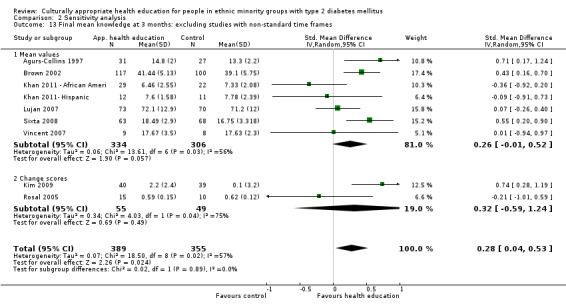
Comparison 2 Sensitivity analysis, Outcome 13 Final mean knowledge at 3 months: excluding studies with non‐standard time frames.
2.18. Analysis.
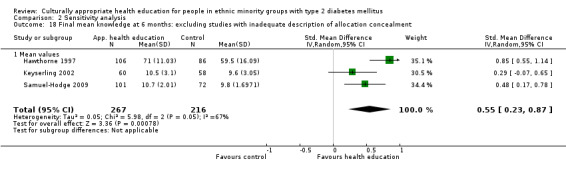
Comparison 2 Sensitivity analysis, Outcome 18 Final mean knowledge at 6 months: excluding studies with inadequate description of allocation concealment.
Comparison 3. Subgroup analysis for studies involving Hispanic individuals in culturally sensitive HE vs usual care.
| Outcome or subgroup title | No. of studies | No. of participants | Statistical method | Effect size |
|---|---|---|---|---|
| 1 Mean HbA1c at 3 to 4 months | 8 | 881 | Mean Difference (IV, Random, 95% CI) | ‐0.33 [‐0.56, ‐0.11] |
| 1.1 Final values | 6 | 626 | Mean Difference (IV, Random, 95% CI) | ‐0.18 [‐0.47, 0.12] |
| 1.2 Change scores | 2 | 255 | Mean Difference (IV, Random, 95% CI) | ‐0.54 [‐0.89, ‐0.20] |
| 2 Mean HbA1c at up to 6 months | 6 | 1084 | Mean Difference (IV, Random, 95% CI) | ‐0.49 [‐0.77, ‐0.22] |
| 2.1 Final values | 3 | 647 | Mean Difference (IV, Random, 95% CI) | ‐0.62 [‐1.21, ‐0.04] |
| 2.2 Change scores | 3 | 437 | Mean Difference (IV, Random, 95% CI) | ‐0.40 [‐0.67, ‐0.14] |
| 3 Mean HbA1c at 12 months | 4 | 728 | Mean Difference (IV, Random, 95% CI) | ‐0.50 [‐0.77, ‐0.24] |
| 4 Mean HbA1c at 24 months | 1 | Mean Difference (IV, Fixed, 95% CI) | Totals not selected | |
| 5 Mean BMI at up to 3 months (kg/m2) | 3 | 261 | Mean Difference (IV, Random, 95% CI) | ‐0.48 [‐1.70, 0.74] |
| 5.1 Final values | 2 | 236 | Mean Difference (IV, Random, 95% CI) | ‐0.70 [‐2.22, 0.83] |
| 5.2 Change scores | 1 | 25 | Mean Difference (IV, Random, 95% CI) | ‐0.08 [‐2.13, 1.97] |
| 6 Mean BMI at up to 6 months (kg/m2) | 4 | 459 | Mean Difference (IV, Random, 95% CI) | ‐0.51 [‐1.37, 0.35] |
| 6.1 Final values | 2 | 374 | Mean Difference (IV, Random, 95% CI) | ‐1.15 [‐2.43, 0.13] |
| 6.2 Change scores | 2 | 85 | Mean Difference (IV, Random, 95% CI) | 0.02 [‐1.15, 1.18] |
| 7 Mean BMI at up to 12 months (kg/m2) | 2 | 358 | Mean Difference (IV, Random, 95% CI) | ‐0.38 [‐1.70, 0.95] |
| 8 Mean total cholesterol at 3 to 4 months (mg/dL) | 4 | 609 | Mean Difference (IV, Random, 95% CI) | ‐1.48 [‐7.97, 5.01] |
| 8.1 Final values | 3 | 584 | Mean Difference (IV, Random, 95% CI) | ‐1.18 [‐8.21, 5.85] |
| 8.2 Change scores | 1 | 25 | Mean Difference (IV, Random, 95% CI) | ‐3.2 [‐20.03, 13.63] |
| 9 Mean total cholesterol at up to 6 months (mg/dL) | 2 | 255 | Mean Difference (IV, Random, 95% CI) | ‐3.00 [‐22.38, 16.37] |
| 9.1 Final values | 1 | 230 | Mean Difference (IV, Random, 95% CI) | 6.58 [‐3.88, 17.04] |
| 9.2 Change scores | 1 | 25 | Mean Difference (IV, Random, 95% CI) | ‐13.2 [‐25.70, ‐0.70] |
| 10 Mean total cholesterol at up to 12 months (mg/dL) | 3 | 583 | Mean Difference (IV, Random, 95% CI) | ‐0.10 [‐7.24, 7.04] |
| 10.1 Final values | 3 | 583 | Mean Difference (IV, Random, 95% CI) | ‐0.10 [‐7.24, 7.04] |
| 11 Mean triglycerides at 3 to 4 months (mg/dL) | 4 | 605 | Mean Difference (IV, Random, 95% CI) | ‐22.93 [‐40.47, ‐5.39] |
| 11.1 Final values | 3 | 580 | Mean Difference (IV, Random, 95% CI) | ‐20.76 [‐43.43, 1.91] |
| 11.2 Change scores | 1 | 25 | Mean Difference (IV, Random, 95% CI) | ‐31.70 [‐71.90, 8.50] |
| 12 Mean triglycerides at up to 6 months (mg/dL) | 2 | 254 | Mean Difference (IV, Random, 95% CI) | ‐24.99 [‐60.95, 10.96] |
| 12.1 Final values | 1 | 229 | Mean Difference (IV, Random, 95% CI) | ‐48.54 [‐96.10, ‐0.98] |
| 12.2 Change scores | 1 | 25 | Mean Difference (IV, Random, 95% CI) | ‐10.7 [‐40.97, 19.57] |
| 13 Mean triglycerides at up to 1 year (mg/dL) | 3 | 584 | Mean Difference (IV, Random, 95% CI) | ‐5.55 [‐25.53, 14.42] |
| 14 Mean LDL at 3 to 4 months (mg/dL) | 2 | 360 | Mean Difference (IV, Random, 95% CI) | ‐2.28 [‐9.98, 5.41] |
| 14.1 Final values | 2 | 360 | Mean Difference (IV, Random, 95% CI) | ‐2.28 [‐9.98, 5.41] |
| 15 Mean LDL at up to 6 months (mg/dL) | 1 | 54 | Mean Difference (IV, Random, 95% CI) | ‐14.9 [‐33.76, 3.96] |
| 15.1 Change scores | 1 | 54 | Mean Difference (IV, Random, 95% CI) | ‐14.9 [‐33.76, 3.96] |
| 16 Mean LDL at up to 12 months (mg/dL) | 2 | 346 | Mean Difference (IV, Random, 95% CI) | ‐1.35 [‐9.39, 6.69] |
| 16.1 Final values | 2 | 346 | Mean Difference (IV, Random, 95% CI) | ‐1.35 [‐9.39, 6.69] |
| 17 Mean HDL at 3 to 4 months (mg/dL) | 2 | 375 | Mean Difference (IV, Random, 95% CI) | 0.76 [‐1.37, 2.89] |
| 17.1 Final values | 2 | 375 | Mean Difference (IV, Random, 95% CI) | 0.76 [‐1.37, 2.89] |
| 18 Mean HDL at up to 1 year (mg/dL) | 2 | 360 | Mean Difference (IV, Random, 95% CI) | 0.22 [‐1.90, 2.35] |
| 19 Mean systolic blood pressure at 3 to 4 months (mm Hg) | 4 | 422 | Mean Difference (IV, Random, 95% CI) | ‐2.15 [‐5.37, 1.08] |
| 19.1 Final values | 3 | 397 | Mean Difference (IV, Random, 95% CI) | ‐2.75 [‐6.13, 0.63] |
| 19.2 Change scores | 1 | 25 | Mean Difference (IV, Random, 95% CI) | 4.0 [‐6.77, 14.77] |
| 20 Mean systolic blood pressure at up to 6 months (mm Hg) | 2 | 86 | Mean Difference (IV, Random, 95% CI) | ‐0.02 [‐4.52, 4.47] |
| 20.1 Change scores | 2 | 86 | Mean Difference (IV, Random, 95% CI) | ‐0.02 [‐4.52, 4.47] |
| 21 Mean systolic blood pressure at up to 1 year (mm Hg) | 2 | 356 | Mean Difference (IV, Random, 95% CI) | ‐1.53 [‐5.12, 2.05] |
| 22 Mean diastolic blood pressure at 3 to 4 months | 4 | 422 | Mean Difference (IV, Random, 95% CI) | ‐2.09 [‐3.88, ‐0.29] |
| 22.1 Final values | 3 | 397 | Mean Difference (IV, Random, 95% CI) | ‐2.03 [‐3.89, ‐0.18] |
| 22.2 Change scores | 1 | 25 | Mean Difference (IV, Random, 95% CI) | ‐2.87 [‐9.97, 4.23] |
| 23 Mean diastolic blood pressure at up to 6 months (mm Hg) | 2 | 86 | Mean Difference (IV, Random, 95% CI) | ‐0.17 [‐4.69, 4.36] |
| 23.1 Change scores | 2 | 86 | Mean Difference (IV, Random, 95% CI) | ‐0.17 [‐4.69, 4.36] |
| 24 Mean diastolic blood pressure at up to 1 year (mm Hg) | 2 | 356 | Mean Difference (IV, Random, 95% CI) | ‐2.42 [‐4.34, ‐0.50] |
| 25 Final mean knowledge at up to 3 months | 6 | 556 | Std. Mean Difference (IV, Random, 95% CI) | 0.26 [0.03, 0.49] |
| 25.1 Final values | 5 | 531 | Std. Mean Difference (IV, Random, 95% CI) | 0.30 [0.08, 0.53] |
| 25.2 Change scores | 1 | 25 | Std. Mean Difference (IV, Random, 95% CI) | ‐0.21 [‐1.01, 0.59] |
| 26 Diabetes knowledge at 6 months | 3 | 297 | Mean Difference (IV, Random, 95% CI) | 2.24 [‐0.22, 4.70] |
| 26.1 Final values | 2 | 272 | Mean Difference (IV, Random, 95% CI) | 6.51 [‐3.57, 16.58] |
| 26.2 Change scores | 1 | 25 | Mean Difference (IV, Random, 95% CI) | ‐0.02 [‐0.13, 0.09] |
| 27 Final mean knowledge at 1 year | 1 | 217 | Std. Mean Difference (IV, Random, 95% CI) | 0.41 [0.14, 0.68] |
| 28 Final mean self‐efficacy and empowerment [on diet and health beliefs on barriers] at 3 to 4 months | 2 | 40 | Std. Mean Difference (IV, Random, 95% CI) | ‐0.10 [‐0.73, 0.52] |
| 28.1 Mean values | 2 | 40 | Std. Mean Difference (IV, Random, 95% CI) | ‐0.10 [‐0.73, 0.52] |
| 28.2 Change scores | 0 | 0 | Std. Mean Difference (IV, Random, 95% CI) | 0.0 [0.0, 0.0] |
| 29 Mean quality of life measures at 3 to 4 months | 1 | 25 | Mean Difference (IV, Random, 95% CI) | 0.44 [‐0.23, 1.11] |
| 29.1 Final values | 0 | 0 | Mean Difference (IV, Random, 95% CI) | 0.0 [0.0, 0.0] |
| 29.2 Change scores | 1 | 25 | Mean Difference (IV, Random, 95% CI) | 0.44 [‐0.23, 1.11] |
| 30 Mean quality of life scores at 6 months | 1 | 25 | Mean Difference (IV, Random, 95% CI) | 0.59 [‐0.42, 1.60] |
| 30.1 Mean values | 0 | 0 | Mean Difference (IV, Random, 95% CI) | 0.0 [0.0, 0.0] |
| 30.2 Change scores | 1 | 25 | Mean Difference (IV, Random, 95% CI) | 0.59 [‐0.42, 1.60] |
| 31 Emergency visits at 6 months | 1 | 352 | Mean Difference (IV, Random, 95% CI) | ‐0.03 [‐0.21, 0.16] |
| 31.1 Change values | 1 | 352 | Mean Difference (IV, Random, 95% CI) | ‐0.03 [‐0.21, 0.16] |
3.2. Analysis.
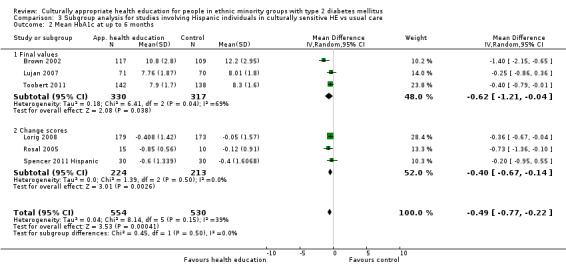
Comparison 3 Subgroup analysis for studies involving Hispanic individuals in culturally sensitive HE vs usual care, Outcome 2 Mean HbA1c at up to 6 months.
3.3. Analysis.
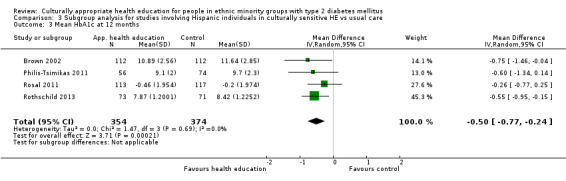
Comparison 3 Subgroup analysis for studies involving Hispanic individuals in culturally sensitive HE vs usual care, Outcome 3 Mean HbA1c at 12 months.
3.4. Analysis.
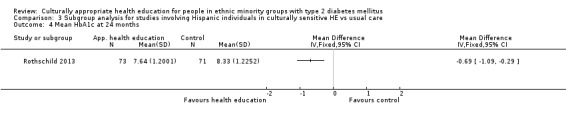
Comparison 3 Subgroup analysis for studies involving Hispanic individuals in culturally sensitive HE vs usual care, Outcome 4 Mean HbA1c at 24 months.
3.5. Analysis.
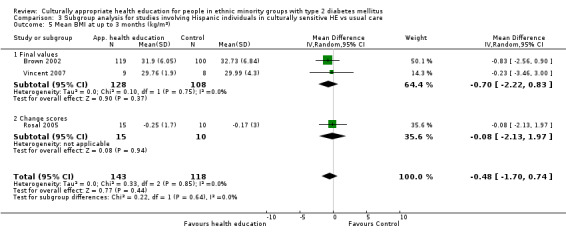
Comparison 3 Subgroup analysis for studies involving Hispanic individuals in culturally sensitive HE vs usual care, Outcome 5 Mean BMI at up to 3 months (kg/m2).
3.6. Analysis.
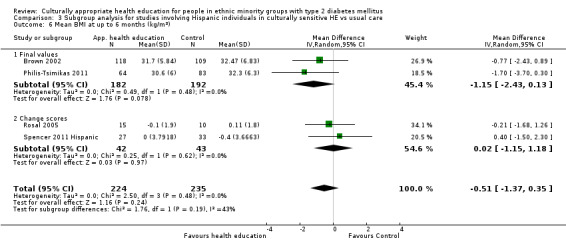
Comparison 3 Subgroup analysis for studies involving Hispanic individuals in culturally sensitive HE vs usual care, Outcome 6 Mean BMI at up to 6 months (kg/m2).
3.7. Analysis.
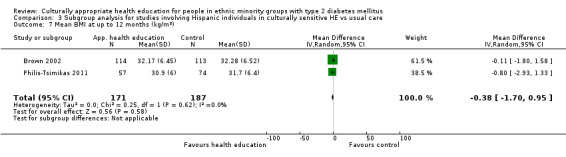
Comparison 3 Subgroup analysis for studies involving Hispanic individuals in culturally sensitive HE vs usual care, Outcome 7 Mean BMI at up to 12 months (kg/m2).
3.8. Analysis.
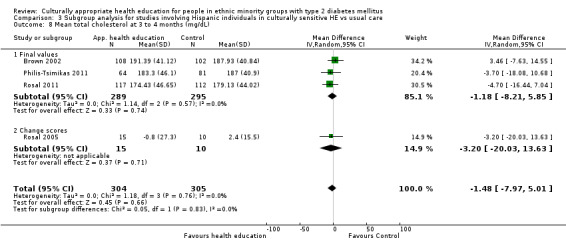
Comparison 3 Subgroup analysis for studies involving Hispanic individuals in culturally sensitive HE vs usual care, Outcome 8 Mean total cholesterol at 3 to 4 months (mg/dL).
3.9. Analysis.
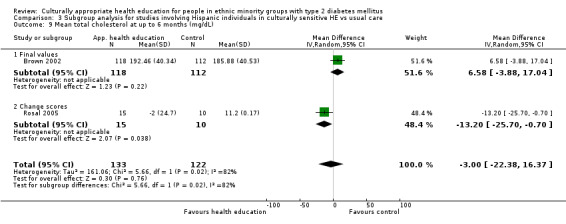
Comparison 3 Subgroup analysis for studies involving Hispanic individuals in culturally sensitive HE vs usual care, Outcome 9 Mean total cholesterol at up to 6 months (mg/dL).
3.10. Analysis.
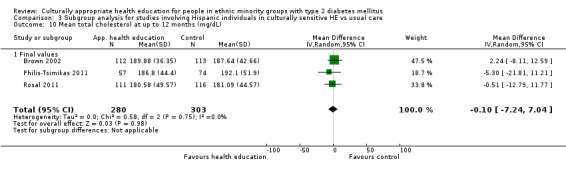
Comparison 3 Subgroup analysis for studies involving Hispanic individuals in culturally sensitive HE vs usual care, Outcome 10 Mean total cholesterol at up to 12 months (mg/dL).
3.11. Analysis.
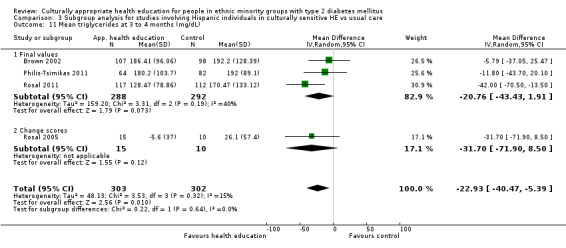
Comparison 3 Subgroup analysis for studies involving Hispanic individuals in culturally sensitive HE vs usual care, Outcome 11 Mean triglycerides at 3 to 4 months (mg/dL).
3.12. Analysis.
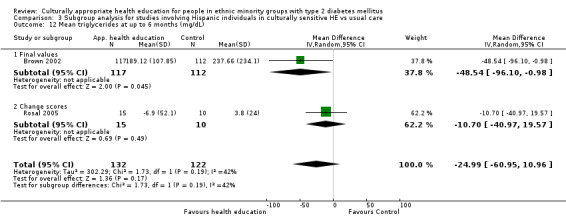
Comparison 3 Subgroup analysis for studies involving Hispanic individuals in culturally sensitive HE vs usual care, Outcome 12 Mean triglycerides at up to 6 months (mg/dL).
3.13. Analysis.
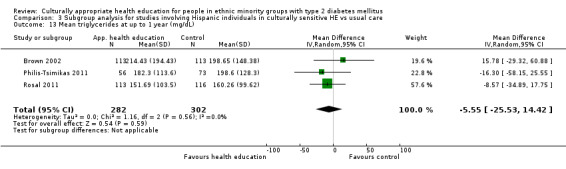
Comparison 3 Subgroup analysis for studies involving Hispanic individuals in culturally sensitive HE vs usual care, Outcome 13 Mean triglycerides at up to 1 year (mg/dL).
3.14. Analysis.
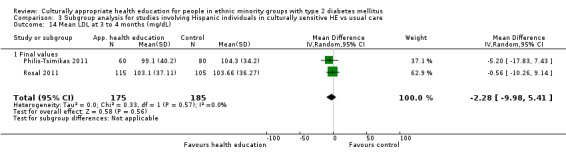
Comparison 3 Subgroup analysis for studies involving Hispanic individuals in culturally sensitive HE vs usual care, Outcome 14 Mean LDL at 3 to 4 months (mg/dL).
3.15. Analysis.
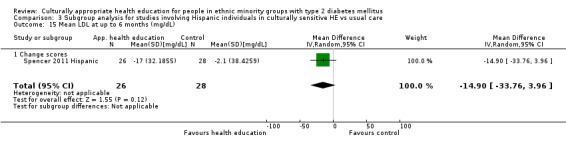
Comparison 3 Subgroup analysis for studies involving Hispanic individuals in culturally sensitive HE vs usual care, Outcome 15 Mean LDL at up to 6 months (mg/dL).
3.16. Analysis.
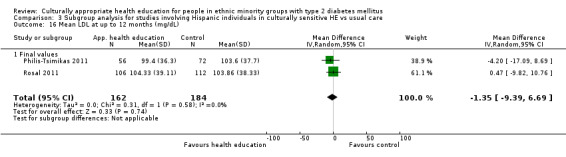
Comparison 3 Subgroup analysis for studies involving Hispanic individuals in culturally sensitive HE vs usual care, Outcome 16 Mean LDL at up to 12 months (mg/dL).
3.17. Analysis.
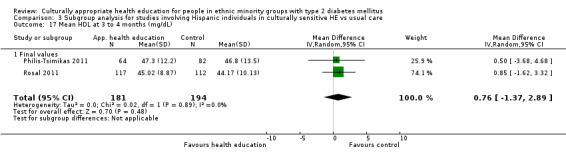
Comparison 3 Subgroup analysis for studies involving Hispanic individuals in culturally sensitive HE vs usual care, Outcome 17 Mean HDL at 3 to 4 months (mg/dL).
3.18. Analysis.
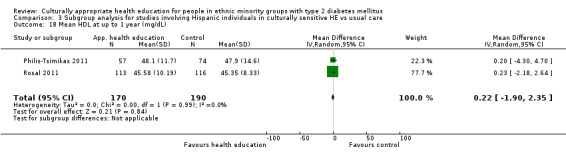
Comparison 3 Subgroup analysis for studies involving Hispanic individuals in culturally sensitive HE vs usual care, Outcome 18 Mean HDL at up to 1 year (mg/dL).
3.19. Analysis.
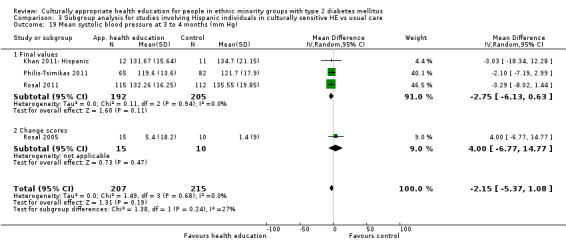
Comparison 3 Subgroup analysis for studies involving Hispanic individuals in culturally sensitive HE vs usual care, Outcome 19 Mean systolic blood pressure at 3 to 4 months (mm Hg).
3.20. Analysis.
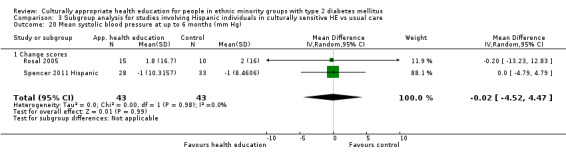
Comparison 3 Subgroup analysis for studies involving Hispanic individuals in culturally sensitive HE vs usual care, Outcome 20 Mean systolic blood pressure at up to 6 months (mm Hg).
3.21. Analysis.
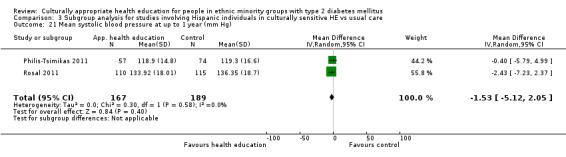
Comparison 3 Subgroup analysis for studies involving Hispanic individuals in culturally sensitive HE vs usual care, Outcome 21 Mean systolic blood pressure at up to 1 year (mm Hg).
3.22. Analysis.
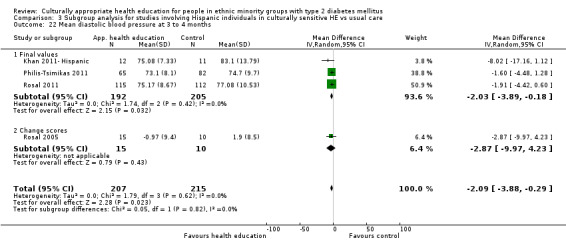
Comparison 3 Subgroup analysis for studies involving Hispanic individuals in culturally sensitive HE vs usual care, Outcome 22 Mean diastolic blood pressure at 3 to 4 months.
3.23. Analysis.
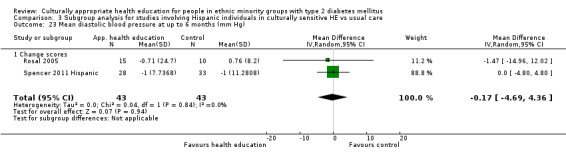
Comparison 3 Subgroup analysis for studies involving Hispanic individuals in culturally sensitive HE vs usual care, Outcome 23 Mean diastolic blood pressure at up to 6 months (mm Hg).
3.24. Analysis.
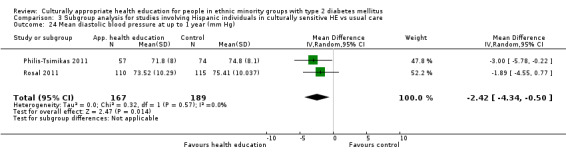
Comparison 3 Subgroup analysis for studies involving Hispanic individuals in culturally sensitive HE vs usual care, Outcome 24 Mean diastolic blood pressure at up to 1 year (mm Hg).
3.25. Analysis.
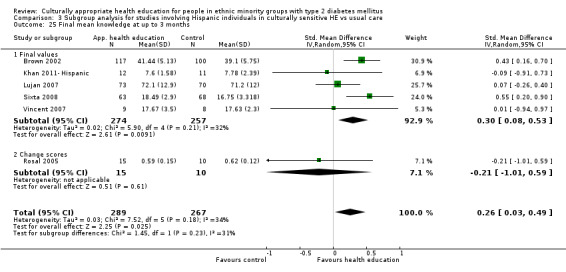
Comparison 3 Subgroup analysis for studies involving Hispanic individuals in culturally sensitive HE vs usual care, Outcome 25 Final mean knowledge at up to 3 months.
3.26. Analysis.
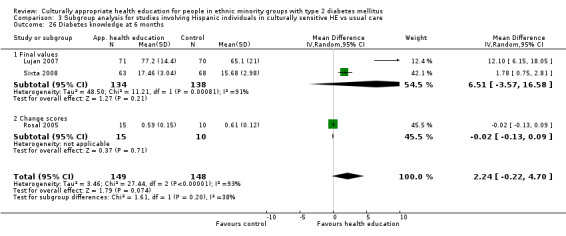
Comparison 3 Subgroup analysis for studies involving Hispanic individuals in culturally sensitive HE vs usual care, Outcome 26 Diabetes knowledge at 6 months.
3.27. Analysis.
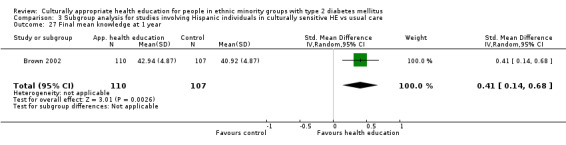
Comparison 3 Subgroup analysis for studies involving Hispanic individuals in culturally sensitive HE vs usual care, Outcome 27 Final mean knowledge at 1 year.
3.28. Analysis.
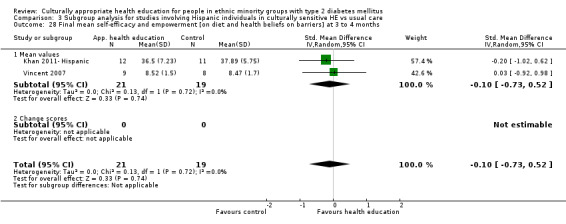
Comparison 3 Subgroup analysis for studies involving Hispanic individuals in culturally sensitive HE vs usual care, Outcome 28 Final mean self‐efficacy and empowerment [on diet and health beliefs on barriers] at 3 to 4 months.
3.29. Analysis.
Comparison 3 Subgroup analysis for studies involving Hispanic individuals in culturally sensitive HE vs usual care, Outcome 29 Mean quality of life measures at 3 to 4 months.
3.30. Analysis.
Comparison 3 Subgroup analysis for studies involving Hispanic individuals in culturally sensitive HE vs usual care, Outcome 30 Mean quality of life scores at 6 months.
3.31. Analysis.
Comparison 3 Subgroup analysis for studies involving Hispanic individuals in culturally sensitive HE vs usual care, Outcome 31 Emergency visits at 6 months.
Comparison 4. Subgroup analysis for studies involving South Asian individuals in culturally sensitive HE vs usual care.
| Outcome or subgroup title | No. of studies | No. of participants | Statistical method | Effect size |
|---|---|---|---|---|
| 1 Mean HbA1c at up to 6 months | 2 | 305 | Mean Difference (IV, Random, 95% CI) | ‐0.41 [‐0.71, ‐0.10] |
| 1.1 Final values | 1 | 192 | Mean Difference (IV, Random, 95% CI) | ‐0.34 [‐0.95, 0.27] |
| 1.2 Change scores | 1 | 113 | Mean Difference (IV, Random, 95% CI) | ‐0.43 [‐0.78, ‐0.08] |
| 2 Mean HbA1c at 24 months | 1 | 1473 | Mean Difference (IV, Random, 95% CI) | ‐0.18 [‐0.34, ‐0.01] |
| 2.1 Change scores | 1 | 1473 | Mean Difference (IV, Random, 95% CI) | ‐0.18 [‐0.34, ‐0.01] |
| 3 Final mean knowledge (diabetes and nutrition knowledge) at up to 6 months | 2 | 272 | Std. Mean Difference (IV, Random, 95% CI) | 0.51 [‐0.19, 1.21] |
| 3.1 Final values | 2 | 272 | Std. Mean Difference (IV, Random, 95% CI) | 0.51 [‐0.19, 1.21] |
| 4 Final mean self‐efficacy and empowerment on diet (can choose correct food) at 6 months | 1 | 192 | Std. Mean Difference (IV, Random, 95% CI) | 0.95 [0.65, 1.25] |
| 4.1 Final values | 1 | 192 | Std. Mean Difference (IV, Random, 95% CI) | 0.95 [0.65, 1.25] |
4.1. Analysis.
Comparison 4 Subgroup analysis for studies involving South Asian individuals in culturally sensitive HE vs usual care, Outcome 1 Mean HbA1c at up to 6 months.
4.2. Analysis.
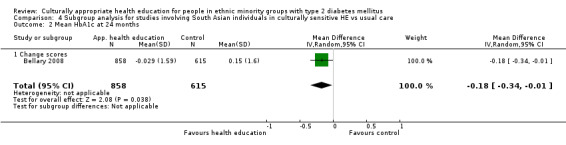
Comparison 4 Subgroup analysis for studies involving South Asian individuals in culturally sensitive HE vs usual care, Outcome 2 Mean HbA1c at 24 months.
4.3. Analysis.
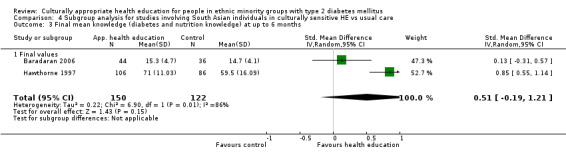
Comparison 4 Subgroup analysis for studies involving South Asian individuals in culturally sensitive HE vs usual care, Outcome 3 Final mean knowledge (diabetes and nutrition knowledge) at up to 6 months.
4.4. Analysis.
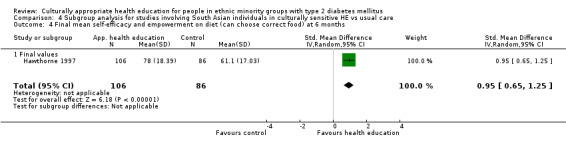
Comparison 4 Subgroup analysis for studies involving South Asian individuals in culturally sensitive HE vs usual care, Outcome 4 Final mean self‐efficacy and empowerment on diet (can choose correct food) at 6 months.
Comparison 5. Subgroup analysis for studies involving African American individuals in culturally sensitive HE vs usual care.
| Outcome or subgroup title | No. of studies | No. of participants | Statistical method | Effect size |
|---|---|---|---|---|
| 1 Mean HbA1c at up to 3 months | 5 | 482 | Mean Difference (IV, Random, 95% CI) | ‐0.34 [‐0.87, 0.19] |
| 1.1 Final values | 5 | 482 | Mean Difference (IV, Random, 95% CI) | ‐0.34 [‐0.87, 0.19] |
| 2 Mean HbA1c at up to 6 months | 4 | 400 | Mean Difference (IV, Random, 95% CI) | ‐0.93 [‐1.66, ‐0.21] |
| 2.1 Final values | 3 | 347 | Mean Difference (IV, Random, 95% CI) | ‐0.44 [‐0.71, ‐0.18] |
| 2.2 Change scores | 1 | 53 | Mean Difference (IV, Random, 95% CI) | ‐1.50 [‐2.24, ‐0.76] |
| 3 Mean HbA1c at up to 12 months | 3 | 633 | Mean Difference (IV, Random, 95% CI) | ‐0.09 [‐0.29, 0.10] |
| 3.1 Final values | 3 | 633 | Mean Difference (IV, Random, 95% CI) | ‐0.09 [‐0.29, 0.10] |
| 4 Mean HbA1c at up to 24 months | 2 | 651 | Mean Difference (IV, Random, 95% CI) | ‐0.34 [‐0.96, 0.28] |
| 4.1 Mean value | 1 | 109 | Mean Difference (IV, Random, 95% CI) | ‐0.80 [‐1.66, 0.06] |
| 4.2 Change value | 1 | 542 | Mean Difference (IV, Random, 95% CI) | ‐0.12 [‐0.43, 0.19] |
| 5 Mean diastolic blood pressure at up to 3 months (mm Hg) | 4 | 354 | Mean Difference (IV, Random, 95% CI) | 0.25 [‐2.20, 2.69] |
| 5.1 Final values | 3 | 329 | Mean Difference (IV, Random, 95% CI) | 0.66 [‐1.94, 3.26] |
| 5.2 Change scores | 1 | 25 | Mean Difference (IV, Random, 95% CI) | ‐2.87 [‐9.97, 4.23] |
| 6 Mean diastolic blood pressure at up to 6 months (mm Hg) | 3 | 286 | Mean Difference (IV, Random, 95% CI) | 2.45 [0.52, 4.38] |
| 6.1 Final values | 2 | 228 | Mean Difference (IV, Random, 95% CI) | 1.73 [‐1.93, 5.38] |
| 6.2 Change scores | 1 | 58 | Mean Difference (IV, Random, 95% CI) | 3.0 [‐4.46, 10.46] |
| 7 Mean diastolic blood pressure at up to 1 year (mm Hg) | 1 | 169 | Mean Difference (IV, Random, 95% CI) | 2.0 [‐0.79, 4.79] |
| 7.1 Final values | 1 | 169 | Mean Difference (IV, Random, 95% CI) | 2.0 [‐0.79, 4.79] |
| 8 Mean systolic blood pressure at up to 3 months (mm Hg) | 3 | 331 | Mean Difference (IV, Random, 95% CI) | 2.69 [‐2.10, 7.49] |
| 8.1 Final values | 3 | 331 | Mean Difference (IV, Random, 95% CI) | 2.69 [‐2.10, 7.49] |
| 9 Mean systolic blood pressure at up to 6 months (mm Hg) | 3 | 286 | Mean Difference (IV, Random, 95% CI) | 2.15 [‐0.04, 4.33] |
| 9.1 Final values | 2 | 228 | Mean Difference (IV, Random, 95% CI) | 1.88 [‐0.46, 4.21] |
| 9.2 Change scores | 1 | 58 | Mean Difference (IV, Random, 95% CI) | 4.0 [‐2.12, 10.12] |
| 10 Mean systolic blood pressure at up to 1 year (mm Hg) | 2 | 528 | Mean Difference (IV, Random, 95% CI) | 2.14 [‐0.76, 5.04] |
| 10.1 Final values | 2 | 528 | Mean Difference (IV, Random, 95% CI) | 2.14 [‐0.76, 5.04] |
| 11 Mean total cholesterol at up to 3 months (mg/dL) | 2 | 279 | Mean Difference (IV, Random, 95% CI) | ‐6.93 [‐17.28, 3.42] |
| 11.1 Final values | 2 | 279 | Mean Difference (IV, Random, 95% CI) | ‐6.93 [‐17.28, 3.42] |
| 12 Mean total cholesterol at up to 6 months (mg/dL) | 2 | 172 | Mean Difference (IV, Random, 95% CI) | ‐3.81 [‐17.14, 9.51] |
| 12.1 Final values | 2 | 172 | Mean Difference (IV, Random, 95% CI) | ‐3.81 [‐17.14, 9.51] |
| 13 Mean total cholesterol at up to 1 year (mg/dL) | 1 | 111 | Mean Difference (IV, Random, 95% CI) | ‐11.0 [‐27.11, 5.11] |
| 13.1 Final values | 1 | 111 | Mean Difference (IV, Random, 95% CI) | ‐11.0 [‐27.11, 5.11] |
| 14 Mean LDL at 3 to 4 months (mg/dL) | 1 | 55 | Mean Difference (IV, Random, 95% CI) | 6.0 [‐10.03, 22.03] |
| 14.1 Final values | 1 | 55 | Mean Difference (IV, Random, 95% CI) | 6.0 [‐10.03, 22.03] |
| 15 Mean LDL at up to 6 months (mg/dL) | 2 | 104 | Mean Difference (IV, Random, 95% CI) | 4.37 [‐9.01, 17.75] |
| 15.1 Final values | 1 | 52 | Mean Difference (IV, Random, 95% CI) | 7.80 [‐11.20, 26.80] |
| 15.2 Change scores | 1 | 52 | Mean Difference (IV, Random, 95% CI) | 1.0 [‐17.84, 19.84] |
| 16 Mean HDL at 3 to 4 months (mg/dL) | 1 | 57 | Mean Difference (IV, Random, 95% CI) | ‐4.80 [‐10.52, 0.92] |
| 16.1 Final values | 1 | 57 | Mean Difference (IV, Random, 95% CI) | ‐4.80 [‐10.52, 0.92] |
| 17 Mean HDL at up to 6 months (mg/dL) | 2 | 171 | Mean Difference (IV, Random, 95% CI) | ‐0.36 [‐9.27, 8.55] |
| 17.1 Final scores | 2 | 171 | Mean Difference (IV, Random, 95% CI) | ‐0.36 [‐9.27, 8.55] |
| 18 Mean HDL at up to 1 year (mg/dL) | 1 | 111 | Mean Difference (IV, Random, 95% CI) | 1.0 [‐4.70, 6.70] |
| 19 Mean LDL at up to 12 months (mg/dL) | 1 | 341 | Mean Difference (IV, Random, 95% CI) | 1.0 [‐6.76, 8.76] |
| 20 Mean triglycerides at 3 to 4 months (mg/dL) | 1 | 57 | Mean Difference (IV, Random, 95% CI) | ‐44.40 [‐119.65, 30.85] |
| 20.1 Final values | 1 | 57 | Mean Difference (IV, Random, 95% CI) | ‐44.40 [‐119.65, 30.85] |
| 21 Mean triglycerides at up to 6 months (mg/dL) | 1 | 55 | Mean Difference (IV, Random, 95% CI) | ‐17.20 [‐60.10, 25.70] |
| 21.1 Final values | 1 | 55 | Mean Difference (IV, Random, 95% CI) | ‐17.20 [‐60.10, 25.70] |
| 22 Mean BMI at up to 3 months (kg/m2) | 1 | 57 | Mean Difference (IV, Random, 95% CI) | ‐1.80 [‐5.22, 1.62] |
| 22.1 Final values | 1 | 57 | Mean Difference (IV, Random, 95% CI) | ‐1.80 [‐5.22, 1.62] |
| 23 Mean BMI at up to 6 months (kg/m2) | 2 | 112 | Mean Difference (IV, Random, 95% CI) | ‐0.57 [‐4.16, 3.01] |
| 23.1 Final values | 1 | 55 | Mean Difference (IV, Random, 95% CI) | ‐2.70 [‐6.12, 0.72] |
| 23.2 Change scores | 1 | 57 | Mean Difference (IV, Random, 95% CI) | 1.0 [‐0.97, 2.97] |
| 24 Final mean knowledge at up to 3 months | 3 | 301 | Std. Mean Difference (IV, Random, 95% CI) | 0.40 [‐0.27, 1.06] |
| 25 Final mean knowledge (diabetes and nutrition knowledge) at up to 6 months | 3 | 346 | Std. Mean Difference (IV, Random, 95% CI) | 0.39 [0.17, 0.60] |
| 26 Final mean knowledge at 1 year | 1 | 111 | Std. Mean Difference (IV, Random, 95% CI) | 0.22 [‐0.15, 0.60] |
| 27 Final mean self‐efficacy and empowerment [on diet and health beliefs on barriers] at 3 to 4 months | 2 | 243 | Std. Mean Difference (IV, Random, 95% CI) | 0.06 [‐0.48, 0.61] |
| 27.1 Mean values | 2 | 243 | Std. Mean Difference (IV, Random, 95% CI) | 0.06 [‐0.48, 0.61] |
| 28 Mean quality of life scores at 6 months | 1 | 120 | Mean Difference (IV, Random, 95% CI) | 0.5 [‐2.01, 3.01] |
| 28.1 Mean values | 1 | 120 | Mean Difference (IV, Random, 95% CI) | 0.5 [‐2.01, 3.01] |
| 29 Mean quality of life scores at 1 year | 1 | 114 | Mean Difference (IV, Random, 95% CI) | ‐1.20 [‐3.84, 1.44] |
| 30 Acute hospital admissions at 24 months | 1 | 542 | Odds Ratio (M‐H, Random, 95% CI) | 0.13 [0.09, 0.19] |
5.1. Analysis.
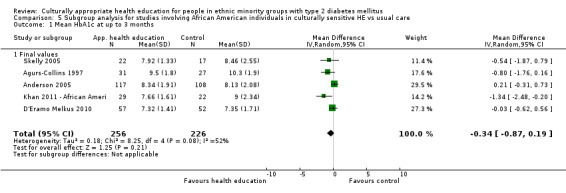
Comparison 5 Subgroup analysis for studies involving African American individuals in culturally sensitive HE vs usual care, Outcome 1 Mean HbA1c at up to 3 months.
5.2. Analysis.
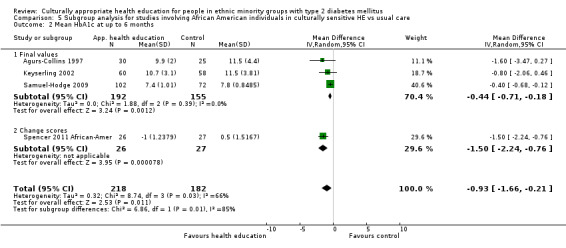
Comparison 5 Subgroup analysis for studies involving African American individuals in culturally sensitive HE vs usual care, Outcome 2 Mean HbA1c at up to 6 months.
5.3. Analysis.
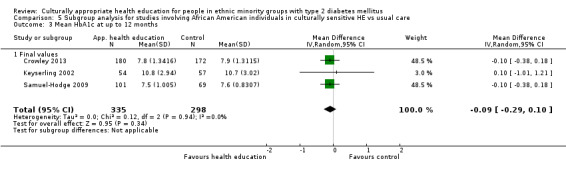
Comparison 5 Subgroup analysis for studies involving African American individuals in culturally sensitive HE vs usual care, Outcome 3 Mean HbA1c at up to 12 months.
5.4. Analysis.
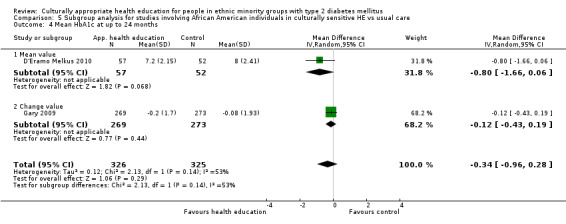
Comparison 5 Subgroup analysis for studies involving African American individuals in culturally sensitive HE vs usual care, Outcome 4 Mean HbA1c at up to 24 months.
5.5. Analysis.
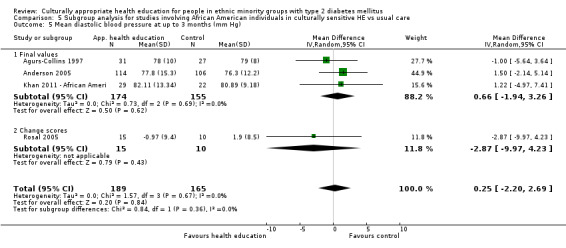
Comparison 5 Subgroup analysis for studies involving African American individuals in culturally sensitive HE vs usual care, Outcome 5 Mean diastolic blood pressure at up to 3 months (mm Hg).
5.6. Analysis.
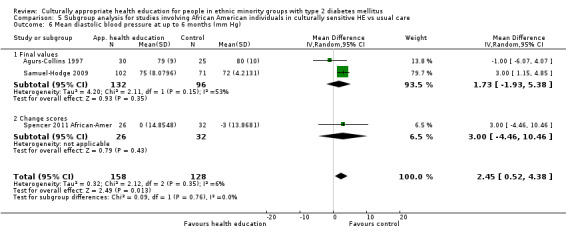
Comparison 5 Subgroup analysis for studies involving African American individuals in culturally sensitive HE vs usual care, Outcome 6 Mean diastolic blood pressure at up to 6 months (mm Hg).
5.7. Analysis.

Comparison 5 Subgroup analysis for studies involving African American individuals in culturally sensitive HE vs usual care, Outcome 7 Mean diastolic blood pressure at up to 1 year (mm Hg).
5.8. Analysis.
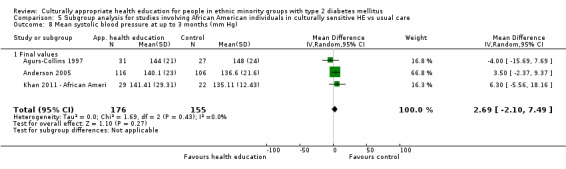
Comparison 5 Subgroup analysis for studies involving African American individuals in culturally sensitive HE vs usual care, Outcome 8 Mean systolic blood pressure at up to 3 months (mm Hg).
5.9. Analysis.
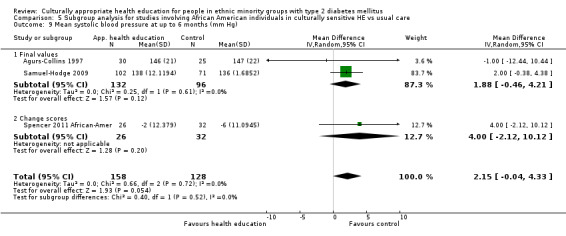
Comparison 5 Subgroup analysis for studies involving African American individuals in culturally sensitive HE vs usual care, Outcome 9 Mean systolic blood pressure at up to 6 months (mm Hg).
5.10. Analysis.
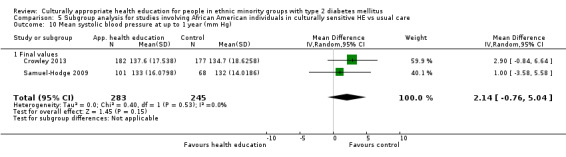
Comparison 5 Subgroup analysis for studies involving African American individuals in culturally sensitive HE vs usual care, Outcome 10 Mean systolic blood pressure at up to 1 year (mm Hg).
5.11. Analysis.
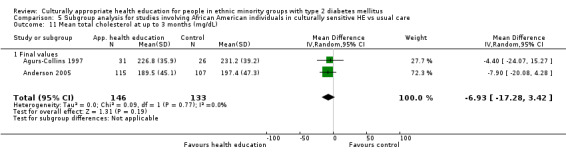
Comparison 5 Subgroup analysis for studies involving African American individuals in culturally sensitive HE vs usual care, Outcome 11 Mean total cholesterol at up to 3 months (mg/dL).
5.12. Analysis.
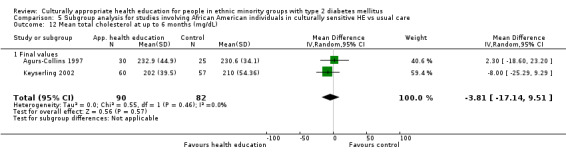
Comparison 5 Subgroup analysis for studies involving African American individuals in culturally sensitive HE vs usual care, Outcome 12 Mean total cholesterol at up to 6 months (mg/dL).
5.13. Analysis.
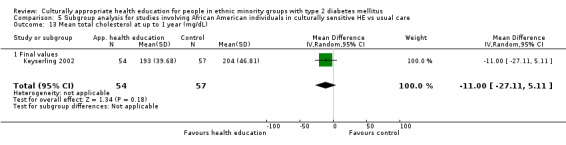
Comparison 5 Subgroup analysis for studies involving African American individuals in culturally sensitive HE vs usual care, Outcome 13 Mean total cholesterol at up to 1 year (mg/dL).
5.14. Analysis.
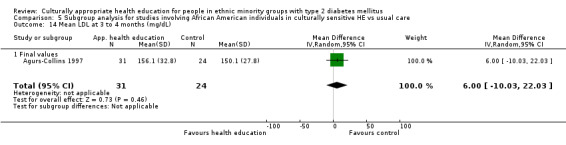
Comparison 5 Subgroup analysis for studies involving African American individuals in culturally sensitive HE vs usual care, Outcome 14 Mean LDL at 3 to 4 months (mg/dL).
5.15. Analysis.
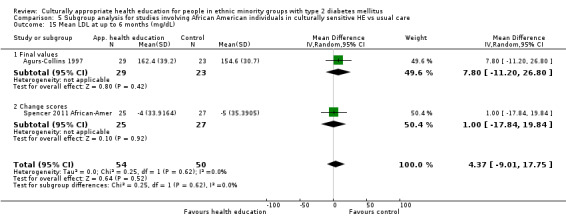
Comparison 5 Subgroup analysis for studies involving African American individuals in culturally sensitive HE vs usual care, Outcome 15 Mean LDL at up to 6 months (mg/dL).
5.16. Analysis.
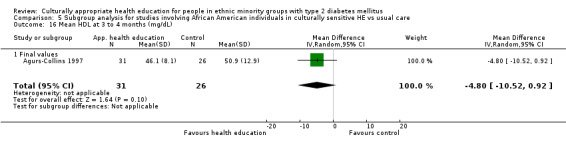
Comparison 5 Subgroup analysis for studies involving African American individuals in culturally sensitive HE vs usual care, Outcome 16 Mean HDL at 3 to 4 months (mg/dL).
5.17. Analysis.
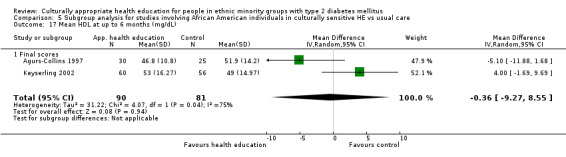
Comparison 5 Subgroup analysis for studies involving African American individuals in culturally sensitive HE vs usual care, Outcome 17 Mean HDL at up to 6 months (mg/dL).
5.18. Analysis.
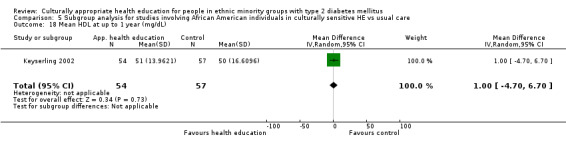
Comparison 5 Subgroup analysis for studies involving African American individuals in culturally sensitive HE vs usual care, Outcome 18 Mean HDL at up to 1 year (mg/dL).
5.19. Analysis.
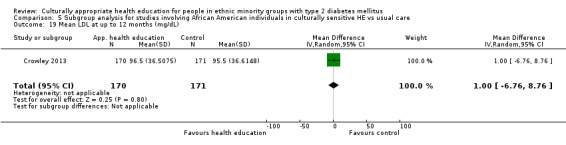
Comparison 5 Subgroup analysis for studies involving African American individuals in culturally sensitive HE vs usual care, Outcome 19 Mean LDL at up to 12 months (mg/dL).
5.20. Analysis.
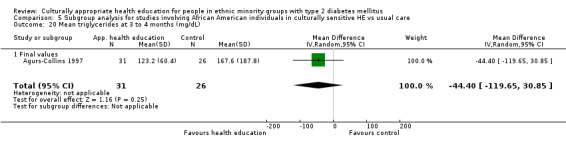
Comparison 5 Subgroup analysis for studies involving African American individuals in culturally sensitive HE vs usual care, Outcome 20 Mean triglycerides at 3 to 4 months (mg/dL).
5.21. Analysis.

Comparison 5 Subgroup analysis for studies involving African American individuals in culturally sensitive HE vs usual care, Outcome 21 Mean triglycerides at up to 6 months (mg/dL).
5.22. Analysis.
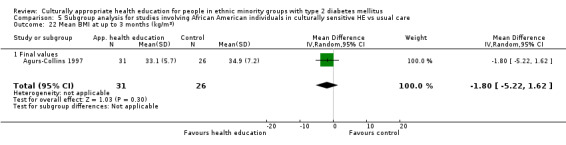
Comparison 5 Subgroup analysis for studies involving African American individuals in culturally sensitive HE vs usual care, Outcome 22 Mean BMI at up to 3 months (kg/m2).
5.23. Analysis.
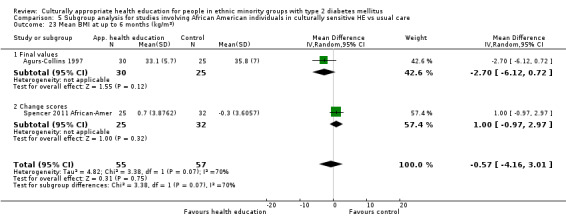
Comparison 5 Subgroup analysis for studies involving African American individuals in culturally sensitive HE vs usual care, Outcome 23 Mean BMI at up to 6 months (kg/m2).
5.24. Analysis.
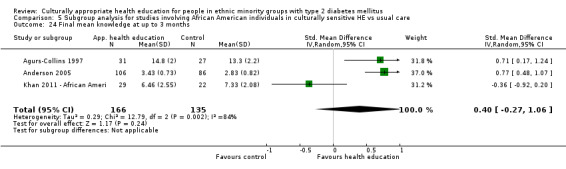
Comparison 5 Subgroup analysis for studies involving African American individuals in culturally sensitive HE vs usual care, Outcome 24 Final mean knowledge at up to 3 months.
5.25. Analysis.
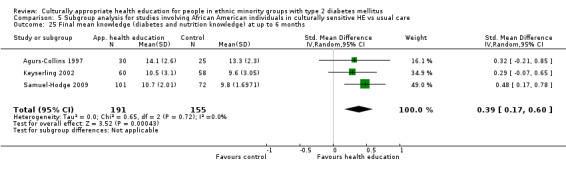
Comparison 5 Subgroup analysis for studies involving African American individuals in culturally sensitive HE vs usual care, Outcome 25 Final mean knowledge (diabetes and nutrition knowledge) at up to 6 months.
5.26. Analysis.
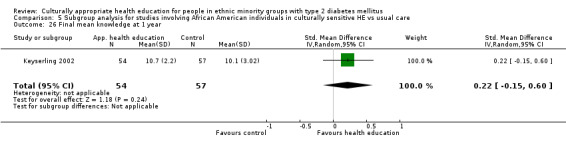
Comparison 5 Subgroup analysis for studies involving African American individuals in culturally sensitive HE vs usual care, Outcome 26 Final mean knowledge at 1 year.
5.27. Analysis.
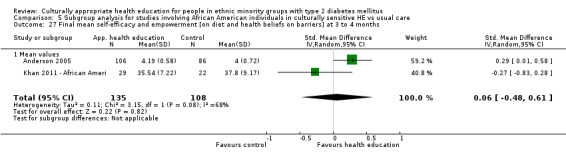
Comparison 5 Subgroup analysis for studies involving African American individuals in culturally sensitive HE vs usual care, Outcome 27 Final mean self‐efficacy and empowerment [on diet and health beliefs on barriers] at 3 to 4 months.
5.28. Analysis.
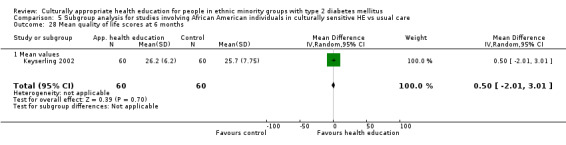
Comparison 5 Subgroup analysis for studies involving African American individuals in culturally sensitive HE vs usual care, Outcome 28 Mean quality of life scores at 6 months.
5.29. Analysis.
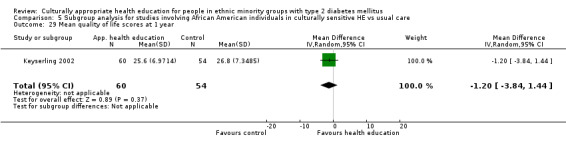
Comparison 5 Subgroup analysis for studies involving African American individuals in culturally sensitive HE vs usual care, Outcome 29 Mean quality of life scores at 1 year.
5.30. Analysis.
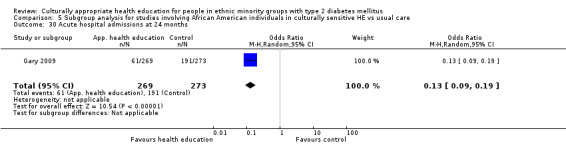
Comparison 5 Subgroup analysis for studies involving African American individuals in culturally sensitive HE vs usual care, Outcome 30 Acute hospital admissions at 24 months.
Comparison 6. Subgroup analysis of group HE in culturally sensitive intervention vs usual care.
| Outcome or subgroup title | No. of studies | No. of participants | Statistical method | Effect size |
|---|---|---|---|---|
| 1 Mean HbA1c at 3 to 4 months | 5 | 703 | Mean Difference (IV, Random, 95% CI) | ‐0.14 [‐0.46, 0.18] |
| 1.1 Final values | 5 | 703 | Mean Difference (IV, Random, 95% CI) | ‐0.14 [‐0.46, 0.18] |
| 1.2 Change scores | 0 | 0 | Mean Difference (IV, Random, 95% CI) | 0.0 [0.0, 0.0] |
| 2 Mean HbA1c at 6 months | 5 | 1075 | Mean Difference (IV, Random, 95% CI) | ‐0.46 [‐0.74, ‐0.19] |
| 2.1 Mean HbA1c at 6 months | 2 | 506 | Mean Difference (IV, Random, 95% CI) | ‐0.85 [‐1.82, 0.13] |
| 2.2 Change HbA1c at 6 months | 3 | 569 | Mean Difference (IV, Random, 95% CI) | ‐0.36 [‐0.58, ‐0.14] |
| 3 Mean HbA1c at 12 months | 2 | 354 | Mean Difference (IV, Random, 95% CI) | ‐0.68 [‐1.19, ‐0.17] |
| 4 Mean HbA1c at 24 months | 1 | 109 | Mean Difference (IV, Random, 95% CI) | ‐0.80 [‐1.66, 0.06] |
| 5 Mean BMI at up to 3 months (kg/m2) | 2 | 236 | Mean Difference (IV, Random, 95% CI) | ‐0.70 [‐2.22, 0.83] |
| 5.1 Final values | 2 | 236 | Mean Difference (IV, Random, 95% CI) | ‐0.70 [‐2.22, 0.83] |
| 6 Mean BMI at up to 6 months (kg/m2) | 3 | 478 | Mean Difference (IV, Random, 95% CI) | ‐0.57 [‐0.98, ‐0.15] |
| 6.1 Mean value | 2 | 374 | Mean Difference (IV, Random, 95% CI) | ‐1.15 [‐2.43, 0.13] |
| 6.2 Change value | 1 | 104 | Mean Difference (IV, Random, 95% CI) | ‐0.5 [‐0.94, ‐0.06] |
| 7 Mean BMI at up to 12 months (kg/m2) | 2 | 358 | Mean Difference (IV, Random, 95% CI) | ‐0.38 [‐1.70, 0.95] |
| 8 Mean total cholesterol at 3 to 4 months (mg/dL) | 3 | 577 | Mean Difference (IV, Random, 95% CI) | ‐2.18 [‐9.31, 4.94] |
| 8.1 Final values | 3 | 577 | Mean Difference (IV, Random, 95% CI) | ‐2.18 [‐9.31, 4.94] |
| 9 Mean total cholesterol at 6 months | 2 | 334 | Mean Difference (IV, Random, 95% CI) | 8.92 [7.03, 10.81] |
| 9.1 Mean values | 1 | 230 | Mean Difference (IV, Random, 95% CI) | 6.58 [‐3.88, 17.04] |
| 9.2 Change scores | 1 | 104 | Mean Difference (IV, Random, 95% CI) | 9.0 [7.08, 10.92] |
| 10 Mean total cholesterol at up to 12 months (mg/dL) | 2 | 356 | Mean Difference (IV, Random, 95% CI) | 0.11 [‐8.66, 8.88] |
| 11 Mean LDL at 3 to 4 months (mg/dL) | 1 | 140 | Mean Difference (IV, Random, 95% CI) | ‐5.20 [‐17.83, 7.43] |
| 11.1 Final values | 1 | 140 | Mean Difference (IV, Random, 95% CI) | ‐5.20 [‐17.83, 7.43] |
| 12 LDL cholesterol at 6 months | 1 | 104 | Mean Difference (IV, Random, 95% CI) | ‐2.0 [‐14.55, 10.55] |
| 12.1 Mean value | 0 | 0 | Mean Difference (IV, Random, 95% CI) | 0.0 [0.0, 0.0] |
| 12.2 Change scores | 1 | 104 | Mean Difference (IV, Random, 95% CI) | ‐2.0 [‐14.55, 10.55] |
| 13 Mean LDL at up to 12 months (mg/dL) | 1 | 128 | Mean Difference (IV, Random, 95% CI) | ‐4.20 [‐17.09, 8.69] |
| 14 Mean HDL at 3 to 4 months (mg/dL) | 1 | 146 | Mean Difference (IV, Random, 95% CI) | 0.5 [‐3.68, 4.68] |
| 14.1 Final values | 1 | 146 | Mean Difference (IV, Random, 95% CI) | 0.5 [‐3.68, 4.68] |
| 15 Mean HDL cholesterol at 6 months | 1 | 104 | Mean Difference (IV, Random, 95% CI) | 3.0 [‐1.38, 7.38] |
| 15.1 Mean values | 0 | 0 | Mean Difference (IV, Random, 95% CI) | 0.0 [0.0, 0.0] |
| 15.2 Change scores | 1 | 104 | Mean Difference (IV, Random, 95% CI) | 3.0 [‐1.38, 7.38] |
| 16 Mean HDL at up to 1 year (mg/dL) | 1 | 131 | Mean Difference (IV, Random, 95% CI) | 0.20 [‐4.30, 4.70] |
| 17 Mean systolic blood pressure at 3 to 4 months (mm Hg) | 1 | 147 | Mean Difference (IV, Random, 95% CI) | ‐2.10 [‐7.19, 2.99] |
| 18 Systolic blood pressure at 6 months | 1 | 104 | Mean Difference (IV, Random, 95% CI) | 1.0 [‐4.54, 6.54] |
| 18.1 Mean value | 0 | 0 | Mean Difference (IV, Random, 95% CI) | 0.0 [0.0, 0.0] |
| 18.2 Change scores | 1 | 104 | Mean Difference (IV, Random, 95% CI) | 1.0 [‐4.54, 6.54] |
| 19 Mean systolic blood pressure at up to 1 year (mm Hg) | 1 | 131 | Mean Difference (IV, Random, 95% CI) | ‐0.40 [‐5.79, 4.99] |
| 20 Mean diastolic blood pressure at 3 to 4 months | 1 | 147 | Mean Difference (IV, Random, 95% CI) | ‐1.60 [‐4.48, 1.28] |
| 21 Diastolic blood pressure at 6 months | 1 | 104 | Mean Difference (IV, Random, 95% CI) | 2.0 [‐0.77, 4.77] |
| 21.1 Mean values | 0 | 0 | Mean Difference (IV, Random, 95% CI) | 0.0 [0.0, 0.0] |
| 21.2 Change scores | 1 | 104 | Mean Difference (IV, Random, 95% CI) | 2.0 [‐0.77, 4.77] |
| 22 Mean diastolic blood pressure at up to 1 year (mm Hg) | 1 | 131 | Mean Difference (IV, Random, 95% CI) | ‐3.0 [‐5.78, ‐0.22] |
| 23 Mean triglycerides at 3 to 4 months (mg/dL) | 2 | 351 | Mean Difference (IV, Random, 95% CI) | ‐8.73 [‐31.06, 13.59] |
| 23.1 Final values | 2 | 351 | Mean Difference (IV, Random, 95% CI) | ‐8.73 [‐31.06, 13.59] |
| 23.2 Change scores | 0 | 0 | Mean Difference (IV, Random, 95% CI) | 0.0 [0.0, 0.0] |
| 24 Mean triglycerides at up to 6 months (mg/dL) | 2 | 333 | Mean Difference (IV, Random, 95% CI) | 0.04 [‐93.57, 93.66] |
| 24.1 Final values | 1 | 229 | Mean Difference (IV, Random, 95% CI) | ‐48.54 [‐96.10, ‐0.98] |
| 24.2 Change scores | 1 | 104 | Mean Difference (IV, Random, 95% CI) | 47.0 [6.22, 87.78] |
| 25 Mean triglycerides at up to 1 year (mg/dL) | 2 | 355 | Mean Difference (IV, Random, 95% CI) | ‐1.40 [‐32.76, 29.95] |
| 26 Final mean knowledge at up to 3 months | 4 | 557 | Std. Mean Difference (IV, Random, 95% CI) | 0.56 [0.34, 0.77] |
| 27 Diabetes knowledge at 6 months | 2 | 211 | Std. Mean Difference (IV, Random, 95% CI) | 0.38 [‐0.06, 0.82] |
| 28 Final mean knowledge at 1 year | 1 | 217 | Std. Mean Difference (IV, Random, 95% CI) | 0.41 [0.14, 0.68] |
| 29 Final mean self‐efficacy and empowerment [on diet and health beliefs on barriers] at up to 3 months | 3 | 424 | Std. Mean Difference (IV, Random, 95% CI) | 0.13 [‐0.07, 0.34] |
| 29.1 Final values | 3 | 424 | Std. Mean Difference (IV, Random, 95% CI) | 0.13 [‐0.07, 0.34] |
| 29.2 Change scores | 0 | 0 | Std. Mean Difference (IV, Random, 95% CI) | 0.0 [0.0, 0.0] |
| 30 Emergency visits at 6 months | 1 | 352 | Mean Difference (IV, Random, 95% CI) | ‐0.03 [‐0.21, 0.16] |
| 30.1 Change values | 1 | 352 | Mean Difference (IV, Random, 95% CI) | ‐0.03 [‐0.21, 0.16] |
| 31 Mean HbA1c at all endpoints | 9 | 2241 | Mean Difference (IV, Random, 95% CI) | ‐0.40 [‐0.59, ‐0.21] |
| 31.1 Final values | 6 | 1672 | Mean Difference (IV, Random, 95% CI) | ‐0.45 [‐0.74, ‐0.17] |
| 31.2 Change scores | 3 | 569 | Mean Difference (IV, Random, 95% CI) | ‐0.36 [‐0.58, ‐0.14] |
| 32 Final mean knowledge at all endpoints | 5 | 985 | Std. Mean Difference (IV, Random, 95% CI) | 0.49 [0.34, 0.64] |
| 33 Mean total cholesterol at all endpoints | 4 | 1267 | Mean Difference (IV, Random, 95% CI) | 2.45 [‐3.15, 8.05] |
| 33.1 Mean values | 3 | 1163 | Mean Difference (IV, Random, 95% CI) | 0.45 [‐4.44, 5.33] |
| 33.2 Change scores | 1 | 104 | Mean Difference (IV, Random, 95% CI) | 9.0 [7.08, 10.92] |
6.1. Analysis.
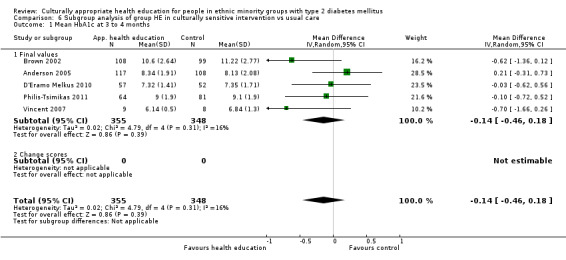
Comparison 6 Subgroup analysis of group HE in culturally sensitive intervention vs usual care, Outcome 1 Mean HbA1c at 3 to 4 months.
6.2. Analysis.
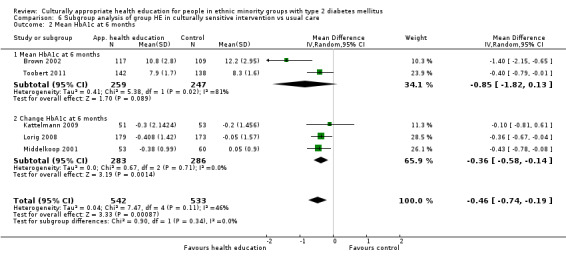
Comparison 6 Subgroup analysis of group HE in culturally sensitive intervention vs usual care, Outcome 2 Mean HbA1c at 6 months.
6.3. Analysis.
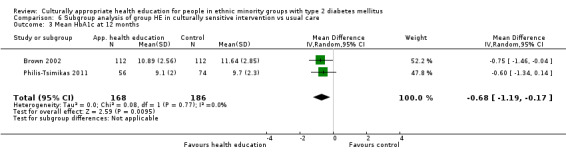
Comparison 6 Subgroup analysis of group HE in culturally sensitive intervention vs usual care, Outcome 3 Mean HbA1c at 12 months.
6.4. Analysis.
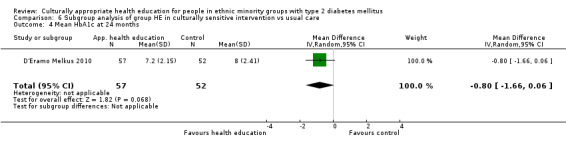
Comparison 6 Subgroup analysis of group HE in culturally sensitive intervention vs usual care, Outcome 4 Mean HbA1c at 24 months.
6.5. Analysis.
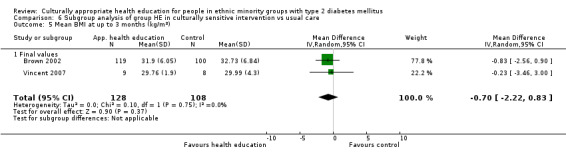
Comparison 6 Subgroup analysis of group HE in culturally sensitive intervention vs usual care, Outcome 5 Mean BMI at up to 3 months (kg/m2).
6.6. Analysis.
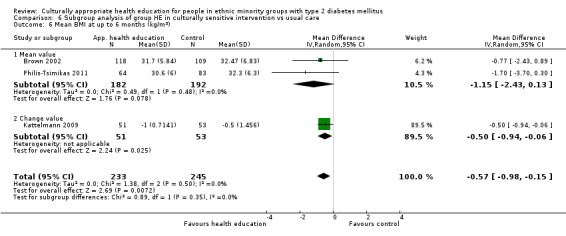
Comparison 6 Subgroup analysis of group HE in culturally sensitive intervention vs usual care, Outcome 6 Mean BMI at up to 6 months (kg/m2).
6.7. Analysis.
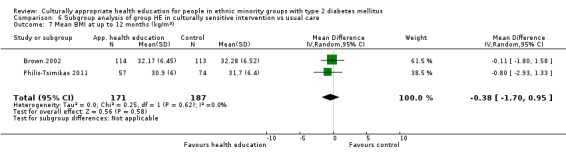
Comparison 6 Subgroup analysis of group HE in culturally sensitive intervention vs usual care, Outcome 7 Mean BMI at up to 12 months (kg/m2).
6.8. Analysis.
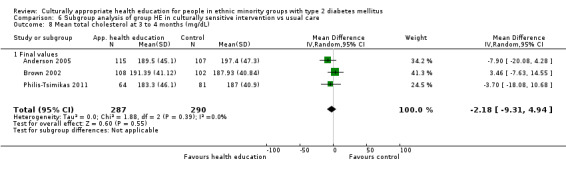
Comparison 6 Subgroup analysis of group HE in culturally sensitive intervention vs usual care, Outcome 8 Mean total cholesterol at 3 to 4 months (mg/dL).
6.9. Analysis.
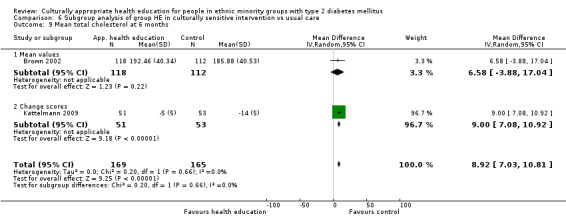
Comparison 6 Subgroup analysis of group HE in culturally sensitive intervention vs usual care, Outcome 9 Mean total cholesterol at 6 months.
6.10. Analysis.
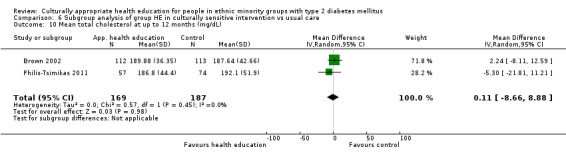
Comparison 6 Subgroup analysis of group HE in culturally sensitive intervention vs usual care, Outcome 10 Mean total cholesterol at up to 12 months (mg/dL).
6.11. Analysis.
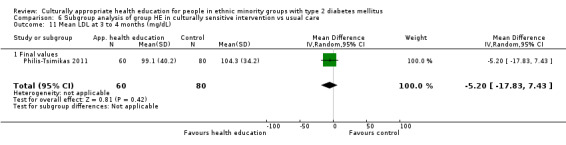
Comparison 6 Subgroup analysis of group HE in culturally sensitive intervention vs usual care, Outcome 11 Mean LDL at 3 to 4 months (mg/dL).
6.12. Analysis.
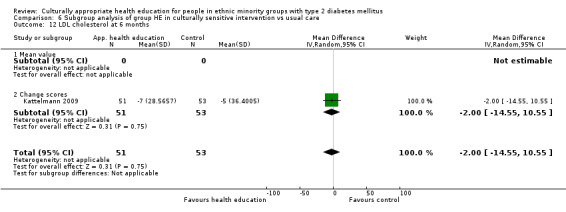
Comparison 6 Subgroup analysis of group HE in culturally sensitive intervention vs usual care, Outcome 12 LDL cholesterol at 6 months.
6.13. Analysis.
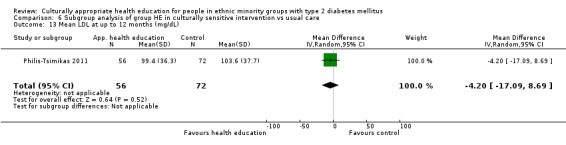
Comparison 6 Subgroup analysis of group HE in culturally sensitive intervention vs usual care, Outcome 13 Mean LDL at up to 12 months (mg/dL).
6.14. Analysis.
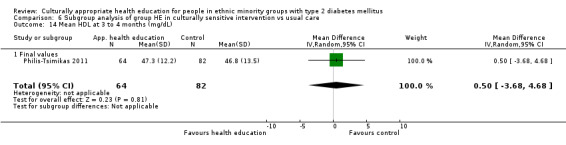
Comparison 6 Subgroup analysis of group HE in culturally sensitive intervention vs usual care, Outcome 14 Mean HDL at 3 to 4 months (mg/dL).
6.15. Analysis.
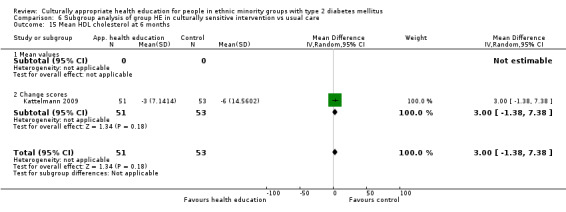
Comparison 6 Subgroup analysis of group HE in culturally sensitive intervention vs usual care, Outcome 15 Mean HDL cholesterol at 6 months.
6.16. Analysis.
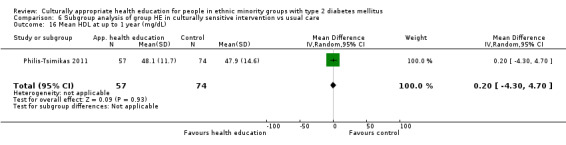
Comparison 6 Subgroup analysis of group HE in culturally sensitive intervention vs usual care, Outcome 16 Mean HDL at up to 1 year (mg/dL).
6.17. Analysis.
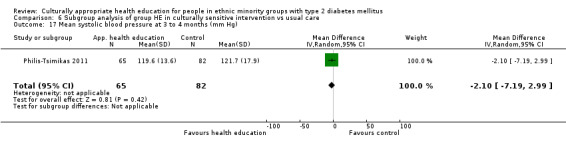
Comparison 6 Subgroup analysis of group HE in culturally sensitive intervention vs usual care, Outcome 17 Mean systolic blood pressure at 3 to 4 months (mm Hg).
6.18. Analysis.

Comparison 6 Subgroup analysis of group HE in culturally sensitive intervention vs usual care, Outcome 18 Systolic blood pressure at 6 months.
6.19. Analysis.
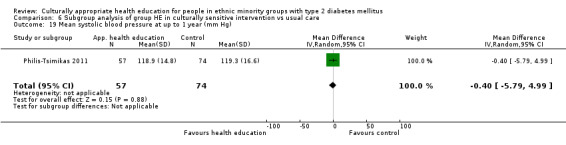
Comparison 6 Subgroup analysis of group HE in culturally sensitive intervention vs usual care, Outcome 19 Mean systolic blood pressure at up to 1 year (mm Hg).
6.20. Analysis.
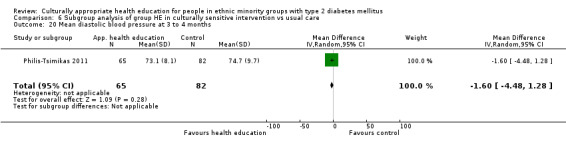
Comparison 6 Subgroup analysis of group HE in culturally sensitive intervention vs usual care, Outcome 20 Mean diastolic blood pressure at 3 to 4 months.
6.21. Analysis.
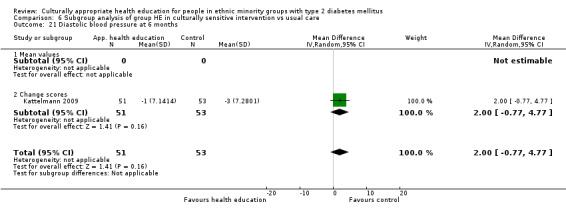
Comparison 6 Subgroup analysis of group HE in culturally sensitive intervention vs usual care, Outcome 21 Diastolic blood pressure at 6 months.
6.22. Analysis.
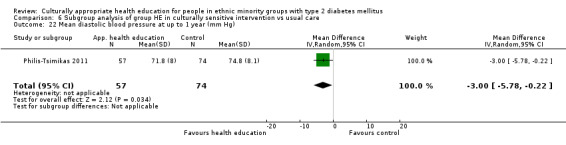
Comparison 6 Subgroup analysis of group HE in culturally sensitive intervention vs usual care, Outcome 22 Mean diastolic blood pressure at up to 1 year (mm Hg).
6.23. Analysis.
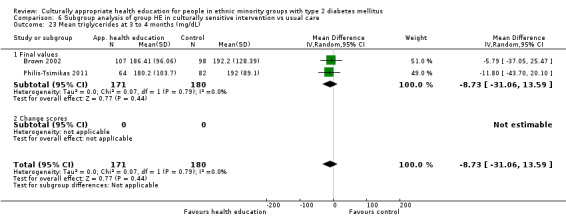
Comparison 6 Subgroup analysis of group HE in culturally sensitive intervention vs usual care, Outcome 23 Mean triglycerides at 3 to 4 months (mg/dL).
6.24. Analysis.
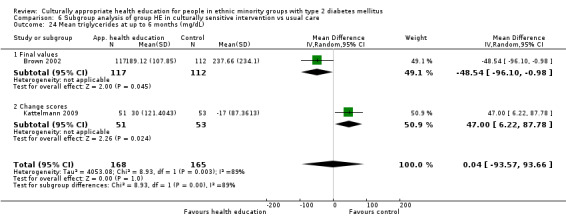
Comparison 6 Subgroup analysis of group HE in culturally sensitive intervention vs usual care, Outcome 24 Mean triglycerides at up to 6 months (mg/dL).
6.25. Analysis.
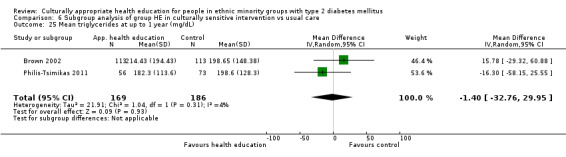
Comparison 6 Subgroup analysis of group HE in culturally sensitive intervention vs usual care, Outcome 25 Mean triglycerides at up to 1 year (mg/dL).
6.26. Analysis.
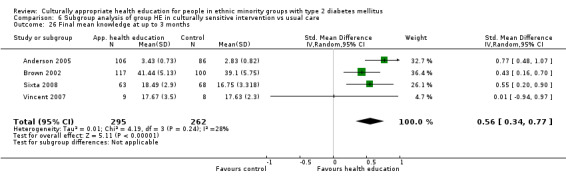
Comparison 6 Subgroup analysis of group HE in culturally sensitive intervention vs usual care, Outcome 26 Final mean knowledge at up to 3 months.
6.27. Analysis.
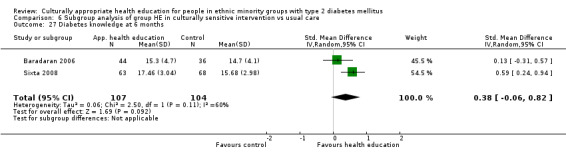
Comparison 6 Subgroup analysis of group HE in culturally sensitive intervention vs usual care, Outcome 27 Diabetes knowledge at 6 months.
6.28. Analysis.
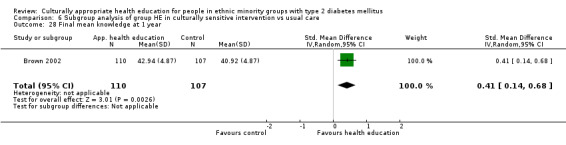
Comparison 6 Subgroup analysis of group HE in culturally sensitive intervention vs usual care, Outcome 28 Final mean knowledge at 1 year.
6.29. Analysis.
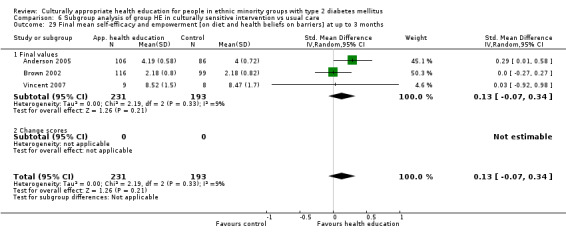
Comparison 6 Subgroup analysis of group HE in culturally sensitive intervention vs usual care, Outcome 29 Final mean self‐efficacy and empowerment [on diet and health beliefs on barriers] at up to 3 months.
6.30. Analysis.
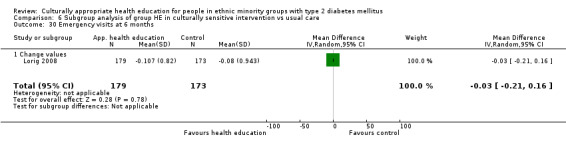
Comparison 6 Subgroup analysis of group HE in culturally sensitive intervention vs usual care, Outcome 30 Emergency visits at 6 months.
6.31. Analysis.
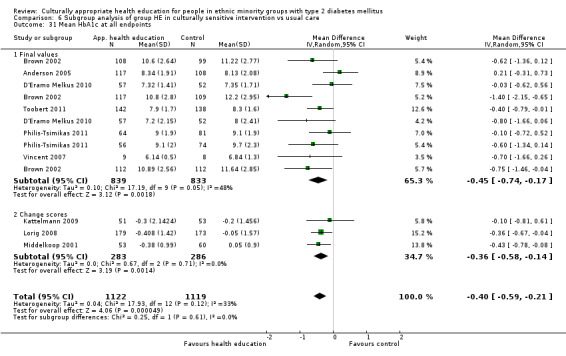
Comparison 6 Subgroup analysis of group HE in culturally sensitive intervention vs usual care, Outcome 31 Mean HbA1c at all endpoints.
6.32. Analysis.
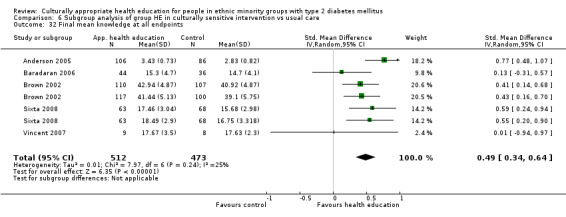
Comparison 6 Subgroup analysis of group HE in culturally sensitive intervention vs usual care, Outcome 32 Final mean knowledge at all endpoints.
6.33. Analysis.
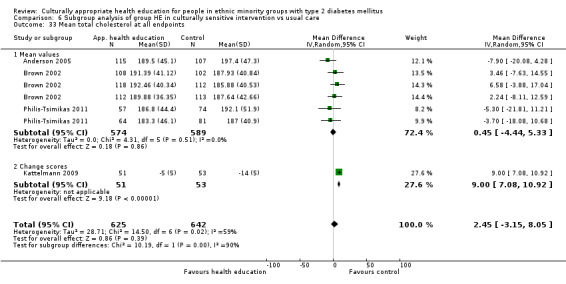
Comparison 6 Subgroup analysis of group HE in culturally sensitive intervention vs usual care, Outcome 33 Mean total cholesterol at all endpoints.
Comparison 7. Subgroup analysis of individual HE in culturally sensitive intervention vs usual care.
| Outcome or subgroup title | No. of studies | No. of participants | Statistical method | Effect size |
|---|---|---|---|---|
| 1 Mean HbA1c at up to 3 months | 4 | 204 | Mean Difference (IV, Random, 95% CI) | ‐0.36 [‐1.12, 0.41] |
| 1.1 Final values | 4 | 204 | Mean Difference (IV, Random, 95% CI) | ‐0.36 [‐1.12, 0.41] |
| 2 Mean HbA1c at up to 6 months | 2 | 305 | Mean Difference (IV, Random, 95% CI) | ‐0.41 [‐0.71, ‐0.10] |
| 2.1 Final values | 1 | 192 | Mean Difference (IV, Random, 95% CI) | ‐0.34 [‐0.95, 0.27] |
| 2.2 Change scores | 1 | 113 | Mean Difference (IV, Random, 95% CI) | ‐0.43 [‐0.78, ‐0.08] |
| 3 Mean HbA1c at up to 1 year | 2 | 496 | Mean Difference (IV, Random, 95% CI) | ‐0.30 [‐0.74, 0.14] |
| 3.1 Final values | 2 | 496 | Mean Difference (IV, Random, 95% CI) | ‐0.30 [‐0.74, 0.14] |
| 4 HbA1c at 24 months | 3 | 2159 | Mean Difference (IV, Random, 95% CI) | ‐0.29 [‐0.57, ‐0.01] |
| 4.1 Final values | 1 | 144 | Mean Difference (IV, Random, 95% CI) | ‐0.69 [‐1.09, ‐0.29] |
| 4.2 Change scores | 2 | 2015 | Mean Difference (IV, Random, 95% CI) | ‐0.16 [‐0.31, ‐0.02] |
| 5 Mean systolic blood pressure at up to 3 months (mm Hg) | 2 | 74 | Mean Difference (IV, Random, 95% CI) | 2.80 [‐6.58, 12.18] |
| 5.1 Final values | 2 | 74 | Mean Difference (IV, Random, 95% CI) | 2.80 [‐6.58, 12.18] |
| 6 Mean diastolic blood pressure at up to 3 months (mm Hg) | 2 | 74 | Mean Difference (IV, Random, 95% CI) | ‐2.76 [‐11.73, 6.21] |
| 6.1 Final values | 2 | 74 | Mean Difference (IV, Random, 95% CI) | ‐2.76 [‐11.73, 6.21] |
| 7 Diabetes knowledge at 3 months | 2 | 74 | Std. Mean Difference (IV, Random, 95% CI) | ‐0.28 [‐0.74, 0.19] |
| 8 Mean systolic blood pressure at up to 1 year (mm Hg) | 1 | 359 | Mean Difference (IV, Random, 95% CI) | 2.90 [‐0.84, 6.64] |
| 8.1 Final values | 1 | 359 | Mean Difference (IV, Random, 95% CI) | 2.90 [‐0.84, 6.64] |
| 9 Diabetes knowledge at 6 months | 1 | 192 | Std. Mean Difference (IV, Random, 95% CI) | 0.85 [0.55, 1.14] |
| 10 Mean LDL at up to 12 months (mg/dL) | 1 | 341 | Mean Difference (IV, Random, 95% CI) | 1.0 [‐6.76, 8.76] |
| 11 Final mean self‐efficacy and empowerment [on diet and health beliefs on barriers] at 3 to 4 months | 2 | 74 | Std. Mean Difference (IV, Random, 95% CI) | ‐0.25 [‐0.71, 0.21] |
| 11.1 Mean values | 2 | 74 | Std. Mean Difference (IV, Random, 95% CI) | ‐0.25 [‐0.71, 0.21] |
| 12 Final mean self‐efficacy and empowerment on diet (can choose correct food) at 6 months | 1 | Std. Mean Difference (IV, Random, 95% CI) | Totals not selected | |
| 12.1 Final values | 1 | Std. Mean Difference (IV, Random, 95% CI) | 0.0 [0.0, 0.0] | |
| 13 Acute hospital admissions at 24 months | 1 | 542 | Odds Ratio (M‐H, Random, 95% CI) | 0.13 [0.09, 0.19] |
| 14 Mean HbA1c at all endpoints | 8 | 1005 | Mean Difference (IV, Random, 95% CI) | ‐0.32 [‐0.54, ‐0.09] |
| 14.1 Final values | 7 | 892 | Mean Difference (IV, Random, 95% CI) | ‐0.29 [‐0.57, ‐0.01] |
| 14.2 Change scores | 1 | 113 | Mean Difference (IV, Random, 95% CI) | ‐0.43 [‐0.78, ‐0.08] |
| 15 Diabetes knowledge at all endpoints | 3 | 266 | Std. Mean Difference (IV, Random, 95% CI) | 0.17 [‐0.71, 1.05] |
| 16 Mean total cholesterol at all endpoints | 2 | 517 | Mean Difference (IV, Random, 95% CI) | ‐8.99 [‐22.52, 4.54] |
| 16.1 Final values | 1 | 192 | Mean Difference (IV, Random, 95% CI) | ‐1.16 [‐14.87, 12.55] |
| 16.2 Change value | 1 | 325 | Mean Difference (IV, Random, 95% CI) | ‐15.08 [‐24.82, ‐5.34] |
7.1. Analysis.
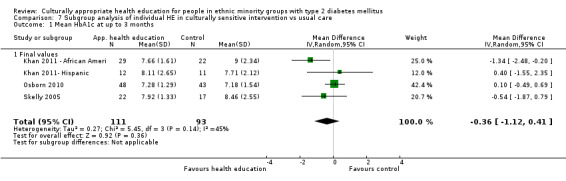
Comparison 7 Subgroup analysis of individual HE in culturally sensitive intervention vs usual care, Outcome 1 Mean HbA1c at up to 3 months.
7.2. Analysis.
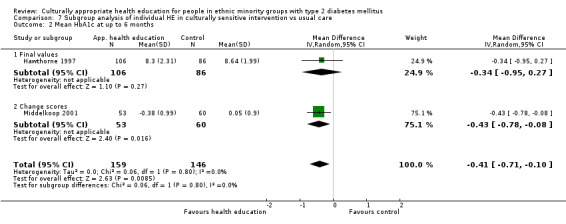
Comparison 7 Subgroup analysis of individual HE in culturally sensitive intervention vs usual care, Outcome 2 Mean HbA1c at up to 6 months.
7.3. Analysis.
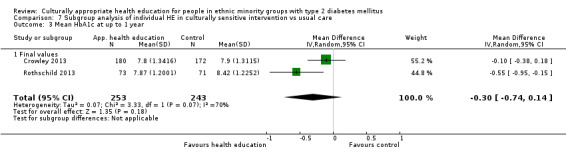
Comparison 7 Subgroup analysis of individual HE in culturally sensitive intervention vs usual care, Outcome 3 Mean HbA1c at up to 1 year.
7.4. Analysis.
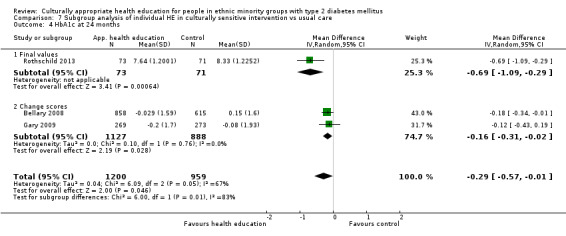
Comparison 7 Subgroup analysis of individual HE in culturally sensitive intervention vs usual care, Outcome 4 HbA1c at 24 months.
7.5. Analysis.
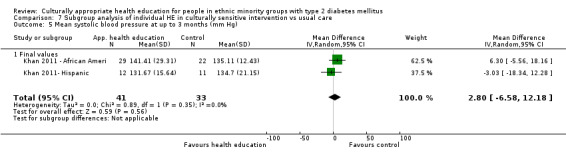
Comparison 7 Subgroup analysis of individual HE in culturally sensitive intervention vs usual care, Outcome 5 Mean systolic blood pressure at up to 3 months (mm Hg).
7.6. Analysis.
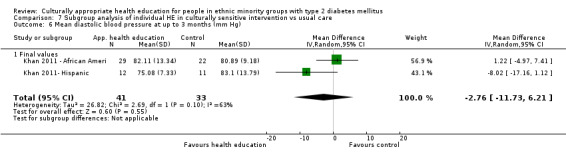
Comparison 7 Subgroup analysis of individual HE in culturally sensitive intervention vs usual care, Outcome 6 Mean diastolic blood pressure at up to 3 months (mm Hg).
7.7. Analysis.
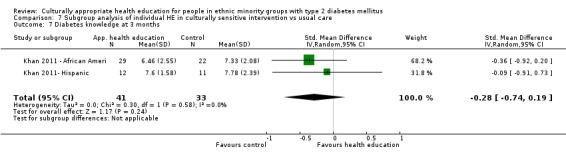
Comparison 7 Subgroup analysis of individual HE in culturally sensitive intervention vs usual care, Outcome 7 Diabetes knowledge at 3 months.
7.8. Analysis.
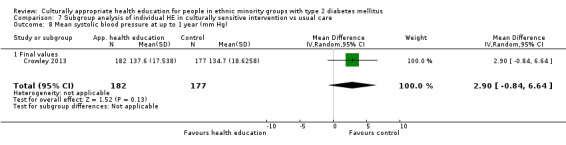
Comparison 7 Subgroup analysis of individual HE in culturally sensitive intervention vs usual care, Outcome 8 Mean systolic blood pressure at up to 1 year (mm Hg).
7.9. Analysis.
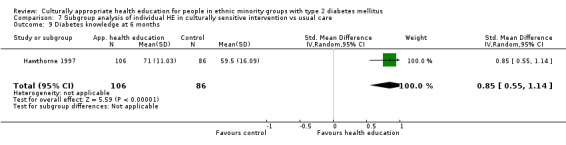
Comparison 7 Subgroup analysis of individual HE in culturally sensitive intervention vs usual care, Outcome 9 Diabetes knowledge at 6 months.
7.10. Analysis.
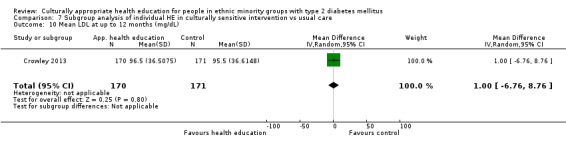
Comparison 7 Subgroup analysis of individual HE in culturally sensitive intervention vs usual care, Outcome 10 Mean LDL at up to 12 months (mg/dL).
7.11. Analysis.
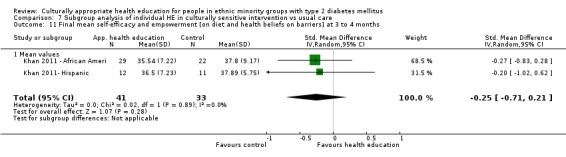
Comparison 7 Subgroup analysis of individual HE in culturally sensitive intervention vs usual care, Outcome 11 Final mean self‐efficacy and empowerment [on diet and health beliefs on barriers] at 3 to 4 months.
7.12. Analysis.
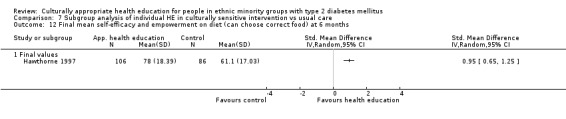
Comparison 7 Subgroup analysis of individual HE in culturally sensitive intervention vs usual care, Outcome 12 Final mean self‐efficacy and empowerment on diet (can choose correct food) at 6 months.
7.13. Analysis.
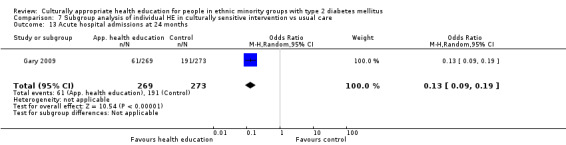
Comparison 7 Subgroup analysis of individual HE in culturally sensitive intervention vs usual care, Outcome 13 Acute hospital admissions at 24 months.
7.14. Analysis.
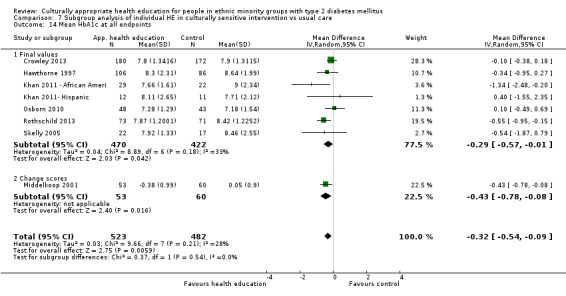
Comparison 7 Subgroup analysis of individual HE in culturally sensitive intervention vs usual care, Outcome 14 Mean HbA1c at all endpoints.
7.15. Analysis.
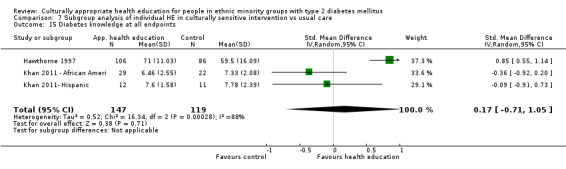
Comparison 7 Subgroup analysis of individual HE in culturally sensitive intervention vs usual care, Outcome 15 Diabetes knowledge at all endpoints.
7.16. Analysis.
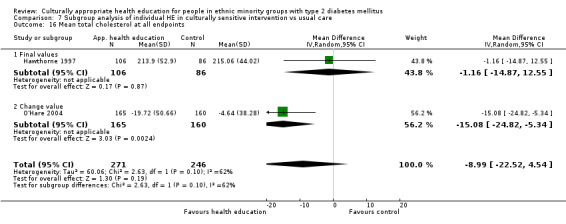
Comparison 7 Subgroup analysis of individual HE in culturally sensitive intervention vs usual care, Outcome 16 Mean total cholesterol at all endpoints.
Comparison 8. Subgroup analysis for combined group and individual HE for culturally sensitive HE vs usual care.
| Outcome or subgroup title | No. of studies | No. of participants | Statistical method | Effect size |
|---|---|---|---|---|
| 1 Mean HbA1c at up to 3 months | 5 | 535 | Mean Difference (IV, Random, 95% CI) | ‐0.62 [‐0.99, ‐0.25] |
| 1.1 Final values | 2 | 201 | Mean Difference (IV, Random, 95% CI) | ‐0.34 [‐1.01, 0.32] |
| 1.2 Change scores | 3 | 334 | Mean Difference (IV, Random, 95% CI) | ‐0.74 [‐1.19, ‐0.30] |
| 2 Mean HbA1c at up to 6 months | 8 | 705 | Mean Difference (IV, Fixed, 95% CI) | ‐0.56 [‐0.76, ‐0.36] |
| 2.1 Final values | 4 | 488 | Mean Difference (IV, Fixed, 95% CI) | ‐0.41 [‐0.66, ‐0.17] |
| 2.2 Change scores | 4 | 217 | Mean Difference (IV, Fixed, 95% CI) | ‐0.83 [‐1.17, ‐0.50] |
| 3 Mean HbA1c at up to 1 year | 3 | 511 | Mean Difference (IV, Random, 95% CI) | ‐0.13 [‐0.36, 0.11] |
| 3.1 Final values | 2 | 281 | Mean Difference (IV, Random, 95% CI) | ‐0.09 [‐0.36, 0.18] |
| 3.2 Change score | 1 | 230 | Mean Difference (IV, Random, 95% CI) | ‐0.26 [‐0.77, 0.25] |
| 4 Mean systolic blood pressure at up to 3 months (mm Hg) | 4 | 389 | Mean Difference (IV, Random, 95% CI) | ‐1.54 [‐5.03, 1.94] |
| 4.1 Final values | 2 | 285 | Mean Difference (IV, Random, 95% CI) | ‐3.39 [‐7.77, 0.99] |
| 4.2 Change scores | 2 | 104 | Mean Difference (IV, Random, 95% CI) | 1.64 [‐4.12, 7.41] |
| 5 Mean systolic blood pressure at up to 6 months (mm Hg) | 6 | 451 | Mean Difference (IV, Random, 95% CI) | 1.83 [‐0.08, 3.73] |
| 5.1 Final values | 2 | 228 | Mean Difference (IV, Random, 95% CI) | 1.88 [‐0.46, 4.21] |
| 5.2 Change scores | 4 | 223 | Mean Difference (IV, Random, 95% CI) | 1.73 [‐1.57, 5.03] |
| 6 Mean systolic blood pressure at up to 1 year (mm Hg) | 2 | 394 | Mean Difference (IV, Random, 95% CI) | ‐0.64 [‐3.99, 2.72] |
| 6.1 Final values | 2 | 394 | Mean Difference (IV, Random, 95% CI) | ‐0.64 [‐3.99, 2.72] |
| 7 Mean diastolic blood pressure at up to 3 months (mm Hg) | 4 | 389 | Mean Difference (IV, Random, 95% CI) | ‐1.66 [‐3.53, 0.22] |
| 7.1 Final values | 2 | 285 | Mean Difference (IV, Random, 95% CI) | ‐1.70 [‐3.91, 0.51] |
| 7.2 Change scores | 2 | 104 | Mean Difference (IV, Random, 95% CI) | ‐1.54 [‐5.10, 2.01] |
| 8 Mean diastolic blood pressure at up to 6 months (mm Hg) | 6 | 451 | Mean Difference (IV, Random, 95% CI) | 2.06 [0.57, 3.56] |
| 8.1 Final values | 2 | 228 | Mean Difference (IV, Random, 95% CI) | 1.73 [‐1.93, 5.38] |
| 8.2 Change scores | 4 | 223 | Mean Difference (IV, Random, 95% CI) | 0.73 [‐2.20, 3.67] |
| 9 Mean diastolic blood pressure at up to 1 year (mm Hg) | 2 | 394 | Mean Difference (IV, Random, 95% CI) | 0.03 [‐3.78, 3.84] |
| 9.1 Final values | 2 | 394 | Mean Difference (IV, Random, 95% CI) | 0.03 [‐3.78, 3.84] |
| 10 Mean BMI at up to 3 months (kg/m2) | 3 | 161 | Mean Difference (IV, Random, 95% CI) | 0.05 [‐0.42, 0.53] |
| 10.1 Final values | 1 | 57 | Mean Difference (IV, Random, 95% CI) | ‐1.80 [‐5.22, 1.62] |
| 10.2 Change scores | 2 | 104 | Mean Difference (IV, Random, 95% CI) | 0.09 [‐0.39, 0.57] |
| 11 Mean BMI at up to 6 months (kg/m2) | 5 | 276 | Mean Difference (IV, Random, 95% CI) | 0.01 [‐0.45, 0.47] |
| 11.1 Final values | 1 | 55 | Mean Difference (IV, Random, 95% CI) | ‐2.70 [‐6.12, 0.72] |
| 11.2 Change scores | 4 | 221 | Mean Difference (IV, Random, 95% CI) | 0.06 [‐0.41, 0.53] |
| 12 QoL at up to 6 months (overall QoL and mental QoL) | 3 | 224 | Std. Mean Difference (IV, Random, 95% CI) | ‐0.00 [‐0.35, 0.34] |
| 12.1 Final values | 1 | 120 | Std. Mean Difference (IV, Random, 95% CI) | 0.07 [‐0.29, 0.43] |
| 12.2 Mean change | 2 | 104 | Std. Mean Difference (IV, Random, 95% CI) | 0.01 [‐0.71, 0.72] |
| 13 Mean total cholesterol at up to 3 months (mg/dL) | 4 | 390 | Mean Difference (IV, Random, 95% CI) | ‐8.61 [‐18.28, 1.06] |
| 13.1 Final values | 2 | 286 | Mean Difference (IV, Random, 95% CI) | ‐4.62 [‐14.70, 5.46] |
| 13.2 Change scores | 2 | 104 | Mean Difference (IV, Random, 95% CI) | ‐14.15 [‐36.29, 7.98] |
| 14 Mean total cholesterol at up to 6 months (mg/dL) | 4 | 276 | Mean Difference (IV, Random, 95% CI) | ‐11.90 [‐21.80, ‐2.01] |
| 14.1 Final values | 2 | 172 | Mean Difference (IV, Random, 95% CI) | ‐3.81 [‐17.14, 9.51] |
| 14.2 Change scores | 2 | 104 | Mean Difference (IV, Random, 95% CI) | ‐17.57 [‐29.32, ‐5.81] |
| 15 Mean total cholesterol at up to 1 year (mg/dL) | 2 | 338 | Mean Difference (IV, Random, 95% CI) | ‐4.40 [‐14.34, 5.53] |
| 15.1 Final values | 2 | 338 | Mean Difference (IV, Random, 95% CI) | ‐4.40 [‐14.34, 5.53] |
| 16 Mean LDL at up to 3 months (mg/dL) | 3 | 300 | Mean Difference (IV, Random, 95% CI) | 1.25 [‐6.01, 8.50] |
| 16.1 Final values | 2 | 275 | Mean Difference (IV, Random, 95% CI) | 1.20 [‐7.10, 9.50] |
| 16.2 Change scores | 1 | 25 | Mean Difference (IV, Random, 95% CI) | 1.4 [‐13.55, 16.35] |
| 17 Mean LDL at up to 6 months (mg/dL) | 4 | 183 | Mean Difference (IV, Random, 95% CI) | ‐4.93 [‐14.13, 4.27] |
| 17.1 Final values | 1 | 52 | Mean Difference (IV, Random, 95% CI) | 7.80 [‐11.20, 26.80] |
| 17.2 Change scores | 3 | 131 | Mean Difference (IV, Random, 95% CI) | ‐8.21 [‐17.26, 0.84] |
| 18 Mean LDL at up to 12 months (mg/dL) | 1 | 218 | Mean Difference (IV, Random, 95% CI) | 0.47 [‐9.82, 10.76] |
| 18.1 Final values | 1 | 218 | Mean Difference (IV, Random, 95% CI) | 0.47 [‐9.82, 10.76] |
| 19 Mean HDL at up to 3 months (mg/dL) | 4 | 390 | Mean Difference (IV, Random, 95% CI) | 0.02 [‐2.03, 2.07] |
| 19.1 Final values | 2 | 286 | Mean Difference (IV, Random, 95% CI) | ‐1.36 [‐6.77, 4.04] |
| 19.2 Change scores | 2 | 104 | Mean Difference (IV, Random, 95% CI) | 0.43 [‐2.69, 3.54] |
| 20 Mean HDL at up to 6 months (mg/dL) | 4 | 275 | Mean Difference (IV, Random, 95% CI) | ‐1.58 [‐5.02, 1.85] |
| 20.1 Final scores | 2 | 171 | Mean Difference (IV, Random, 95% CI) | ‐0.36 [‐9.27, 8.55] |
| 20.2 Change scores | 2 | 104 | Mean Difference (IV, Random, 95% CI) | ‐2.69 [‐5.70, 0.32] |
| 21 Mean HDL at up to 1 year (mg/dL) | 2 | 340 | Mean Difference (IV, Random, 95% CI) | 0.35 [‐1.88, 2.57] |
| 22 Mean triglycerides at up to 3 months (mg/dL) | 3 | 311 | Mean Difference (IV, Random, 95% CI) | ‐39.06 [‐61.28, ‐16.85] |
| 22.1 Final values | 2 | 286 | Mean Difference (IV, Random, 95% CI) | ‐42.30 [‐68.95, ‐15.65] |
| 22.2 Change scores | 1 | 25 | Mean Difference (IV, Random, 95% CI) | ‐31.70 [‐71.90, 8.50] |
| 23 Mean triglycerides at up to 6 months (mg/dL) | 2 | 80 | Mean Difference (IV, Random, 95% CI) | ‐12.86 [‐37.60, 11.87] |
| 23.1 Final values | 1 | 55 | Mean Difference (IV, Random, 95% CI) | ‐17.20 [‐60.10, 25.70] |
| 23.2 Change scores | 1 | 25 | Mean Difference (IV, Random, 95% CI) | ‐10.7 [‐40.97, 19.57] |
| 24 Mean triglycerides at up to 1 year (mg/dL) | 1 | 229 | Mean Difference (IV, Random, 95% CI) | ‐8.57 [‐34.89, 17.75] |
| 25 Final mean knowledge at up to 3 months | 4 | 305 | Std. Mean Difference (IV, Random, 95% CI) | 0.36 [‐0.07, 0.79] |
| 25.1 Mean values | 2 | 201 | Std. Mean Difference (IV, Random, 95% CI) | 0.35 [‐0.26, 0.97] |
| 25.2 Change scores | 2 | 104 | Std. Mean Difference (IV, Random, 95% CI) | 0.32 [‐0.59, 1.24] |
| 26 Final mean knowledge (diabetes and nutrition knowledge) at up to 6 months | 6 | 591 | Std. Mean Difference (IV, Random, 95% CI) | 0.47 [0.29, 0.65] |
| 26.1 Mean values | 4 | 487 | Std. Mean Difference (IV, Random, 95% CI) | 0.47 [0.29, 0.65] |
| 26.2 Change scores | 2 | 104 | Std. Mean Difference (IV, Random, 95% CI) | 0.35 [‐0.47, 1.18] |
| 27 Final mean knowledge at 1 year | 1 | 111 | Std. Mean Difference (IV, Random, 95% CI) | 0.22 [‐0.15, 0.60] |
| 28 Final mean self‐efficacy and empowerment [on diet and health beliefs on barriers] at 3 to 4 months | 1 | 79 | Std. Mean Difference (IV, Random, 95% CI) | 0.45 [0.01, 0.90] |
| 28.1 Change scores | 1 | 79 | Std. Mean Difference (IV, Random, 95% CI) | 0.45 [0.01, 0.90] |
| 29 Final mean self‐efficacy and empowerment on diet (can choose correct food) at 6 months | 1 | 79 | Std. Mean Difference (IV, Random, 95% CI) | 0.50 [0.06, 0.95] |
| 29.1 Change scores | 1 | 79 | Std. Mean Difference (IV, Random, 95% CI) | 0.50 [0.06, 0.95] |
| 30 Mean quality of life measures at 3 to 4 months | 2 | 104 | Std. Mean Difference (IV, Random, 95% CI) | 0.36 [‐0.03, 0.75] |
| 30.1 Final values | 0 | 0 | Std. Mean Difference (IV, Random, 95% CI) | 0.0 [0.0, 0.0] |
| 30.2 Change scores | 2 | 104 | Std. Mean Difference (IV, Random, 95% CI) | 0.36 [‐0.03, 0.75] |
| 31 Mean quality of life scores at 6 months | 1 | 120 | Std. Mean Difference (IV, Random, 95% CI) | 0.07 [‐0.29, 0.43] |
| 31.1 Mean values | 1 | 120 | Std. Mean Difference (IV, Random, 95% CI) | 0.07 [‐0.29, 0.43] |
| 32 Mean quality of life scores at 1 year | 1 | 114 | Std. Mean Difference (IV, Random, 95% CI) | ‐0.17 [‐0.53, 0.20] |
| 33 Mean HbA1c at all endpoints | 9 | 1336 | Mean Difference (IV, Random, 95% CI) | ‐0.57 [‐0.81, ‐0.32] |
| 33.1 Final values | 4 | 659 | Mean Difference (IV, Random, 95% CI) | ‐0.39 [‐0.62, ‐0.16] |
| 33.2 Change scores | 5 | 677 | Mean Difference (IV, Random, 95% CI) | ‐0.69 [‐1.08, ‐0.30] |
| 34 Mean total cholesterol at all endpoints | 5 | 503 | Mean Difference (IV, Random, 95% CI) | ‐6.46 [‐15.56, 2.64] |
| 34.1 Final values | 3 | 399 | Mean Difference (IV, Random, 95% CI) | ‐2.03 [‐11.06, 7.00] |
| 34.2 Change scores | 2 | 104 | Mean Difference (IV, Random, 95% CI) | ‐14.15 [‐36.29, 7.98] |
8.1. Analysis.
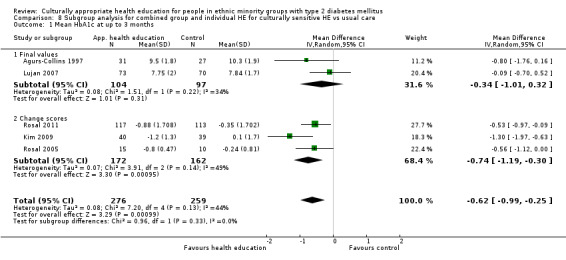
Comparison 8 Subgroup analysis for combined group and individual HE for culturally sensitive HE vs usual care, Outcome 1 Mean HbA1c at up to 3 months.
8.2. Analysis.
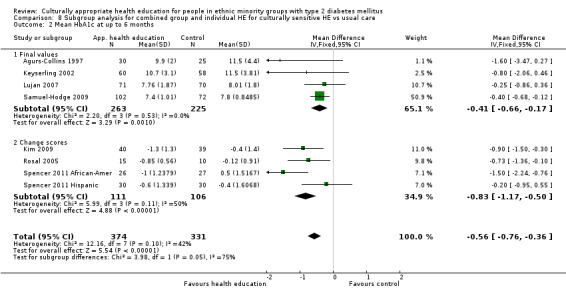
Comparison 8 Subgroup analysis for combined group and individual HE for culturally sensitive HE vs usual care, Outcome 2 Mean HbA1c at up to 6 months.
8.3. Analysis.
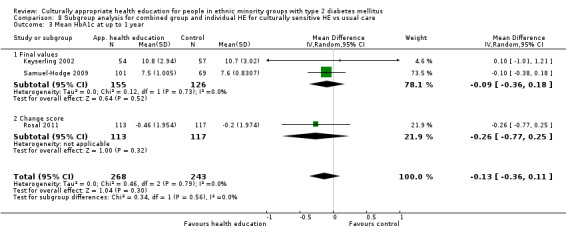
Comparison 8 Subgroup analysis for combined group and individual HE for culturally sensitive HE vs usual care, Outcome 3 Mean HbA1c at up to 1 year.
8.4. Analysis.
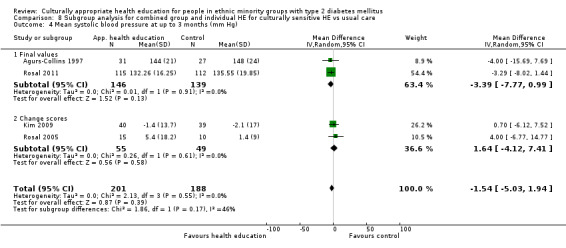
Comparison 8 Subgroup analysis for combined group and individual HE for culturally sensitive HE vs usual care, Outcome 4 Mean systolic blood pressure at up to 3 months (mm Hg).
8.5. Analysis.
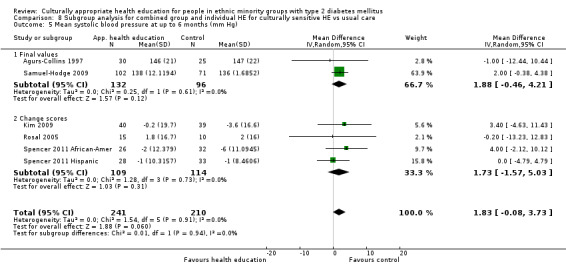
Comparison 8 Subgroup analysis for combined group and individual HE for culturally sensitive HE vs usual care, Outcome 5 Mean systolic blood pressure at up to 6 months (mm Hg).
8.6. Analysis.
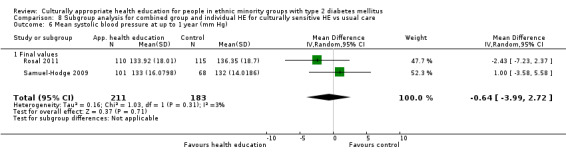
Comparison 8 Subgroup analysis for combined group and individual HE for culturally sensitive HE vs usual care, Outcome 6 Mean systolic blood pressure at up to 1 year (mm Hg).
8.7. Analysis.
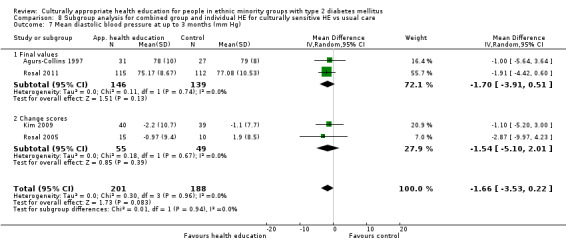
Comparison 8 Subgroup analysis for combined group and individual HE for culturally sensitive HE vs usual care, Outcome 7 Mean diastolic blood pressure at up to 3 months (mm Hg).
8.8. Analysis.
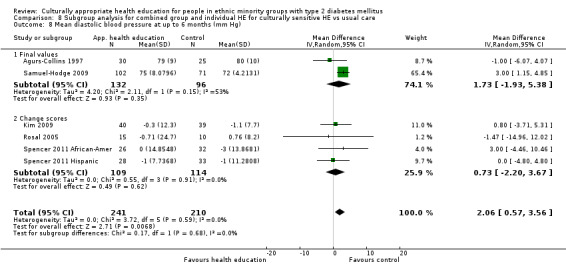
Comparison 8 Subgroup analysis for combined group and individual HE for culturally sensitive HE vs usual care, Outcome 8 Mean diastolic blood pressure at up to 6 months (mm Hg).
8.9. Analysis.
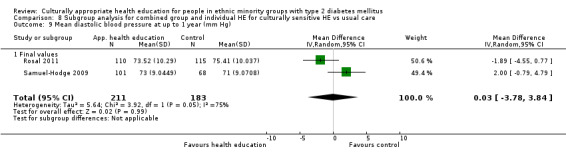
Comparison 8 Subgroup analysis for combined group and individual HE for culturally sensitive HE vs usual care, Outcome 9 Mean diastolic blood pressure at up to 1 year (mm Hg).
8.10. Analysis.
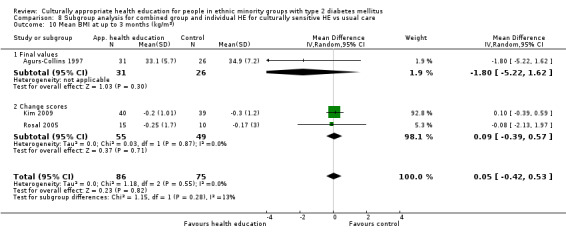
Comparison 8 Subgroup analysis for combined group and individual HE for culturally sensitive HE vs usual care, Outcome 10 Mean BMI at up to 3 months (kg/m2).
8.11. Analysis.
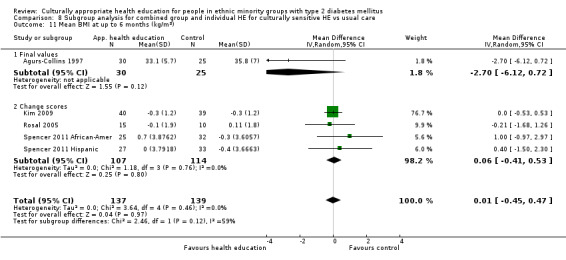
Comparison 8 Subgroup analysis for combined group and individual HE for culturally sensitive HE vs usual care, Outcome 11 Mean BMI at up to 6 months (kg/m2).
8.12. Analysis.
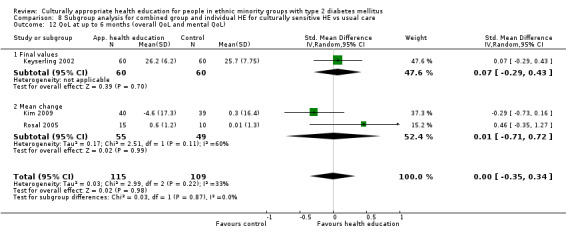
Comparison 8 Subgroup analysis for combined group and individual HE for culturally sensitive HE vs usual care, Outcome 12 QoL at up to 6 months (overall QoL and mental QoL).
8.13. Analysis.
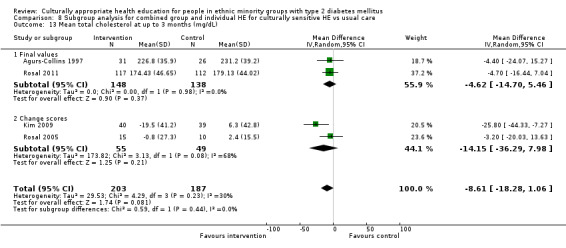
Comparison 8 Subgroup analysis for combined group and individual HE for culturally sensitive HE vs usual care, Outcome 13 Mean total cholesterol at up to 3 months (mg/dL).
8.14. Analysis.
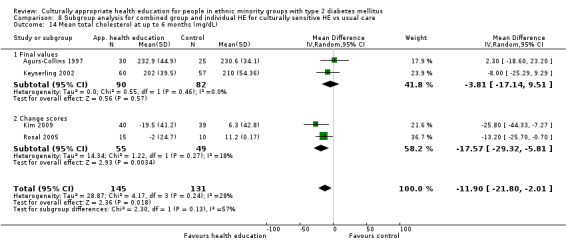
Comparison 8 Subgroup analysis for combined group and individual HE for culturally sensitive HE vs usual care, Outcome 14 Mean total cholesterol at up to 6 months (mg/dL).
8.15. Analysis.
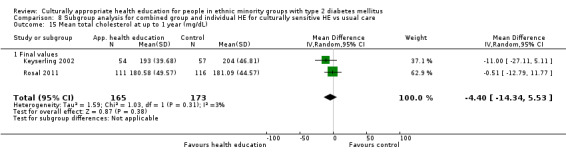
Comparison 8 Subgroup analysis for combined group and individual HE for culturally sensitive HE vs usual care, Outcome 15 Mean total cholesterol at up to 1 year (mg/dL).
8.16. Analysis.
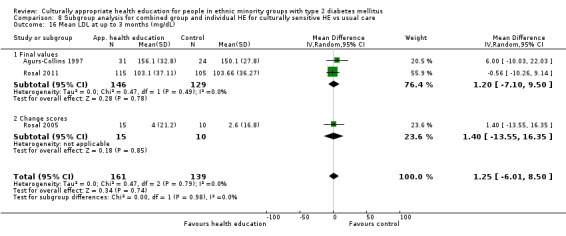
Comparison 8 Subgroup analysis for combined group and individual HE for culturally sensitive HE vs usual care, Outcome 16 Mean LDL at up to 3 months (mg/dL).
8.17. Analysis.
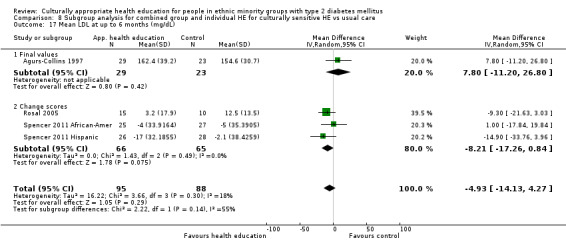
Comparison 8 Subgroup analysis for combined group and individual HE for culturally sensitive HE vs usual care, Outcome 17 Mean LDL at up to 6 months (mg/dL).
8.18. Analysis.
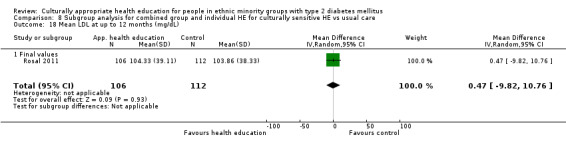
Comparison 8 Subgroup analysis for combined group and individual HE for culturally sensitive HE vs usual care, Outcome 18 Mean LDL at up to 12 months (mg/dL).
8.19. Analysis.
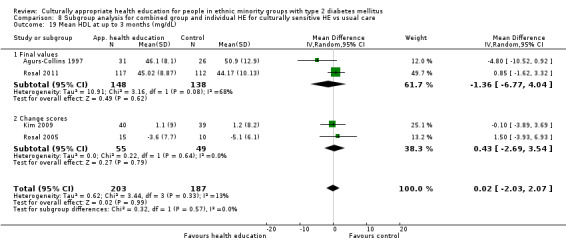
Comparison 8 Subgroup analysis for combined group and individual HE for culturally sensitive HE vs usual care, Outcome 19 Mean HDL at up to 3 months (mg/dL).
8.20. Analysis.
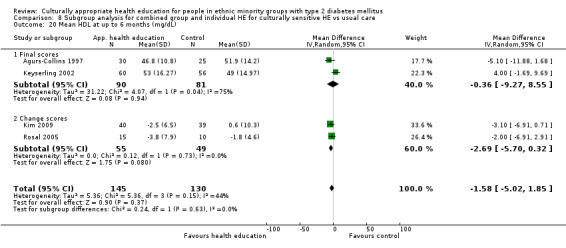
Comparison 8 Subgroup analysis for combined group and individual HE for culturally sensitive HE vs usual care, Outcome 20 Mean HDL at up to 6 months (mg/dL).
8.21. Analysis.
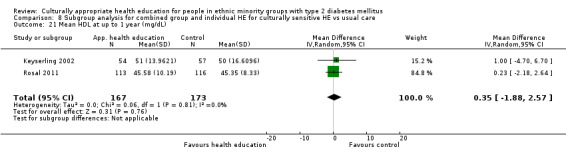
Comparison 8 Subgroup analysis for combined group and individual HE for culturally sensitive HE vs usual care, Outcome 21 Mean HDL at up to 1 year (mg/dL).
8.22. Analysis.
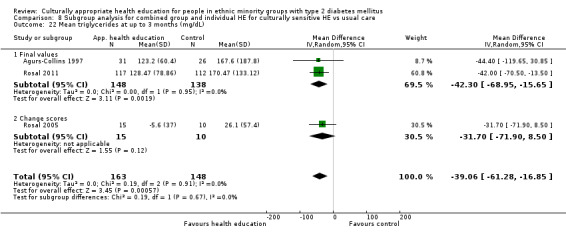
Comparison 8 Subgroup analysis for combined group and individual HE for culturally sensitive HE vs usual care, Outcome 22 Mean triglycerides at up to 3 months (mg/dL).
8.23. Analysis.
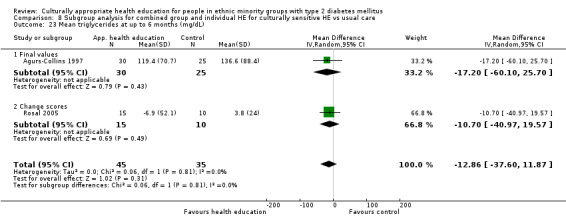
Comparison 8 Subgroup analysis for combined group and individual HE for culturally sensitive HE vs usual care, Outcome 23 Mean triglycerides at up to 6 months (mg/dL).
8.24. Analysis.
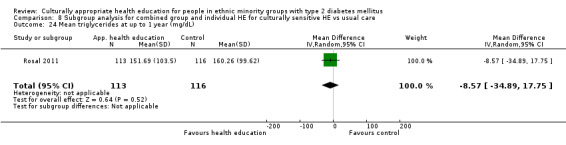
Comparison 8 Subgroup analysis for combined group and individual HE for culturally sensitive HE vs usual care, Outcome 24 Mean triglycerides at up to 1 year (mg/dL).
8.25. Analysis.
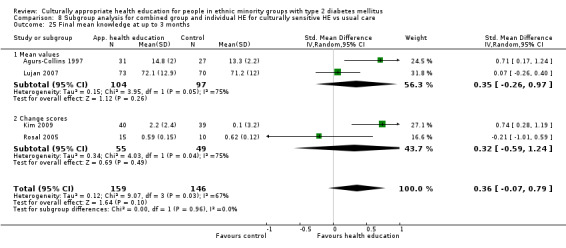
Comparison 8 Subgroup analysis for combined group and individual HE for culturally sensitive HE vs usual care, Outcome 25 Final mean knowledge at up to 3 months.
8.26. Analysis.
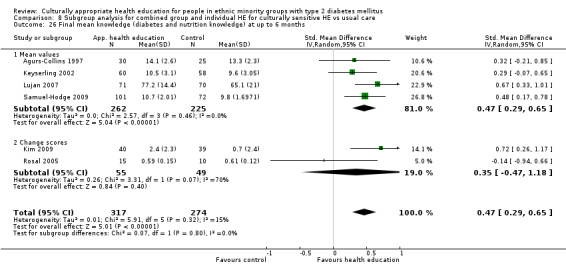
Comparison 8 Subgroup analysis for combined group and individual HE for culturally sensitive HE vs usual care, Outcome 26 Final mean knowledge (diabetes and nutrition knowledge) at up to 6 months.
8.27. Analysis.
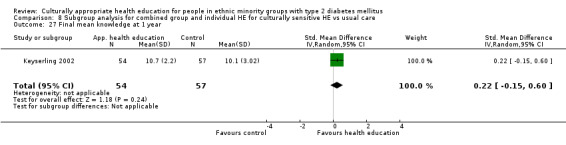
Comparison 8 Subgroup analysis for combined group and individual HE for culturally sensitive HE vs usual care, Outcome 27 Final mean knowledge at 1 year.
8.28. Analysis.
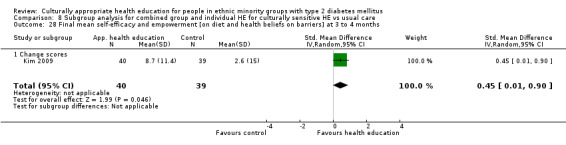
Comparison 8 Subgroup analysis for combined group and individual HE for culturally sensitive HE vs usual care, Outcome 28 Final mean self‐efficacy and empowerment [on diet and health beliefs on barriers] at 3 to 4 months.
8.29. Analysis.
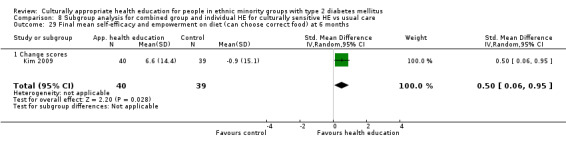
Comparison 8 Subgroup analysis for combined group and individual HE for culturally sensitive HE vs usual care, Outcome 29 Final mean self‐efficacy and empowerment on diet (can choose correct food) at 6 months.
8.30. Analysis.
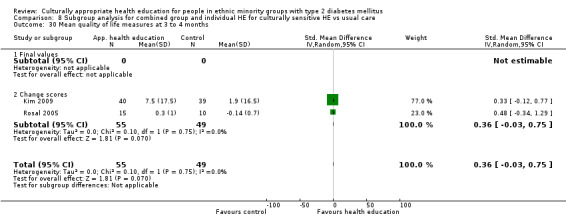
Comparison 8 Subgroup analysis for combined group and individual HE for culturally sensitive HE vs usual care, Outcome 30 Mean quality of life measures at 3 to 4 months.
8.31. Analysis.
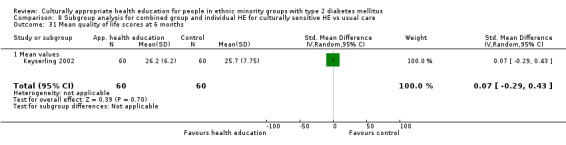
Comparison 8 Subgroup analysis for combined group and individual HE for culturally sensitive HE vs usual care, Outcome 31 Mean quality of life scores at 6 months.
8.32. Analysis.
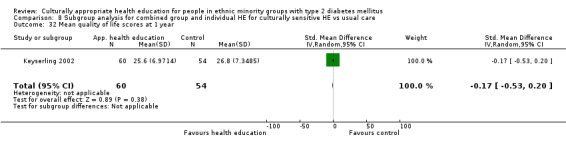
Comparison 8 Subgroup analysis for combined group and individual HE for culturally sensitive HE vs usual care, Outcome 32 Mean quality of life scores at 1 year.
8.33. Analysis.
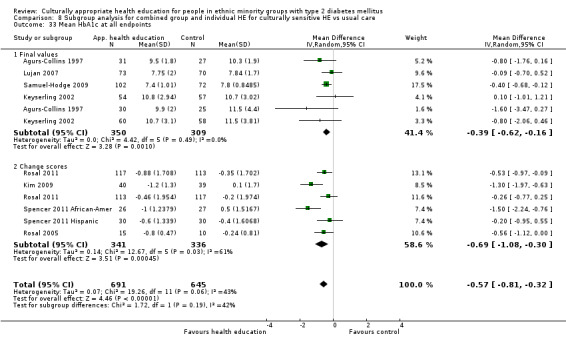
Comparison 8 Subgroup analysis for combined group and individual HE for culturally sensitive HE vs usual care, Outcome 33 Mean HbA1c at all endpoints.
8.34. Analysis.
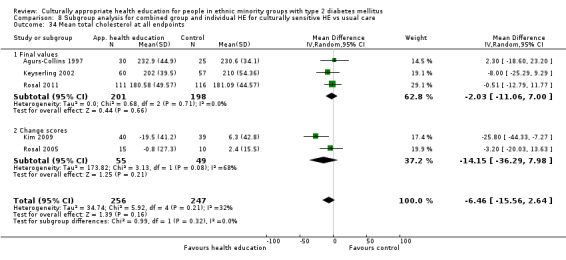
Comparison 8 Subgroup analysis for combined group and individual HE for culturally sensitive HE vs usual care, Outcome 34 Mean total cholesterol at all endpoints.
Comparison 9. Subgroup analysis of studies involving a link worker or community worker in the intervention HE.
| Outcome or subgroup title | No. of studies | No. of participants | Statistical method | Effect size |
|---|---|---|---|---|
| 1 HbA1c at 3 months | 7 | 876 | Mean Difference (IV, Random, 95% CI) | ‐0.36 [‐0.59, ‐0.13] |
| 1.1 Mean HbA1c | 5 | 621 | Mean Difference (IV, Random, 95% CI) | ‐0.22 [‐0.53, 0.08] |
| 1.2 Change HbA1c | 2 | 255 | Mean Difference (IV, Random, 95% CI) | ‐0.54 [‐0.89, ‐0.20] |
| 2 Mean HbA1c at up to 6 months | 9 | 1271 | Mean Difference (IV, Random, 95% CI) | ‐0.58 [‐0.89, ‐0.27] |
| 2.1 Final values | 4 | 677 | Mean Difference (IV, Random, 95% CI) | ‐0.65 [‐1.19, ‐0.10] |
| 2.2 Change HbA1c | 5 | 594 | Mean Difference (IV, Random, 95% CI) | ‐0.55 [‐0.97, ‐0.13] |
| 3 Mean HbA1c at up to 1 year | 6 | 1164 | Mean Difference (IV, Random, 95% CI) | ‐0.33 [‐0.59, ‐0.07] |
| 3.1 Final values | 4 | 609 | Mean Difference (IV, Random, 95% CI) | ‐0.55 [‐0.85, ‐0.24] |
| 3.2 Change scores | 2 | 555 | Mean Difference (IV, Random, 95% CI) | ‐0.10 [‐0.37, 0.18] |
| 4 Mean HbA1c at 24 months | 4 | 2268 | Mean Difference (IV, Random, 95% CI) | ‐0.33 [‐0.61, ‐0.06] |
| 4.1 Mean value | 2 | 253 | Mean Difference (IV, Random, 95% CI) | ‐0.71 [‐1.07, ‐0.35] |
| 4.2 Change value | 2 | 2015 | Mean Difference (IV, Random, 95% CI) | ‐0.16 [‐0.31, ‐0.02] |
| 5 Mean BMI at up to 3 months (kg/m2) | 2 | 42 | Mean Difference (IV, Random, 95% CI) | ‐0.12 [‐1.85, 1.61] |
| 5.1 Final values | 1 | 17 | Mean Difference (IV, Random, 95% CI) | ‐0.23 [‐3.46, 3.00] |
| 5.2 Change score | 1 | 25 | Mean Difference (IV, Random, 95% CI) | ‐0.08 [‐2.13, 1.97] |
| 6 BMI at 6 months | 4 | 246 | Mean Difference (IV, Random, 95% CI) | ‐0.38 [‐0.78, 0.03] |
| 6.1 Mean value | 0 | 0 | Mean Difference (IV, Random, 95% CI) | 0.0 [0.0, 0.0] |
| 6.2 Change value | 4 | 246 | Mean Difference (IV, Random, 95% CI) | ‐0.38 [‐0.78, 0.03] |
| 7 Mean systolic blood pressure at up to 3 months (mm Hg) | 2 | 252 | Mean Difference (IV, Random, 95% CI) | ‐1.32 [‐7.67, 5.03] |
| 7.1 Final values | 1 | 227 | Mean Difference (IV, Random, 95% CI) | ‐3.29 [‐8.02, 1.44] |
| 7.2 Change scores | 1 | 25 | Mean Difference (IV, Random, 95% CI) | 4.0 [‐6.77, 14.77] |
| 8 Systolic blood pressure at 6 months | 4 | 248 | Mean Difference (IV, Random, 95% CI) | 1.27 [‐1.76, 4.30] |
| 8.1 Mean value | 0 | 0 | Mean Difference (IV, Random, 95% CI) | 0.0 [0.0, 0.0] |
| 8.2 Change scores | 4 | 248 | Mean Difference (IV, Random, 95% CI) | 1.27 [‐1.76, 4.30] |
| 9 Mean systolic blood pressure at up to 1 year (mm Hg) | 1 | 225 | Mean Difference (IV, Random, 95% CI) | ‐2.43 [‐7.23, 2.37] |
| 9.1 Final values | 1 | 225 | Mean Difference (IV, Random, 95% CI) | ‐2.43 [‐7.23, 2.37] |
| 10 Mean diastolic blood pressure at up to 3 months (mm Hg) | 2 | 252 | Mean Difference (IV, Random, 95% CI) | ‐2.02 [‐4.39, 0.35] |
| 10.1 Final values | 1 | 227 | Mean Difference (IV, Random, 95% CI) | ‐1.91 [‐4.42, 0.60] |
| 10.2 Change scores | 1 | 25 | Mean Difference (IV, Random, 95% CI) | ‐2.87 [‐9.97, 4.23] |
| 11 Diastolic blood pressure at 6 months | 4 | 248 | Mean Difference (IV, Random, 95% CI) | 1.55 [‐0.70, 3.81] |
| 11.1 Mean values | 0 | 0 | Mean Difference (IV, Random, 95% CI) | 0.0 [0.0, 0.0] |
| 11.2 Change scores | 4 | 248 | Mean Difference (IV, Random, 95% CI) | 1.55 [‐0.70, 3.81] |
| 12 Mean diastolic blood pressure at up to 1 year (mm Hg) | 1 | 225 | Mean Difference (IV, Random, 95% CI) | ‐1.89 [‐4.55, 0.77] |
| 12.1 Final values | 1 | 225 | Mean Difference (IV, Random, 95% CI) | ‐1.89 [‐4.55, 0.77] |
| 13 Mean total cholesterol at up to 3 months (mg/dL) | 3 | 399 | Mean Difference (IV, Random, 95% CI) | ‐4.05 [‐12.05, 3.95] |
| 13.1 Final values | 2 | 374 | Mean Difference (IV, Random, 95% CI) | ‐4.30 [‐13.40, 4.80] |
| 13.2 Change scores | 1 | 25 | Mean Difference (IV, Random, 95% CI) | ‐3.2 [‐20.03, 13.63] |
| 14 Mean total cholesterol at up to 6 months (mg/dL) | 5 | 668 | Mean Difference (IV, Random, 95% CI) | 0.14 [‐8.97, 9.26] |
| 14.1 Final values | 3 | 539 | Mean Difference (IV, Random, 95% CI) | 1.30 [‐6.67, 9.27] |
| 14.2 Change scores | 2 | 129 | Mean Difference (IV, Random, 95% CI) | ‐1.21 [‐22.89, 20.48] |
| 15 Mean total cholesterol at up to 1 year (mg/dL) | 5 | 1019 | Mean Difference (IV, Random, 95% CI) | ‐0.39 [‐0.64, ‐0.14] |
| 15.1 Final values | 4 | 694 | Mean Difference (IV, Random, 95% CI) | ‐1.89 [‐8.41, 4.64] |
| 15.2 Change scores | 1 | 325 | Mean Difference (IV, Random, 95% CI) | ‐0.39 [‐0.64, ‐0.14] |
| 16 LDL cholesterol at 6 months | 3 | 210 | Mean Difference (IV, Random, 95% CI) | ‐4.32 [‐13.46, 4.81] |
| 16.1 Mean value | 0 | 0 | Mean Difference (IV, Random, 95% CI) | 0.0 [0.0, 0.0] |
| 16.2 Change scores | 3 | 210 | Mean Difference (IV, Random, 95% CI) | ‐4.32 [‐13.46, 4.81] |
| 17 Mean HDL cholesterol at 6 months | 2 | 220 | Mean Difference (IV, Random, 95% CI) | 3.37 [‐0.10, 6.84] |
| 17.1 Mean values | 1 | 116 | Mean Difference (IV, Random, 95% CI) | 4.0 [‐1.69, 9.69] |
| 17.2 Change scores | 1 | 104 | Mean Difference (IV, Random, 95% CI) | 3.0 [‐1.38, 7.38] |
| 18 Mean HDL at up to 1 year (mg/dL) | 1 | 111 | Mean Difference (IV, Random, 95% CI) | 1.0 [‐4.70, 6.70] |
| 19 Mean triglycerides at up to 3 months (mg/dL) | 2 | 254 | Mean Difference (IV, Random, 95% CI) | ‐38.56 [‐61.80, ‐15.31] |
| 19.1 Final values | 1 | 229 | Mean Difference (IV, Random, 95% CI) | ‐42.0 [‐70.50, ‐13.50] |
| 19.2 Change scores | 1 | 25 | Mean Difference (IV, Random, 95% CI) | ‐31.70 [‐71.90, 8.50] |
| 20 Mean triglycerides at up to 6 months (mg/dL) | 2 | 129 | Mean Difference (IV, Random, 95% CI) | 16.47 [‐39.98, 72.91] |
| 20.1 Change scores | 2 | 129 | Mean Difference (IV, Random, 95% CI) | 16.47 [‐39.98, 72.91] |
| 21 Mean triglycerides at up to 1 year (mg/dL) | 1 | 229 | Mean Difference (IV, Random, 95% CI) | ‐8.57 [‐34.89, 17.75] |
| 22 Final mean self‐efficacy and empowerment [on diet and health beliefs on barriers] at up to 3 months | 1 | 17 | Std. Mean Difference (IV, Random, 95% CI) | 0.03 [‐0.92, 0.98] |
| 22.1 Final values | 1 | 17 | Std. Mean Difference (IV, Random, 95% CI) | 0.03 [‐0.92, 0.98] |
| 23 Final mean self‐efficacy and empowerment on diet (can choose correct food) at 6 months | 1 | Std. Mean Difference (IV, Random, 95% CI) | Totals not selected | |
| 23.1 Final values | 1 | Std. Mean Difference (IV, Random, 95% CI) | 0.0 [0.0, 0.0] | |
| 24 Diabetes knowledge at 3 months | 5 | 533 | Std. Mean Difference (IV, Random, 95% CI) | 0.29 [0.04, 0.53] |
| 24.1 Final values | 4 | 508 | Std. Mean Difference (IV, Random, 95% CI) | 0.33 [0.09, 0.57] |
| 24.2 Change score | 1 | 25 | Std. Mean Difference (IV, Random, 95% CI) | ‐0.21 [‐1.01, 0.59] |
| 25 Mean knowledge (diabetes and nutrition knowledge) at up to 6 months | 5 | 607 | Std. Mean Difference (IV, Random, 95% CI) | 0.55 [0.29, 0.80] |
| 25.1 Final values | 4 | 582 | Std. Mean Difference (IV, Random, 95% CI) | 0.61 [0.39, 0.84] |
| 25.2 Change scores | 1 | 25 | Std. Mean Difference (IV, Random, 95% CI) | ‐0.14 [‐0.94, 0.66] |
| 26 Final mean knowledge at 1 year | 2 | 328 | Std. Mean Difference (IV, Random, 95% CI) | 0.35 [0.13, 0.57] |
| 27 Mean quality of life measures at 3 to 4 months | 1 | 25 | Mean Difference (IV, Random, 95% CI) | 0.44 [‐0.23, 1.11] |
| 27.1 Final values | 0 | 0 | Mean Difference (IV, Random, 95% CI) | 0.0 [0.0, 0.0] |
| 27.2 Change scores | 1 | 25 | Mean Difference (IV, Random, 95% CI) | 0.44 [‐0.23, 1.11] |
| 28 Mean quality of life scores at 6 months | 2 | 145 | Mean Difference (IV, Random, 95% CI) | 0.58 [‐0.36, 1.51] |
| 28.1 Mean values | 1 | 120 | Mean Difference (IV, Random, 95% CI) | 0.5 [‐2.01, 3.01] |
| 28.2 Change scores | 1 | 25 | Mean Difference (IV, Random, 95% CI) | 0.59 [‐0.42, 1.60] |
| 29 Mean quality of life scores at 1 year | 1 | 114 | Mean Difference (IV, Random, 95% CI) | ‐1.20 [‐3.84, 1.44] |
| 30 Acute hospital admissions at 24 months | 1 | 542 | Odds Ratio (M‐H, Random, 95% CI) | 0.13 [0.09, 0.19] |
| 31 Emergency visits at 6 months | 1 | 352 | Mean Difference (IV, Random, 95% CI) | ‐0.03 [‐0.21, 0.16] |
| 31.1 Change values | 1 | 352 | Mean Difference (IV, Random, 95% CI) | ‐0.03 [‐0.21, 0.16] |
9.1. Analysis.
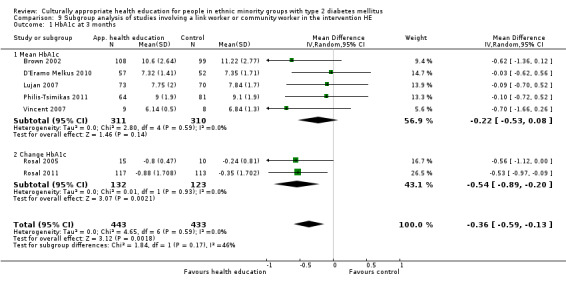
Comparison 9 Subgroup analysis of studies involving a link worker or community worker in the intervention HE, Outcome 1 HbA1c at 3 months.
9.2. Analysis.
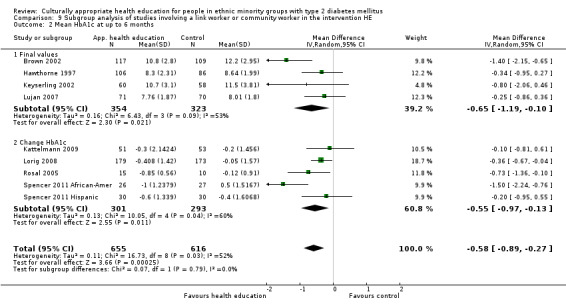
Comparison 9 Subgroup analysis of studies involving a link worker or community worker in the intervention HE, Outcome 2 Mean HbA1c at up to 6 months.
9.3. Analysis.
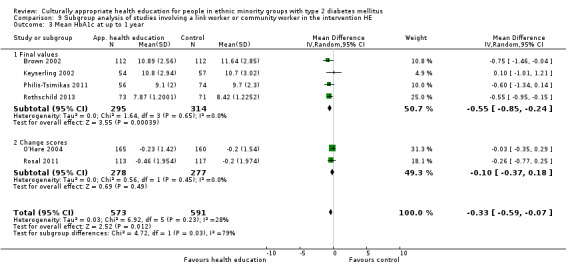
Comparison 9 Subgroup analysis of studies involving a link worker or community worker in the intervention HE, Outcome 3 Mean HbA1c at up to 1 year.
9.4. Analysis.
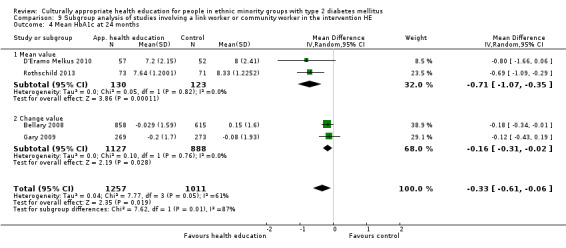
Comparison 9 Subgroup analysis of studies involving a link worker or community worker in the intervention HE, Outcome 4 Mean HbA1c at 24 months.
9.5. Analysis.
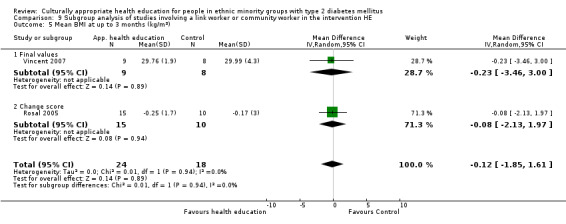
Comparison 9 Subgroup analysis of studies involving a link worker or community worker in the intervention HE, Outcome 5 Mean BMI at up to 3 months (kg/m2).
9.6. Analysis.
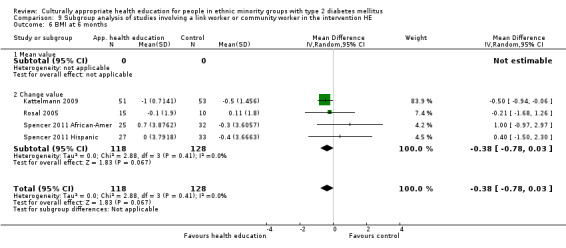
Comparison 9 Subgroup analysis of studies involving a link worker or community worker in the intervention HE, Outcome 6 BMI at 6 months.
9.7. Analysis.

Comparison 9 Subgroup analysis of studies involving a link worker or community worker in the intervention HE, Outcome 7 Mean systolic blood pressure at up to 3 months (mm Hg).
9.8. Analysis.
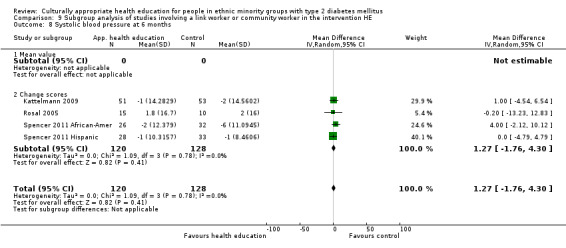
Comparison 9 Subgroup analysis of studies involving a link worker or community worker in the intervention HE, Outcome 8 Systolic blood pressure at 6 months.
9.9. Analysis.
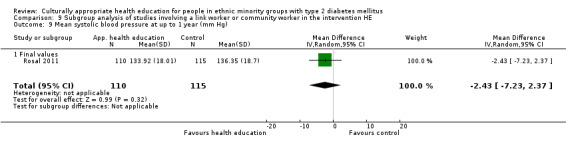
Comparison 9 Subgroup analysis of studies involving a link worker or community worker in the intervention HE, Outcome 9 Mean systolic blood pressure at up to 1 year (mm Hg).
9.10. Analysis.
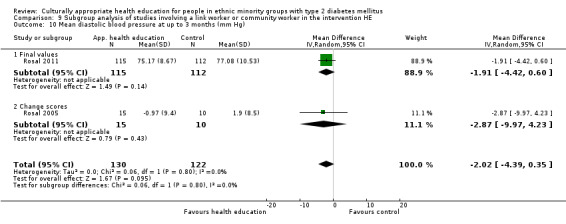
Comparison 9 Subgroup analysis of studies involving a link worker or community worker in the intervention HE, Outcome 10 Mean diastolic blood pressure at up to 3 months (mm Hg).
9.11. Analysis.
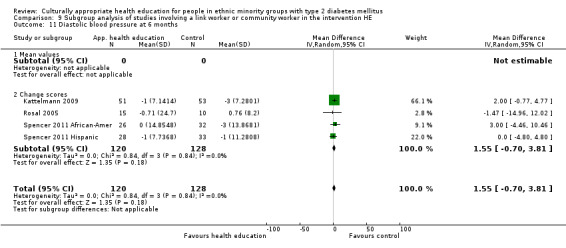
Comparison 9 Subgroup analysis of studies involving a link worker or community worker in the intervention HE, Outcome 11 Diastolic blood pressure at 6 months.
9.12. Analysis.

Comparison 9 Subgroup analysis of studies involving a link worker or community worker in the intervention HE, Outcome 12 Mean diastolic blood pressure at up to 1 year (mm Hg).
9.13. Analysis.
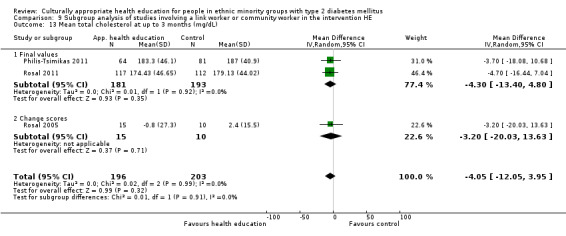
Comparison 9 Subgroup analysis of studies involving a link worker or community worker in the intervention HE, Outcome 13 Mean total cholesterol at up to 3 months (mg/dL).
9.14. Analysis.
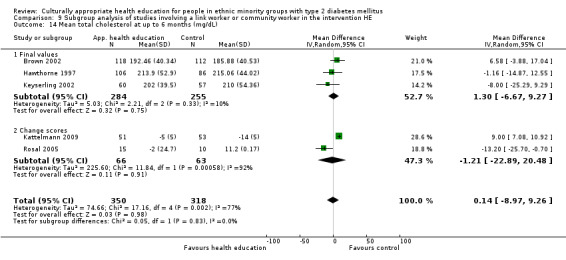
Comparison 9 Subgroup analysis of studies involving a link worker or community worker in the intervention HE, Outcome 14 Mean total cholesterol at up to 6 months (mg/dL).
9.15. Analysis.
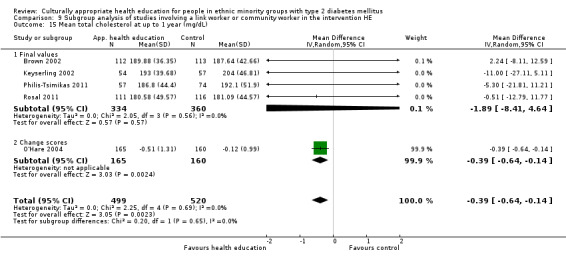
Comparison 9 Subgroup analysis of studies involving a link worker or community worker in the intervention HE, Outcome 15 Mean total cholesterol at up to 1 year (mg/dL).
9.16. Analysis.
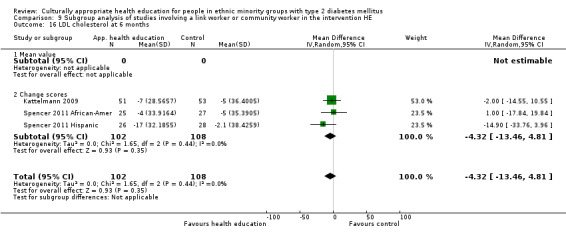
Comparison 9 Subgroup analysis of studies involving a link worker or community worker in the intervention HE, Outcome 16 LDL cholesterol at 6 months.
9.17. Analysis.
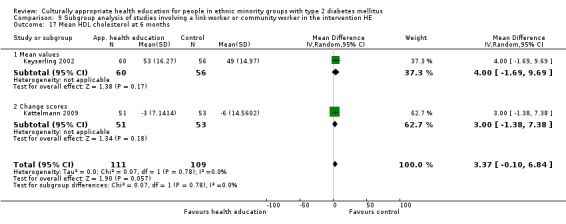
Comparison 9 Subgroup analysis of studies involving a link worker or community worker in the intervention HE, Outcome 17 Mean HDL cholesterol at 6 months.
9.18. Analysis.
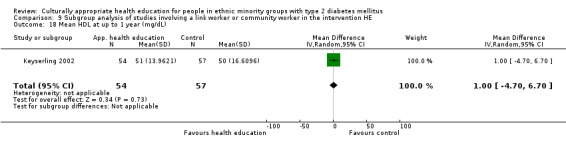
Comparison 9 Subgroup analysis of studies involving a link worker or community worker in the intervention HE, Outcome 18 Mean HDL at up to 1 year (mg/dL).
9.19. Analysis.
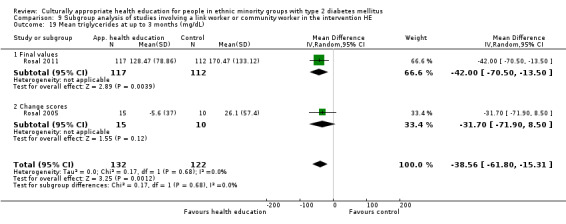
Comparison 9 Subgroup analysis of studies involving a link worker or community worker in the intervention HE, Outcome 19 Mean triglycerides at up to 3 months (mg/dL).
9.20. Analysis.
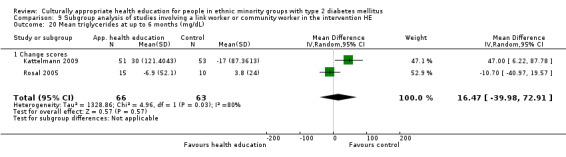
Comparison 9 Subgroup analysis of studies involving a link worker or community worker in the intervention HE, Outcome 20 Mean triglycerides at up to 6 months (mg/dL).
9.21. Analysis.
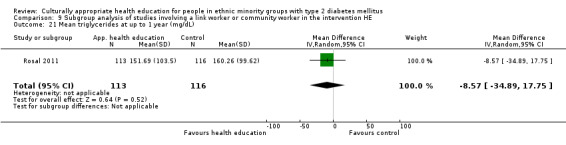
Comparison 9 Subgroup analysis of studies involving a link worker or community worker in the intervention HE, Outcome 21 Mean triglycerides at up to 1 year (mg/dL).
9.22. Analysis.
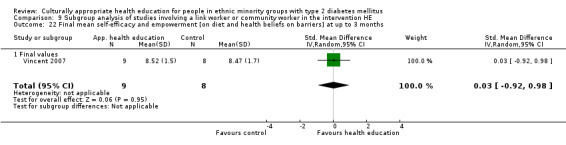
Comparison 9 Subgroup analysis of studies involving a link worker or community worker in the intervention HE, Outcome 22 Final mean self‐efficacy and empowerment [on diet and health beliefs on barriers] at up to 3 months.
9.23. Analysis.
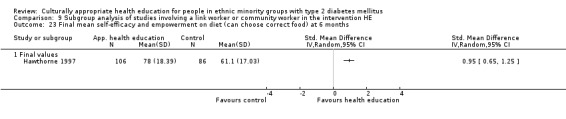
Comparison 9 Subgroup analysis of studies involving a link worker or community worker in the intervention HE, Outcome 23 Final mean self‐efficacy and empowerment on diet (can choose correct food) at 6 months.
9.24. Analysis.
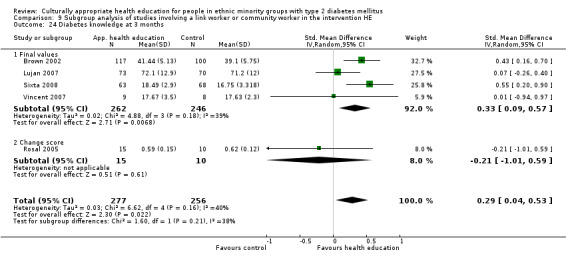
Comparison 9 Subgroup analysis of studies involving a link worker or community worker in the intervention HE, Outcome 24 Diabetes knowledge at 3 months.
9.25. Analysis.
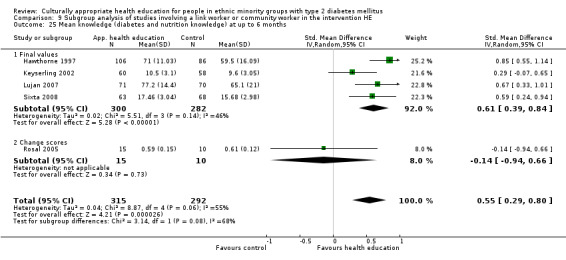
Comparison 9 Subgroup analysis of studies involving a link worker or community worker in the intervention HE, Outcome 25 Mean knowledge (diabetes and nutrition knowledge) at up to 6 months.
9.26. Analysis.
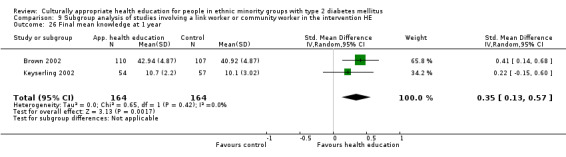
Comparison 9 Subgroup analysis of studies involving a link worker or community worker in the intervention HE, Outcome 26 Final mean knowledge at 1 year.
9.27. Analysis.
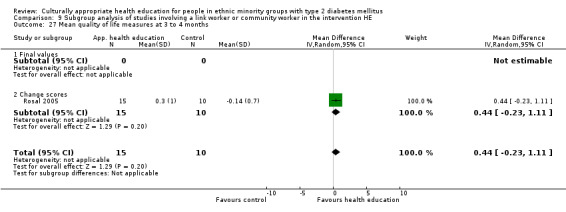
Comparison 9 Subgroup analysis of studies involving a link worker or community worker in the intervention HE, Outcome 27 Mean quality of life measures at 3 to 4 months.
9.28. Analysis.
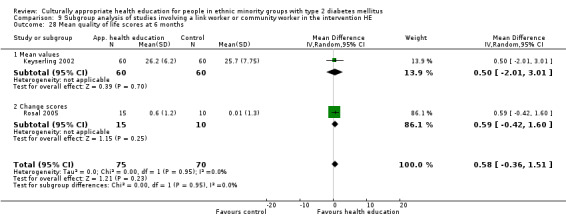
Comparison 9 Subgroup analysis of studies involving a link worker or community worker in the intervention HE, Outcome 28 Mean quality of life scores at 6 months.
9.29. Analysis.
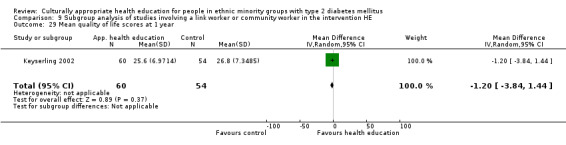
Comparison 9 Subgroup analysis of studies involving a link worker or community worker in the intervention HE, Outcome 29 Mean quality of life scores at 1 year.
9.30. Analysis.
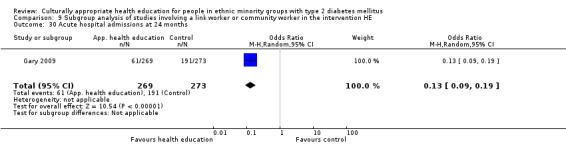
Comparison 9 Subgroup analysis of studies involving a link worker or community worker in the intervention HE, Outcome 30 Acute hospital admissions at 24 months.
9.31. Analysis.
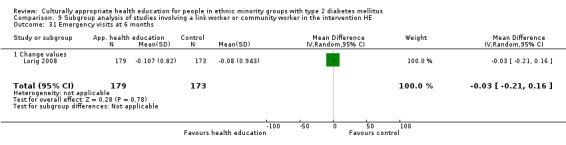
Comparison 9 Subgroup analysis of studies involving a link worker or community worker in the intervention HE, Outcome 31 Emergency visits at 6 months.
Comparison 10. Subgroup analysis of studies involving a nurse in the intervention HE.
| Outcome or subgroup title | No. of studies | No. of participants | Statistical method | Effect size |
|---|---|---|---|---|
| 1 Mean HbA1c at up to 3 months | 6 | 684 | Mean Difference (IV, Random, 95% CI) | ‐0.49 [‐0.96, ‐0.03] |
| 1.1 Final values | 4 | 580 | Mean Difference (IV, Random, 95% CI) | ‐0.18 [‐0.61, 0.25] |
| 1.2 Change scores | 2 | 104 | Mean Difference (IV, Random, 95% CI) | ‐0.91 [‐1.63, ‐0.18] |
| 2 Mean HbA1c at up to 6 months | 4 | 443 | Mean Difference (IV, Random, 95% CI) | ‐0.78 [‐1.18, ‐0.39] |
| 2.1 Final values | 1 | 226 | Mean Difference (IV, Random, 95% CI) | ‐1.40 [‐2.15, ‐0.65] |
| 2.2 Change scores | 3 | 217 | Mean Difference (IV, Random, 95% CI) | ‐0.59 [‐0.86, ‐0.31] |
| 3 Mean HbA1c at up to 1 year | 3 | 901 | Mean Difference (IV, Random, 95% CI) | ‐0.16 [‐0.44, 0.12] |
| 3.1 Final values | 2 | 576 | Mean Difference (IV, Random, 95% CI) | ‐0.34 [‐0.95, 0.28] |
| 3.2 Change scores | 1 | 325 | Mean Difference (IV, Random, 95% CI) | ‐0.03 [‐0.35, 0.29] |
| 4 Mean HbA1c at 24 months | 3 | 2124 | Mean Difference (IV, Random, 95% CI) | ‐0.18 [‐0.34, ‐0.02] |
| 4.1 Mean value | 1 | 109 | Mean Difference (IV, Random, 95% CI) | ‐0.80 [‐1.66, 0.06] |
| 4.2 Change value | 2 | 2015 | Mean Difference (IV, Random, 95% CI) | ‐0.16 [‐0.31, ‐0.02] |
| 5 Mean systolic blood pressure at up to 3 months (mm Hg) | 3 | 326 | Mean Difference (IV, Random, 95% CI) | 2.56 [‐1.56, 6.67] |
| 5.1 Final values | 1 | 222 | Mean Difference (IV, Random, 95% CI) | 3.5 [‐2.37, 9.37] |
| 5.2 Change scores | 2 | 104 | Mean Difference (IV, Random, 95% CI) | 1.64 [‐4.12, 7.41] |
| 6 Mean systolic blood pressure at up to 6 months (mm Hg) | 2 | 104 | Mean Difference (IV, Random, 95% CI) | 2.41 [‐4.42, 9.24] |
| 6.1 Change scores | 2 | 104 | Mean Difference (IV, Random, 95% CI) | 2.41 [‐4.42, 9.24] |
| 7 Mean diastolic blood pressure at up to 3 months (mm Hg) | 3 | 324 | Mean Difference (IV, Random, 95% CI) | ‐0.06 [‐2.60, 2.48] |
| 7.1 Final values | 1 | 220 | Mean Difference (IV, Random, 95% CI) | 1.5 [‐2.14, 5.14] |
| 7.2 Change scores | 2 | 104 | Mean Difference (IV, Random, 95% CI) | ‐1.54 [‐5.10, 2.01] |
| 8 Mean diastolic blood pressure at up to 6 months (mm Hg) | 2 | 104 | Mean Difference (IV, Random, 95% CI) | 0.57 [‐3.71, 4.85] |
| 8.1 Change scores | 2 | 104 | Mean Difference (IV, Random, 95% CI) | 0.57 [‐3.71, 4.85] |
| 9 Mean BMI at up to 3 months (kg/m2) | 3 | 323 | Mean Difference (IV, Random, 95% CI) | 0.03 [‐0.43, 0.48] |
| 9.1 Final values | 1 | 219 | Mean Difference (IV, Random, 95% CI) | ‐0.83 [‐2.56, 0.90] |
| 9.2 Change scores | 2 | 104 | Mean Difference (IV, Random, 95% CI) | 0.09 [‐0.39, 0.57] |
| 10 Mean BMI at up to 6 months (kg/m2) | 3 | 331 | Mean Difference (IV, Random, 95% CI) | ‐0.09 [‐0.56, 0.39] |
| 10.1 Final values | 1 | 227 | Mean Difference (IV, Random, 95% CI) | ‐0.77 [‐2.43, 0.89] |
| 10.2 Change scores | 2 | 104 | Mean Difference (IV, Random, 95% CI) | ‐0.02 [‐0.52, 0.47] |
| 11 Mean total cholesterol at up to 3 months (mg/dL) | 4 | 536 | Mean Difference (IV, Random, 95% CI) | ‐6.96 [‐18.09, 4.16] |
| 11.1 Final values | 2 | 432 | Mean Difference (IV, Random, 95% CI) | ‐1.93 [‐13.05, 9.19] |
| 11.2 Change scores | 2 | 104 | Mean Difference (IV, Random, 95% CI) | ‐14.15 [‐36.29, 7.98] |
| 12 Mean total cholesterol at up to 6 months (mg/dL) | 3 | 334 | Mean Difference (IV, Random, 95% CI) | ‐11.92 [‐32.92, 9.07] |
| 12.1 Final values | 1 | 230 | Mean Difference (IV, Random, 95% CI) | 6.58 [‐3.88, 17.04] |
| 12.2 Change scores | 2 | 104 | Mean Difference (IV, Random, 95% CI) | ‐21.52 [‐39.73, ‐3.30] |
| 13 Mean total cholesterol at up to 1 year (mg/dL) | 2 | 550 | Mean Difference (IV, Random, 95% CI) | ‐0.39 [‐0.64, ‐0.14] |
| 13.1 Final values | 1 | 225 | Mean Difference (IV, Random, 95% CI) | 2.24 [‐8.11, 12.59] |
| 13.2 Change scores | 1 | 325 | Mean Difference (IV, Random, 95% CI) | ‐0.39 [‐0.64, ‐0.14] |
| 14 Mean triglycerides at up to 3 months (mg/dL) | 2 | 230 | Mean Difference (IV, Random, 95% CI) | ‐15.55 [‐40.23, 9.13] |
| 14.1 Final values | 1 | 205 | Mean Difference (IV, Random, 95% CI) | ‐5.79 [‐37.05, 25.47] |
| 14.2 Change scores | 1 | 25 | Mean Difference (IV, Random, 95% CI) | ‐31.70 [‐71.90, 8.50] |
| 15 Mean triglycerides at up to 6 months (mg/dL) | 2 | 254 | Mean Difference (IV, Random, 95% CI) | ‐24.99 [‐60.95, 10.96] |
| 15.1 Final values | 1 | 229 | Mean Difference (IV, Random, 95% CI) | ‐48.54 [‐96.10, ‐0.98] |
| 15.2 Change scores | 1 | 25 | Mean Difference (IV, Random, 95% CI) | ‐10.7 [‐40.97, 19.57] |
| 16 Final mean self‐efficacy and empowerment [on diet and health beliefs on barriers] at up to 3 months | 3 | 486 | Std. Mean Difference (IV, Random, 95% CI) | 0.21 [‐0.04, 0.47] |
| 16.1 Final mean | 2 | 407 | Std. Mean Difference (IV, Random, 95% CI) | 0.14 [‐0.14, 0.43] |
| 16.2 Change scores | 1 | 79 | Std. Mean Difference (IV, Random, 95% CI) | 0.45 [0.01, 0.90] |
| 17 Final mean self‐efficacy and empowerment on diet (can choose correct food) at 6 months | 1 | 79 | Std. Mean Difference (IV, Random, 95% CI) | 0.50 [0.06, 0.95] |
| 17.1 Change scores | 1 | 79 | Std. Mean Difference (IV, Random, 95% CI) | 0.50 [0.06, 0.95] |
| 18 Final mean knowledge at up to 3 months | 4 | 513 | Std. Mean Difference (IV, Random, 95% CI) | 0.54 [0.24, 0.84] |
| 18.1 Final values | 2 | 409 | Std. Mean Difference (IV, Random, 95% CI) | 0.60 [0.26, 0.93] |
| 18.2 Change values | 2 | 104 | Std. Mean Difference (IV, Random, 95% CI) | 0.32 [‐0.59, 1.24] |
| 19 Mean BMI at up to 12 months (kg/m2) | 1 | 227 | Mean Difference (IV, Random, 95% CI) | ‐0.11 [‐1.80, 1.58] |
| 20 Mean systolic blood pressure at up to 1 year (mm Hg) | 1 | 359 | Mean Difference (IV, Random, 95% CI) | 2.90 [‐0.84, 6.64] |
| 20.1 Final values | 1 | 359 | Mean Difference (IV, Random, 95% CI) | 2.90 [‐0.84, 6.64] |
| 21 Mean LDL at up to 12 months (mg/dL) | 1 | 341 | Mean Difference (IV, Random, 95% CI) | 1.0 [‐6.76, 8.76] |
| 22 Mean knowledge at 6 months | 2 | 104 | Mean Difference (IV, Random, 95% CI) | 0.76 [‐0.92, 2.44] |
| 22.1 Change values | 2 | 104 | Mean Difference (IV, Random, 95% CI) | 0.76 [‐0.92, 2.44] |
| 23 Mean quality of life measures at 3 to 4 months | 1 | 25 | Mean Difference (IV, Random, 95% CI) | 0.44 [‐0.23, 1.11] |
| 23.1 Final values | 0 | 0 | Mean Difference (IV, Random, 95% CI) | 0.0 [0.0, 0.0] |
| 23.2 Change scores | 1 | 25 | Mean Difference (IV, Random, 95% CI) | 0.44 [‐0.23, 1.11] |
| 24 Mean quality of life measures at up to 6 months | 1 | 25 | Std. Mean Difference (IV, Random, 95% CI) | 0.46 [‐0.35, 1.27] |
| 24.1 Mean change | 1 | 25 | Std. Mean Difference (IV, Random, 95% CI) | 0.46 [‐0.35, 1.27] |
| 25 Final mean knowledge at 1 year | 1 | 217 | Std. Mean Difference (IV, Random, 95% CI) | 0.41 [0.14, 0.68] |
10.1. Analysis.
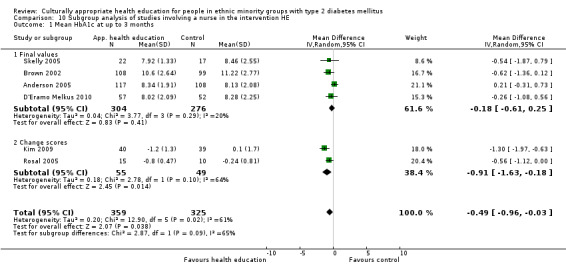
Comparison 10 Subgroup analysis of studies involving a nurse in the intervention HE, Outcome 1 Mean HbA1c at up to 3 months.
10.2. Analysis.
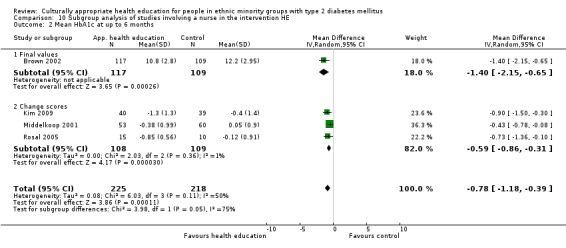
Comparison 10 Subgroup analysis of studies involving a nurse in the intervention HE, Outcome 2 Mean HbA1c at up to 6 months.
10.3. Analysis.
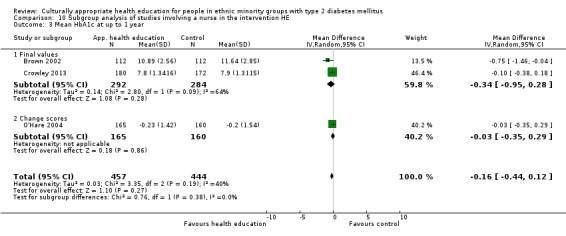
Comparison 10 Subgroup analysis of studies involving a nurse in the intervention HE, Outcome 3 Mean HbA1c at up to 1 year.
10.4. Analysis.
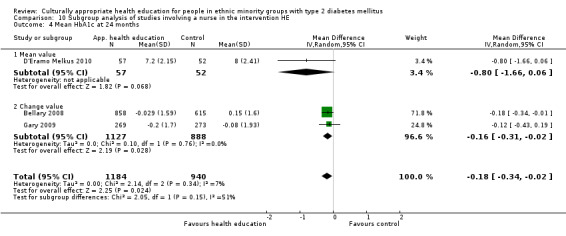
Comparison 10 Subgroup analysis of studies involving a nurse in the intervention HE, Outcome 4 Mean HbA1c at 24 months.
10.5. Analysis.
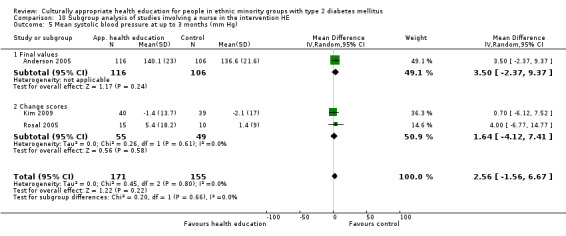
Comparison 10 Subgroup analysis of studies involving a nurse in the intervention HE, Outcome 5 Mean systolic blood pressure at up to 3 months (mm Hg).
10.6. Analysis.
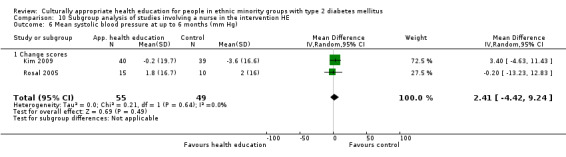
Comparison 10 Subgroup analysis of studies involving a nurse in the intervention HE, Outcome 6 Mean systolic blood pressure at up to 6 months (mm Hg).
10.7. Analysis.
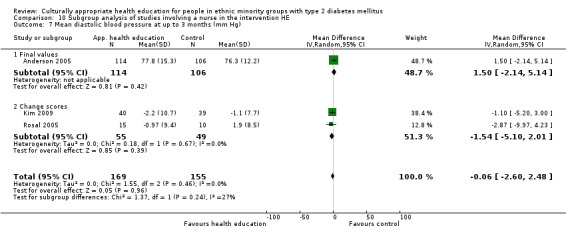
Comparison 10 Subgroup analysis of studies involving a nurse in the intervention HE, Outcome 7 Mean diastolic blood pressure at up to 3 months (mm Hg).
10.8. Analysis.
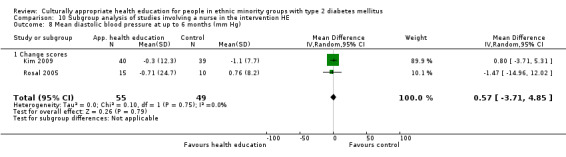
Comparison 10 Subgroup analysis of studies involving a nurse in the intervention HE, Outcome 8 Mean diastolic blood pressure at up to 6 months (mm Hg).
10.9. Analysis.
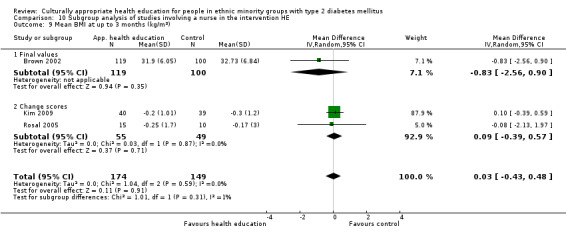
Comparison 10 Subgroup analysis of studies involving a nurse in the intervention HE, Outcome 9 Mean BMI at up to 3 months (kg/m2).
10.10. Analysis.
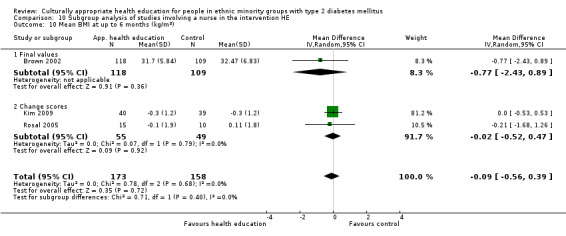
Comparison 10 Subgroup analysis of studies involving a nurse in the intervention HE, Outcome 10 Mean BMI at up to 6 months (kg/m2).
10.11. Analysis.
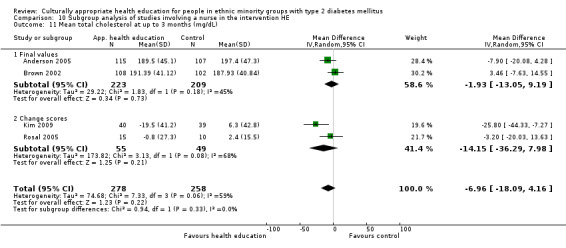
Comparison 10 Subgroup analysis of studies involving a nurse in the intervention HE, Outcome 11 Mean total cholesterol at up to 3 months (mg/dL).
10.12. Analysis.
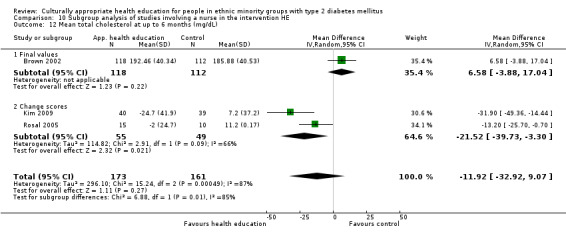
Comparison 10 Subgroup analysis of studies involving a nurse in the intervention HE, Outcome 12 Mean total cholesterol at up to 6 months (mg/dL).
10.13. Analysis.
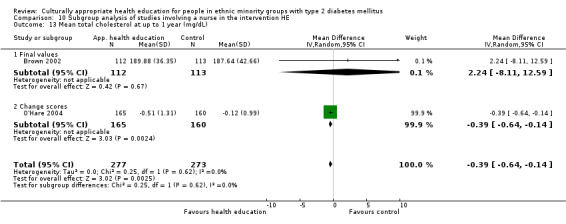
Comparison 10 Subgroup analysis of studies involving a nurse in the intervention HE, Outcome 13 Mean total cholesterol at up to 1 year (mg/dL).
10.14. Analysis.
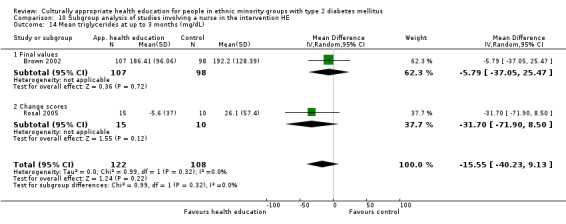
Comparison 10 Subgroup analysis of studies involving a nurse in the intervention HE, Outcome 14 Mean triglycerides at up to 3 months (mg/dL).
10.15. Analysis.
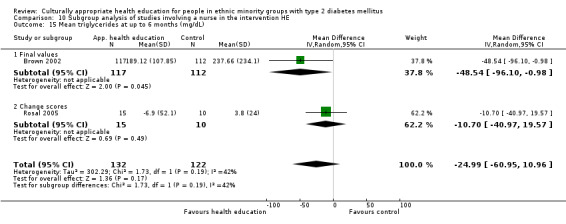
Comparison 10 Subgroup analysis of studies involving a nurse in the intervention HE, Outcome 15 Mean triglycerides at up to 6 months (mg/dL).
10.16. Analysis.
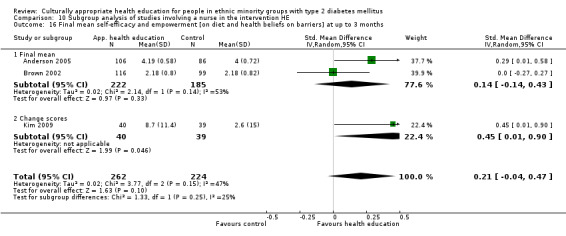
Comparison 10 Subgroup analysis of studies involving a nurse in the intervention HE, Outcome 16 Final mean self‐efficacy and empowerment [on diet and health beliefs on barriers] at up to 3 months.
10.17. Analysis.
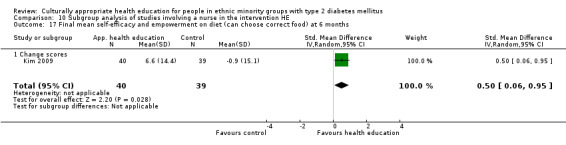
Comparison 10 Subgroup analysis of studies involving a nurse in the intervention HE, Outcome 17 Final mean self‐efficacy and empowerment on diet (can choose correct food) at 6 months.
10.18. Analysis.
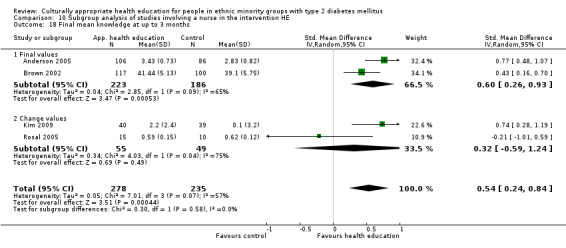
Comparison 10 Subgroup analysis of studies involving a nurse in the intervention HE, Outcome 18 Final mean knowledge at up to 3 months.
10.19. Analysis.

Comparison 10 Subgroup analysis of studies involving a nurse in the intervention HE, Outcome 19 Mean BMI at up to 12 months (kg/m2).
10.20. Analysis.
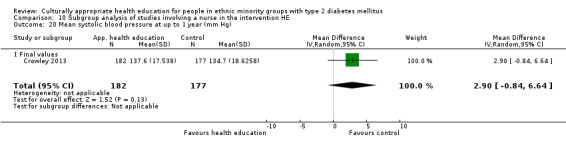
Comparison 10 Subgroup analysis of studies involving a nurse in the intervention HE, Outcome 20 Mean systolic blood pressure at up to 1 year (mm Hg).
10.21. Analysis.
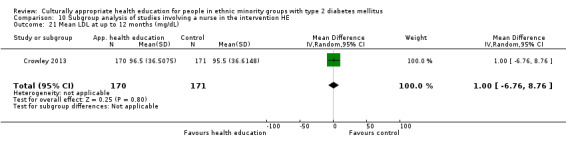
Comparison 10 Subgroup analysis of studies involving a nurse in the intervention HE, Outcome 21 Mean LDL at up to 12 months (mg/dL).
10.22. Analysis.
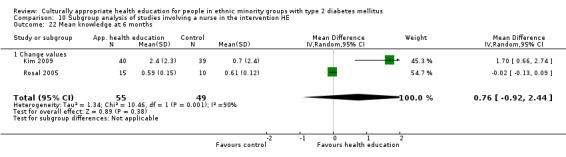
Comparison 10 Subgroup analysis of studies involving a nurse in the intervention HE, Outcome 22 Mean knowledge at 6 months.
10.23. Analysis.
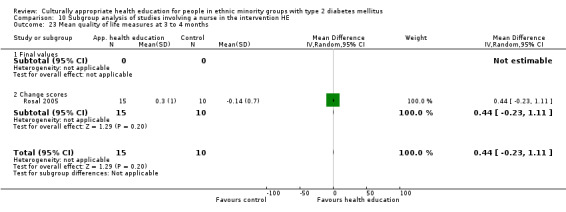
Comparison 10 Subgroup analysis of studies involving a nurse in the intervention HE, Outcome 23 Mean quality of life measures at 3 to 4 months.
10.24. Analysis.
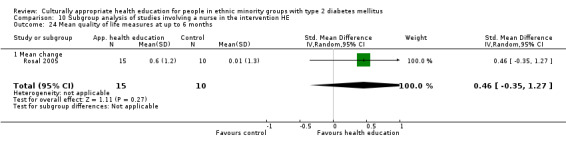
Comparison 10 Subgroup analysis of studies involving a nurse in the intervention HE, Outcome 24 Mean quality of life measures at up to 6 months.
10.25. Analysis.
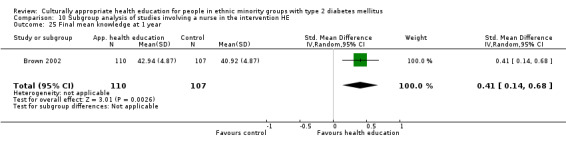
Comparison 10 Subgroup analysis of studies involving a nurse in the intervention HE, Outcome 25 Final mean knowledge at 1 year.
Comparison 11. Subgroup analysis of studies involving a dietician in the intervention HE.
| Outcome or subgroup title | No. of studies | No. of participants | Statistical method | Effect size |
|---|---|---|---|---|
| 1 Mean HbA1c at up to 3 months | 4 | 515 | Mean Difference (IV, Random, 95% CI) | ‐0.37 [‐0.86, 0.11] |
| 1.1 Final values | 3 | 490 | Mean Difference (IV, Random, 95% CI) | ‐0.32 [‐0.99, 0.34] |
| 1.2 Change scores | 1 | 25 | Mean Difference (IV, Random, 95% CI) | ‐0.56 [‐1.12, ‐0.00] |
| 2 Mean HbA1c at up to 6 months | 7 | 815 | Mean Difference (IV, Random, 95% CI) | ‐0.57 [‐0.85, ‐0.29] |
| 2.1 Final values | 4 | 573 | Mean Difference (IV, Random, 95% CI) | ‐0.88 [‐1.55, ‐0.22] |
| 2.2 Change scores | 3 | 242 | Mean Difference (IV, Random, 95% CI) | ‐0.44 [‐0.72, ‐0.16] |
| 3 Mean HbA1c at up to 1 year | 3 | 505 | Mean Difference (IV, Random, 95% CI) | ‐0.24 [‐0.67, 0.19] |
| 3.1 Final values | 3 | 505 | Mean Difference (IV, Random, 95% CI) | ‐0.24 [‐0.67, 0.19] |
| 4 Mean systolic blood pressure at up to 3 months (mm Hg) | 3 | 305 | Mean Difference (IV, Random, 95% CI) | 2.38 [‐2.34, 7.09] |
| 4.1 Final values | 2 | 280 | Mean Difference (IV, Random, 95% CI) | 1.52 [‐4.95, 8.00] |
| 4.2 Change scores | 1 | 25 | Mean Difference (IV, Random, 95% CI) | 4.0 [‐6.77, 14.77] |
| 5 Mean systolic blood pressure at up to 6 months (mm Hg) | 4 | 357 | Mean Difference (IV, Random, 95% CI) | 1.69 [‐0.43, 3.81] |
| 5.1 Final values | 2 | 228 | Mean Difference (IV, Random, 95% CI) | 1.88 [‐0.46, 4.21] |
| 5.2 Change scores | 2 | 129 | Mean Difference (IV, Random, 95% CI) | 0.82 [‐4.29, 5.92] |
| 6 Mean systolic blood pressure at up to 1 year (mm Hg) | 1 | 169 | Mean Difference (IV, Random, 95% CI) | 1.0 [‐3.58, 5.58] |
| 6.1 Final values | 1 | 169 | Mean Difference (IV, Random, 95% CI) | 1.0 [‐3.58, 5.58] |
| 7 Mean diastolic blood pressure at up to 3 months (mm Hg) | 3 | 303 | Mean Difference (IV, Random, 95% CI) | 0.07 [‐2.59, 2.72] |
| 7.1 Final values | 2 | 278 | Mean Difference (IV, Random, 95% CI) | 0.55 [‐2.32, 3.41] |
| 7.2 Change scores | 1 | 25 | Mean Difference (IV, Random, 95% CI) | ‐2.87 [‐9.97, 4.23] |
| 8 Mean diastolic blood pressure at up to 6 months (mm Hg) | 4 | 357 | Mean Difference (IV, Random, 95% CI) | 2.34 [0.87, 3.80] |
| 8.1 Final values | 2 | 228 | Mean Difference (IV, Random, 95% CI) | 1.73 [‐1.93, 5.38] |
| 8.2 Change scores | 2 | 129 | Mean Difference (IV, Random, 95% CI) | 1.86 [‐0.86, 4.57] |
| 9 Mean diastolic blood pressure at up to 1 year (mm Hg) | 1 | 169 | Mean Difference (IV, Random, 95% CI) | 2.0 [‐0.79, 4.79] |
| 9.1 Final values | 1 | 169 | Mean Difference (IV, Random, 95% CI) | 2.0 [‐0.79, 4.79] |
| 10 Mean BMI at up to 3 months (kg/m2) | 3 | 301 | Mean Difference (IV, Random, 95% CI) | ‐0.68 [‐1.92, 0.55] |
| 10.1 Final values | 2 | 276 | Mean Difference (IV, Random, 95% CI) | ‐1.03 [‐2.57, 0.51] |
| 10.2 Change scores | 1 | 25 | Mean Difference (IV, Random, 95% CI) | ‐0.08 [‐2.13, 1.97] |
| 11 Mean BMI at up to 6 months (kg/m2) | 4 | 411 | Mean Difference (IV, Random, 95% CI) | ‐0.52 [‐0.93, ‐0.12] |
| 11.1 Final values | 2 | 282 | Mean Difference (IV, Random, 95% CI) | ‐1.14 [‐2.63, 0.35] |
| 11.2 Change scores | 2 | 129 | Mean Difference (IV, Random, 95% CI) | ‐0.48 [‐0.90, ‐0.06] |
| 12 Mean total cholesterol at up to 3 months (mg/dL) | 4 | 514 | Mean Difference (IV, Random, 95% CI) | ‐2.28 [‐9.18, 4.62] |
| 12.1 Final values | 3 | 489 | Mean Difference (IV, Random, 95% CI) | ‐2.09 [‐9.66, 5.48] |
| 12.2 Change scores | 1 | 25 | Mean Difference (IV, Random, 95% CI) | ‐3.2 [‐20.03, 13.63] |
| 13 Mean total cholesterol at up to 6 months (mg/dL) | 5 | 531 | Mean Difference (IV, Random, 95% CI) | 0.64 [‐8.80, 10.07] |
| 13.1 Final values | 3 | 402 | Mean Difference (IV, Random, 95% CI) | 2.62 [‐5.61, 10.85] |
| 13.2 Change scores | 2 | 129 | Mean Difference (IV, Random, 95% CI) | ‐1.21 [‐22.89, 20.48] |
| 14 Mean total cholesterol at up to 1 year (mg/dL) | 2 | 336 | Mean Difference (IV, Random, 95% CI) | ‐2.88 [‐15.52, 9.76] |
| 14.1 Final values | 2 | 336 | Mean Difference (IV, Random, 95% CI) | ‐2.88 [‐15.52, 9.76] |
| 15 Mean LDL at up to 3 months (mg/dL) | 2 | 80 | Mean Difference (IV, Random, 95% CI) | 3.54 [‐7.39, 14.47] |
| 15.1 Final values | 1 | 55 | Mean Difference (IV, Random, 95% CI) | 6.0 [‐10.03, 22.03] |
| 15.2 Change scores | 1 | 25 | Mean Difference (IV, Random, 95% CI) | 1.4 [‐13.55, 16.35] |
| 16 Mean LDL at up to 6 months (mg/dL) | 3 | 181 | Mean Difference (IV, Random, 95% CI) | ‐3.14 [‐11.71, 5.42] |
| 16.1 Final values | 1 | 52 | Mean Difference (IV, Random, 95% CI) | 7.80 [‐11.20, 26.80] |
| 16.2 Change scores | 2 | 129 | Mean Difference (IV, Random, 95% CI) | ‐5.71 [‐14.51, 3.08] |
| 17 Mean HDL at up to 3 months (mg/dL) | 2 | 82 | Mean Difference (IV, Random, 95% CI) | ‐1.58 [‐7.76, 4.59] |
| 17.1 Final values | 1 | 57 | Mean Difference (IV, Random, 95% CI) | ‐4.80 [‐10.52, 0.92] |
| 17.2 Change scores | 1 | 25 | Mean Difference (IV, Random, 95% CI) | 1.50 [‐3.93, 6.93] |
| 18 Mean HDL at up to 6 months (mg/dL) | 4 | 300 | Mean Difference (IV, Random, 95% CI) | 0.30 [‐3.57, 4.18] |
| 18.1 Final scores | 2 | 171 | Mean Difference (IV, Random, 95% CI) | ‐0.36 [‐9.27, 8.55] |
| 18.2 Change scores | 2 | 129 | Mean Difference (IV, Random, 95% CI) | 0.63 [‐4.27, 5.52] |
| 19 Mean HDL at up to 1 year (mg/dL) | 1 | 111 | Mean Difference (IV, Random, 95% CI) | 1.0 [‐4.70, 6.70] |
| 20 Mean triglycerides at up to 3 months (mg/dL) | 3 | 287 | Mean Difference (IV, Random, 95% CI) | ‐18.36 [‐41.81, 5.10] |
| 20.1 Final values | 2 | 262 | Mean Difference (IV, Random, 95% CI) | ‐11.47 [‐40.34, 17.40] |
| 20.2 Change scores | 1 | 25 | Mean Difference (IV, Random, 95% CI) | ‐31.70 [‐71.90, 8.50] |
| 21 Mean triglycerides at up to 6 months (mg/dL) | 4 | 413 | Mean Difference (IV, Random, 95% CI) | ‐6.38 [‐42.54, 29.79] |
| 21.1 Final values | 2 | 284 | Mean Difference (IV, Random, 95% CI) | ‐31.26 [‐63.12, 0.59] |
| 21.2 Change scores | 2 | 129 | Mean Difference (IV, Random, 95% CI) | 16.47 [‐39.98, 72.91] |
| 22 Final mean knowledge at up to 3 months | 4 | 492 | Std. Mean Difference (IV, Random, 95% CI) | 0.53 [0.22, 0.84] |
| 22.1 Final values | 3 | 467 | Std. Mean Difference (IV, Random, 95% CI) | 0.61 [0.37, 0.85] |
| 22.2 Change scores | 1 | 25 | Std. Mean Difference (IV, Random, 95% CI) | ‐0.21 [‐1.01, 0.59] |
| 23 Final mean knowledge (diabetes and nutrition knowledge) at up to 6 months | 5 | 451 | Std. Mean Difference (IV, Random, 95% CI) | 0.31 [0.12, 0.50] |
| 23.1 Final values | 4 | 426 | Std. Mean Difference (IV, Random, 95% CI) | 0.34 [0.14, 0.53] |
| 23.2 Change scores | 1 | 25 | Std. Mean Difference (IV, Random, 95% CI) | ‐0.14 [‐0.94, 0.66] |
| 24 Final mean knowledge at 1 year | 2 | 328 | Std. Mean Difference (IV, Random, 95% CI) | 0.35 [0.13, 0.57] |
| 25 Final mean self‐efficacy & empowerment [on diet and health beliefs on barriers] at up to 3 months | 2 | 407 | Std. Mean Difference (IV, Random, 95% CI) | 0.14 [‐0.14, 0.43] |
| 25.1 Mean values | 2 | 407 | Std. Mean Difference (IV, Random, 95% CI) | 0.14 [‐0.14, 0.43] |
| 25.2 Change scores | 0 | 0 | Std. Mean Difference (IV, Random, 95% CI) | 0.0 [0.0, 0.0] |
| 26 Mean quality of life measures at 3 to 4 months | 1 | 25 | Mean Difference (IV, Random, 95% CI) | 0.44 [‐0.23, 1.11] |
| 26.1 Final values | 0 | 0 | Mean Difference (IV, Random, 95% CI) | 0.0 [0.0, 0.0] |
| 26.2 Change scores | 1 | 25 | Mean Difference (IV, Random, 95% CI) | 0.44 [‐0.23, 1.11] |
| 27 Mean BMI at up to 12 months (kg/m2) | 1 | 227 | Mean Difference (IV, Random, 95% CI) | ‐0.11 [‐1.80, 1.58] |
| 28 Mean triglycerides at up to 1 year (mg/dL) | 1 | 226 | Mean Difference (IV, Random, 95% CI) | 15.78 [‐29.32, 60.88] |
| 29 Mean quality of life scores at 6 months | 2 | 145 | Mean Difference (IV, Random, 95% CI) | ‐0.68 [‐2.49, 1.13] |
| 29.1 Mean values | 1 | 120 | Mean Difference (IV, Random, 95% CI) | 0.5 [‐2.01, 3.01] |
| 29.2 Change scores | 1 | 25 | Mean Difference (IV, Random, 95% CI) | ‐1.40 [‐3.13, 0.33] |
| 30 Mean quality of life scores at 1 year | 1 | 114 | Std. Mean Difference (IV, Random, 95% CI) | ‐0.17 [‐0.53, 0.20] |
11.1. Analysis.
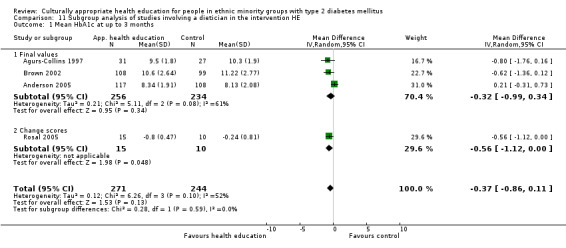
Comparison 11 Subgroup analysis of studies involving a dietician in the intervention HE, Outcome 1 Mean HbA1c at up to 3 months.
11.2. Analysis.
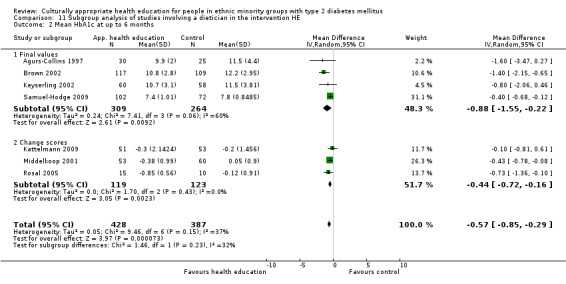
Comparison 11 Subgroup analysis of studies involving a dietician in the intervention HE, Outcome 2 Mean HbA1c at up to 6 months.
11.3. Analysis.
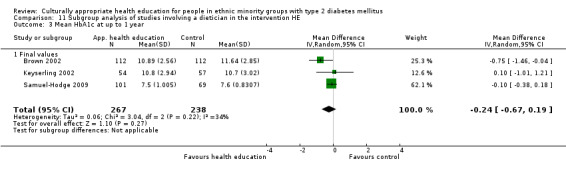
Comparison 11 Subgroup analysis of studies involving a dietician in the intervention HE, Outcome 3 Mean HbA1c at up to 1 year.
11.4. Analysis.
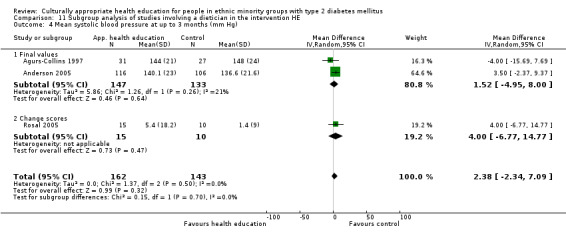
Comparison 11 Subgroup analysis of studies involving a dietician in the intervention HE, Outcome 4 Mean systolic blood pressure at up to 3 months (mm Hg).
11.5. Analysis.
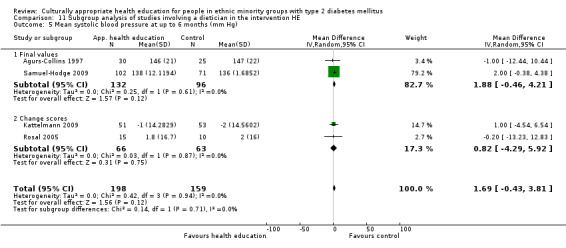
Comparison 11 Subgroup analysis of studies involving a dietician in the intervention HE, Outcome 5 Mean systolic blood pressure at up to 6 months (mm Hg).
11.6. Analysis.
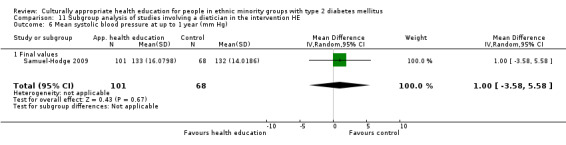
Comparison 11 Subgroup analysis of studies involving a dietician in the intervention HE, Outcome 6 Mean systolic blood pressure at up to 1 year (mm Hg).
11.7. Analysis.
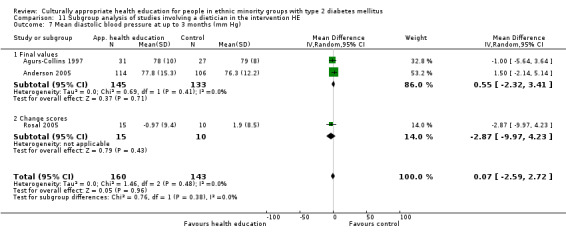
Comparison 11 Subgroup analysis of studies involving a dietician in the intervention HE, Outcome 7 Mean diastolic blood pressure at up to 3 months (mm Hg).
11.8. Analysis.
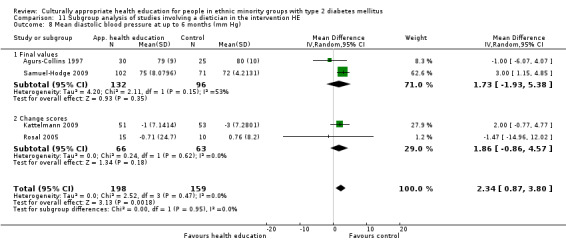
Comparison 11 Subgroup analysis of studies involving a dietician in the intervention HE, Outcome 8 Mean diastolic blood pressure at up to 6 months (mm Hg).
11.9. Analysis.
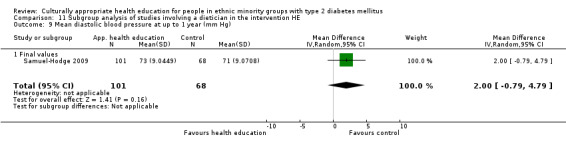
Comparison 11 Subgroup analysis of studies involving a dietician in the intervention HE, Outcome 9 Mean diastolic blood pressure at up to 1 year (mm Hg).
11.10. Analysis.
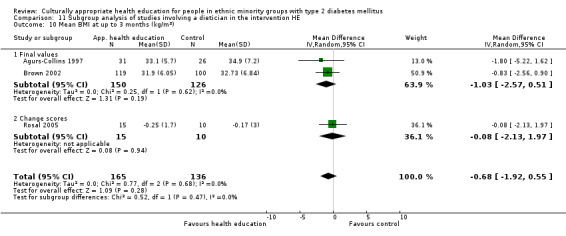
Comparison 11 Subgroup analysis of studies involving a dietician in the intervention HE, Outcome 10 Mean BMI at up to 3 months (kg/m2).
11.11. Analysis.
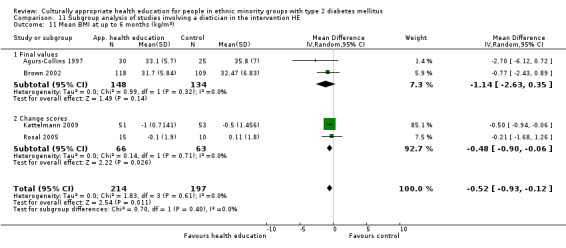
Comparison 11 Subgroup analysis of studies involving a dietician in the intervention HE, Outcome 11 Mean BMI at up to 6 months (kg/m2).
11.12. Analysis.
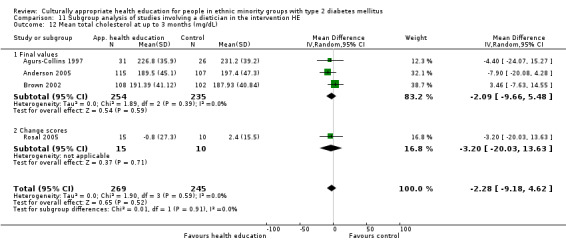
Comparison 11 Subgroup analysis of studies involving a dietician in the intervention HE, Outcome 12 Mean total cholesterol at up to 3 months (mg/dL).
11.13. Analysis.
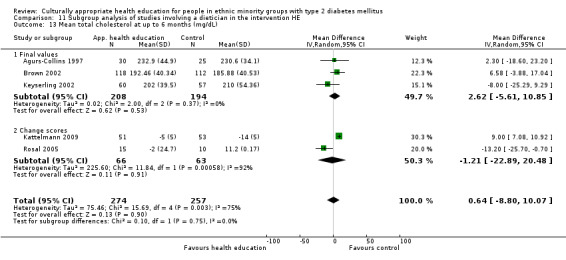
Comparison 11 Subgroup analysis of studies involving a dietician in the intervention HE, Outcome 13 Mean total cholesterol at up to 6 months (mg/dL).
11.14. Analysis.
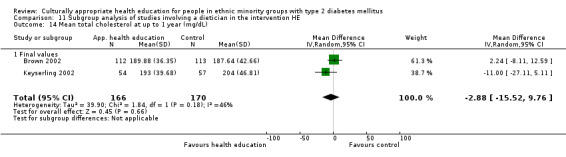
Comparison 11 Subgroup analysis of studies involving a dietician in the intervention HE, Outcome 14 Mean total cholesterol at up to 1 year (mg/dL).
11.15. Analysis.
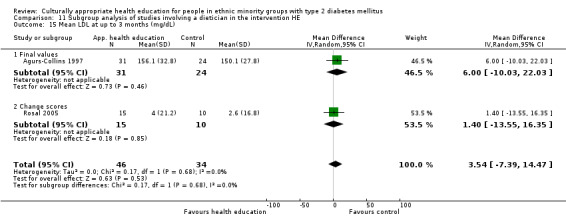
Comparison 11 Subgroup analysis of studies involving a dietician in the intervention HE, Outcome 15 Mean LDL at up to 3 months (mg/dL).
11.16. Analysis.
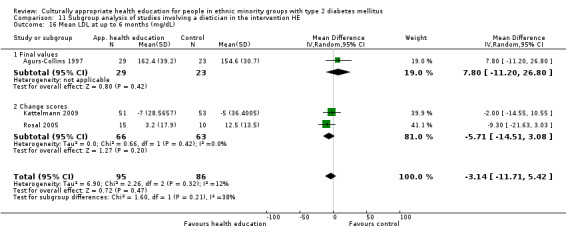
Comparison 11 Subgroup analysis of studies involving a dietician in the intervention HE, Outcome 16 Mean LDL at up to 6 months (mg/dL).
11.17. Analysis.
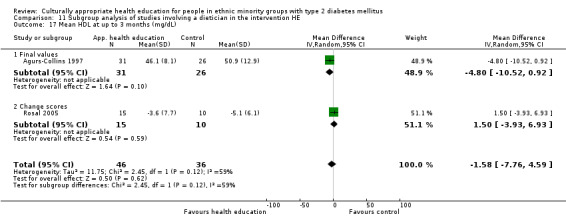
Comparison 11 Subgroup analysis of studies involving a dietician in the intervention HE, Outcome 17 Mean HDL at up to 3 months (mg/dL).
11.18. Analysis.
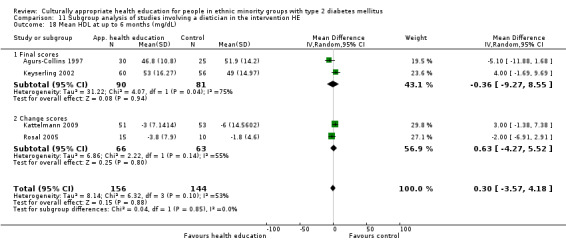
Comparison 11 Subgroup analysis of studies involving a dietician in the intervention HE, Outcome 18 Mean HDL at up to 6 months (mg/dL).
11.19. Analysis.
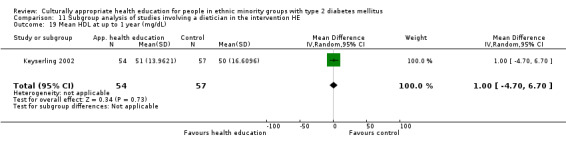
Comparison 11 Subgroup analysis of studies involving a dietician in the intervention HE, Outcome 19 Mean HDL at up to 1 year (mg/dL).
11.20. Analysis.
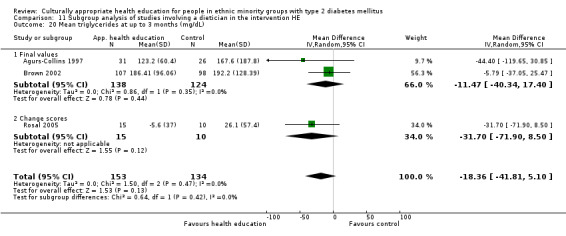
Comparison 11 Subgroup analysis of studies involving a dietician in the intervention HE, Outcome 20 Mean triglycerides at up to 3 months (mg/dL).
11.21. Analysis.
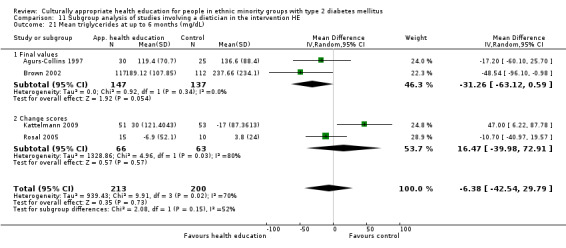
Comparison 11 Subgroup analysis of studies involving a dietician in the intervention HE, Outcome 21 Mean triglycerides at up to 6 months (mg/dL).
11.22. Analysis.
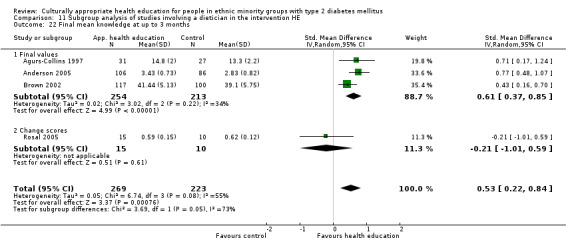
Comparison 11 Subgroup analysis of studies involving a dietician in the intervention HE, Outcome 22 Final mean knowledge at up to 3 months.
11.23. Analysis.
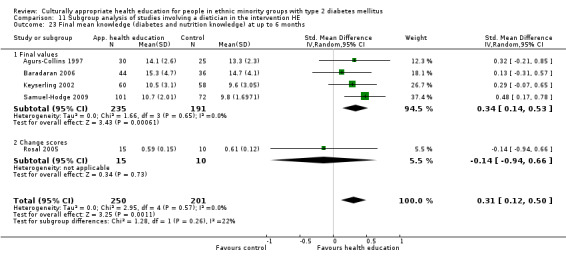
Comparison 11 Subgroup analysis of studies involving a dietician in the intervention HE, Outcome 23 Final mean knowledge (diabetes and nutrition knowledge) at up to 6 months.
11.24. Analysis.
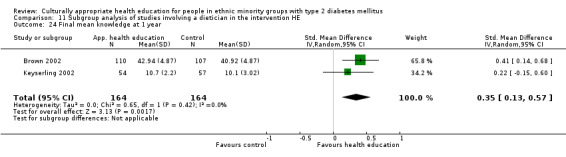
Comparison 11 Subgroup analysis of studies involving a dietician in the intervention HE, Outcome 24 Final mean knowledge at 1 year.
11.25. Analysis.
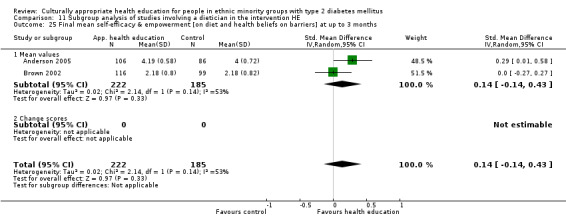
Comparison 11 Subgroup analysis of studies involving a dietician in the intervention HE, Outcome 25 Final mean self‐efficacy & empowerment [on diet and health beliefs on barriers] at up to 3 months.
11.26. Analysis.
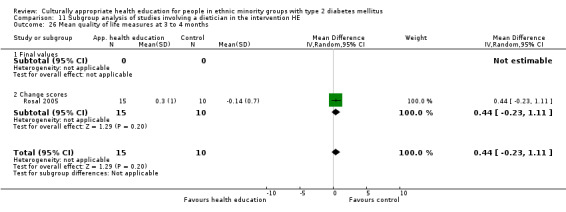
Comparison 11 Subgroup analysis of studies involving a dietician in the intervention HE, Outcome 26 Mean quality of life measures at 3 to 4 months.
11.27. Analysis.
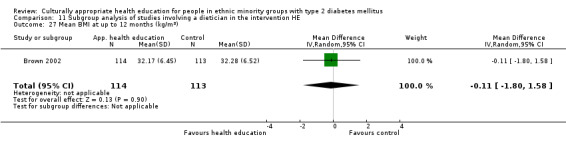
Comparison 11 Subgroup analysis of studies involving a dietician in the intervention HE, Outcome 27 Mean BMI at up to 12 months (kg/m2).
11.28. Analysis.
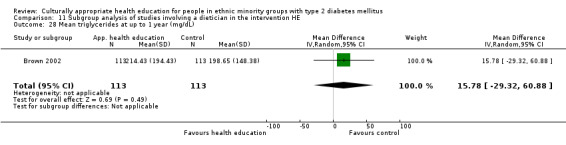
Comparison 11 Subgroup analysis of studies involving a dietician in the intervention HE, Outcome 28 Mean triglycerides at up to 1 year (mg/dL).
11.29. Analysis.
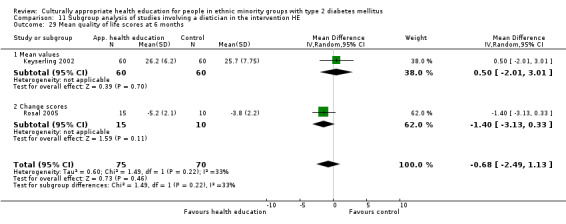
Comparison 11 Subgroup analysis of studies involving a dietician in the intervention HE, Outcome 29 Mean quality of life scores at 6 months.
11.30. Analysis.
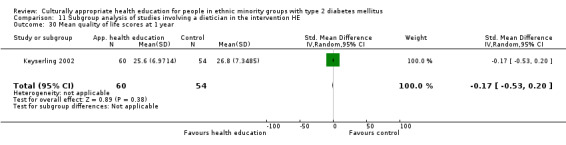
Comparison 11 Subgroup analysis of studies involving a dietician in the intervention HE, Outcome 30 Mean quality of life scores at 1 year.
Comparison 12. Subgroup analysis of studies based in the USA.
| Outcome or subgroup title | No. of studies | No. of participants | Statistical method | Effect size |
|---|---|---|---|---|
| 1 Mean HbA1c at up to 3 months | 14 | 1442 | Mean Difference (IV, Random, 95% CI) | ‐0.47 [‐0.73, ‐0.20] |
| 1.1 Final values | 11 | 1108 | Mean Difference (IV, Random, 95% CI) | ‐0.34 [‐0.64, ‐0.04] |
| 1.2 Change scores | 3 | 334 | Mean Difference (IV, Random, 95% CI) | ‐0.74 [‐1.19, ‐0.30] |
| 2 Mean HbA1c at up to 6 months | 11 | 1387 | Mean Difference (IV, Random, 95% CI) | ‐0.62 [‐0.88, ‐0.36] |
| 2.1 Final values | 5 | 714 | Mean Difference (IV, Random, 95% CI) | ‐0.67 [‐1.14, ‐0.21] |
| 2.2 Change scores | 6 | 673 | Mean Difference (IV, Random, 95% CI) | ‐0.61 [‐0.98, ‐0.24] |
| 3 Mean HbA1c at up to 1 year | 7 | 1361 | Mean Difference (IV, Random, 95% CI) | ‐0.26 [‐0.45, ‐0.07] |
| 3.1 Final values | 6 | 1131 | Mean Difference (IV, Random, 95% CI) | ‐0.28 [‐0.51, ‐0.05] |
| 3.2 Change scores | 1 | 230 | Mean Difference (IV, Random, 95% CI) | ‐0.26 [‐0.77, 0.25] |
| 4 HbA1c at 24 months | 3 | 795 | Mean Difference (IV, Random, 95% CI) | ‐0.47 [‐0.93, ‐0.00] |
| 4.1 Mean value | 2 | 253 | Mean Difference (IV, Random, 95% CI) | ‐0.71 [‐1.07, ‐0.35] |
| 4.2 Change value | 1 | 542 | Mean Difference (IV, Random, 95% CI) | ‐0.12 [‐0.43, 0.19] |
| 5 Mean systolic blood pressure at up to 3 months (mm Hg) | 7 | 685 | Mean Difference (IV, Random, 95% CI) | 0.05 [‐2.80, 2.91] |
| 5.1 Final values | 5 | 581 | Mean Difference (IV, Random, 95% CI) | ‐0.25 [‐4.16, 3.65] |
| 5.2 Change scores | 2 | 104 | Mean Difference (IV, Random, 95% CI) | 1.64 [‐4.12, 7.41] |
| 6 Mean systolic blood pressure at up to 6 months (mm Hg) | 7 | 555 | Mean Difference (IV, Random, 95% CI) | 1.74 [‐0.06, 3.54] |
| 6.1 Final values | 2 | 228 | Mean Difference (IV, Random, 95% CI) | 1.88 [‐0.46, 4.21] |
| 6.2 Change scores | 5 | 327 | Mean Difference (IV, Random, 95% CI) | 1.54 [‐1.30, 4.37] |
| 7 Mean systolic blood pressure at up to 1 year (mm Hg) | 3 | 753 | Mean Difference (IV, Random, 95% CI) | 0.77 [‐2.27, 3.81] |
| 7.1 Final values | 3 | 753 | Mean Difference (IV, Random, 95% CI) | 0.77 [‐2.27, 3.81] |
| 8 Mean diastolic blood pressure at up to 3 months (mm Hg) | 7 | 683 | Mean Difference (IV, Random, 95% CI) | ‐1.06 [‐2.65, 0.52] |
| 8.1 Final values | 5 | 579 | Mean Difference (IV, Random, 95% CI) | ‐0.87 [‐3.03, 1.29] |
| 8.2 Change scores | 2 | 104 | Mean Difference (IV, Random, 95% CI) | ‐1.54 [‐5.10, 2.01] |
| 9 Mean diastolic blood pressure at up to 6 months (mm Hg) | 7 | 555 | Mean Difference (IV, Random, 95% CI) | 1.95 [0.62, 3.28] |
| 9.1 Final values | 2 | 228 | Mean Difference (IV, Random, 95% CI) | 1.73 [‐1.93, 5.38] |
| 9.2 Change scores | 5 | 327 | Mean Difference (IV, Random, 95% CI) | 1.14 [‐0.92, 3.20] |
| 10 Mean diastolic blood pressure at up to 1 year (mm Hg) | 2 | 394 | Mean Difference (IV, Random, 95% CI) | 0.03 [‐3.78, 3.84] |
| 10.1 Final values | 2 | 394 | Mean Difference (IV, Random, 95% CI) | 0.03 [‐3.78, 3.84] |
| 11 Mean BMI at up to 3 months (kg/m2) | 5 | 397 | Mean Difference (IV, Random, 95% CI) | ‐0.01 [‐0.46, 0.44] |
| 11.1 Final values | 3 | 293 | Mean Difference (IV, Random, 95% CI) | ‐0.88 [‐2.27, 0.51] |
| 11.2 Change scores | 2 | 104 | Mean Difference (IV, Random, 95% CI) | 0.09 [‐0.39, 0.57] |
| 12 Mean BMI at up to 6 months (kg/m2) | 7 | 607 | Mean Difference (IV, Random, 95% CI) | ‐0.27 [‐0.62, 0.09] |
| 12.1 Final values | 2 | 282 | Mean Difference (IV, Random, 95% CI) | ‐1.14 [‐2.63, 0.35] |
| 12.2 Change scores | 5 | 325 | Mean Difference (IV, Random, 95% CI) | ‐0.23 [‐0.56, 0.10] |
| 13 Mean total cholesterol at up to 3 months (mg/dL) | 7 | 967 | Mean Difference (IV, Random, 95% CI) | ‐5.16 [‐11.09, 0.77] |
| 13.1 Final values | 5 | 863 | Mean Difference (IV, Random, 95% CI) | ‐2.99 [‐8.81, 2.82] |
| 13.2 Change scores | 2 | 104 | Mean Difference (IV, Random, 95% CI) | ‐14.15 [‐36.29, 7.98] |
| 14 Mean total cholesterol at up to 6 months (mg/dL) | 6 | 610 | Mean Difference (IV, Random, 95% CI) | ‐4.75 [‐16.70, 7.20] |
| 14.1 Final values | 3 | 402 | Mean Difference (IV, Random, 95% CI) | 2.62 [‐5.61, 10.85] |
| 14.2 Change scores | 3 | 208 | Mean Difference (IV, Random, 95% CI) | ‐10.86 [‐34.98, 13.27] |
| 15 Mean total cholesterol at up to 1 year (mg/dL) | 4 | 694 | Mean Difference (IV, Random, 95% CI) | ‐1.89 [‐8.41, 4.64] |
| 15.1 Final values | 4 | 694 | Mean Difference (IV, Random, 95% CI) | ‐1.89 [‐8.41, 4.64] |
| 16 Mean LDL at up to 3 months (mg/dL) | 2 | 80 | Mean Difference (IV, Random, 95% CI) | 3.54 [‐7.39, 14.47] |
| 16.1 Final values | 1 | 55 | Mean Difference (IV, Random, 95% CI) | 6.0 [‐10.03, 22.03] |
| 16.2 Change scores | 1 | 25 | Mean Difference (IV, Random, 95% CI) | 1.4 [‐13.55, 16.35] |
| 17 Mean LDL at up to 6 months (mg/dL) | 5 | 287 | Mean Difference (IV, Random, 95% CI) | ‐4.28 [‐11.13, 2.57] |
| 17.1 Final values | 1 | 52 | Mean Difference (IV, Random, 95% CI) | 7.80 [‐11.20, 26.80] |
| 17.2 Change scores | 4 | 235 | Mean Difference (IV, Random, 95% CI) | ‐6.09 [‐13.43, 1.25] |
| 18 Mean HDL at up to 3 months (mg/dL) | 3 | 161 | Mean Difference (IV, Random, 95% CI) | ‐0.86 [‐4.12, 2.39] |
| 18.1 Final values | 1 | 57 | Mean Difference (IV, Random, 95% CI) | ‐4.80 [‐10.52, 0.92] |
| 18.2 Change scores | 2 | 104 | Mean Difference (IV, Random, 95% CI) | 0.43 [‐2.69, 3.54] |
| 19 Mean HDL at up to 6 months (mg/dL) | 5 | 379 | Mean Difference (IV, Random, 95% CI) | ‐0.54 [‐3.82, 2.75] |
| 19.1 Final scores | 2 | 171 | Mean Difference (IV, Random, 95% CI) | ‐0.36 [‐9.27, 8.55] |
| 19.2 Change scores | 3 | 208 | Mean Difference (IV, Random, 95% CI) | ‐0.75 [‐4.52, 3.02] |
| 20 Mean HDL at up to 1 year (mg/dL) | 1 | 111 | Mean Difference (IV, Random, 95% CI) | 1.0 [‐4.70, 6.70] |
| 21 Mean triglycerides at up to 3 months (mg/dL) | 4 | 516 | Mean Difference (IV, Random, 95% CI) | ‐27.90 [‐46.35, ‐9.45] |
| 21.1 Final values | 3 | 491 | Mean Difference (IV, Random, 95% CI) | ‐27.03 [‐54.08, 0.02] |
| 21.2 Change scores | 1 | 25 | Mean Difference (IV, Random, 95% CI) | ‐31.70 [‐71.90, 8.50] |
| 22 Mean triglycerides at up to 6 months (mg/dL) | 4 | 413 | Mean Difference (IV, Random, 95% CI) | ‐6.38 [‐42.54, 29.79] |
| 22.1 Final values | 2 | 284 | Mean Difference (IV, Random, 95% CI) | ‐31.26 [‐63.12, 0.59] |
| 22.2 Change scores | 2 | 129 | Mean Difference (IV, Random, 95% CI) | 16.47 [‐39.98, 72.91] |
| 23 Mean triglycerides at up to 1 year (mg/dL) | 3 | 584 | Mean Difference (IV, Random, 95% CI) | ‐5.55 [‐25.53, 14.42] |
| 24 Final mean knowledge at up to 3 months | 10 | 936 | Std. Mean Difference (IV, Random, 95% CI) | 0.35 [0.10, 0.59] |
| 24.1 Final values | 8 | 832 | Std. Mean Difference (IV, Random, 95% CI) | 0.33 [0.07, 0.60] |
| 24.2 Change values | 2 | 104 | Std. Mean Difference (IV, Random, 95% CI) | 0.32 [‐0.59, 1.24] |
| 25 Final mean knowledge (diabetes and nutrition knowledge) at up to 6 months | 7 | 722 | Std. Mean Difference (IV, Random, 95% CI) | 0.49 [0.34, 0.65] |
| 25.1 Final values | 5 | 618 | Std. Mean Difference (IV, Random, 95% CI) | 0.49 [0.33, 0.65] |
| 25.2 Change values | 2 | 104 | Std. Mean Difference (IV, Random, 95% CI) | 0.35 [‐0.47, 1.18] |
| 26 Final mean knowledge at 1 year | 2 | 328 | Std. Mean Difference (IV, Random, 95% CI) | 0.35 [0.13, 0.57] |
| 27 Final mean self‐efficacy and empowerment [on diet and health beliefs on barriers] at up to 3 months | 6 | 577 | Std. Mean Difference (IV, Random, 95% CI) | 0.12 [‐0.09, 0.33] |
| 27.1 Final values | 5 | 498 | Std. Mean Difference (IV, Random, 95% CI) | 0.07 [‐0.13, 0.26] |
| 27.2 Changes values | 1 | 79 | Std. Mean Difference (IV, Random, 95% CI) | 0.45 [0.01, 0.90] |
| 28 Final mean self‐efficacy and empowerment on diet (can choose correct food) at 6 months | 1 | 79 | Std. Mean Difference (IV, Random, 95% CI) | 0.50 [0.06, 0.95] |
| 28.1 Change scores | 1 | 79 | Std. Mean Difference (IV, Random, 95% CI) | 0.50 [0.06, 0.95] |
| 29 Mean BMI at up to 12 months (kg/m2) | 2 | 358 | Mean Difference (IV, Random, 95% CI) | ‐0.38 [‐1.70, 0.95] |
| 30 Mean quality of life measures at 3 to 4 months | 2 | 104 | Std. Mean Difference (IV, Random, 95% CI) | 0.36 [‐0.03, 0.75] |
| 30.1 Final values | 0 | 0 | Std. Mean Difference (IV, Random, 95% CI) | 0.0 [0.0, 0.0] |
| 30.2 Change scores | 2 | 104 | Std. Mean Difference (IV, Random, 95% CI) | 0.36 [‐0.03, 0.75] |
| 31 Mean LDL at up to 12 months (mg/dL) | 3 | 687 | Mean Difference (IV, Random, 95% CI) | ‐0.13 [‐5.72, 5.45] |
| 32 Quality of life at up to 6 months (overall QoL and mental QoL) | 3 | 224 | Std. Mean Difference (IV, Random, 95% CI) | 0.03 [‐0.36, 0.42] |
| 32.1 Final values | 1 | 120 | Std. Mean Difference (IV, Random, 95% CI) | 0.07 [‐0.29, 0.43] |
| 32.2 Change scores | 2 | 104 | Std. Mean Difference (IV, Random, 95% CI) | ‐0.10 [1.00, 0.79] |
| 33 Mean quality of life scores at 1 year | 1 | 114 | Std. Mean Difference (IV, Random, 95% CI) | ‐0.17 [‐0.53, 0.20] |
| 34 Acute hospital admissions at 24 months | 1 | 542 | Odds Ratio (M‐H, Random, 95% CI) | 0.13 [0.09, 0.19] |
| 35 Emergency visits at 6 months | 1 | 352 | Mean Difference (IV, Random, 95% CI) | ‐0.03 [‐0.21, 0.16] |
| 35.1 Change values | 1 | 352 | Mean Difference (IV, Random, 95% CI) | ‐0.03 [‐0.21, 0.16] |
12.1. Analysis.
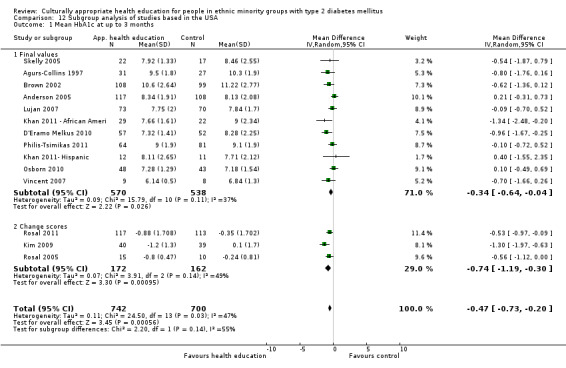
Comparison 12 Subgroup analysis of studies based in the USA, Outcome 1 Mean HbA1c at up to 3 months.
12.2. Analysis.
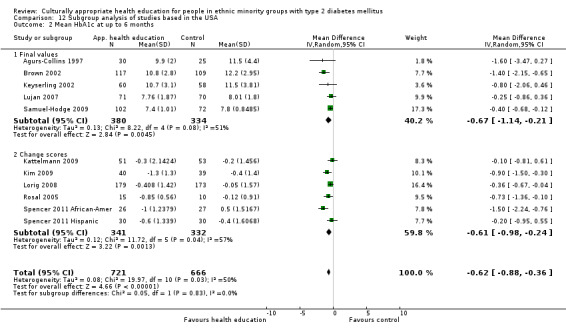
Comparison 12 Subgroup analysis of studies based in the USA, Outcome 2 Mean HbA1c at up to 6 months.
12.3. Analysis.
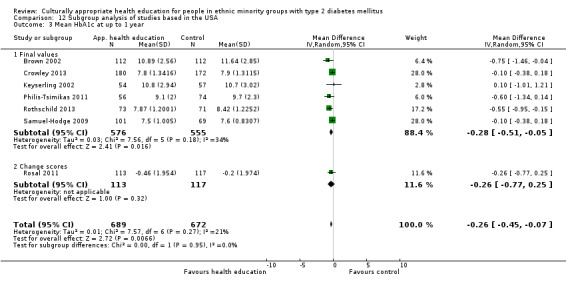
Comparison 12 Subgroup analysis of studies based in the USA, Outcome 3 Mean HbA1c at up to 1 year.
12.4. Analysis.
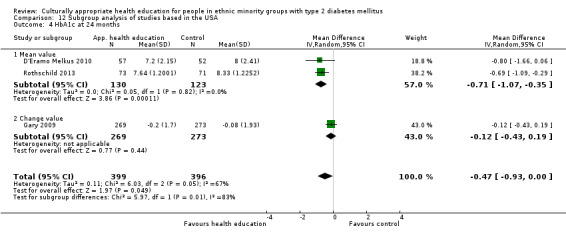
Comparison 12 Subgroup analysis of studies based in the USA, Outcome 4 HbA1c at 24 months.
12.5. Analysis.
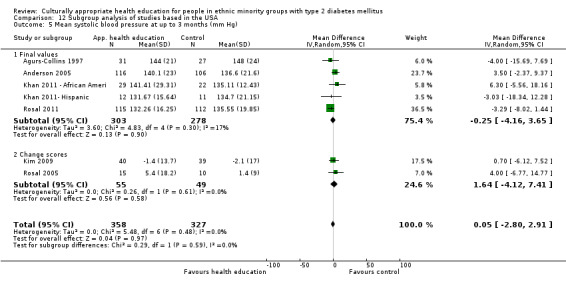
Comparison 12 Subgroup analysis of studies based in the USA, Outcome 5 Mean systolic blood pressure at up to 3 months (mm Hg).
12.6. Analysis.
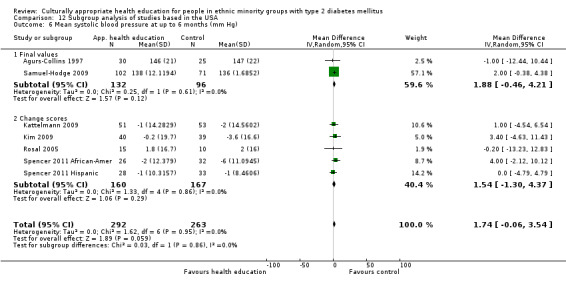
Comparison 12 Subgroup analysis of studies based in the USA, Outcome 6 Mean systolic blood pressure at up to 6 months (mm Hg).
12.7. Analysis.
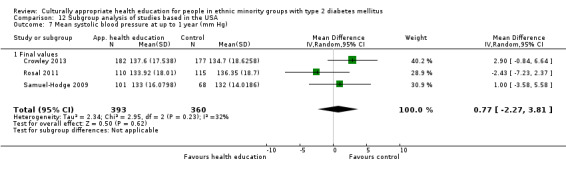
Comparison 12 Subgroup analysis of studies based in the USA, Outcome 7 Mean systolic blood pressure at up to 1 year (mm Hg).
12.8. Analysis.
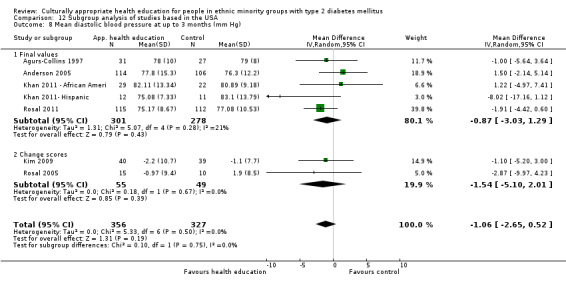
Comparison 12 Subgroup analysis of studies based in the USA, Outcome 8 Mean diastolic blood pressure at up to 3 months (mm Hg).
12.9. Analysis.
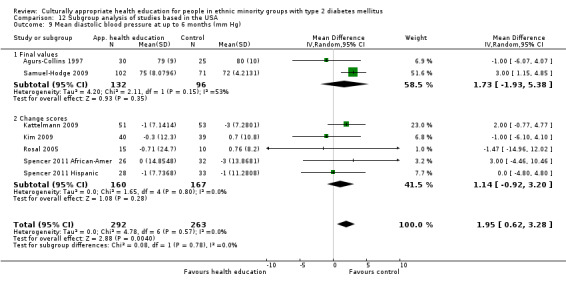
Comparison 12 Subgroup analysis of studies based in the USA, Outcome 9 Mean diastolic blood pressure at up to 6 months (mm Hg).
12.10. Analysis.
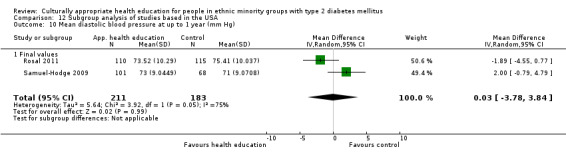
Comparison 12 Subgroup analysis of studies based in the USA, Outcome 10 Mean diastolic blood pressure at up to 1 year (mm Hg).
12.11. Analysis.
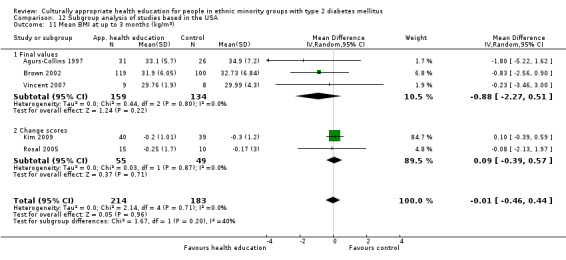
Comparison 12 Subgroup analysis of studies based in the USA, Outcome 11 Mean BMI at up to 3 months (kg/m2).
12.12. Analysis.
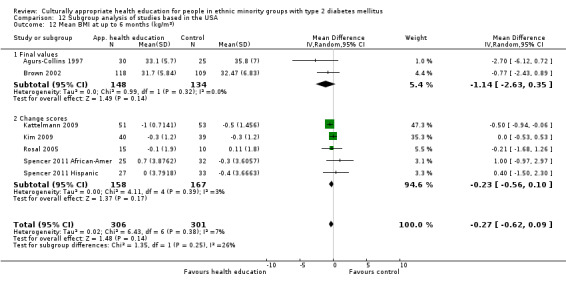
Comparison 12 Subgroup analysis of studies based in the USA, Outcome 12 Mean BMI at up to 6 months (kg/m2).
12.13. Analysis.
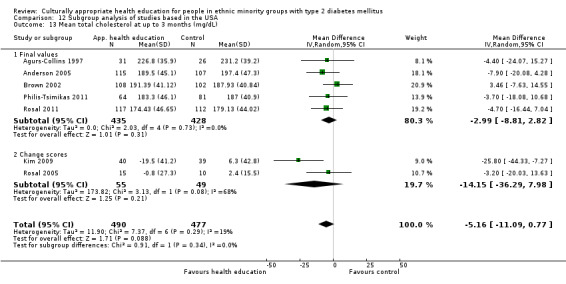
Comparison 12 Subgroup analysis of studies based in the USA, Outcome 13 Mean total cholesterol at up to 3 months (mg/dL).
12.14. Analysis.
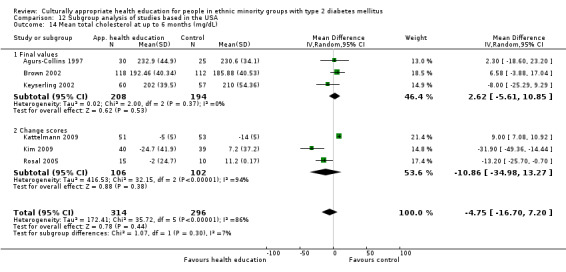
Comparison 12 Subgroup analysis of studies based in the USA, Outcome 14 Mean total cholesterol at up to 6 months (mg/dL).
12.15. Analysis.
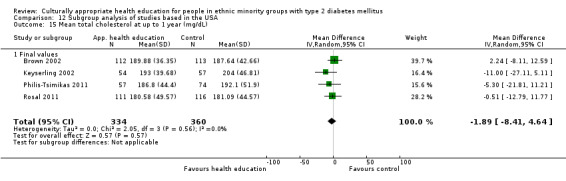
Comparison 12 Subgroup analysis of studies based in the USA, Outcome 15 Mean total cholesterol at up to 1 year (mg/dL).
12.16. Analysis.
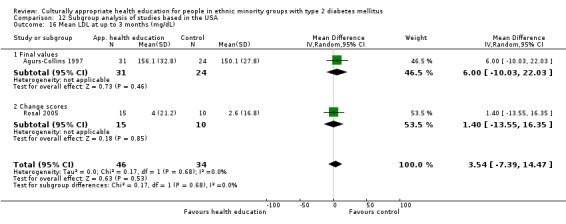
Comparison 12 Subgroup analysis of studies based in the USA, Outcome 16 Mean LDL at up to 3 months (mg/dL).
12.17. Analysis.
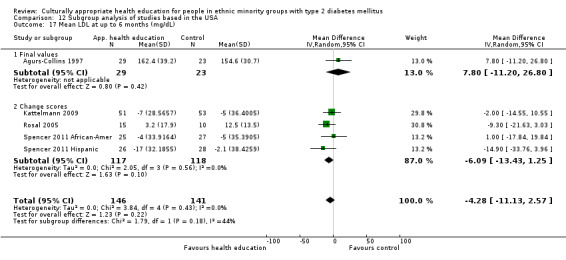
Comparison 12 Subgroup analysis of studies based in the USA, Outcome 17 Mean LDL at up to 6 months (mg/dL).
12.18. Analysis.
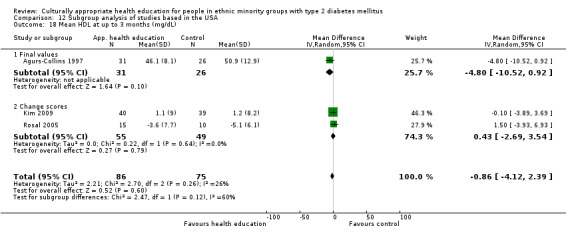
Comparison 12 Subgroup analysis of studies based in the USA, Outcome 18 Mean HDL at up to 3 months (mg/dL).
12.19. Analysis.
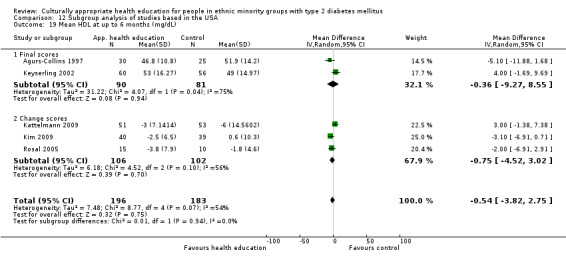
Comparison 12 Subgroup analysis of studies based in the USA, Outcome 19 Mean HDL at up to 6 months (mg/dL).
12.20. Analysis.
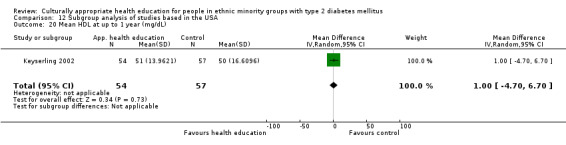
Comparison 12 Subgroup analysis of studies based in the USA, Outcome 20 Mean HDL at up to 1 year (mg/dL).
12.21. Analysis.
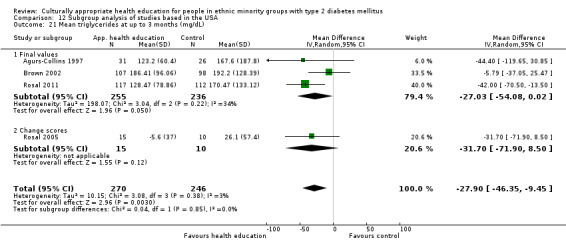
Comparison 12 Subgroup analysis of studies based in the USA, Outcome 21 Mean triglycerides at up to 3 months (mg/dL).
12.22. Analysis.
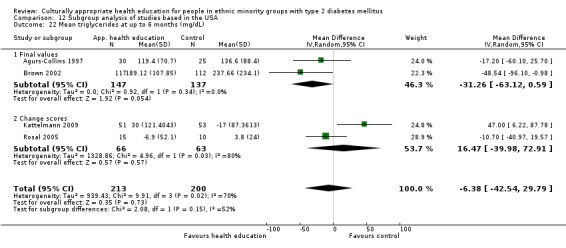
Comparison 12 Subgroup analysis of studies based in the USA, Outcome 22 Mean triglycerides at up to 6 months (mg/dL).
12.23. Analysis.
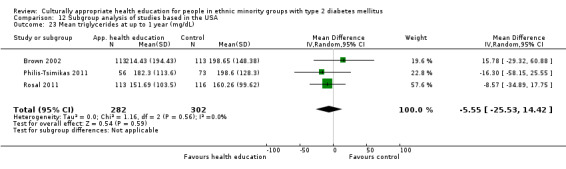
Comparison 12 Subgroup analysis of studies based in the USA, Outcome 23 Mean triglycerides at up to 1 year (mg/dL).
12.24. Analysis.
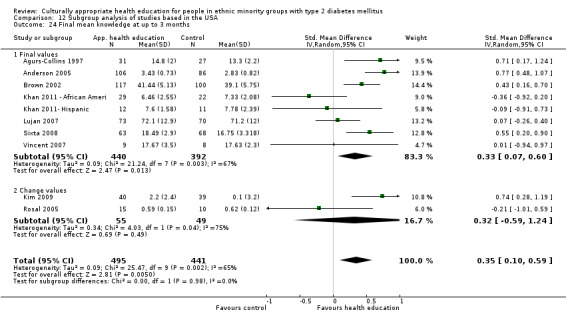
Comparison 12 Subgroup analysis of studies based in the USA, Outcome 24 Final mean knowledge at up to 3 months.
12.25. Analysis.
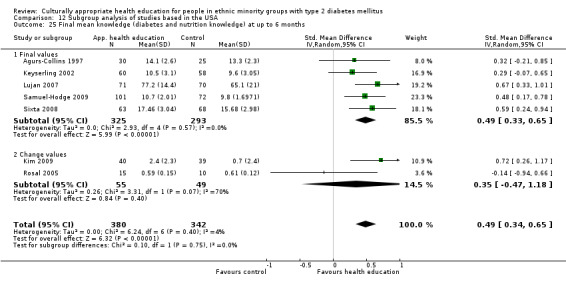
Comparison 12 Subgroup analysis of studies based in the USA, Outcome 25 Final mean knowledge (diabetes and nutrition knowledge) at up to 6 months.
12.26. Analysis.
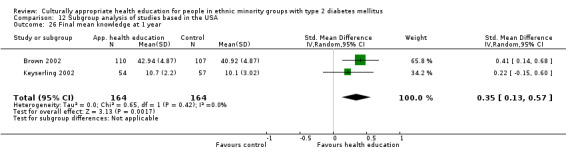
Comparison 12 Subgroup analysis of studies based in the USA, Outcome 26 Final mean knowledge at 1 year.
12.27. Analysis.
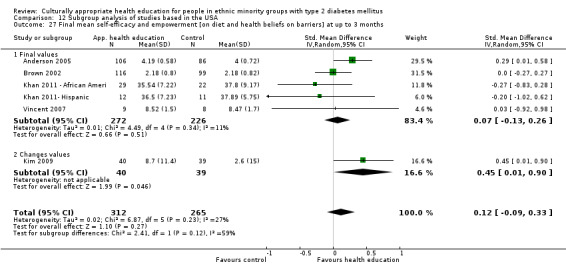
Comparison 12 Subgroup analysis of studies based in the USA, Outcome 27 Final mean self‐efficacy and empowerment [on diet and health beliefs on barriers] at up to 3 months.
12.28. Analysis.
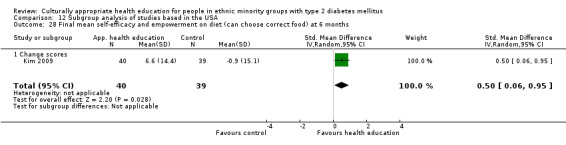
Comparison 12 Subgroup analysis of studies based in the USA, Outcome 28 Final mean self‐efficacy and empowerment on diet (can choose correct food) at 6 months.
12.29. Analysis.
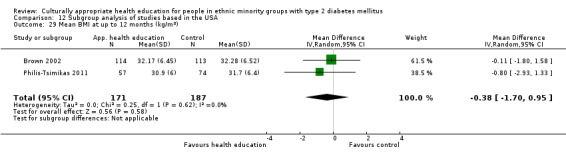
Comparison 12 Subgroup analysis of studies based in the USA, Outcome 29 Mean BMI at up to 12 months (kg/m2).
12.30. Analysis.
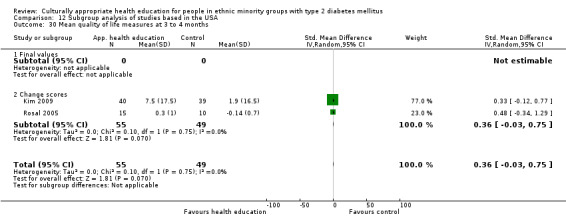
Comparison 12 Subgroup analysis of studies based in the USA, Outcome 30 Mean quality of life measures at 3 to 4 months.
12.31. Analysis.
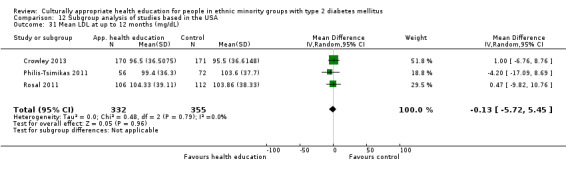
Comparison 12 Subgroup analysis of studies based in the USA, Outcome 31 Mean LDL at up to 12 months (mg/dL).
12.32. Analysis.
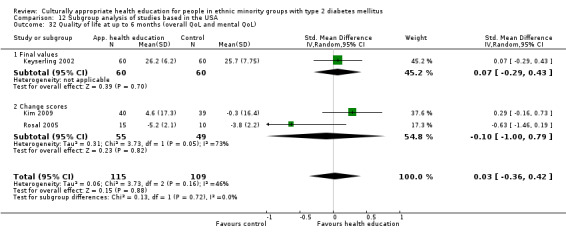
Comparison 12 Subgroup analysis of studies based in the USA, Outcome 32 Quality of life at up to 6 months (overall QoL and mental QoL).
12.33. Analysis.
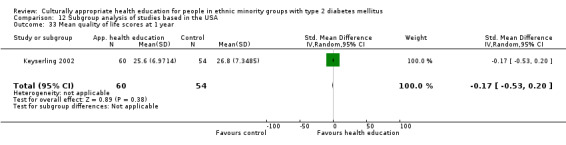
Comparison 12 Subgroup analysis of studies based in the USA, Outcome 33 Mean quality of life scores at 1 year.
12.34. Analysis.
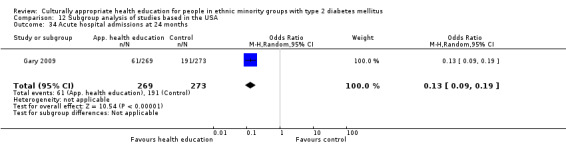
Comparison 12 Subgroup analysis of studies based in the USA, Outcome 34 Acute hospital admissions at 24 months.
12.35. Analysis.
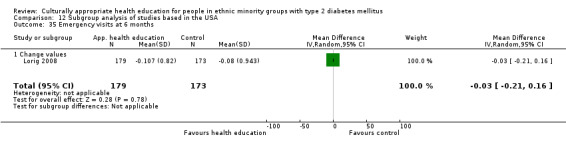
Comparison 12 Subgroup analysis of studies based in the USA, Outcome 35 Emergency visits at 6 months.
Comparison 13. Subgroup analysis of studies based in Europe.
| Outcome or subgroup title | No. of studies | No. of participants | Statistical method | Effect size |
|---|---|---|---|---|
| 1 Mean HbA1c at up to 6 months | 2 | 305 | Mean Difference (IV, Random, 95% CI) | ‐0.41 [‐0.71, ‐0.10] |
| 1.1 Final values | 1 | 192 | Mean Difference (IV, Random, 95% CI) | ‐0.34 [‐0.95, 0.27] |
| 1.2 Change scores | 1 | 113 | Mean Difference (IV, Random, 95% CI) | ‐0.43 [‐0.78, ‐0.08] |
| 2 Mean HbA1c at up to 1 year | 1 | 325 | Mean Difference (IV, Random, 95% CI) | ‐0.03 [‐0.35, 0.29] |
| 2.1 Final values | 0 | 0 | Mean Difference (IV, Random, 95% CI) | 0.0 [0.0, 0.0] |
| 2.2 Change scores | 1 | 325 | Mean Difference (IV, Random, 95% CI) | ‐0.03 [‐0.35, 0.29] |
| 3 Mean HbA1c at 24 months | 1 | 1473 | Mean Difference (IV, Random, 95% CI) | ‐0.18 [‐0.34, ‐0.01] |
| 3.1 Change value | 1 | 1473 | Mean Difference (IV, Random, 95% CI) | ‐0.18 [‐0.34, ‐0.01] |
| 4 Final mean knowledge (diabetes and nutrition knowledge) at up to 6 months | 2 | 272 | Std. Mean Difference (IV, Random, 95% CI) | 0.51 [‐0.19, 1.21] |
| 5 Final mean self‐efficacy and empowerment on diet (can choose correct food) at 6 months | 1 | 192 | Std. Mean Difference (IV, Random, 95% CI) | 0.95 [0.65, 1.25] |
| 5.1 Final values | 1 | 192 | Std. Mean Difference (IV, Random, 95% CI) | 0.95 [0.65, 1.25] |
13.1. Analysis.
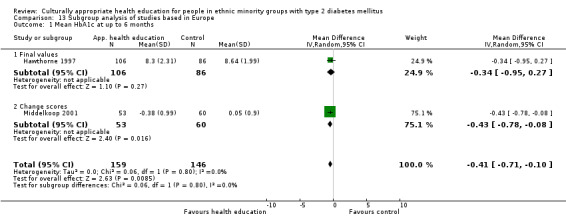
Comparison 13 Subgroup analysis of studies based in Europe, Outcome 1 Mean HbA1c at up to 6 months.
13.2. Analysis.
Comparison 13 Subgroup analysis of studies based in Europe, Outcome 2 Mean HbA1c at up to 1 year.
13.3. Analysis.
Comparison 13 Subgroup analysis of studies based in Europe, Outcome 3 Mean HbA1c at 24 months.
13.4. Analysis.
Comparison 13 Subgroup analysis of studies based in Europe, Outcome 4 Final mean knowledge (diabetes and nutrition knowledge) at up to 6 months.
13.5. Analysis.
Comparison 13 Subgroup analysis of studies based in Europe, Outcome 5 Final mean self‐efficacy and empowerment on diet (can choose correct food) at 6 months.
Comparison 14. Subgroup analysis of interventions lasting less than 3 months.
| Outcome or subgroup title | No. of studies | No. of participants | Statistical method | Effect size |
|---|---|---|---|---|
| 1 Mean HbA1c at up to 3 months | 9 | 638 | Mean Difference (IV, Random, 95% CI) | ‐0.28 [‐0.61, 0.04] |
| 1.1 Final values | 8 | 613 | Mean Difference (IV, Random, 95% CI) | ‐0.23 [‐0.59, 0.13] |
| 1.2 Change scores | 1 | 25 | Mean Difference (IV, Random, 95% CI) | ‐0.56 [‐1.12, ‐0.00] |
| 2 Mean HbA1c at up to 6 months | 5 | 737 | Mean Difference (IV, Random, 95% CI) | ‐0.43 [‐0.64, ‐0.23] |
| 2.1 Final values | 2 | 247 | Mean Difference (IV, Random, 95% CI) | ‐0.65 [‐1.71, 0.41] |
| 2.2 Change scores | 3 | 490 | Mean Difference (IV, Random, 95% CI) | ‐0.43 [‐0.65, ‐0.21] |
| 3 Mean HbA1c at 24 months | 1 | 109 | Mean Difference (IV, Random, 95% CI) | ‐0.80 [‐1.66, 0.06] |
| 4 Mean systolic blood pressure at up to 3 months (mm Hg) | 5 | 379 | Mean Difference (IV, Random, 95% CI) | 2.46 [‐1.75, 6.67] |
| 4.1 Final values | 4 | 354 | Mean Difference (IV, Random, 95% CI) | 2.18 [‐2.39, 6.76] |
| 4.2 Change scores | 1 | 25 | Mean Difference (IV, Random, 95% CI) | 4.0 [‐6.77, 14.77] |
| 5 Mean systolic blood pressure at up to 6 months (mm Hg) | 2 | 80 | Mean Difference (IV, Random, 95% CI) | ‐0.65 [‐9.25, 7.94] |
| 5.1 Final values | 1 | 55 | Mean Difference (IV, Random, 95% CI) | ‐1.0 [‐12.44, 10.44] |
| 5.2 Change scores | 1 | 25 | Mean Difference (IV, Random, 95% CI) | ‐0.20 [‐13.23, 12.83] |
| 6 Mean diastolic blood pressure at up to 3 months (mm Hg) | 5 | 377 | Mean Difference (IV, Random, 95% CI) | ‐0.45 [‐3.02, 2.12] |
| 6.1 Final values | 4 | 352 | Mean Difference (IV, Random, 95% CI) | ‐0.24 [‐3.25, 2.78] |
| 6.2 Change scores | 1 | 25 | Mean Difference (IV, Random, 95% CI) | ‐2.87 [‐9.97, 4.23] |
| 7 Mean diastolic blood pressure at up to 6 months (mm Hg) | 2 | 80 | Mean Difference (IV, Random, 95% CI) | ‐1.06 [‐5.81, 3.69] |
| 7.1 Final values | 1 | 55 | Mean Difference (IV, Random, 95% CI) | ‐1.0 [‐6.07, 4.07] |
| 7.2 Change scores | 1 | 25 | Mean Difference (IV, Random, 95% CI) | ‐1.47 [‐14.96, 12.02] |
| 8 Mean BMI at up to 3 months (kg/m2) | 3 | 99 | Mean Difference (IV, Random, 95% CI) | ‐0.46 [‐2.01, 1.08] |
| 8.1 Final values | 2 | 74 | Mean Difference (IV, Random, 95% CI) | ‐0.97 [‐3.32, 1.38] |
| 8.2 Change scores | 1 | 25 | Mean Difference (IV, Random, 95% CI) | ‐0.08 [‐2.13, 1.97] |
| 9 Mean BMI at up to 6 months (kg/m2) | 2 | 80 | Mean Difference (IV, Random, 95% CI) | ‐0.96 [‐3.19, 1.28] |
| 9.1 Final values | 1 | 55 | Mean Difference (IV, Random, 95% CI) | ‐2.70 [‐6.12, 0.72] |
| 9.2 Change scores | 1 | 25 | Mean Difference (IV, Random, 95% CI) | ‐0.21 [‐1.68, 1.26] |
| 10 Mean total cholesterol at up to 3 months (mg/dL) | 3 | 304 | Mean Difference (IV, Random, 95% CI) | ‐5.91 [‐14.72, 2.91] |
| 10.1 Final values | 2 | 279 | Mean Difference (IV, Random, 95% CI) | ‐6.93 [‐17.28, 3.42] |
| 10.2 Change scores | 1 | 25 | Mean Difference (IV, Random, 95% CI) | ‐3.2 [‐20.03, 13.63] |
| 11 Mean total cholesterol at up to 6 months (mg/dL) | 2 | 80 | Mean Difference (IV, Random, 95% CI) | ‐7.81 [‐22.28, 6.66] |
| 11.1 Final values | 1 | 55 | Mean Difference (IV, Random, 95% CI) | 2.30 [‐18.60, 23.20] |
| 11.2 Change scores | 1 | 25 | Mean Difference (IV, Random, 95% CI) | ‐13.2 [‐25.70, ‐0.70] |
| 12 Mean LDL at up to 3 months (mg/dL) | 2 | 80 | Mean Difference (IV, Random, 95% CI) | 3.54 [‐7.39, 14.47] |
| 12.1 Final values | 1 | 55 | Mean Difference (IV, Random, 95% CI) | 6.0 [‐10.03, 22.03] |
| 12.2 Change scores | 1 | 25 | Mean Difference (IV, Random, 95% CI) | 1.4 [‐13.55, 16.35] |
| 13 Mean LDL at up to 6 months (mg/dL) | 2 | 77 | Mean Difference (IV, Random, 95% CI) | ‐2.34 [‐18.81, 14.13] |
| 13.1 Final values | 1 | 52 | Mean Difference (IV, Random, 95% CI) | 7.80 [‐11.20, 26.80] |
| 13.2 Change scores | 1 | 25 | Mean Difference (IV, Random, 95% CI) | ‐9.3 [‐21.63, 3.03] |
| 14 Mean HDL at up to 3 months (mg/dL) | 2 | 82 | Mean Difference (IV, Random, 95% CI) | ‐1.58 [‐7.76, 4.59] |
| 14.1 Final values | 1 | 57 | Mean Difference (IV, Random, 95% CI) | ‐4.80 [‐10.52, 0.92] |
| 14.2 Change scores | 1 | 25 | Mean Difference (IV, Random, 95% CI) | 1.50 [‐3.93, 6.93] |
| 15 Mean HDL at up to 6 months (mg/dL) | 2 | 80 | Mean Difference (IV, Random, 95% CI) | ‐3.07 [‐7.04, 0.91] |
| 15.1 Final scores | 1 | 55 | Mean Difference (IV, Random, 95% CI) | ‐5.10 [‐11.88, 1.68] |
| 15.2 Change scores | 1 | 25 | Mean Difference (IV, Random, 95% CI) | 0.00 [‐6.91, 2.91] |
| 16 Mean triglycerides at up to 3 months (mg/dL) | 2 | 82 | Mean Difference (IV, Random, 95% CI) | ‐34.52 [‐69.98, 0.94] |
| 16.1 Final values | 1 | 57 | Mean Difference (IV, Random, 95% CI) | ‐44.40 [‐119.65, 30.85] |
| 16.2 Change scores | 1 | 25 | Mean Difference (IV, Random, 95% CI) | ‐31.70 [‐71.90, 8.50] |
| 17 Mean triglycerides at up to 6 months (mg/dL) | 2 | 80 | Mean Difference (IV, Random, 95% CI) | ‐12.86 [‐37.60, 11.87] |
| 17.1 Final values | 1 | 55 | Mean Difference (IV, Random, 95% CI) | ‐17.20 [‐60.10, 25.70] |
| 17.2 Change scores | 1 | 25 | Mean Difference (IV, Random, 95% CI) | ‐10.7 [‐40.97, 19.57] |
| 18 Final mean knowledge (diabetes and nutrition knowledge) at up to 3 months | 7 | 497 | Std. Mean Difference (IV, Random, 95% CI) | 0.29 [‐0.06, 0.64] |
| 18.1 Final values | 6 | 472 | Std. Mean Difference (IV, Random, 95% CI) | 0.36 [‐0.01, 0.72] |
| 18.2 Change scores | 1 | 25 | Std. Mean Difference (IV, Random, 95% CI) | ‐0.21 [‐1.01, 0.59] |
| 19 Final mean knowledge (diabetes and nutrition knowledge) at up to 6 months | 5 | 483 | Std. Mean Difference (IV, Random, 95% CI) | 0.43 [0.11, 0.76] |
| 19.1 Final values | 4 | 458 | Std. Mean Difference (IV, Random, 95% CI) | 0.51 [0.19, 0.83] |
| 19.2 Change scores | 1 | 25 | Std. Mean Difference (IV, Random, 95% CI) | ‐0.14 [‐0.94, 0.66] |
| 20 Final mean self‐efficacy and empowerment [on diet and health beliefs on barriers] at up to 3 months | 4 | 283 | Std. Mean Difference (IV, Random, 95% CI) | 0.07 [‐0.25, 0.38] |
| 20.1 Final values | 4 | 283 | Std. Mean Difference (IV, Random, 95% CI) | 0.07 [‐0.25, 0.38] |
| 20.2 Change scores | 0 | 0 | Std. Mean Difference (IV, Random, 95% CI) | 0.0 [0.0, 0.0] |
| 21 Final mean self‐efficacy and empowerment on diet (can choose correct food) at 6 months | 1 | 192 | Std. Mean Difference (IV, Random, 95% CI) | 0.95 [0.65, 1.25] |
| 21.1 Final values | 1 | 192 | Std. Mean Difference (IV, Random, 95% CI) | 0.95 [0.65, 1.25] |
| 22 Mean quality of life measures at 3 to 4 months | 1 | 25 | Std. Mean Difference (IV, Random, 95% CI) | 0.48 [‐0.34, 1.29] |
| 22.1 Final values | 0 | 0 | Std. Mean Difference (IV, Random, 95% CI) | 0.0 [0.0, 0.0] |
| 22.2 Change scores | 1 | 25 | Std. Mean Difference (IV, Random, 95% CI) | 0.48 [‐0.34, 1.29] |
| 23 QoL up to 6 months (overall QoL and mental QoL) | 1 | 25 | Std. Mean Difference (IV, Random, 95% CI) | ‐0.63 [‐1.46, 0.19] |
| 23.1 Change scores | 1 | 25 | Std. Mean Difference (IV, Random, 95% CI) | ‐0.63 [‐1.46, 0.19] |
| 24 Emergency visits at 6 months | 1 | 352 | Mean Difference (IV, Random, 95% CI) | ‐0.03 [‐0.21, 0.16] |
| 24.1 Change values | 1 | 352 | Mean Difference (IV, Random, 95% CI) | ‐0.03 [‐0.21, 0.16] |
14.1. Analysis.
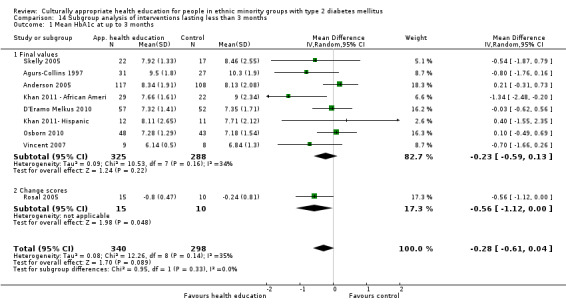
Comparison 14 Subgroup analysis of interventions lasting less than 3 months, Outcome 1 Mean HbA1c at up to 3 months.
14.2. Analysis.
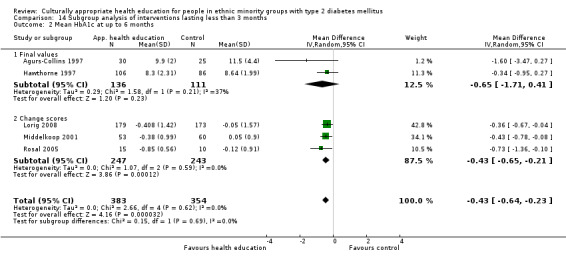
Comparison 14 Subgroup analysis of interventions lasting less than 3 months, Outcome 2 Mean HbA1c at up to 6 months.
14.3. Analysis.
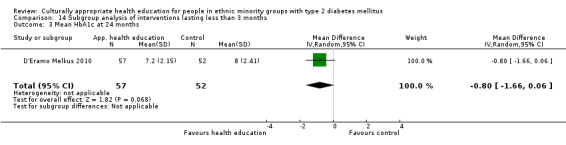
Comparison 14 Subgroup analysis of interventions lasting less than 3 months, Outcome 3 Mean HbA1c at 24 months.
14.4. Analysis.
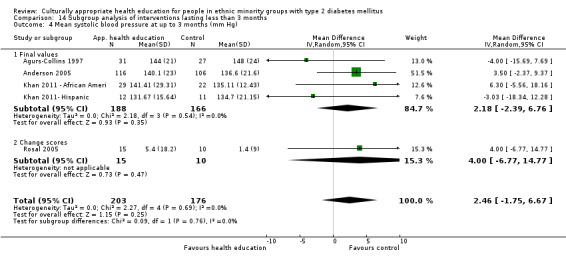
Comparison 14 Subgroup analysis of interventions lasting less than 3 months, Outcome 4 Mean systolic blood pressure at up to 3 months (mm Hg).
14.5. Analysis.
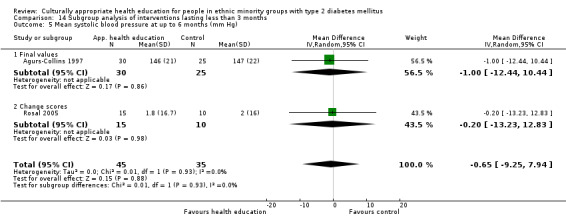
Comparison 14 Subgroup analysis of interventions lasting less than 3 months, Outcome 5 Mean systolic blood pressure at up to 6 months (mm Hg).
14.6. Analysis.
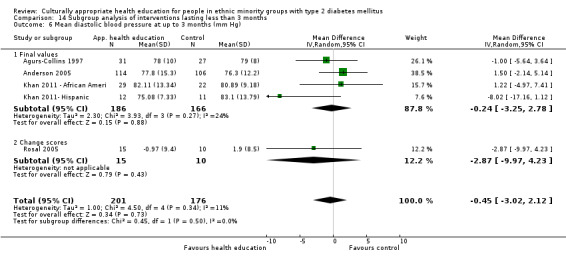
Comparison 14 Subgroup analysis of interventions lasting less than 3 months, Outcome 6 Mean diastolic blood pressure at up to 3 months (mm Hg).
14.7. Analysis.
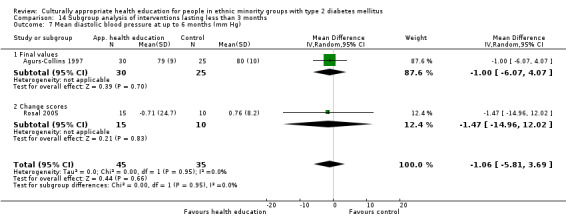
Comparison 14 Subgroup analysis of interventions lasting less than 3 months, Outcome 7 Mean diastolic blood pressure at up to 6 months (mm Hg).
14.8. Analysis.
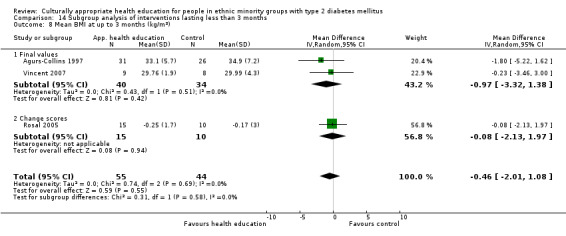
Comparison 14 Subgroup analysis of interventions lasting less than 3 months, Outcome 8 Mean BMI at up to 3 months (kg/m2).
14.9. Analysis.
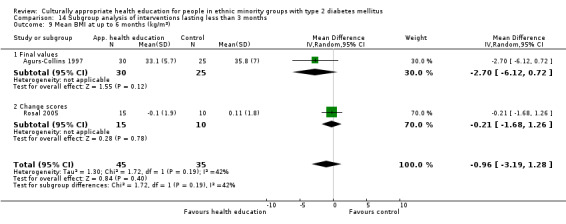
Comparison 14 Subgroup analysis of interventions lasting less than 3 months, Outcome 9 Mean BMI at up to 6 months (kg/m2).
14.10. Analysis.
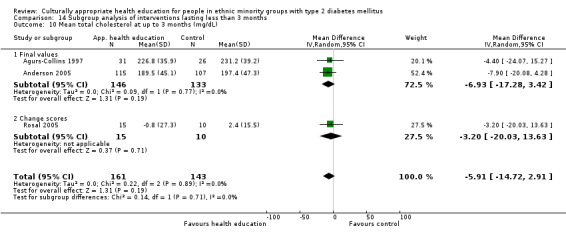
Comparison 14 Subgroup analysis of interventions lasting less than 3 months, Outcome 10 Mean total cholesterol at up to 3 months (mg/dL).
14.11. Analysis.
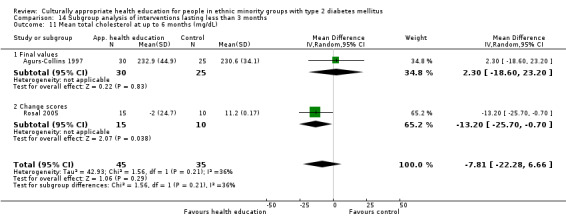
Comparison 14 Subgroup analysis of interventions lasting less than 3 months, Outcome 11 Mean total cholesterol at up to 6 months (mg/dL).
14.12. Analysis.
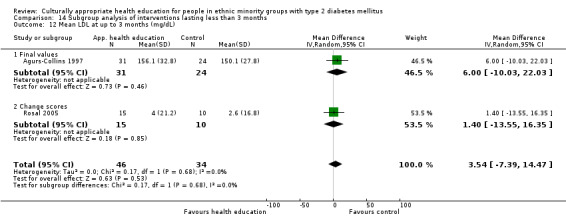
Comparison 14 Subgroup analysis of interventions lasting less than 3 months, Outcome 12 Mean LDL at up to 3 months (mg/dL).
14.13. Analysis.
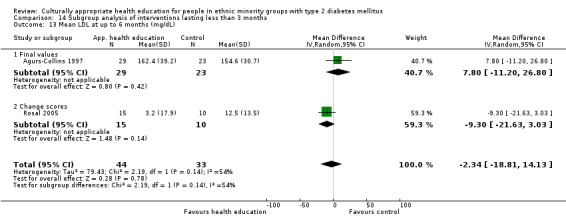
Comparison 14 Subgroup analysis of interventions lasting less than 3 months, Outcome 13 Mean LDL at up to 6 months (mg/dL).
14.14. Analysis.
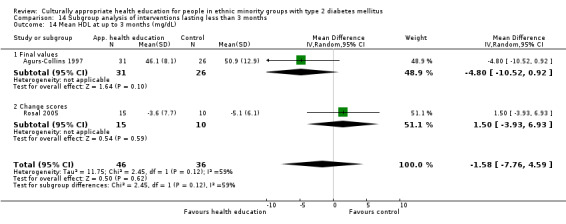
Comparison 14 Subgroup analysis of interventions lasting less than 3 months, Outcome 14 Mean HDL at up to 3 months (mg/dL).
14.15. Analysis.
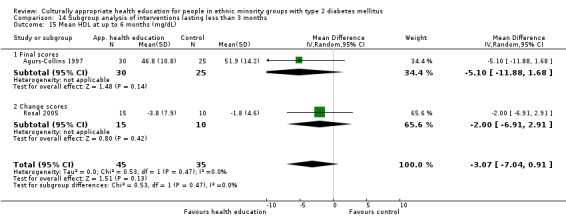
Comparison 14 Subgroup analysis of interventions lasting less than 3 months, Outcome 15 Mean HDL at up to 6 months (mg/dL).
14.16. Analysis.
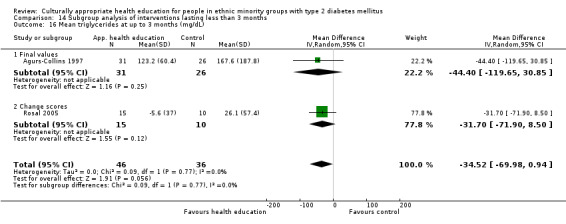
Comparison 14 Subgroup analysis of interventions lasting less than 3 months, Outcome 16 Mean triglycerides at up to 3 months (mg/dL).
14.17. Analysis.
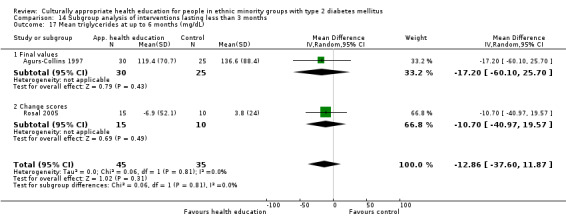
Comparison 14 Subgroup analysis of interventions lasting less than 3 months, Outcome 17 Mean triglycerides at up to 6 months (mg/dL).
14.18. Analysis.
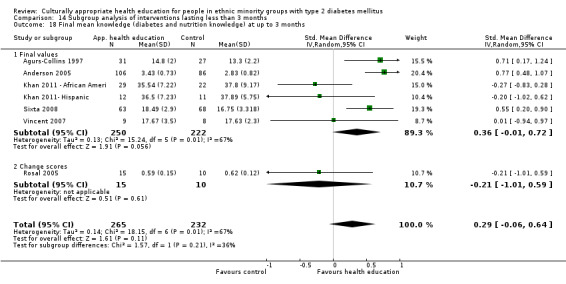
Comparison 14 Subgroup analysis of interventions lasting less than 3 months, Outcome 18 Final mean knowledge (diabetes and nutrition knowledge) at up to 3 months.
14.19. Analysis.
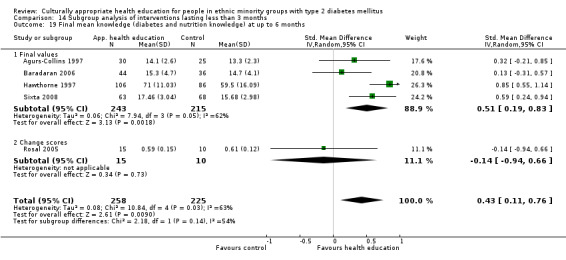
Comparison 14 Subgroup analysis of interventions lasting less than 3 months, Outcome 19 Final mean knowledge (diabetes and nutrition knowledge) at up to 6 months.
14.20. Analysis.
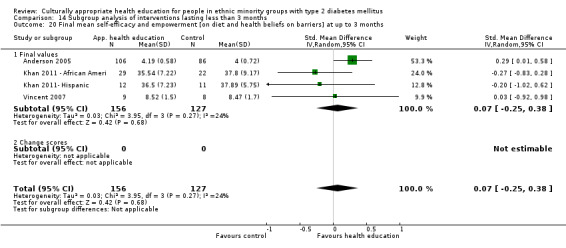
Comparison 14 Subgroup analysis of interventions lasting less than 3 months, Outcome 20 Final mean self‐efficacy and empowerment [on diet and health beliefs on barriers] at up to 3 months.
14.21. Analysis.
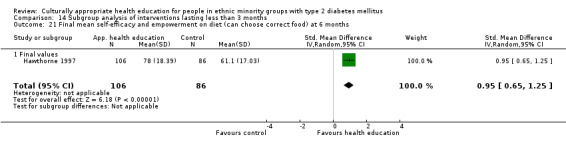
Comparison 14 Subgroup analysis of interventions lasting less than 3 months, Outcome 21 Final mean self‐efficacy and empowerment on diet (can choose correct food) at 6 months.
14.22. Analysis.
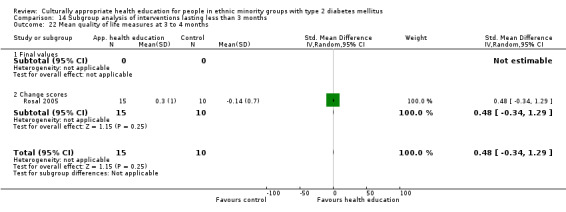
Comparison 14 Subgroup analysis of interventions lasting less than 3 months, Outcome 22 Mean quality of life measures at 3 to 4 months.
14.23. Analysis.
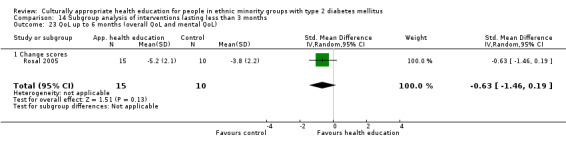
Comparison 14 Subgroup analysis of interventions lasting less than 3 months, Outcome 23 QoL up to 6 months (overall QoL and mental QoL).
14.24. Analysis.
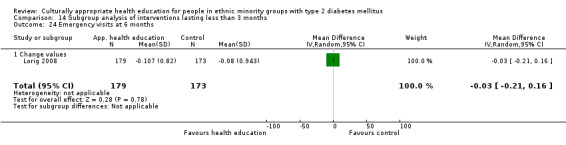
Comparison 14 Subgroup analysis of interventions lasting less than 3 months, Outcome 24 Emergency visits at 6 months.
Comparison 15. Subgroup analysis of interventions lasting longer than 3 months.
| Outcome or subgroup title | No. of studies | No. of participants | Statistical method | Effect size |
|---|---|---|---|---|
| 1 HbA1c at 3 months | 5 | 804 | Mean Difference (IV, Random, 95% CI) | ‐0.51 [‐0.92, ‐0.11] |
| 1.1 Mean values | 3 | 495 | Mean Difference (IV, Random, 95% CI) | ‐0.23 [‐0.60, 0.14] |
| 1.2 Change scores | 2 | 309 | Mean Difference (IV, Random, 95% CI) | ‐0.87 [‐1.62, ‐0.12] |
| 2 Mean HbA1c at up to 6 months | 8 | 955 | Mean Difference (IV, Random, 95% CI) | ‐0.65 [‐1.00, ‐0.30] |
| 2.1 Final values | 4 | 659 | Mean Difference (IV, Random, 95% CI) | ‐0.62 [‐1.09, ‐0.15] |
| 2.2 Change scores | 4 | 296 | Mean Difference (IV, Random, 95% CI) | ‐0.68 [‐1.29, ‐0.06] |
| 3 Mean HbA1c at up to 1 year | 8 | 1686 | Mean Difference (IV, Random, 95% CI) | ‐0.22 [‐0.38, ‐0.05] |
| 3.1 Final values | 6 | 1131 | Mean Difference (IV, Random, 95% CI) | ‐0.28 [‐0.51, ‐0.05] |
| 3.2 Change scores | 2 | 555 | Mean Difference (IV, Random, 95% CI) | ‐0.10 [‐0.37, 0.18] |
| 4 HbA1c at 24 months | 3 | 2159 | Mean Difference (IV, Random, 95% CI) | ‐0.29 [‐0.57, ‐0.01] |
| 4.1 Change value | 2 | 2015 | Mean Difference (IV, Random, 95% CI) | ‐0.16 [‐0.31, ‐0.02] |
| 4.2 Final values | 1 | 144 | Mean Difference (IV, Random, 95% CI) | ‐0.69 [‐1.09, ‐0.29] |
| 5 BMI at 3 months | 2 | 298 | Mean Difference (IV, Random, 95% CI) | 0.02 [‐0.50, 0.53] |
| 6 Mean BMI at 6 months | 5 | 527 | Mean Difference (IV, Random, 95% CI) | ‐0.16 [‐0.61, 0.28] |
| 6.1 Mean value | 1 | 227 | Mean Difference (IV, Random, 95% CI) | ‐0.77 [‐2.43, 0.89] |
| 6.2 Change value | 4 | 300 | Mean Difference (IV, Random, 95% CI) | ‐0.10 [‐0.61, 0.41] |
| 7 Systolic blood pressure at 3 months | 2 | 306 | Mean Difference (IV, Random, 95% CI) | ‐0.76 [‐7.12, 5.59] |
| 7.1 Final values | 1 | 227 | Mean Difference (IV, Random, 95% CI) | ‐3.29 [‐8.02, 1.44] |
| 7.2 Change scores | 1 | 79 | Mean Difference (IV, Random, 95% CI) | 3.4 [‐4.63, 11.43] |
| 8 Systolic blood pressure at 6 months | 5 | 475 | Mean Difference (IV, Random, 95% CI) | 1.85 [0.01, 3.69] |
| 8.1 Mean value | 1 | 173 | Mean Difference (IV, Random, 95% CI) | 2.0 [‐0.38, 4.38] |
| 8.2 Change scores | 4 | 302 | Mean Difference (IV, Random, 95% CI) | 1.62 [‐1.28, 4.53] |
| 9 Mean systolic blood pressure at up to 1 year (mm Hg) | 3 | 753 | Mean Difference (IV, Random, 95% CI) | 0.77 [‐2.27, 3.81] |
| 9.1 Final values | 3 | 753 | Mean Difference (IV, Random, 95% CI) | 0.77 [‐2.27, 3.81] |
| 10 Diastolic blood pressure at 3 months | 2 | 306 | Mean Difference (IV, Random, 95% CI) | ‐1.69 [‐3.83, 0.45] |
| 10.1 Change scores | 1 | 79 | Mean Difference (IV, Random, 95% CI) | ‐1.1 [‐5.20, 3.00] |
| 10.2 Final values | 1 | 227 | Mean Difference (IV, Random, 95% CI) | ‐1.91 [‐4.42, 0.60] |
| 11 Diastolic blood pressure at 6 months | 6 | 593 | Mean Difference (IV, Random, 95% CI) | 1.44 [0.39, 2.49] |
| 11.1 Mean values | 2 | 291 | Mean Difference (IV, Random, 95% CI) | 1.81 [‐0.23, 3.86] |
| 11.2 Change scores | 4 | 302 | Mean Difference (IV, Random, 95% CI) | 0.99 [‐1.00, 2.99] |
| 12 Mean diastolic blood pressure at up to 1 year (mm Hg) | 2 | 394 | Mean Difference (IV, Random, 95% CI) | 0.03 [‐3.78, 3.84] |
| 12.1 Final values | 2 | 394 | Mean Difference (IV, Random, 95% CI) | 0.03 [‐3.78, 3.84] |
| 13 Mean total cholesterol at up to 3 months (mg/dL) | 4 | 663 | Mean Difference (IV, Random, 95% CI) | ‐5.94 [‐16.33, 4.46] |
| 13.1 Final values | 3 | 584 | Mean Difference (IV, Random, 95% CI) | ‐1.18 [‐8.21, 5.85] |
| 13.2 Change scores | 1 | 79 | Mean Difference (IV, Random, 95% CI) | ‐25.8 [‐44.33, ‐7.27] |
| 14 Mean total cholesterol at up to 6 months (mg/dL) | 4 | 530 | Mean Difference (IV, Random, 95% CI) | ‐5.18 [‐22.16, 11.81] |
| 14.1 Final values | 2 | 347 | Mean Difference (IV, Random, 95% CI) | 0.98 [‐12.91, 14.88] |
| 14.2 Change scores | 2 | 183 | Mean Difference (IV, Random, 95% CI) | ‐11.09 [‐51.17, 28.98] |
| 15 Mean total cholesterol at up to 1 year (mg/dL) | 5 | 1019 | Mean Difference (IV, Random, 95% CI) | ‐0.39 [‐0.64, ‐0.14] |
| 15.1 Final values | 4 | 694 | Mean Difference (IV, Random, 95% CI) | ‐1.89 [‐8.41, 4.64] |
| 15.2 Change scores | 1 | 325 | Mean Difference (IV, Random, 95% CI) | ‐0.39 [‐0.64, ‐0.14] |
| 16 Mean LDL at up to 3 months (mg/dL) | 2 | 299 | Mean Difference (IV, Random, 95% CI) | ‐11.35 [‐47.92, 25.21] |
| 16.1 Final values | 1 | 220 | Mean Difference (IV, Random, 95% CI) | ‐0.56 [‐10.26, 9.14] |
| 16.2 Change scores | 1 | 79 | Mean Difference (IV, Random, 95% CI) | ‐43.60 [‐103.94, 16.74] |
| 17 LDL cholesterol at 6 months | 4 | 289 | Mean Difference (IV, Random, 95% CI) | ‐6.31 [‐17.59, 4.98] |
| 17.1 Mean value | 0 | 0 | Mean Difference (IV, Random, 95% CI) | 0.0 [0.0, 0.0] |
| 17.2 Change scores | 4 | 289 | Mean Difference (IV, Random, 95% CI) | ‐6.31 [‐17.59, 4.98] |
| 18 Mean LDL at up to 12 months (mg/dL) | 2 | 559 | Mean Difference (IV, Random, 95% CI) | 0.81 [‐5.39, 7.00] |
| 18.1 Final values | 2 | 559 | Mean Difference (IV, Random, 95% CI) | 0.81 [‐5.39, 7.00] |
| 19 Mean HDL at up to 3 months (mg/dL) | 2 | 308 | Mean Difference (IV, Random, 95% CI) | 0.57 [‐1.50, 2.64] |
| 19.1 Final values | 1 | 229 | Mean Difference (IV, Random, 95% CI) | 0.85 [‐1.62, 3.32] |
| 19.2 Change scores | 1 | 79 | Mean Difference (IV, Random, 95% CI) | ‐0.10 [‐3.89, 3.69] |
| 20 Mean HDL cholesterol at 6 months | 3 | 299 | Mean Difference (IV, Random, 95% CI) | 1.01 [‐3.61, 5.63] |
| 20.1 Mean values | 1 | 116 | Mean Difference (IV, Random, 95% CI) | 4.0 [‐1.69, 9.69] |
| 20.2 Change scores | 2 | 183 | Mean Difference (IV, Random, 95% CI) | ‐0.15 [‐6.12, 5.82] |
| 21 Mean HDL at up to 1 year (mg/dL) | 2 | 340 | Mean Difference (IV, Random, 95% CI) | 0.35 [‐1.88, 2.57] |
| 22 Mean triglycerides at up to 3 months (mg/dL) | 3 | 513 | Mean Difference (IV, Random, 95% CI) | ‐29.83 [‐64.81, 5.16] |
| 22.1 Final values | 2 | 434 | Mean Difference (IV, Random, 95% CI) | ‐24.49 [‐59.96, 10.98] |
| 22.2 Change scores | 1 | 79 | Mean Difference (IV, Random, 95% CI) | ‐98.3 [‐221.16, 24.56] |
| 23 Mean triglycerides at up to 6 months (mg/dL) | 3 | 412 | Mean Difference (IV, Random, 95% CI) | ‐17.21 [‐97.48, 63.07] |
| 23.1 Final values | 1 | 229 | Mean Difference (IV, Random, 95% CI) | ‐48.54 [‐96.10, ‐0.98] |
| 23.2 Change scores | 2 | 183 | Mean Difference (IV, Random, 95% CI) | ‐2.55 [‐124.28, 119.18] |
| 24 Mean triglycerides at up to 1 year (mg/dL) | 2 | 455 | Mean Difference (IV, Random, 95% CI) | ‐2.38 [‐25.11, 20.35] |
| 25 Diabetes knowledge at 3 months | 3 | 439 | Std. Mean Difference (IV, Random, 95% CI) | 0.39 [0.05, 0.73] |
| 25.1 Final values | 2 | 360 | Std. Mean Difference (IV, Random, 95% CI) | 0.26 [‐0.09, 0.61] |
| 25.2 Change values | 1 | 79 | Std. Mean Difference (IV, Random, 95% CI) | 0.74 [0.28, 1.19] |
| 26 Diabetes knowledge at 6 months | 4 | 511 | Std. Mean Difference (IV, Random, 95% CI) | 0.52 [0.34, 0.70] |
| 26.1 Final values | 3 | 432 | Std. Mean Difference (IV, Random, 95% CI) | 0.49 [0.28, 0.69] |
| 26.2 Change values | 1 | 79 | Std. Mean Difference (IV, Random, 95% CI) | 0.72 [0.26, 1.17] |
| 27 Final mean knowledge at 1 year | 2 | 328 | Std. Mean Difference (IV, Random, 95% CI) | 0.35 [0.13, 0.57] |
| 28 Mean BMI at up to 12 months (kg/m2) | 1 | 227 | Mean Difference (IV, Random, 95% CI) | ‐0.11 [‐1.80, 1.58] |
| 29 Quality of life at 3 months | 1 | 79 | Std. Mean Difference (IV, Random, 95% CI) | 0.33 [‐0.12, 0.77] |
| 29.1 Change scores | 1 | 79 | Std. Mean Difference (IV, Random, 95% CI) | 0.33 [‐0.12, 0.77] |
| 30 Quality of life at 6 months | 2 | 199 | Mean Difference (IV, Random, 95% CI) | 1.25 [‐1.99, 4.50] |
| 30.1 Final values | 1 | 120 | Mean Difference (IV, Random, 95% CI) | 0.5 [‐2.01, 3.01] |
| 30.2 Change scores | 1 | 79 | Mean Difference (IV, Random, 95% CI) | 4.90 [‐2.53, 12.33] |
| 31 Mean quality of life scores at 1 year | 1 | 114 | Mean Difference (IV, Random, 95% CI) | ‐1.20 [‐3.84, 1.44] |
| 32 Acute hospital admissions at 24 months | 1 | 542 | Odds Ratio (M‐H, Random, 95% CI) | 0.13 [0.09, 0.19] |
15.1. Analysis.
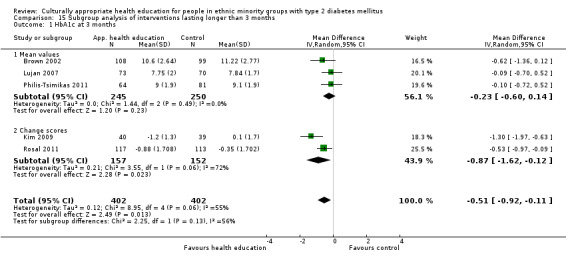
Comparison 15 Subgroup analysis of interventions lasting longer than 3 months, Outcome 1 HbA1c at 3 months.
15.2. Analysis.
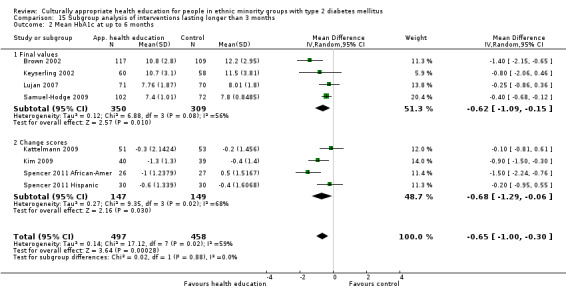
Comparison 15 Subgroup analysis of interventions lasting longer than 3 months, Outcome 2 Mean HbA1c at up to 6 months.
15.3. Analysis.
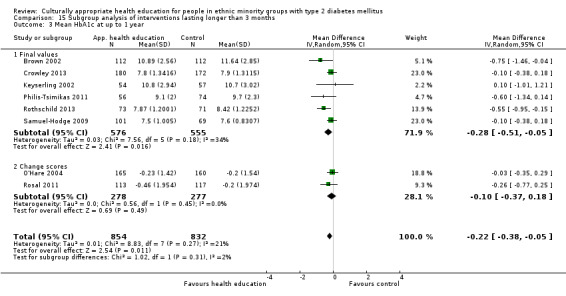
Comparison 15 Subgroup analysis of interventions lasting longer than 3 months, Outcome 3 Mean HbA1c at up to 1 year.
15.4. Analysis.
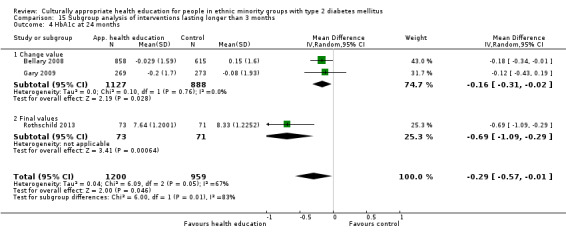
Comparison 15 Subgroup analysis of interventions lasting longer than 3 months, Outcome 4 HbA1c at 24 months.
15.5. Analysis.
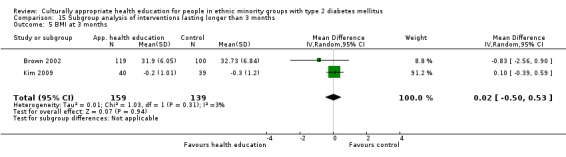
Comparison 15 Subgroup analysis of interventions lasting longer than 3 months, Outcome 5 BMI at 3 months.
15.6. Analysis.
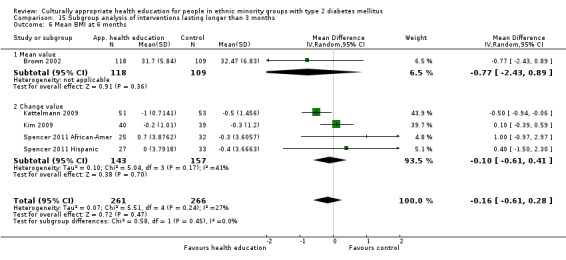
Comparison 15 Subgroup analysis of interventions lasting longer than 3 months, Outcome 6 Mean BMI at 6 months.
15.7. Analysis.
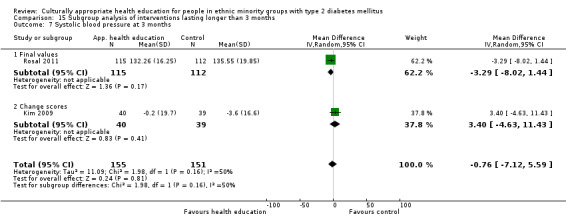
Comparison 15 Subgroup analysis of interventions lasting longer than 3 months, Outcome 7 Systolic blood pressure at 3 months.
15.8. Analysis.
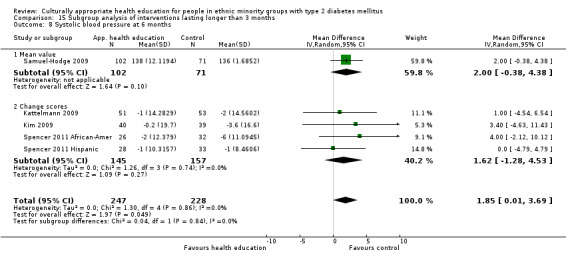
Comparison 15 Subgroup analysis of interventions lasting longer than 3 months, Outcome 8 Systolic blood pressure at 6 months.
15.9. Analysis.
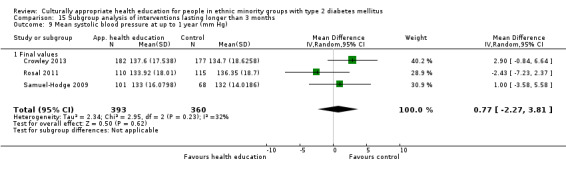
Comparison 15 Subgroup analysis of interventions lasting longer than 3 months, Outcome 9 Mean systolic blood pressure at up to 1 year (mm Hg).
15.10. Analysis.
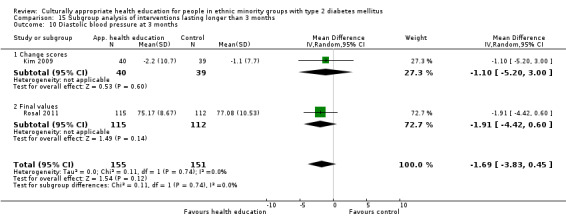
Comparison 15 Subgroup analysis of interventions lasting longer than 3 months, Outcome 10 Diastolic blood pressure at 3 months.
15.11. Analysis.
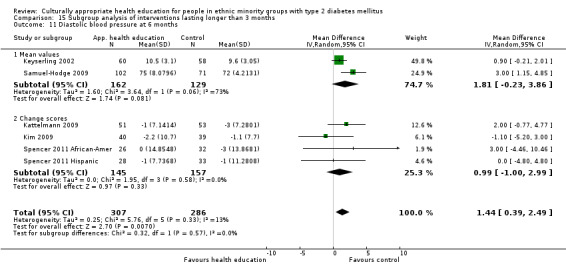
Comparison 15 Subgroup analysis of interventions lasting longer than 3 months, Outcome 11 Diastolic blood pressure at 6 months.
15.12. Analysis.
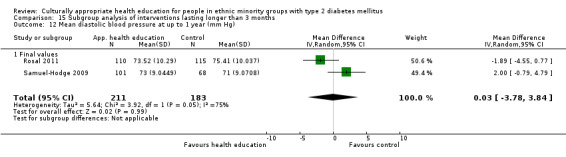
Comparison 15 Subgroup analysis of interventions lasting longer than 3 months, Outcome 12 Mean diastolic blood pressure at up to 1 year (mm Hg).
15.13. Analysis.
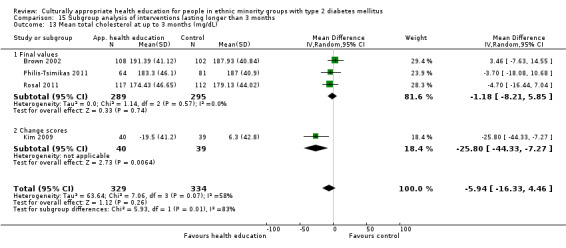
Comparison 15 Subgroup analysis of interventions lasting longer than 3 months, Outcome 13 Mean total cholesterol at up to 3 months (mg/dL).
15.14. Analysis.
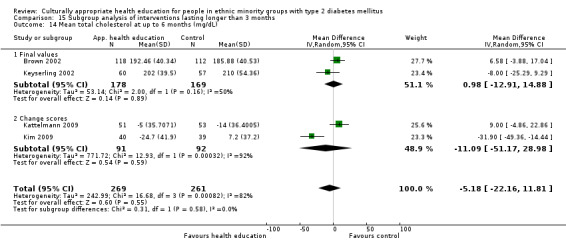
Comparison 15 Subgroup analysis of interventions lasting longer than 3 months, Outcome 14 Mean total cholesterol at up to 6 months (mg/dL).
15.15. Analysis.
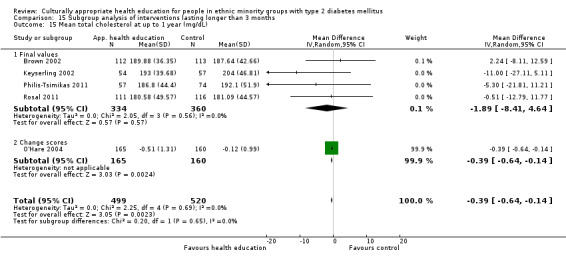
Comparison 15 Subgroup analysis of interventions lasting longer than 3 months, Outcome 15 Mean total cholesterol at up to 1 year (mg/dL).
15.16. Analysis.
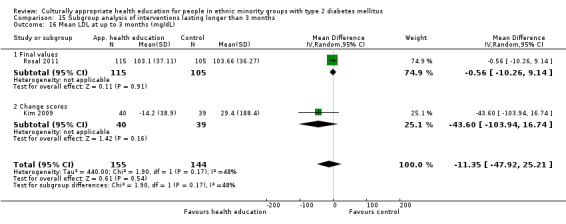
Comparison 15 Subgroup analysis of interventions lasting longer than 3 months, Outcome 16 Mean LDL at up to 3 months (mg/dL).
15.17. Analysis.
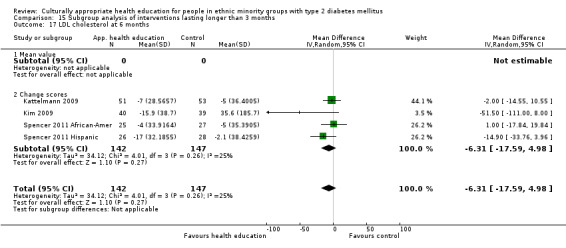
Comparison 15 Subgroup analysis of interventions lasting longer than 3 months, Outcome 17 LDL cholesterol at 6 months.
15.18. Analysis.
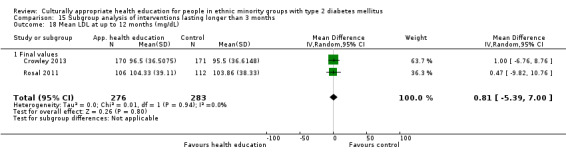
Comparison 15 Subgroup analysis of interventions lasting longer than 3 months, Outcome 18 Mean LDL at up to 12 months (mg/dL).
15.19. Analysis.
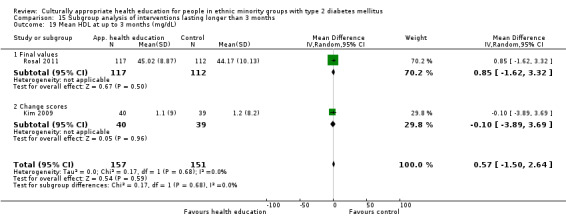
Comparison 15 Subgroup analysis of interventions lasting longer than 3 months, Outcome 19 Mean HDL at up to 3 months (mg/dL).
15.20. Analysis.
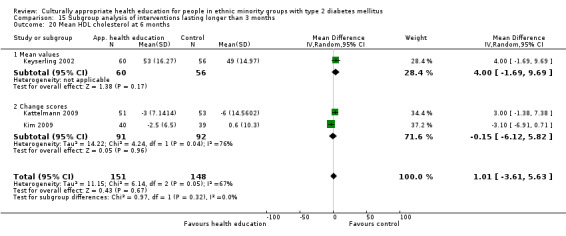
Comparison 15 Subgroup analysis of interventions lasting longer than 3 months, Outcome 20 Mean HDL cholesterol at 6 months.
15.21. Analysis.
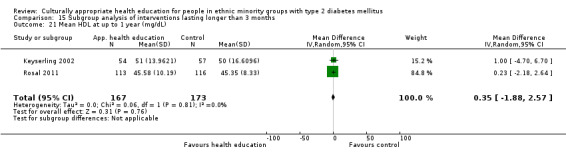
Comparison 15 Subgroup analysis of interventions lasting longer than 3 months, Outcome 21 Mean HDL at up to 1 year (mg/dL).
15.22. Analysis.
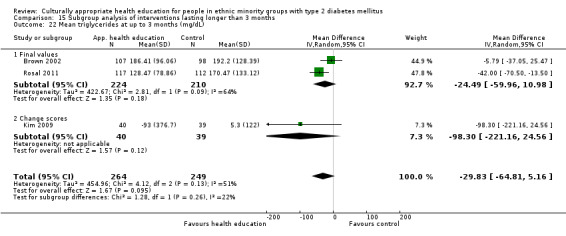
Comparison 15 Subgroup analysis of interventions lasting longer than 3 months, Outcome 22 Mean triglycerides at up to 3 months (mg/dL).
15.23. Analysis.
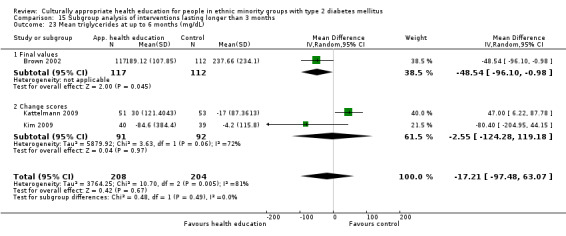
Comparison 15 Subgroup analysis of interventions lasting longer than 3 months, Outcome 23 Mean triglycerides at up to 6 months (mg/dL).
15.24. Analysis.
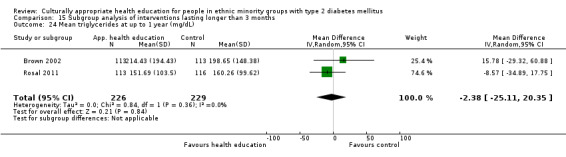
Comparison 15 Subgroup analysis of interventions lasting longer than 3 months, Outcome 24 Mean triglycerides at up to 1 year (mg/dL).
15.25. Analysis.
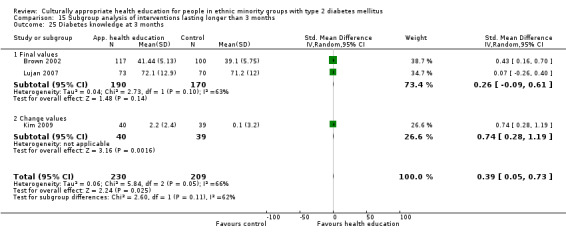
Comparison 15 Subgroup analysis of interventions lasting longer than 3 months, Outcome 25 Diabetes knowledge at 3 months.
15.26. Analysis.
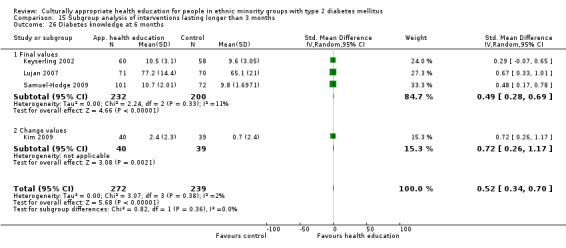
Comparison 15 Subgroup analysis of interventions lasting longer than 3 months, Outcome 26 Diabetes knowledge at 6 months.
15.27. Analysis.
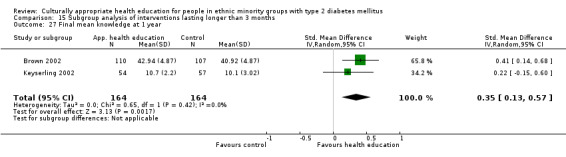
Comparison 15 Subgroup analysis of interventions lasting longer than 3 months, Outcome 27 Final mean knowledge at 1 year.
15.28. Analysis.
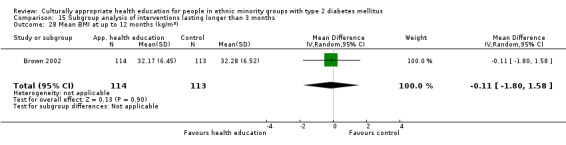
Comparison 15 Subgroup analysis of interventions lasting longer than 3 months, Outcome 28 Mean BMI at up to 12 months (kg/m2).
15.29. Analysis.
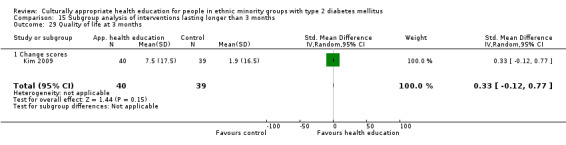
Comparison 15 Subgroup analysis of interventions lasting longer than 3 months, Outcome 29 Quality of life at 3 months.
15.30. Analysis.
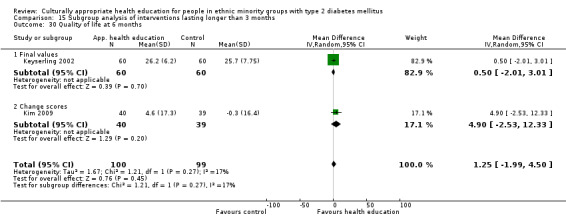
Comparison 15 Subgroup analysis of interventions lasting longer than 3 months, Outcome 30 Quality of life at 6 months.
15.31. Analysis.
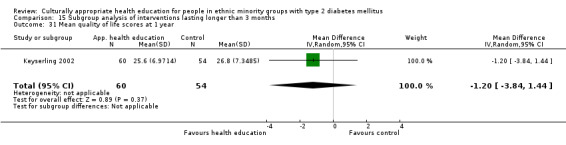
Comparison 15 Subgroup analysis of interventions lasting longer than 3 months, Outcome 31 Mean quality of life scores at 1 year.
Characteristics of studies
Characteristics of included studies [ordered by study ID]
Agurs‐Collins 1997.
| Methods |
Parallel randomised controlled clinical trial (RCT) Randomisation ratio: 1:1 Superiority design |
|
| Participants |
Inclusion criteria:
Exclusion criteria: not explicitly stated (but see inclusion criteria) Diagnostic criteria: by medical history |
|
| Interventions |
Number of study centres: not stated Treatment before study: not stated if previous HE Intervention: weekly nutrition sessions (60 minutes) with exercise training (30 minutes) for 3 months; following 3 months on biweekly problem‐solving (90 minutes) sessions. Also 1 individual counselling session Control: 1 class on glycaemic control at 3 weeks from start; 2 letters with written information on nutrition. Participants were given the results of blood tests Provider: dietician and exercise physiotherapist with experience in working with African Americans |
|
| Outcomes |
Outcomes reported in abstract of publication: Primary outcomes(s): HbA1c (hypothesis testing) Secondary outcome(s):
|
|
| Study details |
Run‐in period: not stated Study terminated before regular end: yes—stopped before target of 40 per treatment arm because of time and funding constraints |
|
| Publication details |
Language of publication: English Funding: dissertation research grant, partially funded by the National Institute of Aging and the National Institutes of Health Publication status: peer review journal |
|
| Stated aim of study | Quote from publication: "The objective was to evaluate a weight loss and exercise programme designed to improve diabetes management in older African Americans" | |
| Notes | — | |
| Risk of bias | ||
| Bias | Authors' judgement | Support for judgement |
| Random sequence generation (selection bias) | Unclear risk | Quote from publication: "Randomization was supervised by the study statistician..." Comment: split into groups depending on medication or dietary therapy, and then "assigned randomly with 1:1 ratio within medication strata" |
| Allocation concealment (selection bias) | Unclear risk | Comment: no mention |
| Blinding of participants and personnel (performance bias) Objective outcomes | High risk | Quote from publication: "One of the authors, a registered dietician experienced in working with older African‐Americans delivered the intervention program..." Comment: participants and staff not blinded because of the nature of the study |
| Blinding of participants and personnel (performance bias) Subjective outcomes | High risk | Comment: not blinded |
| Blinding of outcome assessment (detection bias) Lab tests: Lipids, HBA1C | Unclear risk | Comment: no mention of whether laboratory staff/outcome assessors for BP were blinded |
| Blinding of outcome assessment (detection bias) Subjective outcomes | High risk | Comment: participants completing questionnaires unlikely to have been blinded |
| Incomplete outcome data (attrition bias) Objective outcomes | Unclear risk | Comment: unequal loss to follow‐up, no mention of ITT analysis |
| Incomplete outcome data (attrition bias) Subjective outcomes | Unclear risk | Comment: as above |
| Selective reporting (reporting bias) | Unclear risk | Comment: protocol not available |
| Other bias | Unclear risk | Comment: none |
Anderson 2005.
| Methods |
RCT with a wait‐listed control group Randomisation ratio: 1:1 Superiority design |
|
| Participants |
Inclusion criteria: not stated; targeted to African Americans in urban area in Detroit Exclusion criteria: not stated Diagnostic criteria: not stated |
|
| Interventions |
Number of study centres: not stated Treatment before study: 37% overall had previous HE Intervention: 2‐hour weekly group sessions for 6 weeks Control: wait‐listed Provider: certified diabetes educators (nurses) |
|
| Outcomes |
Outcomes reported in abstract of publication: Primary outcome(s):
Secondary outcome(s): Not specified primary and secondary outcomes |
|
| Study details |
Run‐in period: 4 years Study terminated before regular end: no |
|
| Publication details |
Language of publication: English Funding: National Institutes of Health grants and the core of the Michigan Diabetes Research and Training Center Publication status: peer review journal |
|
| Stated aim of study | Quote from publication: "To evaluate the impact of problem‐based empowerment education program specifically tailored to urban African Americans with type 2 DM" | |
| Notes | — | |
| Risk of bias | ||
| Bias | Authors' judgement | Support for judgement |
| Random sequence generation (selection bias) | Unclear risk | Comment: not stated |
| Allocation concealment (selection bias) | Unclear risk | Comment: not mentioned |
| Blinding of participants and personnel (performance bias) Objective outcomes | High risk | Comment: not stated but from the nature of the intervention unlikely to have been blinded |
| Blinding of participants and personnel (performance bias) Subjective outcomes | High risk | Comment: not stated but from the nature of the intervention unlikely to have been blinded |
| Blinding of outcome assessment (detection bias) Lab tests: Lipids, HBA1C | Unclear risk | Comment: not mentioned |
| Blinding of outcome assessment (detection bias) Subjective outcomes | High risk | Comment: not mentioned but participants completing questionnaires unlikely to have been blinded |
| Incomplete outcome data (attrition bias) Objective outcomes | Unclear risk | Comment: roughly equal numbers lost to follow up in control and intervention groups. No mention of ITT analysis |
| Incomplete outcome data (attrition bias) Subjective outcomes | Unclear risk | Comment: significant number of control group lost to follow‐up at 6 weeks (33/119) |
| Selective reporting (reporting bias) | Unclear risk | Comment: no outcomes appear to have been missed but no protocol available |
| Other bias | Unclear risk | Comment: none |
Babamoto 2009.
| Methods |
Parallel randomised controlled clinical trial (RCT) Randomisation ratio: 3 groups 1:1:1 Superiority design |
|
| Participants |
Inclusion criteria:
Exclusion criteria:
Diagnostic criteria: |
|
| Interventions |
Number of study centres: 3 Treatment before study: no Intervention group: a CHW‐led intervention consisting of individual education sessions at participant's home/clinic/community location and supporting telephone calls; education sessions lasted for a 10‐week period (unclear how frequent they were). CHWs were bilingual Hispanics; education sessions were tailored to participant needs—some topics may have been covered more then once, some not at all, depending on participant needs; telephone calls were made 'routinely' during this period and then for 14 weeks after the intervention (up to 6 months). The second intervention group received case management by culturally sensitive nurses Control group: received no extra contact |
|
| Outcomes |
Outcomes reported in abstract of publication:
Primary outcome(s): Secondary outcome(s): Outcome measures were assessed at completion of the 6‐month intervention programme |
|
| Study details |
Run‐in period: unclear Study terminated before regular end: no |
|
| Publication details |
Language of publication: English Funding: not stated Publication status: peer‐reviewed journal |
|
| Stated aim of study | Quote from publication: "Evaluate the relative effectiveness of a CHW intervention among Hispanic persons with newly diagnosed type 2 diabetes (compared with case management and usual care)" | |
| Notes | — | |
| Risk of bias | ||
| Bias | Authors' judgement | Support for judgement |
| Random sequence generation (selection bias) | Low risk | Comment: randomisation via a "random‐number table" |
| Allocation concealment (selection bias) | Unclear risk | Comment: not commented upon |
| Blinding of participants and personnel (performance bias) Objective outcomes | High risk | Comment: no one was blinded—participants, providers or outcome assessors |
| Blinding of participants and personnel (performance bias) Subjective outcomes | High risk | Comment: no one was blinded—participants, providers or outcome assessors |
| Blinding of outcome assessment (detection bias) Lab tests: Lipids, HBA1C | Unclear risk | Comment: no one was blinded—participants, providers or outcome assessors; unlikely to affect objective measurement of HbA1c, but BMI can be more subject to bias in measurement (e.g. rounding differences) |
| Blinding of outcome assessment (detection bias) Subjective outcomes | High risk | Comment: no blinding |
| Incomplete outcome data (attrition bias) Objective outcomes | High risk | Comment: not an ITT analysis. High attrition rate and differences between groups (43%‐50% control and 28% intervention) |
| Incomplete outcome data (attrition bias) Subjective outcomes | High risk | Comment: as above |
| Selective reporting (reporting bias) | Unclear risk | Comment: protocol not seen |
| Other bias | Unclear risk | Comment: none |
Baradaran 2006.
| Methods |
Parallel randomised controlled clinical trial (RCT) Randomisation ratio: 1:1 South Asians plus white comparison control group approx 2:1 Superiority design |
|
| Participants |
Inclusion criteria:
Exclusion criteria: not stated Diagnostic criteria: not specified |
|
| Interventions |
Number of study centres: 3 general practices; 1 day care centre (originally 2 but 1 closed while the study was ongoing) Treatment before study: not stated if previous HE Intervention: 3 group sessions (1‐hour dietician‐led session and 1 hour and a half podiatrist‐led session) in 3 months. The intervention had a didactic component and an interactive group discussion component |
|
| Outcomes |
Outcomes reported in abstract of publication: Primary outcome(s): Changes in scores (from baseline to post intervention) for the following variables:
Secondary outcome(s): Differences in changes in score in above variables (4) |
|
| Study details |
Run‐in period: not stated Study terminated before regular end: no |
|
| Publication details |
Language of publication: English Funding: funded in part by Iran University of Medical Sciences Publication status: peer‐reviewed journal |
|
| Stated aim of study | Quote from publication: "To develop a culturally appropriate educational intervention programme for South Asians with type 2 DM, and to assess if the intervention would improve knowledge, attitudes and practice of diabetes" | |
| Notes | — | |
| Risk of bias | ||
| Bias | Authors' judgement | Support for judgement |
| Random sequence generation (selection bias) | Unclear risk | Quote from publication: "The South Asian group was divided by gender, then each stratum was further divided based on their reading ability in any language.." Comment: not mentioned how randomly assigned to intervention/control |
| Allocation concealment (selection bias) | Unclear risk | Comment: not stated |
| Blinding of participants and personnel (performance bias) Objective outcomes | Unclear risk | Comment: no objective outcomes in study |
| Blinding of participants and personnel (performance bias) Subjective outcomes | High risk | Comment: unlikely because of the nature of the intervention |
| Blinding of outcome assessment (detection bias) Lab tests: Lipids, HBA1C | Unclear risk | Comment: no objective outcomes |
| Blinding of outcome assessment (detection bias) Subjective outcomes | High risk | Comment: not blinded because of the nature of the study |
| Incomplete outcome data (attrition bias) Objective outcomes | Unclear risk | Comment: no objective outcomes |
| Incomplete outcome data (attrition bias) Subjective outcomes | Low risk | Comment: analysis of those lost to follow‐up looking at their baseline data and comparability. Roughly equal control and intervention group dropout rates, similar reasons for missing data across groups |
| Selective reporting (reporting bias) | Unclear risk | Comment: no study protocol seen |
| Other bias | Unclear risk | Comment: none |
Bellary 2008.
| Methods |
Cluster‐randomised controlled trial: 21 general practices randomly assigned (7 in Coventry (500 participants) and 14 in Birmingham (986 participants)) Randomisation ratio: unclear Superiority design |
|
| Participants |
Inclusion criteria:
Exclusion criteria: "There were no exclusion criteria" Diagnostic criteria: not stated |
|
| Interventions |
Number of study centres: 21 (7 in Coventry, 14 in Birmingham) Treatment before study: unclear Intervention: was "enhanced care." This included practices receiving an additional practice nurse (4 hours per practice per week) supported by link workers and a community nurse specialising in diabetes. Participants in the intervention group were followed up on average every 2 months in weekly clinics held by the practice nurse (extra practice nurse had protected time to run these clinics). All participants were contacted by a link worker before and between appointments to encourage clinic attendance. In addition, link workers attended clinics and provided interpretation and additional educational input in local languages (Punjabi, Urdu and Mirpuri). All link workers had attended a foundation course in diabetes management and care. Two community nurses (diabetes specialists) covered the 9 intervention practices and attended some of the clinics, providing additional educational and clinical support. The specialist nurse also monitored the standard of care provided by the practice nurse and link workers. The intervention provided protocols and targets to try to achieve |
|
| Outcomes | Primarily assessed at 24 months. Also an interim analysis at 12 months—results not given in article Primary outcomes:
Secondary outcome(s):
|
|
| Study details |
Run‐in period: unclear Study terminated before regular end: no |
|
| Publication details |
Language of publication: English Funding: grants from UKAD study from numerous organisations Publication status: peer review journal |
|
| Stated aim of study | Quote from publication: "To investigate the effectiveness of a culturally sensitive, enhanced care package in UK general practices for improvement of cardiovascular risk factors in patients of South Asian origin with type 2 diabetes" | |
| Notes | — | |
| Risk of bias | ||
| Bias | Authors' judgement | Support for judgement |
| Random sequence generation (selection bias) | Unclear risk | Quote from publication: "Simple randomisation" |
| Allocation concealment (selection bias) | Unclear risk | Comment: not mentioned |
| Blinding of participants and personnel (performance bias) Objective outcomes | High risk | Comment: because of the nature of the intervention, both participants and personnel not blinded |
| Blinding of participants and personnel (performance bias) Subjective outcomes | Unclear risk | Comment: no subjective outcomes |
| Blinding of outcome assessment (detection bias) Lab tests: Lipids, HBA1C | Unclear risk | Comment: not mentioned whether assessors blinded. Objective outcome measures such as blood pressure at risk of bias |
| Blinding of outcome assessment (detection bias) Subjective outcomes | Unclear risk | Comment: no subjective outcomes |
| Incomplete outcome data (attrition bias) Objective outcomes | Low risk | Comment: primary analysis by intention‐to‐treat. Per‐protocol analysis also carried out |
| Incomplete outcome data (attrition bias) Subjective outcomes | Unclear risk | Comment: no subjective outcomes |
| Selective reporting (reporting bias) | Unclear risk | Comment: results given for all outcomes mentioned but study protocol not seen |
| Other bias | Unclear risk | Comment: none |
Brown 2002.
| Methods |
Parallel randomised controlled clinical trial (RCT) Randomisation ratio: 1:1 Equivalence design |
|
| Participants |
Inclusion criteria:
Exclusion criteria:
Diagnostic criteria:
|
|
| Interventions |
Number of study centres: Roasters in Starr County, Texas Treatment before study: none had participated in any intervention previously Intervention: 3 months weekly group educational sessions, 6 months biweekly support sessions and thereafter 3 months monthly support sessions Control: usual care from their private physicians or at local clinics Providers: bilingual Mexican American dietician, nurse and community health worker |
|
| Outcomes |
Outcomes reported in abstract of publication: Primary outcome(s):
Secondary outcome(s): None stated as secondary outcome |
|
| Study details |
Run‐in period: not stated Study terminated before regular end (for benefit/because of adverse events): no |
|
| Publication details |
Language of publication: English Funding: National Institute for Diabetes and Kidney Disease and the Office of Research on Minority Health, National Institute of Health and the State of Texas Publication status: peer review journal |
|
| Stated aim of study | Quote from publication: "To determine the effects of culturally competent diabetes self‐management education on diabetes‐related knowledge, health beliefs, HbA1c, lipids and BMI" | |
| Notes | — | |
| Risk of bias | ||
| Bias | Authors' judgement | Support for judgement |
| Random sequence generation (selection bias) | Unclear risk | Comment: no specific comment on method of randomisation |
| Allocation concealment (selection bias) | Unclear risk | Comment: not commented on |
| Blinding of participants and personnel (performance bias) Objective outcomes | High risk | Comment: not specifically mentioned but participants unlikely to have been blinded given study design. At high risk of performance bias |
| Blinding of participants and personnel (performance bias) Subjective outcomes | High risk | Comment: not specifically mentioned but participants unlikely to have been blinded given study design. At high risk of performance bias |
| Blinding of outcome assessment (detection bias) Lab tests: Lipids, HBA1C | Low risk | Comment: presumed lack of blinding unlikely to affect the objective outcomes measured |
| Blinding of outcome assessment (detection bias) Subjective outcomes | High risk | Comment: although attempts made to train assessors to be non‐biased, self‐reported subjective measures in non‐blinded participants = high risk |
| Incomplete outcome data (attrition bias) Objective outcomes | Unclear risk | Comment: not specifically commented on, but attrition rate appears to be about ˜10% from the n values in the data tables |
| Incomplete outcome data (attrition bias) Subjective outcomes | Unclear risk | Comment: not specifically commented on, but attrition rate appears to be about ˜10% from the n values in the data tables |
| Selective reporting (reporting bias) | Unclear risk | Comment: protocol not seen |
| Other bias | Unclear risk | Comment: none |
Carter 2011.
| Methods |
Parallel randomised controlled clinical trial (RCT) Randomisation ratio: approx 1:1 Superiority design |
|
| Participants |
Inclusion criteria:
Exclusion criteria:
Diagnostic criteria: Participants had to have been diagnosed with type 2 diabetes at least 2 years before the start of the study based on a positive reading of any of the following 3 tests, followed by a second positive test on a different day:
|
|
| Interventions |
Number of study centres: 1 Treatment before study: N/A Intervention: provider‐assisted, participant self‐management intervention with multiple aspects to it All participants in the intervention group were provided with a laptop equipped with a wireless scale, a blood pressure cuff and a glucometer (to measure weight, BP and glucose). Weight and BP were advised to be checked weekly, and blood glucose to be checked 3× a day Participants also had access to an online portal, which included 3 modules:
Control: did not have access to the online portal, received standard care only |
|
| Outcomes |
Outcomes reported in abstract of publication: Primary outcomes:
Secondary outcome(s):
|
|
| Study details |
Run‐in period: unclear Study terminated before regular end: no |
|
| Publication details |
Language of publication: English Funding: National Center on Minority Health Disparities (NCMHD) research to reduce ethnic disparities in ESRD Export Grant Publication status: peer review journal |
|
| Stated aim of study | Quote from publication: "To see if a provider‐assisted, patient self‐management telehealth intervention could create access to quality monitoring for the medically underserved and lead to improve patient outcomes (HbA1C, BMI, BP)" | |
| Notes | — | |
| Risk of bias | ||
| Bias | Authors' judgement | Support for judgement |
| Random sequence generation (selection bias) | Low risk | Comment: random number table used |
| Allocation concealment (selection bias) | Unclear risk | Comment: unclear |
| Blinding of participants and personnel (performance bias) Objective outcomes | High risk | Comment: not blinded |
| Blinding of participants and personnel (performance bias) Subjective outcomes | High risk | Comment: not blinded |
| Blinding of outcome assessment (detection bias) Lab tests: Lipids, HBA1C | Unclear risk | Quote from publication: "We collected baseline data and then readministered the survey" Comment: not blinded |
| Blinding of outcome assessment (detection bias) Subjective outcomes | High risk | Comment: participants not blinded. Self‐reported measures |
| Incomplete outcome data (attrition bias) Objective outcomes | High risk | Comment: high rate of attrition—27 participants "lost to attrition." No discussion of why or for what reason. Sounds as though these 27 participants were randomly assigned but excluded from analysis. Therefore, appears to be a per‐protocol analysis, not ITT |
| Incomplete outcome data (attrition bias) Subjective outcomes | Unclear risk | Comment: unclear |
| Selective reporting (reporting bias) | Low risk | Comment: All outcomes stated are reported |
| Other bias | Unclear risk | Comment: none |
Crowley 2013.
| Methods |
Parallel randomised controlled clinical trial (RCT) Randomisation ratio: 1:1 Superiority design |
|
| Participants |
Inclusion criteria: ≥ 18 years old, self‐reported black/African American race; ≥ 1 PCP visit in the past year, a type 2 diabetes International Classification of Diseases, Ninth Revision, code (250.×0/250.×2) within 3 years, and ≥ 1 haemoglobin A1c (HbA1c) measurement in the past year Exclusion criteria: dementia, psychosis or metastatic cancer; receipt of dialysis; recent (3 months) hospitalisation for stroke, myocardial infarction or coronary revascularization; pregnancy, expected pregnancy or breastfeeding; nursing home residence; lack of telephone access; severely impaired speech/vision; not speaking English Diagnostic criteria: not stated |
|
| Interventions |
Number of study centres: 2 Intervention: "The CHANGE study intervention included self‐management education and medication management facilitation components. Both intervention components were delivered by nurse interventionists centred outside the study sites, who communicated remotely with patients and PCPs (...) Nurses delivered self‐management education modules via monthly telephone calls during the 12‐month study period, and medication management facilitation occurred quarterly via electronic nurse‐PCP communication” “Intervention materials were designed for low‐income/low‐health‐literacy patients (...) all research staff underwent interactive training with the Duke Community Health Network focusing on cultural sensitivity and awareness of issues facing African Americans in our community. Along with cultural sensitivity training, the 2 nurse interventionists (both white women) received intensive training in motivational interviewing” “The self‐management material addressed 3 separate domains: (1) disease management (including knowledge, self‐monitoring, and medication use), (2) psychosocial determinants of disease control (including depression, memory and social support), and (3) tailored behavior change (customized based on patient assessment, could include diet, exercise, smoking cessation and others)” Control: Control group received "usual care and written education material at baseline." No other information given |
|
| Outcomes |
Outcomes reported in abstract of publication: Primary outcomes: Systolic blood pressure HbA1c LDL cholesterol Secondary outcomes: Medication adherence |
|
| Study details |
Run‐in period: "HbA1c was collected for the period 90 days before baseline through 90 days after study end, and LDL‐C was collected for the period 90 days before baseline through 180 days after study end" Study terminated before regular end (for benefit/because of adverse events): no |
|
| Publication details |
Language of publication: English Funding: "supported by grants from the Robert Wood Johnson Foundation Disparities Research for Change program and the Kate B. Reynolds Foundation” Publication status: peer‐reviewed journal full article |
|
| Stated aim of study | Quote from publication: "evaluate the effect of a CVD risk reduction intervention in African Americans with diabetes" | |
| Notes | — | |
| Risk of bias | ||
| Bias | Authors' judgement | Support for judgement |
| Random sequence generation (selection bias) | Low risk | Quote from publication: "Randomization used a computer‐generated block‐randomisation sequence stratified by clinic site" |
| Allocation concealment (selection bias) | Low risk | Quote from publication: "A blinded staff member sealed randomisation assignments within sequentially numbered, opaque, identical envelopes, and a research assistant revealed group assignments to participants" Comment: ... |
| Blinding of participants and personnel (performance bias) Objective outcomes | High risk | Comment: not specifically mentioned after allocation concealment; however given the nature of the study, it is assumed no‐one was blinded |
| Blinding of participants and personnel (performance bias) Subjective outcomes | High risk | Comment: Medication adherence was the only subjective outcome. Given they were not blinded, high risk of bias |
| Blinding of outcome assessment (detection bias) Lab tests: Lipids, HBA1C | Unclear risk | Quote from publication: "These (primary) outcomes were not assessed at research visits but were ascertained based on routine clinic measurements from the Duke EMR" Comment: it is assumed therefore that results were taken by independent staff. However it is unclear whether they were blinded to group allocation from the records |
| Blinding of outcome assessment (detection bias) Subjective outcomes | High risk | Comment: unblinded participants—high risk for self‐reported outcome measures |
| Incomplete outcome data (attrition bias) Objective outcomes | Low risk | Comment: very low attrition rates of <5%–10% for each group. Roughly equal numbers. Not clear whether an intention‐to‐treat analysis was used |
| Incomplete outcome data (attrition bias) Subjective outcomes | Low risk | Comment: very low attrition rates of < 5%‐10% for each group. Roughly equal numbers. Not clear whether an intention‐to‐treat analysis was used |
| Selective reporting (reporting bias) | Unclear risk | Comment: study protocol not seen |
| Other bias | Unclear risk | Comment: none |
D'Eramo Melkus 2010.
| Methods |
Randomised controlled clinical trial (RCT): 2 groups Randomisation ratio: 1:1 Superiority design |
|
| Participants |
Inclusion criteria:
Exclusion criteria:
|
|
| Interventions |
Number of study centres: 2 (primary care centre and adjacent school of nursing). Treatment before study: N/A Intervention: 11 weekly group sessions. The first 6 sessions (each 2 hours in duration) provided culturally relevant cognitive‐behavioural diabetes self‐management training. Each of the 6 sessions had a specific learner objective. Culturally specific materials were used for each session, with a focus on cultural barriers and beliefs that support or hinder healthy dietary intake. A culturally specific video and culturally relevant cookbooks were used The remaining 5 sessions comprised coping skills training (CST). These sessions were led by a clinical psychologist or a psychiatric mental health nurse trained in CST. These sessions addressed the following areas using the context of lifestyle behaviour for supporting T2DM self‐management: understanding stress, identifying and exploring problems, applying problem‐solving strategies, managing stress and communication Control: 10 weekly sessions of conventional diabetes education and group follow‐up question and answer sessions. Each group consisted of 8‐10 participants. Sessions 1‐5 provided culturally neutral, usual diabetes education; sessions 6‐10 provided diabetes discussion Provider: CST in intervention sessions led by a psychiatric mental health nurse |
|
| Outcomes | All physiological (excluding lipids) and self‐report measures (excluding demographic data) were collected at 3, 6, 9, 12 and 24 months. Fasting lipid levels repeated at 12 and 24 months
|
|
| Study details |
Run‐in period: not stated Study terminated before regular end: no |
|
| Publication details |
Language of publication: English Funding: NIH NIHR funding Publication status: peer review journal |
|
| Stated aim of study | "The purpose of this study was to evaluate the effectiveness of a tested (Melkus et al. 2004), culturally relevant primary care nurse‐led intervention of group DSMT, CST and diabetes care for black women with T2D" | |
| Notes | — | |
| Risk of bias | ||
| Bias | Authors' judgement | Support for judgement |
| Random sequence generation (selection bias) | Low risk | Quote from publication: "computer randomised" |
| Allocation concealment (selection bias) | Unclear risk | Comment: not commented upon |
| Blinding of participants and personnel (performance bias) Objective outcomes | High risk | Comment: blinding of participants/personnel not commented upon. It is assumed that participants are not blinded, given the nature of the study |
| Blinding of participants and personnel (performance bias) Subjective outcomes | High risk | Comment: blinding of participants/personnel not commented upon. It is assumed that participants are not blinded, given the nature of the study |
| Blinding of outcome assessment (detection bias) Lab tests: Lipids, HBA1C | Unclear risk | Comment: blinding of outcome assessors not commented upon. Blinding unlikely to affect blood results. However manual BP readings may be at risk |
| Blinding of outcome assessment (detection bias) Subjective outcomes | High risk | Comment: self‐reported subjective outcome scales at high risk of bias |
| Incomplete outcome data (attrition bias) Objective outcomes | Unclear risk | Comment: data presented in the text different from data in Figure 2 labelled ITT. Therefore we can assume that data in the text (i.e. data included in this meta‐analysis) include the subgroup analysis, which does not include the ˜1/3 participants who dropped out. They are roughly equal in each arm, which is attributed to "work and/or family issues." Risk is therefore unclear |
| Incomplete outcome data (attrition bias) Subjective outcomes | Unclear risk | Comment: data presented in the text different from data in Figure 2 labelled ITT. Therefore we can assume that data in the text (i.e. data included in this meta‐analysis) include the subgroup analysis, which does not include the ˜1/3 participants who dropped out. They are roughly equal in each arm, which is attributed to "work and/or family issues." Risk is therefore unclear |
| Selective reporting (reporting bias) | Unclear risk | Comment: all stated outcomes reported but study protocol not seen |
| Other bias | Unclear risk | Comment: none |
DePue 2013.
| Methods |
Cluster‐randomised controlled clinical trial (RCT) Randomisation ratio: 1:1 (village clusters) Superiority design |
|
| Participants |
Participants were 268 nationals of American Samoa with type 2 diabetes Inclusion criteria: aged 18 or older, resident in service area, self‐identity as Samoan, physician diagnosis of T2DM, mentally competent and able to consent, unlikely to leave American Samoa for over 4 months, no serious co‐morbidities (e.g. ESRF, cancer) Exclusion criteria: as above Diagnostic criteria: "physician diagnosed" type 2 diabetes |
|
| Interventions |
Number of study centres: 1 Treatment before study: not commented upon The intervention was individual education tailored to a person's self‐goals and diabetes risk over the course of a year. Frequency varied depending on risk, from monthly to yearly. Teaching was delivered by nurses and community health workers. High‐risk patients were also seen in group sessions. Intervention occurred at home, at work or at the Tafuna clinic. Control arm received delayed intervention of 12 months. In meantime, they received usual care. Included a telephone call at 6 months to update contact info and encourage participation |
|
| Outcomes |
Outcomes reported in abstract of publication: Primary outcome: HbA1c Secondary outcomes:
|
|
| Study details |
Run‐in period: recruiting between February 2009 and May 2010. No details on when intervention commenced Study terminated before regular end: no |
|
| Publication details |
Language of publication: English Funding: National Institute of Diabetes, Digestive, and Kidney Disorders (R18‐DK075371) Publication status: peer‐reviewed journal |
|
| Stated aim of study | Quote from publication: "To evaluate the effectiveness of a culturally adapted, primary care–based nurse–community health worker (CHW) team intervention to support diabetes self‐management on diabetes control and other biologic measures" | |
| Notes | — | |
| Risk of bias | ||
| Bias | Authors' judgement | Support for judgement |
| Random sequence generation (selection bias) | Unclear risk | Comment: no data |
| Allocation concealment (selection bias) | Unclear risk | Comment: no data |
| Blinding of participants and personnel (performance bias) Objective outcomes | Unclear risk | Comment: no data |
| Blinding of participants and personnel (performance bias) Subjective outcomes | Unclear risk | Comment: no data |
| Blinding of outcome assessment (detection bias) Lab tests: Lipids, HBA1C | Unclear risk | Comment: no data |
| Blinding of outcome assessment (detection bias) Subjective outcomes | Unclear risk | Comment: no data |
| Incomplete outcome data (attrition bias) Objective outcomes | Unclear risk | Comment: no data |
| Incomplete outcome data (attrition bias) Subjective outcomes | Unclear risk | Comment: no data |
| Selective reporting (reporting bias) | Unclear risk | Comment: no data |
| Other bias | Unclear risk | Comment: no data |
Gary 2009.
| Methods |
Randomised controlled clinical trial (RCT) Randomisation ratio: unclear Superiority design |
|
| Participants |
Inclusion criteria:
Exclusion criteria:
Diagnostic criteria: type 2 diabetes determined by self‐report |
|
| Interventions |
Number of study centres: 5 sites used for recruitment in this study Treatment before study: not stated Setting: CHW visited participants in their homes. Meetings with nurses were often in a community clinic, and baseline and 24‐month assessments were carried out at the Johns Hopkins Outpatient General Clinic Research Center Intervention: The intensive intervention involved the use of both a nurse care manager (NCM) and a community health worker (CHW) team. The NCM is a registered nurse, who would see the participant at least once a year, usually in a clinic setting, focusing on aspects of health care that needed a specialist nurse (e.g. providing education regarding medication management, prompting physicians regarding suboptimal care patterns) The CHWs were African American women familiar with Baltimore City who had not received previous health training. They were trained (by the NCM) for 6 weeks before the trial began. They scheduled home visits at least 3 times a year. CHWs would intervene to overcome problems (e.g. making frequent home visits to monitor and oversee medication taking, reviewing foods in family kitchens, arranging field trips to the grocery store to educate on healthy eating). CHWs would also participate in the completion of an intake assessment and plan for every participant, with particular attention to problems not traditionally addressed by medical or nursing care (e.g. difficulty filling out forms because of low literacy). The intensive intervention was generally based on clinical algorithms, used to triage participants' level of control (as optimal, suboptimal, poor or very poor) and direct the initiation of specific intervention action plans (IAPs). Algorithms were available for blood glucose control, blood pressure control, lipid control, depressive symptoms, smoking, foot screening, blood glucose monitoring, socioeconomic issues (e.g. employment, housing, insurance, caregiver concerns), alcohol use and illicit drug use. Higher‐risk participants (e.g., those in poor vs optimal control) receive more aggressive (e.g. physician is paged vs sent a written report; face‐to‐face meeting vs telephone call) and more frequent follow‐up (e.g. every week vs every 2 weeks) to achieve better control (e.g. depressive symptom algorithm to assess depressive symptoms). If scores indicate no depressive symptoms, no action is taken and the participant is reassessed in 1 year. If scores indicate mild or moderate symptoms (and depression is diagnosed), the participant receives face‐to‐face education along with educational materials and is reassessed in 1 year. If scores indicate major or severe depressive symptoms, a report is sent to the participant's primary care doctor and the participant receives face‐to‐face education, along with educational materials. In this case, reassessment occurs sooner—at 3 months. If a participant indicates suicidal ideations, an at‐risk protocol is implemented immediately in which a physician‐on‐call is paged. Intervention action plans (IAPs) are implemented by NCMs and CHWs on the basis of clinical algorithms. After NCMs and CHWs have completed the initial intervention visit for each participant, they meet to discuss and implement a plan of care. Subsequent intervention contacts are initiated by the NCM and/ or the CHW as directed by participant needs, algorithms or IAPs. The NCM conducts a minimum of 1 face‐to‐face clinic visit per participant each year. Each CHW conducts at least 3 contacts per participant yearly with at least 1 of those 3 being a face‐to‐face home visit. At the end of the initial face‐to‐face contact and as needed thereafter, a written summary is sent to the participant’s primary care provider Control: Participants in the control group received a minimal intervention, which consisted of telephone calls every 6 months by a lay health educator to remind participants about important preventative diabetes‐related health care (e.g. HbA1c tests, primary care). Control participants also received DM‐specific information in the mail. The general aim of this minimal intervention was to make participants more involved in their health care Provider: Intervention is provided by a nurse care manager (a registered nurse) and a community health worker (African American women with no prior health education). Control intervention telephone calls are provided by a lay health educator, who has had no previous health education training but has received 6 weeks of training |
|
| Outcomes | Main follow‐up period occurred at 24 months (emergency room (ER) visits also assessed at 36 months) Primary outcome:
Secondary outcomes:
|
|
| Study details |
Run‐in period: November 2001 to May 2003 Study terminated before regular end: no |
|
| Publication details |
Language of publication: English Funding: grants from National Institutes of Health; National Institute of Diabetes and Digestive and Kidney Diseases; National Heart, Lung and Blood Institute Publication status: peer‐reviewed journal |
|
| Stated aim of study | Quote from publication: "To investigate the effect of an intervention that combined individually tailored counselling by a nurse case manager and health education by a community health worker in the home on emergency department visits (Secondary outcomes are HbA1C and hospitalisation) | |
| Notes | — | |
| Risk of bias | ||
| Bias | Authors' judgement | Support for judgement |
| Random sequence generation (selection bias) | Low risk | Comment: randomisation stratified by clinic sites and health plans. Done using the Moses‐Oakford algorithm |
| Allocation concealment (selection bias) | Low risk | Comment: assignment carried out using sealed envelopes |
| Blinding of participants and personnel (performance bias) Objective outcomes | High risk | Comment: because of the nature of the assignment, participants, nurse case managers and community health workers not blinded |
| Blinding of participants and personnel (performance bias) Subjective outcomes | High risk | Comment: because of the nature of the assignment, participants, nurse case managers and community health workers not blinded |
| Blinding of outcome assessment (detection bias) Lab tests: Lipids, HBA1C | Low risk | Quote from publication: "All data were collected by technicians who were masked to intervention assignment" |
| Blinding of outcome assessment (detection bias) Subjective outcomes | Unclear risk | Comment: no subjective outcomes included |
| Incomplete outcome data (attrition bias) Objective outcomes | Low risk | Comment: 54/542 participants lost to follow‐up. ITT analysis used |
| Incomplete outcome data (attrition bias) Subjective outcomes | Unclear risk | Comment: no subjective outcomes included |
| Selective reporting (reporting bias) | Unclear risk | Comment: all stated outcomes have results but no study protocol seen |
| Other bias | Unclear risk | Comment: none |
Gucciardi 2007.
| Methods |
Parallel randomised controlled clinical trial (RCT) Randomisation ratio: randomly assigned—41 intervention:46 control Superiority design |
|
| Participants |
Inclusion criteria::
Exclusion criteria:
Diagnostic criteria: not stated |
|
| Interventions |
Number of study centres: 1 Treatment before study: Individuals participating in previous health education were excluded Intervention: group + individual: 3 group meetings of 7 hours and individual meetings of 1 initial assessment + mean no. of visit 2.08 (0.95) Individual: 1 initial assessment + mean no. of visits 1.83 (0.69) Control: no control group Provider: individual + group: nurse, dietician, pharmacist, psychologist and physiotherapist. Nurse and dietician were also involved in the individual component of the intervention Individual: nurse and dietician |
|
| Outcomes |
Outcomes reported in abstract of publication: Primary outcome(s):
Secondary outcome(s): Not specified between primary and secondary outcomes |
|
| Study details |
Run‐in period: not explicitly stated, possibly 3 months. Recruitment of participants took place between November 2001 and 2003 Study terminated before regular end: no |
|
| Publication details |
Language of publication: English Funding: Banting and Best Diabetes Centre Publication status: peer‐reviewed journal |
|
| Stated aim of study | Quote from publication: "To examine the impact on nutrition adherence and glycaemic control of two culturally competent interventions (individual counselling vs. individual counselling and group education in Portuguese Canadian" | |
| Notes | — | |
| Risk of bias | ||
| Bias | Authors' judgement | Support for judgement |
| Random sequence generation (selection bias) | Low risk | Comment: participants randomly assigned using a generated random number list |
| Allocation concealment (selection bias) | Unclear risk | Comment: subjects randomised on the spot |
| Blinding of participants and personnel (performance bias) Objective outcomes | Low risk | Comment: diabetes education (DEC) providers blinded |
| Blinding of participants and personnel (performance bias) Subjective outcomes | Low risk | Comment: diabetes education (DEC) providers blinded |
| Blinding of outcome assessment (detection bias) Lab tests: Lipids, HBA1C | Low risk | Comment: research assistants blinded to participant status |
| Blinding of outcome assessment (detection bias) Subjective outcomes | Low risk | Comment: research assistants blinded to participant status |
| Incomplete outcome data (attrition bias) Objective outcomes | High risk | Comment: no intention‐to‐treat analysis |
| Incomplete outcome data (attrition bias) Subjective outcomes | High risk | Comment: no intention‐to‐treat analysis |
| Selective reporting (reporting bias) | Unclear risk | Comment: protocol not seen |
| Other bias | Unclear risk | Comment: none |
Hawthorne 1997.
| Methods |
Parallel randomised controlled clinical trial (RCT) Randomisation ratio: 113 intervention:89 control Superiority design |
|
| Participants | Pakistani Moslems with type 2 DM Inclusion criteria::
Exclusion criteria:
Diagnostic criteria: not stated—from medical history |
|
| Interventions |
Number of study centres: 10 general practices and 1 hospital diabetes clinic Treatment before study: none had previous diabetes HE Intervention: 1 session of 1‐to‐1 pictorial flash cards HE (purpose of glucose monitoring, how to control blood sugar, diabetic complications and purpose of regular screening) with a trained link worker Control: not stated Provider: trained link worker |
|
| Outcomes |
Outcomes reported in abstract of publication: Primary outcome(s):
Secondary outcome(s):
|
|
| Study details |
Run‐in period: 6 months Study terminated before regular end (for benefit/because of adverse events): no |
|
| Publication details |
Language of publication: English Funding: Central Manchester Hospitals Trust Research Grant Publication status: peer‐reviewed journal |
|
| Stated aim of study | Quote from publication: "To develop and evaluate a set of culturally appropriate flashcards one to one diabetes education intervention" | |
| Notes | — | |
| Risk of bias | ||
| Bias | Authors' judgement | Support for judgement |
| Random sequence generation (selection bias) | Low risk | Quote from publication: "patient[s] were allocated to control or intervention groups as they presented at clinics, using pre‐sealed envelopes and random number tables" |
| Allocation concealment (selection bias) | Low risk | Comment: sealed envelopes opened by researcher on allocation to intervention/control |
| Blinding of participants and personnel (performance bias) Objective outcomes | High risk | Comment: does not mention whether participants/personnel were blinded, although unlikely to have been due to the nature of the intervention |
| Blinding of participants and personnel (performance bias) Subjective outcomes | High risk | Comment: does not mention whether participants/personnel were blinded, although unlikely to have been due to the nature of the intervention |
| Blinding of outcome assessment (detection bias) Lab tests: Lipids, HBA1C | Low risk | Comment: lack of blinding unlikely to affect outcome |
| Blinding of outcome assessment (detection bias) Subjective outcomes | High risk | Comment: participants completing questionnaires unlikely to have been blinded |
| Incomplete outcome data (attrition bias) Objective outcomes | Low risk | Comment: under 5% attrition rate, roughly balanced, gives reasons overall but not for each group. ITT analysis not used? |
| Incomplete outcome data (attrition bias) Subjective outcomes | Low risk | Comment: under 5% attrition rate, roughly balanced, gives reasons overall but not for each group. ITT analysis not used? |
| Selective reporting (reporting bias) | Unclear risk | Comment: protocol not seen |
| Other bias | Unclear risk | Comment: none |
Kattelmann 2009.
| Methods |
Randomised controlled clinical trial (RCT): 2 groups: intervention and 'usual care' control group Randomisation ratio: 1:1 Superiority design |
|
| Participants |
Inclusion criteria:
Exclusion criteria:
Diagnostic criteria: previous diagnosis by personal physicians |
|
| Interventions |
Number of study centres: 1 Treatment before study: N/A Intervention: Intervention consisted of six 2‐hour‐long group (5‐9 participants) nutrition education lessons, based on the Medicine Wheel Nutrition Model. This model uses the Medicine Wheel diagram to promote a diet patterned according to the traditional consumption of macronutrients for Northern Plains Indians (approx. 25% protein, 25% fat, 50% carbohydrate). The 6 class sessions were on the following topics: The Medicine Wheel Model for Native Nutrition/Individualized meal plans; self‐monitoring of eating; self‐monitoring of physical activity; changing the environment to promote food choices; eating at home: food preparation techniques; and problem solving After each lesson, participants were given the opportunity to attend a group support session called a Talking Circle. This is a method of intragroup communication in many Insian communities Each participant had total energy requirement estimated and was then provided an individualised meal plan built upon the 4 meal components of the Medicine Wheel Nutrition Model Control: Control group received only the standardised dietary education provided by personal healthcare providers at the local Indian Health Services Hospital. At the time of the study, this hospital did not have a registered dietician on staff. Participants in the control group were offered the same classes Provider: Group education sessions were run by a registered dietician and a tribal member, who was trained in the curriculum |
|
| Outcomes | Assessed at baseline and at 6 months (after intervention):
|
|
| Study details |
Run‐in period: unclear. Study took place from January 2005 to December 2005 Study terminated before regular end: no |
|
| Publication details |
Language of publication: English Funding: not stated but does mention "Missouri Breaks Industries, a local native American owned company assisted with recruitment and transportation of participants to study visits" Publication status: peer‐reviewed journal |
|
| Stated aim of study | Quote from publication: "The objective of this study was to determine if Northern Plains Indians with type 2 diabetes mellitus who are randomized to receive culturally adapted educational lessons based on the Medicine Wheel Model for Nutrition in addition to their usual dietary education will have better control of their type 2 diabetes then a non‐intervention, usual care group who received only the usual dietary education from their personal providers" | |
| Notes | — | |
| Risk of bias | ||
| Bias | Authors' judgement | Support for judgement |
| Random sequence generation (selection bias) | Low risk | Quote from publication: "randomised using a computer generated random number chart" |
| Allocation concealment (selection bias) | Unclear risk | Comment: not mentioned |
| Blinding of participants and personnel (performance bias) Objective outcomes | High risk | Quote from publication: "Project investigators were not blinded to the intervention" Comment: participants unlikely to have ben blinded because of the nature of the intervention |
| Blinding of participants and personnel (performance bias) Subjective outcomes | High risk | Comment: participants unlikely to have ben blinded because of the nature of the intervention |
| Blinding of outcome assessment (detection bias) Lab tests: Lipids, HBA1C | Unclear risk | Comment: does not say whether technicians or laboratory staff blinded |
| Blinding of outcome assessment (detection bias) Subjective outcomes | High risk | Comment: participants and project investigators not blinded |
| Incomplete outcome data (attrition bias) Objective outcomes | Unclear risk | Comment: does not state whether lost to follow‐up from intervention or control group; per‐protocol analysis, low attrition rate (92% completion rate) |
| Incomplete outcome data (attrition bias) Subjective outcomes | Unclear risk | Comment: does not state whether lost to follow‐up from intervention or control group; per‐protocol analysis, low attrition rate (92% completion rate) |
| Selective reporting (reporting bias) | Unclear risk | Comment: results appear to have been given for all outcomes but protocol not seen |
| Other bias | Unclear risk | Comment: none |
Keyserling 2002.
| Methods |
3‐Arm parallel randomised controlled clinical trial (RCT) Randomisation ratio: 133 intervention:67 control Superiority design |
|
| Participants | African American women with type 2 DM Inclusion criteria::
Exclusion criteria: not stated Diagnostic criteria: type 2 DM defined as diagnosis of diabetes at 20 years of age or older with no history of ketoacidosis |
|
| Interventions |
Number of study centres: 5 community health centres; 1 staff model health maintenance organisation; and 1 general medicine clinic at an academic health centre Treatment before study: not stated Intervention A: clinic‐based education + community‐based education. Clinic component consisted of individual counselling visits at months 1, 2, 3 and 4 The community component included 2 group sessions (90 minutes) and monthly telephone calls for the first 6 months; the second 6 months consisted of 1 group session and monthly telephone calls Intervention B: consisted of individual clinic‐based education with visits for the first 6 months, as described in intervention A. No further intervention was offered Control: Participants were mailed pamphlets from the ADA ("Staying Active, Healthy Eating", and "What is Non‐Insulin‐Dependent diabetes?") Provider: clinic nurse and peer counsellor |
|
| Outcomes |
Outcomes reported in abstract of publication: Primary outcome(s):
Secondary outcome(s): No specified primary and secondary outcomes |
|
| Study details |
Run‐in period: not stated Study terminated before regular end: no |
|
| Publication details |
Language of publication: English Funding: "Supported in part by a co‐operative agreement with the Centers for Disease Control and Prevention" Publication status: peer‐reviewed journal |
|
| Stated aim of study | Quote from publication: "To determine whether a culturally appropriate clinic‐ and community‐based intervention for African‐American women with type 2 DM will increase moderate‐intensity physical activity" | |
| Notes | — | |
| Risk of bias | ||
| Bias | Authors' judgement | Support for judgement |
| Random sequence generation (selection bias) | Low risk | Comment: statistical consultant using random numbers from a random number generator |
| Allocation concealment (selection bias) | Low risk | Comment: sealed sequentially numbered envelopes |
| Blinding of participants and personnel (performance bias) Objective outcomes | High risk | Comment: because of the nature of the intervention, participants and providers unlikely to have been blinded |
| Blinding of participants and personnel (performance bias) Subjective outcomes | High risk | Comment: because of the nature of the intervention, participants and providers unlikely to have been blinded |
| Blinding of outcome assessment (detection bias) Lab tests: Lipids, HBA1C | Low risk | Comment: lack of blinding unlikely to affect outcome |
| Blinding of outcome assessment (detection bias) Subjective outcomes | Unclear risk | Comment: does not say whether assessors delivering questionnaire on phone were blinded |
| Incomplete outcome data (attrition bias) Objective outcomes | Low risk | Comment: low attrition rate 10%; baseline comparability for those lost to follow‐up; reasons for attrition given for each group, roughly equal? No ITT done |
| Incomplete outcome data (attrition bias) Subjective outcomes | Low risk | Comment: low attrition rate 10%; baseline comparability for those lost to follow‐up; reasons for attrition given for each group, roughly equal? No ITT done |
| Selective reporting (reporting bias) | Unclear risk | Comment: protocol not seen |
| Other bias | Unclear risk | Comment: none |
Khan 2011 ‐ African Ameri.
| Methods |
Parallel randomised controlled clinical trial (RCT) Randomisation ratio: 67 intervention:62 control Superiority design |
|
| Participants |
Inclusion criteria:
Exclusion criteria: none stated Diagnostic criteria: not stated |
|
| Interventions |
Number of study centres: 1 Treatment before study: does not say Intervention: was the 'Living Well with Diabetes Multimedia Program.' Aim of the intervention was to improve participants' diabetes self‐management behaviours, therapy intensification and glycaemic control over a 3‐month period 19 bilingual computer multimedia lessons on diabetes self‐management: Content included an introduction to diabetes, blood glucose management, oral medications and insulin, nutrition and physical activity, depression and stress and oral hygiene, and prevention of complications (eye, foot, cardiovascular, kidney diseases). Each lesson targeted a specific self‐care objective. The programme also consisted of more than 160 testimonials from African American and Hispanic patients with diabetes related to diabetes self‐care, emphasising barriers to care, challenges and personalised solutions that they or family members had encountered. Different testimonials and messages were used to relate both language and culturally appropriate information to African American or Latino users Programme available to patients in waiting areas, prior to attending general education. Each lesson targeted a specific objective according to Gagne's theory of learning and the component display theory Control: given an American Diabetes Association brochure on self‐management ("Living with Diabetes," written at 6th grade level) Co‐interventions: All participants received traditional diabetes self‐management education. This involved group educational sessions, individualised risk assessment and goal setting |
|
| Outcomes | Outcomes reported in abstract of publication: diabetes knowledge, self‐efficacy, behaviours, medications prescribed, HbA1c and BP levels over 3 months | |
| Study details |
Run‐in period: none stated Study terminated before regular end: no |
|
| Publication details |
Language of publication: English Funding: Agency for Healthcare Research and Quality Publication status: peer‐reviewed journal |
|
| Stated aim of study | Quote from publication: "to evaluate the impact of a waiting room‐administered, low‐literacy, computer multimedia diabetes education program on patient self‐management and provider intensification on therapy" | |
| Notes | — | |
| Risk of bias | ||
| Bias | Authors' judgement | Support for judgement |
| Random sequence generation (selection bias) | Low risk | Comment: random allocation by research assistant pulling a card out of a box, with each card indicating group assignment |
| Allocation concealment (selection bias) | Unclear risk | Comment: not mentioned |
| Blinding of participants and personnel (performance bias) Objective outcomes | High risk | Comment: participants not blinded because of the nature of the study, but physicians were blinded |
| Blinding of participants and personnel (performance bias) Subjective outcomes | High risk | Comment: participants not blinded because of the nature of the study, but physicians were blinded |
| Blinding of outcome assessment (detection bias) Lab tests: Lipids, HBA1C | Unclear risk | Comment: does not say whether research assistants were blinded. Physicians were blinded |
| Blinding of outcome assessment (detection bias) Subjective outcomes | High risk | Comment: participants not blinded completing questionnaires |
| Incomplete outcome data (attrition bias) Objective outcomes | Low risk | Comment: 12/129 lost to follow‐up, roughly equal in control/intervention group. Reasons for dropping out included relocation, phone disconnection and leaving the county health system |
| Incomplete outcome data (attrition bias) Subjective outcomes | Low risk | Comment: 12/129 lost to follow‐up, roughly equal in control/intervention group. Reasons for dropping out included relocation, phone disconnection and leaving the county health system |
| Selective reporting (reporting bias) | Unclear risk | Comment: study protocol not seen |
| Other bias | Unclear risk | Comment: none |
Khan 2011‐ Hispanic.
| Methods |
Parallel randomised controlled clinical trial (RCT) Randomisation ratio: 67 intervention:62 control Superiority design |
|
| Participants |
Inclusion criteria:
Exclusion criteria: not stated Diagnostic criteria: not stated |
|
| Interventions |
Number of study centres: 1 Treatment before study: does not say Intervention: was the 'Living Well with Diabetes Multimedia Program.' Aim of the intervention was to improve participants' diabetes self‐management behaviours, therapy intensification and glycaemic control over a 3‐month period 19 bilingual computer multimedia lessons on diabetes self‐management: Content included an introduction to diabetes, blood glucose management, oral medications and insulin, nutrition and physical activity, depression and stress, oral hygiene and the prevention of complications (eye, foot, cardiovascular, kidney diseases). Each lesson targeted a specific self‐care objective. The programme also consisted of more than 160 testimonials from African American and Hispanic patients with diabetes related to diabetes self‐care, emphasising barriers to care and challenges and personalised solutions that they or family members had encountered. Different testimonials and messages were used to relate both language and culturally appropriate information to African American or Latino users Programme available to participants in waiting areas before attending general education. Each lesson targeted a specific objective according to Gagne's theory of learning and the component display theory Control: given an American Diabetes Association brochure on self‐management ("Living with Diabetes," written at 6th grade level) Co‐interventions: All participants received traditional diabetes self‐management education. This involved group educational sessions, individualised risk assessment and goal setting |
|
| Outcomes | Outcomes reported in abstract of publication: diabetes knowledge, self‐efficacy, behaviours, medications prescribed, HbA1c and BP levels over 3 months | |
| Study details |
Run‐in period: none stated Study terminated before regular end: no |
|
| Publication details |
Language of publication: English Funding: Agency for Healthcare Research and Quality Publication status: peer‐reviewed journal |
|
| Stated aim of study | Quote from publication: "to evaluate the impact of a waiting room‐administered, low‐literacy, computer multimedia diabetes education program on patient self‐management and provider intensification on therapy" | |
| Notes | — | |
| Risk of bias | ||
| Bias | Authors' judgement | Support for judgement |
| Random sequence generation (selection bias) | Low risk | Comment: random allocation by research assistant pulling a card out of a box, with each card indicating group assignment |
| Allocation concealment (selection bias) | Unclear risk | Comment: not mentioned |
| Blinding of participants and personnel (performance bias) Objective outcomes | High risk | Comment: participants not blinded because of the nature of the study; physicians were blinded |
| Blinding of participants and personnel (performance bias) Subjective outcomes | High risk | Comment: participants not blinded because of the nature of the study; physicians were blinded |
| Blinding of outcome assessment (detection bias) Lab tests: Lipids, HBA1C | Unclear risk | Comment: does not say whether or not research assistants were blinded; physicians were blinded |
| Blinding of outcome assessment (detection bias) Subjective outcomes | High risk | Comment: participants not blinded completing questionnaires |
| Incomplete outcome data (attrition bias) Objective outcomes | Low risk | Comment: 12/129 lost to follow‐up, roughly equal in control/intervention group. Reasons for dropping out included relocation, phone disconnection and leaving the county health system |
| Incomplete outcome data (attrition bias) Subjective outcomes | Low risk | Comment: 12/129 lost to follow‐up, roughly equal in control/intervention group. Reasons for dropping out included relocation, phone disconnection and leaving the county health system |
| Selective reporting (reporting bias) | Unclear risk | Comment: study protocol not seen |
| Other bias | Unclear risk | Comment: none |
Kim 2009.
| Methods |
Parallel randomised controlled clinical trial (RCT): delayed intervention design used (control group received intervention after trial was complete) Randomisation ratio: 41:42 Superiority design |
|
| Participants |
Inclusion criteria:
Exclusion criteria: None specifically stated Diagnostic criteria: HbA1c over 7.5% on dry blood test (A1CNOW+) and serum sample 2 weeks later |
|
| Interventions |
Number of study centres: 1 Treatment before study: not mentioned Intervention:
Control: delayed intervention; received intervention after trial was complete Provider: education sessions run by trained bilingual nurses and a nutritionist; telephone counselling provided by a bilingual nurse |
|
| Outcomes |
Outcomes reported in abstract of publication: All measured at baseline, 18 weeks and 30 weeks:
|
|
| Study details |
Run‐in period: not stated. No dates given for when study was carried out, although recruitment target was reached within 3 months, and follow‐up was 6 months (so whole study lasted about 9 months) Study terminated before regular end: no |
|
| Publication details |
Language of publication: English Funding: National Institutes of Health, Lifescan, Johns Hopkins University School of Medicine General Clinical Research Center, National Center for Research Resources/National Institutes of Health Publication status: peer‐reviewed journal |
|
| Stated aim of study | Quote from publication: "To empower Korean American Immigrants (KAIs) who have type 2 diabetes with greater knowledge, self‐efficacy and self‐help skills concerning diabetes" | |
| Notes | — | |
| Risk of bias | ||
| Bias | Authors' judgement | Support for judgement |
| Random sequence generation (selection bias) | Low risk | Comment: sequence generated by computer‐automated random assignment |
| Allocation concealment (selection bias) | Unclear risk | Comment: not mentioned |
| Blinding of participants and personnel (performance bias) Objective outcomes | High risk | Comment: participants not blinded to which group they were in, not feasible because of the nature of the intervention |
| Blinding of participants and personnel (performance bias) Subjective outcomes | High risk | Comment: participants not blinded to which group they were in, not feasible because of the nature of the intervention |
| Blinding of outcome assessment (detection bias) Lab tests: Lipids, HBA1C | Unclear risk | Comment: does not say whether research staff or laboratory staff were blinded |
| Blinding of outcome assessment (detection bias) Subjective outcomes | High risk | Comment: participants unlikely to have been blinded |
| Incomplete outcome data (attrition bias) Objective outcomes | Unclear risk | Comment: low attrition rate but not an ITT analysis, and no mention of reasons for dropping out of study |
| Incomplete outcome data (attrition bias) Subjective outcomes | Unclear risk | Comment: low attrition rate but not an ITT analysis, and no mention of reasons for dropping out of study |
| Selective reporting (reporting bias) | Unclear risk | Comment: all stated outcomes reported but protocol not seen |
| Other bias | Unclear risk | Comment: none |
Lorig 2008.
| Methods |
Randomised controlled clinical trial (RCT): This article reports on 2 separate trials. The first is an RCT of 6 months' duration, comparing the effects of the Spanish Diabetes Self‐Management Program (SDSMP) versus usual care. The second part is an 18‐month follow‐up comparing the effects of telephone reinforcement for participants who receive the SDSMP. Included only the RCT in our review Randomisation ratio: not clear how participants were randomly assigned Superiority design |
|
| Participants |
Inclusion criteria:
Exclusion criteria:
("There were no other inclusion or exclusion criteria") Diagnostic criteria: not stated |
|
| Interventions |
Number of study centres: 1 Treatment before study: none stated Intervention: 6‐week programme consisting of 2.5‐hour weekly sessions Class sizes ranged from 10‐15 people, including participants' family and friends "Was developed based on needs assessments conducted with four groups of Latinos with diabetes and three groups of diabetes educators. It was then reviewed by diabetes nurse educators, nutritionists and a diabetologist and modified for real world practice" Control: usual care—ranged from community clinics to specialist care and was representative of care received by Spanish speakers in large urban areas Provider: 2 Spanish‐speaking peer leaders. "Most had type 2 diabetes and were not professionals, and came from the same communities as the participants." "They received 4 days of the training in the use of a detailed protocol" |
|
| Outcomes |
Outcomes reported in abstract of publication: assessed at 6 months Health indicators:
Health behaviours (assessed by a physical activities scale):
Health care utilisation (assessed by self‐report):
|
|
| Study details |
Run‐in period: unclear Study terminated before regular end: no |
|
| Publication details |
Language of publication: English Funding: National Institutues of Health/National Institutes of Nursing Research grant and Michigan Diabetes Research and Training Center Publication status: peer‐reviewed journal |
|
| Stated aim of study | Quote from publication: "To determine whether participants in the Spanish Diabetes Self‐Management Program (SDSMP) when compared at 6 months to randomised control subjects, would demonstrate improvements in health status, health behaviours and self‐efficacy" | |
| Notes | — | |
| Risk of bias | ||
| Bias | Authors' judgement | Support for judgement |
| Random sequence generation (selection bias) | Unclear risk | Comment: does not state how randomisation was carried out |
| Allocation concealment (selection bias) | Unclear risk | Comment: not stated |
| Blinding of participants and personnel (performance bias) Objective outcomes | High risk | Quote from publication: "Because SDSMP participants could not be blinded, there is the possibility of an attention effect" |
| Blinding of participants and personnel (performance bias) Subjective outcomes | High risk | Quote from publication: "Because SDSMP participants could not be blinded, there is the possibility of an attention effect" |
| Blinding of outcome assessment (detection bias) Lab tests: Lipids, HBA1C | Low risk | Comment: lack of blinding unlikely to affect outcome |
| Blinding of outcome assessment (detection bias) Subjective outcomes | High risk | Comment: participants completing questionnaires unlikely to have been blinded |
| Incomplete outcome data (attrition bias) Objective outcomes | Unclear risk | Comment: Attrition was noted in both groups (CG 13%, IG 18%). Reasons for attrition not discussed, but those who did not complete questionnaire at 6 months were found to not differ significantly from those who did in terms of baseline demographics. However, they did have worse health generally (higher A1c, lower self‐reported health and more fatigue) |
| Incomplete outcome data (attrition bias) Subjective outcomes | Unclear risk | Comment: Attrition was noted in both groups (CG 13%, IG 18%). Reasons for attrition not discussed, but those who did not complete questionnaire at 6 months were found to not differ significantly from those who did in terms of baseline demographics. However, they did have worse health generally (higher A1c, lower self‐reported health and more fatigue) |
| Selective reporting (reporting bias) | Unclear risk | Comment: All stated outcomes appear to be reported but protocol was not seen |
| Other bias | Unclear risk | Comment: none |
Lujan 2007.
| Methods |
Parallel randomised controlled clinical trial (RCT) Randomisation ratio: 1:1 Superiority design |
|
| Participants |
Inclusion criteria:
Exclusion criteria:
Diagnostic criteria: no mention |
|
| Interventions |
Number of study centres: 1 Treatment before study: Taking or having taken hypoglycaemic agents within the past 6 months Intervention: ran by "promotoras." Consisting of 8 × weekly 2‐hour participative group classes and fortnightly telephone follow‐up. Following the end of the classes, inspirational faith‐based health behaviour change postcards were sent to participants fortnightly. Eight group sessions covered the following topics:
Classes were interactive, small‐group sessions (23 participants in Spainsh classes, 6 in English class) involving hands‐on demonstrations and handouts Telephone call by promotoras to answer questions and reinforce education Postcards with a faith‐based and health behaviour change message were sent fortnightly after the sessions ended |
|
| Outcomes |
Outcomes reported in abstract of publication: HbA1c, diabetes knowledge and diabetes health beliefs |
|
| Study details |
Run‐in period: no mention of this Study terminated before regular end: no |
|
| Publication details |
Language of publication: English Funding: supported by a grant from the Paso del Norte Health Foundation through the Center for Border Health Research Publication status: peer‐reviewed journal |
|
| Stated aim of study | The purpose of this RCT is to determine the effectiveness of an intervention led by promotoras (CHWs) on glycaemic control, diabetes knowledge and diabetes beliefs of Mexican Americans with type 2 diabetes living in a major city on the Texas‐Mexico border | |
| Notes | — | |
| Risk of bias | ||
| Bias | Authors' judgement | Support for judgement |
| Random sequence generation (selection bias) | Unclear risk | Comment: not stated; just says "were randomised" |
| Allocation concealment (selection bias) | Unclear risk | Comment: no mention |
| Blinding of participants and personnel (performance bias) Objective outcomes | High risk | Comment: does not say but likely not blinded |
| Blinding of participants and personnel (performance bias) Subjective outcomes | High risk | Comment: does not say but likely not blinded |
| Blinding of outcome assessment (detection bias) Lab tests: Lipids, HBA1C | Low risk | Comment: lack of blinding unlikely to affect outcome |
| Blinding of outcome assessment (detection bias) Subjective outcomes | High risk | Quote from publication: "A trained bilingual assistant, masked to the intervention and group assignment, read the questionnaires to each participant" Comment: however, participant still likely not blinded |
| Incomplete outcome data (attrition bias) Objective outcomes | Low risk | Comment: overall attrition rate was 6% (n = 9). No mention of intention‐to‐treat analysis |
| Incomplete outcome data (attrition bias) Subjective outcomes | Low risk | Quote from publication: "data from participants who missed more than 2 of 8 classes or did not complete at least 3 data collection assessment interviews were discarded..." Comment: overall attrition rate was 6% (n = 9). No mention of intention‐to‐treat analysis |
| Selective reporting (reporting bias) | Unclear risk | Comment: all outcomes reported but no protocol seen |
| Other bias | Unclear risk | Comment: none |
Middelkoop 2001.
| Methods |
Parallel randomised controlled clinical trial (RCT) (for first 6 months) Randomisation ratio: 53 intervention:60 control Superiority design |
|
| Participants |
Inclusion criteria:
Exclusion criteria: not stated Diagnostic criteria: not stated |
|
| Interventions |
Number of study centres: 3 general practices and 1 outpatient clinic Treatment before study: not stated Intervention: attending to intensive guidance clinics (approximately 4‐7 visits for the first 3 months, with less frequent subsequent visits) provided by trained nurse and dietician Control: wait‐listed group that joined the intervention group after 6 months Provider: specialist nurse and dietician trained in South Asian culture |
|
| Outcomes |
Outcomes reported in abstract of publication: Primary outcome(s): HbA1c Secondary outcome(s): not assessed for RCT component of the intervention |
|
| Study details |
Run‐in period: not stated Study terminated before regular end: no |
|
| Publication details |
Language of publication: English Funding: not stated Publication status: peer‐reviewed journal |
|
| Stated aim of study | Quote from publication: "To assess if culturally‐specific diabetes intervention led to a decrease HbA1c level, improvement in lipid profile, or a decrease in BMI" | |
| Notes | — | |
| Risk of bias | ||
| Bias | Authors' judgement | Support for judgement |
| Random sequence generation (selection bias) | High risk | Quote from publication: "Patients were randomised based on their date of birth: odd numbers (intervention patients)" |
| Allocation concealment (selection bias) | Unclear risk | Comment: not mentioned |
| Blinding of participants and personnel (performance bias) Objective outcomes | Unclear risk | Comment: not clear whether participants would have been aware of whether they were in the control group |
| Blinding of participants and personnel (performance bias) Subjective outcomes | Unclear risk | Comment: no subjective outcomes |
| Blinding of outcome assessment (detection bias) Lab tests: Lipids, HBA1C | Low risk | Comment: does not mention whether laboratory technicians blinded but unlikely to have affected HbA1c |
| Blinding of outcome assessment (detection bias) Subjective outcomes | Unclear risk | Comment: no subjective outcomes |
| Incomplete outcome data (attrition bias) Objective outcomes | Unclear risk | Comment: 28/60 of control group lost to follow‐up as changed GP, does not provide further details of other participants lost to follow‐up |
| Incomplete outcome data (attrition bias) Subjective outcomes | Unclear risk | Comment: no subjective outcomes |
| Selective reporting (reporting bias) | Unclear risk | Comment: HbA1c was only outcome in RCT reported on but protocol not seen (e.g. may have specified that investigators would look at BMI at 6 months) |
| Other bias | Unclear risk | Comment: none |
O'Hare 2004.
| Methods |
Parallel randomised controlled clinical trial (RCT) Randomisation ratio: Recruited from 6 practices, I1:C1 180 (3 practices):181 (3 practices) Superiority design |
|
| Participants |
Inclusion criteria:
Exclusion criteria: not stated Diagnostic criteria: not stated |
|
| Interventions |
Number of study centres: 3 practices randomly assigned to intervention and 3 practices to control clusters Treatment before study: not stated Intervention: consisted of extra weekly diabetes clinic at primary care centres (with community diabetes input and 2 link workers with language skills). Frequency of participants' exposure to the intervention has not been stated Control: usual care; practices were provided with protocols; no further resources were provided Provider: diabetes nurse specialist, practice nurse, dietician—all aided by a link worker |
|
| Outcomes |
Outcomes reported in abstract of publication: Primary outcome(s):
Secondary outcome(s): Economic evaluation (not available) |
|
| Study details |
Run‐in period: not stated Study terminated before regular end: no |
|
| Publication details |
Language of publication: English Funding: Pfizer; Aventis UK; Eli Lilly; NovoNordisk; Boehringer Ingleheim; Servier Laboratories UK; Takeda UK Publication status: peer‐reviewed journal |
|
| Stated aim of study | Quote from publication: "To test the hypothesis that enhanced diabetes care tailored to the needs of the South Asian community with type 2 DM, would improve risk factors for diabetic vascular complications and ultimately reduce morbidity and mortality" | |
| Notes | — | |
| Risk of bias | ||
| Bias | Authors' judgement | Support for judgement |
| Random sequence generation (selection bias) | Unclear risk | Comment: randomly assigned by practice, not individually; does not say how this was done |
| Allocation concealment (selection bias) | Unclear risk | Comment: not explained |
| Blinding of participants and personnel (performance bias) Objective outcomes | High risk | Comment: does not say whether participants blinded, personnel not blinded |
| Blinding of participants and personnel (performance bias) Subjective outcomes | Unclear risk | Comment: no subjective outcomes |
| Blinding of outcome assessment (detection bias) Lab tests: Lipids, HBA1C | Unclear risk | Comment: does not say whether practice personnel taking BP were blinded |
| Blinding of outcome assessment (detection bias) Subjective outcomes | Unclear risk | Comment: no subjective outcomes |
| Incomplete outcome data (attrition bias) Objective outcomes | Unclear risk | Comment: baseline groups similar in characteristics; 10% lost to follow‐up but does explain reasons; does not explain within‐group follow‐up data; 6 died—from which group? No ITT mentioned |
| Incomplete outcome data (attrition bias) Subjective outcomes | Unclear risk | Comment: no subjective outcomes |
| Selective reporting (reporting bias) | Unclear risk | Comment: study protocol not seen |
| Other bias | Unclear risk | Comment: none |
Osborn 2010.
| Methods |
Randomised controlled clinical trial (RCT): 2 groups—intervention and control Randomisation ratio: 1:1 Superiority design |
|
| Participants |
Inclusion criteria:
Exclusion criteria: None specifically stated Diagnostic criteria: not stated |
|
| Interventions |
Number of study centres: 1 Treatment before study: not stated Intervention: a single 90‐minute session with a bilingual medical assistant of Puerto Rican heritage. Medical assistant received approx. 40 hours of training in diabetes self‐management before the session. Session was based on the Information‐Behavioural Skills (IMB) model of health behaviour change. Information/Education was provided with use of a flip chart and interactive discussion. Culturally appropriate foods were used as examples as to what can raise blood glucose. Motivational interviewing was carried out to try to enhance motivation—this involved personalised feedback on self‐care activities and open‐ended query and exploration of self‐care attitudes and beliefs. Behavioural skills were targeted and enforced using a teach‐back method to ensure understanding Each participant received a personal feedback report immediately after the session (contained self‐generated reasons to change, agreed on goals, etc.) and a culturally tailored, individualised meal plan booklet. This was intended to promote positive attitudes about adhering to diet recommendations and therefore enhance participants' motivation to change. Participants were also provided with 0‐3 handouts, depending on personal relevance as determined by the interventionist. Finally, all participants received a brochure of culturally familiar foods with recommended serving sizes No further support was offered post intervention Control: Participants in the control group received usual care. However, this included an optional diabetes support group coupled with group‐based didactic education delivered in Spanish. This support group was free, delivered on a monthly basis and facilitated by a bilingual diabetes community health worker of Puerto Rican heritage. This session was not tailored to the individual needs of the participant. Participants in the intervention arm could also attend this session Provider: intervention session provided by a bilingual medical assistant of Puerto Rican heritage |
|
| Outcomes |
Outcomes reported in abstract of publication: Primary outcome(s): Secondary outcome(s): Assessed at baseline and at 3 months:
|
|
| Study details |
Run‐in period: unclear Study terminated before regular end: no |
|
| Publication details |
Language of publication: English Funding: grants and awards from Center for Health Intervention and Prevention (University of Connecticut), NIH/NIDDK National Research Service Award, Diversity Supplement Award, NIH/NCMHD Publication status: peer‐reviewed journal |
|
| Stated aim of study | Quote from publication: "To evaluate the effect of an IMB model of diabetes self‐care on Puerto Ricans with type 2 diabetes in terms of diet behaviour, physical activity and glycaemic control" | |
| Notes | — | |
| Risk of bias | ||
| Bias | Authors' judgement | Support for judgement |
| Random sequence generation (selection bias) | Unclear risk | Quote from publication: "Patients were randomised" Comment: no information given as to how this was done |
| Allocation concealment (selection bias) | Unclear risk | Quote from publication: "Research assistants were blind to the random allocation sequence" |
| Blinding of participants and personnel (performance bias) Objective outcomes | High risk | Comment: participants and personnel not blinded because of the nature of the intervention |
| Blinding of participants and personnel (performance bias) Subjective outcomes | High risk | Comment: participants and personnel not blinded because of the nature of the intervention |
| Blinding of outcome assessment (detection bias) Lab tests: Lipids, HBA1C | Low risk | Comment: It is not commented upon whether or not they were blinded; unlikely to affect HbA1c however |
| Blinding of outcome assessment (detection bias) Subjective outcomes | High risk | Comment: self‐reported outcome measures at high risk of bias in an unblinded population |
| Incomplete outcome data (attrition bias) Objective outcomes | Unclear risk | Comment: analysis by per‐protocol approach, not by intention‐to‐treat, but only ˜10% lost to follow‐up |
| Incomplete outcome data (attrition bias) Subjective outcomes | Unclear risk | Comment: analysis by per‐protocol approach, not by intention‐to‐treat, but only ˜10% lost to follow‐up |
| Selective reporting (reporting bias) | Unclear risk | Comment: All stated outcomes were reported but study protocol was not seen |
| Other bias | Unclear risk | Comment: none |
Philis‐Tsimikas 2011.
| Methods |
Parallel randomised controlled clinical trial (RCT) Randomisation ratio: Intervention 104 participants: control 103 participants Superiority design |
|
| Participants |
Inclusion criteria:
Exclusion criteria: Having a physical or mental health condition that would preclude fulfilling the requirements of the study Diagnostic criteria: not stated |
|
| Interventions |
Number of study centres: not stated Treatment before study: not stated Intervention: consisted of 8 weekly 2‐hour diabetes self‐management classes and subsequent 2‐hour monthly support groups (phoned by peer educator beforehand to encourage attendance). Occasional guest speaker at support groups. Interactive discussion facilitated by peer educator. Self‐management classes covering basics of diabetes and its complications, as well as diet, exercise, medication, blood glucose monitoring and cultural beliefs that interfere with optimum self‐management Provider: delivered by Promotora—trained peer educator |
|
| Outcomes |
Outcomes reported in abstract of publication: Primary outcome(s):
Secondary outcome(s):
|
|
| Study details |
Run‐in period: not stated Study terminated before regular end: no |
|
| Publication details |
Language of publication: English Funding: National Institute of Diabetes and Digestive Kidney Diseases Grant, National Center for Research Resources Grant and a grant from Lufescan and Johnson and Johnson Publication status: peer‐reviewed journal |
|
| Stated aim of study | Quote from publication: “To evaluate the effect of a culturally sensitive diabetes self‐management program that uses a low‐cost, peer‐educator format (Project Dulce) on glucose control and metabolic parameters in low income Mexican Americans with type 2 diabetes” | |
| Notes | — | |
| Risk of bias | ||
| Bias | Authors' judgement | Support for judgement |
| Random sequence generation (selection bias) | Low risk | Comment: blocked random assignment with randomly generated number sequence |
| Allocation concealment (selection bias) | Unclear risk | Quote from publication: "Participants were informed of their group allocation after the baseline assessment" Comment: however, does not mention whether or not assessors were blinded |
| Blinding of participants and personnel (performance bias) Objective outcomes | High risk | Comment: participants and peer educator not blinded |
| Blinding of participants and personnel (performance bias) Subjective outcomes | Unclear risk | Comment: no subjective outcomes |
| Blinding of outcome assessment (detection bias) Lab tests: Lipids, HBA1C | Unclear risk | Quote from publication: "by laboratory personnel who were blinded to group assignment" Comment: does not say whether clinical trials assistant (measuring BP, etc) was blinded also |
| Blinding of outcome assessment (detection bias) Subjective outcomes | Unclear risk | Comment: no subjective outcomes |
| Incomplete outcome data (attrition bias) Objective outcomes | High risk | Comment: 51 participants (25%) lost to follow‐up: 35 (33.5%) from intervention group, 16 (15.5%) from control group. Does not attempt statistical compensation for those lost to follow‐up |
| Incomplete outcome data (attrition bias) Subjective outcomes | Unclear risk | Comment: no subjective outcomes |
| Selective reporting (reporting bias) | Unclear risk | Comment: study protocol not seen |
| Other bias | Unclear risk | Comment: none |
Rosal 2005.
| Methods |
Parallel randomised controlled clinical trial (RCT) (pilot) Randomisation ratio: assumed 3:2 Superiority design |
|
| Participants |
Inclusion criteria:
Exclusion criteria:
Diagnostic criteria: not stated Participating population: individuals (in a community with 80% Puerto Rican heritage) with type 2 DM > 18 years of age |
|
| Interventions |
Number of study centres: 1 community health centre, an affiliated elder health centre and a community‐wide database Treatment before study: not stated Number of study centres: not stated Intervention: consisted of an initial 1‐hour individual session, followed by 2 3‐hour weekly group sessions for 10 weeks and 2 15‐minute sessions. individual sessions during the 10‐week period. Primary care physicians received copies of laboratory results at each assessment point Control: Usual care and primary care physicians received copies of laboratory results as intervention group did Provider: bilingual nutritionist, diabetes nurse and assistant |
|
| Outcomes |
Outcomes reported in abstract of publication: Primary outcome(s):
Secondary outcome(s): Not specified between primary and secondary outcomes |
|
| Study details |
Run‐in period: not stated Study terminated before regular end: no |
|
| Publication details |
Language of publication: English Funding: American Diabetes Association Innovation Award, which in part is supported by NovoNordisk Pharmaceuticals Publication status: peer‐reviewed journal |
|
| Stated aim of study | Quote from publication: "To assess the feasibility of an innovative self‐management education in low income Spanish speaking individuals and secondly to have a preliminary data of intervention effects" | |
| Notes | — | |
| Risk of bias | ||
| Bias | Authors' judgement | Support for judgement |
| Random sequence generation (selection bias) | Unclear risk | Comment: method of randomisation not specified |
| Allocation concealment (selection bias) | Unclear risk | Quote from publication: "Research assistants administered informed consent documents ... and were blind to the random sequence allocation" Comment: does not specify method of allocation concealment |
| Blinding of participants and personnel (performance bias) Objective outcomes | High risk | Comment: providers not blinded because of the nature of the intervention; participants unlikely to have been blinded |
| Blinding of participants and personnel (performance bias) Subjective outcomes | High risk | Comment: providers not blinded because of the nature of the intervention; participants unlikely to have been blinded |
| Blinding of outcome assessment (detection bias) Lab tests: Lipids, HBA1C | Low risk | Comment: does not say whether research assistants taking blood pressure were blinded. However, details given for standardised procedure for doing this |
| Blinding of outcome assessment (detection bias) Subjective outcomes | High risk | Comment: participants completing questionnaires unlikely to have been blinded |
| Incomplete outcome data (attrition bias) Objective outcomes | Unclear risk | Comment: does not mention whether any participants were lost to follow‐up; no numbers in results and no mention of whether ITT analysis was used |
| Incomplete outcome data (attrition bias) Subjective outcomes | Unclear risk | Comment: does not mention whether any participants were lost to follow‐up; no numbers in results and no mention of whether ITT analysis was used |
| Selective reporting (reporting bias) | Unclear risk | Comment: no outcomes appear unreported but protocol not seen |
| Other bias | Unclear risk | Comment: none |
Rosal 2011.
| Methods |
Parallel randomised controlled clinical trial (RCT): 2 groups—control and intervention Randomisation ratio: 1:1 Superiority design |
|
| Participants |
Inclusion criteria:
Exclusion criteria:
Participating population: Latino patients diagnosed with type 2 diabetes |
|
| Interventions |
Number of study centres: 5 community health centres Treatment before study: not stated Intervention: 'Latinos en Control' intervention consisted of an intensive phase of 12 weekly sessions and a follow‐up phase of 8 monthly sessions. Social‐cognitive theory was used as a framework to targeted previously identified needs in this population: diabetes knowledge, attitudes and self‐management behaviours. Sessions were made literacy and culturally appropriate by simplifying concepts, using an educational soap opera (soap operas popular in this population), putting desired behaviours into culturally relevant context, using bingo games and emphasising making traditional foods healthier and other things Group sessions were 2.5 hours long, with the 1st hour covering personalised counselling and cooking and the remaining time covering the group protocol and a meal Control: Participants in the control group received no intervention. All primary care providers received laboratory results (HbA1c, lipid profiles, FBG) at baseline and at 4 and 12 months, and were free to provide care as deemed appropriate or as routinely delivered Provider: Intervention was delivered by a trained team of 2 leaders and an assistant (a nutritionist or a health educator and trained lay individuals, or 3 lay individuals supervised by 2 investigators) |
|
| Outcomes | Assessed at baseline, at 4 months (post intensive intervention) and at 12 months (end of proper intervention) Primary outcome
Secondary outcomes
|
|
| Study details |
Run‐in period: none Study terminated before regular end: no |
|
| Publication details |
Language of publication: English Funding: National Institutes of Health, National Institutes of Diabetes and Digestive and Kidney Diseases Grant Publication status: peer‐reviewed journal |
|
| Stated aim of study | Quote from publication: "To test whether a theory‐based, literacy and culturally tailored self‐management intervention, Latinos en Control, improves glycaemic control among low‐income Latinos with type 2 diabetes" | |
| Notes | Study author provided extra details on results data for BP and lipids | |
| Risk of bias | ||
| Bias | Authors' judgement | Support for judgement |
| Random sequence generation (selection bias) | Low risk | Quote from publication: "A stratified randomisation scheme was created using Stata's ralloc procedure" "Patients from the same family were assigned to the same study condition" |
| Allocation concealment (selection bias) | Unclear risk | Comment: not mentioned |
| Blinding of participants and personnel (performance bias) Objective outcomes | High risk | Quote from publication: "Due to nature of assignment, we could not blind participants PCPs" Comment: participants unlikely to have been blinded |
| Blinding of participants and personnel (performance bias) Subjective outcomes | High risk | Quote from publication: "Due to nature of assignment, we could not blind participants PCPs" Comment: participants unlikely to have been blinded |
| Blinding of outcome assessment (detection bias) Lab tests: Lipids, HBA1C | Low risk | Quote from publication: "Trained bilingual and bicultural research staff blinded to the study condition conducted assessments" |
| Blinding of outcome assessment (detection bias) Subjective outcomes | High risk | Comment: participants not blinded |
| Incomplete outcome data (attrition bias) Objective outcomes | Low risk | Comment: intention‐to‐treat analysis used (all 252 participants randomly assigned were included in analysis) |
| Incomplete outcome data (attrition bias) Subjective outcomes | Low risk | Comment: intention‐to‐treat analysis used (all 252 participants randomly assigned were included in analysis) |
| Selective reporting (reporting bias) | Unclear risk | Comment: protocol not seen, and several secondary outcomes from abstract not reported |
| Other bias | Low risk | Comment: none |
Rothschild 2013.
| Methods |
Parallel randomised controlled clinical trial (RCT) Randomisation ratio: 1:1 Superiority design |
|
| Participants |
Inclusion criteria:
Exclusion criteria:
Diagnostic criteria: not stated Participating population: 144 Mexican Americans in the Chicago area |
|
| Interventions |
Number of study centres: not stated Treatment before study: All participants were taking at least 1 oral hypoglycaemic agent. 35.4% were taking aspirin, and 46.5% were taking an ACEi or an ARB. The mean number of medications a patient was taking at baseline was 4.8 (SD = 2.9) The intervention included 36 visits over 2 years from a community health worker (from the same community), who delivered behavioural self‐management training using a curriculum derived from recommendations of the American Academy of Diabetes Educators (the AADE 7) |
|
| Outcomes |
Primary outcomes:
Secondary outcomes:
|
|
| Study details |
Run‐in period: recruitment of participants took place between January 2006 and September 2008 Study terminated before regular end: no |
|
| Publication details |
Language of publication: English Funding: National Institute for Diabetes and Digestive and Kidney Diseases Publication status: peer‐reviewed journal |
|
| Stated aim of study | To assess whether community health workers can improve glycaemic control among Mexican Americans with diabetes | |
| Notes | — | |
| Risk of bias | ||
| Bias | Authors' judgement | Support for judgement |
| Random sequence generation (selection bias) | Low risk | Quote from publication: "Randomisation used a permuted block design with block sizes of 4 and 6 in a single randomisation scheme. The Rush Preventive Medicine Data Management Center generated randomisation lists" |
| Allocation concealment (selection bias) | Unclear risk | Comment: concealment method not described |
| Blinding of participants and personnel (performance bias) Objective outcomes | High risk | Comment: participants and HCWs not blinded, which may artificially alter their performance in diabetic management |
| Blinding of participants and personnel (performance bias) Subjective outcomes | High risk | Comment: participants and HCWs not blinded, which may artificially alter their performance in diabetic management |
| Blinding of outcome assessment (detection bias) Lab tests: Lipids, HBA1C | Low risk | Comment: Research assistants blinded to participants’ group assignments collected outcome data at 12 and 24 months after randomisation |
| Blinding of outcome assessment (detection bias) Subjective outcomes | High risk | Comment: Self‐reported subjective outcome measures are at high risk of bias given that participants were not blinded |
| Incomplete outcome data (attrition bias) Objective outcomes | Unclear risk | Comment: data not available |
| Incomplete outcome data (attrition bias) Subjective outcomes | Unclear risk | Comment: data not available |
| Selective reporting (reporting bias) | Unclear risk | Comment: large quantity of baseline data collected, and follow‐up data not adequately provided. For instance, blood pressure is dichotomised as an outcome, whereas it is presented as continuous at baseline. Self‐efficacy is reported as "increasing significantly for both study arms," but no further details are provided |
| Other bias | Unclear risk | Comment: none |
Samuel‐Hodge 2009.
| Methods |
Cluster randomised controlled trial: 24 churches randomly assigned, 201 participants involved Randomisation ratio: not specified. Assumed 1:1. 13 churches intervention, 11 churches control Superiority design |
|
| Participants |
Inclusion criteria:
Exclusion criteria:
Diagnostic criteria: Participating population: African Americans diagnosed with type 2 diabetes who went to church |
|
| Interventions |
Number of study centres: 24 churches involved in study Treatment before study: not stated Intervention: majority of intervention consisted of 12 biweekly group sessions, held at each church. Most sessions lasted between 90 and 120 minutes. Before each session, participants had their blood glucose checked and blood pressure checked and received feedback about their results. Each session opened with a prayer, followed by the main educational component of the session. Each session also involved a short physical activity segment (15 minutes, using chair exercises) and taste testing of 1 or 2 recipes. The format for sessions included small‐group activities designed to be acceptable to persons with very limited literacy skills and those unaccustomed to group education/interactions. Therefore sessions were interactive, included lots of visual and hands‐on activities, involved limited writing, used a game format for teaching nutrition concepts when feasible and included opportunities for participants to share their successes and struggles with efforts to change behaviours Before the 12 sessions, participants had a 60‐minute individual counselling session with a registered dietician to assess their usual dietary, physical activity and self‐management behaviours, to initiate counselling and to facilitate subsequent counselling. The church diabetes advisor phoned participants monthly to offer support for behaviour change to improve diabetes self‐management Finally, to try to co ordinate the intervention with participants' primary care physician, study staff sent 3 postcard messages of encouragement to participants on behalf of their primary care physician during the first 8 months of the study. Postcard messages were tailored to behavioural goals selected by participants and included brief messages relevant to dietary behaviour, physical activity and HbA1c Control: Control group received minimal intervention, which included mailing to participants of 2 pamphlets ("Healthy Eating" and "Staying Active"), published by the American Diabetes Association, and 3 bimonthly newsletters providing general information and study updates Provider: A registered dietician on the study staff led the first 7 group sessions with the assistance of a Church Diabetes Advisor (CDA). The CDA was a peer counsellor with type 2 diabetes, or who had lived with someone diagnosed with diabetes for at least 2 years. CDAs were selected on the basis of recommendations of the pastor and were trained over a 1‐month period (4 weekly 4‐hour sessions) in the areas of motivational interviewing techniques, listening skills, diabetes self‐management and telephone counselling. The educational components of sessions 8 to 11 were led by a health professional from the local community who was identified and invited to participate by the CDA. For the last session, participants were given the option to choose a health‐related presentation or to have a potluck meal. The individual counselling session at the start was led by a registered dietician |
|
| Outcomes | Assessed at baseline, 8 months and 12 months Primary outcome: comparison of A1C levels at 8 months All outcomes:
|
|
| Study details |
Run‐in period: not stated Study terminated before regular end: no |
|
| Publication details |
Language of publication: English Funding: Centers for Disease Control and Prevention Publication status: peer‐reviewed journal |
|
| Stated aim of study | This was a prospective, group‐randomised, multi‐site trial conducted to test a culturally appropriate, church‐based intervention to improve diabetes self‐management | |
| Notes | ‐ | |
| Risk of bias | ||
| Bias | Authors' judgement | Support for judgement |
| Random sequence generation (selection bias) | Low risk | Quote from publication: "determined by random numbers generated by a statistical consultant using a personal computer" |
| Allocation concealment (selection bias) | Low risk | Comment: Allocation of this predetermined random number sequence was concealed by using "a set of sequentially numbered sealed envelopes" |
| Blinding of participants and personnel (performance bias) Objective outcomes | High risk | Comment: participants not blinded |
| Blinding of participants and personnel (performance bias) Subjective outcomes | High risk | Comment: participants not blinded, and fact that provider (church diabetes advisor) is a member of that specific church may lead to exposure of participants to more intervention than specified (e.g. meeting the provider at church between sessions) |
| Blinding of outcome assessment (detection bias) Lab tests: Lipids, HBA1C | Low risk | Comment: not blinded but unlikely to affect outcome; detailed description of how BP measured and number of times, etc |
| Blinding of outcome assessment (detection bias) Subjective outcomes | High risk | Quote from publication: "Except for the final telephone interview assessing the acceptability of the intervention, personnel conducting follow‐up interviews were masked to the participants study group" Comment: Self‐reported subjective outcome measures were used, which are at high risk of bias given that participants were not blinded |
| Incomplete outcome data (attrition bias) Objective outcomes | Low risk | Comment: low number lost to follow‐up for similar reasons. ITT analysis |
| Incomplete outcome data (attrition bias) Subjective outcomes | Low risk | Comment: low number lost to follow‐up for similar reasons. ITT analysis |
| Selective reporting (reporting bias) | Unclear risk | Comment: data extensively presented but study protocol not seen |
| Other bias | Unclear risk | Comment: none |
Sixta 2008.
| Methods |
Randomised controlled clinical trial (RCT): 2 groups Randomisation ratio: 1:1 Superiority design |
|
| Participants |
Inclusion criteria:
Exclusion criteria: no exclusion criteria specifically stated Diagnostic criteria: Participating population: Mexican Americans diagnosed with type 2 diabetes |
|
| Interventions |
Number of study centres: 1 Treatment before study: not stated Titration period: n/a Intervention: Intervention was a 10‐week diabetes self‐management course taught by 2 promotoras, who were employed by the clinic and supervised by nurses. 10 weekly group sessions lasted for 90 minutes. A scripted course curriculum was used by the promotoras to maintain consistency and accuracy of information. The course was presented in Spanish and was culturally sensitive. The promotoras were the primary instructors and presented the information in a manner that participants could understand Control: Participants in the control group did not receive the intervention until after the trial was complete (wait‐listed control group) Provider: Intervention was provided by promotoras, employed by the clinic and supervised by nurses |
|
| Outcomes | Assessed at baseline, at 3 months and at 6 months Primary outcomes:
Secondary outcome(s): |
|
| Study details |
Run‐in period: unclear Study terminated before regular end: no |
|
| Publication details |
Language of publication: English Funding: Ruth L. Kirschstein National Research Service Award 1 F31 Publication status: peer‐reviewed journal |
|
| Stated aim of study | Quote from publication: "The purpose of this study is to evaluate the impact of a promotora‐led diabetes self‐management program by comparing the outcomes (knowledge, beliefs and HbA1c level) of Mexican American patients with type 2 diabetes who received usual diabetic care in a wait‐listed control group to those who received self‐management education and follow‐up by promotoras in consultation with clinic providers and staff" | |
| Notes | — | |
| Risk of bias | ||
| Bias | Authors' judgement | Support for judgement |
| Random sequence generation (selection bias) | Unclear risk | Comment: method of randomisation not specified |
| Allocation concealment (selection bias) | Unclear risk | Comment: not commented on |
| Blinding of participants and personnel (performance bias) Objective outcomes | High risk | Comment: participants not blinded |
| Blinding of participants and personnel (performance bias) Subjective outcomes | High risk | Comment: participants not blinded |
| Blinding of outcome assessment (detection bias) Lab tests: Lipids, HBA1C | Low risk | Quote from publication: "The HbA1c level was drawn by a laboratory technician using a standard venipuncture technique. The samples were sent by the CHC to a consistent, commercial, Clinical Laboratory Improvement Amendments–accredited laboratory. Results were sent back to the CHC via a protected Web site" |
| Blinding of outcome assessment (detection bias) Subjective outcomes | High risk | Quote from publication: "Bilingual research assistants, masked to the group assignment, collected information through interviews in the patient's language of choice in a private setting at the clinic" Comment: These results still included self‐reported outcome measures, however from non‐blinded participants |
| Incomplete outcome data (attrition bias) Objective outcomes | Unclear risk | Quote from publication: "No subjects were eliminated because of missing data." Only 50% of participants "completed baseline, 3‐month and 6‐month assessments" Comment: no further information given |
| Incomplete outcome data (attrition bias) Subjective outcomes | Unclear risk | Quote from publication: "No subjects were eliminated because of missing data." Only 50% of participants "completed baseline, 3‐month and 6‐month assessments" No further information given Comment: no further information given |
| Selective reporting (reporting bias) | Unclear risk | Comment: none apparent but study protocol not seen |
| Other bias | Unclear risk | Comment: none |
Skelly 2005.
| Methods |
Parallel randomised controlled clinical trial (RCT) Randomisation ratio: 23 intervention:18 control Superiority design |
|
| Participants |
Inclusion criteria:
Exclusion criteria:
Diagnostic criteria: not stated Participating population: older African American women in rural area in North Carolina |
|
| Interventions |
Number of study centres: One health department; two community‐based practices; one community health centre providing primary care in 3 rural counties of a southeastern state Treatment before study: not stated Intervention: individual biweekly visits to individuals' homes lasting < 1 hour, with 4 achievable modules on teaching and counselling intervention based on patient‐nurse collaboration. Total time spent with participants was 6 hours. Provider was a nurse‐investigator not blinded to participants' group assignment Control: Control group received also 2 pre‐intervention visits, during which demographic data were collected and study instruments administered. Controls also received a telephone call at a midpoint between baseline and final evaluation details. Total time spent was 3 hours and time spent on a telephone call Provider: nurse |
|
| Outcomes |
Outcomes reported in abstract of publication: Primary outcome(s):
Secondary outcome(s): Not stated primary or secondary outcomes |
|
| Study details |
Run‐in period: not stated Study terminated before regular end: no |
|
| Publication details |
Language of publication: English Funding: National Institute of Nursing Research Grant Publication status: peer‐reviewed journal |
|
| Stated aim of study | Quote from publication: "To assess the effect of culturally sensitive symptoms‐focused intervention in older African‐American women with type 2 DM in a rural area" | |
| Notes | ‐ | |
| Risk of bias | ||
| Bias | Authors' judgement | Support for judgement |
| Random sequence generation (selection bias) | Low risk | Comment: used random tables |
| Allocation concealment (selection bias) | Unclear risk | Comment: no mention |
| Blinding of participants and personnel (performance bias) Objective outcomes | High risk | Comment: participants and providers not blinded |
| Blinding of participants and personnel (performance bias) Subjective outcomes | Unclear risk | Comment: no subjective outcomes used in data analysis |
| Blinding of outcome assessment (detection bias) Lab tests: Lipids, HBA1C | Low risk | Comment: outcome assessors not blinded but unlikely to have affected HbA1c |
| Blinding of outcome assessment (detection bias) Subjective outcomes | Unclear risk | Comment: no subjective outcomes used in data analysis |
| Incomplete outcome data (attrition bias) Objective outcomes | Unclear risk | Comment: not stated whether ITT used. 4 of 47 lost to follow‐up. Few reasons given |
| Incomplete outcome data (attrition bias) Subjective outcomes | Unclear risk | Comment: no subjective outcomes used in data analysis |
| Selective reporting (reporting bias) | Unclear risk | Comment: protocol not seen |
| Other bias | Unclear risk | Comment: none |
Skelly 2009.
| Methods |
Group randomised controlled clinical trial (RCT): (2/3 of participants were randomly assigned to the intervention, 1/3 to a diet and weight control intervention. Control group received an attention‐control intervention. Of the participants randomly assigned to receive the intervention, half were randomly assigned to receive a telephone booster after 6 months, and half were randomly assigned to not receive this booster. Will not include booster analysis in this review) Randomisation ratio: 2:1 intervention:control Superiority design |
|
| Participants |
Inclusion criteria:
Exclusion criteria:
Others not specified Participating population: African American women over 50 years of age who had type 2 diabetes and lived in a rural area |
|
| Interventions |
Number of study centres: not stated Treatment before study: unclear Intervention: Intervention consisted of 4 60‐minute fortnightly home visits by a nurse to participant's house. Intervention was symptom‐focused and involved teaching and counselling. Each session was guided by a different module: (1) symptoms of hyperglycaemia, (2) symptoms of hypoglycaemia, (3) numbness and tingling in the feet/foot pain and (4) prevention of cardiovascular symptoms. The intervention was individualised by allowing participants to choose in what order they addressed symptoms and what management strategies they used. Intervention was made culturally appropriate by incorporating women's own coping strategies (e.g. spirituality, importance of family) and allowing time for women to tell their own stories about living with diabetes. In addition, an advisory board of 6 African American women living in similar communities as participants guided development of study materials. Booster intervention started after 6 months (about 3 months after intervention finished) and consisted of 4 telephone calls by nurse who had carried out intervention at intervals of about 2‐3 weeks Control: Control participants also received 4 60‐minute fortnightly home visits by a nurse (a different nurse from the one who carried out the symptom‐focused intervention). However, instead of a symptom‐focused intervention, the control group received a weight and diet program. The 4 modules delivered across the 4 sessions were weight maintenance (2 modules), fat modification and sodium modification. Participants were taught skills to enhance diabetes self‐care (e.g. reading labels, determining portion sizes). This intervention was also individualised and was culturally tailored. It was expected that this intervention would not be effective, but actually it was, probably because it was individualised to each participant Provider: nurse |
|
| Outcomes | Assessed at 3, 6 and 9 months
|
|
| Study details |
Run‐in period: unclear Study terminated before regular end: no |
|
| Publication details |
Language of publication: English Funding: National Institute of Nursing Research grant Publication status: peer‐reviewed journal |
|
| Stated aim of study | Quote from publication: "To test the effectiveness of a symptom‐focused diabetes intervention on older African American women with type 2 diabetes" | |
| Notes | ‐ | |
| Risk of bias | ||
| Bias | Authors' judgement | Support for judgement |
| Random sequence generation (selection bias) | Unclear risk | Comment: unclear how randomisation procedure was carried out |
| Allocation concealment (selection bias) | Low risk | Quote from publication: "Allocation concealed in sealed, opaque envelopes, that were opened in a verified system, which assured that participants received assignment in the order in which they were enrolled" |
| Blinding of participants and personnel (performance bias) Objective outcomes | Unclear risk | Comment: no data used |
| Blinding of participants and personnel (performance bias) Subjective outcomes | Unclear risk | Comment: no data used |
| Blinding of outcome assessment (detection bias) Lab tests: Lipids, HBA1C | Unclear risk | Comment: no data used |
| Blinding of outcome assessment (detection bias) Subjective outcomes | Unclear risk | Comment: no data used |
| Incomplete outcome data (attrition bias) Objective outcomes | Unclear risk | Comment: no data used |
| Incomplete outcome data (attrition bias) Subjective outcomes | Unclear risk | Comment: no data used |
| Selective reporting (reporting bias) | Unclear risk | Comment: no data used |
| Other bias | Unclear risk | Comment: no data used |
Spencer 2011 African‐Amer.
| Methods |
Parallel randomised controlled clinical trial (RCT) Randomisation ratio: 9:11 (intervention:control) to account for attrition rate Superiority design |
|
| Participants | African American type 2 diabetics in certain ZIP codes of Detroit Inclusion criteria:
Exclusion criteria: Those who already had serious diabetes complications (e.g. blindness, amputated limbs, kidney failure) Diagnostic criteria: "physician diagnosed" Participating population: 164 Hispanic or African American residents of Detroit (70 Hispanic, 94 African American) |
|
| Interventions | Trained community health workers (CHWs) A.K.A. “family health advocates” promoted healthy lifestyle and self‐management activities. In addition, family health advocates helped participants improve their patient‐provider communication skills and facilitated necessary referrals to other service systems. This took the form of:
Participants in the control group were contacted once per month to update contact information |
|
| Outcomes |
Primary:
Secondary: (at baseline and at 6 months)
|
|
| Study details |
Run‐in period: Recruitment of participants took place between September 2004 and July 2006 Study terminated before regular end: no |
|
| Publication details | Publication status: peer‐reviewed journal | |
| Stated aim of study | To test "the effectiveness of a culturally tailored, behavioural theory‐based community health worker intervention for improving glycaemic control” | |
| Notes | — | |
| Risk of bias | ||
| Bias | Authors' judgement | Support for judgement |
| Random sequence generation (selection bias) | Unclear risk | Quote from publication: “Participants were stratified by race/ethnicity and health care site during randomisation to ensure that those variables were equally distributed across the 2 arms of the intervention” Comment: does not specify how exactly randomly assigned to intervention |
| Allocation concealment (selection bias) | Unclear risk | Comment: not commented on |
| Blinding of participants and personnel (performance bias) Objective outcomes | High risk | Quote from publication: "Participants, community health workers and interviewers were not blinded to the group assignment; however data analysts were blinded" |
| Blinding of participants and personnel (performance bias) Subjective outcomes | High risk | Comment: participants not blinded, and therefore may feel expected to overestimate the subjective outcomes to appear to have engaged with health workers (with whom they are likely to have formed relationships given the large amount of time input) |
| Blinding of outcome assessment (detection bias) Lab tests: Lipids, HBA1C | Low risk | Quote from publication: "Participants, community health workers and interviewers were not blinded to the group assignment; however data analysts were blinded" Comment: objective outcomes extracted from GP notes; therefore assumed to be independently collected |
| Blinding of outcome assessment (detection bias) Subjective outcomes | High risk | Comment: interviewers not blinded. It is very possible that the tone of the interview could alter people's answers to subjective outcomes |
| Incomplete outcome data (attrition bias) Objective outcomes | Low risk | Comment: Details of participants lost to follow‐up are well documented and seem comparable between groups |
| Incomplete outcome data (attrition bias) Subjective outcomes | Low risk | Comment: Details of participants lost to follow‐up are well documented and seem comparable between groups |
| Selective reporting (reporting bias) | Unclear risk | Comment: All data are commented upon; however, study protocol not seen |
| Other bias | Unclear risk | Comment: none |
Spencer 2011 Hispanic.
| Methods |
Parallel randomised controlled clinical trial (RCT) Randomisation ratio: 9:11 (intervention:control) to account for attrition rate Superiority design Recruitment of participants took place between September 2004 and July 2006 Intervention group received CHW input as described below. Both control and intervention groups received information on and had access to REACH Detroit community activities that provided free, publicly available healthy eating demonstrations, physical fitness activity and a weekly community farmer’s produce market. Also both groups received health care at facilities in which healthcare providers were trained in culturally competent diabetes care |
|
| Participants |
Inclusion criteria:
Exclusion criteria: Those who already had serious diabetes complications (e.g. blindness, amputated limbs, kidney failure) Diagnostic criteria: "physician diagnosed" Participating population: 164 Hispanic or African American residents of Detroit (70 Hispanic, 94 African American) |
|
| Interventions |
Number of centres: not stated Trained community health workers (CHWs) A.K.A. “family health advocates” promoted healthy lifestyle and self‐management activities. In addition family health advocates helped participants improve their patient‐provider communication skills and facilitated necessary referrals to other service systems. This took the form of:
|
|
| Outcomes |
Primary:
Secondary: (at baseline and 6 months)
|
|
| Study details |
Run‐in period: recruitment of participants took place between September 2004 and July 2006 Study terminated before regular end: no |
|
| Publication details | Publication status: peer‐reviewed journal | |
| Stated aim of study | To test "the effectiveness of a culturally tailored, behavioural theory‐based community health worker intervention for improving glycaemic control” | |
| Notes | — | |
| Risk of bias | ||
| Bias | Authors' judgement | Support for judgement |
| Random sequence generation (selection bias) | Unclear risk | Quote from publication: “Participants were stratified by race/ethnicity and health care site during randomisation to ensure that those variables were equally distributed across the 2 arms of the intervention” Comment: does not specify how exactly randomly assigned to intervention |
| Allocation concealment (selection bias) | Unclear risk | Comment: not commented on |
| Blinding of participants and personnel (performance bias) Objective outcomes | High risk | Quote from publication: "Participants, community health workers and interviewers were not blinded to the group assignment; however data analysts were blinded" |
| Blinding of participants and personnel (performance bias) Subjective outcomes | High risk | Comment: participants not blinded, and therefore may feel expected to overestimate the subjective outcomes to appear to have engaged with the health workers (with whom they are likely to have formed relationships given the large amount of time input) |
| Blinding of outcome assessment (detection bias) Lab tests: Lipids, HBA1C | Low risk | Quote from publication: "Participants, community health workers and interviewers were not blinded to the group assignment; however data analysts were blinded" Comment: Objective outcomes were extracted from GP notes, therefore assumed to be independently collected |
| Blinding of outcome assessment (detection bias) Subjective outcomes | High risk | Comment: interviewers not blinded. It is very possible that the tone of the interview could alter people's answers to subjective outcomes |
| Incomplete outcome data (attrition bias) Objective outcomes | Low risk | Comment: Details of participants lost to follow‐up are well documented and seem comparable between groups |
| Incomplete outcome data (attrition bias) Subjective outcomes | Low risk | Comment: Details of participants lost to follow‐up are well documented and seem comparable between groups |
| Selective reporting (reporting bias) | Unclear risk | Comment: All data are commented upon. However, study protocol not seen |
| Other bias | Unclear risk | Comment: none |
Toobert 2011.
| Methods |
Randomised controlled clinical trial (RCT): 2 groups: intervention and control Randomisation ratio: 1:1 Superiority design |
|
| Participants |
Inclusion criteria:
Exclusion criteria:
Participating population: Latina women diagnosed with type 2 diabetes living in Denver, Colorado |
|
| Interventions |
Number of study centres: recruited from 9 Kaiser Permanente clinics in Denver area and 1 community health centre, the Salud Family Health Center, located in Commerce City (near Denver) Treatment before study: not stated Intervention: Intervention was the Viva Bien programme, a culturally adapted version of the previously established Mediterranean Lifestyle Program for diabetes. The intervention involved a 2.5‐day retreat, followed by 4‐hour weekly meetings for 6 months, then fortnightly meetings for the remaining 6 months The purpose of the retreat was to introduce each of the major components of the programme and provide time for participants to practice new skills. The 4‐hour meetings included an hour of instruction on the following topics: diet, stress management, physical activity and support groups The intervention was culturally adapted by using information gathered from a literature review and focus groups. Examples of changes made include greater family involvement, foods common in Latin American countries that could be used in modified Mediterranean diet recipes and incorporation of Latin music, language and symbols in meetings and materials Control: Control group received usual care only. No details given as to what this involves Provider: retreat led by "bilingual staff" Not stated who ran meetings ("facilitator led"). Sounds as though a team of bilingual staff ran the meetings, probably including a nurse and a dietician |
|
| Outcomes |
Outcomes reported in abstract of publication: Primary outcome(s): Secondary outcome(s): Outcomes assessed at 6 and 12 months:
|
|
| Study details |
Run‐in period: unclear Study terminated before regular end (for benefit/because of adverse events): no |
|
| Publication details |
Language of publication: English Funding: National Heart, Lung and Blood Institute Publication status: peer‐reviewed journal |
|
| Stated aim of study | Quote from publication: "The purpose of this paper was to document the extent to which the Viva Bien intervention helped Latinas with type 2 diabetes to make simultaneous changes in psychosocial factors and multiple lifestyle behaviours that were hypothesised to result in improved biologic and quality of life outcomes at 6 and 12 months" | |
| Notes | — | |
| Risk of bias | ||
| Bias | Authors' judgement | Support for judgement |
| Random sequence generation (selection bias) | Low risk | Quote from publication: randomisation done through a "computerized random number generator" |
| Allocation concealment (selection bias) | Unclear risk | Comment: not mentioned |
| Blinding of participants and personnel (performance bias) Objective outcomes | High risk | Comment: assessors blinded to the assignment at baseline assessment only. After that, they were aware of participant treatment assignments |
| Blinding of participants and personnel (performance bias) Subjective outcomes | High risk | Comment: assessors blinded to the assignment at baseline assessment only. After that, they were aware of participant treatment assignments |
| Blinding of outcome assessment (detection bias) Lab tests: Lipids, HBA1C | Low risk | Comment: HbA1c assessment unlikely to have been affected by lack of blinding |
| Blinding of outcome assessment (detection bias) Subjective outcomes | High risk | Quote from publication: "Much of the assessment did not involve assessors, and therefore could not be biased by their knowledge of treatment assignment" Comment: however, participants completing questionnaires not blinded |
| Incomplete outcome data (attrition bias) Objective outcomes | Low risk | Comment: Both ITT and per‐protocol analyses were carried out, with similar results and ITT data reported |
| Incomplete outcome data (attrition bias) Subjective outcomes | Low risk | Comment: Both ITT and per‐protocol analysis were carried out, with similar results and ITT data reported |
| Selective reporting (reporting bias) | Unclear risk | Comment: Results are given for all stated outcomes; study protocol not seen |
| Other bias | Unclear risk | Comment: none |
Vincent 2007.
| Methods |
Parallel randomised controlled clinical trial (RCT) Randomisation ratio: 10:10 Superiority design |
|
| Participants |
Inclusion criteria:
Exclusion criteria:
Participating population: Mexican Americans diagnosed with type 2 diabetes Diagnostic criteria: none stated |
|
| Interventions |
Number of study centres: 1 Treatment before study: N/A Intervention: intervention consisted of 8 weekly 2‐hour group sessions, which included didactic content, cooking demonstrations and group support. Didactic content considered essential by the ADA and the National Diabetes Education Program (NDEP 2002) was the foundation of the intervention. Numerous cultural modifications were used, including encouraging participants to bring a support person to sessions, delivering intervention and all materials in Spanish, facilitating the support group by providing a promotora (Mexican American lay educator) and including cultural content such as Mexican American risks and home remedies Control: Control group received usual care and education given at the clinic. This consisted of a 10‐ to 15‐minute encounter with a physician or nurse practitioner 2 to 4 times per year Provider: Group sessions were facilitated by a promotora—a Mexican American lay educator. Does not specify whether anyone else was present at the sessions |
|
| Outcomes |
Outcomes reported in abstract of publication: Primary outcomes: Secondary outcomes: Assessed at 2 months and at 3 months:
|
|
| Study details |
Run‐in period: unclear Study terminated before regular end: no |
|
| Publication details |
Language of publication: English Funding: grant from University of Arizona Publication status: peer‐reviewed journal |
|
| Stated aim of study | Quote from publication: "The purpose of this study was to test the feasibility and examine the effects of a culturally tailored intervention for Mexican Americans with type 2 diabetes on outcomes of self‐management" | |
| Notes | — | |
| Risk of bias | ||
| Bias | Authors' judgement | Support for judgement |
| Random sequence generation (selection bias) | Low risk | Quote from publication: "were randomly assigned to control or intervention group using a list of random numbers from the Microsoft Excel random‐number generator function" |
| Allocation concealment (selection bias) | Unclear risk | Comment: not mentioned |
| Blinding of participants and personnel (performance bias) Objective outcomes | High risk | Comment: Because of the nature of the intervention, participants and personnel were not blinded |
| Blinding of participants and personnel (performance bias) Subjective outcomes | High risk | Comment: Because of the nature of the intervention, participants and personnel were not blinded |
| Blinding of outcome assessment (detection bias) Lab tests: Lipids, HBA1C | Low risk | Comment: not mentioned, but objectives outcomes unlikely to have been affected by any lack of blinding |
| Blinding of outcome assessment (detection bias) Subjective outcomes | High risk | Comment: not mentioned whether or not researchers who collected information were blinded. Also, some questionnaire data were collected by researchers reading aloud the questionnaire to participants, although apparently they had been trained to read questionnaires "without leading the participants to a specific answer and to communicate in a nonjudgmental manner regarding diabetes knowledge or health beliefs." However, participants not blinded |
| Incomplete outcome data (attrition bias) Objective outcomes | Unclear risk | Comment: small sample, per‐protocol analysis used. 3/20 (15%) participants dropped out. Different reasons for attrition between groups |
| Incomplete outcome data (attrition bias) Subjective outcomes | Unclear risk | Comment: small sample, per‐protocol analysis used. 3/20 (15%) participants dropped out |
| Selective reporting (reporting bias) | Unclear risk | Comment: protocol not seen |
| Other bias | Unclear risk | Comment: none |
A1C: glycosylated haemoglobin A1c; AADE: American Academy of Diabetes Educators; ACEi, angiotensin‐converting enzyme inhibitor; ADA: American Diabetes Association; ARB: angiotensin receptor blocker; BMI: body mass index; BP: blood pressure; CAPS: Cross‐Cultural Activity Participation Study; CDA: Church Diabetes Advisor; CDC: Centers for Disease Control and Prevention; CG: control group; CHC: community health centre; CHD: coronary heart disease; CHW: community health worker; CST: coping skills training; CVD: cardiovascular disease; DCP: Diabetes Care Profile; DEC: Diabetes Education Provider; DES‐SF: Diabetes Empowerment Scale, Short Form; DKQ: Diabetes Knowledge Questionnaire; DM: diabetes mellitus; DQOL: Diabetes Quality of Life Measure; DSEQ: Diabetes Self‐Efficacy Outcomes Expectancies Questionnaire; DSMT: diabetes self‐management training; ER: emergency room; ESRD: end‐stage renal disease; ESRF: end‐stage renal failure; FBG: fasting blood glucose; FFQ: Food Frequency Questionnaire; GP: XXX; HbA1c: glycosylated haemoglobin A1c; HDL: high‐density lipoprotein; HE: health education; HGMT: home glucose monitoring with teletransmission; IAP: intervention action plan; IG: intervention group; IMB: Information‐Behavioural Skills model; ITT: intention‐to‐treat; KDSKA: Kim Depression Scale for Korean Americans; LDL‐C: low‐density lipoprotein cholesterol; MOC: Medical Outcomes Study; MHCCQ: Modified Health Care Climate Questionnaire; N/A: not applicable; NCM: nurse care manager; NCMHD: National Center on Minority Health Disparities; NDEP: National Diabetes Education Program; OGTT: oral glucose tolerance test; OHA: oral hypoglycaemic agent; PA: physical activity; PAID: Problem Areas in Diabetes Survey; PBV: perceived behaviour control; PCP: primary care provider; QALY: quality‐adjusted life‐year; QoL: quality of life; RCT: randomised controlled trial; SD: standard deviation; SDSCA: Summary of Diabetes Self‐Care Activities; SDSMP: Spanish Diabetes Self‐Management Program; SMBG: self monitoring of blood glucose; T2DM: type 2 diabetes mellitus; TPB: theory of planned behaviour; wk: weeks.
Characteristics of excluded studies [ordered by study ID]
| Study | Reason for exclusion |
|---|---|
| Ahmedani 2012 | Includes both type 1 and type 2 diabetes and does not focus on ethnic group in Pakistan |
| Al‐Shookri 2012 | Arab Omanis are not an ethnic minority |
| Alexander 2008 | Not a randomised controlled trial (RCT) |
| Amano 2007 | Not an ethnic minority group |
| Amaoko 2007 | Not clearly defined diabetes health education |
| Amaoko 2008 | Outcome assessed only at 6 weeks, not clearly defined diabetes health education |
| Andersen 2013 | Excluded if have diabetes |
| Anderson 2010 | Multi‐ethnic group |
| Arakaki 2009 | No specific ethnic minority group |
| Arora 2012 | Not an RCT, includes both type 1 and type 2 diabetes |
| Barrera 2012 | No outcomes from our protocol |
| Batik 2008 | No health education |
| Blackwell 2011 | No ethnic group; participants did not have type 2 diabetes mellitus (DM) |
| Bogner 2010 | Not clearly defined health education |
| Bolin 2013 | Not type 2 diabetes, mixed ethnic group |
| Borges 2007 | Outcomes assessed at 1 month only |
| Boudreau 2011 | No outcomes from our review |
| Bravis 2010 | Appears participants were not randomly assigned |
| Bray 2013 | Not an RCT |
| Brown 2007 | No control group, not an RCT |
| Brown 2010 | Not an RCT |
| Brown 2011 | All received culturally appropriate health education (HE). Intervention group had nurse case manager |
| Calle 2009 | No outcomes specified in our protocol |
| Calles‐Escandon 2010 | Intervention not diabetes health education (HE) |
| Chan 2009 | Not an ethnic minority group, intervention not culturally adapted |
| Choi 2012 | Not an RCT, also this is a pilot study |
| Choudhury 2008 | Qualitative study, not an RCT |
| Comellas 2010 | No control group, not an RCT. Mutli‐ethnic group |
| Cramer 2007 | Not specified by ethnic group |
| Crasto 2010 | No specific ethnic minority group |
| Crasto 2011 | No ethnic minority group |
| Davidson 2007 | No control group, not an RCT |
| Davis 2009 | Participants did not have type 2 diabetes |
| Davis 2009a | Multi‐ethnic group, no clearly defined ethnic group |
| Davis 2009b | Conference abstract for Diabetes Telecare Study (Davis 2009a) |
| Davis 2011 | Not an RCT |
| Deitrick 2010 | Qualitative study, not an RCT |
| Douglas 2013 | Not type 2 diabetes, participants have "impaired glycaemia" |
| Eakin 2007 | Any chronic condition, not just type 2 diabetes |
| Egede 2010 | No results |
| Ell 2009 | Just design, no results |
| Ezenwaka 2011 | Not an ethnic minority group |
| Fatima 2011 | Cohort study with purposive sampling |
| Fernandez 2011 | No clearly defined outcome from protocol, assesses questionnaire validity |
| Gerber 2012 | Trial design, plus mixed ethnic group |
| Gill 2010 | No control group, not an RCT |
| Glasgow 2011 | No specific ethnic minority group |
| Henderson 2012 | Study not completed and cultural intervention not clear |
| Heudebert 2013 | Abstract of conference only. Does not appear culturally adapted. |
| Hill‐Briggs 2007 | Not an RCT |
| Hill‐Briggs 2011 | Intervention not culturally adapted |
| Hotu 2010 | No health education in intervention |
| Ivey 2012 | Not an RCT |
| Jernigan 2011 | Not an RCT |
| Jones 2008 | Qualitative study, not an RCT |
| Kanaya 2012 | Participants do not have type 2 diabetes |
| Katula 2011 | Participants did not have type 2 diabetes |
| Klug 2008 | Not an RCT |
| Latham 2009 | No control group, not an RCT |
| Leeman 2008 | No control group, not an RCT |
| Lenjawi 2012 | Discussed with KH. Qatar not on list of selected countries and excluded, as study population is the national group not at a disadvantage |
| Levetan 2002 | Study included only 86% of African Americans, and the intervention was not culturally relevant |
| Liang 2011 | Participants did not all have type 2 diabetes plus did not receive not a culturally tailored intervention |
| Lunde 2012 | Participants do not have type 2 diabetes |
| Martin 2011 | Just about recruitment, not an RCT |
| McCloskey 2009 | Not an RCT |
| Metghalchi 2008 | Cohort study, not an RCT |
| Mohamed 2013 | Arabs in Qatar not ethnic minority group |
| Murrock 2009 | Not health education |
| Nam 2010 | Cross‐sectional survey, not an RCT |
| Osuna 2011 | Pilot study, not an RCT |
| Oyetayo 2011 | Not an RCT |
| Palmas 2012 | It is a protocol |
| Peña‐Purcell 2011 | Not a randomised controlled trial |
| Phumipamorn 2008 | Not an ethnic group, not culturally adapted |
| Powers 2009 | This is a protocol |
| Prezio 2013 | No clearly defined ethnic group |
| Raberg Kjollesdal 2011 | Both type 1 and type 2 diabetes |
| Rosal 2009 | No results, just design |
| Rothschild 2012 | Study design paper |
| Ruelas 2009 | Not clearly defined health education and unsure whether culturally adapted. Both groups had same number of visits |
| Ruggiero 2010 | Multi‐ethnic group |
| Ruggiero 2010b | No specific ethnic minority group |
| Ryan 2013 | Not an RCT (feasibility study), no clearly defined ethnic group |
| Saha 2013 | Protocol, not for diabetic individuals |
| Salto 2011 | Not an RCT |
| Shea 2009 | Type 1 and type 2 diabetes |
| Shenoy 2009 | Not an ethnic group, not a culturally tailored intervention |
| Shenoy 2010 | Not an ethnic group, intervention not culturally adapted |
| Shi 2010 | Not an ethnic minority group |
| Skelly 2008 | Not an RCT |
| Skoro‐Kondza 2009 | Multi‐ethnic group, not health education |
| Sun 2012 | Includes both type 1 and type 2 diabetes |
| Tang 2010 | Not an RCT |
| Tang 2011 | Not an RCT |
| Tang 2012 | Not an RCT |
| Trief 2013 | Not clear whether only type 2, also mixed ethnic groups |
| Utz 2008 | No control group, not an RCT |
| Vincent 2008 | Qualitative data for same trial as Vincent 2007 |
| Walker 2008 | includes both type 1 and type 2 diabetes and multi‐ethnic group |
| Walker 2010 | Participants were not randomly assigned to intervention |
| Walker 2011 | Mixed ethnic group |
| Wattana 2007 | Not an ethnic minority group |
| Weinstock 2011 | Type 1 and type 2 diabetes, multi‐ethnic group |
| Weinstock 2011b | Participants had both type 1 and type 2 diabetes |
| Welch 2011 | No clearly defined diabetes health education and both groups culturally adapted |
| West 2007 | Mixed ethnic group and no diabetes health education |
| West 2008 | Partcipants do not have type 2 diabetes |
| Wheeler 2012 | Not an RCT |
| Williams 2013 | For non‐diabetic individuals, trial design |
| Winston 2009 | Conference abstract. No specific ethnic minority group |
DM: diabetes mellitus; HE: health education; RCT: randomised controlled trial
Differences between protocol and review
The initial protocol considered six months, 12 months and two years as standard time intervals for assessment of outcome data. However, available data showed a high number of studies assessing outcomes at three months; this was discovered only after the protocol was written. Therefore three‐month assessments were included in the main analysis for both the original review and the update review; otherwise a substantial amount of information would have been lost.
We had originally planned to perform subgroup analyses of several other covariates, including stratifying data by gender of educators, gender of participants, age group of participants, newly diagnosed versus established diabetes, literacy of participants and ability to speak the country's main language. However, this was not possible, as no studies stratified their data in this way. In addition, we planned to perform subgroup analyses of the setting in which the intervention took place (i.e. community vs hospital). However, it was not always possible to identify the venue(s) at which the health education intervention took place, and indeed in some studies, a mixture of primary and secondary care venues was used for the convenience of participants; therefore venue could not be assessed.
Contributions of authors
Madeleine Attridge (MA): search strategy development, acquisition of trial copies, trial selection, data extraction, data analysis, data interpretation, review and update of draft.
John Creamer (JC): protocol draft, search strategy development, acquisition of trial copies, trial selection, data extraction, data analysis, data interpretation, review and update of draft.
Michael Ramsden (MR): data extraction, data analysis, data interpretation, review and update of draft.
Rebecca Cannings‐John (RCJ): data analysis and interpretation.
Kamila Hawthorne (KH): protocol draft, search strategy development, acquisition of trial copies, trial selection, data extraction, data analysis, data interpretation, review and update of draft.
Declarations of interest
Kamila Hawthorne is the author of one study included in this review (Hawthorne 1997). The Co‐ordinating editor of the Cochrane Metabolic and Endocrine Disorders Group checked the included data and interpretation against the study report.
Madeleine Attridge: nothing to declare.
John Creamer: nothing to declare.
Michael Ramsden: nothing to declare.
Rebecca Cannings‐John: nothing to declare.
New search for studies and content updated (conclusions changed)
References
References to studies included in this review
Agurs‐Collins 1997 {published data only}
- Agurs‐Collins TD, Kumanyika SK, Have TR, Adams‐Campbell LL. A randomised controlled trial of weight reduction and exercise for diabetes management in older African‐American subjects. Diabetes Care 1997;20(10):1503‐11. [DOI] [PubMed] [Google Scholar]
Anderson 2005 {published data only}
- Anderson RM, Funnell MM, Nwankwo R, Gillard ML, Oh M, Fitzgerald T. Evaluating a problem‐based empowerment program for African Americans with diabetes: results of a randomized controlled trial. Ethnicity and Disease 2005;15:671‐8. [PubMed] [Google Scholar]
Babamoto 2009 {published data only}
- Babamoto KS, Sey KA, Camilleri AJ, Karlan VJ, Catalasan J, Morisky DE. Improving diabetes care and health measures among Hispanics using community health workers: results from a randomized controlled trial. Health Education & Behavior 2009;36(1):113‐26. [DOI] [PubMed] [Google Scholar]
Baradaran 2006 {published data only}
- Baradaran HR, Knill‐Jones RP, Wallia S, Rodgers A. A controlled trial of the effectiveness of a diabetes education programme in a multi‐ethnic community in Glasgow. BMC Public Health 2006;6:134. [DOI] [PMC free article] [PubMed] [Google Scholar]
Bellary 2008 {published data only}
- Bellary S, O'Hare JP, Raymond NT, Gumber A, Szczpura A, Kumar S, et al. Enhanced diabetes care to patients of South Asian ethnic origin (the United Kingdom Asian Diabetes Study): a cluster randomised controlled trial. Lancet 2008;371:1769‐76. [DOI] [PubMed] [Google Scholar]
Brown 2002 {published data only}
- Brown SA, Garcia AA, Kouzekanani K, Hanis CL. Culturally competent diabetes self‐management education for Mexican Amercians. Diabetes Care 2002;25(2):259‐68. [DOI] [PMC free article] [PubMed] [Google Scholar]
Carter 2011 {published data only}
- Carter EL, Nunlee‐Bland G, Callender C. A patient‐centric, provider‐assisted diabetes telehealth self‐management intervention for urban minorities. Perspectives in Health Information Management 2011;8:1b. [PMC free article] [PubMed] [Google Scholar]
Crowley 2013 {published data only}
- Crowley MJ, Powers BJ, Olsen MK, Grubber JM, Koropchak C, Rose CM, et al. The Cholesterol, Hypertension, And Glucose Education (CHANGE) study: results from a randomized controlled trial in African Americans with diabetes. American Heart Journal July 2013;166(1):179‐86. [DOI] [PubMed] [Google Scholar]
D'Eramo Melkus 2010 {published data only}
- D'Eramo Melkus G, Chyun D, Vorderstrasse A, Newlin K, Jefferson V, Langerman S. The effect of a diabetes education, coping skills training and care intervention on physiological and psychosocial outcomes in black women with type 2 diabetes. Biological Research for Nursing 2010;12(1):7‐19. [DOI] [PubMed] [Google Scholar]
DePue 2013 {published data only}
- DePue JD, Goldstein MG, Dunsiger S, Nu'usolia O, Seiden AD, Tuitele J, et al. Nurse‐community health worker team improves diabetes care in American Samoa. Diabetes Care July 2013;36(7):1947‐53. [DOI] [PMC free article] [PubMed] [Google Scholar]
Gary 2009 {published data only}
- Gary TL, Batts‐Turner M, Yeh H, Hill‐Broggs F, Bone LR, Wang N, et al. The effects of a nurse case manager and a community health worker team on diabetic control, emergency department visits and hospitalizations among urban African Americans with type 2 diabetes mellitus. Archives of Internal Medicine 2009;169(19):1788‐94. [DOI] [PMC free article] [PubMed] [Google Scholar]
Gucciardi 2007 {published data only}
- Gucciardi E, DeMelo M, Lee RN, Grace SL. Assessment of two culturally competent diabetes education methods: individual versus individual plus group education in Canadian Portuguese adults with type 2 diabetes. Ethnicity and Health 2007;12(2):163‐87. [DOI] [PubMed] [Google Scholar]
Hawthorne 1997 {published data only}
- Hawthorne K, Tomlinson S. One‐to‐one teaching with pictures—flashcard health education for British Asians with diabetes. British Journal of General Practice 1997;47:301‐4. [PMC free article] [PubMed] [Google Scholar]
Kattelmann 2009 {published data only}
- Kattelmann KK, Conti K, Ren C. The Medicine Wheel Nutrition Intervention: a diabetes education study with the Cheyenne River Sioux tribe. Journal of the American Dietetic Association 2009;109(9):1532‐9. [DOI] [PMC free article] [PubMed] [Google Scholar]
Keyserling 2002 {published data only}
- Keyserling TC, Samuel‐Hodge CD, Ammerman AS, Ainsworth BE, Hernandez‐Roldan CF, Elasy TA, et al. A randomised trial of an intervention to improve self‐care behaviours of African‐Amercan women with type 2 diabetes. Diabetes Care 2002;25(9):1576‐83. [DOI] [PubMed] [Google Scholar]
Khan 2011 ‐ African Ameri {published and unpublished data}
- Khan MA, Shah S, Grudzien A, Onyejekwe N, Banskota P, Karim S, et al. A diabetes education multimedia program in the waiting room setting. Diabetes Therapy 2011;2(3):178‐88. [DOI] [PMC free article] [PubMed] [Google Scholar]
Khan 2011‐ Hispanic {published data only}
- Khan MA, Shah S, Grudzien A, Onyejekwe N, Banskota P, Karim S, et al. A diabetes education multimedia program in the waiting room setting. Diabetes Therapy 2011;2(3):178‐88. [DOI] [PMC free article] [PubMed] [Google Scholar]
Kim 2009 {published data only}
- Kim MT, Han H, Song H, Lee J, Kim J, Ryu JP, et al. A community‐based, culturally tailored behavioral intervention for Korean Americans with type 2 diabetes. The Diabetes Educator 2009;35(6):986‐94. [DOI] [PMC free article] [PubMed] [Google Scholar]
Lorig 2008 {published data only}
- Lorig K, Ritter PL, Villa F, Piette JD. Spanish diabetes self‐management with and without automated telephone reinforcement. Diabetes Care 2008;31:408‐14. [DOI] [PubMed] [Google Scholar]
Lujan 2007 {published data only}
- Lujan J, Ostwald SK, Ortiz M. Promotora diabetes intervention for Mexican Americans. The Diabetes Educator 2007;33(4):660‐70. [DOI] [PubMed] [Google Scholar]
Middelkoop 2001 {published data only}
- MiddelKoop BJC, Geelhoed‐Duijvestijn PHLM, Wal G. Effectiveness of culture‐specific diabetes care for Surinam South Asian patients in the Hague. Diabetes Care 2001;24:1997‐8. [DOI] [PubMed] [Google Scholar]
O'Hare 2004 {published data only}
- O'Hare JP, Raymond NT, Mughal S, Dodd L, Hanif W, Ahmad Y, et al. Evaluation of delivery of enhanced diabetes care to patients of South Asian ethnicity: the United Kingdom Asian Diabetes Study (UKADS). Diabetic Medicine 2004;221:1357‐65. [DOI] [PubMed] [Google Scholar]
Osborn 2010 {published data only}
- Osborn CY, Amico KR, Cruz N, O'Connell AA, Perez‐Escamilla R, Kalichman SC, et al. A brief culturally tailored intervention for Puerto Ricans with type 2 diabetes. Health Education & Behavior 2010;37(6):849‐62. [DOI] [PMC free article] [PubMed] [Google Scholar]
Philis‐Tsimikas 2011 {published data only}
- Philis‐Tsimikas A, Walker C, Fortmann A, Gallo LC, Lleva‐Ocana L. Peer‐led diabetes education programs in high‐risk Mexican Americans improve glycaemic control compared with standard approaches. Diabetes Care 2011;34:1926‐31. [DOI] [PMC free article] [PubMed] [Google Scholar]
Rosal 2005 {published data only}
- Rosal M, Olendzki B, Reed GW, Gumieniak O, Scavron J, Ockene I. Diabetes self‐management among low‐income Spanish‐speaking patients. Annals of Behavioral Medicine 2005;29(3):225‐35. [DOI] [PubMed] [Google Scholar]
Rosal 2011 {published data only}
- Rosal MC, Ockene IS, Restrepo A, White MJ, Borg A, Olendzki B, et al. Randomized trial of a literacy‐sensitive, culturally tailored diabetes self‐management intervention for low‐income Latinos. Diabetes Care 2011;34:838‐44. [DOI] [PMC free article] [PubMed] [Google Scholar]
Rothschild 2013 {published data only}
- Rothschild SK, Martin MA, Swider SM, Tumialan Lynas CM, Janssen I, Avery EF, et al. MATCH: a randomized controlled trial of a community health worker intervention for Mexican Americans with type 2 diabetes mellitus. American Journal of Public Health August 15 2013;Online:.. [DOI] [PMC free article] [PubMed] [Google Scholar]
Samuel‐Hodge 2009 {published data only}
- Samuel‐Hodge CD, Keyserling TC, Park S, Johnston LF, Gizlice Z, Bangdiwala SI. A randomized trial of a church‐based diabetes self‐management program for African Americans with type 2 diabetes. The Diabetes Educator 2009;35(3):439‐54. [DOI] [PubMed] [Google Scholar]
Sixta 2008 {published data only}
- Sixta CS, Ostwald S. Texas‐Mexico border intervention by promotores for patients with type 2 diabetes. The Diabetes Educator 2008;34(2):299‐309. [DOI] [PubMed] [Google Scholar]
Skelly 2005 {published data only}
- Lemman J, Skelly AH, Burns D, Carlson J, Soward A. Tailoring a diabetes self‐care intervention for use with older, rural African American women. The Diabetes Educator 2008;34(2):310‐7. [DOI] [PubMed] [Google Scholar]
- Skelly AH, Carlson JR, Leeman J, Holditch‐Davis D, Soward ACM. Symptoms‐focused management for African American women with type 2 diabetes: a pilot study. Applied Nursing Research 2005;18:213‐20. [DOI] [PubMed] [Google Scholar]
Skelly 2009 {published data only}
- Skelly AH, Carlson J, Leeman J, Soward A, Burns D. Controlled trial of nursing interventions to improve health outcomes of older African American women with type 2 diabetes. Nursing Research 2009;58(6):410‐8. [DOI] [PMC free article] [PubMed] [Google Scholar]
Spencer 2011 African‐Amer {published and unpublished data}
- Spencer MS, Rosland A, Kieffer EC, Sinco BR, Valerio M, Palmisano G, et al. Effectiveness of a community health worker intervention among African American and Latino adults with type 2 diabetes: a randomized controlled trial. American Journal of Public Health December 2011;101(12):2253‐60. [DOI] [PMC free article] [PubMed] [Google Scholar]
Spencer 2011 Hispanic {published and unpublished data}
- Spencer MS, Rosland A, Kieffer EC, Sinco BR, Valerio M, Palmisano G, et al. Effectiveness of a community health worker intervention among African American and Latino adults with type 2 diabetes: a randomized controlled trial. American Journal of Public Health December 2011;101(12):2253‐60. [DOI] [PMC free article] [PubMed] [Google Scholar]
Toobert 2011 {published data only}
- Toobert DJ, Strycker LA, Barrera M Jr, Osuna D, King DK, Glasgow RE. Outcomes from a multiple risk factor diabetes self‐management trial for Latinas: Viva Bien!. Annals of Behavioral Medicine 2011;41(3):310‐23. [DOI] [PMC free article] [PubMed] [Google Scholar]
- Toobert DJ, Strycker LA, Barrera M, Osuna D, King DK, Glasgow RE. Long‐term outcomes from a multiple risk factor diabetes self‐management trial for Latinas: Viva Bien!. Annals of Behavioral Medicine 2011;41(3):310‐23. [DOI] [PMC free article] [PubMed] [Google Scholar]
Vincent 2007 {published data only}
- Vincent D, Pasvogel A, Barrera L. A feasibility study of a culturally tailored diabetes intervention for Mexican Americans. Biological Research for Nursing 2007;9:130‐41. [DOI] [PubMed] [Google Scholar]
References to studies excluded from this review
Ahmedani 2012 {published data only}
- Ahmedani MY, Haque MS, Basit A, Fawwad A, Alvi SFD. Ramadan prospective diabetes study: the role of drug dosage and timing alteration, active glucose monitoring and patient education. Diabetic Medicine 2012;29:709‐15. [DOI] [PubMed] [Google Scholar]
Alexander 2008 {published data only}
- Alexander GK, Uz SW, Hinton I, Williams I, Jones R. Culture brokerage strategies in diabetes education. Public Health Nursing 2008;25(5):461‐70. [DOI] [PubMed] [Google Scholar]
Al‐Shookri 2012 {published data only}
- Al‐Shookri A, Khor G, Chan Y, Loke S, Al‐Maskari M. Effectiveness of medical nutrition treatment delivered by dieticians on glycaemic outcomes and lipid profiles of Arab, Omani patients with type 2 diabetes. Diabetic Medicine 2012;29:236‐44. [DOI] [PubMed] [Google Scholar]
Amano 2007 {published data only}
- Amano Y, Sugiyama M, Lee JS, Kawakubo K, Mori K, Tnag AC, Akabayashi A. Glycemic index‐based nutritional education improves blood glucose control in Japanese adults. Diabetes Care 2007;30(7):1874‐6. [DOI] [PubMed] [Google Scholar]
Amaoko 2007 {published data only}
- Amoako E, Skelly AH. Managing uncertainty in diabetes: an intervention for older African American women. Ethnicity and Disease 2007;17:515‐21. [PubMed] [Google Scholar]
Amaoko 2008 {published data only}
- Amaoko E, Skelly AH, Rossen EK. Outcomes of an intervention to reduce uncertainty among African American women with diabetes. Western Journal Nursing Research 2008;30:928‐42. [DOI] [PubMed] [Google Scholar]
Andersen 2013 {published data only}
- Andersen E, Hostmark AT, Holme I, Anderssen SA. Intervention effects on physical activity and insulin levels in men of Pakistani origin living in Oslo: a randomised controlled trial. Immigrant Minority Health 2013;15:101‐10. [DOI] [PMC free article] [PubMed] [Google Scholar]
Anderson 2010 {published data only}
- Anderson DR, Christison‐Lagay J, Villagra V, Liu H, Dziura J. Managing the space between visits: a randomized trial of disease management for diabetes in a community health center. Journal of General Internal Medicine 2010;25(10):1116‐22. [DOI] [PMC free article] [PubMed] [Google Scholar]
Arakaki 2009 {published data only}
- Arakaki RFD. Clinical response to cognitive behavioural intervention in Asians and Pacific Islanders with type 2 diabetes. Diabetes 2009;Conference:.. [Google Scholar]
Arora 2012 {published data only}
- Arora S, Peters A, Agy C, Menchine M. A mobile health intervention for inner city patients with poorly controlled diabetes: proof‐of‐concept of the TEXT‐MED program. Diabetes Technology & Therapeutics 2012;14(6):492‐6. [DOI] [PubMed] [Google Scholar]
Barrera 2012 {published data only}
- Barrera M, Toobert D, Strycker L, Osuna D. Brief report: effects of acculturation on a culturally adapted diabetes intervention for Latinas. Health Psychology January 2012;31(1):51‐4. [DOI] [PMC free article] [PubMed] [Google Scholar]
Batik 2008 {published data only}
- Batik O, Phelan EA, Walwick JA, Wang G, LoGerfo JP. Translating a community‐based motivational support program to increase physical activity among older adults with diabetes at community clinics: a pilot study of physical activity for a lifetime of success (PALS). Preventing Chronic Disease 2008;5(1):.. [PMC free article] [PubMed] [Google Scholar]
Blackwell 2011 {published data only}
- Blackwell CS, Foster KA, Isom S, Katula JA, Vitolins MZ, Rosenberger EL, et al. Healthy living partnerships to prevent diabetes: recruitment and baseline characteristics. Contemporary Clinical Trials 2011;32(1):40‐9. [DOI] [PMC free article] [PubMed] [Google Scholar]
Bogner 2010 {published data only}
- Bogner HR, Vries HF. Integrating type 2 diabetes mellitus and depression treatment among African‐Americans: a randomized controlled pilot trial. The Diabetes Educator 2010;36(2):284‐92. [DOI] [PMC free article] [PubMed] [Google Scholar]
Bolin 2013 {published data only}
- Bolin JN, Ory MG, Wilson AD, Salge L. Diabetes education kiosks in a Latino community. The Diabetes Educator 2013;39(2):204‐12. [DOI] [PubMed] [Google Scholar]
Borges 2007 {published data only}
- Borges WJ, Ostwald SK. Improving foot self‐care behaviours with Pies Santos. Western Journal of Research Nursing 2007;30:325‐41. [DOI] [PubMed] [Google Scholar]
Boudreau 2011 {published data only}
- Boudreau F, Godin G, Poirier P. Effectiveness of a computer‐tailored print‐based physical activity intervention among French Canadians with type 2 diabetes in a real‐life setting. Health Education Research 2011;26(4):573‐85. [DOI] [PubMed] [Google Scholar]
Bravis 2010 {published data only}
- Bravis V, Hui E, Salih S, Mehart S, Hussanein M, Devendra D. Ramadan education and awareness in diabetes (READ) programme for Muslims with type 2 diabetes who fast during Ramadan. Diabetic Medicine 2010;27:327‐31. [DOI] [PubMed] [Google Scholar]
Bray 2013 {published data only}
- Bray P, Cummings DM, Morrissey S, Thompson D, Hobert D, Wilson K, et al. Improved outcomes in diabetes care for rural African Americans. Annals of Family Medicine 2013;11(2):145‐50. [DOI] [PMC free article] [PubMed] [Google Scholar]
Brown 2007 {published data only}
- Brown SA, Blozis SA, Kouzekanani K, Garcia AA, Winchell M, Hanis CL. Health beliefs of Mexican Americans with type 2 diabetes. The Diabetes Educator 2007;33(2):300‐8. [DOI] [PubMed] [Google Scholar]
Brown 2010 {published data only}
- Brown BD, Harris KJ, Harris JL, Parker M, Ricci C, Noonan C. Translating the diabetes prevention program for northern plains Indian youth through community‐based participatory research methods. The Diabetes Educator 2010;36(6):924‐35. [DOI] [PMC free article] [PubMed] [Google Scholar]
Brown 2011 {published data only}
- Borwn SA, Garcia AA, Winter M, Silva MSN, Borwn A, Hanis CL. Integrating education, group support and case management for diabetic Hispanics. Ethnicity and Disease 2011;21(1):20‐6. [PMC free article] [PubMed] [Google Scholar]
Calle 2009 {published data only}
- Calle MC, Vega‐Lopez S, Puglisi MJ, Segura‐Perez S, Chabara J, Perez‐Escamilla R, et al. Peer‐counselling and inflammatory markers in Latinos diagnosed with type 2 diabetes. Results from the DIALBEST trial. The FASEBJ Journal 2009;Conference:.. [Google Scholar]
Calles‐Escandon 2010 {published data only}
- Calles‐Escandon JL. Glycemia management of minority participants in ACCORD. Diabetologia 2010;Conference: September:.. [Google Scholar]
Chan 2009 {published data only}
- Chan JC, So WY, Yeung C, Ko GT, Lau I, Tsang M, et al. Effects of structured versus usual care on renal endpoint in type 2 diabetes: the SURE study. Diabetes Care 2009;32(6):977‐82. [DOI] [PMC free article] [PubMed] [Google Scholar]
Choi 2012 {published data only}
- Choi SE, Rush EB. Effect of short‐duration, culturally tailored, community‐based diabetes self‐management intervention for Korean immigrants: a pilot study. The Diabetes Educator May/June 2012;38(3):377‐85. [DOI] [PMC free article] [PubMed] [Google Scholar]
Choudhury 2008 {published data only}
- Choudhury SM, Brophy S, Fareedi MA, Zaman B, Ahmed P, Williams DRR. Intervention, recruitment and evaluation challenges in the Bangladeshi community: experience from a peer lead educational course. BMC Medical Research Methodology 2008;8:64. [DOI] [PMC free article] [PubMed] [Google Scholar]
Comellas 2010 {published data only}
- Comellas M, Walker EA, Movsas S, Merkin S, Zonszein J, Strelnick H. Training community health promoters to implement diabetes self‐management support programs for urban minority adults. The Diabetes Educator 2010;36(1):141‐51. [DOI] [PMC free article] [PubMed] [Google Scholar]
Cramer 2007 {published data only}
- Cramer JS, Sibley RF, Bartlett DP, Kahn LS, Loffredo L. An adaptation of the diabetes prevention program for use with high‐risk, minority patients with type 2 diabetes. The Diabetes Educator 2007;33:503‐8. [DOI] [PubMed] [Google Scholar]
Crasto 2010 {published data only}
- Crasto WJ. Effects of a target driven risk factor control strategy with structured patient education in individuals with type 2 diabetes and microalbuminuria: the Microalbuminuria Education and Medication Optimisation (MEMO) Study. Diabetic Medicine 2010;Conference:19‐20. [Google Scholar]
Crasto 2011 {published data only}
- Crasto W, Jarvis J, Khunti K, Skinner TC, Gray LJ, Brela J, et al. Multifactorial intervention in individuals with type 2 diabetes and microalbuminuria: the Microalbuminuria Education and Medication Optimisation (MEMO) study. Diabetes Research and Clinical Practice 2011;93:328‐36. [DOI] [PubMed] [Google Scholar]
Davidson 2007 {published data only}
- Davidson MB, Ansari A, Karlan VJ. Effect of a nurse‐directed diabetes disease management program on urgent care/emergency room visits and hospitalizations in a minority population. Diabetes Care 2007;30(2):224‐7. [DOI] [PubMed] [Google Scholar]
Davis 2009 {published data only}
- Davis JN, Kelly LA, Lane CJ, Ventura EE, Byrd‐Williams CE, Alexander KA, et al. Randomized control trial to improve adiposity and insulin resistance in overweight Latino adolescents. Obesity 2009;17(8):1542‐8. [DOI] [PMC free article] [PubMed] [Google Scholar]
Davis 2009a {published data only}
- Davis RM, Hitch AD, Nichols M, Rizvi A, Salaam M, Mayer‐Davis EJ. A collaborative approach to the recruitment and retention of minority patients with diabetes in rural community health centers. Contemporary Clinical Trials 2009;30:63‐70. [DOI] [PubMed] [Google Scholar]
Davis 2009b {published data only}
- Davis R. The diabetes TeleCare (DTC) study: 24 month follow up data on patients living in rural medically underserved areas. Diabetes 2009;Conference. [Google Scholar]
Davis 2011 {published data only}
- Davis RE, Peterson KE, Rothschild SK, Resnicow K. Pushing the envelope for cultural appropriateness: does evidence support cultural tailoring in type 2 diabetes interventions for Mexican American adults?. The Diabetes Educator 2011;37(2):227‐38. [DOI] [PMC free article] [PubMed] [Google Scholar]
Deitrick 2010 {published data only}
- Deitrick LM, Paxton HD, Rivera A, Gertner EJ, Biery N, Letcher AS, et al. Understanding the role of the promotora in a Latino Diabetes Education Program. Qualitative Health Research 2010;20(3):386‐99. [DOI] [PubMed] [Google Scholar]
Douglas 2013 {published data only}
- Douglas A, Bhopal RS, Bhopal R, Forbes JF, Gill JMR, McKnight J, et al. Design and baseline characteristics of the PODOSA (Prevention of Diabetes & Obesity in South Asians) trial: a cluster, randomised lifestyle intervention in Indian and Pakistani adults with impaired glycaemia at high risk of developing type 2 diabetes. BMJ Open 2013;3:1‐11. [DOI] [PMC free article] [PubMed] [Google Scholar]
Eakin 2007 {published data only}
- Eakin EG, Riley KM, Bull SS, Reeves MM, McLaughlin P, Gutierrez S. Resources for health: a primary‐care based diet and physical activity intervention targeting urban Latinos with multiple chronic conditions. Health Psychology 2007;26(4):392‐400. [DOI] [PubMed] [Google Scholar]
Egede 2010 {published data only}
- Egede LE, Strom JL, Durkalski VL, Mauldin PD, Moran WP. Rationale and design: telephone‐delivered behavioural skills for interventions for Blacks with type 2 diabetes. BioMed Central 2010;11(35). [DOI] [PMC free article] [PubMed] [Google Scholar]
Ell 2009 {published data only}
- Ell K, Katon W, Cabassa LJ, Xie B, Lee P, Kapetanovic S, et al. Depression and diabetes among low‐income Hispanics: design elements of a socio‐culturally adapted collaborative care model randomized controlled trial. International Journal of Psychiatry in Medicine 2009;39(2):113‐32. [DOI] [PMC free article] [PubMed] [Google Scholar]
Ezenwaka 2011 {published data only}
- Ezenwaka CE, Dimgba A, Okali F, Skinner T, Extavour R, Rodriguez M, et al. Self‐monitoring of blood glucose improved glycaemic control and the 10‐year coronary heart disease risk profile of female type 2 diabetes patients in Trinidad and Tobago. Nigerian Journal of Clinical Practice 2011;14(1):1‐5. [DOI] [PubMed] [Google Scholar]
Fatima 2011 {published data only}
- Fatima J, Karoli K, Chandra A, Naqvi N. Attitudinal determinants of fasting in type 2 diabetes mellitus patients during Ramadan. Journal of Association of Physicians of India October 2011;59:630‐4. [PubMed] [Google Scholar]
Fernandez 2011 {published data only}
- Fernandez S, Olendzki B, Rosal MC. A dietary behaviours measure for use with low‐income, Spanish‐Speaking Caribbean Latinos with type 2 diabetes: the Latino Dietary Behaviours Questionnaire. Journal of the American Dietetic Association 2011;111:589‐99. [DOI] [PMC free article] [PubMed] [Google Scholar]
Gerber 2012 {published data only}
- Gerber BS, Rapacki L, Castillo A, Tilton J, Touchette DR, Mihailescu D, et al. Design of a trial to evaluate the impact of clinical pharmacists and community health promoters working with African‐Americans and Latinos with diabetes. BMC Public Health 2012;12:891. [DOI] [PMC free article] [PubMed] [Google Scholar]
Gill 2010 {published data only}
- Gill R, Sahota R, Leveridge J, Saini S, Tomlinson D. Structured diabetes group education for UK south Asian communities: a study investigating the effectiveness of a 5‐week X‐PERT‐based diabetes education programme on improving biomedical outcomes in this population. Diabetes and Primary Care 2010;12(4):218. [Google Scholar]
Glasgow 2011 {published data only}
- Glasgow RE, Christiansen SM, King DK, Wooley T, Faber AJ, Estabrooks PA, et al. Engagement in diabetes self‐management website: usage patterns and generalizability of program use. Journal of Medical Internet Research 2011;13(1):e9. [DOI] [PMC free article] [PubMed] [Google Scholar]
Henderson 2012 {published data only}
- Henderson JA, Chubak J, O'Connell J, Ramos MC, Jensen J, Jobe JB. Design of a randomized controlled trial of a web‐based intervention to reduce cardiovascular disease risk factors among remote reservation‐dwelling American Indian adults with type 2 diabetes. Journal of Primary Prevention 2012;33:209‐22. [DOI] [PMC free article] [PubMed] [Google Scholar]
Heudebert 2013 {published data only}
- Heudebert A, Eichold B, Arrieta MI, Roach D, Brown S, Hansberry S, et al. Real‐time tele‐monitoring of glucose as adjunct to the management of type 2 diabetes in primary care. Journal of Investigative Medicine 2013;61(2):398. [Google Scholar]
Hill‐Briggs 2007 {published data only}
- Hill‐Briggs F, Batts‐Turner M, Gary TL, Brancati FL, Hill M, Levine DM, et al. Training community health workers as diabetes educators for urban African Americans: value added using participatory methods. Progress in Community Health Partnerships 2007;Summer(2):185‐94. [DOI] [PubMed] [Google Scholar]
Hill‐Briggs 2011 {published data only}
- Hill‐Briggs F, Lazo M, Peyrot M, Doswell A, Chang Y, Hill MN, et al. Effect of problem‐solving‐based diabetes self‐management training on diabetes control in a low income patient sample. Journal of General Internal Medicine 2011;26(9):972‐8. [DOI] [PMC free article] [PubMed] [Google Scholar]
Hotu 2010 {published data only}
- Hotu C, Bagg W, Collins J, Harwood L, Whalley G, Doughty R, et al. A community‐based model of care improves blood pressure control and delays progression of proteinuria, left ventricular hypertrophy and diastolic dysfunction in Maori and Pacific patients with type 2 diabetes and chronic kidney disease: a randomized controlled trial. Nephrology Dialysis Transplantation 2010;25:3260‐6. [DOI] [PubMed] [Google Scholar]
Ivey 2012 {published data only}
- Ivey S, Tseng W, Kurtovich E, Lui B, Weir R, Liu J, et al. Evaluating a culturally and linguistically competent health coach intervention for Chinese‐American patients with diabetes. Diabetes Spectrum 2012;25(2):93‐101. [DOI] [PMC free article] [PubMed] [Google Scholar]
Jernigan 2011 {published data only}
- Jernigan VBB, Lorig K. The internet diabetes self‐management workshop for American Indians and Alaska Natives. Health Promotion Practice 2011;12(2):261‐70. [DOI] [PMC free article] [PubMed] [Google Scholar]
Jones 2008 {published data only}
- Jones RA, Utz SW, Williams IC, Hinton I, Alexander G, Moore C, et al. Family Interactions among African Americans diagnosed with type 2 diabetes. The Diabetes Educator 2008;34(2):318‐26. [DOI] [PMC free article] [PubMed] [Google Scholar]
Kanaya 2012 {published data only}
- Kanaya AM, Santoyo‐Olsson J, Gregorich S, Grossman M, Moore T, Stewart AL. The Live Well, Be Well study: a community‐based, translational lifestyle program to lower diabetes risk factors in ethnic minority and lower‐socioeconomic status adults. Research and Practice 2012;102(8):1551‐8. [DOI] [PMC free article] [PubMed] [Google Scholar]
Katula 2011 {published data only}
- Katula JA, Vitolins MZ, Rosenberger EL, Blackwell CS, Morgan TM, Lawlor MS, et al. One‐year results of a community based translation of the diabetes prevention program: healthy living partnerships to prevent diabetes (HELP PD) project. Diabetes Care 2011;34(7):1451‐7. [DOI] [PMC free article] [PubMed] [Google Scholar]
Klug 2008 {published data only}
- Klug C, Toobert DJ, Fogerty M, Klug C. Healthy changes for living with diabetes: an evidence‐based community diabetes self‐management program. The Diabetes Educator 2008;34:1053‐61. [DOI] [PMC free article] [PubMed] [Google Scholar]
Latham 2009 {published data only}
- Latham CL, Calvillo E. Predictors of successful diabetes management in low‐income Hispanic people. Western Journal of Nursing Research 2009;31(3):364‐88. [DOI] [PubMed] [Google Scholar]
Leeman 2008 {published data only}
- Leeman J, Skelly AH, Burns D, Carlson J, Soward A. Tailoring a diabetes self‐care intervention for use with older, rural African American women. The Diabetes Educator 2008;34(2):310‐317. [DOI] [PubMed] [Google Scholar]
Lenjawi 2012 {published data only}
- Lenjawi BA, Mohammed H, Ammouna P, Zotor F, Almahdi H, Hassan I. Efficacy of a culturally competent group‐based educational program for type 2 diabetics: a randomized controlled trial. Middle East Journal of Family Medicine November 2012;10(10):21‐8. [Google Scholar]
Levetan 2002 {published data only}
- Levetan CS, Dawn KR, Robbins DC, Ratner RE. Impact of computer‐generated personalized goals on HbA1c. Diabetes Care 2002;25(1):2‐8. [DOI] [PubMed] [Google Scholar]
Liang 2011 {published data only}
- Liang R, Dai X, Zuojie L, Zhou A, Meijuan C. Two‐year foot care program for minority patients with type 2 diabetes mellitus of Zhuang tribe in Guangxi, China. Canadian Journal of Diabetes 2012;36:15‐8. [Google Scholar]
Lunde 2012 {published data only}
- Lunde MSH, Hjellset VT, Hostmark AT. Adjusting the amount and type of carbohydrate in a meal strongly reduced the postprandial glycaemic response in Pakistani immigrant women. Journal of Diabetology 2012;1(1). [Google Scholar]
Martin 2011 {published data only}
- Martin MA, Swider SM, Olinger T, Avery E, Lynas CMT, Carlson K, et al. Recruitment of Mexican American adults for an intensive diabetes intervention trial. Ethnicity and Disease 2011;21:7‐12. [PMC free article] [PubMed] [Google Scholar]
McCloskey 2009 {published data only}
- McCloskey J. Promotores as partners in a community‐based diabetes diabetes intervention program targeting Hispanics. Family and Community Health 2009;32:48‐57. [DOI] [PubMed] [Google Scholar]
Metghalchi 2008 {published data only}
- Metghalchi S, Rivera M, Beeson L, Firek A, Leon M, Cordero‐MacIntyre ZR, et al. Improved clinical outcomes using a culturally sensitive diabetes education program in a Hispanic population. The Diabetes Educator 2008;34(4):698‐706. [DOI] [PMC free article] [PubMed] [Google Scholar]
Mohamed 2013 {published data only}
- Mohamed H, Al‐Lenjawi B, Amuna P, Zotor F, Elmahdi H. Culturally sensitive patient‐centred educational programme for self‐management of type 2 diabetes: a randomized controlled trial. Primary Care Diabetes 2013;7:199‐206. [DOI] [PubMed] [Google Scholar]
Murrock 2009 {published data only}
- Murrock CJ, Higgins PA, Killion C. Dance and peer support to improve diabetes outcomes in African American women. The Diabetes Educator 2009;35(6):995‐1003. [DOI] [PubMed] [Google Scholar]
Nam 2010 {published data only}
- Nam S, Chesla C, Stotts NA, Krron L, Janson SL. Factors associated with psychological insulin resistance in individuals with type 2 diabetes. Diabetes Care 2010;33(8):1747‐9. [DOI] [PMC free article] [PubMed] [Google Scholar]
Osuna 2011 {published data only}
- Osuna D, Barrera M, Strycker LA, Toobert DJ, Glasgow RE, Geno CR, et al. Methods for the cultural adaptation of a diabetes lifestyle intervention for Latinas: an illustrative project. Health Promotion Practice 2011;12(3):341‐8. [DOI] [PMC free article] [PubMed] [Google Scholar]
Oyetayo 2011 {published data only}
- Oyetayo OO, James C, Martinez A, Roberson K, Talbert RL. The Hispanic Diabetes Management Program: impact of community pharmacists on clinical outcomes. Journal of the American Pharmacists Association Sept/Oct 2011;51(5):623‐6. [DOI] [PubMed] [Google Scholar]
Palmas 2012 {published data only}
- Palmas W, Teresi J, Findley S, Mejia M, Batista M, Kong J, et al. Protocol for the northern Manhattan diabetes community outreach project. A randomised trial of community health worker intervention to improve diabetes care in Hispanic adults. BMJ Open 2012;2:1‐5. [DOI] [PMC free article] [PubMed] [Google Scholar]
Peña‐Purcell 2011 {published and unpublished data}
- Peña‐Purcell NC, Boggess MM, Jimenez N. An empowerment‐based diabetes self‐management education program for Hispanic/Latinos: a quasi‐experimental pilot study. The Diabetes Educator 2011;37(6):770‐9. [DOI] [PubMed] [Google Scholar]
Phumipamorn 2008 {published data only}
- Phumipamorn S, Pongwecharak J, Soorapan S, Pattharachayakul S. Effects of the pharmacist's input on glycaemic control and cardiovascular risks in Muslim diabetes. Primary Care Diabetes 2008;2:31‐7. [DOI] [PubMed] [Google Scholar]
Powers 2009 {published data only}
- Powers BJ, King JL, Ali R, Alkon A, Bowlby L, Edelman D, et al. The cholesterol, hypertension, and glucose education (CHANGE) study for African Americans with diabetes: study design and methodology. American Heart Journal September 2009;158(3):343‐8. [DOI] [PubMed] [Google Scholar]
Prezio 2013 {published data only}
- Prezio EA, Cheng D, Balasubramanian BA, Shuval K, Kendzor DE, Culica D. Community Diabetes Education (CoDE) for uninsured Mexican Americans: a randomized controlled trail of a culturally tailored diabetes education and management program led by a community health worker. Diabetes Research and Clinical Practice 2013;100:19‐28. [DOI] [PubMed] [Google Scholar]
Raberg Kjollesdal 2011 {published data only}
- Raberg Kjollesdal MK, Hjellset VT, Bjorge B, Holmboe‐Ottesen G, Wandel M. Perceptions of risk factors for diabetes among Nowwegian‐Pakistani women participating in a culturally adapted intervention. Ethnicity and Health 2011;16(3):279‐97. [DOI] [PubMed] [Google Scholar]
Rosal 2009 {published data only}
- Rosal MC, White MJ, Restrepo A, Olendzki B, Scavron J, Sinagra E, et al. Design and methods for a randomized clinical trial of diabetes self‐management intervention for low‐income Latinos: Latinos en control. BMC Medical Research Methodology 2009;9(81). [DOI] [PMC free article] [PubMed] [Google Scholar]
Rothschild 2012 {published data only}
- Rothschild SK, Martin MA, Swider SM, Lynas CT, Avery EF, Janssen I, et al. The Mexican‐American Trial of Community Health workers (MATCH): design and baseline characteristics of a randomised controlled trial testing a culturally tailored community diabetes self‐management intervention. Contemporary Clinical Trials 2012;33(2):369‐77. [DOI] [PMC free article] [PubMed] [Google Scholar]
Ruelas 2009 {published data only}
- Ruelas V, Roybal GM, Lu Y, Goldman D, Peters A. Clinical and behavioural correlates of achieving and maintaining glycemic targets in an underserved population with type 2 diabetes. Diabetes Care 2009;32(1):54‐6. [DOI] [PMC free article] [PubMed] [Google Scholar]
Ruggiero 2010 {published data only}
- Ruggiero LM. Supporting diabetes self‐care in underserved populations: a randomized pilot study using medical assistant coaches. The Diabetes Educator 2010;36:127‐31. [DOI] [PMC free article] [PubMed] [Google Scholar]
Ruggiero 2010b {published data only}
- Ruggiero L, Moadsiri A, Butler P, Oros SM, Berbaum ML, Whitman S, et al. Supporting diabetes self‐care in underserved populations: a randomized pilot study using medical assistant coaches. The Diabetes Educator 2010;36(1):127‐31. [DOI] [PMC free article] [PubMed] [Google Scholar]
Ryan 2013 {published data only}
- Ryan JG, Schwartz R, Jennings T, Fedders M, Vittoria I. Feasibility of an internet‐based intervention for improving diabetes outcomes among low‐income patients with a high risk for poor diabetes outcomes followed in a community clinic. The Diabetes Educator 2013;100(39):365‐75. [DOI] [PubMed] [Google Scholar]
Saha 2013 {published data only}
- Saha S, Leijon M, Gerdtham U, Sundquist K, Arvidsson D, Bennet L. A culturally adapted lifestyle intervention addressing a Middle Eastern immigrant population at risk of diabetes, the MEDIM (impact of Migration and Ethnicity on Diabetes in Malmo): study protocol for a randomized controlled trial. Trials 2013;14:279. [DOI] [PMC free article] [PubMed] [Google Scholar]
Salto 2011 {published data only}
- Salto LM, Cordero‐MacIntyre Z, Beeson L, Schulz E, Firek A, Leon M. En Balance participants decrease dietary fat and cholesterol intake as part of a culturally sensitive Hispanic diabetes education program. The Diabetes Educator 2011;37(2):239‐53. [DOI] [PMC free article] [PubMed] [Google Scholar]
Shea 2009 {published data only}
- Shea S, Weinstock RS, Teresi JA, Palmas W, Starren J, Cimino JJ, et al. A randomized trial comparing telemedicine case management with usual care in older, ethnically diverse, medically underserved patients with diabetes mellitus: 5 year results of the IDEATel Study. Journal of the American Medical Informatics Association 2009;16(4):446‐56. [DOI] [PMC free article] [PubMed] [Google Scholar]
Shenoy 2009 {published data only}
- Shenoy S, Arora E, Jaspal S. Effects of progressive resistance training and aerobic exercise on type 2 diabetics in Indian population. International Journal of Diabetes and Metabolism 2009;17:27‐30. [Google Scholar]
Shenoy 2010 {published data only}
- Shenoy S, Guglani R, Sandhu JS. Effectiveness of an aerobic walking program using heart rate monitor and pedometer on the parameters of diabetes control in Asian Indians with type 2 diabetes. Primary Care Diabetes 2010;4:41‐5. [DOI] [PubMed] [Google Scholar]
Shi 2010 {published data only}
- Shi Q, Ostald SK, Wang S. Improving glycaemic control self‐efficacy and glycaemic control behaviour in Chinese patients with type 2 diabetes mellitus: randomised controlled trial. Journal of Clinical Nursing 2010;19:398‐404. [DOI] [PubMed] [Google Scholar]
Skelly 2008 {published data only}
- Skelly AH, Leeman J, Carlson J, Soward ACM, Burns D. Conceptual model of symptom‐focused diabetes care for African Americans. Journal of Nursing Scholarship 2008;40(3):261‐7. [DOI] [PMC free article] [PubMed] [Google Scholar]
Skoro‐Kondza 2009 {published data only}
- Skoro‐Kondza L, See Tai S, Gandelrab R, Drincevic D, Greenhalgh T. Community based yoga classes for type 2 diabetes: an exploratory randomised controlled trial. BMC Health Services Research 2009;9(13). [DOI] [PMC free article] [PubMed] [Google Scholar]
Sun 2012 {published data only}
- Sun AC, Tsoh JY, Saw A, Chan JL, Cheng JW. Effectiveness of a culturally tailored diabetes self‐management program for Chinese Americans. The Diabetes Educator 2012;38:685‐94. [DOI] [PMC free article] [PubMed] [Google Scholar]
Tang 2010 {published data only}
- Tang TS, Funnell MM, Brown MB, Kurlander JE. Self‐management support in "real‐world" settings: an empowerment‐based intervention. Patient Education and Counseling 2010;79(2):178‐84. [DOI] [PMC free article] [PubMed] [Google Scholar]
Tang 2011 {published data only}
- Tang TS, Funnell MM, Noorulla S, Oh M, Brown MB. Sustaining short‐term improvements over the long‐term: results from a 2‐year diabetes self‐management support (DSMS) intervention. Diabetes Research and Clinical Practice 2012;95:85‐92. [DOI] [PMC free article] [PubMed] [Google Scholar]
Tang 2012 {published data only}
- Tang TS, Funnell MM, Oh M. Lasting effects of a 2‐year diabetes self‐management support intervention: outcomes at 1‐year follow‐up. Preventing Chronic Disease 2012;9:E109. [DOI] [PMC free article] [PubMed] [Google Scholar]
Trief 2013 {published data only}
- Trief PM, Izquierdo R, Eimicke JP, Teresi JA, Goland R, Palmas W, et al. Adherence to diabetes self care for white, African‐American and Hispanic telemedicine participants: 5 year results from the IDEATel project. Ethnicity & Health 2013;18(1):83‐96. [DOI] [PubMed] [Google Scholar]
Utz 2008 {published data only}
- Utz SW, Williams IC, Jones R, Hinton I, Alexander G, Yan G, et al. Culturally tailored intervention for rural African Americans with type 2 diabetes. The Diabetes Educator 2008;34(5):854‐65. [DOI] [PMC free article] [PubMed] [Google Scholar]
Vincent 2008 {published data only}
- Vincent D. Culturally tailored education to promote lifestyle change in Mexican Americans with type 2 Diabetes. Journal of the American Academy of Nurse Practitioners 2009;21:520‐7. [DOI] [PubMed] [Google Scholar]
Walker 2008 {published data only}
- Walker EA, Schechter CB, Caban A, Basch CE. Telephone Intervention to promote diabetic retinopathy screening among the urban poor. American Journal of Preventative Medicine 2008;34(5):185‐91. [DOI] [PMC free article] [PubMed] [Google Scholar]
Walker 2010 {published data only}
- Walker EA, Stevens KA, Persaud S. Promoting diabetes self‐management among African Americans: an educational intervention. Journal of Health Care for the Poor and Underserved 2010;21:169‐86. [DOI] [PubMed] [Google Scholar]
Walker 2011 {published data only}
- Walker EA, Shmukler C, Ullman R, Blanco E, Scollan‐Koliopoulus M, Cohen HW. Results of a successful telephonic intervention to improve diabetes control in urban adults: a randomized trial. Diabetes Care 2011;34(1):2‐6. [DOI] [PMC free article] [PubMed] [Google Scholar]
Wattana 2007 {published data only}
- Wattana C, Srisuphan W, Pothiban L, Upchurch SL. Effects of a diabetes self‐management program on glycaemic control, coronary heart disease risk and quality of life among Thai patients with type 2 diabetes. Nursing and Health Sciences 2007;9:135‐41. [DOI] [PubMed] [Google Scholar]
Weinstock 2011 {published data only}
- Weinstock RS, Brooks G, Palmas W, Morin PC, Teresi JA, Eimicke JP, et al. Lessened decline in physical activity and impairment of older adults with diabetes with telemedicine and pedometer use: results from the IDEATel study. Age and Ageing 2011;40:98‐105. [DOI] [PubMed] [Google Scholar]
Weinstock 2011b {published data only}
- Weinstock RS, Teresi JA, Goland R, Izquierdo R, Palmas W, Eimicke JP, et al. Glycemic control and health disparities in older ethnically diverse underserved adults with diabetes. Diabetes Care 2011;34:274‐9. [DOI] [PMC free article] [PubMed] [Google Scholar]
Welch 2011 {published data only}
- Welch G, Allen NA, Zagarins SE, Stamp KD, Bursell S, Kedziora RJ. Comprehensive diabetes management program for poorly controlled Hispanic type 2 patients at a Community Health Center. The Diabetes Educator 2011;37:680‐8. [DOI] [PubMed] [Google Scholar]
West 2007 {published data only}
- West DS, DiLillo V, Bursac Z, Gore SA, Greene PG. Motivational interviewing improves weight loss in women with type 2 diabetes. Diabetes Care 2007;30(5):1081‐7. [DOI] [PubMed] [Google Scholar]
West 2008 {published data only}
- West DS, Prewitt TE, Bursac Z, Felix HC. Weight loss of black, white and Hispanic men and women in the diabetes prevention program. Obesity 2008;16(6):1413‐20. [DOI] [PubMed] [Google Scholar]
Wheeler 2012 {published data only}
- Wheeler G, Montgomery S, Beeson L, Bahjri K, Shulz E, Firek A, et al. En Balance: the effects of Spanish diabetes education on physical activity changes and diabetes control. The Diabetes Educator 2012;38(5):723‐32. [DOI] [PMC free article] [PubMed] [Google Scholar]
Williams 2013 {published data only}
- Williams LB, Sattin RW, Dias J, Garvin JT, Marion L, Joshua T, et al. Design of a cluster‐randomized controlled trial of a diabetes prevention program within African‐American churches: the Fit Body and Soul study. Contemporary Clinical Trials 2013;34:336‐47. [DOI] [PMC free article] [PubMed] [Google Scholar]
Winston 2009 {published data only}
- Winston RAL. Diabetes management and knowledge improvements as a result of patient education: a community based, randomized clinical trial. Value in Health 2009;Conference. [Google Scholar]
Additional references
Abate 2003
- Abate N, Chandalia M. The impact of ethnicity on type 2 diabetes. Journal of Diabetes and Its Complications 2003;17:39‐58. [DOI] [PubMed] [Google Scholar]
ADA 1995
- The Task Force to Revise the National Standards. The American Diabetes Association. National standards for diabetes self‐management education programs. The Diabetes Educator 1995;21:189‐93. [DOI] [PubMed] [Google Scholar]
ADA 1997
- American Diabetes Association. Report on the Expert Committee on the Diagnosis and Classification of Diabetes Mellitus. Diabetes Care 1997;20 Suppl 1:S5‐20. [DOI] [PubMed] [Google Scholar]
ADA 1999
- The Expert Committee on the Diagnosis and Classification of Diabetes Mellitus. Report of the Expert Committee on the diagnosis and classification of diabetes mellitus. Diabetes Care 1999;22 Suppl 1:S5‐19. [DOI] [PubMed] [Google Scholar]
Bhatt 1992
- Bhatt A, Dickinson R. An analysis of health education materials from minority communities by cultural and linguistic group. Health Education Journal 1992;51(2):72‐7. [Google Scholar]
Bhopal 1988
- Bhopal RS, Donaldson LJ. Health education for ethnic minorities: current provision and future direction. Health Education Journal 1988;47(4):137‐40. [DOI] [PubMed] [Google Scholar]
Brown 1990
- Brown S. Studies of educational interventions and outcomes in diabetic adults: a meta‐analysis revisited. Patient Education and Counselling 1990;16(3):189‐215. [DOI] [PubMed] [Google Scholar]
Calman 1994
- Calman K. On the state of public health. Health Trends 1994:30‐43. [PubMed] [Google Scholar]
Cohen 1988
- Cohen, J. Statistical Power Analysis for the Behavioural Sciences. Hillsdale, New Jersey: Lawrence Erlbaum Associates, 1988. [Google Scholar]
Coonrod 1994
- Coonrod BA, Betschart J, Harris MI. Frequency and determinants of diabetes patient education among adults in the US population. Diabetes Care 1994;17:852‐8. [DOI] [PubMed] [Google Scholar]
Cooper 2002
- Cooper H. Investigating socio‐economic explanations for gender and ethnic inequalities in health. Social Science and Medicine 2002;54:693‐706. [DOI] [PubMed] [Google Scholar]
DCCT 1993
- DCCT. The effect of intensive treatment of diabetes on the development and progression of long term complications in insulin‐dependent diabetes mellitus. New England Journal of Medicine 1993;329:977‐86. [DOI] [PubMed] [Google Scholar]
Deakin 2005
- Deakin T, McShane CE, Cade JE, Williams RDRR. Group based training for self‐management strategies in people with type 2 diabetes mellitus. Cochrane Database of Systematic Reviews 2005, Issue 2. [DOI: 10.1002/14651858.CD003417.pub2] [DOI] [PubMed] [Google Scholar]
Deakin 2006
- Deakin TA, Cade JE, Williams R, Greenwood DC. Structured patient education: the diabetes X‐PERT Programme makes a difference. Diabetic Medicine 2006;23(9):944‐54. [DOI] [PubMed] [Google Scholar]
Fischbacher 2009
- Fischbacher CM, Bhopal R, Steiner M, Morris AD, Chalmers J. Is there equity of service delivery and intermediate outcomes in South Asians with type 2 diabetes? Analysis of DARTS database and summary of UK publications. Journal of Public Health 2009;31(2):239‐49. [DOI] [PubMed] [Google Scholar]
Funnell 2009
- Funnell MM, Brown TL, Childs BP, Haas LB, Hosey GM, Jensen B, et al. National standards for diabetes self‐management education. Diabetes Care January 2009;32(s1):587‐94. [DOI] [PMC free article] [PubMed] [Google Scholar]
Glasgow 2013
- Glasgow T, Cheek L, Tabet N. Efficacy of non‐pharmacological interventions in controlling type 2 diabetes in patients of African descent: a systematic review. Journal of Biomedical Science and Engineering 2013;6:36‐44. [Google Scholar]
Glazier 2006
- Glazier RH, Bajcar J, Kennie NR, Willson K. A systematic review of interventions to improve diabetes care in socially disadvantaged populations. Diabetes Care 2006;29:1675‐88. [DOI] [PubMed] [Google Scholar]
Griffin 1998
- Griffin S, Kinmouth AL, Skinner C, Kelly J. Educational and psychological interventions for adults with diabetes. Report to the British Diabetes Association. British Diabetes Association 1998.
Harris 1999
- Harris MI. Racial and ethnic differences in health insurance coverage for adults with diabetes. Diabetes Care 1999;22:1679‐82. [DOI] [PubMed] [Google Scholar]
Hawthorne 1990
- Hawthorne K. Asian diabetics attending a British hospital clinic: a pilot study to evaluate their care. British Journal of General Practice 1990;40:243‐7. [PMC free article] [PubMed] [Google Scholar]
Hemmingsen 2013
- Hemmingsen B, Lund SS, Gluud C, Vaag A, Almdal T, Hemmingsen C, et al. Targeting intensive glycaemic control versus targeting conventional glycaemic control for type 2 diabetes mellitus. Cochrane Database of Systematic Reviews 2013, Issue 11. [DOI: 10.1002/14651858.CD008143.pub3] [DOI] [PubMed] [Google Scholar]
Hex 2012
- Hex N, Bartlett C, Wright D, Taylor M, Varley D. Estimating the current and future costs of Type 1 and Type 2 diabetes in the UK, including direct health costs and indirect societal and productivity costs. Diabetic Medicine 2012;29(7):855‐62. [DOI] [PubMed] [Google Scholar]
Higgins 2002
- Higgins JPT, Thompson SG. Quantifying heterogeneity in a meta‐analysis. Statistics in Medicine 2002;21:1539‐58. [DOI] [PubMed] [Google Scholar]
Higgins 2003
- Higgins JPT, Thompson SG, Deeks JJ, Altman DG. Measuring inconsistency in meta‐analysis. British Medical Journal 2003;327:557‐60. [DOI] [PMC free article] [PubMed] [Google Scholar]
Higgins 2009
- Higgins JPT, Thompson SG, Spiegelhalter DJ. A re‐evaluation of random‐effects meta‐analysis. Journal of the Royal Statistical Society: Series A (Statistics in Society) 2009;172(1):137‐59. [DOI] [PMC free article] [PubMed] [Google Scholar]
Higgins 2011a
- Higgins JPT, Green S (editors). Cochrane Handbook for Systematic Reviews of Interventions Version 5.1.0 [updated March 2011]. The Cochrane Collaboration, 2011. www.cochrane‐handbook.org.
Higgins 2011b
- Higgins JPT, Altman DG, Gøtzsche PC, Jüni P, Moher D, Oxman AD, et al. The Cochrane Collaboration's tool for assessing risk of bias in randomised trials. BMJ 2011;343:d5928. [DOI] [PMC free article] [PubMed] [Google Scholar]
Hoare 1992
- Hoare TA, Johnson CM, Gorton R, Alberg C. Reasons for non‐attendance for breast screening by Asian women. Health Education Journal 1992;51(4):157‐61. [Google Scholar]
Hrobjartsson 2013
- Hrobjartsson A, Thomsen AS, Emanuelsson F, Tendal B, Hilden J, Boutron I, et al. Observer bias in randomized clinical trials with measurement scale outcomes: a systematic review of trials with both blinded and non‐blinded assessors. Canadian Medical Association Journal 2013;185(4):E201‐11. [PUBMED: 23359047] [DOI] [PMC free article] [PubMed] [Google Scholar]
Kirkham 2010
- Kirkham JJ, Dwan KM, Altman DG, Gamble C, Dodd S, Smyth R, et al. The impact of outcome reporting bias in randomised controlled trials on a cohort of systematic reviews. BMJ 2010;340:c365. [DOI: 10.1136/bmj.c365] [DOI] [PubMed] [Google Scholar]
Knight 2006
- Knight KM, Dornan T, Bundy C. The diabetes educator: trying hard but must concentrate on behaviour. Diabetic Medicine 2006;23:485‐501. [DOI] [PubMed] [Google Scholar]
Lacey 2000
- Lacey KO, Chyun DA, Grey M. An integrative literature review of cardiac risk factor management in diabetes education interventions. The Diabetes Educator 2000;26:812‐9. [DOI] [PubMed] [Google Scholar]
Lanting 2005
- Lanting LC, Joung MA, Mackenbach JP, Lamberts SWJ, Bootsma AH. Ethnic differences in mortality, end‐stage complications, and quality of care among diabetic patients: a review. Diabetes Care 2005;28(9):2280‐8. [DOI] [PubMed] [Google Scholar]
Leedham 2000
- Leedham I. Diabetes health promotion in ethnic minority communities. Report to the BDA (Wales) 2000.
Liberati 2009
- Liberati A, Altman DG, Tetzlaff J, Mulrow C, Gøtzsche PC, Ioannidis JPA, et al. The PRISMA statement for reporting systematic and meta‐analyses of studies that evaluate interventions: explanation and elaboration. PLoS Medicine 2009;6(7):1‐28. [DOI: 10.1371/journal.pmed.1000100] [DOI] [PMC free article] [PubMed] [Google Scholar]
Lip 1996
- Lip GY, Luscombe C, McCarry M, Malik I, Beevers G. Ethnic differences in public health awareness, health perceptions and physical exercise: implications in heart disease prevention. Ethnicity and Health 1996;1(1):47‐53. [DOI] [PubMed] [Google Scholar]
Lirussi 2010
- Lirussi F. The global challenge of type 2 diabetes and the strategies for response in ethnic minority groups. Diabetes/Metabolism Research and Reviews 2010;26:421‐32. [DOI] [PubMed] [Google Scholar]
Loveman 2008
- Loveman E, Frampton GK, Clegg AJ. The clinical effectiveness of diabetes education models for Type 2 diabetes: a systematic review. Health Technology Assessment 2008;12(9). [DOI] [PubMed] [Google Scholar]
Majeed‐Ariss 2013
- Majeed‐Ariss R, Jackson C, Knapp P, Cheater FM. A systematic review of research into Black and ethnic minority patients' view on self‐management of type 2 diabetes. Health Expectations 2013; Vol. Unavailable see DOI below, issue Unavailable see DOI below. [DOI: 10.1111/hex.12080] [DOI] [PMC free article] [PubMed]
Mather 1985
- Mather HM, Keen H. Southhall Diabetes Survey: prevalence of known diabetes. British Medical Journal 1985;291:1081‐4. [DOI] [PMC free article] [PubMed] [Google Scholar]
Mather 1998a
- Mather HM, Chaturvedi N, Fuller JH. Mortality and morbidity from diabetes in South Asians and Europeans: 11 year follow up of the Southhall Diabetes Survey. Diabetic Medicine 1998;15:53‐9. [DOI] [PubMed] [Google Scholar]
Mather 1998b
- Mather HM, Chaturderi N, Kehely AM. Comparison of prevalence and risk factors for microalbuminuria in South Asians and Europeans with type 2 diabetes mellitus. Diabetic Medicine 1998;15:672‐7. [DOI] [PubMed] [Google Scholar]
Molokhie 2000
- Molokhie M, Oakeshott P. Ethnic minorities have specific needs with regard to cardiovascular risk. British Medical Journal 2000;321:112. [PMC free article] [PubMed] [Google Scholar]
Mukhopadhyay 2005
- Mukhopadhyay B, Saltar N, Fisher M. Diabetes and cardiac disease in South Asians. British Journal of Diabetes and Vascular Disease 2005;5(5):253‐9. [Google Scholar]
Naish 1994
- Naish J, Brown J, Denton B. Intercultural consultations: investigation of factors that deter non‐English speaking women from attending their general practitioners for cervical screening. BMJ 1994;309:1126‐8. [PMC free article] [PubMed] [Google Scholar]
Nazroo 1997
- Nazroo J. The Health of Britain's ethnic minorities. Findings from a National Survey. 1. Vol. 1, London: Policy Studies Institute, 1997. [Google Scholar]
NICE 2008
- National Collaborating Centre for Chronic Conditions. Type 2 diabetes: national clinical guideline for management in primary and secondary care (update).. http://webarchive.nationalarchives.gov.uk/20130316063827/http://www.nice.org.uk/nicemedia/live/11983/40803/40803.pdf [accessed online December 2013] 2008:27.
Norris 2001
- Norris SL, Engelgau MM, Narayan KM. Effectiveness of self‐management training in type 2 diabetes: a systematic review of randomised controlled trials. Diabetes Care 2001;24:561‐87. [DOI] [PubMed] [Google Scholar]
Norris 2002
- Norris SL, Nichols PJ, Caspersen CJ, Glasgow RE, Engelgau MM, Jac L, et al. Increasing diabetes self‐management education in community settings. American Journal of Preventive Medicine 2002;22:39‐66. [DOI] [PubMed] [Google Scholar]
Office of Minority Health 2012
- The Office of Minority Health. Diabetes data/statistics. http://minorityhealth.hhs.gov/templates/browse.aspx?lvl=3&lvlid=5 [accessed online December 2013].
Oomen 1999
- Oomen JS, Owen LJ, Suggs LS. Culture counts: why current treatment models fail Hispanic women with type 2 diabetes. The Diabetes Educator 1999;25(2):220‐5. [DOI] [PubMed] [Google Scholar]
Overland 1993
- Overland JE, Hoskins PL, McGill MJ, Yue DK. Low literacy: a problem in diabetes education. Diabetic Medicine 1993;28(4):122‐7. [DOI] [PubMed] [Google Scholar]
Padgett 1988
- Padgett D, Mumford E, Hynes M, Carter R. Meta‐analysis of educational and psychological interventions on management of diabetes mellitus. Clinical Epidemiology 1988;41(10):1007‐30. [DOI] [PubMed] [Google Scholar]
PEWG 2005
- Patient Education Working Group. Structured patient education in diabetes: report from the Patient Education Working Group. Department of Health 2005; Vol. http://www.dafne.uk.com/uploads/135/documents/structured_patient_education_diabetes_report.pdf (accessed 17 December 2013).
Pill 1998
- Pill R, Stott N, Rollnick S, Rees M. A randomized controlled trial of an intervention designed to improve the care given in general practice to type 2 diabetic patients: patient outcomes and professional ability to change behaviour. Family Practice 1998;15(3):229‐35. [DOI] [PubMed] [Google Scholar]
Pottie 2013
- Pottie K, Hadi A, Chen J, Welch V, Hawthorne K. Realist review to understand the efficacy of culturally appropriate diabetes education programmes. Diabetic Medicine 2013;30:1017‐25. [DOI] [PubMed] [Google Scholar]
Raleigh 1997
- Raleigh VS. Diabetes and hypertension in Britain's ethnic minorities: implications for the future of renal services. British Medical Journal 1997;314:209. [DOI] [PMC free article] [PubMed] [Google Scholar]
Riley 2011
- Riley RD, Higgins JP, Deeks JJ. Interpretation of random effects meta‐analyses. BMJ 2011;342:d549. [DOI] [PubMed] [Google Scholar]
Rogers 1994
- Rogers C, Freiberg HJ. Freedom to Learn. 3rd Edition. New York: Macmillan, 1994. [Google Scholar]
Roglic 2005
- Roglic G, Unwin N, Bennett PH, Mathers C, Tuomilehto J, Nag S, et al. The burden of mortality attributable to diabetes. Diabetes Care 2005;29(9):2130‐5. [DOI] [PubMed] [Google Scholar]
Shaw 2010
- Shaw JE, Sicree RA, Zimmet PZ. Global estimates of the prevalence of diabetes for 2010 and 2030. Diabetes Research and Clinical Practice 2010;87:4‐14. [DOI] [PubMed] [Google Scholar]
Simmons 1989
- Simmons D, Williams DRR, Powell MJ. Prevalence of diabetes in predominantly Asian community. British Medical Journal 1989;298:18‐21. [DOI] [PMC free article] [PubMed] [Google Scholar]
Simmons 1993
- Simmons D, Powell MJ. Metabolic and clinical characteristics of South Asians and Europeans in Coventry. Diabetic Medicine 1993;10:751‐8. [DOI] [PubMed] [Google Scholar]
Skinner 2006
- Skinner TC, Carey ME, Cradock S, Daly H, Davies MJ, Doherty Y, et al. Diabetes education and self‐management for ongoing and newly diagnosed (DESMOND): process modelling of pilot study. Patient Education and Counselling 2006;64:369‐77. [DOI] [PubMed] [Google Scholar]
Sterne 2011
- Sterne JA, Sutton AJ, Ioannidis JP, Terrin N, Jones DR, Lau J, et al. Recommendations for examining and interpreting funnel plot asymmetry in meta‐analyses of randomised controlled trials. BMJ 2011;343:d4002. [DOI] [PubMed] [Google Scholar]
UKPDS 1991
- United Kingdom Prospective Diabetes Survey Group. UK Prospective Diabetees Study VIII: study design, progress and performance. Diabetologia 1991;34:877‐90. [PubMed] [Google Scholar]
UKPDS 1998
- United Kingdom Prospective Diabetes Study. Tight blood pressure control and risk of macrovascular ans microvascular complications in type 2 diabetes. BMJ 1998;317:703‐13. [PMC free article] [PubMed] [Google Scholar]
WHO 1980
- WHO Expert Committee on Diabetes Mellitus. Second report. Technical Report Series 646. Second report. Technical report series 646. Geneva: WHO, 1980. [PubMed] [Google Scholar]
WHO 1985
- WHO Expert Committee on Diabetes Mellitus. WHO Expert Committee on Diabetes Mellitus. Technical report series 727. Geneva: WHO, 1985. [Google Scholar]
WHO 1998
- Alberti KM, Zimmet PZ. Definition, diagnosis and classification of diabetes mellitus and its complications. Part I: diagnosis and classification of diabetes mellitus. Provisional report of a WHO consultation. Diabetic Medicine 1998;15:539‐53. [DOI] [PubMed] [Google Scholar]
WHO 1999
- WHO. Definitons, Diagnosis and Classification of Diabetes Mellitus and its complications. Report of a WHO Consultation. Definitions, Diagnosis and Classification of Diabetes Mellitus and Its Complications. Report of a WHO Consultation. Geneva: World Health Organization, 1999. [Google Scholar]
Wierenga 1995
- Wierenga ME, Wuethrich KL. Diabetes program attrition: differences between two cultural groups. Health Value 1995;19:12‐21. [Google Scholar]
Wild 2004
- Wild S, Roglic G, Green A, Sicree R, King H. Global prevalence of diabetes. Diabetes Care 2004;27(5):1047‐53. [DOI] [PubMed] [Google Scholar]
Wilkinson 1996
- Wilkinson P, Sayer J, Laji K, Grundy C, Marchant B, Kopelman P, et al. Comparison of case fatality in South Asians and white patients after acute MI. British Medical Journal 1996;312:1330‐3. [DOI] [PMC free article] [PubMed] [Google Scholar]
Wood 2008
- Wood L, Egger M, Gluud LL, Schulz KF, Juni P, Altman DG, et al. Empirical evidence of bias in treatment effect estimates in controlled trials with different interventions and outcomes: meta‐epidemiological study. BMJ 2008;336(7644):601‐5. [DOI] [PMC free article] [PubMed] [Google Scholar]
World Bank 2013
- World Bank 2013. Country classification. http://data.worldbank.org/about/country‐classifications/country‐and‐lending‐groups#Low_income 2013 (last accessed October 2013).
References to other published versions of this review
Hawthorne 2008
- Hawthorne K, Robles Y, Cannings‐John R, Edwards A. Culturally appropriate health education for type 2 diabetes mellitus in ethnic minority groups. Cochrane Database of Systematic Reviews 2008, Issue 3. [DOI: 10.1002/14651858.CD006424.pub2] [DOI] [PubMed] [Google Scholar]