SUMMARY
Tissue homeostasis and the emergence of disease are controlled by changes in the proportions of resident and recruited cells, their organization into cellular neighbourhoods, and their interactions with acellular tissue components. Highly multiplexed tissue profiling (spatial omics)1 makes it possible to study this microenvironment in situ, usually in 4-5 micron thick sections (the standard histopathology format)2. Microscopy-based tissue profiling is commonly performed at a resolution sufficient to determine cell types but not to detect subtle morphological features associated with cytoskeletal reorganisation, juxtracrine signalling, or membrane trafficking3. Here we describe a high-resolution 3D imaging approach able to characterize a wide variety of organelles and structures at sub-micron scale while simultaneously quantifying millimetre-scale spatial features. This approach combines cyclic immunofluorescence (CyCIF) imaging4 of over 50 markers with confocal microscopy of archival human tissue thick enough (30-40 microns) to fully encompass two or more layers of intact cells. 3D imaging of entire cell volumes substantially improves the accuracy of cell phenotyping and allows cell proximity to be scored using plasma membrane apposition, not just nuclear position. In pre-invasive melanoma in situ5, precise phenotyping shows that adjacent melanocytic cells are plastic in state and participate in tightly localised niches of interferon signalling near sites of initial invasion into the underlying dermis. In this and metastatic melanoma, mature and precursor T cells engage in an unexpectedly diverse array of juxtracrine and membrane-membrane interactions as well as looser “neighbourhood” associations6 whose morphologies reveal functional states. These data provide new insight into the transitions occurring during early tumour formation and immunoediting and demonstrate the potential for phenotyping of tissues at a level of detail previously restricted to cultured cells and organoids.
MAIN
Since the first cultured cell lines, analysis of cell and organelle morphology has informed our understanding of cell mechanics, cell-cell signalling, and disease7. Morphology also plays a central role in conventional histopathological diagnosis using haematoxylin and eosin (H&E) stained tissue sections. High-plex spatial profiling extends such approaches by quantifying diverse molecular and phenotypic features in a preserved tissue environment. In spatial transcriptomics8, the ability to discriminate cells depends primarily on the number of genes measured, but in imaging with antibodies, both the number of antigens and their precise intracellular distributions determine information content9. Nonetheless, almost all contemporary high-plex image-based profiling emphasizes relatively low resolution 2D imaging (0.6 to 2.0 μm lateral resolution) of conventional 5 μm thick tissue sections to increase the speed and convenience of data acquisition.
To study the impact of tissue thickness and image resolution on accurate cell type assessment, formaldehyde-fixed paraffin-embedded (FFPE) tissue blocks were sectioned at thicknesses ranging from 5 to 40 μm (processing thicker sections was infeasible with current techniques) and subjected to 3D CyCIF imaging using a multi-spectral Zeiss LSM980 laser scanning confocal microscope. This revealed that, in conventional 5 μm sections, nearly all nuclei (>90%) were incomplete along the Z (optical) axis whereas, in 30-40 μm sections, 60-80% of nuclear envelopes were complete along all three axes (Fig. 1a; Supplementary Video 1). In many areas of a thick specimen, multiple layers of intact nuclei were visible (Fig. 1a-c).
Figure 1: Demonstrating the need for thick tissue sections using 3D CyCIF.
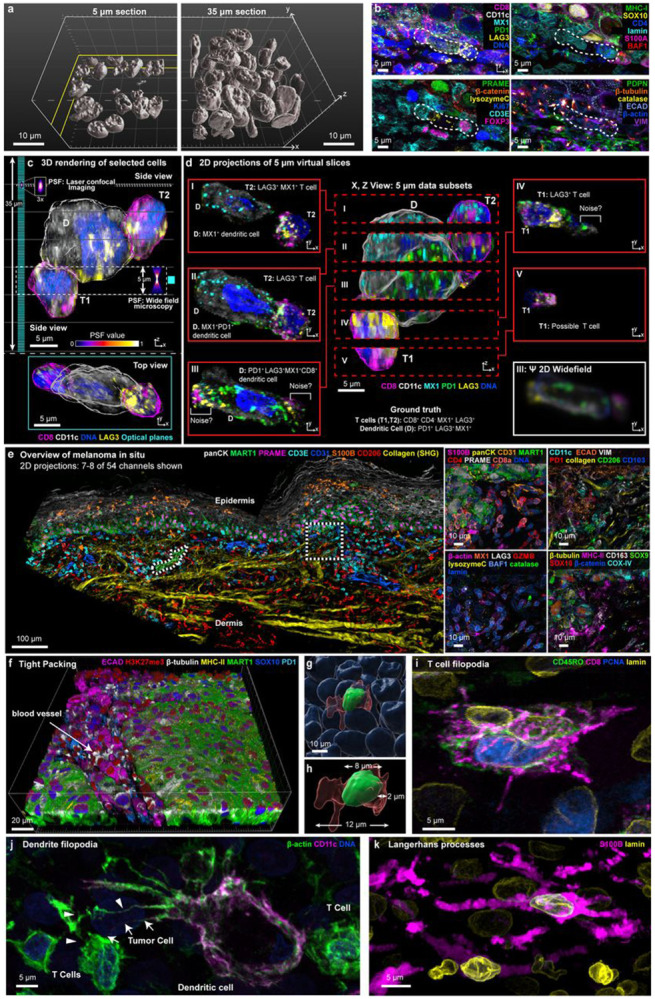
a, Surface rendering illustrates the nuclei volume of 5 μm (left) and 35 μm tissue sections (right). Scale bars, 10 μm. b, Immunofluorescence images of 6-marker subsets illustrating the microenvironment of the cellular community from the VGP highlighted in c-d (dotted lines). c, 3D rendering of 3 selected cells from (b). Comparison of the point spread function and optical planes (cyan) for laser scanning confocal and widefield microscopy shown. Upper: x,z (side) view. Lower: y-x (top) view. d, Synthetic 5 μm sections of 3-dimensional data in x-z (center) and x-y 2D projections (red outlines to left and right; labelled I-V). Simulated widefield slice III image using theoretical PSFs (lower left, white outline). e, Multi-modal image integrating 3D CyCIF with second harmonic signal of collagen highlighting the melanoma in-situ region (MIS). Maximum intensity projection of selected channels at lower magnification (left), with additional marker subsets for the indicated ROI (right). Scale bar, 100 μm. f-h, FOVs capturing the boundary of a vertical growth phase tumour, highlighting the densely-packed tissue at low-resolution (f) and high-resolution renderings of an individual cell (g-h). i-k, Examples of cells with multiple processes in melanoma: i, Cluster of CD8 T cells in metastatic melanoma. j, Dendritic cell with filopodia extensions in metastatic melanoma. Two filopodia making contact with a T cell and tumour cell, labelled with arrows or arrowheads, respectively. k, Langerhans cell in the MIS. Scale bars 5 μm.
To study the impact of thick section imaging on cell phenotyping, volumetric reconstruction was performed on small communities of cells using Imaris® (RRID:SCR_007370) software. Figure 1c shows one community, comprising a dendritic cell (D) and two T cells (T1, T2), from a 54-plex CyCIF image of a 35 μm thick section of invasive (vertical growth phase; VGP) primary melanoma; the cells spanned ~25 μm along the optical axis (Z; upper image) and a similar distance in the plane of the specimen (X,Y; lower image). In these cells, surface antigens commonly used to subtype immune cells had non-uniform distributions and the T-cell activation and exhaustion markers PD-1 and LAG3 were polarized (see Supplementary Table 1 for protein nomenclature). When we created sequential synthetic 5 μm serial ‘sections’ (2D maximum intensity projections; labelled I to V) along the Z axis, inferred cell types varied with the section and was often incorrect (Fig. 1d). Using synthetic section III as an example, D would be incorrectly scored as negative for the inflammatory marker MX1 due to its polarized distribution and positive for LAG3 due to overlap with cell T1, while true positive staining from T1 and T2 (CD8 and LAG3) would be scored as background because the corresponding nuclei were largely absent from the section (cell segmentation methods rely on nuclei). Thus, accurate phenotyping of these three immune cells requires imaging whole cells to account for non-uniform protein distributions in cells and their overlap in Z.
The ~5 μm projections of high-resolution images in Figure 1d do not correctly represent what would be seen in a conventional lower resolution 2D slide scanner. This arises because the volume of emitted photons (the point spread function) collected by a confocal microscope relative to a widefield scanner (with 0.5 Numerical Aperture objective) is ~3 fold smaller in X,Y and 5-fold smaller in Z; emitted light from out-of-focus planes is also lower. These effects are approximated in the lower right panel of Figure 1d (‘Ψ widefield”) and show that punctate signals commonly representing intracellular organelles, condensates, and other localized protein complexes cannot be readily distinguished from each other and from background noise at lower resolution (see Extended Data Fig. 1a for individual channel views).
We then collected 11 datasets (Supplementary Table 2) from five tissue types (representing normal, cancerous, and pre-cancerous tissues) using thick section 3D high-plex CyCIF imaging with 140 x 140 x 280 nm voxels (~1,000,000 voxels per cell). Datasets averaged ~500 gigabyte per mm2 of tissue (see Supplementary Figs. 1-11 for illustrative results of all tissues). Antibody specificity was confirmed on 5 μm sections of the same specimens, as previously described10. Extracellular matrix (collagen) was imaged with Second Harmonic Generation by Fluorescence Lifetime Imaging Microscopy (SHG; Fig. 1e). A newly developed 3D segmentation algorithm was used to identify single cells, generate UMAP embeddings, and distinguish among major immune and tumour cell types (Extended Data Fig. 1b). Because methods for systematic assessment of 3D high-plex morphologies do not yet exist, we relied on visual analysis; key findings were then confirmed computationally. For simplicity, the current manuscript focuses on three datasets in one disease: (i) a pre-invasive cutaneous melanoma in situ (MIS), (ii) a VGP primary melanoma from the same patient (Fig. 1e, Extended Data Fig. 1c-d), and (iii) a metastatic melanoma to the skin from a different patient. We have organized the description of these specimens around key topics in spatial biology: analysis of cell and organelle morphology, the microanatomy of cell clusters and structures (e.g. blood vessels), cell shape, tumour and immune cell lineages, and cell-cell interactions (proximity analysis). Throughout, we highlight protein distributions that have functional significance based on historical studies with cultured cells and organoids.
Across all specimens, cells were densely packed except in areas where blood vessels or ECM filled the voids (Fig. 1f; Supplementary Video 3). In the MIS, for example, nuclei averaged 5.0 μm in diameter (mean 7.2 μm ± 2.3 μm SD for melanocytes and 4.9 μm ± 2.8 μm for immune cells). Cells averaged 13 μm ± 4.3 μm along the major axis, 6.1 μm ± 1.9 μm along the minor axis (consistent with recent and historical estimates)11. Thus, the depth of the cytoplasmic compartment, scored as the distance from the plasma membrane to the nuclear lamina, was often 1 to 6 μm and the membranes of neighbouring cells were located only 1 to 1.5 μm apart (Fig. 1g,h).
Some cells had highly extended cell bodies and cytoplasmic processes. For example, in Figure 1i, three CD8+ T cells from metastatic melanoma had multiple filipodia extending 5-10 μm from the cell body. A dendritic cell had 20-30 μm filopodia and membrane ruffles in contact with multiple CD8+ PD1+ effector T cells; these specialized filopodia (dendrites) enable a switch from antigen sampling to antigen presentation during T cell priming12 (Fig. 1j, Extended Data Fig. 1e,f,). Langerhans cells, specialized dendritic cells in skin, also had many membrane extensions, with branches extending 30-50 μm across multiple Z planes (Fig. 1k). 3D imaging was essential to identify these morphologies, and to distinguish changes in cell shape from changes in orientation: 2D views of VGP melanoma suggested that round cells were more common in the tumour centre and elongated cells at the tumour margin. In 3D this was seen to be an artefact of differences in orientation: cells in the centre were more likely to be viewed end-on whereas those in the margin were rotated ~90° (Extended Data Fig. 1g-i). Theoretical and experimental studies of cell migration have demonstrated a dependency on both the intrinsic properties of cells and their packing13. Accurate 3D representations of tissues and their constituents will be useful in such studies. Moreover, tight cell packing, extended processes, and overlap along the Z-axis explain why accurate single-cell segmentation of 2D images and spatial transcriptomic profiles14 is inherently challenging.
Organelle and cell surface morphologies
High-plex imaging of whole immune and tumour cells in 3D made it possible to identify a wide variety of discrete intracellular and plasma-membrane structures (Fig. 2a) including lineage-associated differences in nuclear lamina (e.g., a multi-lobed – hyper-segmented – nucleus in neutrophils; Fig. 2b), microtubule organising centres (Fig. 2c), peroxisomes (based on catalase staining), secretory granules and/or ER (lysozyme C in neutrophils and granzyme B in T cells), DNA damage foci (γH2AX), mitochondria (COX IV), and biomolecular condensates (MX115; Fig. 2d-h, Extended Data Fig. 2a). Galleries of single cells identified broadly distributed and cell-type specific features (e.g., catalase foci in dendritic cells and γH2AX foci in keratinocytes and myeloid cells), enabling deep phenotyping of cell lineage and state.
Figure 2: Visualizing complex organelle and cell-surface morphologies.
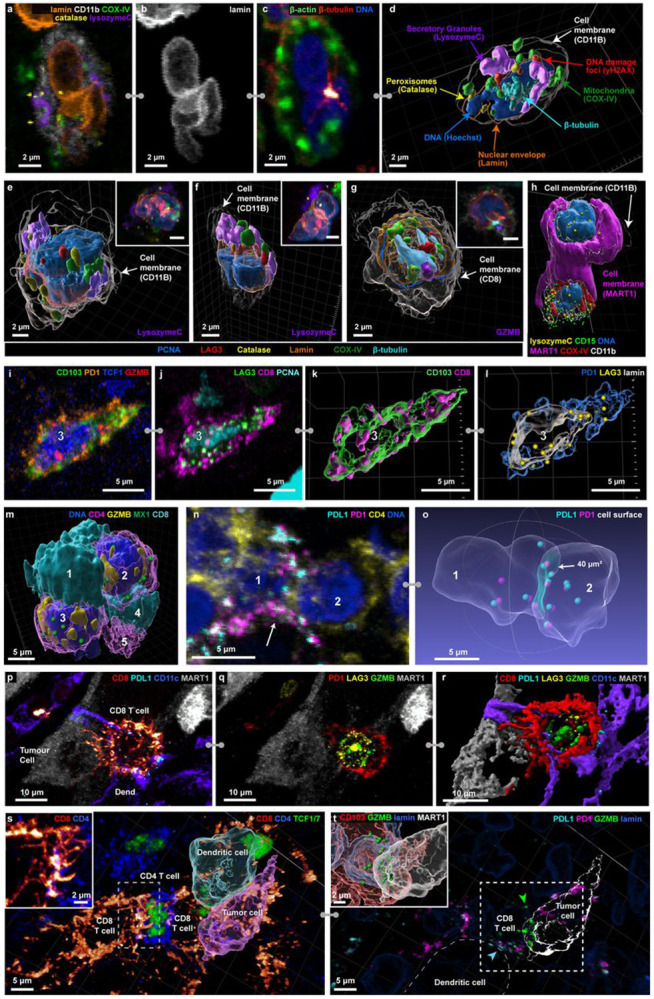
a-f, Selected channels of 54 plex 3D CyCIF images used for identifying cell types and organelles. All cells found in the dermis of the MIS (full marker assignment in Supplementary Figure 12). a-c, Maximum projections of a neutrophil showing marker subsets for identifying organelles (a), a multi-lobed nucleus (b), the cytoskeleton (c). d, A 3D rendering of the cell shown in (a-c). e-g, 3D rendering and maximum intensity projection inset (upper right) for selected cells, including neutrophils in the MIS (e & f) and a T cell in metastatic melanoma (g). h, 3D rendering of a neutrophil interacting with a MART1+ tumour cell (magenta) in the MIS. i-l, Distribution of intracellular (i & k) and membranous (j & l) markers in a single cell as maximum projections (i-j) and surface rendering (k-l). m, Surface rendering of five interacting immune cells in the MIS, including three CD4+ helper T cells (magenta-translucent) and two CD8+ T cells (cyan-opaque). Also shown, MX1 biomolecular condensates (green), globular GZMB+ (yellow) in CD4+ T cells. Spacing between opposed membranes is <1.5 μm and contact area is ~20μm2. Scale bars 5 μm. See Extended Data Figure 2c for reversed T cell opacity. n-o, Two CD4+ T cells from the VGP interacting expressing PD1 and PDL1 as a maximum projection (n) and transparent surface mesh showing contact area, with colocalized PD1 and PDL1 shown as spheres. p, CD8+ T cell (red) and dendritic cell (purple) interacting with a tumour cell with long filopodia. q, Same cells as (p) with GZMB, PD1, and LAG3 shown, highlighting that the T cell is activated and cytotoxic. r, surface rendering of interactions in (p) and (q), showing the filopodia in greater detail. s, Multicellular interaction in metastatic melanoma. A dendritic cell interacting with a tumour cell (with surface rendering overlaid onto immunofluorescence) and a CD4 Thelper cell interacting with a CD8 T cell through filopodia (shown in greater detail in inset). t, Same field of view in (s), showing PD1 and PDL1 colocalization between CD8 T cell and dendritic cell (blue arrow). In the CD8 cell, GZMB is polarized towards the tumour cell (green arrow and inset). Location of inset shown by box with dotted line. Scale bars as indicated.
Proteins used for lineage analysis exhibited a variety of distributions that proved helpful in subtyping. Some were distributed throughout the plasma membrane, for example the myeloid cell integrin CD11c, skin-homing T cell integrin CD103, and MHCII receptor (in tumour and antigen presenting cells). Others were found in discontinuous islands (CD4 and CD8 in T cells) or puncta (the immune checkpoint protein LAG3; Fig. 2i-l). The distributions of some proteins provided information on activity or cell state. For example, newly synthesized LAG3 localizes to endosomes but can rapidly translocate to the plasma membrane where it is activated by binding to MHC class II16 on the membranes of apposed cells. Across specimens, we found 1-20 LAG3 puncta per cell, both inside cells and at the plasma membrane (Extended Data Fig. 2b). Granzyme B (GZMB) staining was diffuse and globular in CD4 T cells and punctate in CD8 T cells, consistent with localization to cytoplasmic granules. GZMB mediates the cytotoxic activity of T and NK cells and globular GZMB can be used to identify activated memory CD4 T cells (Fig. 2m, Extended Data Fig. 2c; Supplementary Video 4)17.
Functional interactions among cells could be inferred from changes in the distributions of cell surface proteins. For example, the immune checkpoint receptor PD1 and its transmembrane ligand PD-L1 varied from relatively uniform in the membrane to punctate (Fig. 2n-o; Extended Data Fig. 2d-f), with the latter morphology most evident when PD1+ T cells were in contact with PDL1 expressing cells (primarily dendritic cells).18 In some cases, many PD1 and PDL1 puncta were visible across an extended domain of membrane apposition (e.g., 13 foci over 40 μm2 in Fig. 2o), in an arrangement consistent with formation of multiple juxtracrine signalling complexes. Multiple distinctive membrane structures were commonly visible in a single cell; for example, filipodia from a CD8 T cell contacting a tumour cell while PD1 was bound to PDL1 from a neighbouring dendritic cell (Fig. 2p-r, Extended Data Fig. g-i). In a different multicellular community, filipodia from a CD8 T cell contacted a CD4 T helper cell (Fig. 2s; inset, Extended Data Fig. 2j), which in turn contacted another CD8 T cell that was in contact with both a tumour cell and a dendritic cell; GZMB in this T cell was polarized toward the tumour cell (Fig. 2t; green arrowhead) and PD1-PDL1 complexes had also formed (blue arrowhead). Thus, morphologically distinguishable interactions involving a variety of intracellular and cell surface proteins provide insight into complex patterns of T-cell regulation and activation.
Tumour microarchitecture
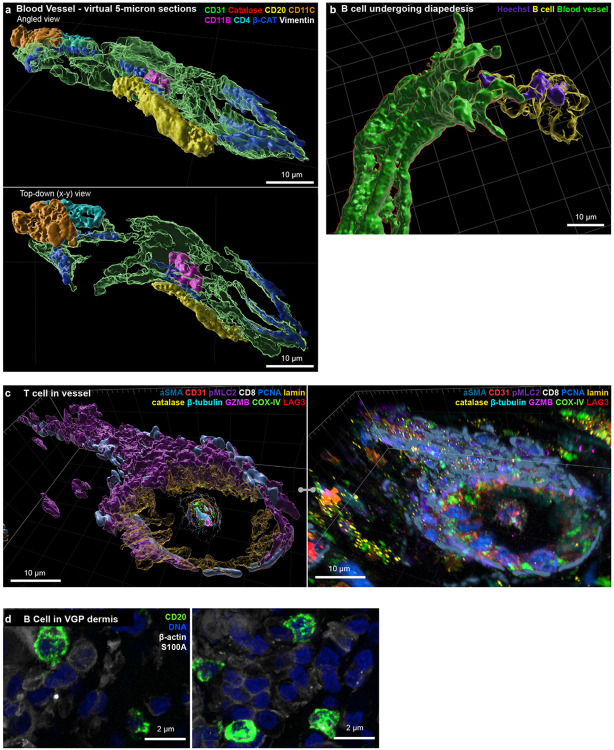
Thick section 3D imaging made it possible to dissect components of the tissue microarchitecture such as a 100 μm-long dermal blood vessel (venule) in the MIS (Fig. 3a; Supplementary Video 2). In this vessel, ~10 vimentin and beta-catenin-positive endothelial cells formed a tube enclosing erythrocytes (labelled “6”) and a neutrophil (4). At the distal end, a helper T (2) and dendritic (1) cell were visible where the vessel appeared to branch. Most remarkable was a B cell (5) with a low sphericity (value of ~0.35) flattened against the vessel wall, a morphology consistent with trans-endothelial migration (diapedesis) of immune cells from vessels into tissues19. These features were not evident in virtual 5 μm-thick sections (Extended Data Fig. 3a). Elsewhere in the dermis, another B cell had its nucleus traversing a vessel wall while its cell body remained inside the vessel while in in metastatic melanoma a T cell was suspended within a vessel (Extended Data Fig. 3b-c). In the MIS as a whole, we found that B cells were the type of cell most likely to associate with collagen fibres in the dermis20,21 (Fig. 3b, c); they were often (n = 11 of 14 in the MIS) stretched into irregular shapes (this was not a feature of all B cells and those found in the stroma were often round; Extended Data Fig. 3d). Functions have only recently been ascribed to B cells in the skin and our images provide direct evidence of B cell recruitment from the vasculature into the dermis, followed by collagen binding, at densities consistent with other reports22.
Figure 3: Visualizing the interplay of multi-cellular structures, cell shape, motility, and tension in native tissue.
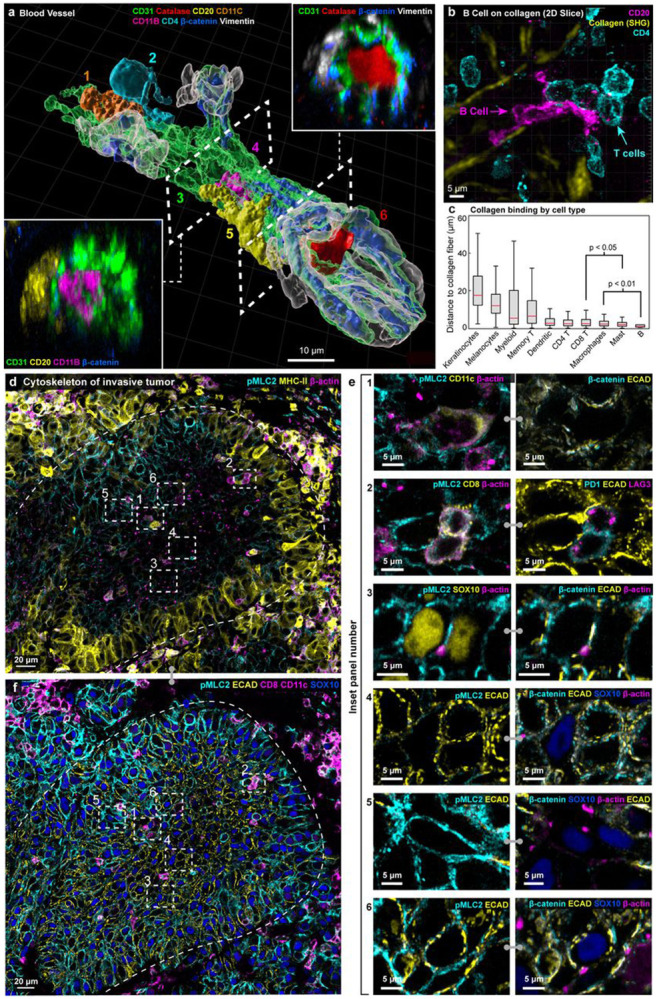
a, Surface rendering of a segment of an intact blood vessel within the MIS region. Dashed lines demarcate cutting planes for cross-sectional views (insets), illustrating the capability to distinguish between internal components of the blood vessel: a helper T (2), dendritic (1) cell, neutrophil (4), red blood cell (6) and external, fully intact B cell (5). Scale bar, 10 μm. b, Representative CD20+ B cell (magenta) with elongated morphology interacting closely with collagen fibres (yellow), as a maximum intensity projection. Scale bars, 5 μm. c, Tukey box plot illustrating the distances between collagen fibres and different cell types in the MIS. Statistical significance was assessed using one sided unpaired student’s t-test. Centre line, median; box limits, upper and lower quartiles; whiskers, minimum and maximum after removing outliers. d, An orthogonal slice of a VGP melanoma region, highlighting the punctate nature of β-actin in tumour cells and the generally elevated expression levels of β-actin in immune cells, alongside graded pMLC2 expression. Scale bar 20 μm. e, High resolution insets of FOV indicated in (d) and (f), highlighting elevated β-actin expression in dendritic cells (1) and CD8 T cells (2), β-actin puncta in SOX10+ tumour cells (3), and alternating patterns of pMLC2 and E-cadherin (4-6). Scale bars 5 μm. f, Orthogonal slice of the same region as (d), highlighting the inverse expression of pMLC2 and ECAD, and the locations of T cells and tumour cells. Scale bar 20 μm.
Cell shape and motility
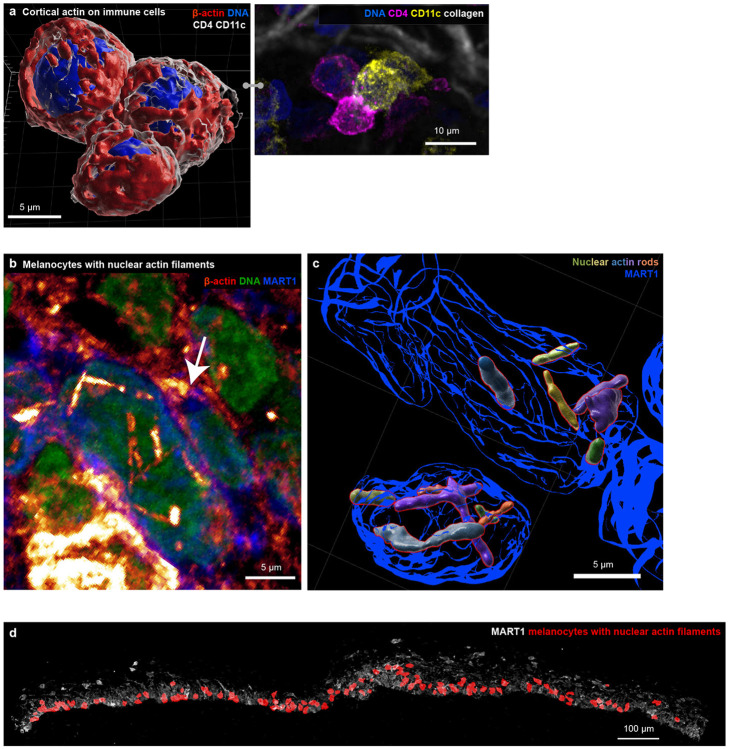
Cell shape and motility are regulated by the actomyosin cytoskeleton which was most prominent in dendritic and T cells (~2-fold more actin overall than melanocytic cells and 3-fold more than in keratinocytes; Fig. 3d). This manifested itself as a dense network of plasma membrane-proximal cortical actin (Fig. 3e, panel 1&2; Extended Data Fig. 4a). Tumour cells had indistinct actin networks but frequent plasma membrane-localised puncta (0.45 puncta per cell in the interior vs. 0.06 per cell at the tumour margin; panel 3), which may represent invadopodia23. Nuclear actin rods were another atypical actin morphology, found in ~14% of melanocytic cells in MIS (Extended Data Fig. 4b-d), and have previously been associated with a stress response24. This may reflect contact between rod-positive cells and one or two activated CD8+ PD1+ cytotoxic T cells.
Melanocytes (and epithelial cells) form lateral adherens junctions (mediated by E-cadherin) that connect to the actin cytoskeleton through linker proteins such as beta-catenin; these junctions play a key role in melanocyte differentiation and oncogenesis25. Adherens junctions are often under tension due to opposing contractile forces in adjacent cells. Phosphorylation of myosin light chain 2 (pMLC2) regulates this tension by promoting actomyosin contractility. In VGP melanoma, E-cadherin staining was greatest in the centre of the tumour (Fig. 3f) and was positively correlated with levels of β-catenin (panel 4), but inversely correlated with pMLC2 staining at the tumour margin (panel 5). Single tumour cells midway between the margin and centre exhibited alternative staining for pMLC2 and E-cadherin (panel 6). This pattern likely reflects lower adhesion and greater tension at the tumour margin and more adhesion and lower tension at the tumour core26, perhaps in response to an immune cell-proximate inflammatory environment27 (which manifests itself as MHC-II upregulation in tumour cells at the margin; Fig. 3f). Such an arrangement is expected to promote invasion of the underlying dermis. Infrequent pMLC2 positive cells in the tumour centre were found be myeloid and T cells; these cells had abundant cortical actin and extended cytoplasmic processes (Fig. 3e; panels 1&2). We propose that these represent immune cells actively migrating into the tumour core.
Tumour lineage plasticity
Although the genetics of later stage melanoma are well characterized28, mechanisms of melanoma initiation remain elusive29. A handful of studies have identified oncogenic mutations (such as BRAF, NRAS, NF1)28 and reductions in the DNA epigenetic marker, 5-Hydroxymethylcytosine (5hmc)30, in melanoma precursors suggesting a role for both genetic and epigenetic changes. Currently, the presence of melanoma precursor fields5 and MIS is scored by changes in the morphologies, numbers, and positions of melanocytic cells in H&E images31 (expression of protein markers such as PRAME32 is also used in diagnosis). In the MIS region, most melanocytic cells were located at the dermal-epidermal junction (DEJ), interacted with keratinocytes, and retained a dendritic morphology (promoting transfer of UV-protective melanin; Fig. 4a). Also present were pagetoid melanocytic cells that lacked dendrites and had a rounded, ameboid morphology (cytological atypia), which was most obvious among cells that had migrated towards the top of the epidermis (Fig. 4b-h). Pagetoid spread by single and small groups of cells is a hallmark of oncogenic transformation33. Nonetheless, the MIS and underlying dermis were not highly proliferative, with only 1% of cells (n = 110) positive for the Ki67+ proliferation marker. Among Ki67+ cells, 34% were T cells while the remainder consisted of monocytes (28%) and endothelial cells (2.7%); only a single melanocytic cell was Ki67+. By contrast, in the invasive VGP melanoma domain from the same specimen, 11% of all cells were Ki67+ with melanoma tumour cells the most proliferative (45% Ki67+), followed by monocytes (44%). Thus, the MIS had the hallmarks of early oncogenic transformation and migration, but limited cell division (proliferation is known to vary among MIS specimens)34.
Figure 4: Melanocyte morphologies, lineage marker expression, and cellular interactions in the melanocytic intraepidermal compartment.
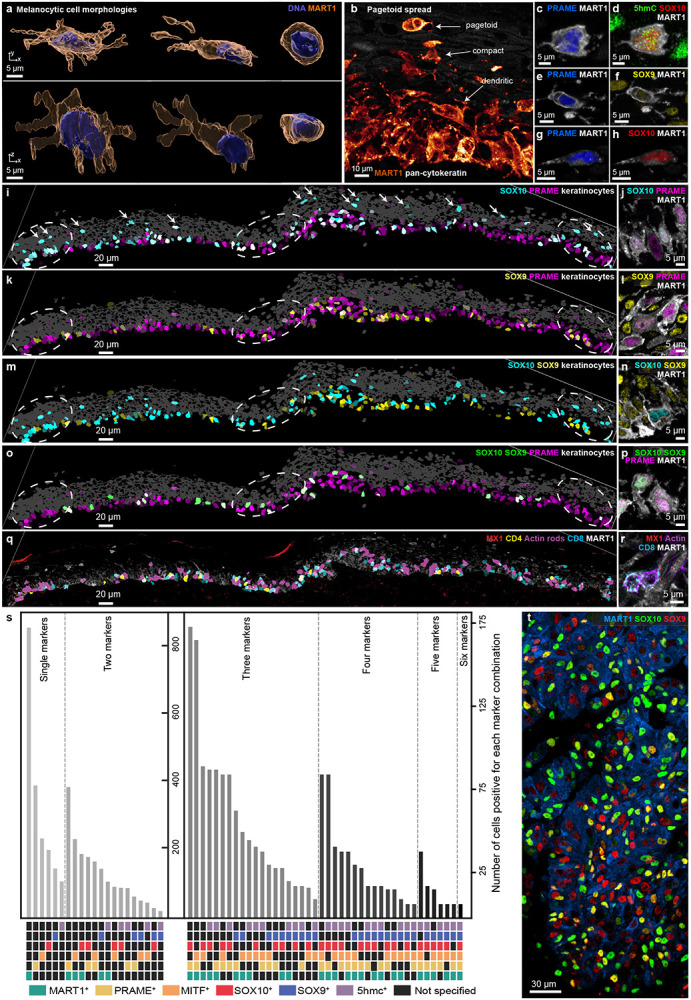
a, Surface-rendered melanocytes within the MIS, illustrating variations in conventional dendritic-like and rounded morphologies. Scale bars, 5 μm. b, A representative FOV showcasing the transition of melanocyte morphology from dendritic-like at the DEJ to compact (bottom), and ultimately rounded, during the pagetoid spread within the epidermis (top). Scale bars, 10 μm. c-h, Representative examples of PRAME- and MART1-expressing pagetoid spread cells showing different expression levels of 5hMC, SOX9 and SOX10. Markers as indicated on each panel. Scale bars, 5 μm, i-p, Images of the MIS. Left column: segmentation masks coloured by marker intensity and brightness representing mean expression level. Masks in grey denote the positions of keratinocytes; dashed circles denote IFN-rich domains. Markers as indicated on each panel. Right column: high-resolution immunofluorescence images of the same markers per row. q,r, Images as in l-p but with magenta denoting cells containing nuclear actin rods. s, Bar graph showing the number of melanocytic cells in the MIS positive for each of 63 combinations of marker proteins. MART1 (green), PRAME (yellow), MITF (orange), SOX10 (red), SOX9 (blue), and 5hmc (violet). Note different y-axes. t, Maximum projection of a region from the vertical growth phase showing variability of SOX9 (red) and SOX10 (green) expression. Scale bar, 30 μm.
We scored individual melanocytic cells (n=875) in the MIS for expression of six markers of melanocyte lineage and transformation, including 5hmc, PRAME, MART1 (a melanocyte cell surface protein used clinically)35, SOX9, SOX10, and MITF (transcription factors associated with differentiation). 3D imaging made it possible to unambiguously score combinations of nuclear and cell surface markers at a single cell level and revealed that the six markers we scored were present in all 63 possible combinations, without evidence of significant spatial correlation (Fig. 4i-s), Cells undergoing pagetoid spread also expressed many different combinations of lineage markers (Fig. 4c-h) and transcription factors (Fig. 4m,n). Additionally, in the case of SOX9 and SOX10, there was clear evidence of a graded transition between states (Fig. 4t). However, we did not detect expression of NGFR (CD271), a marker of melanoma initiating “stem” cells36 in the MIS or the VGP melanoma (as a control, we confirmed positive NGFR staining in parallel thin-sections of a separate case of metastatic melanoma). Moreover, in the MIS we did not detect any association between cell-intrinsic markers and melanocyte morphology or other features such as nuclear actin rods. These data imply that melanocytic cells with features of early malignant transformation are subject to frequent changes in cell state (phenotypic plasticity) rather than progressive evolution from a single transformed or progenitor (stem-like) cell, as proposed for advanced invasive melanoma.
Inflammatory neighbourhoods
We also observed changes in immunogenic state affecting cellular neighbourhoods. For example, the MIS contained three spatially restricted domains in which the levels or distributions of IRF1, MX1, and MHC-I revealed an active response to interferons (IFNs; Fig. 5a-b, Extended Data Fig. 5a). IRF1 is an IFN-responsive transcription factor that translocates from the cytoplasm to the nucleus and MX1 and MHC-I are downstream response genes; MX1 forms multiple biomolecular condensates in each cell15 and MHC-I is found on the cell surface. The inferred IFN-positive domains were ~50 to 100 μm in diameter, implying highly localised cytokine activity (domain size was confirmed on a distant serial section; Extended Data Fig. 5b-d). Within these domains, melanocytic cells had started to pass through the DEJ and were in contact with immune cells (Fig. 5b-c). Thus, our data provide direct evidence for restricted and recurrent spatial niches, defined by the simultaneous presence of an IFN response, melanocyte-immune cell contact, and melanocytes crossing the DEJ (the first step in invasion). These IFN-positive spatial niches were coincident with the lineage switching described above but without detectable spatial correlation, despite evidence that IFN can induce melanoma de-differentiation in cultured melanoma cells37.
Figure 5: Spatial analysis of IFN-rich domains and distinct T cell lineages.
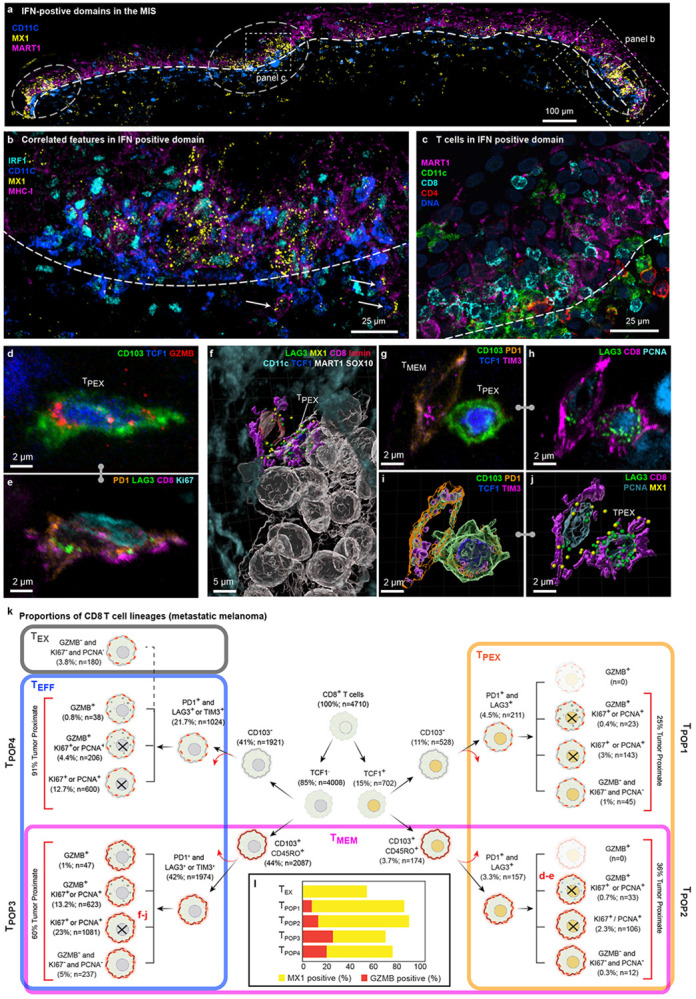
a, Three selected channels of 54-plex CyCIF image of the MIS in dataset 2 (LSP13625). A single image plane from the middle of the specimen is shown. IFN-rich domains denoted by dashed circles. DEJ denoted by white dashed line. Scale bar 100 μm. b, Magnified view of inset from panel a showing coincident nuclear localization of IRF1, expression of MX1, and MHC-1 upregulation. DEJ denoted by white dashed line. White arrowheads indicate invading melanocytic cells into dermis. Scale bars, 50 μm. c, Enlarged inset from panel (a) showing diversity of immune cells crossing the DEJ. DEJ denoted by white dashed lines. d,e, Max projection of an activated TPEX cell, showing intracellular organelles like GZMB (d) and membranous proteins such as LAG3 and PD1 (e). f, 3D rendering of a TMEM cell interacting with a TPEX cell, which is in turn interacting with a cluster of metastatic melanoma tumour cells. Dendritic cells surround the neighbourhood. g-j, The TMEM and TPEX cells shown in (f), as a maximum projection (g & h) and 3D rendering (I & j). k, Hierarchical tree diagram showing proportions of CD8 T sub-lineages the metastatic melanoma specimen. TMEM (magenta), TPEX (orange), and TEFF (blue) subtypes overlap, giving rise to four hybrid populations (TPOP1-4) as denoted by vertical labels. See text for details. Red arrows denote additional cell subsets that are not shown on this tree. l, Percent of cells positive for GZMB (red) or MX1 (yellow) by population.
Progenitor and effector T-cell subsets
The normal epidermis has an abundance of resident memory T cells as a consequence of prior encounters with non-tumour antigens (these TMEM cells are characterized by expression of the lineage markers CD45RO and CD103)38. The presence of tumour leads to additional T-cell recruitment and activation. In-depth 3D immunoprofiling of metastatic melanoma using ten T cell lineage and state markers (n=4,710 CD8 and 2,820 CD4 cells) revealed a remarkable diversity of populations and states (Fig. 5d-j, Extended Data 5e,f). Among these, TPEX cells39-41 (15% of CD8 cells; orange box; Fig. 5k) are of particular interest because they can be re-activated by immune checkpoint inhibitors (ICIs) and their presence is associated with improved patient outcomes42.
These cells are defined as CD8+ CD3+ T cells co-expressing the master transcriptional regulator T Cell Factor 1 (TCF1)43 and checkpoint proteins (exhaustion markers) PD-1 and LAG3. In our data, TPEX cells could be divided into two subpopulations based on expression of CD45RO and CD103; two CD proteins that are traditionally markers of tissue-homing memory cells (TMEM; magenta box). Thus, TPEX and TMEM populations overlapped (giving rise to the hybrid populations TPOP1 and TPOP2; Fig. 5k). TMEM cells also overlapped effector T cells (TEFF; blue box; defined as CD8+ TCF1− PD1+ [LAG3 or TIM3]+ [Ki67, PCNA, and/or GZMB]+) and gave rise to hybrid populations TPOP3 and TPOP4. Terminally exhausted cells (TEX; grey box; defined as CD8+ PD1+ [LAG3 or TIM3]+ [Ki67−, PCNA−, and GZMB−]) were distinct from the four hybrid populations. Thus, TPEX, TMEM, and TEFF CD8 T cell populations, which are commonly described as functionally distinct, appear to have a substantial overlap. Analogous results were obtained for CD4 T cells (Extended Data Fig. 5g).
Cytotoxic T cells could be distinguished by the presence of 1-20 GZMB puncta per cell (Extended Data Fig. 5h). Unexpectedly, GZMB+ cells (5% of all CD8 T cells) were found in T cells that were both positive or negative for TCF1, CD45RO, and CD103 (Fig. 5l red bars). While TCF1− cells were more likely to be GZMB+ and in contact with tumour cells than any other subtype. visual review confirmed that cells in all four populations exhibited polarization of GZMB toward closely apposed tumour cells, implying active cell killing. TPEX, TMEM, and TEFF cells were also highly proliferative (40-80% PCNA or Ki67 positive) demonstrating a high degree of activation and self-renewal. Moreover, greater than 60% of all CD8 T cells contained multiple MX1 puncta as a result of an active response to IFN (Fig. 5l; yellow bars). These data are consistent with the known effects of IFN on T cell proliferation and suggest that this extends to all major T cell subtypes.
Spatial analysis showed that TPEX cells were significantly closer to TMEM and TEFF cells than to TEX or other TPEX cells (Extended Data Fig. 5i,j). TMEM cells were the most likely to be close to tumour cells (Fig. 5k, Extended Data Fig. 5k). These data are consistent with evolution of TPEX cells from a TCF1+ to a TCF1− effector status in both the memory-related (TPOP2 CD45RO+ CD103+) and classical (TPOP1) populations (Extended Data Fig. 5l,m). Thus, we infer that differentiation of TPEX cells involves three branches, one involved in self-renewal, one in direct generation of TCF1+ cytotoxic cells, and the third giving rise to classic TEFF cells.
Membrane-membrane interactions
Existing approaches to proximity analysis use nuclear positions to identify cell-cell interactions18 but high resolution imaging made it possible to detect the more biologically relevant process of membrane-membrane interaction. Three arrangements were observed: (i) direct binding (Type I interaction) (ii) membrane apposition (Type II) and (iii) neighbourhood clustering (Type III). Direct binding involved pixel-level overlap in membrane proteins from neighbouring cells. This was most obvious in the case of a CD8+ PD1+ T cells interacting with PDL1 expressing cells; Figure 6a shows this for a rare PDL1+ melanocytic cell. A line integral across the cell-cell junction, followed by polynomial curve fitting, revealed a membrane-to-membrane spacing of ~70 nm (Fig. 6b) vs. an average intermembrane spacing of ~1.5 μm among all cells. PDL1 expressing dendritic cells bound to CD8+ PD1+ T cells had a similar membrane spacing (Fig. 6c,d), as did a T cell interacting with a PDL1 negative melanocytic cell in the VGP (Fig. 6e,f, Extended Data Fig. 6a). Given the resolution of our microscopy, these spacings are consistent with EM of juxtracrine signalling and immunological synapses involving integrin-stabilised cell-cell contacts and intervening clefts with ~30 nm membrane separation44.
Figure 6: Cell-cell interactions and multivalent immune cell niches.
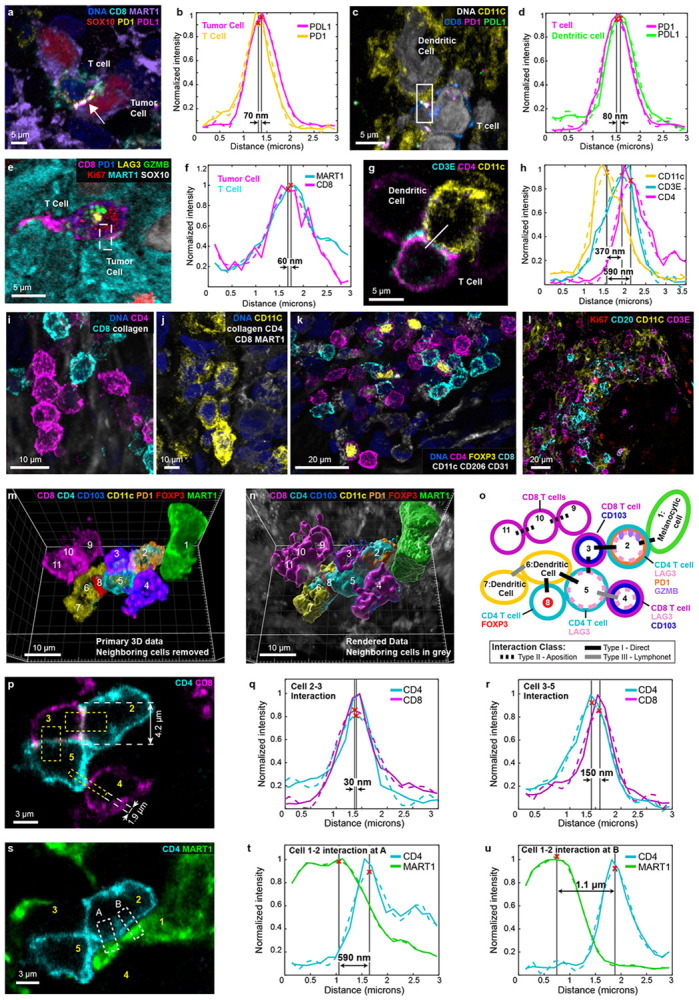
a-h, Selected fields of view and surface renderings from dataset 1 (LSP1362). a, A single image plane of a PD1+ dendritic cell (cell 1) interacting with two MART1+ tumour cells. White arrow denotes juxtacrine PD1-PDL1 interaction. Scale bar 5 μm. b, Line integral of interaction of cells 1 and 3 in a. c-d, A dendritic cell (cell 1) interacting with a CD8+ T cell as a maximum projection I and line integral (d). Box indicates region of line integral shown in d. e,f, Representations of a TPEX cell from the invasive margin as a maximum projection (e) and line integral across membrane (f), for region marked by white dashed box in I. g,h, A conventional direct interaction between a CD4 helper T cell (magenta) and a dendritic cell (yellow), as a maximum intensity projection (g). The degree of direct interaction is shown by line integral in (h). i-k, Examples of Type III interactions (lymphonets), involving CD4+ CD8+ dendritic cells in the MIS. These networks are characterised by cell-cell interactions involving immediate contact through relatively small membrane domains and a loosely packed arrangement. l, Stroma in the vicinity of the VGP melanoma showing neighbourhoods rich in CD20+ B cells, CD11C+ dendritic cells, CD3E+ T cells but without the clusters of proliferating Ki67+ cells that are characteristic of mature germinal centres. m-o, 11 cells from the MIS lying in proximity to the DEJ, shown as primary data (m), 3D surface renderings (n), and as a schematic representation of three Type I, four Type II, and two Type III interactions inferred from line integrals in single-plane images (o). Scale bars, 10 μm. p, A cross-sectional slice of the two CD8+ T cells and two CD4+ featured in (m), depicting the direct engagement of cell membranes. Scale bar 3 μm. q,r, A line integral plot depicting CD4 and CD8 average expression within the bottom boxed region of p (q) or right boxed region of r (s). s-u, A Type II interaction between a MART1+ tumour cell and CD4+ T cells, as a representative image (s) and line integrals for the interaction between cells 1-2 at region A (t) and B (u). Scale bars, 3 μm. Red ‘X’s mark the maximum intensity along line integral and denotes the boundary of the cell membrane for each channel.
A second form of cell-cell interaction was characterized by neighbouring cells with extensive membrane apposition but without evidence of pixel-level overlap in protein staining; in this case a membrane-membrane spacing of 300-600 nm was typical (Fig. 6g,h). Type II interactions between CD4 and CD8 T cells were common across the MIS, without evidence of a nearby antigen presenting cell (e.g., dendritic cell), making this an atypical interaction with respect to current understanding of T cell biology. In the conventional mode, APCs present antigens to both CD4 and CD8 T cells, with the CD4 helper cells enhancing the cytotoxicity of CD8 cells via cytokine production.
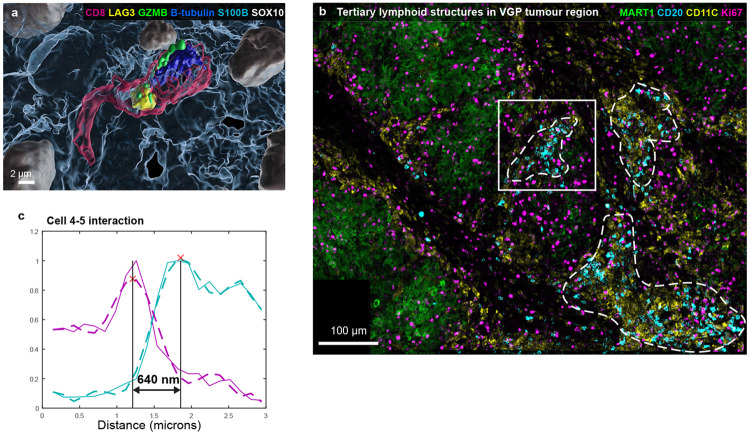
A third form of cell-cell interaction involved an intermembrane spacing of ~500 nm but only along a small area of the membrane (1-2 μm2); such interactions could involve 100 or more immune cells, a pattern we have described previously as lymphocyte networks (lymphonets)6. We observed lymphonets comprised primarily of CD4 T cells or CD8 T cells, dendritic cells, and mixtures thereof (Fig. 6i-l, Extended Data Fig. 6b). Lymphonets did not contain CD4+ FOXP3+ regulatory T cells, which were most commonly involved in Type I interactions (Fig. 6k), or tissue-resident macrophages, which uniformly distributed across the dermis. Type III interactions among T, B, and dendritic cells were also observed in VGP melanoma (Fig. 6l) and likely represent nascent tertiary lymphoid structures (TLS), which have recently been shown to play role in the responsiveness of metastatic melanoma to immunotherapy45.
These three classes of membrane-membrane interaction co-occurred. Figure 6m-n shows a complex set of cell-cell interactions involving a melanocytic cell at the DEJ (cell 1) and 10 immune cells (cells 2-11; Fig. 6o, Supplementary Video 5). In this network, a CD4+ GZMB+ memory T cell (cell 2) formed a Type I contact with a CD8+ LAG3+ CD103+ PD1− memory T cell (cell 3; Fig. 6p) with an estimated membrane-membrane spacing of 30 nm over a 20-30 um2 area (Fig. 6q). Cell 3 made an extended Type II contact with another memory CD8+ CD103+ LAG3+ PD1− T cell (cell 5; 150 nm spacing Fig. 6r). Cell 4 and 5 engaged in a spatially restricted Type III interaction (640 nm spacing; Extended Data Fig. 6c). CD4 T cell 2 also engaged in Type II contact with a melanocytic cell (1; 690 nm spacing; Fig. 6s,t). The two cells were proximate over a much larger area, but we judged the 1.1 μm spacing to be a consequence of tissue packing rather than interaction (Fig. 6u). Elsewhere in the network, Type I interactions were observed between CD4 T cell 5 and a dendritic cell (cell 6) and cell 6 and a CD4 TREG cell (cell 8); finally, a CD8+ network (cells 9-11) extended in an epidermal direction (Fig. 6o). The distinctions among types of membrane interaction were not always unambiguous and, given the dynamic nature of cell-cell communication, different interaction classes may represent different points in the time of evolution of a common structure. Regardless, our data show that immune cells can form complex simultaneous associations with cells of different types including those known to send both positive and negative signals to cytotoxic T cells.
Conclusions
Traditional 5 μm tissue sections contain few if any intact cells and this substantially interferes with detailed phenotyping of tightly packed tissues. However, increasing thickness to 30-40 μm enables intact cells to be studied while retaining compatibility with conventional high-resolution confocal microscopy. Under these circumstances, neighbourhood analysis can be based on interaction of juxtaposed membranes rather than nuclear position. Because high resolution imaging is inherently 3D, thick section tissue imaging makes it possible to study intracellular organelles, condensates, cytoskeletal structures, receptor-ligand complexes (including targets of therapeutic drugs), networks of filipodia and dendrites, changes in cell adhesion, and precise protein distributions in diverse cell types and tissues. These are processes that have hitherto been amenable to study primarily in cultured cells.
Precise 3D phenotyping of tumour and immune cells provides new insight into cancer initiation and immunosurveillance. Melanocytic cells in MIS expressed every possible combination of the six lineage and epigenetic markers we assayed, implying a high degree of plasticity in morphology and cell state. Plasticity is well-described in late-stage melanoma and cell lines46, but our data suggest it is also a feature of early stage disease. One state missing from our primary melanomas but present in metastases is an NGFR-high state, which has been described as neural crest (stem-like) and tumour-initiating. Thus, high cell plasticity may precede the appearance of stem-like states rather than derive from them. T cells are also found in a wide range of states, with overlap between precursor, effector, and memory subtypes. This implies branched rather than linear development, with phenotypic plasticity. Moreover, we find that individual immune cells are often subject to opposing regulatory signals: a single cytotoxic GZMB+ CD8 T cell can be polarized toward a tumour cell, enveloped by filipodia from a CD4 helper cell, and repressed by a PDL1-expresing myeloid cell. Lineage plasticity overlaps (but not obviously correlates) with spatially restricted inflammatory domains, which are often only a few cell diameters wide. Spatially restricted cytokine signalling is predicted by mathematical models of cytokine production and uptake under conditions of high consumption47.
Thick section 3D imaging can be performed using a variety of confocal microscopes on diverse archival human tumours. An important next step will be linking cell and tissue morphologies visible in high resolution 3D images to specific functions. This will likely involve pairing high-plex imaging of tissues with cell cultures or mouse models subjected to perturbational experiments. Immune cell states distinguishable by imaging also need to be mapped to single-cell transcriptional states. We envision using thick-section high-plex imaging in combination with large-scale serial section reconstruction48,49 or light sheet microscopy50 to provide broader tissue context. However, high plex 3D imaging is likely to remain a complement rather than a replacement for simpler 2D methods. In particular, 3D data can serve as a ground truth for training computational models able to discriminate otherwise ambiguous states in 2D images and correct for limitations in 2D images that might confound accurate biological interpretation.
Extended Data
Extended Data Figure 1: Demonstrating the need for thick tissue sections using 3D CyCIF.
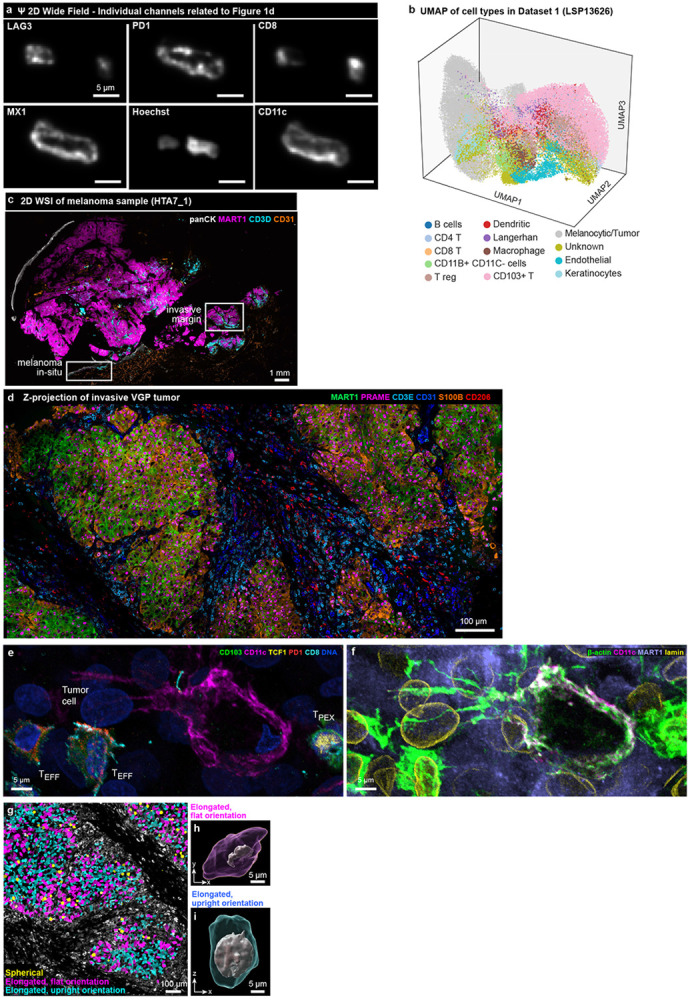
a, Individual channels of simulated Ψ 2D widefield (10x/0.45), see Figure 1d for composite image. b, UMAP rendering of all cell types analysed in Dataset 1 (LSP13626). See Supplementary Figure 12 for flow chart of cell type classifications. c, 2D CyCIF whole slide image of adjacent section of the primary melanoma sample HTA7_1. White squares indicate the regions of melanoma in-situ (MIS) and the invasive vertical growth phase (VGP) melanoma where high-resolution 3D CyCIF was performed. Marker colours as indicated. Scale bar 1 mm. d, Maximum projection of the region of the invasive margin imaged with 3D CyCIF of Dataset 1 (LSP13626), showing a subset (6) of the total 54 markers. Image corresponds to right ROI indicated in (c). Scale bar 100 μm. e,f, Dendritic cell from Figure 1j with additional markers highlighting T cell subtypes (e) and the dense neighbourhood of tumour cells (f). g, Mask plots overlaid on the vertical growth phase melanoma region, highlighting spherical cells in yellow and elongated cells in magenta and cyan. Scale bar, 100 μm. h,i, Surface renderings of selected cells from g.
Extended Data Figure 2: Visualizing complex organelle and cell-surface morphologies.
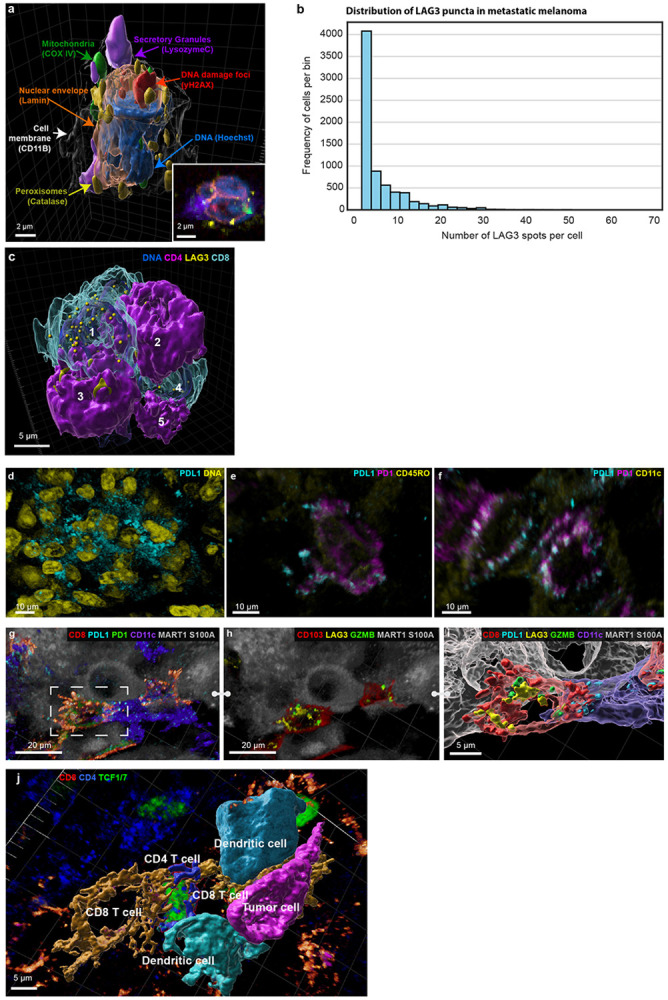
a, 3D rendering of a neutrophil with organelles shown. b, Histogram displaying the frequency distribution of LAG3 spots per cell. The x-axis represents the number of LAG3 spots identified within individual cells, and the y-axis indicates the frequency of cells corresponding to each LAG3 spot count. c, Surface rendering of five immune cells involving Type II interactions among three CD4+ helper T cells (magenta-opaque) and two CD8+ T cells (cyan-translucent), identical to Figure 2m but with transparency reversed. Also shown, punctate LAG3 (yellow) on the membranes of CD8+ T cells. d-f, Volumetric renderings showing PD1 and PDL1 can manifest as different morphologies within the same sample (Dataset 3 - LSP22409). d, diffused PDL1. e, diffused PD1 and punctate PDL1 within the same immune cell. f, colocalization of punctate PD1 and PDL1 within the same dendritic cells. g, Activated CD8+ T cell with long filopodia (red) and dendritic cell (purple) interacting with a tumour cell. Note: This is a different cell community from those shown in Figure 2p-r. h, Same cells as (g) with GZMB and LAG3 shown, highlighting that the T cell is not only activated but cytotoxic too. i, surface rendering of interactions in (g) and (h), showing the filopodia in greater detail. j, 3D rendering of cells highlighted in the multicellular interactions in Figure 2s-t.
Extended Data Figure 3: Visualizing multi-cellular structures, cell shape, and motility in native tissue.
a, Surface rendering of 5-micron virtual sections of a blood vessel segment at an angled view (top) and a top view (bottom). See Figure 3a for full vessel from 35-micron thick tissue. Scale bar 10 μm. b, Surface rendering of B cell undergoing diapedesis. B cell (yellow) with elongated nuclei (purple), passing through a blood vessel (green). Scale bar 5 μm. c, T cell inside vessel, shown as a rendering (top) and as a 2D maximum intensity projection (bottom). d, B cells in the VGP dermis with a characteristic rounded morphology.
Extended Data Figure 4: Actin morphologies in tumour and immune cells in the MIS.
a, Three immune cells as a surface rendering with cortical actin shown in red and immune marker in grey (top) and as a maximum projection (bottom). Scale bar, 5 μm. b-d, Examples of nuclear actin in melanocytic cells. b, Maximum projection of MART1+ melanocytic cells (blue) with nuclear actin rods (red-to-yellow heatmap). Nuclei shown in green. Scale bar 5 μm. c, Surface rendering melanocytic cell nuclei (blue) containing actin rods, with individual actin rods indicated with assorted colours. Scalebar 5 μm. d, Colour overlay of melanocytic cells containing nuclear actin rods (red) on maximum projection of MART1 (grey). Scale bar 100 μm.
Extended Data Figure 5: Spatial analysis of IFN-rich domains and distinct T cell lineages.
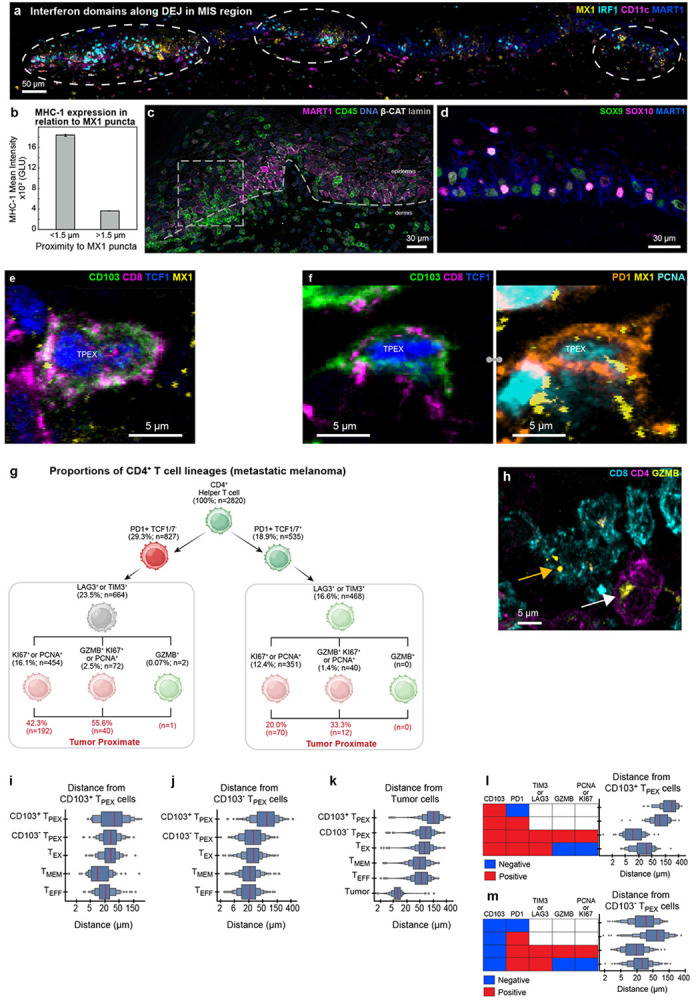
a, 2D CyCIF image of the MIS showing the correlation between pockets of MX1 (yellow) and IRF1 (cyan) along the dermal epidermal junction (dark blue). Dendritic cells shown in purple. Scale bar 50 μm. b, Quantification of MHC-1 expression in Gray Level Units (GLU) <1.5 μm (proximal) or >1.5 μm (distant) from an MX1 punctum in the DEJ of an independent dataset (dataset 1; LSP13626). Error bar indicates STD. c, Five selected channels from 42-plex CyCIF image of MIS in dataset 2. DEJ denoted by white dashed lines. White dashed rectangle is enlarged in Figure 5c and exemplifies CD45+ immune cells (green) breaking through the DEJ into the epidermis. Scale bar 30 μm. d, Maximum projection of MIS region showing combinations and variability of SOX10 (magenta) and SOX9 (green) expression in melanocytic cells (MART1 – blue). Scale bar 30 μm. e,f, Two examples of maximum projections of TCF1+ TPEX cells, showing non-proliferation (e) and proliferation via PCNA staining (f). Scale bar 5 μm. g, Hierarchical tree diagram showing proportions of CD4+ T cell sub-lineages in the metastatic melanoma sample. Red values indicate the percentage of cells in the associated state that are next to tumour cells. h, Comparison of GZMB morphology within a CD8 T cell (yellow arrow) and CD4 T cell (white arrow) in the MIS. i-m Boxen plots of cell proximity in metastatic melanoma. Each box in a boxen plot represents a quantile range, progressively detailing the distribution from the median outwards to the extremes. Red boxes indicate cells positive for the given marker, blue indicate cells negative for the given marker, white indicate markers that were not used for selection. i,j, The distribution of the shortest distance between CD103+ (i) and CD103− (j) TPEX cells with other T cell subpopulations. k, The distribution of the shortest distance between tumour cells and T cell subpopulations. l,m, The distribution of the shortest distance between CD103+ (l) and CD103− (m) TPEX cells with subclasses of TMEM populations, with activity states indicated by the marker patterns on the left.
Extended Data Figure 6: Cell-cell interactions and multivalent immune cell niches.
a, Surface rendering of Fig. 6e. b, Maximum projection of tertiary lymphoid structures in the VGP tumour region. Dashed lines demarcate colonies of CD20+ B cells (cyan) mixed with CD11C+ dendritic cells (yellow). White box indicates zoom in version found in Figure 6l. Scale bar 100 μm. c, A line integral plot depicting CD4 (cyan) and CD8 (magenta) average expression across membranes of cells 4 (CD8 T cell) and 5 (CD4 T cell) from Figure 6p. Solid lines from raw data, dashed lines are from polynomial curve fitting. Red ‘X’s mark the maximum intensity along line integral and denotes the boundary of the cell membrane for each channel.
Extended Data Figure 7. Recurrent cellular neighbourhoods, identified by applying spatial latent Dirichlet allocation (LDA) to 2D projections of 3D data.
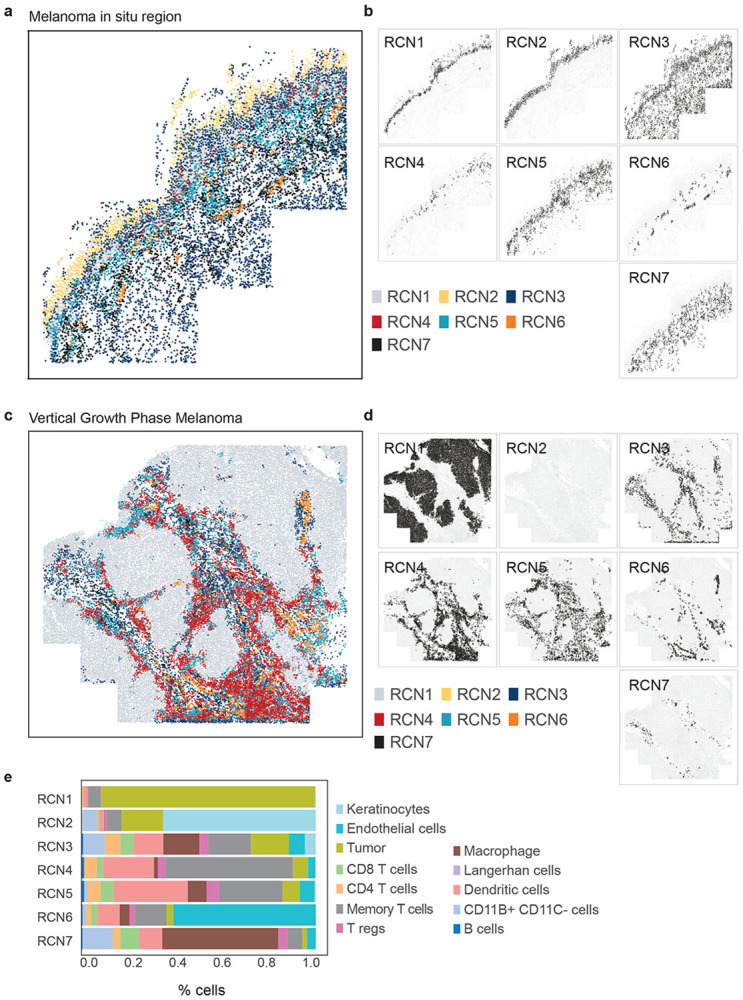
a, Scatter plot showing the MIS region. Cells are coloured based on their recurrent cellular neighbourhoods (RCN1–7). b, Scatter plot highlighting the distribution of each RCN in the MIS region of tissue. c, Scatter plot showing the invasive region of vertical growth phase melanoma. Cells are coloured based on the RCN to which they belong. d, Scatter plot highlighting the distribution of each RCN in the invasive region of tissue. e, Bar plot depicting the proportion of different cell-types within each RCN.
Supplementary Material
Supplementary Table 1: Definitions of all protein abbreviations.
Supplementary Table 2: Sample metadata and HTAN identifiers.
Supplementary Table 3: CyCIF antibody panel used for LSP13626 MIS and VGP datasets, the first serial section from a patient with cutaneous melanoma.
Supplementary Table 4: CyCIF antibody panel used for LSP13625 MIS and VGP datasets, the first serial section from a patient with cutaneous melanoma.
Supplementary Table 5: CyCIF antibody panel used for metastatic melanoma (LSP22409 / WD-100476).
Supplementary Table 6: An index of which figure panels relate to which datasets.
Supplementary Video 1: Surface rendering of Hoechst stained 5 and 35-micron thick serial sections from primary melanoma. 3D rendering from Bitplane Imaris 10.0.
Supplementary Video 2: Surface rendering of an intact blood vessel (green) from the MIS region with B cell (yellow), red blood cell (red), and neutrophil (pink). 3D rendering from Bitplane Imaris 10.0.
Supplementary Video 3: Volumetric rendering of packed tumour cells from the invasive margin. Rendering from Bitplane Imaris 10.0. Marker colours as indicated.
Supplementary Video 4: Surface rendering of CD4 (magenta) and CD8 (blue) positive T cells with LAG3 (yellow spheres), MX1 (green sphere), and GZMB (yellow blobs). Rendering from Bitplane Imaris 10.0.
Supplementary Video 5: Surface rendering of 1 melanocytic cell (green) and 10 interacting immune cells comprising of CD4 T cells (blue), CD8 T cells (magenta), and dendritic cells (yellow) from the MIS region. Rendering from Bitplane Imaris 10.0.
Acknowledgements
We thank T. Kupper, D. Liu, and J. Agudo for scientific advice, A. Chen, S. Chan, J. Muhlich, and J, Hoffer for help with data analysis, N. Ghelenborg and E. Moerth for pre-publication access to a 3D Vitesse data viewer, J Lian for model training, and J Appelt for tissue integrity studies. We thank the MicRoN core facility at HMS and G. Guimaraes, T. Desai, and S. Fore from Carl Zeiss Inc. for providing access to an LSM980 Airyscan 2 microscope.
Funding
This work was supported by Ludwig Cancer Research and the Ludwig Center at Harvard (P.K.S., S.S.) and by NCI grant U2C-CA233262 (P.K.S., S.S.), R00CA256497 (A.J.N.), Research Specialist Award R50-CA252138 (Z.M.) and CCBIR grant U54-CA268072 (G.D., P.K.S and S.S.). Histopathology was supported by P30-CA06516. Development of computational methods and image processing software is supported by a Team Science Grant from the Gray Foundation (P.K.S., S.S.), the Gates Foundation grant INV-027106 (P.K.S.), the David Liposarcoma Research Initiative at DFCI supported by KBF Canada via the Rossy Foundation Fund (P.K.S., S.S.), and the Emerson Collective (P.K.S.). S.S. is supported by the BWH President’s Scholars Award.
Footnotes
Competing Interests
PKS is a co-founder and member of the BOD of Glencoe Software, member of the BOD for Applied Biomath, and member of the SAB for RareCyte, NanoString, Reverb Therapeutics and Montai Health; he holds equity in Glencoe, Applied Biomath, and RareCyte. PKS consults for Merck and the Sorger lab has received research funding from Novartis and Merck in the past five years. The other authors declare no outside interests.
Materials & Correspondence
All materials associated with this study are available through commercial vendors. Please contact Peter Sorger (peter_sorger@hms.harvard.edu) with any additional requests.
Data Availability (At time of publication)
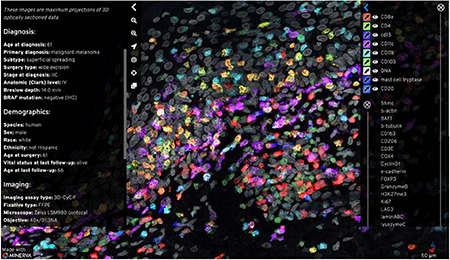
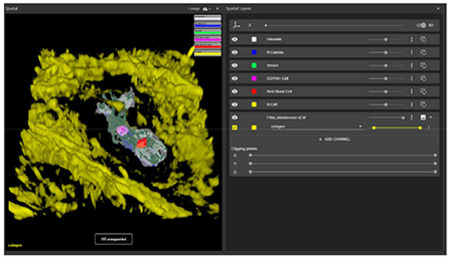
All images and derived data (~3 TB) are available without restriction via the NCI Human Tumor Atlas Network Portal (data.humantumoratlas.org/). The Human Tumor Atlas Network participant (specimen) ID numbers are listed in Supplementary Table 2. All other data supporting the findings of this study are available via an index page on GitHub that has been archived on Zenodo (doi.org/10.5281/zenodo.10055593). To see a 2D maximum projection of a subset of this data in the MINERVA in-browser viewer (no download required), please go to www.tissue-atlas.org/mel-3d-mis-2 (see screenshot, below). See https://www.minerva.im/ for more information on how to use the MINERVA viewer. We are also implementing 3D interactive viewing of data from specific figure panels within the browser-based tool Vitessce51,52 (http://vitessce.io/). Links to figures panels 3a, 3d, and 6n can be accessed at the links below (see second screenshot, below for example of figure 3a). This is a work in progress that should be ready by time of publication and combines primary data with surface meshes.
Figure 3a - http://beta-3d.vitessce.io/?dataset=Figure3a_blood_vessel
Figure 3d - http://beta-3d.vitessce.io/?dataset=Figure3d_tumor_cytoskeleton
Figure 6n - http://beta-3d.vitessce.io/?dataset=Figure6n_cell_community
Code Availability
Original code associated with this paper is available on GitHub (github.com/labsyspharm/mel-3d-mis) and Zenodo (doi.org/10.5281/zenodo.10055593).
References
- 1.Hickey J. W. et al. Spatial mapping of protein composition and tissue organization: a primer for multiplexed antibody-based imaging. Preprint at http://arxiv.org/abs/2107.07953 (2021). [DOI] [PMC free article] [PubMed] [Google Scholar]
- 2.Slaoui M. & Fiette L. Histopathology procedures: from tissue sampling to histopathological evaluation. Methods Mol Biol 691, 69–82 (2011). [DOI] [PubMed] [Google Scholar]
- 3.Prasad A. & Alizadeh E. Cell Form and Function: Interpreting and Controlling the Shape of Adherent Cells. Trends Biotechnol 37, 347–357 (2019). [DOI] [PubMed] [Google Scholar]
- 4.Lin J.-R. et al. Highly multiplexed immunofluorescence imaging of human tissues and tumors using t-CyCIF and conventional optical microscopes. eLife 7, (2018). [DOI] [PMC free article] [PubMed] [Google Scholar]
- 5.Clark W. H. et al. A study of tumor progression: The precursor lesions of superficial spreading and nodular melanoma. Human Pathology 15, 1147–1165 (1984). [DOI] [PubMed] [Google Scholar]
- 6.Gaglia G. et al. Lymphocyte networks are dynamic cellular communities in the immunoregulatory landscape of lung adenocarcinoma. Cancer Cell 41, 871–886.e10 (2023). [DOI] [PMC free article] [PubMed] [Google Scholar]
- 7.Kapałczyńska M. et al. 2D and 3D cell cultures - a comparison of different types of cancer cell cultures. Arch Med Sci 14, 910–919 (2018). [DOI] [PMC free article] [PubMed] [Google Scholar]
- 8.Rao A., Barkley D., França G. S. & Yanai I. Exploring tissue architecture using spatial transcriptomics. Nature 596, 211–220 (2021). [DOI] [PMC free article] [PubMed] [Google Scholar]
- 9.Herman B. & Lemasters J. J. Optical Microscopy: Emerging Methods and Applications. (Elsevier, 2012). [Google Scholar]
- 10.Du Z. et al. Qualifying antibodies for image-based immune profiling and multiplexed tissue imaging. Nat Protoc 14, 2900–2930 (2019). [DOI] [PMC free article] [PubMed] [Google Scholar]
- 11.Wu Y., Pegoraro A. F., Weitz D. A., Janmey P. & Sun S. X. The correlation between cell and nucleus size is explained by an eukaryotic cell growth model. PLoS Comput Biol 18, e1009400 (2022). [DOI] [PMC free article] [PubMed] [Google Scholar]
- 12.Benvenuti F. et al. Requirement of Rac1 and Rac2 Expression by Mature Dendritic Cells for T Cell Priming. Science 305, 1150–1153 (2004). [DOI] [PubMed] [Google Scholar]
- 13.Blauth E., Kubitschke H., Gottheil P., Grosser S. & Käs J. A. Jamming in Embryogenesis and Cancer Progression. Frontiers in Physics 9, (2021). [Google Scholar]
- 14.Chen H., Li D. & Bar-Joseph Z. SCS: cell segmentation for high-resolution spatial transcriptomics. Nat Methods 20, 1237–1243 (2023). [DOI] [PubMed] [Google Scholar]
- 15.Sehgal P. B. et al. Murine GFP-Mx1 forms nuclear condensates and associates with cytoplasmic intermediate filaments: Novel antiviral activity against VSV. J Biol Chem 295, 18023–18035 (2021). [DOI] [PMC free article] [PubMed] [Google Scholar]
- 16.Woo S.-R. et al. Differential subcellular localization of the regulatory T-cell protein LAG-3 and the coreceptor CD4. Eur J Immunol 40, 1768–1777 (2010). [DOI] [PMC free article] [PubMed] [Google Scholar]
- 17.Lin L. et al. Granzyme B secretion by human memory CD4 T cells is less strictly regulated compared to memory CD8 T cells. BMC Immunol 15, 36 (2014). [DOI] [PMC free article] [PubMed] [Google Scholar]
- 18.Nirmal A. J. et al. The Spatial Landscape of Progression and Immunoediting in Primary Melanoma at Single-Cell Resolution. Cancer Discovery 12, 1518–1541 (2022). [DOI] [PMC free article] [PubMed] [Google Scholar]
- 19.Muller W. A. Getting Leukocytes to the Site of Inflammation. Vet Pathol 50, 7–22 (2013). [DOI] [PMC free article] [PubMed] [Google Scholar]
- 20.Van Goethem E., Poincloux R., Gauffre F., Maridonneau-Parini I. & Le Cabec V. Matrix Architecture Dictates Three-Dimensional Migration Modes of Human Macrophages: Differential Involvement of Proteases and Podosome-Like Structures. The Journal of Immunology 184, 1049–1061 (2010). [DOI] [PubMed] [Google Scholar]
- 21.Kuczek D. E. et al. Collagen density regulates the activity of tumor-infiltrating T cells. j. immunotherapy cancer 7, 68 (2019). [DOI] [PMC free article] [PubMed] [Google Scholar]
- 22.Willsmore Z. N. et al. B Cells in Patients With Melanoma: Implications for Treatment With Checkpoint Inhibitor Antibodies. Front Immunol 11, 622442 (2021). [DOI] [PMC free article] [PubMed] [Google Scholar]
- 23.Yamaguchi H. & Condeelis J. Regulation of the actin cytoskeleton in cancer cell migration and invasion. Biochimica et Biophysica Acta (BBA) - Molecular Cell Research 1773, 642–652 (2007). [DOI] [PMC free article] [PubMed] [Google Scholar]
- 24.Caridi C. P., Plessner M., Grosse R. & Chiolo I. Nuclear actin filaments in DNA repair dynamics. Nat Cell Biol 21, 1068–1077 (2019). [DOI] [PMC free article] [PubMed] [Google Scholar]
- 25.Rickelt S. et al. Subtypes of melanocytes and melanoma cells distinguished by their intercellular contacts: heterotypic adherens junctions, adhesive associations, and dispersed desmoglein 2 glycoproteins. Cell Tissue Res 334, 401–422 (2008). [DOI] [PubMed] [Google Scholar]
- 26.Foty R. A. & Steinberg M. S. The differential adhesion hypothesis: a direct evaluation. Dev Biol 278, 255–263 (2005). [DOI] [PubMed] [Google Scholar]
- 27.Wu Y. & Zhou B. P. Inflammation: a driving force speeds cancer metastasis. Cell Cycle 8, 3267–3273 (2009). [DOI] [PMC free article] [PubMed] [Google Scholar]
- 28.Hodis E. et al. A Landscape of Driver Mutations in Melanoma. Cell 150, 251–263 (2012). [DOI] [PMC free article] [PubMed] [Google Scholar]
- 29.Jackett L. A. & Scolyer R. A. A Review of Key Biological and Molecular Events Underpinning Transformation of Melanocytes to Primary and Metastatic Melanoma. Cancers (Basel) 11, 2041 (2019). [DOI] [PMC free article] [PubMed] [Google Scholar]
- 30.Lian C. G. et al. LOSS OF 5-HYDROXYMETHYLCYTOSINE IS AN EPIGENETIC HALLMARK OF MELANOMA. Cell 150, 1135–1146 (2012). [DOI] [PMC free article] [PubMed] [Google Scholar]
- 31.Smoller B. R. Histologic criteria for diagnosing primary cutaneous malignant melanoma. Mod Pathol 19, S34–S40 (2006). [DOI] [PubMed] [Google Scholar]
- 32.Lezcano C., Jungbluth A. A., Nehal K. S., Hollmann T. J. & Busam K. J. PRAME Expression in Melanocytic Tumors. Am J Surg Pathol 42, 1456–1465 (2018). [DOI] [PMC free article] [PubMed] [Google Scholar]
- 33.Chudnovsky Y., Khavari P. A. & Adams A. E. Melanoma genetics and the development of rational therapeutics. J Clin Invest 115, 813–824 (2005). [DOI] [PMC free article] [PubMed] [Google Scholar]
- 34.Kaufmann C. et al. The role of cyclin D1 and Ki-67 in the development and prognostication of thin melanoma. Histopathology 77, 460–470 (2020). [DOI] [PMC free article] [PubMed] [Google Scholar]
- 35.Fetsch P. A. et al. Melanoma-associated antigen recognized by T cells (MART-1): the advent of a preferred immunocytochemical antibody for the diagnosis of metastatic malignant melanoma with fine-needle aspiration. Cancer 87, 37–42 (1999). [PubMed] [Google Scholar]
- 36.Boiko A. D. et al. Human melanoma-initiating cells express neural crest nerve growth factor receptor CD271. Nature 466, 133–137 (2010). [DOI] [PMC free article] [PubMed] [Google Scholar]
- 37.Kim Y. J. et al. Melanoma dedifferentiation induced by IFN-γ epigenetic remodeling in response to anti-PD-1 therapy. J Clin Invest 131, e145859, 145859 (2021). [DOI] [PMC free article] [PubMed] [Google Scholar]
- 38.Watanabe R. et al. Human skin is protected by four functionally and phenotypically discrete populations of resident and recirculating memory T cells. Sci Transl Med 7, 279ra39 (2015). [DOI] [PMC free article] [PubMed] [Google Scholar]
- 39.Utzschneider D. T. et al. Early precursor T cells establish and propagate T cell exhaustion in chronic infection. Nat Immunol 21, 1256–1266 (2020). [DOI] [PubMed] [Google Scholar]
- 40.Burger M. L. et al. Antigen dominance hierarchies shape TCF1+ progenitor CD8 T cell phenotypes in tumors. Cell 184, 4996–5014.e26 (2021). [DOI] [PMC free article] [PubMed] [Google Scholar]
- 41.Miller B. C. et al. Subsets of exhausted CD8+ T cells differentially mediate tumor control and respond to checkpoint blockade. Nat Immunol 20, 326–336 (2019). [DOI] [PMC free article] [PubMed] [Google Scholar]
- 42.Kallies A., Zehn D. & Utzschneider D. T. Precursor exhausted T cells: key to successful immunotherapy? Nat Rev Immunol 20, 128–136 (2020). [DOI] [PubMed] [Google Scholar]
- 43.Escobar G., Mangani D. & Anderson A. C. T cell factor 1 (Tcf1): a master regulator of the T cell response in disease. Sci Immunol 5, eabb9726 (2020). [DOI] [PMC free article] [PubMed] [Google Scholar]
- 44.Dustin M. L. The immunological synapse. Cancer Immunol Res 2, 1023–1033 (2014). [DOI] [PMC free article] [PubMed] [Google Scholar]
- 45.Cabrita R. et al. Tertiary lymphoid structures improve immunotherapy and survival in melanoma. Nature 577, 561–565 (2020). [DOI] [PubMed] [Google Scholar]
- 46.Huang F., Santinon F., Flores González R. E. & del Rincón S. V. Melanoma Plasticity: Promoter of Metastasis and Resistance to Therapy. Front Oncol 11, 756001 (2021). [DOI] [PMC free article] [PubMed] [Google Scholar]
- 47.Oyler-Yaniv A. et al. A Tunable Diffusion-Consumption Mechanism of Cytokine Propagation Enables Plasticity in Cell-to-Cell Communication in the Immune System. Immunity 46, 609–620 (2017). [DOI] [PMC free article] [PubMed] [Google Scholar]
- 48.Kiemen A. et al. CODA: Quantitative 3D reconstruction of large tissues at cellular resolution. Nat Methods 19, 1490–1499 (2022). [DOI] [PMC free article] [PubMed] [Google Scholar]
- 49.Lin J.-R. et al. Multiplexed 3D atlas of state transitions and immune interaction in colorectal cancer. Cell 186, 363–381.e19 (2023). [DOI] [PMC free article] [PubMed] [Google Scholar]
- 50.Stelzer E. H. K. et al. Light sheet fluorescence microscopy. Nat Rev Methods Primers 1, 1–25 (2021). [Google Scholar]
- 51.Keller M. S. et al. Vitessce: integrative visualization of multimodal and spatially-resolved single-cell data. Preprint at 10.31219/osf.io/y8thv (2021). [DOI] [PubMed] [Google Scholar]
- 52.Manz T. et al. Viv: multiscale visualization of high-resolution multiplexed bioimaging data on the web. Nat Methods 19, 515–516 (2022). [DOI] [PMC free article] [PubMed] [Google Scholar]
- 53.Wallace W., Schaefer L. H. & Swedlow J. R. A Workingperson’s Guide to Deconvolution in Light Microscopy. BioTechniques 31, 1076–1097 (2001). [DOI] [PubMed] [Google Scholar]
- 54.Fish K. N. Total Internal Reflection Fluorescence (TIRF) Microscopy. CP Cytometry 50, (2009). [DOI] [PMC free article] [PubMed] [Google Scholar]
- 55.Axelrod D., Thompson N. L. & Burghardt T. P. Total internal reflection fluorescent microscopy. Journal of Microscopy 129, 19–28 (1983). [DOI] [PubMed] [Google Scholar]
- 56.Egger M. D. & Petráň M. New Reflected-Light Microscope for Viewing Unstained Brain and Ganglion Cells. Science 157, 305–307 (1967). [DOI] [PubMed] [Google Scholar]
- 57.Wilson T. Resolution and optical sectioning in the confocal microscope: PROPERTIES OF THE FLUORESCENT CONFOCAL MICROSCOPE. Journal of Microscopy 244, 113–121 (2011). [DOI] [PubMed] [Google Scholar]
- 58.Wilson T. Optical sectioning in confocal fluorescent microscopes. Journal of Microscopy 154, 143–156 (1989). [Google Scholar]
- 59.Murray J. M., Appleton P. L., Swedlow J. R. & Waters J. C. Evaluating performance in three-dimensional fluorescence microscopy. J Microsc 228, 390–405 (2007). [DOI] [PMC free article] [PubMed] [Google Scholar]
- 60.Denk W., Strickler J. H. & Webb W. W. Two-Photon Laser Scanning Fluorescence Microscopy. Science 248, 73–76 (1990). [DOI] [PubMed] [Google Scholar]
- 61.Campagnola P. J. et al. Three-Dimensional High-Resolution Second-Harmonic Generation Imaging of Endogenous Structural Proteins in Biological Tissues. Biophysical Journal 82, 493–508 (2002). [DOI] [PMC free article] [PubMed] [Google Scholar]
- 62.Campagnola P. J., Wei M., Lewis A. & Loew L. M. High-Resolution Nonlinear Optical Imaging of Live Cells by Second Harmonic Generation. Biophysical Journal 77, 3341–3349 (1999). [DOI] [PMC free article] [PubMed] [Google Scholar]
- 63.Zipfel W. R. et al. Live tissue intrinsic emission microscopy using multiphoton-excited native fluorescence and second harmonic generation. Proc. Natl. Acad. Sci. U.S.A. 100, 7075–7080 (2003). [DOI] [PMC free article] [PubMed] [Google Scholar]
- 64.Ghose S. et al. Human Digital Twin: Automated Cell Type Distance Computation and 3D Atlas Construction in Multiplexed Skin Biopsies. http://biorxiv.org/lookup/doi/10.1101/2022.03.30.486438 (2022) doi: 10.1101/2022.03.30.486438. [DOI] [Google Scholar]
- 65.Kuett L. et al. Three-dimensional imaging mass cytometry for highly multiplexed molecular and cellular mapping of tissues and the tumor microenvironment. Nat Cancer 3, 122–133 (2022). [DOI] [PMC free article] [PubMed] [Google Scholar]
- 66.Ghose S. et al. 3D reconstruction of skin and spatial mapping of immune cell density, vascular distance and effects of sun exposure and aging. Commun Biol 6, 718 (2023). [DOI] [PMC free article] [PubMed] [Google Scholar]
- 67.Renier N. et al. iDISCO: A Simple, Rapid Method to Immunolabel Large Tissue Samples for Volume Imaging. Cell 159, 896–910 (2014). [DOI] [PubMed] [Google Scholar]
- 68.Tomer R., Ye L., Hsueh B. & Deisseroth K. Advanced CLARITY for rapid and high-resolution imaging of intact tissues. Nat Protoc 9, 1682–1697 (2014). [DOI] [PMC free article] [PubMed] [Google Scholar]
- 69.Tanaka N. et al. Whole-tissue biopsy phenotyping of three-dimensional tumours reveals patterns of cancer heterogeneity. Nat Biomed Eng 1, 796–806 (2017). [DOI] [PubMed] [Google Scholar]
- 70.Murray E. et al. Simple, Scalable Proteomic Imaging for High-Dimensional Profiling of Intact Systems. Cell 163, 1500–1514 (2015). [DOI] [PMC free article] [PubMed] [Google Scholar]
- 71.Chen B.-C. et al. Lattice light-sheet microscopy: Imaging molecules to embryos at high spatiotemporal resolution. Science 346, 1257998 (2014). [DOI] [PMC free article] [PubMed] [Google Scholar]
- 72.Dean K. M., Roudot P., Welf E. S., Danuser G. & Fiolka R. Deconvolution-free Subcellular Imaging with Axially Swept Light Sheet Microscopy. Biophysical Journal 108, 2807–2815 (2015). [DOI] [PMC free article] [PubMed] [Google Scholar]
- 73.Scholaert M. et al. 3-D Deconvolution of Human Skin Immune Architecture with Multiplex Annotated Tissue Imaging System (MANTIS). http://biorxiv.org/lookup/doi/10.1101/2023.01.13.523748 (2023) doi: 10.1101/2023.01.13.523748. [DOI] [PMC free article] [PubMed] [Google Scholar]
- 74.Van Ineveld R. L. et al. Revealing the spatio-phenotypic patterning of cells in healthy and tumor tissues with mLSR-3D and STAPL-3D. Nat Biotechnol 39, 1239–1245 (2021). [DOI] [PMC free article] [PubMed] [Google Scholar]
- 75.Shi L., Wei M. & Min W. Highly-Multiplexed Tissue Imaging with Raman Dyes. JoVE 63547 (2022) doi: 10.3791/63547. [DOI] [PubMed] [Google Scholar]
- 76.Lin J.-R. et al. Highly multiplexed immunofluorescence imaging of human tissues and tumors using t-CyCIF and conventional optical microscopes. eLife 7, e31657 (2018). [DOI] [PMC free article] [PubMed] [Google Scholar]
- 77.Stringer C., Wang T., Michaelos M. & Pachitariu M. Cellpose: a generalist algorithm for cellular segmentation. Nat Methods 18, 100–106 (2021). [DOI] [PubMed] [Google Scholar]
- 78.Zhou D., Bousquet O., Lal T., Weston J. & Schölkopf B. Learning with Local and Global Consistency. in Advances in Neural Information Processing Systems (eds. Thrun S., Saul L. & Schölkopf B.) vol. 16 (MIT Press, 2003). [Google Scholar]
Associated Data
This section collects any data citations, data availability statements, or supplementary materials included in this article.
Supplementary Materials
Supplementary Table 1: Definitions of all protein abbreviations.
Supplementary Table 2: Sample metadata and HTAN identifiers.
Supplementary Table 3: CyCIF antibody panel used for LSP13626 MIS and VGP datasets, the first serial section from a patient with cutaneous melanoma.
Supplementary Table 4: CyCIF antibody panel used for LSP13625 MIS and VGP datasets, the first serial section from a patient with cutaneous melanoma.
Supplementary Table 5: CyCIF antibody panel used for metastatic melanoma (LSP22409 / WD-100476).
Supplementary Table 6: An index of which figure panels relate to which datasets.
Supplementary Video 1: Surface rendering of Hoechst stained 5 and 35-micron thick serial sections from primary melanoma. 3D rendering from Bitplane Imaris 10.0.
Supplementary Video 2: Surface rendering of an intact blood vessel (green) from the MIS region with B cell (yellow), red blood cell (red), and neutrophil (pink). 3D rendering from Bitplane Imaris 10.0.
Supplementary Video 3: Volumetric rendering of packed tumour cells from the invasive margin. Rendering from Bitplane Imaris 10.0. Marker colours as indicated.
Supplementary Video 4: Surface rendering of CD4 (magenta) and CD8 (blue) positive T cells with LAG3 (yellow spheres), MX1 (green sphere), and GZMB (yellow blobs). Rendering from Bitplane Imaris 10.0.
Supplementary Video 5: Surface rendering of 1 melanocytic cell (green) and 10 interacting immune cells comprising of CD4 T cells (blue), CD8 T cells (magenta), and dendritic cells (yellow) from the MIS region. Rendering from Bitplane Imaris 10.0.
Data Availability Statement
All images and derived data (~3 TB) are available without restriction via the NCI Human Tumor Atlas Network Portal (data.humantumoratlas.org/). The Human Tumor Atlas Network participant (specimen) ID numbers are listed in Supplementary Table 2. All other data supporting the findings of this study are available via an index page on GitHub that has been archived on Zenodo (doi.org/10.5281/zenodo.10055593). To see a 2D maximum projection of a subset of this data in the MINERVA in-browser viewer (no download required), please go to www.tissue-atlas.org/mel-3d-mis-2 (see screenshot, below). See https://www.minerva.im/ for more information on how to use the MINERVA viewer. We are also implementing 3D interactive viewing of data from specific figure panels within the browser-based tool Vitessce51,52 (http://vitessce.io/). Links to figures panels 3a, 3d, and 6n can be accessed at the links below (see second screenshot, below for example of figure 3a). This is a work in progress that should be ready by time of publication and combines primary data with surface meshes.
Figure 3a - http://beta-3d.vitessce.io/?dataset=Figure3a_blood_vessel
Figure 3d - http://beta-3d.vitessce.io/?dataset=Figure3d_tumor_cytoskeleton
Figure 6n - http://beta-3d.vitessce.io/?dataset=Figure6n_cell_community


Original code associated with this paper is available on GitHub (github.com/labsyspharm/mel-3d-mis) and Zenodo (doi.org/10.5281/zenodo.10055593).


