PLOS ONE logoLink to PLOS ONE
. 2023 Nov 30;18(11):e0295055. doi: 10.1371/journal.pone.0295055

A simple method to measure methane emissions from indoor gas leaks

Dominic Nicholas 1,*, Robert Ackley 2, Nathan G Phillips 3
Editor: Yanping Yuan4
PMCID: PMC10688665  PMID: 38032978

Abstract

From wellhead to burner tip, each component of the natural gas process chain has come under increased scrutiny for the presence and magnitude of methane leaks, because of the large global warming potential of methane. Top-down measures of methane emissions in urban areas are significantly greater than bottom-up estimates. Recent research suggests this disparity might in part be explained by gas leaks from one of the least understood parts of the process chain: behind the gas meter in homes and buildings. However, little research has been performed in this area and few methods and data sets exist to measure or estimate them. We develop and test a simple and widely deployable closed chamber method that can be used for quantifying indoor methane emissions with an order-of-magnitude precision which allows for screening of indoor large volume (“super-emitting”) leaks. We also perform test applications of the method finding indoor leaks in 90% of the 20 Greater Boston buildings studied and indoor methane emissions between 0.02–0.51 ft3 CH4 day-1 (0.4–10.3 g CH4 day-1) with a mean of 0.14 ft3 CH4 day-1 (2.8 g CH4 day-1). Our method provides a relatively simple way to scale up indoor methane emissions data collection. Increased data may reduce uncertainty in bottom-up inventories, and can be used to find super-emitting indoor emissions which may better explain the disparity between top-down and bottom-up post-meter emissions estimates.

Introduction

Methane (CH4) is the main component of natural gas (NG) and when leaked uncombusted into the atmosphere is a potent greenhouse gas having 86 times the global warming potential (GWP) of carbon dioxide over the first 20 years [1]. According to the Environmental Protection Agency (EPA) Inventory of U.S. Greenhouse Gas Emissions and Sinks (a national greenhouse gas inventory, or GHGI), methane makes up an estimated 11% of all greenhouse gasses, just over a third of which is attributed to NG and petroleum systems [2]. In urban areas with both high population and NG infrastructure density, studies show the NG distribution system to be one of the largest contributors of methane emissions [37]. Sources of methane emissions within the NG distribution system include metering and regulating stations, transmission pipelines, mains and service pipes, meters and NG appliances behind those meters [8]. Methane emissions can be estimated using top-down and bottom-up approaches. Top-down approaches model emissions from large areas or regions by using atmospheric data gathered from observation towers, aircraft and satellites. Bottom-up approaches measure or estimate methane emissions from collections of individual components in the system and typically involve multiplying the number of components (i.e. activity factors) by the emissions from those components (i.e. emission factors) which in turn can be determined using methods such as flux chambers and whole-building mass balance. A National Academy of Sciences report [9] highlights the need to improve the accuracy and precision of bottom-up methane emission estimates, focusing on areas of the inventory where there is the most uncertainty. The report suggests reasons for these uncertainties such as unaccounted-for sources, temporal and spatial variability of emissions, episodic high-emitting sources and inadequate spatial coverage of observational networks.

Recent studies have found that top-down methane emission inventories in urban areas are significantly greater than bottom-up methane emission inventories [3, 10, 11] and suggest that a potentially significant proportion of this disparity may be explained by post-meter NG methane emissions. Furthermore, studies have also correlated NG emissions with NG consumption [10, 12]. Whilst interest in post-meter emissions has been growing, few studies have been done to estimate or measure post-meter methane emissions. These studies have focused on measuring methane emissions from appliances such as domestic water heaters and stoves [1315] and only one study in 2018 by Fischer et al. [16] measured quiescent whole-house methane emissions. Fischer et al studied 75 single-family owner-occupied California homes and appliances therein using a mass balance method implemented using commercial blower door systems and a portable gas analyzer. Many other buildings of different types, occupancy, age etc. need to be studied to be able to more accurately estimate post-meter emissions. In 2022 the EPA GHGI (a bottom-up methodology) was updated to include post-meter methane emissions for the first time and includes residential, commercial, industrial and power plants and NG vehicles sources. Residential post-meter emissions in this inventory were calculated retroactively for years 1990–2020 (estimates are not provided beyond 2020), using an emission factor based on the Fischer et al whole-house study. Residential post-meter methane emissions in 2020 accounted for 42% (192 kt CH4) of all post-meter emissions. Similarly in 2022, the EPA GHGI post-meter inventory sources were added to the Massachusetts Department of Environmental Protection GHGI [17] also for years 1990–2020, with 2020 post-meter residential methane emissions accounting for 65% (4.5 kt CH4) of all post-meter emissions as calculated using the EPA’s emissions factor. These recent additions emphasize the recognition and importance of post-meter methane emissions inventories and present an opportunity to improve them.

The objective of our study is to develop a method to measure NG methane emissions into the indoors from NG infrastructure and appliances by approximating a room as a closed-system dynamic flux chamber [4, 1820]. We develop air CH4 concentration sampling approaches and flux calculation methods to arrive at a simple method that could be widely deployed. This scaling provides opportunities to improve our temporal and spatial understanding of indoor NG methane emissions across different building types (e.g. multi-family homes, businesses), across a diversity of socioeconomics and geography, and to further explore the super-emitting nature of indoor NG emissions [16, 21, 22].

Materials and methods

Measurements overview

We performed our study in basements with closable doors and windows to the exterior and upper floors of the building as rooms. Basements often contain a large amount of NG infrastructure and appliances and thus where we may expect the majority of NG leakage to be occurring. We explored two methods to measure CH4 emissions into basements: a high frequency intensive sampling room chamber method (“RCM”) and a simplified room chamber method (“bag method”). We used a Picarro GasScouter G4301 Analyzer cavity ring-down spectrometer (“GasScouter”) to collect air CH4 concentration measurements. The GasScouter’s inlet was connected to a tube with an intake at 127 cm from the ground positioning it approximately midway between floor and ceiling indoors. The GasScouter was periodically tested using test gasses (see S9 Appendix section 1). NG appliances were left in their normal operating states. We collected air CH4 concentration measurements from outside of the building to determine an atmospheric CH4 baseline, and from each floor of buildings, with basement rooms opened and measured last to minimize air mixing through basement doorways with upper floors due methane’s buoyant nature. As a preliminary indication of measurable leakage, we tested the methods in basements having an average air CH4 concentration of at least 0.5 ppmv above the outdoor ambient air CH4 concentration (see S2 Appendix section 1). We chose this threshold based on prior experience that a 0.5 ppmv elevation in basement rooms relative to outdoors reliably had leaks and because this study was intended to resolve leaks which have greater significance as contributors to greenhouse gas emissions. The RCM and bag methods do not measure post-meter uncombusted methane emissions that may reach the outside of the building through other potential pathways such as flues, for which methods should also be developed. Both methods were tested in two different basements using controlled CH4 releases at different CH4 concentrations and different flow rates (see S6 Appendix). We then tested the application of the methods in a variety of basements. We also performed detailed indoor point-of-leak (“leak”) surveys using a periodically calibrated Bascom-Turner Gas-Rover VG211 portable combustible gas indicator (“CGI”) equipped with a rubber coned surface probe (SP-636) (see S9 Appendix section 3). Leak surveying was done across all accessible NG infrastructure and appliances on all floors of the buildings to detect any safety issues, learn about sources of indoor NG leaks and provide an indoor NG leaks amelioration plan to participants. Surveying covered interior service lines, meters, pipes, pipe joints, couplings and connectors, appliances such as furnaces, boilers, stoves, dryers and fireplaces.

Recruitment of buildings

Participants’ buildings were recruited through residential neighborhood associations, the Mothers Out Front network and the researchers’ personal networks. In total, 23 buildings were available, spanning a variety of building styles, ages, floors, occupancy types, towns and neighborhoods. Participants were provided with a description of the study and phone-screened for eligibility. Buildings with whole-house HVAC systems in operation were not included as these interfered with the air flushing and circulation steps of the methods.

We selected 20 buildings for the study that were representative of the Boston area’s housing stock and located in 8 different towns and neighborhoods (a map of locations and a table summarizing their characteristics can be found in S1 Appendix). Buildings studied included 14 single-family homes built between 1920 and 2005 (mean age 108 y, median age 102 y) covering a variety of architectural styles (3 colonials, 1 Victorian, 3 capes, 1 ranch, 2 bungalows, the rest ‘conventional’). These buildings had 2–4 floors including the basement and basement volumes between 814–6787 ft3 and 702–5707 ft3 after adjusting for volume of objects therein. Buildings studied also included 6 multi-family homes built between 1870 and 1984 (mean age 106 y, median age 116 y) with styles covering one 3 story (3 families, 1 shared basement), 2 ‘conventional’ (3 family and 2 family, both with shared basements), 2 duplex halves (both with divided basements) and one 2 story (2 families, 1 shared basement). These buildings had 3–4 floors including the basement with basement volumes ranging between 2256–8549 ft3 and 2169–8283 ft3 after adjusting for the volume of objects therein. Across all 20 buildings, basements were on average approximately 75% subterranean and objects therein occupied on average 8% of their volumes. All but 3 had NG meters located inside the basement, and all but 3 had NG utility service pipes entering the basement from underground. All of the buildings had at least 1 NG furnace or boiler (27 in total) used for space heating or both space heating and domestic water heating; 16 buildings had NG powered water heaters; 11 buildings had NG dryers and 1 home had 1 NG fireplace. One of the buildings had a NG furnace in both the basement and the attic.

Room chamber method (“RCM”)

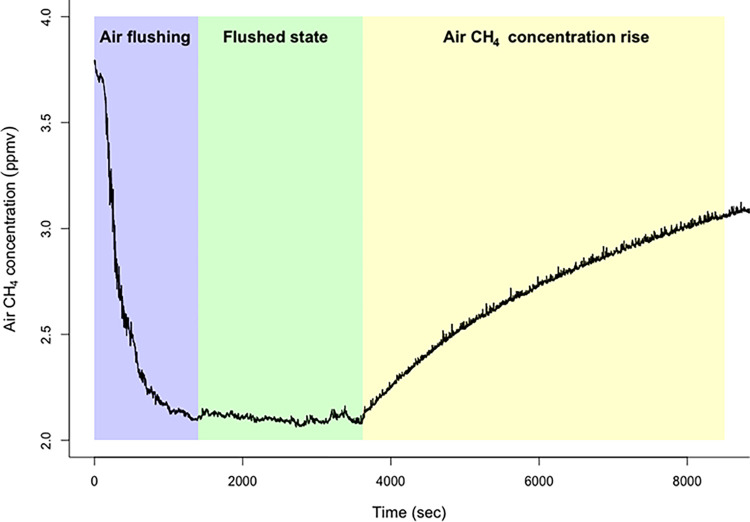
Exterior windows and doors were opened and basement air was flushed out and replaced with outdoor air using 3 to 4 adjustable-speed tilting-head 4960-CFM 51 cm floor fans (Pelonis model PFE50A4ABB) and 2 to 3 51 cm 1800 CFM box fans (Lasko model 3733). Air flushing continued until a flushed steady state was detected with the GasScouter where air CH4 concentrations were approximately steady. Exterior windows and doors were then closed and the fans reoriented to provide maximum air CH4 mixing and circulation in the basement. During this air CH4 concentration rise phase, data was logged for as long as practicable (between 1.5 and 19 hours, after equipment set-up, air flushing and room volume measuring), and used for data modeling and emissions calculations. Fig 1 shows an example of the air CH4 concentration across the three phases.

Fig 1. Example of air CH4 concentrations during each phase of the room chamber method (RCM).

Fig 1

The basement volume was measured using a laser distance measurer (RockSeed ‎Mileseey S2-50) and a tape measure. The basement was divided into spaces such as main rooms, stairwells, window bay cavities and crawl spaces. Their volumes were measured and summed to create a total ‘empty’ basement volume (Vempty). Volumes of objects (Vobjects) in the basement were measured and summed, including chimneys, water tanks, furnaces, boilers, washers and dryers, ceiling cross members and floor support beams or pillars, large furniture such as cupboards and sofas, heating ducts and plenums, and other miscellaneous objects. An adjusted basement volume was calculated as Vadj = Vempty—Vobjects. We calculated the daily basement CH4 emissions as follows (and provide CH4 fluxes in cubic feet per day, rather than cubic meters per day as natural gas is measured in the United States in cubic feet; 1 cubic foot = 0.0283 cubic meters):

CH4emissions(ft3day1)=dCH4/dt(ppmvsec1)x60secx60minx24hr(day)xVadj(ft3)x106 (Eq 1)

where dCH4/dt is the rate of change of air CH4 concentration and Vadj is the volume of the room chamber adjusted by removing the volume of objects therein. Two methods were compared for calculating dCH4/dt. The first method (“simple slope”) calculates the linear rate of change from two air CH4 concentration measurements over time:

dCH4/dt=(CH4attnCH4att0)/n (Eq 2)

where n is the timespan in seconds between two air CH4 concentration measurements, CH4 at tn is the air CH4 concentration in the basement after n seconds, and CH4 at t0 is the air CH4 concentration at the beginning of data logging (t = 0), after flushing and closing the basement (see S4 Appendix section 2 for an example). In the second method (“fitted tangent”), air CH4 concentration over time in the room chamber is modeled with the equation:

CH4(t)=Sαekt (Eq 3)

where t is time, S is the ideal air CH4 concentration steady state in the room chamber, k is a time constant, and α is some constant. The maximum rate of change of air CH4 concentration is calculated using the first derivative of this equation at t = 0 (see S4 Appendix section 3 for example):

dCH4/dt=kα (Eq 4)

The RCM method was tested against metered control CH4 fluxes in 2 basements between June 12 2022 and August 2 2022. We tested 4 orders of magnitude of control fluxes ranging from 0.2 to 198 ft3 day-1. Although this study did not investigate control leak fluxes lower than 0.2 ft3 day-1, smaller leak fluxes could be investigated using this method. Using fitted tangent and simple slope calculation methods, RCM detected flux that was on average within 7% and 12% respectively of the control test fluxes (see S6 Appendix section 1). Having determined the accuracy of RCM, we performed the method between July 26 2022 and October 13 2022 in 16 basements and 1 attic (RCM was not performed in 3 basements that did not have an average air CH4 concentration of at least 0.5 ppmv above the outdoor ambient air CH4 concentration). The GasScouter was placed in an approximately central basement location and away from any gas appliances.

Simplified room chamber method (“Bag method”)

We explored the viability of a simpler version of RCM that could be used at scale using inexpensive equipment together with a centrally-located gas analyzer. Basement exterior windows and doors were opened and air was flushed out and replaced with outdoor air using 2 to 3 51 cm 1800-CFM box fans (Lasko model 3733). Basement air CH4 concentrations were monitored with the GasScouter until a flushed state was observed in order to learn how long the air had to be flushed to reach a steady state. Air CH4 concentration sampling was simplified by replacing the use of the GasScouter with an air sampling kit consisting of two 0.5 L Tedlar bags with polypropylene combo valves (Restek 22049) and a gas sampling bulb (Heathrow Scientific 56HV89) used to evacuate and fill the bags. A first air CH4 concentration sample was taken in one bag after basement air flushing was completed and before basement doors and windows were closed. Basement exterior doors and windows were then closed and fans reoriented to provide air CH4 mixing and circulation in the basement. After a recorded amount of time later (typically 600 s), a second air sample was taken using the second bag (details on using the air sampling kit can be found in S5 Appendix section 1). Bagged air CH4 concentrations were later analyzed using the GasScouter or a Picarro G2311-f cavity ring-down spectrometer which were tested periodically with test gasses (see S9 Appendix section 2). Measurement of Vempty was simplified by omitting small and harder-to-measure sub-volumes such as basement stairway areas above the basement ceilings, window bays or small built-in shelf or storage spaces. A standard adjustment factor was then applied to Vempty to account for basement contents, resulting in a final simplified volume, Vsim = Vempty x f, where f was derived by taking the average volume consumed by objects in basements measured across this study (f = 0.92) (see S4 Appendix section 1). We calculated the daily basement CH4 emissions using Eq 1, replacing Vadj with Vsim and calculating dCH4/dt using simple slope (Eq 2) with CH4 at t0 and CH4 at tn taken from the first and second bagged air samples respectively.

The bag method was tested against metered control CH4 fluxes in 1 basement between June 12 2022 and October 10 2022 using test fluxes ranging from 0.19 to 1.03 ft3 day-1 (S6 Appendix section 2). Having determined the accuracy of the bag method, we performed the method in 14 basements (11 immediately prior to RCM and in 3 basements on different days to RCM) between September 3 2022 and October 13 2022.

Results and discussion

Room chamber method (RCM)

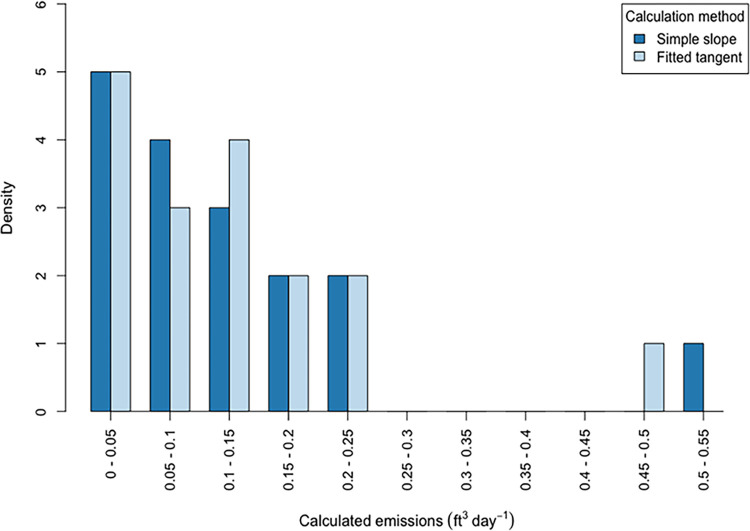
Air CH4 concentrations during flushing reduced exponentially over time (see S3 Appendix). Total basement air flushing time (including the bag method flushing duration) ranged between 25–120 min (mean 68, median 60 min, n = 16) and post-flushed basement air CH4 concentrations relative to outdoors had a mean and median of 1% higher relative to the outdoors. We suggest that this small difference may be due to active NG leakage and slower air/CH4 exchange rates from stored object volumes (e.g. storage boxes, furniture, appliances). During RCM we collected 1.5–19 h (mean 7 h, median 5.3 h, n = 18) of data with the GasScouter. During the post-flush rise phase at three experiment locations, we observed spikes in air CH4 concentration possibly due to unburnt gas entering the basement from the cycling on/off of domestic water heating NG furnaces or boilers [23] (see S4 Appendix section 6). We also observed examples of air CH4 concentration fluctuating after initial concentration rises (see S4 Appendix section 7). However, neither of these issues adversely affected our ability to model the data for our purposes and precision sought. During the rise phase at one experiment location, we observed high frequency large variations in air CH4 concentration readings due to poor air circulation. This was addressed by repeating the experiment after closing off spaces and sub-rooms in the basement where it was difficult to circulate air and where there was no NG infrastructure (see S4 Appendix section 8). We also explored how indoor air CH4 concentration may vary with indoor and outdoor atmospheric pressure by performing a multi-day experiment in one basement in which all NG appliances in the basement (and entire building) were turned off. We found no relationship between pressure and CH4 concentration (see S4 Appendix section 9). It is possible that fluctuations in air CH4 concentrations in this scenario could be due to pressure fluctuations in the NG distribution system. After taking fluctuations and spikes into account, we selected as much exponential rise phase data as possible (between 0.3–6.6 h, mean 3.3 h, median 3.2 h) for use in modeling in 16 basements and 1 attic room (see S10 Appendix for details of each experiment). Calculated emissions ranged between 0.02–0.51 ft3 day-1 and are shown for both calculation methods as histograms in Fig 2. Mean daily emissions were 0.13 and 0.12 ft3 day-1 using simple slope and fitted tangent methods respectively, and median daily emissions were 0.09 and 0.1 ft3 day-1 using simple slope and fitted tangent methods respectively (n = 17).

Fig 2. Histogram of CH4 calculated emissions from room chamber method (RCM), comparing results from using the simple slope and fitted tangent emissions calculation methods.

Fig 2

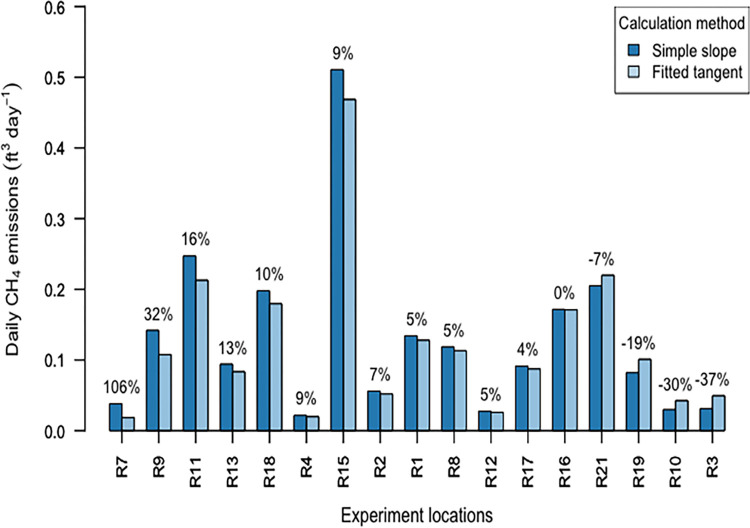
Our calculated emissions from inside basement rooms were comparable in magnitude to findings in the Fischer et al study (Fischer et al., 2018) which measured mean and median whole-house emissions of 0.10 ft3 day-1 and 0.23 ft3 day-1 (2.1 and 4.6 g CH4 day-1) respectively (n = 75). We recognize that the different methods likely probe different flow regimes i.e. pressure driven mass flow in the Fischer et al study versus molecular diffusion dominated-flow in our study (as discussed in Bain et al., 2005). We also recognize that our measurements were not for the whole house, and were also performed on a smaller number and wider variety of buildings in Massachusetts. As an additional point of comparison, our calculated emissions are less than 1% of the average daily emissions of 89 ft3 day-1 from 79 distribution system leaks studied by Magavi in 2018 in the greater Boston area [24]. The largest calculated daily emissions from one of the basements, regardless of calculation method, was responsible for 23% of total emissions across all experiment locations (4 standard deviations above the mean), suggesting there might be super-emitting basements. Fig 3 shows a comparison of emissions using the two calculation methods which correlated well (R2 = 0.983, p < 0.001). Emission calculations using simple slope were between 37% less to 106% more when compared relatively to emissions calculated using fitted tangent, with a mean relative difference of 8% and median relative difference of 5%.

Fig 3. Daily CH4 emissions calculated using room chamber method (RCM) ranged between 0.02–0.51 ft3 day-1.

Fig 3

The relative difference between emissions from the two RCM calculation methods is shown as a percentage above each pair of bars. The graph is ordered from left to right in descending order of the relative percentage difference.

When calculating daily emissions with either calculation method, as the timespan used in calculations increased, calculated emissions decreased. We analyzed a 30 minute control test by varying the timespan from 60 to 1680 s in 60 s increments and found emissions calculated using simple slope diverged from 102% to 93% of the actual test flux. Similarly, when using fitted tangent, varying the timespan from 100 s to 1700 s in 60 s increments, calculated emissions diverged from 96% to 92% of the actual test flux (see S4 Appendix section 4). For simple slope calculations we chose to use a timespan of 600 seconds. Differences between calculated emissions and actual emissions could in part be explained by error in volume measurements.

Simplified room chamber method (“Bag method”)

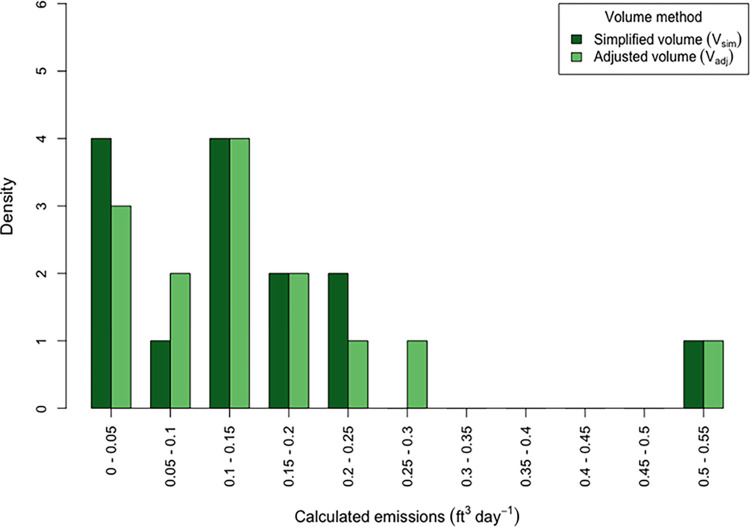
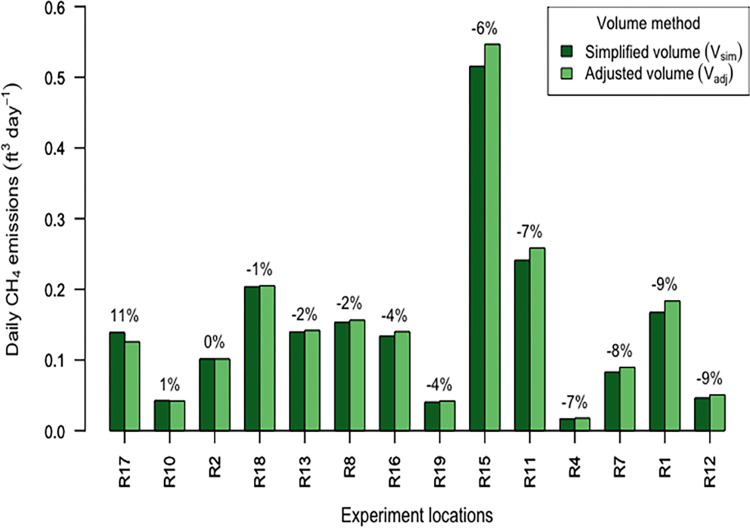
Flush duration and post-flush air CH4 concentration was measured in the 11 experiment locations performed immediately prior to RCM. As with RCM, air CH4 concentrations during flushing reduced exponentially over time (see S3 Appendix). Flush time ranged between 35–60 min with both a mean and median of 48 min. Post-flushed basement air CH4 concentrations relative to outdoors were slightly higher than RCM with a mean 7% and median 6% higher relatively. Daily emissions calculated using simplified volumes (Vsim) and the more accurate adjusted volumes (Vadj) are shown as histograms in Fig 4 and ranged between 0.02–0.55 ft3 day-1. Mean daily emissions were 0.14 and 0.15 ft3 day-1 using Vsim and Vadj respectively, and median daily emissions were 0.14 and 0.13 ft3 day-1 using Vsim and Vadj respectively (n = 14).

Fig 4. Histogram of CH4 calculated emissions from the bag method, comparing results of using the simplified room volume (Vsim) and the more accurate room volume (Vadj).

Fig 4

Emissions calculated using Vsim and Vadj were on average lower by 15% and 14% respectively than metered control tests but still within our sought after level of precision. Simplified volumes differed from 8% less to 11% greater than adjusted volumes and on average simplified volumes were 3% less than adjusted volumes (n = 15). Emissions calculations using Vsim and Vadj correlated well (R2 = 0.997, p < 0.001) and Vsim calculations when compared relatively to Vadj differed between 9% less to 11% more in result, with an average difference of 3% less and median difference of 4% less (Fig 5).

Fig 5. Daily CH4 emissions calculated using the bag method ranged between 0.02–0.55 ft3 day-1.

Fig 5

The relative difference between emissions from the bag method calculations using simplified volume (Vsim) and the more accurate volume (Vadj) is shown as a percentage above each pair of bars. The graph is ordered from left to right in descending order of the relative percentage difference.

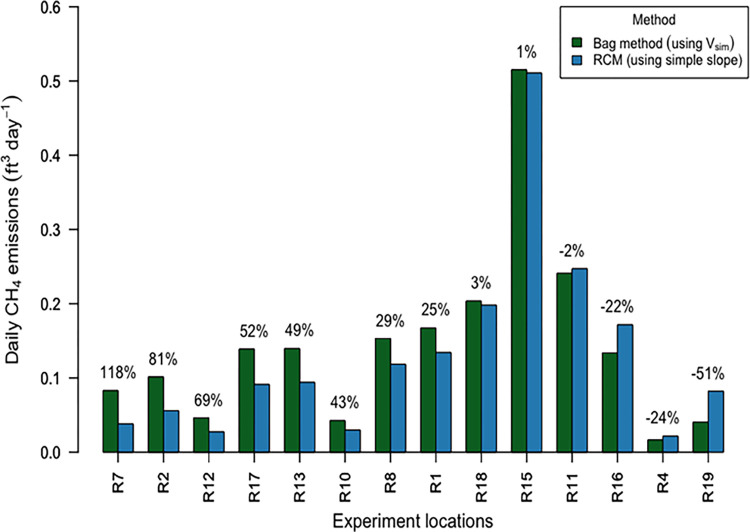
Fig 6 shows the relative differences between the bag method calculations using Vsim and RCM calculations using simple slope. These correlated well (R2 = 0.946, p < 0.001) and ranged from 51% less to 118% greater than RCM emissions, with a mean 26% greater and a median 27% greater (n = 14). These differences may likely be due to the less thorough air flushing used in the bag method, and secondarily the slight variation in volume measurements. Also, the relative difference between the bag method (using Vsim) and RCM simple slope calculated emissions appeared to reduce as emissions calculated with RCM increases (see S5 Appendix section 2). Due to its lower sampling rate, this method’s results could be more susceptible to air CH4 concentration spikes from NG appliance cycling. For example, if the second sample were taken nearer in time or space to a spike, the calculated flux might appear larger. Sampling protocol could be further improved, for example by performing the air flush/sample steps multiple times.

Fig 6. Comparison of calculated emissions using the bag method and room chamber method (RCM).

Fig 6

The relative difference in calculated emissions between the two methods is shown as a percentage above each pair of bars. The graph is ordered from left to right in descending order by relative percentage difference. (Note: The bag method was performed on different days to RCM for experiment locations R12, R13 and R16).

Ambient air CH4 concentration measurements

Across all single-family homes, ambient air CH4 concentrations were on average highest in the basement (3.8 ppmv, n = 15). Across all multi-family homes, on average the highest reading was on floor 3 (16.6 ppmv, n = 5) and was due to one building having a floor 3 ambient air CH4 concentration of 16.6 ppmv due to an extinguished gas stove pilot light (no other leaks were found through indoor leak surveying on this floor). Air CH4 concentrations in these basements were on average 3.5 ppmv (n = 6) (see S2 Appendix section 2). We found a correlation between unflushed ambient basement air CH4 concentrations and RCM daily emissions calculated using fitted tangent, the most accurate emissions method and calculation relative to control tests (R2 = 0.39, p = 0.0075, n = 17, see S4 Appendix section 5). The basement’s air exchange rate could account for much of the unexplained variation in this result.

Leak measurements

Of all the buildings studied, 18 out of 20 (90%) had at least 1 indoor gas leak detected during surveying. The majority of found leaks were in the basement compared to other floors, and were distributed approximately evenly between single and multi-family home types. Leaks were found both before and after the NG meter (15 and 58 leaks respectively). Leaks after the NG meter occurred slightly more frequently in multi-family homes (59%) and leaks before the NG meter which occurred more frequently in single-family homes (87%). The majority (83%) of the leaks were found at pipe joints. No leaks were found on meters. More details about leaks surveyed can be found in S7 Appendix. Also, building age didn’t appear to correlate with the number of leaks, their sizes or calculated daily emissions (see S8 Appendix).

Conclusions

In general both RCM and bag method can be used to measure indoor uncombusted CH4 emissions in any building room where the air in the space can be flushed sufficiently and air can be thoroughly circulated. While the bag method can potentially be affected by air CH4 concentration spikes from NG appliance cycling, when compared to RCM it was faster to perform, required simpler on-site equipment and room volume measurements and used simple emissions calculations resulting in only slightly less accuracy when compared to metered control tests results. Room flushing and air sampling could be performed by trained community-based scientists and air CH4 concentration bagged air samples can easily be processed at centralized locations for gas analysis. In addition, the bag method could potentially be used as a widely-adoptable screening tool to detect post-meter super-emitting gas leaks that are likely associated with long-tailed leak distributions. Super-emitting leaks have characterized all other parts of the NG process chain and characterizing long-tailed statistical distributions benefits from large data sets. Such a scalable remote sampling and centralized analysis approach could play an important role in dramatically increasing sampling rates both seasonally and spatially, and could lead to improvements in indoor CH4 emissions research and bottom-up post-meter methane emissions inventories. In the next phase of research we intend to actively pursue these applications.

Supporting information

S1 Appendix. Selected building locations and characteristics.

(PDF)

S2 Appendix. Ambient CH4 air concentration measurements.

(PDF)

S3 Appendix. Air CH4 concentrations over time during air flushing phase.

(PDF)

S4 Appendix. Room chamber method (RCM).

(PDF)

S5 Appendix. Simplified room chamber method (“Bag method”).

(PDF)

S6 Appendix. Testing methods with metered CH4 releases.

(PDF)

S7 Appendix. Leaks.

(PDF)

S8 Appendix. Building age relationships.

(PDF)

S9 Appendix. Instrument quality control tests.

(PDF)

S10 Appendix. Individual RCM experiment data and modeling plots.

(PDF)

S1 Data

(ZIP)

Acknowledgments

The authors would like to warmly thank the study participants and Sarah Lerman-Sinkoff, Dr Marcos Luna, Audrey Schulman and Zeyneb Magavi for thoughtful reviews and suggestions.

Data Availability

All relevant data are within the manuscript and its Supporting Information files.

Funding Statement

The author(s) received no specific funding for this work.

References

  • 1.Stocker T.F., Qin D., Plattner G.-K., Tignor M., Allen S.K., Boschung J., et al., 2013. Climate Change 2013: The Physical Science Basis. Contribution of Working Group I to the Fifth Assessment Report of the Intergovernmental Panel on Climate Change. [Google Scholar]
  • 2.Inventory of U.S. Greenhouse Gas Emissions and Sinks: 1990–2020, 2022. U.S. Environmental Protection Agency: Washington, DC, USA. Available from https://www.epa.gov/ghgemissions/natural-gas-and-petroleum-systems-ghg-inventory-additional-information-1990-2020-ghg [Google Scholar]
  • 3.McKain K., Down A., Raciti S.M., 2015. Methane emissions from natural gas infrastructure and use in the urban region of Boston, Massachusetts. Proceedings of the National Academy of Sciences. doi: 10.1073/pnas.1416261112 [DOI] [PMC free article] [PubMed] [Google Scholar]
  • 4.Hendrick M.F., Ackley R., Sanaie-Movahed B., Tang X., Phillips N.G., 2016. Fugitive methane emissions from leak-prone natural gas distribution infrastructure in urban environments. Environ. Pollut. 213, 710–716. doi: 10.1016/j.envpol.2016.01.094 [DOI] [PubMed] [Google Scholar]
  • 5.Hopkins F.M., Kort E.A., Bush S.E., Ehleringer J.R., Lai C.-T., Blake D.R., et al., 2016. Spatial patterns and source attribution of urban methane in the Los Angeles Basin. Journal of Geophysical Research: Atmospheres. 10.1002/2015jd024429 [DOI] [Google Scholar]
  • 6.Huang Y., Kort E.A., Gourdji S., Karion A., Mueller K., Ware J., 2019. Seasonally Resolved Excess Urban Methane Emissions from the Baltimore/Washington, DC Metropolitan Region. Environ. Sci. Technol. 53, 11285–11293. doi: 10.1021/acs.est.9b02782 [DOI] [PubMed] [Google Scholar]
  • 7.Phillips N.G., Ackley R., Crosson E.R., Down A., 2013. Mapping urban pipeline leaks: Methane leaks across Boston. Environmental Pollution. doi: 10.1016/j.envpol.2012.11.003 [DOI] [PubMed] [Google Scholar]
  • 8.Saint-Vincent P.M.B., Pekney N.J., 2020. Beyond-the-Meter: Unaccounted Sources of Methane Emissions in the Natural Gas Distribution Sector. Environ. Sci. Technol. 54, 39–49. doi: 10.1021/acs.est.9b04657 [DOI] [PubMed] [Google Scholar]
  • 9.National Academies of Sciences, Engineering, and Medicine, Division on Earth and Life Studies, Board on Environmental Studies and Toxicology, Board on Energy and Environmental Systems, Board on Earth Sciences and Resources, Board on Agriculture and Natural Resources, Board on Atmospheric Sciences and Climate, Committee on Anthropogenic Methane Emissions in the United States: Improving Measurement, Monitoring, Presentation of Results, and Development of Inventories, 2018. Improving Characterization of Anthropogenic Methane Emissions in the United States. National Academies Press. Available from https://nap.nationalacademies.org/catalog/24987/improving-characterization-of-anthropogenic-methane-emissions-in-the-united-states [PubMed]
  • 10.Sargent M.R., Floerchinger C., McKain K., Budney J., Gottlieb E.W., Hutyra L.R., et al., 2021. Majority of US urban natural gas emissions unaccounted for in inventories. Proc. Natl. Acad. Sci. U. S. A. 118. 10.1073/pnas.2105804118 [DOI] [PMC free article] [PubMed] [Google Scholar]
  • 11.Plant G., Kort E.A., Floerchinger C., Gvakharia A., Vimont I., Sweeney C., 2019. Large fugitive methane emissions from urban centers along the U.s. east Coast. Geophys. Res. Lett. 46, 8500–8507. doi: 10.1029/2019GL082635 [DOI] [PMC free article] [PubMed] [Google Scholar]
  • 12.He L., Zeng Z.C., Pongetti T.J., Wong C., 2019. Atmospheric methane emissions correlate with natural gas consumption from residential and commercial sectors in Los Angeles. Geophysical. 10.1029/2019GL083400 [DOI] [Google Scholar]
  • 13.Hong B., Howarth R.W., 2016. Greenhouse gas emissions from domestic hot water: heat pumps compared to most commonly used systems. Energy Sci. Eng. 4, 123–133. 10.1002/ese3.112 [DOI] [Google Scholar]
  • 14.Lebel E.D., Lu H.S., Speizer S.A., Finnegan C.J., Jackson R.B., 2020. Quantifying Methane Emissions from Natural Gas Water Heaters. Environ. Sci. Technol. 54, 5737–5745. doi: 10.1021/acs.est.9b07189 [DOI] [PubMed] [Google Scholar]
  • 15.Lebel E.D., Finnegan C.J., Ouyang Z., Jackson R.B., 2022. Methane and NOx Emissions from Natural Gas Stoves, Cooktops, and Ovens in Residential Homes. Environ. Sci. Technol. 56, 2529–2539. doi: 10.1021/acs.est.1c04707 [DOI] [PubMed] [Google Scholar]
  • 16.Fischer M.L., Chan W.R., Delp W., Jeong S., Rapp V., Zhu Z., 2018. An Estimate of Natural Gas Methane Emissions from California Homes. Environ. Sci. Technol. 52, 10205–10213. doi: 10.1021/acs.est.8b03217 [DOI] [PubMed] [Google Scholar]
  • 17.Massachusetts Department of Environmental Protection, 2022. MassDEP Emissions Inventories. Available from https://www.mass.gov/lists/massdep-emissions-inventories. [Google Scholar]
  • 18.Field C.B., Ball J.T., Berry J.A., 1989. Photosynthesis: principles and field techniques, in: Pearcy R.W., Ehleringer J.R., Mooney H.A., Rundel P.W. (Eds.), Plant Physiological Ecology: Field Methods and Instrumentation. Springer Netherlands, Dordrecht, pp. 209–253. [Google Scholar]
  • 19.Winner W.E., Greitner C.S., 1989. Field methods used for air pollution research with plants, in: Pearcy R.W., Ehleringer J.R., Mooney H.A., Rundel P.W. (Eds.), Plant Physiological Ecology: Field Methods and Instrumentation. Springer Netherlands, Dordrecht, pp. 399–425. [Google Scholar]
  • 20.Bain W.G., Hutyra L., Patterson D.C., Bright A.V., Daube B.C., Munger J.W., et al., 2005. Wind-induced error in the measurement of soil respiration using closed dynamic chambers. Agric. For. Meteorol. 131, 225–232. 10.1016/j.agrformet.2005.06.004 [DOI] [Google Scholar]
  • 21.Brandt A.R., Heath G.A., Cooley D., 2016. Methane Leaks from Natural Gas Systems Follow Extreme Distributions. Environ. Sci. Technol. 50, 12512–12520. doi: 10.1021/acs.est.6b04303 [DOI] [PubMed] [Google Scholar]
  • 22.Zavala-Araiza D., Lyon D., Alvarez R.A., Palacios V., Harriss R., Lan X., et al., 2015. Toward a Functional Definition of Methane Super-Emitters: Application to Natural Gas Production Sites. Environmental Science & Technology. 10.1021/acs.est.5b00133 [DOI] [PubMed] [Google Scholar]
  • 23.Merrin Z., Francisco P.W., 2019. Unburned Methane Emissions from Residential Natural Gas Appliances. Environ. Sci. Technol. 53, 5473–5482. doi: 10.1021/acs.est.8b05323 [DOI] [PubMed] [Google Scholar]
  • 24.Magavi Z., 2018. Identifying and Rank-ordering Large Volume Leaks in the Underground Natural Gas Distribution System of Massachusetts. Harvard University. Available from https://dash.harvard.edu/handle/1/37945149. [Google Scholar]

Decision Letter 0

Yanping Yuan

26 Sep 2023

PONE-D-23-18731A Simple Method To Measure Methane Emissions From Indoor Gas LeaksPLOS ONE

Dear Dr. Nicholas,

Thank you for submitting your manuscript to PLOS ONE. After careful consideration, we feel that it has merit but does not fully meet PLOS ONE’s publication criteria as it currently stands. Therefore, we invite you to submit a revised version of the manuscript that addresses the points raised during the review process.

Please submit your revised manuscript by Nov 09 2023 11:59PM. If you will need more time than this to complete your revisions, please reply to this message or contact the journal office at plosone@plos.org. When you're ready to submit your revision, log on to https://www.editorialmanager.com/pone/ and select the 'Submissions Needing Revision' folder to locate your manuscript file.

Please include the following items when submitting your revised manuscript:

  • A rebuttal letter that responds to each point raised by the academic editor and reviewer(s). You should upload this letter as a separate file labeled 'Response to Reviewers'.

  • A marked-up copy of your manuscript that highlights changes made to the original version. You should upload this as a separate file labeled 'Revised Manuscript with Track Changes'.

  • An unmarked version of your revised paper without tracked changes. You should upload this as a separate file labeled 'Manuscript'.

If you would like to make changes to your financial disclosure, please include your updated statement in your cover letter. Guidelines for resubmitting your figure files are available below the reviewer comments at the end of this letter.

If applicable, we recommend that you deposit your laboratory protocols in protocols.io to enhance the reproducibility of your results. Protocols.io assigns your protocol its own identifier (DOI) so that it can be cited independently in the future. For instructions see: https://journals.plos.org/plosone/s/submission-guidelines#loc-laboratory-protocols. Additionally, PLOS ONE offers an option for publishing peer-reviewed Lab Protocol articles, which describe protocols hosted on protocols.io. Read more information on sharing protocols at https://plos.org/protocols?utm_medium=editorial-email&utm_source=authorletters&utm_campaign=protocols.

We look forward to receiving your revised manuscript.

Kind regards,

Yanping Yuan

Academic Editor

PLOS ONE

Journal Requirements:

When submitting your revision, we need you to address these additional requirements.

1. Please ensure that your manuscript meets PLOS ONE's style requirements, including those for file naming. The PLOS ONE style templates can be found at 

https://journals.plos.org/plosone/s/file?id=wjVg/PLOSOne_formatting_sample_main_body.pdf and 

https://journals.plos.org/plosone/s/file?id=ba62/PLOSOne_formatting_sample_title_authors_affiliations.pdf

2. Please note that PLOS ONE has specific guidelines on code sharing for submissions in which author-generated code underpins the findings in the manuscript. In these cases, all author-generated code must be made available without restrictions upon publication of the work. Please review our guidelines at https://journals.plos.org/plosone/s/materials-and-software-sharing#loc-sharing-code and ensure that your code is shared in a way that follows best practice and facilitates reproducibility and reuse.

3. Please include captions for your Supporting Information files at the end of your manuscript, and update any in-text citations to match accordingly. Please see our Supporting Information guidelines for more information: http://journals.plos.org/plosone/s/supporting-information.

4. We note that Supporting Figure 1 in your submission contain map images which may be copyrighted. All PLOS content is published under the Creative Commons Attribution License (CC BY 4.0), which means that the manuscript, images, and Supporting Information files will be freely available online, and any third party is permitted to access, download, copy, distribute, and use these materials in any way, even commercially, with proper attribution. For these reasons, we cannot publish previously copyrighted maps or satellite images created using proprietary data, such as Google software (Google Maps, Street View, and Earth). For more information, see our copyright guidelines: http://journals.plos.org/plosone/s/licenses-and-copyright.

We require you to either (1) present written permission from the copyright holder to publish these figures specifically under the CC BY 4.0 license, or (2) remove the figures from your submission:

(1) You may seek permission from the original copyright holder of Supporting Figure 1 to publish the content specifically under the CC BY 4.0 license.  

We recommend that you contact the original copyright holder with the Content Permission Form (http://journals.plos.org/plosone/s/file?id=7c09/content-permission-form.pdf) and the following text:

“I request permission for the open-access journal PLOS ONE to publish XXX under the Creative Commons Attribution License (CCAL) CC BY 4.0 (http://creativecommons.org/licenses/by/4.0/). Please be aware that this license allows unrestricted use and distribution, even commercially, by third parties. Please reply and provide explicit written permission to publish XXX under a CC BY license and complete the attached form.”

Please upload the completed Content Permission Form or other proof of granted permissions as an ""Other"" file with your submission.

In the figure caption of the copyrighted figure, please include the following text: “Reprinted from [ref] under a CC BY license, with permission from [name of publisher], original copyright [original copyright year].”

(2) If you are unable to obtain permission from the original copyright holder to publish these figures under the CC BY 4.0 license or if the copyright holder’s requirements are incompatible with the CC BY 4.0 license, please either i) remove the figure or ii) supply a replacement figure that complies with the CC BY 4.0 license. Please check copyright information on all replacement figures and update the figure caption with source information. If applicable, please specify in the figure caption text when a figure is similar but not identical to the original image and is therefore for illustrative purposes only.

The following resources for replacing copyrighted map figures may be helpful:

USGS National Map Viewer (public domain): http://viewer.nationalmap.gov/viewer/

The Gateway to Astronaut Photography of Earth (public domain): http://eol.jsc.nasa.gov/sseop/clickmap/

Maps at the CIA (public domain): https://www.cia.gov/library/publications/the-world-factbook/index.html and https://www.cia.gov/library/publications/cia-maps-publications/index.html

NASA Earth Observatory (public domain): http://earthobservatory.nasa.gov/

Landsat: http://landsat.visibleearth.nasa.gov/

USGS EROS (Earth Resources Observatory and Science (EROS) Center) (public domain): http://eros.usgs.gov/#

Natural Earth (public domain): http://www.naturalearthdata.com/

5. We note that Supporting Figures R3 & R4, R9, R10, R15, and R21 in your submission contain copyrighted images. All PLOS content is published under the Creative Commons Attribution License (CC BY 4.0), which means that the manuscript, images, and Supporting Information files will be freely available online, and any third party is permitted to access, download, copy, distribute, and use these materials in any way, even commercially, with proper attribution. For more information, see our copyright guidelines: http://journals.plos.org/plosone/s/licenses-and-copyright.

We require you to either (1) present written permission from the copyright holder to publish these figures specifically under the CC BY 4.0 license, or (2) remove the figures from your submission:

(1) You may seek permission from the original copyright holder of Supporting Figures R3 & R4, R9, R10, R15, and R21 to publish the content specifically under the CC BY 4.0 license.

We recommend that you contact the original copyright holder with the Content Permission Form (http://journals.plos.org/plosone/s/file?id=7c09/content-permission-form.pdf) and the following text:

“I request permission for the open-access journal PLOS ONE to publish XXX under the Creative Commons Attribution License (CCAL) CC BY 4.0 (http://creativecommons.org/licenses/by/4.0/). Please be aware that this license allows unrestricted use and distribution, even commercially, by third parties. Please reply and provide explicit written permission to publish XXX under a CC BY license and complete the attached form.”

Please upload the completed Content Permission Form or other proof of granted permissions as an "Other" file with your submission.

In the figure caption of the copyrighted figure, please include the following text: “Reprinted from [ref] under a CC BY license, with permission from [name of publisher], original copyright [original copyright year].”

(2) If you are unable to obtain permission from the original copyright holder to publish these figures under the CC BY 4.0 license or if the copyright holder’s requirements are incompatible with the CC BY 4.0 license, please either i) remove the figure or ii) supply a replacement figure that complies with the CC BY 4.0 license. Please check copyright information on all replacement figures and update the figure caption with source information. If applicable, please specify in the figure caption text when a figure is similar but not identical to the original image and is therefore for illustrative purposes only.

6.. We are unable to open your Supporting Information file [rawdata.gzip]. Please kindly revise as necessary and re-upload.

7. Please review your reference list to ensure that it is complete and correct. If you have cited papers that have been retracted, please include the rationale for doing so in the manuscript text, or remove these references and replace them with relevant current references. Any changes to the reference list should be mentioned in the rebuttal letter that accompanies your revised manuscript. If you need to cite a retracted article, indicate the article’s retracted status in the References list and also include a citation and full reference for the retraction notice.

[Note: HTML markup is below. Please do not edit.]

Reviewers' comments:

Reviewer's Responses to Questions

Comments to the Author

1. Is the manuscript technically sound, and do the data support the conclusions?

The manuscript must describe a technically sound piece of scientific research with data that supports the conclusions. Experiments must have been conducted rigorously, with appropriate controls, replication, and sample sizes. The conclusions must be drawn appropriately based on the data presented.

Reviewer #1: Yes

Reviewer #2: Yes

********** 

2. Has the statistical analysis been performed appropriately and rigorously?

Reviewer #1: Yes

Reviewer #2: Yes

********** 

3. Have the authors made all data underlying the findings in their manuscript fully available?

The PLOS Data policy requires authors to make all data underlying the findings described in their manuscript fully available without restriction, with rare exception (please refer to the Data Availability Statement in the manuscript PDF file). The data should be provided as part of the manuscript or its supporting information, or deposited to a public repository. For example, in addition to summary statistics, the data points behind means, medians and variance measures should be available. If there are restrictions on publicly sharing data—e.g. participant privacy or use of data from a third party—those must be specified.

Reviewer #1: Yes

Reviewer #2: Yes

********** 

4. Is the manuscript presented in an intelligible fashion and written in standard English?

PLOS ONE does not copyedit accepted manuscripts, so the language in submitted articles must be clear, correct, and unambiguous. Any typographical or grammatical errors should be corrected at revision, so please note any specific errors here.

Reviewer #1: Yes

Reviewer #2: Yes

********** 

5. Review Comments to the Author

Please use the space provided to explain your answers to the questions above. You may also include additional comments for the author, including concerns about dual publication, research ethics, or publication ethics. (Please upload your review as an attachment if it exceeds 20,000 characters)

Reviewer #1: The article is well written and organized, and the study was very thoroughly conducted. This method should provide a solution to the problem of quickly and inexpensively obtaining data for building methane emissions. My suggestions for revision are minor.

Line 152: What is meant by "as long as possible"? Be specific.

Line 205: What was the rationale for choosing 0.5 ppmv?

What are the detection limits of both approaches? This should be included.

Was there any activity in the buildings during the tests, for example, gas dryers or furnaces running/not running? (And how might this impact results.) The cycling of water heaters was mentioned, and since it may have had an impact on results this issue seems important to address.

Line 252 and again on line 331: What is "precision sought"? (See detection limit comment above; if a detection limit was given you would be able to define precision sought.

Line 261: "After taking fluctuations and spikes into account": does this mean that these data points were considered outliers and excluded from the analysis? What was the decision making process?

Also line 261: Do we know how much pressure can fluctuate in the NG distribution system? I would guess these fluctuations would have to be small.

Line 308: I find it interesting that emissions changed linearly with basement volume. When you consider the potential sources, some are likely the same (one gas dryer, one water heater, etc.) regardless of a big or small basement. Comments on this?

Reviewer #2: The contribution proposes a new and simple method to measure methane emissions from indoor sources, which is an insufficiently considered. Better assessing these emissions could reduce the gap between top-down and bottom-up estimates. The experiments have been properly conducted, and the conclusions clearly reflect the obtained results.

Mathematical and statistical data processing is appropriate. All data underlying the findings is fully available. The manuscript is written in a clear manner, with a high quality of English language.

********** 

6. PLOS authors have the option to publish the peer review history of their article (what does this mean?). If published, this will include your full peer review and any attached files.

If you choose “no”, your identity will remain anonymous but your review may still be made public.

Do you want your identity to be public for this peer review? For information about this choice, including consent withdrawal, please see our Privacy Policy.

Reviewer #1: No

Reviewer #2: No

**********

[NOTE: If reviewer comments were submitted as an attachment file, they will be attached to this email and accessible via the submission site. Please log into your account, locate the manuscript record, and check for the action link "View Attachments". If this link does not appear, there are no attachment files.]

While revising your submission, please upload your figure files to the Preflight Analysis and Conversion Engine (PACE) digital diagnostic tool, https://pacev2.apexcovantage.com/. PACE helps ensure that figures meet PLOS requirements. To use PACE, you must first register as a user. Registration is free. Then, login and navigate to the UPLOAD tab, where you will find detailed instructions on how to use the tool. If you encounter any issues or have any questions when using PACE, please email PLOS at figures@plos.org. Please note that Supporting Information files do not need this step.

PLoS One. 2023 Nov 30;18(11):e0295055. doi: 10.1371/journal.pone.0295055.r002

Author response to Decision Letter 0


24 Oct 2023

(The content below can be found with correct formatting in the "Response to Reviewers.docx" file submitted - thanks)

October 24, 2023

Dear Editor Yuan and reviewers,

Thank you for your valuable comments and suggestions. They have significantly strengthened this manuscript. Below we have provided responses and updates as per the journal requirements in items 1-7 below. We have also responded in detail to each comment and question of the reviewers and specified where the manuscript and supporting information have been edited. We have uploaded change-tracking and clean versions of the manuscript and SI for your review.

We look forward to hearing from you soon.

Dominic Nicholas, Bob Ackley, Nathan Phillips

Response to Reviewers

1. Please ensure that your manuscript meets PLOS ONE's style requirements, including those for file naming. The PLOS ONE style templates can be found at

https://journals.plos.org/plosone/s/file?id=wjVg/PLOSOne_formatting_sample_main_body.pdf and

https://journals.plos.org/plosone/s/file?id=ba62/PLOSOne_formatting_sample_title_authors_affiliations.pdf

Author’s response:

Style requirements checked and minor updates listed below:

Manuscript:

Level 1 headings : font size increased from 17 to 18

Level 2 headings : font size increased from 11 to 16

Changed “Figure” to “Fig” and bolded first sentence of each figure’s caption

Double-spacing applied to entire manuscript

Corresponding author format revised by adding *

Supporting information:

Corresponding author format revised by adding *

See 3 below for other updates

2. Please note that PLOS ONE has specific guidelines on code sharing for submissions in which author-generated code underpins the findings in the manuscript. In these cases, all author-generated code must be made available without restrictions upon publication of the work. Please review our guidelines at https://journals.plos.org/plosone/s/materials-and-software-sharing#loc-sharing-code and ensure that your code is shared in a way that follows best practice and facilitates reproducibility and reuse.

Author’s response:

The code written for this paper is publicly available through the github repository https://github.com/dominicnicholas/research and shared using a GNU General Public License v3.0.

3. Please include captions for your Supporting Information files at the end of your manuscript, and update any in-text citations to match accordingly. Please see our Supporting Information guidelines for more information: http://journals.plos.org/plosone/s/supporting-information.

Author’s response:

Individual PDF files of each section of the Supporting Information have been created and captions are included at the end of the complete and updated Supporting Information document. For manuscript SI references of the format S#.# (e.g. S9.1), please hyperlink to the main section’s PDF (e.g. S9.1 should hyperlink to S9.pdf). All other manuscript SI references are of the form S# and should hyperlink to S#.pdf (e.g. S1 should hyperlink to S1.pdf). Supporting Information captions and file associations are as follows:

SI Caption

Associated SI PDF file

S1. Selected Building Locations and Characteristics.

S1_File.pdf

S2. Ambient CH4 air concentration measurements.

S2_File.pdf

S3. Air CH4 concentrations over time during air flushing phase.

S3_File.pdf

S4. Room Chamber Method (RCM).

S4_File.pdf

S5. Simplified Room Chamber Method (“Bag method”).

S5_File.pdf

S6. Testing methods with metered CH4 releases.

S6_File.pdf

S7. Leaks.

S7_File.pdf

S8. Building age relationships.

S8_File.pdf

S9. Instrument Quality Control Tests.

S9_File.pdf

S10. Individual RCM experiment data and modeling plots.

S10_File.pdf

4. We note that Supporting Figure 1 in your submission contain map images which may be copyrighted. All PLOS content is published under the Creative Commons Attribution License (CC BY 4.0), which means that the manuscript, images, and Supporting Information files will be freely available online, and any third party is permitted to access, download, copy, distribute, and use these materials in any way, even commercially, with proper attribution. For these reasons, we cannot publish previously copyrighted maps or satellite images created using proprietary data, such as Google software (Google Maps, Street View, and Earth). For more information, see our copyright guidelines: http://journals.plos.org/plosone/s/licenses-and-copyright.

We require you to either (1) present written permission from the copyright holder to publish these figures specifically under the CC BY 4.0 license, or (2) remove the figures from your submission:

(1) You may seek permission from the original copyright holder of Supporting Figure 1 to publish the content specifically under the CC BY 4.0 license.

We recommend that you contact the original copyright holder with the Content Permission Form (http://journals.plos.org/plosone/s/file?id=7c09/content-permission-form.pdf) and the following text:

“I request permission for the open-access journal PLOS ONE to publish XXX under the Creative Commons Attribution License (CCAL) CC BY 4.0 (http://creativecommons.org/licenses/by/4.0/). Please be aware that this license allows unrestricted use and distribution, even commercially, by third parties. Please reply and provide explicit written permission to publish XXX under a CC BY license and complete the attached form.”

Please upload the completed Content Permission Form or other proof of granted permissions as an ""Other"" file with your submission.

In the figure caption of the copyrighted figure, please include the following text: “Reprinted from [ref] under a CC BY license, with permission from [name of publisher], original copyright [original copyright year].”

(2) If you are unable to obtain permission from the original copyright holder to publish these figures under the CC BY 4.0 license or if the copyright holder’s requirements are incompatible with the CC BY 4.0 license, please either i) remove the figure or ii) supply a replacement figure that complies with the CC BY 4.0 license. Please check copyright information on all replacement figures and update the figure caption with source information. If applicable, please specify in the figure caption text when a figure is similar but not identical to the original image and is therefore for illustrative purposes only.

The following resources for replacing copyrighted map figures may be helpful:

USGS National Map Viewer (public domain): http://viewer.nationalmap.gov/viewer/

The Gateway to Astronaut Photography of Earth (public domain): http://eol.jsc.nasa.gov/sseop/clickmap/

Maps at the CIA (public domain): https://www.cia.gov/library/publications/the-world-factbook/index.html and https://www.cia.gov/library/publications/cia-maps-publications/index.html

NASA Earth Observatory (public domain): http://earthobservatory.nasa.gov/

Landsat: http://landsat.visibleearth.nasa.gov/

USGS EROS (Earth Resources Observatory and Science (EROS) Center) (public domain): http://eros.usgs.gov/#

Natural Earth (public domain): http://www.naturalearthdata.com/

Author’s response:

The supporting figure 1 map has been replaced with a public domain OpenStreetMap (OSM) static image of less than 100 features. Whilst not strictly required by OSM for a map with this number of features, we’ve included an embedded attribution (OSM attribution guidelines are defined in https://osmfoundation.org/wiki/Licence/Attribution_Guidelines#Static_images)

5. We note that Supporting Figures R3 & R4, R9, R10, R15, and R21 in your submission contain copyrighted images. All PLOS content is published under the Creative Commons Attribution License (CC BY 4.0), which means that the manuscript, images, and Supporting Information files will be freely available online, and any third party is permitted to access, download, copy, distribute, and use these materials in any way, even commercially, with proper attribution. For more information, see our copyright guidelines: http://journals.plos.org/plosone/s/licenses-and-copyright.

We require you to either (1) present written permission from the copyright holder to publish these figures specifically under the CC BY 4.0 license, or (2) remove the figures from your submission:

(1) You may seek permission from the original copyright holder of Supporting Figures R3 & R4, R9, R10, R15, and R21 to publish the content specifically under the CC BY 4.0 license.

We recommend that you contact the original copyright holder with the Content Permission Form (http://journals.plos.org/plosone/s/file?id=7c09/content-permission-form.pdf) and the following text:

“I request permission for the open-access journal PLOS ONE to publish XXX under the Creative Commons Attribution License (CCAL) CC BY 4.0 (http://creativecommons.org/licenses/by/4.0/). Please be aware that this license allows unrestricted use and distribution, even commercially, by third parties. Please reply and provide explicit written permission to publish XXX under a CC BY license and complete the attached form.”

Please upload the completed Content Permission Form or other proof of granted permissions as an "Other" file with your submission.

In the figure caption of the copyrighted figure, please include the following text: “Reprinted from [ref] under a CC BY license, with permission from [name of publisher], original copyright [original copyright year].”

(2) If you are unable to obtain permission from the original copyright holder to publish these figures under the CC BY 4.0 license or if the copyright holder’s requirements are incompatible with the CC BY 4.0 license, please either i) remove the figure or ii) supply a replacement figure that complies with the CC BY 4.0 license. Please check copyright information on all replacement figures and update the figure caption with source information. If applicable, please specify in the figure caption text when a figure is similar but not identical to the original image and is therefore for illustrative purposes only.

Author’s response:

Supporting figures R3, R4, R9, R10, R15, and R21 are all original figures generated with the author’s original R code and derived from data from this research. These figures are not copyrighted.

6.. We are unable to open your Supporting Information file [rawdata.gzip]. Please kindly revise as necessary and re-upload.

Author’s response:

The two originally submitted data files “research data and code.zip” and “rawdata.gzip” have been reorganized and repackaged into one ‘data and code.zip’ 73.1 MB ZIP archive file.

7. Please review your reference list to ensure that it is complete and correct. If you have cited papers that have been retracted, please include the rationale for doing so in the manuscript text, or remove these references and replace them with relevant current references. Any changes to the reference list should be mentioned in the rebuttal letter that accompanies your revised manuscript. If you need to cite a retracted article, indicate the article’s retracted status in the References list and also include a citation and full reference for the retraction notice.

Author’s response:

References were reviewed and hyperlinks were corrected and improved.

[Note: HTML markup is below. Please do not edit.]

Reviewers' comments:

Reviewer's Responses to Questions

Comments to the Author

1. Is the manuscript technically sound, and do the data support the conclusions?

The manuscript must describe a technically sound piece of scientific research with data that supports the conclusions. Experiments must have been conducted rigorously, with appropriate controls, replication, and sample sizes. The conclusions must be drawn appropriately based on the data presented.

Reviewer #1: Yes

Reviewer #2: Yes

2. Has the statistical analysis been performed appropriately and rigorously?

Reviewer #1: Yes

Reviewer #2: Yes

3. Have the authors made all data underlying the findings in their manuscript fully available?

The PLOS Data policy requires authors to make all data underlying the findings described in their manuscript fully available without restriction, with rare exception (please refer to the Data Availability Statement in the manuscript PDF file). The data should be provided as part of the manuscript or its supporting information, or deposited to a public repository. For example, in addition to summary statistics, the data points behind means, medians and variance measures should be available. If there are restrictions on publicly sharing data—e.g. participant privacy or use of data from a third party—those must be specified.

Reviewer #1: Yes

Reviewer #2: Yes

4. Is the manuscript presented in an intelligible fashion and written in standard English?

PLOS ONE does not copyedit accepted manuscripts, so the language in submitted articles must be clear, correct, and unambiguous. Any typographical or grammatical errors should be corrected at revision, so please note any specific errors here.

Reviewer #1: Yes

Reviewer #2: Yes

5. Review Comments to the Author

Please use the space provided to explain your answers to the questions above. You may also include additional comments for the author, including concerns about dual publication, research ethics, or publication ethics. (Please upload your review as an attachment if it exceeds 20,000 characters)

Reviewer #1: The article is well written and organized, and the study was very thoroughly conducted. This method should provide a solution to the problem of quickly and inexpensively obtaining data for building methane emissions. My suggestions for revision are minor.

Line 152: What is meant by "as long as possible"? Be specific.

Author’s response

Thank you for this good suggestion. We have updated the manuscript as follows with new content in bold, and removed words crossed out (lines 158-159 of revised manuscript) :

“During this air CH4 concentration rise phase, data was logged for as long as possible practicable (between 1.5 and 19 hours, after equipment set-up, air flushing and room volume measuring), and used for data modeling and emissions calculations. Figure 1 shows an example of the air CH4 concentration across the three phases.”

Line 205: What was the rationale for choosing 0.5 ppmv?

Author’s response:

Thank you for your response. We have clarified this in the first mention of this threshold in the Measurements Overview section as follows (lines 106-109 of revised manuscript):

“We chose this threshold based on prior experience that a 0.5 ppmv elevation in basement rooms relative to outdoors reliably had leaks and because this study was intended to resolve leaks which have greater significance as contributors to greenhouse gas emissions.”

What are the detection limits of both approaches? This should be included.

Author’s response:

Thank you again. Although the detection limits of the instruments used here are listed in SI Tables 5 and 6, we did not test the lower detection limit of either RCM or Bag methods. We are confident in the precision and accuracy of the methods over the range of control fluxes verified in this study (S6). We suggest that researchers who are interested in resolving smaller leak fluxes can use this approach with appropriate control tests. To help clarify, we have edited the manuscript Materials and Methods Room Chamber Method (“RCM”) section (lines 211-212 of revised manuscript) to include the following :

“Although this study did not investigate control leak fluxes lower than 0.2 ft3 day-1, smaller leak fluxes could be investigated using this method.”

Was there any activity in the buildings during the tests, for example, gas dryers or furnaces running/not running? (And how might this impact results.) The cycling of water heaters was mentioned, and since it may have had an impact on results this issue seems important to address.

Author’s response:

No NG dryers or NG central heating systems were in use during the experiments. In some buildings, domestic water heating NG furnaces or boilers were observed to be cycling on/off (as we note on lines 247-250). Different times of year might result in different frequency of spikes (eg winter and furnace cycling) and it will be interesting to explore. We’ve improved the conclusion section by changing the word ‘temporally’ to ‘seasonally’ (line 429 of revised manuscript).

With RCM, methane concentration spikes due to cycling of appliances were clearly visible by inspection of results. We tested the effect of these intermittent short duration spikes by including or excluding them in RCM modeling, and have added the results in S10 to the affected experiments R10, R15 and R16.Calculated fluxes were all within the same order of magnitude leak rate (0.04 vs 0.19, 0.47 vs 0.49 and 0.17 vs 0.16 ft3 CH4 day-1).

Bag Method results could be impacted by fuel slip spikes and the sampling protocol could be further developed to increase this method’s resilience. We have added the following sentence to the last paragraph of the Results and Discussion -> ​​Simplified Room Chamber Method (“Bag method”) (lines 374-378 of revised manuscript) :

“Due to its lower sampling rate, this method’s results could be more susceptible to air CH4 concentration spikes from NG appliance cycling. For example, if the second sample were taken nearer in time or space to a spike, the calculated flux might appear larger. Sampling protocol could be further improved, for example by performing the air flush/sample steps multiple times.”

We have also changed the word ‘theoretically’ to ‘potentially’ in the Conclusions section (line 417 of revised manuscript).

Line 252 and again on line 331: What is "precision sought"? (See detection limit comment above; if a detection limit was given you would be able to define precision sought.

Author’s response:

We wanted to develop a method that provides us with an order-of-magnitude of emissions (0.1, 1, 10, 100 ft3 CH4 day-1). We did not seek a precision or accuracy less than 0.2 ft3 CH4 day-1, because we are not interested in detecting smaller leak fluxes with this method. We have updated the Abstract (lines 21-24 of revised manuscript) as follows:

‘We develop and test a simple and widely deployable closed chamber method that can be used for quantifying indoor methane emissions at a with an order-of-magnitude precision which allows for screening of indoor large volume (“super-emitting”) leaks.’

Line 261: "After taking fluctuations and spikes into account": does this mean that these data points were considered outliers and excluded from the analysis? What was the decision making process?

Author’s response:

We modeled RCM fluxes with and without spikes and fluctuations being included and results remained within the same order of magnitude, i.e. in our sought after level of precision. We discussed spikes in our response to your earlier question regarding activity of NG appliances.

In some experiments (R2, R9, R13, R16, R18, R19, R21), we observed fluctuations after the initial rise phase. For these, we had enough data to model with RCM that didn’t include fluctuations.

In experiments where we observed fluctuations affecting the rise phase (R1, R3, R4, R11), we tested the effect of these fluctuations by including or excluding them in RCM modeling, and have added the results in S10 to the affected experiments. In these comparison sets, calculated fluxes were all within the same order of magnitude leak rate (0.13 vs 0.13, 0.05 vs 0.02, 0.02 vs 0.03 and 0.21 vs 0.17 ft3 CH4 day-1).

Our decision making process also included prioritizing the use of a data range that was observed to be the initial rise phase prior to a plateau (or steady state).

Also line 261: Do we know how much pressure can fluctuate in the NG distribution system? I would guess these fluctuations would have to be small.

Author’s response:

We did not measure supply side or post-meter pressure fluctuations. There is some evidence that pressure does fluctuate on the NG distribution system based on demand across the year. Also, according to at least one utility spokesperson : “most of the year pressures do not fluctuate more than about 20% on many of our different systems, but during winter, with very cold weather and high gas consumption, the pressure ranges can be considerably more than 20%.”. Seasonal NG distribution system pressure fluctuations may be significant, but that would not have been a concern within the minute-to-hour time scales studied here. Our future work explores measuring distribution system pressure with smart gas meters.

Line 308: I find it interesting that emissions changed linearly with basement volume. When you consider the potential sources, some are likely the same (one gas dryer, one water heater, etc.) regardless of a big or small basement. Comments on this?

Author’s response:

Thank you for your point. After reviewing this line, we felt it was potentially confusing and have removed it (from equation 1 it should be clear that varying the room volume will result in a directly proportional change in the flux result). The room air CH4 concentration measurements do not use room volume.

Thank you Reviewer #1 for taking the time and effort to provide your thoughtful and helpful comments, questions and input. It is very much appreciated.

Reviewer #2: The contribution proposes a new and simple method to measure methane emissions from indoor sources, which is an insufficiently considered. Better assessing these emissions could reduce the gap between top-down and bottom-up estimates. The experiments have been properly conducted, and the conclusions clearly reflect the obtained results.

Mathematical and statistical data processing is appropriate. All data underlying the findings is fully available. The manuscript is written in a clear manner, with a high quality of English language.

Author’s response:

Thank you Reviewer #2 for your review and generous comments.

6. PLOS authors have the option to publish the peer review history of their article (what does this mean?). If published, this will include your full peer review and any attached files.

If you choose “no”, your identity will remain anonymous but your review may still be made public.

Do you want your identity to be public for this peer review? For information about this choice, including consent withdrawal, please see our Privacy Policy.

Reviewer #1: No

Reviewer #2: No

Attachment

Submitted filename: Response to Reviewers.docx

Decision Letter 1

Yanping Yuan

15 Nov 2023

A Simple Method To Measure Methane Emissions From Indoor Gas Leaks

PONE-D-23-18731R1

Dear Dr. Nicholas,

We’re pleased to inform you that your manuscript has been judged scientifically suitable for publication and will be formally accepted for publication once it meets all outstanding technical requirements.

Within one week, you’ll receive an e-mail detailing the required amendments. When these have been addressed, you’ll receive a formal acceptance letter and your manuscript will be scheduled for publication.

An invoice for payment will follow shortly after the formal acceptance. To ensure an efficient process, please log into Editorial Manager at http://www.editorialmanager.com/pone/, click the 'Update My Information' link at the top of the page, and double check that your user information is up-to-date. If you have any billing related questions, please contact our Author Billing department directly at authorbilling@plos.org.

If your institution or institutions have a press office, please notify them about your upcoming paper to help maximize its impact. If they’ll be preparing press materials, please inform our press team as soon as possible -- no later than 48 hours after receiving the formal acceptance. Your manuscript will remain under strict press embargo until 2 pm Eastern Time on the date of publication. For more information, please contact onepress@plos.org.

Kind regards,

Yanping Yuan

Academic Editor

PLOS ONE

Additional Editor Comments (optional):

Reviewers' comments:

Reviewer's Responses to Questions

Comments to the Author

1. If the authors have adequately addressed your comments raised in a previous round of review and you feel that this manuscript is now acceptable for publication, you may indicate that here to bypass the “Comments to the Author” section, enter your conflict of interest statement in the “Confidential to Editor” section, and submit your "Accept" recommendation.

Reviewer #1: All comments have been addressed

**********

2. Is the manuscript technically sound, and do the data support the conclusions?

The manuscript must describe a technically sound piece of scientific research with data that supports the conclusions. Experiments must have been conducted rigorously, with appropriate controls, replication, and sample sizes. The conclusions must be drawn appropriately based on the data presented.

Reviewer #1: Yes

**********

3. Has the statistical analysis been performed appropriately and rigorously?

Reviewer #1: Yes

**********

4. Have the authors made all data underlying the findings in their manuscript fully available?

The PLOS Data policy requires authors to make all data underlying the findings described in their manuscript fully available without restriction, with rare exception (please refer to the Data Availability Statement in the manuscript PDF file). The data should be provided as part of the manuscript or its supporting information, or deposited to a public repository. For example, in addition to summary statistics, the data points behind means, medians and variance measures should be available. If there are restrictions on publicly sharing data—e.g. participant privacy or use of data from a third party—those must be specified.

Reviewer #1: Yes

**********

5. Is the manuscript presented in an intelligible fashion and written in standard English?

PLOS ONE does not copyedit accepted manuscripts, so the language in submitted articles must be clear, correct, and unambiguous. Any typographical or grammatical errors should be corrected at revision, so please note any specific errors here.

Reviewer #1: Yes

**********

6. Review Comments to the Author

Please use the space provided to explain your answers to the questions above. You may also include additional comments for the author, including concerns about dual publication, research ethics, or publication ethics. (Please upload your review as an attachment if it exceeds 20,000 characters)

Reviewer #1: (No Response)

**********

7. PLOS authors have the option to publish the peer review history of their article (what does this mean?). If published, this will include your full peer review and any attached files.

If you choose “no”, your identity will remain anonymous but your review may still be made public.

Do you want your identity to be public for this peer review? For information about this choice, including consent withdrawal, please see our Privacy Policy.

Reviewer #1: No

**********

Acceptance letter

Yanping Yuan

21 Nov 2023

PONE-D-23-18731R1

A Simple Method To Measure Methane Emissions From Indoor Gas Leaks

Dear Dr. Nicholas:

I'm pleased to inform you that your manuscript has been deemed suitable for publication in PLOS ONE. Congratulations! Your manuscript is now with our production department.

If your institution or institutions have a press office, please let them know about your upcoming paper now to help maximize its impact. If they'll be preparing press materials, please inform our press team within the next 48 hours. Your manuscript will remain under strict press embargo until 2 pm Eastern Time on the date of publication. For more information please contact onepress@plos.org.

If we can help with anything else, please email us at customercare@plos.org.

Thank you for submitting your work to PLOS ONE and supporting open access.

Kind regards,

PLOS ONE Editorial Office Staff

on behalf of

Prof. Yanping Yuan

Academic Editor

PLOS ONE

Associated Data

    This section collects any data citations, data availability statements, or supplementary materials included in this article.

    Supplementary Materials

    S1 Appendix. Selected building locations and characteristics.

    (PDF)

    S2 Appendix. Ambient CH4 air concentration measurements.

    (PDF)

    S3 Appendix. Air CH4 concentrations over time during air flushing phase.

    (PDF)

    S4 Appendix. Room chamber method (RCM).

    (PDF)

    S5 Appendix. Simplified room chamber method (“Bag method”).

    (PDF)

    S6 Appendix. Testing methods with metered CH4 releases.

    (PDF)

    S7 Appendix. Leaks.

    (PDF)

    S8 Appendix. Building age relationships.

    (PDF)

    S9 Appendix. Instrument quality control tests.

    (PDF)

    S10 Appendix. Individual RCM experiment data and modeling plots.

    (PDF)

    S1 Data

    (ZIP)

    Attachment

    Submitted filename: Response to Reviewers.docx

    Data Availability Statement

    All relevant data are within the manuscript and its Supporting Information files.


    Articles from PLOS ONE are provided here courtesy of PLOS

    RESOURCES