Abstract
Single-celled cotton fiber (Gossypium hirsutum) provides a unique experimental system to study cell elongation. To investigate the role of the actin cytoskeleton during fiber development, 15 G. hirsutum ACTIN (GhACT) cDNA clones were characterized. RNA gel blot and real-time RT-PCR analysis revealed that GhACT genes are differentially expressed in different tissues and can be classified into four groups. One group, represented by GhACT1, is expressed predominantly in fiber cells and was studied in detail. A 0.8-kb GhACT1 promoter sufficient to confirm its fiber-specific expression was identified. RNA interference of GhACT1 caused significant reduction of its mRNA and protein levels and disrupted the actin cytoskeleton network in fibers. No defined actin network was observed in these fibers and, consequently, fiber elongation was inhibited. Our results suggested that GhACT1 plays an important role in fiber elongation but not fiber initiation.
INTRODUCTION
Actin cytoskeleton plays an important role in cell morphogenesis in plants as demonstrated by pharmacological, biochemical, and genetic studies (Kost and Chua, 2002; Mathur and Hülskamp, 2002). The actin cytoskeleton may be involved in the transportation of organelles and vesicles carrying membranes and cell wall components to the site of cell growth as in root hairs, trichome cells, and pollen tubes. Therefore, the actin cytoskeleton is essential for cell elongation and tip growth. Disruption of the actin cytoskeleton during trichome development by actin-interacting drugs resulted in randomly distorted trichomes with unextended branches (Mathur et al., 1999; Szymanski et al., 1999). Similarly, inhibition of F-actin elongation blocked the initiation of polar growth and elongation of root hairs (Miller et al., 1999). Furthermore, reduction in actin arrays resulted in dramatic reduction of root hair length and caused severe bulges in the actin2 (act2) mutant and serious retardation of root growth in the act7 mutant in Arabidopsis thaliana (Gilliland et al., 2002, 2003). Misexpression of the reproductive ACT11 gene in vegetative tissues of Arabidopsis altered morphology of most organs in plants because of its effects on the proportion of different actin isovariants (Kandasamy et al., 2002). In polarized elongating cell types, such as root hairs and trichomes, it is believed that long F-actin cables oriented longitudinally throughout the shank and subapical, and net-axially aligned fine F-actins are essential for the intracellular trafficking of organelles and secretory vesicles to the growing apical region to deliver new membranous and cell wall materials (Mathur et al., 1999; Miller et al., 1999; Szymanski et al., 1999; Baluska et al., 2000; Hepler et al., 2001; Chueng et al., 2002). The unstable dynamic F-actin cytoskeleton also plays a role in localized expansion of root hairs and trichome cells (Ketelaar et al., 2003; Mathur, et al., 2003a).
The actin cytoskeleton controls polar cell growth through its interaction with several actin binding proteins, such as actin depolarizing factor (Dong et al., 2001; Chen et al., 2002), profilin (Clarke et al., 1998), Rho family GTPase (Yang, 1998; Chueng et al., 2002; Fu et al., 2002), and the calcium signaling pathway (Malhó, 1998; Franklin-Tong, 1999; Li et al., 1999). The effective regulation of actin turnover by actin regulators may be critical for pollen tube growth (Chen et al., 2002, 2003) and for polar cell expansion in cell types other than root hair and trichome (Fu et al., 2002). Recent studies showed genetically that the actin cytoskeleton by interacting with the ARP2/ARP3 complex plays a pivotal role in controlling cell shape of trichome cells and several other cell types in Arabidopsis (Mathur et al., 2003a, 2003b). In cotton (Gossypium hirsutum), F-actin has been implicated in regulating microtubule orientation during fiber development shown by in vitro drug studies (Seagull, 1990). However, the role of the actin cytoskeleton in cotton fiber cell development remains largely unknown.
Actins in plants are encoded by a multigene family that comprises dozens or even hundreds of actin genes. In Arabidopsis, the actin gene family contains 10 distinct members, of which eight are functional genes and two are pseudogenes (McDowell et al., 1996). In other plant species, the actin gene family also appears to have dozens of members (Baird and Meagher, 1987; Thangavelu et al., 1993; Meagher and Williamson, 1994). Studies on actin sequences revealed that structural and functional divergence occurred within the gene family during evolution (McDowell et al., 1996; Meagher et al., 1999a). Members of the actin gene family are divergent and differentially expressed during plant development. Arabidopsis contains two major actin gene classes: a vegetative class that is expressed predominantly in leaves, stems, roots, petals, and sepals and a reproductive class that is strongly expressed in pollens, ovules, and embryonic tissues (McDowell et al., 1996; Kandasamy et al., 1999). The soybean (Glycine max) actin gene family includes at least three divergent classes: μ-, κ-, and λ-actin. The μ-actin transcripts are differentially accumulated in leaves, roots, and hypocotyls. The κ- and λ-actin proteins are preferentially localized in roots (McLean et al., 1990). In other plant species, such as rice (Oryza sativa) and tobacco (Nicotiana tabacum), actin genes also appear to be expressed in a tissue-specific manner (McElroy et al., 1990; Thangavelu et al., 1993). Although actin genes in a few plant species such as Arabidopsis have been well characterized, our knowledge of cotton actin genes, especially its role in fiber development, needs to be explored.
Cotton fibers, as a premier natural fiber and extensively used in the textile industry, are derived from epidermal cells of the reproductive organ, the ovule. Approximately 30% of the ovule epidermal cells elongate and develop into single-celled fibers at anthesis. Each fiber is perhaps the longest single cell in higher plants. Its elongation rate and the final length attained are far above that of common plant cells (Cosgrove, 1997). Fiber development is a highly regulated process involving four sequential stages: fiber initiation, primary cell wall formation, secondary cell wall formation, and maturation (Basra and Malik, 1984). Thus, the cotton fiber represents a unique experimental system for studying the control of cell elongation without the complication of cell division and multicellular development (Ruan et al., 2001). The study on fiber development not only provides the basic understanding of cell differentiation and elongation, but also identifies potential target genes for genetic manipulation of cotton fiber. Here, we reported the identification and characterization of the actin gene family in cotton and explored its role in fiber development using RNA interference (RNAi) technology.
RESULTS
Isolation and Characterization of GhACT cDNAs
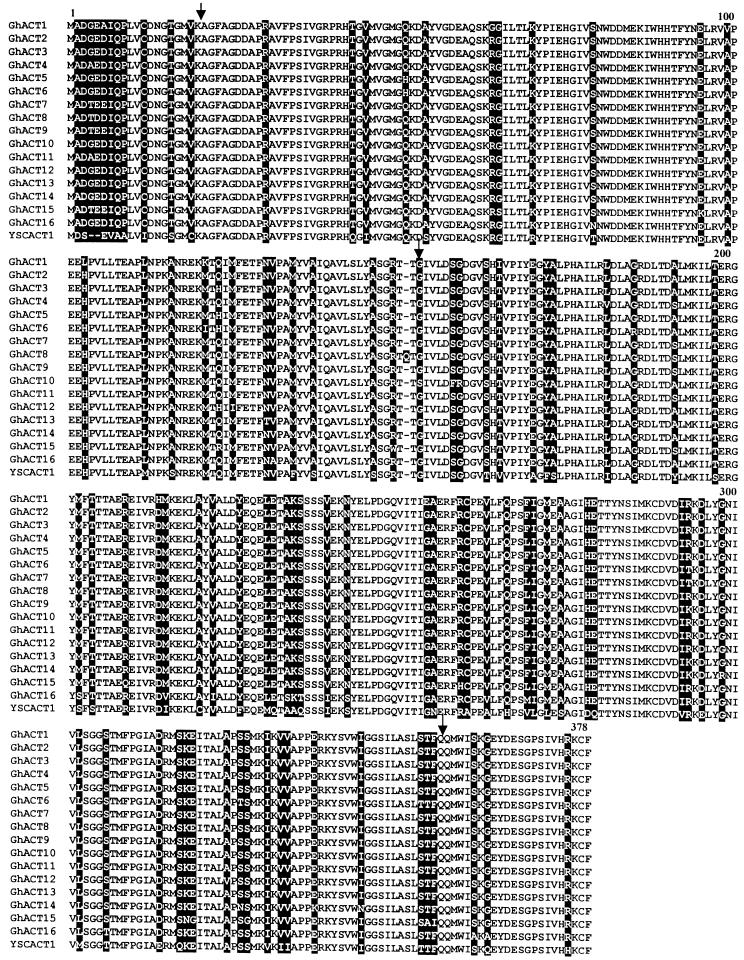
To isolate genes involved in cotton fiber development, we have randomly sequenced >300 cDNA clones from a fiber cDNA library (Li et al., 2002). Clones, including an actin cDNA, likely involved in cell elongation were chosen for further study. Using the actin cDNA clone as probe, we further isolated 15 unique actin cDNAs (designated GhACT genes; accession numbers in GenBank, AY305723 to AY305737) from a cotton cDNA library. Sequence analysis predicted that all GhACT genes, except GhACT8, encode a 377–amino acid polypeptide. The GhACT8 encodes an actin containing 378 amino acid residues with a Gln insertion at position 151 (Figure 1). The GhACT genes share high sequence homology at nucleotide level (70 to 97% identity) in the coding region and at the amino acid level (93 to 99% identity). There is only 1 to 7% substitution rate at amino acid level compared with each other (Figure 1). In total, 21 charged substitutions occurring at 14 charged positions were present in GhACTs. Among them, charged amino acids were exclusively substituted with uncharged residues at six locations (Arg/Gly, Thr or Gln, Asp/Ala, Glu/Gly, His/Leu, or Lys/Trp) and were only substituted by a synonymous charged amino acid at other positions. The charged amino acids at residues 6 and 292 were substituted by either a charged amino acid or an uncharged residue (Figure 1), suggesting that these positions may not be important for actin structure. While at residue 123, both charged and polar uncharged amino acids were present in GhACTs. In addition, 11 uncharged amino acids at six positions were substituted by a charged residue. Often in this case, Gln was substituted by a His and Gly replaced by an Arg. Intriguingly, most nonsynonymous substitutions occur only in GhACT1 protein. For example, positively charged amino acids were substituted by a nonpolar, uncharged amino acid at positions 64 and 103. On the other hand, nonpolar amino acids were replaced by positively charged and negatively charged polar residues at positions 121 and 253, respectively. At position 213, the negatively charged Asp was substituted by a positively charged His, suggesting that GhACT1 may have a different structure and function than other GhACT variants.
Figure 1.
Comparison of the Predicted Amino Acid Sequences of Cotton GhACT Genes.
Multiple alignment of amino acid sequences of 16 cotton GhACT genes and yeast YSCACT1. Amino acid substitutions are highlighted in black. Arrows indicate the positions of the three introns in cotton GhACT genes. GhACT1 to GhACT15 were from this work; GhACT16 is a putative actin derived from a genomic sequence in GenBank (accession number AF059484).
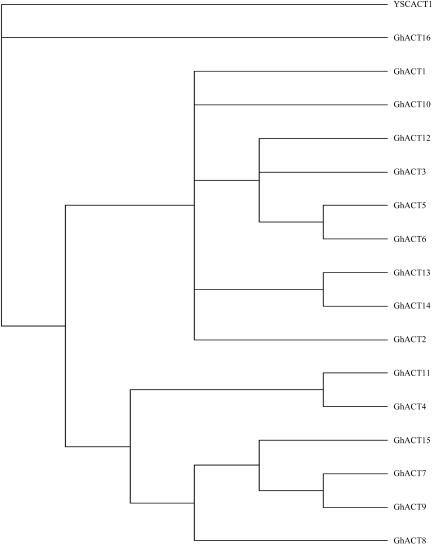
Phylogenetic analysis on amino acid sequences showed that the 16 GhACTs available could be divided into nine subgroups (Figure 2). Among them, five subgroups contain only a single member, and the remaining four subgroups have two to four members. Each of GhACT1, GhACT2, GhACT8, GhACT10, and GhACT16 forms an independent clade, suggesting that these GhACTs diverged early during evolution, whereas GhACT3, GhACT5, GhACT6, and GhACT12 together form a single branch, indicating that divergence of these genes occurred relatively late.
Figure 2.
Phylogenetic Relationships of Cotton Actins.
The rooted gene tree shown is based on majority-rule consensus from 500 bootstrap replicates and resulted from heuristic searching in PAUP 4.0, based on amino acid sequences of the GhACT genes. Cotton GhACT1 to GhACT15 actins were from this work; GhACT16 is a putative actin derived from a genomic sequence in GenBank (accession number AF059484); YSCACT1 is a yeast actin (accession number L00026) used as an outgroup.
GhACT Genes Are Differentially Expressed in Different Organs
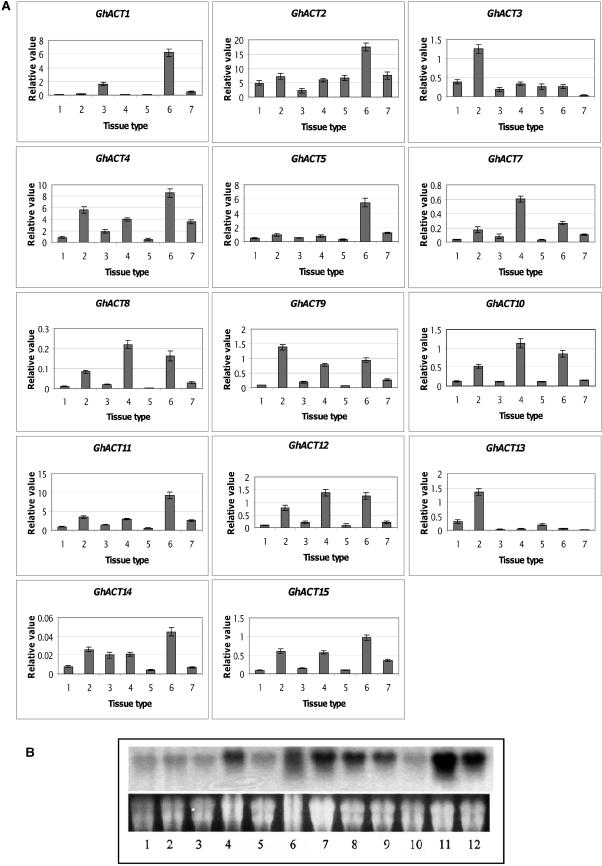
To identify GhACT genes that are preferentially expressed in cotton fibers, the expression patterns of 15 GhACT cDNA clones were analyzed by real-time quantitative SYBR-Green RT-PCR using gene-specific primers (Table 1) as described in Methods. The cotton polyubiquitin gene (GhUBI; X.B. Li and W.C. Yang, unpublished data) expressed equally in all tissue types with cycle threshold (Ct) values at 17.52 ± 0.35 and was chosen as a standard control to normalize differences in RNA template concentrations. Five out of the fifteen GhACT genes are expressed at relatively high levels in fiber cells (Figure 3A). GhACT2 is expressed at high levels in all tissues compared with other GhACTs, and its expression level reaches a relative value of 17 in fibers as compared with ∼5 in other tissue types. For example, GhACT2 expression in fibers is ∼370-fold higher than GhACT14. GhACT1 and GhACT5 are strongly expressed in fiber and very low in leaf, stem, root, and anther, indicating that they are preferentially expressed in fiber cells. GhACT4 and GhACT11 also showed similar expression patterns as GhACT1 and GhACT5 in fiber and were moderately expressed in other tissues, whereas the transcripts of other GhACT genes are very low, as shown in the small values in the y axis. Overall, GhACT3, GhACT9, GhACT10, and GhACT12 are expressed at least fivefold less in fibers compared with GhACT1, GhACT2, GhACT4, GhACT5, and GhACT11. By contrast, the expression of GhACT7, GhACT8, GhACT14, and GhACT15 is extremely low if compared with GhACT1, GhACT2, GhACT4, GhACT5, and GhACT11. Moreover, GhACT6 expression is not detectable in all the tissues examined. The results of the real-time RT-PCR revealed that the actin genes in cotton were differentially expressed, with GhACT1, GhACT2, GhACT4, GhACT5, and GhACT11 being the predominant forms in fiber cells (Figure 3A).
Table 1.
Primers Used in Gene-Specific RT-PCR of GhACT Genes
| Genes | Primers |
|---|---|
| GhACT1 | 5′-CCCTTGAATATTAAATAAATAAAAAAATA-3′ |
| 5′-TTGTGCTCAGTGGGGGTTCAACC-3′ | |
| GhACT2 | 5′-TGCCCGGAAGTCCTCTTCCAG-3′ |
| 5′-ATTTTCCCAGAAGTTTGACCGCGC-3′ | |
| GhACT3 | 5′-CCCTTGAATATTAAATAATAATAAGCAC-3′ |
| 5′-TTGTGCTCAGTGGGGGTTCAACT-3′ | |
| GhACT4 | 5′-GGGGGAGCCTTGAATATGAAATTG-3′ |
| 5′-TTGTGCTCAGTGGGGGTTCAACC-3′ | |
| GhACT5 | 5′-ATTTTCCCAGAAGTTTGACCGCGC-3′ |
| 5′-TGCCCGGAAGTCCTCTTCCAA-3′ | |
| GhACT7 | 5′-TTAAAGAAAATATAAGAAATAAGCATCA-3′ |
| 5′-GTATGCCAGTGGTCGGACGACA-3′ | |
| GhACT8 | 5′-TTAAAGAAAATATAAGAAATAAGCATCA-3′ |
| 5′-GTATGCCAGTGGTCGGACGCAG-3′ | |
| GhACT9 | 5′-ATCTTCAACATAAAAGATCATCCCACT-3′ |
| 5′-GATCTATCTTGGCATCACTCAGCA-3′ | |
| GhACT10 | 5′-AACCAGATATTAAATATAATTTCCGTAG-3′ |
| 5′-GGGAAATTGTCCGTGACATGAAG-3′ | |
| GhACT11 | 5′-ACAATAGCTATTGACATTAATGTTTGC-3′ |
| 5′-TTGTGCTCAGTGGGGGTTCAACT-3′ | |
| GhACT12 | 5′-AACCAGATATTAAATATAATTTCCGTAG-3′ |
| 5′-GGGAAATTGTCCGTGACATGAAA-3′ | |
| GhACT13 | 5′-CCCTTGAATATTAAATAATAATAAGCAC-3′ |
| 5′-TTGTGCTCAGTGGGGGTTCAACC-3′ | |
| GhACT14 | 5′-AACCAGATATTAAATATAATTTCCGTAA-3′ |
| 5′-ATTGGAGCTGAGAGATTCCGTTG-3′ | |
| GhACT15 | 5′-ATCTTCAACATAAAAGATCATCCCACT-3′ |
| 5′-GATCTATCTTGGCATCACTCAGCG-3′ | |
| GhUBI | 5′-CTGAATCTTCGCTTTCACGTTATC-3′ |
| 5′-GGGATGCAAATCTTCGTGAAAAC-3′ |
The efficiency of each primer pair was detected using GhACT cDNA clones as standard templates, and the RT-PCR data were normalized with the relative efficiency of each primer pair.
Figure 3.
Analyses of Expression of GhACT Genes in Cotton Tissues.
(A) Real-time RT-PCR analysis of expression of GhACT genes in cotton tissues. Relative value of GhACT gene expression in cotton tissues, including leaf (1), stem (2), cotyledon (3), root (4), anther (5), fiber (6), and petal (7), was shown as percentage of GhUBI expression activity (see Methods).
(B) RNA gel blot analysis of GhACT1 transcripts in cotton. Total RNA (20 μg/lane) from petal (1), anther (2), leaves (3), cotyledon (4), root (5), ovule (6 to 10) at 4, 8, 14, 21, and 28 DPA, and fiber (11 and 12) at 8 and 14 DPA was fractionated on a 1.2% denaturing agarose gel and transferred onto a nylon membrane (see Methods). Top panel, autoradiograph of RNA hybridization; bottom panel, RNA gel before transfer to membrane showing equal loading of RNAs.
RNA gel blot analysis, using the 3′-untranslated region (UTR) of GhACT1 as a probe, further demonstrated that GhACT1 accumulated at high level in fibers and at a relatively lower level in ovules. The level of GhACT1 transcripts reached the highest level during 8 to 14 d postanthesis (DPA) and decreased gradually as the ovule developed. At 28 DPA, hardly any transcript was detected. No or very little transcripts were detected in anthers, petals, leaves, and roots (Figure 3B). A moderate level of GhACT1 was detected in cotyledons. This result further confirmed that the GhACT1 gene is preferentially expressed, especially in elongation phase in cotton fiber cells.
Isolation and Characterization of GhACT Genes
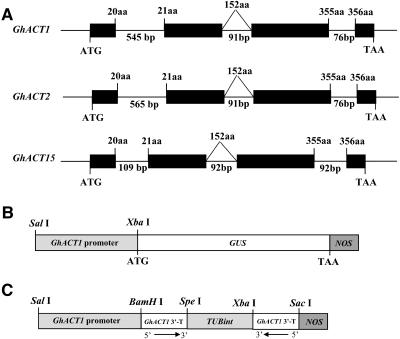
Five genomic DNA clones, representing GhACT1, GhACT2, and GhACT15 (Figure 4A), were isolated from a cotton genomic library using GhACT1 cDNA as probe. The isolated GhACT1 gene is ∼3.9 kb in length, including 1.6 kb of the 5′ promoter region, 1.8 kb transcribed region, and 0.5 kb 3′ downstream sequence. Sequence comparison between cDNA and genomic clones revealed that the three GhACT genes all contain four exons and three introns (Figure 4A). The three introns are located exactly at the same positions in all three genes: between amino acid residues 20 and 21, within residue 152, and between residues 355 and 356, respectively. The size and position of introns in GhACT1 and GhACT2 are almost identical (Figure 4A). Intron 1 is 545 and 565 bp in length in GhACT1 and GhACT2, respectively, much longer than intron 2 and intron 3. By contrast, intron 1 in GhACT15 is relatively short, with only 109 bp. The lengths of introns 2 and 3 are similar in all three genes. These data indicate that GhACT gene structure is quite conserved in cotton.
Figure 4.
GhACT Gene Structure, GhACT1∷GUS, and GhACT1 RNAi Construction.
(A) Exons are denoted by black boxes. Introns, 5′-flanking region, and 3′- UTR are denoted by lines. The lengths of the introns in base pairs are indicated. The number at the boundaries of each exon indicates the codon at which the intron is located. The translation initiation and termination codons are shown. aa, amino acids.
(B) The length of the GhACT1 promoter and cloning sites used for GhACT1∷GUS fusion are shown.
(C) GhACT1 RNAi construction.
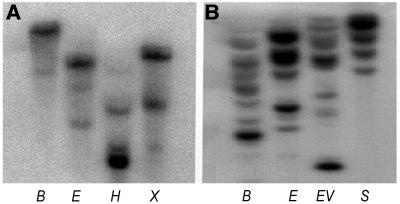
To determine the actin gene family copy numbers, cotton genomic DNA was digested with BamHI, EcoRI, EcoRV, HindIII, SacI, and XalI and subjected to DNA gel blot analysis. There was one major band and one to two weak bands when the 0.8-kb 5′ noncoding region of GhACT1 was used as a probe. The major band represents GhACT1, and the weaker bands most likely are due to cross-hybridization with other members of the actin gene family, though the 5′ noncoding region was used as probe (Figure 5A). Furthermore, several bands were detected when using the more conserved exon 3 of GhACT1 as a probe under highly stringent conditions (Figure 5B). This suggested that there are at least four to eight members of the actin family that share a highly conserved coding region with GhACT1, and the remains may diverge earlier during the evolution of the cotton actin gene family.
Figure 5.
Genomic DNA Gel Blot Analysis of the GhACT1 Gene.
Thirty micrograms of genomic DNA was digested with restriction enzymes as indicated and fractionated on a 0.8% agarose gel. DNA gel blots were hybridized with 32P-labeled GhACT1 5′-region gene-specific probe (0.8 kb) (A) and 32P-labeled GhACT1 exon 3 probe (0.6 kb) (B). B, BamHI; E, EcoRI; H, HindIII; X, XbaI; EV, EcoRV; S, SacI.
The GhACT1∷β-Glucuronidase Fusion Gene Is Predominantly Expressed in Cotton Fibers
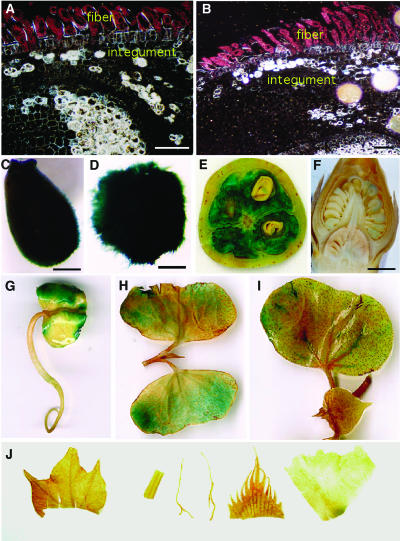
To characterize the precise expression pattern of GhACT genes in cotton fibers, we chose GhACT1 for further study because it represents GhACTs that are expressed preferentially in fibers (Figure 3A) among the three available genomic sequences. A 0.8-kb promoter region of GhACT1 was subcloned upstream of the β-glucuronidase (GUS) reporter gene in pBI101 vector, giving rise to the GhACT1∷GUS gene (Figure 4B). The GhACT1∷GUS construct was introduced into cotton cultivar Coker312 via Agrobacterium tumefaciens–mediated DNA transformation. A total of 230 transformed T0 plants from 21 independent calli were obtained and transplanted to soil for seeds. A total of 52 of 230 T0 transgenic plants were examined in detail for GUS expression patterns. In all of the 52 transgenic plants examined, strong GUS activity was detected only in young fibers (Figures 6A to 6E), whereas no or weak GUS staining was observed in ovules, anthers, petals, sepals, leaves, and roots, including their trichomes (Figures 6F and 6J). In comparison, plants transformed with the positive control pBI121 (35S∷GUS) exhibited strong GUS activity in all tissues, and the nontransformed plants showed no GUS activity in fibers as well as in other tissues under the same staining conditions (data not shown). The same pattern of GhACT1∷GUS expression was further confirmed in T1 and T2 transgenic plants. In addition, the GhACT1∷GUS expression was observed at a moderate level in cotyledons of the germinating embryos at the first 1 to 2 d, when the root had just emerged from the embryo and the two cotyledons had not yet unfolded. In 3- to 4-d-old seedlings, moderate GUS activity was still observed in the cotyledon tissues (Figure 6G). Hypocotyls showed a low level of GUS activity in only one of the 21 independent transgenic lines examined. GhACT1∷GUS expression was not detected in the roots of 3- to 8-d-old seedlings. Occasionally, weak expression was detected in the root tip in one transgenic line. As the seedling grew, GUS activity gradually decreased and finally disappeared in the cotyledons (Figures 6H and 6I). In 2-week-old seedlings, no significant GUS activity in the transgenic plants was detected. These results indicated that the 0.8-kb GhACT1 promoter was sufficient to direct its fiber-specific expression and regulate its dynamic expression during cotton plant development.
Figure 6.
Histochemical Localization of GUS Activity in Transgenic Cotton Plants Containing the GhACT1∷GUS Fusion Genes.
(A) and (B) Dark-field micrographs of 5-μm-thick cross sections of 1- to 2-DPA ovules. A high level of GUS activity (represented by pink dots) was only found in the fiber, and very weak GUS staining was seen in the inner cell layers. No GUS staining was detected in the epidermal atrichoblast and integument.
(C) to (J) Bright field of micrographs or photographs of ovules and other tissues/organs.
(C) and (D) GUS staining in ovules at 1 (C) and 2 (D) DPA. Strong GUS activity was observed in the fibers.
(E) A cross section of a transgenic cotton boll at 14 DPA. Strong GUS activity was detected in the developing fibers, and very weak GUS staining was seen in embryos.
(F) A longitudinal section of a transgenic flower bud before anthesis. Weak GUS staining was found in some pollen grains.
(G) to (I) GUS staining in transgenic seedlings.
(G) Three-day-old seedling. GUS gene was expressed moderately in the cotyledons.
(H) Parts of a 7-d-old seedling. Weak GUS expression was found only in cotyledons.
(I) Parts of a 10-d-old seedling. GUS activity was very low in cotyledons, and no GUS expression was detected in other tissues, such as leaf and shoot apex.
(J) No GUS activity was detected in leaf, stem, root, sepal, and petal (from left to right) of transgenic cotton.
Bars = 80 μm in (A) and (B), 1 mm in (C) and (D), and 2 mm in (F).
Suppression of GhACT1 Expression Dramatically Reduces Fiber Elongation
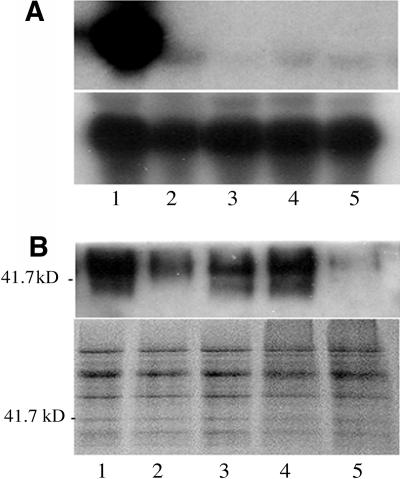
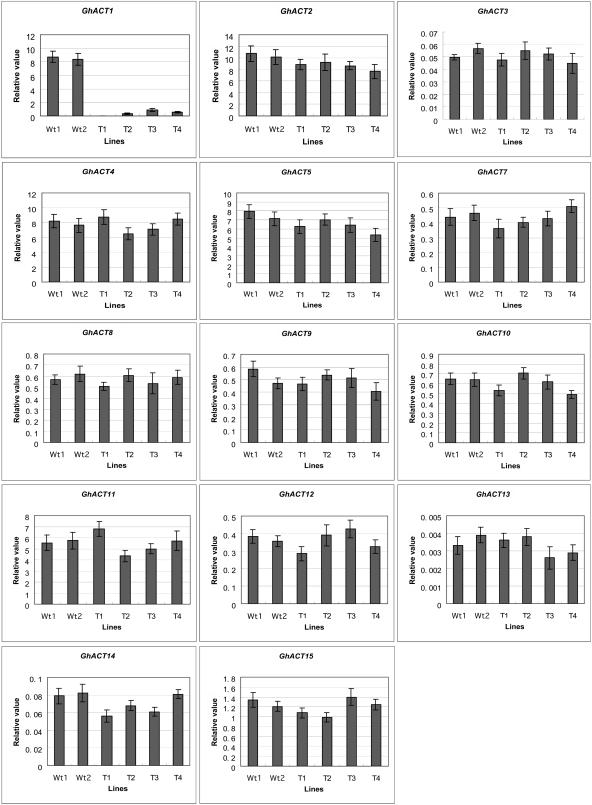
To study the role of actin cytoskeleton in fiber elongation, we chose a GhACT1 gene that is expressed preferentially in fibers and less expressed in other tissues or organs (Figure 3A). Therefore, it was expected that knockdown of this gene would have no or less effect on other tissues. Knockdown approaches using RNAi technology were employed. The 150-bp 3′-terminal fragment of GhACT1 was constructed in the opposite direction with an intron from a cotton tubulin gene as a spacer (Li et al., 2002), then subcloned into pBI101 downstream of its own promoter (Figure 4C) and introduced into cotton cultivar Coker312 via Agrobacterium-mediated DNA transfer. Fourteen independent transgenic lines were regenerated. RNA gel blot analysis showed that the level of GhACT1 mRNAs was reduced significantly down to very low level in fibers of the transgenic plants, using GhACT1 3′-UTR fragment as a probe (Figure 7A). To understand whether the reduced actin mRNAs also include other GhACT gene products, we further analyzed the expression levels of all the GhACT genes in fibers from RNAi transgenic plants by real-time quantitative SYBR-Green RT-PCR using gene-specific primers (Table 1). The results revealed that the expression of the GhACT1 RNAi resulted in complete GhACT1 silence in line T1 and ∼10-fold reduction in lines T2, T3, and T4 (Figure 8). On the contrary, its impact on the expression of other GhACT genes was minor, with ∼10% reduction (Figure 8). To confirm that the reduction in GhACT1 mRNA also led to reduction at the actin protein level, protein gel blot analysis using actin antibody was performed. A strong band was detected in nontransgenic control fibers, whereas no or weak signals were detected in the transgenic lines (Figure 7B). This indicated that there was significant reduction in the actin proteins (mostly GhACT1) as a result of the reduction in GhACT1 expression, and the remaining signals in the transgenic lines (Figure 7B, lanes 2 to 5) likely represented the other GhACT proteins expressed in fibers or residual GhACT1. These data suggest that GhACT1 is one of the dominant and functional actin isoforms in fibers.
Figure 7.
RNA Gel Blot and Protein Gel Blot Analyses of GhACT1 Expression in RNAi Transgenic Fibers of Cotton.
(A) RNA gel blot analysis. Total RNAs from fibers at 10 DPA from a wild-type plant (1) and GhACT1 RNAi transgenic lines (2 to 5) were fractionated on 1.2% denaturing agarose gel and transferred to a nylon membrane (see Methods). Top panel, autoradiograph of RNA gel blot hybridized with 32P-dCTP–labeled GhACT1 probe; bottom panel, autoradiograph of the same RNA gel blot hybridized with 32P-dCTP–labeled 18S RNA probe (control) showing equal loading of RNAs.
(B) Protein gel blot analysis. Total soluble proteins of fibers at 10 DPA from a wild-type plant (1) and GhACT1 RNAi transgenic lines (2 to 5) were separated by electrophoresis in a 12% SDS-PAGE gel. The protein gel blot was stained with anti-actin antibody (top panel) and Coomassie blue (bottom panel).
Figure 8.
Real-Time RT-PCR Analysis of GhACT1 RNAi Expression in Transgenic Fibers.
Relative value of GhACT gene expression in 8-DPA fibers is shown as a percentage of GhUBI expression activity (see Methods). The GhACT1 expression was significantly silenced by RNAi in the transgenic fibers, whereas the activities of the other GhACT genes were little affected in fibers of all the transgenic lines. Wt1 and Wt2, wild-type plants; T1 to T4, transgenic GhACT1 RNAi lines.
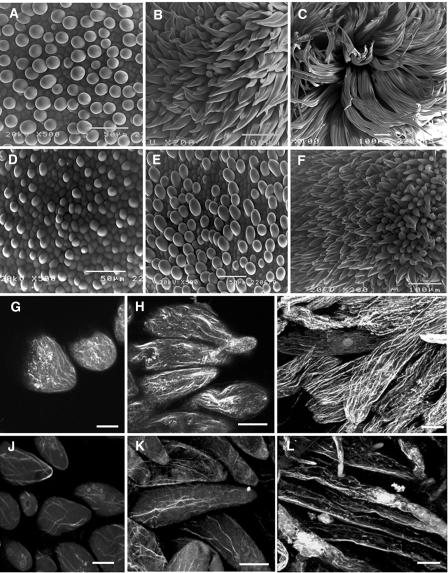
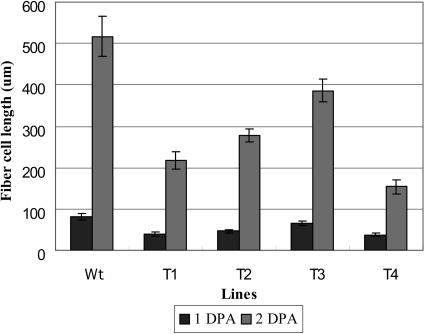
All GhACT1 RNAi transgenic plants showed a short-fiber phenotype (Figure 9) that cosegregated with the kanamycin selection marker (data not shown) and the reduction of actin protein levels, indicating that the phenotype was a result of the actin reduction caused by GhACT1 silence. Fiber cells differentiate and rapidly emerge from the surface of the ovule at 0 to 1 DPA in wild-type plants (Figure 9A), whereas fibers in transgenic plants (Figure 9D) were much shorter. At 2 DPA, fiber cells in wild-type plants reached ∼500 μm long (Figure 9B), whereas transgenic fibers were only ∼150 to 380 μm in length (Figure 9E). Fiber length at 3 DPA in most transgenic plants (Figure 9F) was equal to fibers at 2 DPA in wild-type cotton (Figure 9B) and much shorter than fibers at 3 DPA in wild-type plants (Figure 9C). Measurement of fiber length showed that fiber elongation in transgenic plants was ∼1.5- to 3-fold slower than that in wild-type plants (Figure 10), which correlated with the reduction of actin protein level (see Figure 7B). The results suggest that the reduction in total actins, including GhACT1, slowed down fiber elongation. Moreover, a portion of the ovules was sterile, and bolls in transgenic plants were smaller than those in the wild type after maturation, indicating that GhACT1 RNAi also slightly affected pollination or seed development. However, all the transgenic lines were unaffected in vegetative growth and flower development. No inhibition on fiber initiation was observed in the GhACT1 transgenic lines, suggesting the GhACT1 gene is most likely not involved in fiber initiation but plays a role in fiber elongation.
Figure 9.
Comparison of Fiber Growth Rate and F-Actin Organization in Fiber Cells between Transgenic GhACT1 RNAi and Wild-Type Plants.
(A) to (F) Scanning electron micrographs of the ovule surface of transgenic GhACT1 RNAi and wild-type plants.
(A) to (C) Ovules of wild-type plants at 1 (A), 2 (B), and 3 (C) DPA. Note the length of fibers increases with time.
(D) to (H) Ovules of transgenic plants at 1 (D), 2 (E), and 3 (F) DPA. Note the length of fibers is much shorter than that in wild-type plants at the same stages.
(G) to (L) Organization of actin filaments in fiber cells of wild-type and transgenic GhACT1 RNAi cotton.
(G) to (I) Fiber cells of wild-type cotton at 1 (G), 2 (H), and 3 (I) DPA. Actin filaments were organized into arrays parallel to the growing axis and extended into the tip of the fiber cells at 1 DPA (G). Actin filaments were arranged into thin arrays and thick cables along the shank in fiber cells at 2 DPA (H) and assumed a more complicated net structure of thick and longitudinally extending cables in >3-DPA fiber cells (I).
(J) to (L) Fiber cells of transgenic cotton at 1 (J), 2 (K), and 5 (L) DPA. Fewer F-actin cables were present.
Bars = 5 μm in (G) and (J) and 10 μm in (H), (I), (K), and (L).
Figure 10.
Fiber Length of Transgenic GhACT1 RNAi and Wild-Type Cotton Seeds at 1 and 2 DPA.
Ovules were sectioned and the length of 30 fiber cells was measured under a microscope for each transgenic line and wild type. Data was processed with Microsoft Excel. Compared with the wild type, fiber cells of transgenic plants are much shorter and are approximately one-half to one-third of wild-type fibers.
Impact of GhACT1 Suppression on the Actin Cytoskeleton in Fiber Cells
To investigate if changes in the actin cytoskeleton in GhACT1 RNAi transgenic fibers occurred, we studied actin cytoskeleton in fiber cells using rhodamine-phalloidin staining for F-actin. During fiber cell elongation in wild-type plants, F-actin exhibited a complicated net-like structure from thin filaments to thick and longitudinally extending cables. At the early stage of fiber elongation, actin filaments were organized into arrays parallel to the growing axis and extended into the tip of the fiber cells (Figure 9G). With further elongation of fiber cells, the actin cytoskeleton was comprised of relatively thin arrays and thick cables along the long axis of the fiber (Figure 9H). The F-actin cytoskeleton displayed an increasingly complicated network consisting predominantly of thick and longitudinally long cables (Figure 9I). By contrast, actin filaments in transgenic fibers were obviously reduced in the number of filaments, and a more random array was observed (Figure 9J). During further development of the fibers, they were less bundled into arrays and cables (Figure 9K, compare with Figure 9H) and exhibited a defective F-actin organization (Figures 9K and 9L). As a result of RNAi of GhACT1 expression in transgenic fibers, the devoid of the well-organized actin cytoskeleton consequently resulted in the reduction in fiber cell elongation, leading to the short-fiber phenotype. These data suggested that downregulation of the GhACT1 gene has an impact on actin cytoskeleton network in fiber cells.
DISCUSSION
Divergence of the Protein Structure of the GhACTs
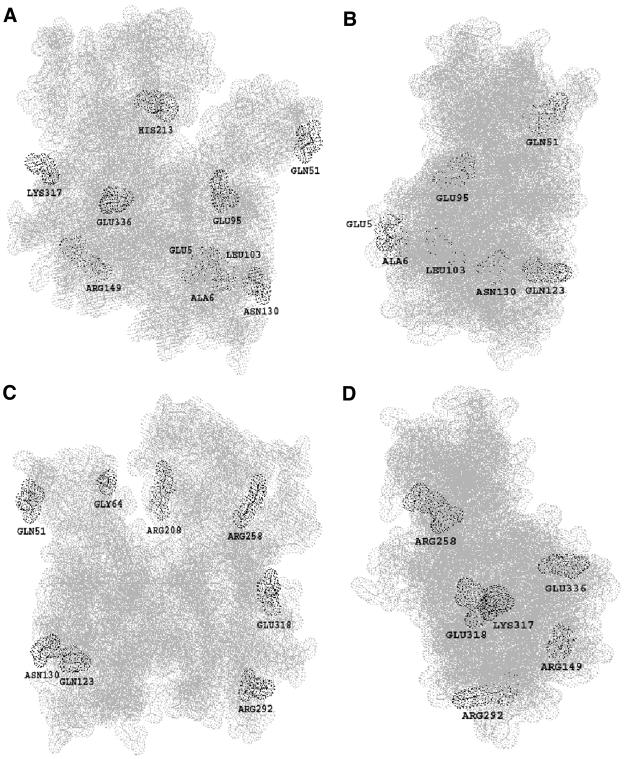
Although plant actins are quite conserved, the divergence on protein structures occurred during evolution. In this study, the 16 cotton actins deduced from the isolated GhACT genes have diverged into nine subclasses compared with six subclasses in Arabidopsis (McDowell et al., 1996). Variation among GhACTs occurs more significantly than that found among the Arabidopsis actins. Figure 11 shows GhACT1 protein structure, indicating that those significant substitutions on amino acids among the cotton actins may have an impact on their surface properties. The 14 positions where charged substitutions took place are found among the GhACTs, whereas only nine such positions appear among Arabidopsis actins (McDowell et al., 1996). At these positions, unlike Arabidopsis actins, only six positions were conservative substitutions, and the other positions showed nonconservative interchanges, whereas human actins contain only conservative substitutions. The nonconservative replacements of charged residues located on several surfaces of the actin molecule (Figure 11) may be involved in functional nonequivalency of actin isovariants as actin monomers polymerize from G-actin to F-actin and alter actin–actin or actin–actin binding protein interaction. For example, the uncharged polar Gln51 just adjacent to the DNase I binding loop involved in intermonomer interactions within the filament (Holmes et al., 1990) is replaced by a positively charged His in GhACT5 and GhACT6. Because actin subdomain 2, in particular the DNase I binding loop, is directly involved in conformational changes (Otterbein et al., 2001), it is likely that this nonsynonymous substitution will have an impact on GhACT5 and GhACT6 structure and function. Recent genetic studies in Arabidopsis clearly showed that substitutions in AtACT2 have dramatic impact on its functions in root hair development (Gilliland et al., 2002; Ringli et al., 2002; Diet et al., 2004). Missense mutation in der1 mutants (Ala183Val in der1-1, Arg97His in der1-2, and Arg97Cys in der1-3) all caused deformed root hairs. Furthermore, Glu356Stop in enl2 enhances der1 phenotypically (Diet et al., 2004), indicating that C-terminal residues are not absolutely required for its function. On the contrary, the conservative substitutions in the N-terminal peptide of Arabidopsis actins may affect polymerization and myosin binding (McDowell et al., 1996). Either a charged (His or Arg) or an uncharged polar amino acid (Gln) at position 123 of cotton actins may suggest that Gln and His are functionally interchangeable. Besides the charged substitutions, there were four positions where a noncharged Gly was substituted by a charged Glu or Arg seen in GhACT1 (Gly253 to Glu), GhACT6 (Gly184 to Arg), GhACT8 (Gly158 to Arg), and GhACT14 (Gly297 to Glu), respectively. These substitutions are not found in Arabidopsis actin genes (McDowell et al., 1996). It would be interesting to know whether these nonsynonymous substitutions have structural and functional impacts on transition from G-actin to F-actin.
Figure 11.
Significant Amino Acid Substitutions within Cotton GhACT Proteins.
The model was constructed using the spdbv37sp5 protein structure program (SwissModel first approach mode) from the Web site http://swissmodel.expasy.org/ of the Swiss Institute of Bioinformatics. Front (A), right side (B), back (C), and left side (D) views, respectively, of the space-filling model for cotton GhACT1. The GhACT1 structure was built based on the known actin three-dimensional structure. Substitutions involving charged or strongly polar amino acid interchanges among the 15 cotton actin isoforms (GhACT1 to GhACT15) are shown in the labeled amino acid residues.
A unique feature of the actin gene family is the position of introns that are conserved among actin genes in cotton and other plant species (Shah et al., 1983; Baird and Meagher, 1987; Nairn et al., 1988; Stranathan et al., 1989; McElroy et al., 1990; Meagher and Williamson, 1994; Cox et al., 1995; An et al., 1996). In Arabidopsis, actin genes have three small introns at identical locations as in GhACT genes except ACT2, in which the first intron between codons 20 and 21 is missing (McDowell et al., 1996). In GhACT1 and GhACT2, the first intron is rather large (545 and 565 bp, respectively) compared with the second and third introns (91 and 76 bp, respectively) that are more conserved, indicating that the first intron is more divergent than intron 2 and intron 3. Furthermore, unlike the other known plant actin genes studied, GhACT1 and GhACT2 share high similarity in the sequences of all three introns, suggesting that both genes may have very close evolutionary relationship.
Nevertheless, the triplet CAG insertion 4 bp upstream the second exon–intron junction in GhACT8 challenged the conserved intron organization paradigm that the three introns are located at the same positions in all actin genes in the plant kingdom (McDowell et al., 1996). In actin genes examined so far, the second intron is always located at amino acid residue 152. However, in GhACT8, the second intron was located at amino acid residue 153 instead of residue 152 because of the insertion. The functional and evolutionary implications of this insertion remain unknown, although GhACT8 is expressed at high levels in fiber and root.
GhACT1 Is Preferentially Expressed during Fiber Development
In this study, we demonstrated that differential expression of the GhACT gene occurs in cotton, as did the members of this actin family in several other plant species, such as Arabidopsis (McDowell et al., 1996; Meagher et al., 1999b), soybean (McLean et al., 1990), tobacco (Thangavelu et al., 1993), and rice (McElroy et al., 1990). The differential expression data may imply that the specialized functional expressions of actin genes are required for proper development of the respective cell and tissue types and may reflect the divergent evolution of actin gene regulatory elements for expression in plant development.
The data presented here provide evidence for strong expression of some GhACT genes in cotton fibers. The high level of GhACT gene expression coincides with the rapid elongation of the fiber cell, suggesting that actin cytoskeleton plays an essential role in fiber elongation. It seems that specialized GhACT genes had been evolved to meet the requirement of the actin cytoskeleton for rapid fiber elongation. This is manifested by the fiber-specific expression of GhACT1, as well as GhACT2 and GhACT5. Real-time RT-PCR and RNA gel blot analysis showed that the GhACT1 transcripts accumulated preferentially in developing fibers, whereas only low or undetectable levels of RNAs were found elsewhere. The transcripts of GhACT1 reach the highest level in young fibers during 8 to 14 DPA, and then there is a gradual and visible decrease of mRNA as the fiber cells developed further. Similarly, genes involved in osmoregulation and cell expansion during fiber development are also expressed at a high level (Orford and Timmis, 1998; Smart et al., 1998; Ruan et al. 2001). Consistently, GhTua2/3 and GhTua4 genes increased in abundance from 10 to 20 DPA, whereas GhTua1 and GhTua5 transcripts were abundant only through to 14 DPA and dropped significantly at 16 DPA with the onset of secondary wall synthesis (Whittaker and Triplett, 1999). Our previous study indicated that the GhTUB1 gene was preferentially expressed in the early stage of fiber development (Li et al., 2002). This suggests that strict developmental control on genes, such as GhACT1, involved in cell elongation during cotton fiber and ovule development had evolved.
To study the developmental control mechanisms, we isolated the GhACT1 gene and its promoter. The 0.8-kb 5′ upstream sequence was cloned upstream the GUS reporter and transferred to cotton plants. GUS assay showed that the promoter is very active in developing fibers, whereas no or very little activity is present in leaf, stem, root, petal, and sepal. It should be emphasized that GhACT1 was not expressed in leaf, stem, root, petal, and sepal trichomes, suggesting that the actin isotype encoded by GhACT1 may be specific for fiber growth, rather than that of other trichomes. This is consistent with the GhACT1 expression pattern revealed by real-time RT-PCR and RNA gel blot analysis, indicating that the 0.8-kb GhACT1 promoter is sufficient to drive its tissue-specific expression and contains all the cis regulatory elements for its developmental regulation, as for actin genes in Arabidopsis (An et al., 1996; Huang et al., 1996; McDowell et al., 1996; Meagher et al., 1999b; Vitale et al., 2003). Thus, the 0.8-kb GhACT1 promoter can be useful for isolating transcriptional factors that recognize the promoter sequence and for directing target gene expression in fiber cells. By comparing other fiber-specific promoter sequences such as E6, H6, and FbL2A (John and Crow, 1992; John and Keller, 1995, 1996; Rinehart et al., 1996), we hope to be able to identify fiber-specific cis elements and trans regulatory factors in the future.
GhACT1 Plays a Major Role in Fiber Elongation
Fiber cell development, similar to trichome morphogenesis in leaf and stem (Mathur et al., 1999), requires the actin cytoskeleton for elaborating and maintaining the spatial patterning. During the early stage of fiber elongation, a rapid rate of actin turnover must keep pace with the equally rapid rates of fiber growth. The downregulation of GhACT1 via RNAi technology in the transgenic fibers greatly reduces actin level that consequently affects actin cytoskeleton organization, and as a result, fiber elongation is inhibited (Figure 9). This demonstrated that GhACT1 plays a major role in fiber elongation, although we could not completely rule out the contribution of GhACT genes (such as GhACT2 and GhACT5). The growth of cotton fiber cells is different from that of most other plant cells because of its rapid and synchronous tip elongation. It has been reported that F-actin plays an important role in pollen tube growth (Mascarenhas, 1993; Chen et al., 2002), in trichome morphogenesis (Mathur et al., 1999), in root hair tip growth (Miller et al., 1999), and in cell elongation of other cell types (Baluska et al., 2000; Waller et al., 2002; Yamamoto and Kiss, 2002). In the tip-growing pollen tube, F-actin arrays are very dynamic, changing from large spherical bodies to F-actin bundles oriented predominantly parallel to the growth axis (Tiwari and Polito, 1988). Similar F-actin arrays were also found for root hair growth (Miller et al., 1999) as well as root tip growth (Blancaflor and Hasenstein, 1997). However, Arabidopsis act7 mutants showed remarkably reduced F-actin in the cells of the root elongation zone. As a result, mutants displayed a series of abnormal phenotypes, such as delayed and less efficient germination, increased root twisting and waving, and retarded and slowed root growth (Gilliland et al., 2003). The act2-1 insertion fully disrupted ACT2 gene expression and significantly decreased the level of total actin protein, resulting in much shorter root hairs (Gilliland et al., 2002; Ringli et al., 2002). Immunocytochemical analysis revealed only several thin actin bundles in the short mutant root hairs, and in the very apex of these stunted root hairs, the actin bundles were often looping through the tip or showing dense but diffuse fluorescence labeling (Gilliland et al., 2002). It was believed that actin isovariants of Arabidopsis have evolved distinct reproductive and vegetative functions and have showed functional nonequavalency among each other. Misexpression of the pollen-specific reproductive ACT1 isovariant in vegetative tissues altered actin polymerization and F-actin organization and thereby dramatically affects plant development and morphogenesis (Kandasamy et al., 2002). In cotton fiber, we found that the F-actin was organized into short and thin arrays in tip orientation at the early stage of fiber development, and with further development, F-actin cytoskeleton displayed an increasingly complicated net-like structure consisting predominantly of thick and longitudinally extending cables in fiber cells. On the other hand, when GhACT1 isovariant level was reduced significantly in the transgenic fiber cells, F-actin bundles were reduced with only a few filaments (Figure 9), similar to act7 and act2 mutants. The reduced and defective actin cytoskeleton was unable to meet rapid fiber elongation. This suggested that F-actin arrays maintained by a significant amount of actins (mostly GhACT1) is critical for fiber cell elongation, like in root hair and trichome cell types.
F-actin might transport vesicles toward the cell periphery, especially near the polar region during tip growth. When the movement of F-actins was blocked, the vesicles could not be released in the cell periphery (polar region), resulting in the inhibition of the coleoptile cell elongation (Waller and Nick, 1997; Waller et al., 2002). In root hair development of Vicia sativa, the elongating net-axial fine bundles of actin filaments (FB-actin) function in polar growth by targeting and releasing Golgi vesicles to the vesicle-rich region of the hair cells. When the elongation of FB-actin was blocked by cytochalasin D, the tip growth of root hair cells was stopped (Miller et al., 1999). In our study, because of suppression of GhACT1 expression, the reduction of F-actin level in transgenic fibers might have a similar effect on fiber cells. With the reduction of actin filaments, the number of organelles (such as Golgi body and endoplasmic reticulum) traveling along the filaments may decrease significantly in the GhACT1 RNAi transgenic fiber cells. The significant reduction in vesicles may account for the slow elongation of fiber cells in the transgenic plants.
In conclusion, our results provide direct evidence that GhACT1, perhaps as well as other GhACT genes (such as GhACT2 and GhACT5), is involved in fiber elongation, not fiber initiation. The characterization and expression studies give us novel insights into the role of GhACT1 in cotton fiber development. Furthermore, the GhACT1 promoter provides a useful tool to identify transcription regulators confirming its fiber-specific expression and to direct potential target genes for fiber quality improvement.
METHODS
Plant Materials
Cotton (Gossypium hirsutum cv Coker312) seeds were surface-sterilized with 70% ethanol for 30 to 60 s and 10% H2O2 for 30 to 60 min, followed by washing with sterile water. The sterilized seeds were germinated on half-strength MS medium under a 12-h-light/12-h-dark cycle at 28°C. Cotyledons and hypocotyls were cut from sterile seedlings as explants for transformation as described before (Li et al., 2002). Tissues for DNA and RNA extraction were derived from cotton plants (G. hirsutum cv DP5415 and Xuzhou142) grown in a greenhouse.
Construction of Cotton cDNA Libraries
Total RNA was extracted from young fibers, ovules, anthers, petals, leaves, cotyledons, and roots as described previously (Li et al., 2002). Poly(A)+ mRNA was purified from total RNA using an mRNA purification kit (Qiagen, Düsseldorf, Germany). cDNA was synthesized and cloned into the EcoRI-XhoI sites of the ZAP Express vector and packaged using a ZAP-cDNA Gigapack Gold III cloning kit (Stratagene, La Jolla, CA) according to the manufacturer's instructions.
Isolation of GhACT cDNAs and RNA Gel Blot Analysis
More than 300 cDNA clones were randomly selected from the cotton fiber cDNA library for sequencing. Sequence analysis identified one actin clone, GhACT1. The 380-bp fragment of the 3′-UTR of GhACT1 was obtained by PCR amplification using primers GhACT1-3′L (5′-AGTTTTGTAATTGCTTTTGATGGT-3′) immediately downstream the stop codon and GhACT1-3′R (5′-AAATCTCGTACAATAATAGCTATT-3′) and used as a gene-specific probe for RNA gel blot analysis as described previously (Li et al., 2002). Then, a 600-bp fragment representing GhACT1 exon 3 was labeled with [α-32P]dCTP and used as a probe to screen a cotton cDNA library according to standard procedures (Sambrook et al., 1989). cDNA (5 × 10⁶) clones were screened, and 300 clones were identified. Among them, 60 full-length clones were sequenced and analyzed. In total, 15 unique cDNA clones were obtained.
Sequence and Phylogenetic Analysis
Nucleotide and amino acid sequences were analyzed using DNAstar (DNAstar, Madison, WI). For phylogenetic analysis, 15 GhACT peptide sequences and one putative cotton actin sequence (AF059484) were aligned with the ClustalW program (http://www.ebi.ac.uk), then maximum parsimony analysis was performed with the PAUP 4.0 program (Swofford, 1998) using yeast actin ScACT1 as an outgroup. The heuristic search methods were applied and the best parsimonious trees were retained in each search.
RT-PCR Analysis
The expression of the GhACT genes in cotton tissues was analyzed by real-time quantitative RT-PCR using the fluorescent intercalating dye SYBR-Green in a LightCycler detection system (Roche, Indianapolis, IN). A cotton polyubiquitin gene (GhUBI) was used as a standard control in the RT-PCR reactions. A two-step RT-PCR procedure was performed in all experiments. First, total RNA samples (2 μg per reaction) from leaves, stems, cotyledons, roots, anthers, petals, and fibers were reversely transcribed into cDNAs by AMV reverse transcriptase according to the manufacturer's instructions (Roche). Then, the cDNAs were used as templates in real-time PCR reactions with gene-specific primers (Table 1). The real-time PCR reaction was performed using the LightCycler–FastStart DNA Master SYBR Green I kit (Roche) according to the manufacturer's instructions. The amplification of the target genes was monitored every cycle by SYBR-Green fluorescence. The Ct, defined as the PCR cycle at which a statistically significant increase of reporter fluorescence is first detected, is used as a measure for the starting copy numbers of the target gene. Relative quantitation of the target GhACT expression level was performed using the comparative Ct method (Roche LightCycler system). The relative value for expression level of each GhACT gene was calculated by the equation Y = 10ΔCt/3 × 100% (ΔCt is the differences of Ct between the control GhUBI products and the target GhACT products; i.e., ΔCt = CtGhUBI − CtGhACT). To achieve optimal amplification, PCR conditions for every primer combination were optimized for annealing temperature and Mg2+ concentration as recommended by the Roche LightCycler system instructions. PCR products were confirmed on an agarose gel. The efficiency of each primer pair was detected using GhACT cDNAs as standard templates, and the RT-PCR data were normalized with the relative efficiency of each primer pair.
DNA Gel Blot Analysis
Genomic DNA was isolated from young cotton (G. hirsutum cv DP5415 and Xuzhou142) leaves using a modified method described earlier (Li et al., 2002). Genomic DNA was digested with restriction enzymes and separated on 0.7% agarose gels and transferred onto Hybond N+ nylon membranes (Amersham Biosciences, Buckinghamshire, UK) by capillary blotting. DNA gel blot hybridization was performed at 68°C overnight using ExpressHyb solution (Clontech, Palo Alto, CA) with 32P-labeled gene-specific DNA probes prepared by the Prime-a-Gene labeling system (Promega, Madison, WI), followed by washing at 68°C in 0.1× SSC and 0.5% SDS for 30 to 60 min. The 32P-labeled membranes were exposed to x-ray film at −80°C for 1 to 3 d.
Isolation of GhACT Genes by Screening Cotton Genomic Libraries
Cotton genomic libraries were constructed as described earlier (Li et al., 2002). Approximately 2 × 10⁶ clones were screened with a [α-32P]dCTP-labeled GhACT1 (0.6 kb of exon 3) probe generated by the Prime-a-Gene labeling system (Promega). The membranes (Hybond N+; Amersham Biosciences) were hybridized overnight in ExpressHyb solution (Clontech) at 68°C, followed by washing with 0.1× SSC and 0.5% SDS. Autoradiography was performed with x-ray film (Kodak, Rochester, NY), and positive clones were purified and sequenced with the ABI Prism 377 DNA sequencer (Applied Biosystems, Foster City, CA) according to the manufacturer's instructions.
Construction of the GhACT1∷GUS Chimeric Gene and GhACT1 RNAi
Primers at −816 to −793 bp with an introduced SalI site and from −1 to −27 bp before ATG with an introduced XbaI site were used to amplify the GhACT1 promoter. A 0.8-kb PCR fragment was obtained using pfu DNA polymerase (Stratagene, La Jolla, CA) and digested with SalI and XbaI, then subcloned into the SalI/XbaI sites of the pBI101 vector (Clontech) to generate a chimeric GhACT1∷GUS gene (named pBI-ACT1-p) (Figure 4B).
To construct GhACT1 RNAi vector, the first intron (0.2 kb) of the GhTUB1 gene (Li et al., 2002) was amplified by PCR with two introduced sites, XbaI and SpeI, using the primer pair TUBint-L, 5′-GGGTCTAGAGACGTAGTTAGAAAGGAAGCCGA-3′, and TUBint-R, 5′-GGGACTAGTACGTTCCCATTCCGGAACCCGTT-3′, and inserted into a pBluescript II SK+ vector at the sites XbaI and SpeI to obtain an intron-containing intermediate construct (pSK-TUBint). The GhACT1 3′-terminal sequence (150 bp fragment at 229 to 378 bp downstream the stop codon) was cloned into the 5′ arm with the introduced sites BamHI/SpeI and the 3′ arm with the introduced sites XbaI/SacI of the intron in pSK-TUBint vector for the sequences encoding the inverted repeat RNA. The constructed RNAi of the GhACT1 gene was subcloned into the GhACT1∷GUS construct at BamHI/SacI sites to replace the GUS gene (named pBI-TUBint-ACT1i) (Figure 4C).
Cotton Transformation
Cotyledon and hypocotyl explants from G. hirsutum cv Coker 312 were transformed using Agrobacterium tumefaciens–mediated transformation as described previously (Li et al., 2002). Homozygosity of transgenic plants was determined by segregation ratio of the kanamycin selection marker and further confirmed by DNA gel blot analysis.
Histochemical Assay of GUS Gene Expression
Histochemical assays for GUS activity in transgenic cotton plants were conducted according to Jefferson et al. (1987), with slight modification. Fresh plant tissues were incubated in 5-bromo-4-chloro-3-indolylglucuronide solution at 37°C for 4 to 8 h and then cleared and fixed by rinsing with 100 and 70% ethanol successively. For sectioning, 1 to 3 DPA ovules stained in 5-bromo-4-chloro-3-indolylglucuronide solution were fixed with 2.5% (v/v) glutaraldehyde in 0.1 M sodium phosphate buffer, pH 7.2, overnight at room temperature, then dehydrated through conventional ethanol series, and finally embedded in Historesin (Leica, Wetzlar, Germany) according to the manufacturer's instructions. The samples were cut into 5- to 7-μm-thick sections using a Leica microtome. The sections were examined and photographed under a Leica DMR microscope equipped with dark-field optics.
Protein Gel Blot Analysis
Soluble proteins were extracted from 8 to 10 DPA wild-type and GhACT1 RNAi transgenic fibers in extraction buffer containing 50 mM Tris-HCl, pH 8.0, 0.5 mM CaCl2, α-mercaptoethanol, 0.5% Nonidet P-40, 1 μg/mL aprotinium, 1 μg/mL leupeptin, and 0.6 μL/mL PMSF. Protein concentration was determined by the Bradford method. Equal amounts of proteins were separated by electrophoresis in a 12% SDS-PAGE gel and transferred onto a nylon membrane by electric transfer (Trans-Blot system; Bio-Rad, Hercules, CA) using semidry transfer buffer. The membrane was blocked with 5% nonfat milk in PBS buffer containing 0.05% Tween-20 at room temperature for at least 1 h and then incubated with affinity-purified goat polyclonal anti-actin IgG (Santa Cruz Biotechnology, Santa Cruz, CA) for 1 h. After washing in PBS buffer for 30 min, the membrane was incubated in PBS containing horseradish peroxidase–conjugated rabbit anti-goat IgG (Pierce, Rockford, IL) for 1 h. After washing in PBS buffer, the membrane was incubated in SuperSignal West Substrate (Pierce) working solution for 5 min and then exposed to x-ray film.
Scanning Electron Microscopy
For examining fiber initiation and elongation, fresh ovules were dissected out and placed on double-sided sticky tape on an aluminum specimen holder and frozen immediately in liquid nitrogen. The frozen sample was viewed with a JSM-5310LV scanning electron microscope (JEOL, Tokyo, Japan).
Observation of F-Actin Structures in Fiber Cells
Ovules dissected out from fresh bolls at 1 to 4 DPA, with or without maleimidoenzoyl-N-hydroxysuccinimide ester pretreatment, were fixed in a solution of 2% paraformaldehyde in KMCP buffer (70 mM KCl, 1 mM MgCl2, 1 mM CaCl2, and 100 mM Pipes, pH 6.5) for 1 h. After rinsing in KMCP buffer, the ovules were sectioned into slices of ∼1 mm thickness. Thin sections were transferred to slides and treated with 1% cellulase (Sigma-Aldrich, St. Louis, MO), 0.5% hemicellulase (Sigma-Aldrich), 0.5% pectinase (Sigma-Aldrich), and 0.1% BSA in KMCP buffer for 10 min, followed by washing with KMCP buffer. Finally, sections were incubated in a solution of 5 μg/mL Phalloidin-TRITC (Sigma-Aldrich) in KMCP buffer with 0.1% Triton X-100 at room temperature. Excess phalloidin was removed by rinsing with the same buffer. Stained ovule sections were immediately examined with an LSM510 confocal microscope (Zeiss, Jena, Germany).
Sequence data from this article have been deposited with the EMBL/GenBank data libraries under accession numbers AY305723 to AY305737.
Acknowledgments
This work was supported by Delta and Pine Land Co. and Temasek Holdings (Singapore). The authors appreciate the support of the National Natural Sciences Foundation of China (Project 30340081 and 30470930) to X.-B.L. and the Young Talent Program, Chinese Academy of Sciences to W.-C.Y. We thank Yangsun Chan and Qingwen Lin for technical assistance on electron microscopy and Rajini Sreenivasan for critical reading of the manuscript. We also would like to thank the Sequencing Service for oligo synthesis and DNA sequencing.
The authors responsible for distribution of materials integral to the findings presented in this article in accordance with the policy described in the Instructions for Authors (www.plantcell.org) are: Xue-Bao Li (xbli@mail.ccnu.edu.cn) and Wei-Cai Yang (wcyang@genetics.sc.cn).
Article, publication date, and citation information can be found at www.plantcell.org/cgi/doi/10.1105/tpc.104.029629.
References
- An, Y.Q., Huang, S., McDowell, J.M., McKinney, E.C., and Meagher, R.B. (1996). Conserved expression of the Arabidopsis ACT1 and ACT3 actin subclass in organ primordia and mature pollen. Plant Cell 8, 15–30. [DOI] [PMC free article] [PubMed] [Google Scholar]
- Baird, W.V., and Meagher, R.B. (1987). A complex gene superfamily encodes actin in petunia. EMBO J. 6, 3223–3231. [DOI] [PMC free article] [PubMed] [Google Scholar]
- Baluska, F., Salaj, J., Mathur, J., Braun, M., Jasper, F., Samaj, J., Chua, N.H., Barlow, P.W., and Wolkmann, D. (2000). Root hair formation: F-actin-dependent tip growth is initiated by local assembly of profilin-supported F-actin meshworks accumulated within expansin-enriched bulges. Dev. Biol. 227, 618–632. [DOI] [PubMed] [Google Scholar]
- Basra, A.S., and Malik, C.P. (1984). Development of the cotton fiber. Int. Rev. Cytol. 89, 65–113. [Google Scholar]
- Blancaflor, E.B., and Hasenstein, K.H. (1997). The organization of the actin cytoskeleton in vertical and graviresponding primary roots of maize. Plant Physiol. 113, 1447–1455. [DOI] [PMC free article] [PubMed] [Google Scholar]
- Chen, C.Y., Chueng, A.Y., and Wu, H.M. (2003). Actin-depolymerizing factor mediates Rac/Rop GTPase-regulated pollen tube growth. Plant Cell 15, 237–249. [DOI] [PMC free article] [PubMed] [Google Scholar]
- Chen, C.Y., Wong, E.I., Vidalli, L., Estavillo, A., Hepler, P.K., Wu, H., and Cheung, A.Y. (2002). The regulation of actin organization by actin-depolymerizing factor in elongating pollen tubes. Plant Cell 14, 2175–2190. [DOI] [PMC free article] [PubMed] [Google Scholar]
- Clarke, S.R., Staiger, C.J., Gibbon, B.C., and Franklin-Tong, V.E. (1998). A potential signaling role for profilin in pollen of Papaver rhoeas. Plant Cell 10, 967–979. [DOI] [PMC free article] [PubMed] [Google Scholar]
- Cosgrove, D.J. (1997). Relaxation in a high-stress environment: The molecular bases of extensible cell walls and cell enlargement. Plant Cell 9, 1031–1041. [DOI] [PMC free article] [PubMed] [Google Scholar]
- Cox, G.M., Rude, T.H., Dykstra, C.C., and Perfect, J.R. (1995). The actin gene from Cryptococcus neoformans: Structure and phylogenetic analysis. J. Med. Vet. Mycol. 33, 261–266. [DOI] [PubMed] [Google Scholar]
- Chueng, A.Y., Chen, C.Y., Glaven, R.H., Graaf, B.H.J., Vidali, L., Hepler, P.K., and Wu, H.M. (2002). Rab2 GTPase regulates vesicle trafficking between the endoplasmic reticulum and the Golgi bodies and is important to pollen tube growth. Plant Cell 14, 945–962. [DOI] [PMC free article] [PubMed] [Google Scholar]
- Diet, A., Brunner, S., and Ringli, C. (2004). The enl mutants enhance the lrx1 root hair mutant phenotype of Arabidopsis thaliana. Plant Cell Physiol. 45, 734–741. [DOI] [PubMed] [Google Scholar]
- Dong, C.H., Xia, G.X., Yang, H., Ramachandran, S., Kost, B., and Chua, N.H. (2001). ADF proteins are involved in the control of flowering and regulate F-actin organization, cell expansion, and organ growth in Arabidopsis. Plant Cell 13, 1333–1346. [DOI] [PMC free article] [PubMed] [Google Scholar]
- Franklin-Tong, V.E. (1999). Signaling and the modulation of pollen tube growth. Plant Cell 11, 727–738. [DOI] [PMC free article] [PubMed] [Google Scholar]
- Fu, Y., Li, H., and Yang, Z. (2002). The ROP2 GTPase controls the formation of cortical fine F-actin and the early phase of directional cell expansion during Arabidopsis organization. Plant Cell 14, 777–794. [DOI] [PMC free article] [PubMed] [Google Scholar]
- Gilliland, L.U., Kandasamy, M.K., Pawloski, L.C., and Meagher, R.B. (2002). Both vegetative and reproductive actin isovariants complement the stunted root hair phenotype of the Arabidopsis act2-1 mutation. Plant Physiol. 130, 2199–2209. [DOI] [PMC free article] [PubMed] [Google Scholar]
- Gilliland, L.U., Pawloski, L.C., Kandasamy, M.K., and Meagher, R.B. (2003). Arabidopsis actin gene ACT7 plays an essential role in germination and root growth. Plant J. 33, 319–328. [DOI] [PubMed] [Google Scholar]
- Hepler, P.K., Vidali, L., and Cheung, A.Y. (2001). Polarized cell growth in higher plants. Annu. Rev. Cell Dev. Biol. 17, 159–187. [DOI] [PubMed] [Google Scholar]
- Holmes, K.C., Popp, D., Gebhard, W., and Kabsch, W. (1990). Atomic model of the actin filament. Nature 347, 44–49. [DOI] [PubMed] [Google Scholar]
- Huang, S.R., An, Y.Q., McDowell, J.M., McKinney, E.C., and Meagher, R.B. (1996). The Arabidopsis thaliana ACT4/ACT12 actin gene subclass is strongly expressed throughout pollen development. Plant J. 10, 189–202. [DOI] [PubMed] [Google Scholar]
- Jefferson, R.A., Kavanagh, T.A., and Bevan, M.W. (1987). GUS fusion: β-Glucuronidase as a sensitive and versatile gene fusion marker in higher plants. EMBO J. 6, 3901–3907. [DOI] [PMC free article] [PubMed] [Google Scholar]
- John, M.E., and Crow, L.J. (1992). Gene expression in cotton fiber: Cloning of the mRNAs. Proc. Natl. Acad. Sci. USA 89, 5769–5773. [DOI] [PMC free article] [PubMed] [Google Scholar]
- John, M.E., and Keller, G. (1995). Characterization of mRNA for a proline-rich protein of cotton fiber. Plant Physiol. 108, 669–676. [DOI] [PMC free article] [PubMed] [Google Scholar]
- John, M.E., and Keller, G. (1996). Metabolic pathway engineering in cotton: Biosynthesis of polyhydroxybutyrate in fiber cells. Proc. Natl. Acad. Sci. USA 93, 12768–12773. [DOI] [PMC free article] [PubMed] [Google Scholar]
- Kandasamy, M.K., McKinney, E.C., and Meagher, R.B. (1999). The late pollen-specific actins in angiosperms. Plant J. 18, 681–691. [DOI] [PubMed] [Google Scholar]
- Kandasamy, M.K., McKinney, E.C., and Meagher, R.B. (2002). Functional nonequivalency of actin isovariants in Arabidopsis. Mol. Biol. Cell 13, 251–261. [DOI] [PMC free article] [PubMed] [Google Scholar]
- Ketelaar, T., de Ruijter, N.C.A., and Emons, A.M. (2003). Unstable F-actin specifies the area and microtubule direction of cell expansion in Arabidopsis root hairs. Plant Cell 15, 285–292. [DOI] [PMC free article] [PubMed] [Google Scholar]
- Kost, B., and Chua, N.H. (2002). The plant cytoskeleton: Vacuoles and cell walls make the difference. Cell 108, 9–12. [DOI] [PubMed] [Google Scholar]
- Li, H., Lin, Y., Heath, R., Zhu, M., and Yang, Z. (1999). Control of pollen tube tip growth by a Rop GTPase-dependent pathway that leads to the tip-localized calcium influx. Plant Cell 11, 1731–1742. [DOI] [PMC free article] [PubMed] [Google Scholar]
- Li, X.B., Lin, C., Cheng, N.H., and Liu, J.W. (2002). Molecular characterization of the cotton GhTUB1 gene that is preferentially expressed in fiber. Plant Physiol. 130, 666–674. [DOI] [PMC free article] [PubMed] [Google Scholar]
- Malhó, R. (1998). Role of 1,4,5-inositol triphosphate-induced Ca2+ release in pollen tube orientation. Sex. Plant Reprod. 11, 231–235. [Google Scholar]
- Mascarenhas, J.P. (1993). Molecular mechanisms of pollen tube growth and differentiation. Plant Cell 5, 1303–1314. [DOI] [PMC free article] [PubMed] [Google Scholar]
- Mathur, J., and Hülskamp, M. (2002). Microtubules and microfilaments in cell morphogenesis in higher plants. Curr. Biol. 12, R669–R676. [DOI] [PubMed] [Google Scholar]
- Mathur, J., Mathur, N., Kernebeck, B., and Hülskamp, M. (2003. b). Mutations in actin-related proteins 2 and 3 affect cell shape development in Arabidopsis. Plant Cell 15, 1632–1645. [DOI] [PMC free article] [PubMed] [Google Scholar]
- Mathur, J., Mathur, N., Kirik, V., Kernebeck, B., Srinivas, B.P., and Hülskamp, M. (2003. a). Arabidopsis CROOKED encodes for the smallest subunit of the ARP2/3 complex and controls cell shape by region specific fine F-actin formation. Development 130, 3137–3146. [DOI] [PubMed] [Google Scholar]
- Mathur, J., Spielhofer, P., Kost, B., and Chua, N.H. (1999). The actin cytoskeleton is required to elaborate and maintain spatial patterning during trichome cell morphogenesis in Arabidopsis thaliana. Development 126, 5559–5568. [DOI] [PubMed] [Google Scholar]
- McDowell, J.M., Huang, S., McKinney, E.C., An, Y.Q., and Meagher, R.B. (1996). Structure and evolution of the actin gene family in Arabidopsis thaliana. Genetics 142, 587–602. [DOI] [PMC free article] [PubMed] [Google Scholar]
- McElroy, D., Rothenberg, M., Reece, K.S., and Wu, R. (1990). Characterization of the rice actin gene family. Plant Mol. Biol. 15, 257–268. [DOI] [PubMed] [Google Scholar]
- McLean, B.G., Eubanks, S., and Meagher, R.B. (1990). Tissue specific expression of divergent actins in soybean root. Plant Cell 2, 335–344. [DOI] [PMC free article] [PubMed] [Google Scholar]
- Meagher, R.B., McKinney, E.C., and Kandasamy, M.K. (1999. a). Isovariant dynamics expand and buffer the responses of complex systems: The diverse plant actin gene family. Plant Cell 11, 995–1005. [DOI] [PMC free article] [PubMed] [Google Scholar]
- Meagher, R.B., McKinney, E.C., and Vitale, A. (1999. b). The evolution of new structures: Clues from plant cytoskeletal genes. Trends Genet. 15, 278–284. [DOI] [PubMed] [Google Scholar]
- Meagher, R.B., and Williamson, R.E. (1994). The plant cytoskeleton. In Arabidopsis, E. Meyerowitz and C. Somerville, eds (Cold Spring Harbor, NY: Cold Spring Harbor Laboratory Press), pp. 1049–1084.
- Miller, D.D., de Ruijter, N.C.A., Bisseling, T., and Emons, A.M.C. (1999). The role of actin in root hair morphogenesis: Studies with lipochito-oligosaccharide as a growth stimulator and cytochalasin as an actin perturbing drug. Plant J. 17, 141–154. [Google Scholar]
- Nairn, C.J., Winesett, L., and Ferl, R.J. (1988). Nucleotide sequence of an actin gene from Arabidopsis thaliana. Gene 65, 247–257. [DOI] [PubMed] [Google Scholar]
- Orford, S.J., and Timmis, J.N. (1998). Specific expression of an expansin gene during elongation of cotton fibers. Biochim. Biophys. Acta 1398, 342–346. [DOI] [PubMed] [Google Scholar]
- Otterbein, L.R., Graceffa, P., and Dominguez, R. (2001). The crystal structure of uncomplexed actin in the ADP state. Science 293, 708–711. [DOI] [PubMed] [Google Scholar]
- Rinehart, J.A., Peterson, M.W., and John, M.E. (1996). Tissue-specific and developmental regulation of cotton gene FbL2A. Demonstration of promoter activity in transgenic plants. Plant Physiol. 112, 1331–1341. [DOI] [PMC free article] [PubMed] [Google Scholar]
- Ringli, C., Baumberger, N., Diet, A., Frey, B., and Keller, B. (2002). ACTIN2 is essential for bulge site selection and tip growth during root hair development of Arabidopsis. Plant Physiol. 129, 1464–1472. [DOI] [PMC free article] [PubMed] [Google Scholar]
- Ruan, Y.L., Llewellyn, D.J., and Furbank, R.T. (2001). The control of single-celled cotton fiber elongation by developmentally reversible gating of plasmodesmata and coordinated expression of sucrose and K+ transporters and expansin. Plant Cell 13, 47–63. [DOI] [PMC free article] [PubMed] [Google Scholar]
- Sambrook, J., Fritsch, E.F., and Maniatis, T. (1989). Molecular Cloning: A Laboratory Manual. (Cold Spring Harbor, NY: Cold Spring Harbor Laboratory Press).
- Seagull, R.W. (1990). The effects of microtubule and microfilament disrupting agents on cytoskeletal arrays and wall deposition in developing cotton fibers. Protoplasma 159, 44–59. [Google Scholar]
- Shah, D.M., Highrower, R.C., and Meagher, R.B. (1983). Genes encoding actin in higher plants: Intron positions are highly conserved but the coding sequences are not. J. Mol. Appl. Genet. 2, 111–126. [PubMed] [Google Scholar]
- Smart, L.B., Vojdani, F., Maeshima, M., and Wikkins, T.A. (1998). Genes involved in osmoregulation during turgor-driven cell expansion of developing cotton fibers are differentially regulated. Plant Physiol. 116, 1539–1549. [DOI] [PMC free article] [PubMed] [Google Scholar]
- Stranathan, M., Hastings, C., and Trinh, H. (1989). Molecular evolution of two actin genes from carrot. Plant Mol. Biol. 13, 375–383. [DOI] [PubMed] [Google Scholar]
- Swofford, D.L. (1998). PAUP*: Phylogenetic Analysis Using Parsimony (*and Other Methods), Version 4.0b1. (Sunderland, MA: Sinauer Associates).
- Szymanski, D.B., Marks, M.D., and Wick, S.M. (1999). Organized F-actin is essential for normal trichome morphogenesis in Arabidopsis. Plant Cell 11, 2331–2347. [DOI] [PMC free article] [PubMed] [Google Scholar]
- Thangavelu, M., Belostotsky, D., Bevan, M.W., Flavell, R.B., Rogers, H.J., and Lonsdale, D.M. (1993). Partial characterization of the Nicotiana tabacum actin gene family: Evidence for pollen specific expression of one of the gene family members. Mol. Gen. Genet. 240, 290–295. [DOI] [PubMed] [Google Scholar]
- Tiwari, S.C., and Polito, V.S. (1988). Organization of the cytoskeleton in pollen tubes of Pyrus communis: A study employing conventional and freeze substitution electron microscopy, immunofluorescence, and rhodamine-phalloidin. Protoplasma 147, 100–112. [Google Scholar]
- Vitale, A., Wu, R.J., Cheng, Z., and Meagher, R.B. (2003). Multiple conserved 5′ elements are required for high-level pollen expression of the Arabidopsis reproductive actin ACT1. Plant Mol. Biol. 52, 1135–1151. [DOI] [PubMed] [Google Scholar]
- Waller, F., and Nick, P. (1997). Response of actin microfilaments during phytochrome-controlled growth of maize seedlings. Protoplasma 200, 154–162. [Google Scholar]
- Waller, F., Riemann, M., and Nick, P. (2002). A role for actin-driven secretion in auxin-induced growth. Protoplasma 219, 72–81. [DOI] [PubMed] [Google Scholar]
- Whittaker, D.J., and Triplett, B.A. (1999). Gene-specific changes in alpha-tubulin transcript accumulation in developing cotton fibers. Plant Physiol. 121, 181–188. [DOI] [PMC free article] [PubMed] [Google Scholar]
- Yamamoto, K., and Kiss, J.Z. (2002). Disruption of the actin cytoskeleton results in the promotion of gravitropism in inflorescence stems and hypocotyls of Arabidopsis. Plant Physiol. 128, 669–681. [DOI] [PMC free article] [PubMed] [Google Scholar]
- Yang, Z. (1998). Signaling tip growth in plants. Curr. Opin. Plant Biol. 1, 525–530. [DOI] [PubMed] [Google Scholar]


