

Abstract
CASP assessments primarily rely on comparing predicted coordinates with experimental reference structures. However, experimental structures by their nature are only models themselves - their construction involves a certain degree of subjectivity in interpreting density maps and translating them to atomic coordinates. Here, we directly utilized density maps to evaluate the predictions by employing a method for ranking the quality of protein chain predictions based on their fit into the experimental density. The fit-based ranking was found to correlate well with the CASP assessment scores. Overall, the evaluation against the density map indicated that the models are of high accuracy, and occasionally even better than the reference structure in some regions of the model. Local assessment of predicted side chains in a 1.52 Å resolution map showed that side-chains are sometimes poorly positioned. Additionally, the top 118 predictions associated with 9 protein target reference structures were selected for automated refinement, in addition to the top 40 predictions for 11 RNA targets. For both proteins and RNA, the refinement of CASP15 predictions resulted in structures that are close to the reference target structure. This refinement was successful despite large conformational changes often being required, showing that predictions from CASP-assessed methods could serve as a good starting point for building atomic models in cryo-EM maps for both proteins and RNA. Loop modeling continued to pose a challenge for predictors, and together with the lack of consensus amongst models in these regions suggests that modeling, in combination with model-fit to the density, holds the potential for identifying more flexible regions within the structure.
1. Introduction
Assessment of models in CASP is traditionally based on comparing predicted coordinates with the coordinates of reference structures provided by experimentalists. For evaluation purposes, the experimental structures are considered the ‘gold standard’. However, experimental structures by their nature are only models themselves - their construction involves a certain degree of subjectivity in interpreting density maps and translating them to atomic coordinates. In several previous CASPs, in parallel to the coordinate-to-coordinate evaluation, we carried out an evaluation of models versus the experimental data for a subset of cryo-EM-derived structures1,2. In this article, we continue this trend and check the fit of CASP15 models to cryo-EM density maps. We also study how the density-guided refinement of the best models improves their fit to map, and how the refined models fare with regards to the experimental structures. For the first time, besides the protein targets, we analyze RNA structures.
The number of structures newly solved by 3D-EM roughly doubles every two years and totals 14,500 as of March 2023, constituting more than 8% of protein structures in the whole PDB (http://www.rcsb.org/)3 (compared to around 4% only two years ago). Reflecting this growth, CASP also registered an uptick in the percentage of cryo-EM targets. In CASP14, 7 out of 54 evaluated targets (13%) were determined by cryo-EM, while in CASP15 the corresponding numbers were 27 out of 93 (29%), including 8 of the 12 (67%) RNA-containing structures.
While AlphaFold2 did not participate in the assembly category in the previous CASP experiment, it was noted that its predictions could have alleviated many interface modeling errors4. Since then, AlphaFold-Multimer5, RosettaFold6 and AF2Complex7 are a few examples of a growing number of deep-learning approaches to complex prediction. In CASP15, predictions of oligomeric targets were sufficiently good to directly refine whole proteins and complexes rather than smaller evaluation units. To test the applicability of the predictions in real-world cryo-EM structure determination tasks, we employed a method for ranking models. Additionally, given the improvement in the average cryo-EM map resolution, we decided to not only refine the best-predicted models into the corresponding maps but also assess higher resolution aspects of predicted models, such as their side-chain orientations.
For the RNA targets, predictions were ranked using their cryo-EM maps in another study of this special issue8. Therefore, here we used the maps to refine the best-ranked RNA predictions. However, whilst cryo-EM for studying proteins can often achieve near-atomic resolution, for RNA-only structures this method generally has not yet been able to achieve the same levels of resolution. Additionally, structure prediction for RNA is far less mature than for proteins, making RNA refinement into cryo-EM maps even more challenging.
2. Materials and Methods
In CASP15, with the increased accuracy of modeling, we evaluated more targets, including multidomain and oligomeric ones (Fig. 1, Table 1). In this paper we had two aims: 1) to assess how well each protein chain of the predictions fitted the density if it was docked individually in the map (ie, in complexes, without the context of the fully predicted complex); and 2) to check whether the predicted models could be improved in the context of the experimental data. For the first aim, we ranked individual protein chains based on rigid cryo-EM docking (section 2.1). For the second aim, we took the top-ranked model for each protein target and also used all the predictions for protein and RNA targets that passed minimum accuracy filters (see section 2.2.1 for proteins and section 2.2.2 for RNA). These were superposed on their corresponding reference structures and the fit of each model was then optimized with ChimeraX9 (supp. Methods 1). This would show us that even when the prediction is not accurate enough, it can still serve as a good starting point for model building. For example, six targets shown in Fig. 2 (T1154, H1158, T1158, T1170o, R1126 and R1156v3) were generally well modelled down to the secondary structure level; however the overall conformations only partly fitted the density. Below we describe the methodologies we used for the two approaches.
Fig. 1: Overview of the cryo-EM targets used for refinement and analysis in CASP15:
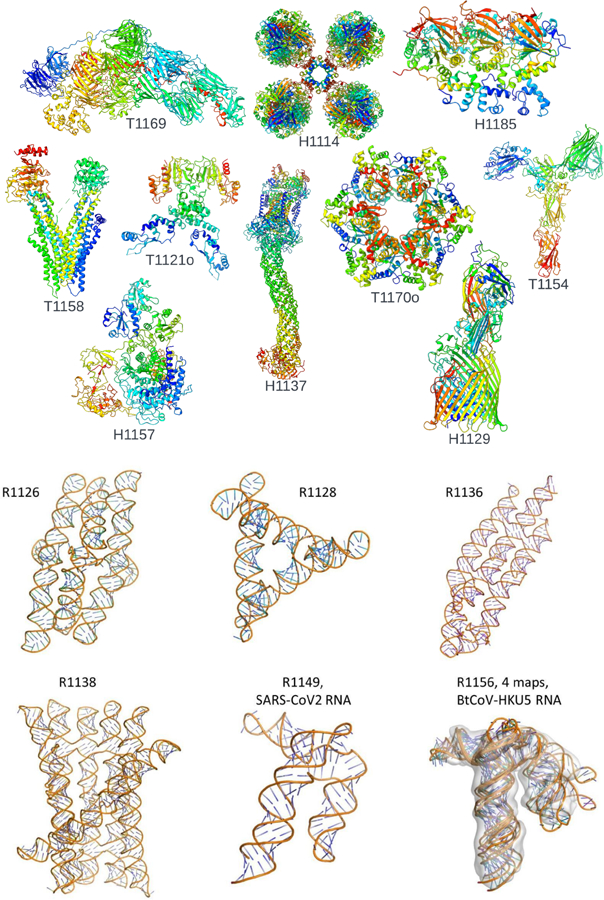
Reference structures for 10 protein targets (A) and 6 RNA targets (B) solved by cryo-EM in CASP15.
Table 1. Overview of targets with refined predictions.
Targets with predictions which met the minimum score criteria were refined. Note that for T1169 only two models were refined (see Section 3.2.1).
| Target Type | Target | Num. of Predictions refined | Resolution (Å) | Num. residues/nucleotides |
|---|---|---|---|---|
| Protein | H1129 | 9 | 2.6 | 1387 |
| H1157 | 11 | 3.3 | 1524 | |
| T1158 | 13 | 3.3 | 1340 | |
| T1154 | 17 | 3.0 | 1424 | |
| H1137 | 40 | 3.1 | 3939 | |
| T1170o | 11 | 3.0–3.3 | 1908 | |
| H1185 | 13 | 3.4 | 1334 | |
| T1121o | 2 | 3.7 | 739 | |
| T1169 | 2 | 3.3 | 3364 | |
| RNA | R1126 | 6 | 5.6 | 363 |
| R1128 | 7 | 5.3 | 238 | |
| R1136v1 | 5 | 4.4 | 374 | |
| R1136v2 | 5 | 3.5 | 374 | |
| R1138v1 | 3 | 4.9 | 720 | |
| R1138v2 | 3 | 5.2 | 720 | |
| R11149 | 3 | 4.7 | 124 | |
| R1156v1 | 1 | 5.8 | 135 | |
| R1156v2 | 1 | 6.6 | 135 | |
| R1156v3 | 4 | 7.6 | 135 | |
| R1156v4 | 2 | 7.6 | 135 |
Fig. 2: Docked predictions vs. the reference model for 6 CASP15 targets.
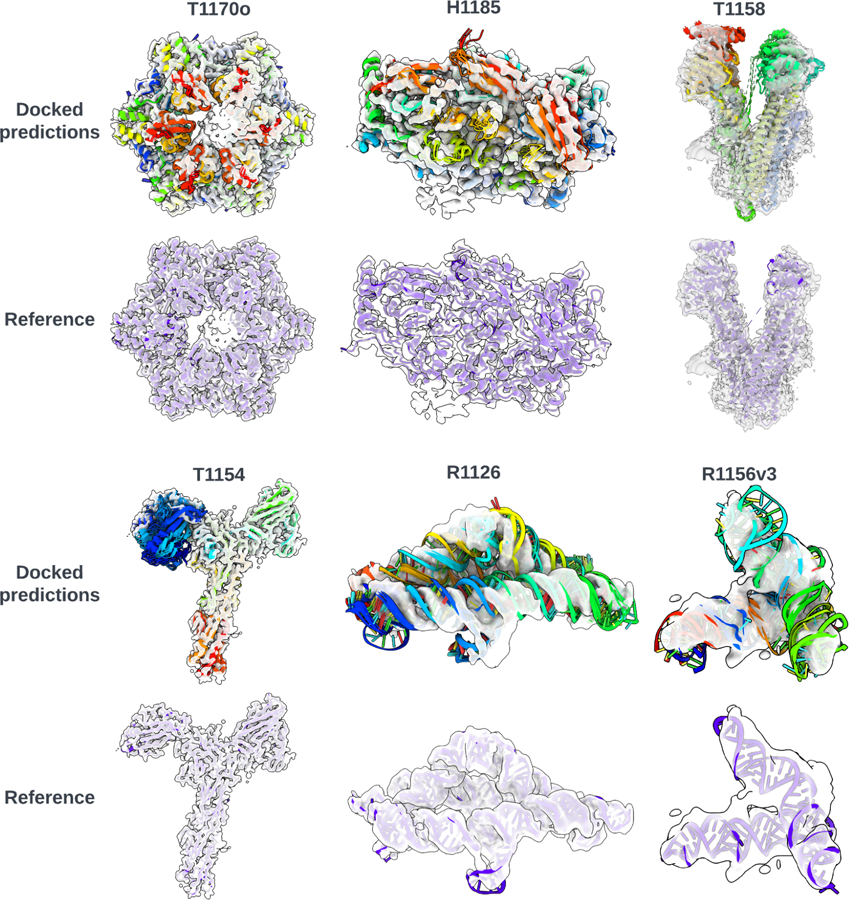
The reference models are displayed in blue within the corresponding cryo-EM maps. The ensembles of docked predictions are shown in rainbow colours.
2.1. Ranking of individual protein chains based on rigid cryo-EM docking
Instead of rigidly fitting the entire complex in the map, one can identify the optimal initial position for each of the protein components in the model using an exhaustive search or another heuristic. Predictions were re-ranked based on this global fitting approach using Cross-Correlation (CC).
The docking of models in this study was carried out using two automatic docking programs, Molrep10,11 and PowerFit12. Both programs use a six-dimensional search to maximize an overlap-correlation score between a given model and the map file. Molrep incorporates a Spherically Averaged Phased Translation Function (SAPTF), followed by a Rotation Function (RF) and Phased Translation Function (PTF), which achieves a suggested first fit and then improves the overlap score with a six-dimensional optimisation search10,11. On the other hand, PowerFit incorporates an exhaustive six-dimensional search, including rotation at a pre-set angle sampling density and translation across the map file. Input parameters for the docking included the input map file, model and resolution12. The top model was determined by the CC score calculated using ChimeraX9.
A group ranking was generated as follows using the complete chain submissions submitted by groups instead of the CASP-defined Evaluation Units (EUs)13. Predictors may submit five models for each target. To reduce the computational time required for the docking process, only the first submitted model for each target per group was considered. For each target, a score was assigned per group reflecting its position in the CC ranking for that target. The top model was given a score of 123 since this was the total number of groups. An automatic rank of 0 was given where a group did not submit a prediction for a given target. For an overall group ranking, a cumulative score for each group was tallied across all targets for which that group submitted a prediction. For comparison, similar rankings were done for each group and target using the composite SCASP15 score defined by14.
For single chain targets, the prediction from the top group was chosen as the starting candidate. For oligomeric targets (H1114, H1129, H1158, T1121o, T1170o, H1185), a cumulative score of the individual chains was tallied. The model from the highest scoring group across all chains for a target was selected for refinement. For these models, no attempt was made to recombine individual fitted chains: instead the originally submitted multi-chain assembly was re-docked so that this full assembly was the starting model for the refinement process.
2.2. Model refinement
2.2.1. Selection of models for refinement from proteins and protein complex-targets
Our rigid-body docking protocol is designed to test how well individual chains reflect the experimental density. However, we know from previous CASP competitions, that predictions, despite often modelling domains and SSEs to a high degree of accuracy, often fare less well when it comes to overall conformation. In previous papers of this series 1,2 we have performed flexible fitting and refinement on cryo-EM targets showing that, with the aid of the experimental data, models oftentimes can be as good as the reference structure. It is important to note that flexible fitting methods require the starting models to be quite accurate at the SSE and domain levels, as these features are not derived from the fitting process. Flexible fitting routines such as the one used in this paper may not converge if the models are far from the global solutions. To select models which have both accurate SSEs and are not too far from the global optimum, we pick the highest ranking models based on the CASP assessment scores and the cryo-EM-based model assessment protocol (see section 2.1). To qualify, predictions had to score above 0.7 on the lDDT (oligo-lDDT for oligomers) scale. Additionally, predictions for monomeric targets required a GDT_TS score greater than 0.7. In the case of oligomeric targets, predictions with QS, TM and F1 scores4,15,16 all greater than 0.7, 0.8 and 0.6 respectively were eligible for refinement.
2.2.2. Selection of models for refinement from RNA targets
All RNA-containing cryo-EM targets were considered for refinement. If there were multiple experimental maps, predicted models were selected separately for each map. The predictors were not asked to predict these conformations separately and hence, in some cases, the same predicted model was refined against multiple maps. Due to the low prediction accuracy all models submitted by each team were considered8. The best models were selected as the top ranked structures across all submitted models based on the previously described map-to-model Z-score, ZEM8. Due to the fit qualities an automatic threshold would result in few models per target, so manual visual inspection was additionally used to select models that, even without good fits, were the most promising for refinement. Based on these rankings and visual inspection of fit of the top 10 models by an expert, a final set of models for each target was selected.
2.2.3. Model fitting and refinement
The refinement protocol was an incremental improvement on what was used in prior CASP challenges1,2. In this CASP we additionally incorporated an updated version of RIBFIND (RIBFIND2)17, which can help to improve the refinement process by clustering secondary structure elements (in both proteins and nucleic acid structures). Combined with ERRASER2, a yet to be published successor to Erraser18 for correcting geometry in RNA structures, this allowed the refinement of both protein and RNA predictions, even when significant conformational changes were required. A more in-depth description of the pipeline is available in the Supplemental Methods along with a graphical overview (Fig. S1).
2.2.4. Model assessment measures for proteins
The protein predictions for cryo-EM protein targets and the subsequent refined models were evaluated for their goodness-of-fit to the experimental cryo-EM density map (model-to-map goodness-of-fit) using the following metrics: The local (per-residue) goodness-of-fit was evaluated with the TEMPy2 Segmented Manders’ Overlap Coefficient (SMOC) score19 and global goodness-of-fit using the ChimeraX cross-correlation measurement. The SMOC score represents the Manders’ overlap coefficient for overlapping residue fragments: it is computed on local spherical regions around the seven residues in the current window. Overlapping windows are used, producing one numerical value per residue. SMOC scores can be calculated for the whole structure by averaging the per-residue scores. In order to compare the quality of fit to the density of side-chain vs. backbone, we have implemented two new “localised” SMOC scores in TEMPy: SMOCs and SMOCb. These scores assess the voxels around the side-chain atoms (SMOCs) and around the backbone atoms (SMOCb), respectively. To compute the SMOCs and SMOCb scores, each residue from the predictions was locally aligned to the target using the C-alpha atoms of the residue and its immediate neighbors. Because side-chains are a high-resolution feature, we did not use sliding windows in this case, i.e., SMOCs and SMOCb scores were computed on the aligned residues. The geometry of the targets, the predictions and the refined models were all assessed using MolProbity20.
2.2.5. Model assessment measures for RNA
For CASP15, we have implemented a new SMOC score in TEMPy – SMOCn – to assess the fit of nucleic acid chains. SMOCn is calculated similarly to the original SMOC score, which was designed to assess the protein chain in the density, by sliding windows around nucleotides instead of amino acids19. Due to resolution limitation, the “localized” SMOCb and SMOCs scores were not used for RNA. As the RNA experimental maps were generally of a lower resolution than their protein counterparts, assessing geometry was important to ensure models were not overfit to the maps. RNA Validate, which is part of the Phenix 21 software package, was used to assess the geometry of the RNA targets, predictions and refinements. We focussed our geometry analysis on the ‘average suiteness’ scores produced by RNA Validate. ‘Suites’ are defined by the pucker of two consecutive backbone sugars and the five torsion angles between them. Empirical studies have shown that these suites inhabit a number of characterized states in 7-dimensional space. ‘Average suiteness’ is a measure of how well the suites in an RNA model match the discrete conformers found in the empirical data 22.
3. Results
3.1. Ranking of protein models using docking into cryo-EM maps
Our comparison of docking results from PowerFit12 and Molrep10 showed that PowerFit usually produced better fitting models (Supp. Methods 2). We therefore carried out the ranking using PowerFit.
There was a significant, strong positive correlation between the cumulative SCASP15 rankings and the cryo-EM-based docking rankings (Fig. 2). The top five groups from the docking rankings, in order, were: Yang, BAKER, GuijunLab-Assembly, FoldEver and PEZYFoldings. Each of these groups submitted predictions for all targets. The Yang group ranked consistently high on all targets and had the most (three) top ranking models (Table 2). Each of the top groups incorporated AlphaFold 2 style networks into their methods, with the exception of BAKER who used RosettaFold. For making performance comparisons, control representations of AlphaFold 2 are annotated (Fig. 3) with group names NBIS-af2-multimer, NBIS-af2-standard, Colabfold and Colabfold_human. Colabfold and Colabfold_human submitted predictions for every target but their results, while confirming the value of these readily available predictions for cryo-EM map fitting, were not among the very best. The best ranked prediction for each target was selected for refinement if it was not already selected based on the CASP criteria (see 3.2.1). These models are listed in Table 3. Target H1137 was excluded since, unlike other targets, there was no single group that had consistently suitable docked models across all interfaces.
Table 2: Group ranking based on docking.
The top-scoring CC model for each target. Also indicated are the top-scoring groups for the same targets, in the general CASP assessment using the CASP15 score14. Some chain models did not receive a CASP15 score because certain elements used in the CASP15 score formula were not calculated since the chain in question was split into multiple AUs. These were given an N/A classification.
| Target | Top Group by Docking Rankings | Top Group by SCASP15 Ranking | Groups selected for Refinement |
|---|---|---|---|
| T1114s1 | Gonglab-THU | SHT | FoldEver-Hybrid |
| T1114s2 | Panlab | trComplex | |
| T1114s3 | Yang | B11L | |
| T1121 | GuijunLab-RocketX | GuijunLab-Threader | GuijunLab-RocketX |
| T1129 | Venclovas | N/A | Venclovas |
| T1137s1 | BhageerathH-Pro | PEZYFoldings | Venclovas* |
| T1137s2 | SHORTLE | Yang | |
| T1137s3 | RostlabUeFOFold | UM-TBM | |
| T1137s4 | ACOMPMOD | N/A | |
| T1137s5 | DELCLAB | UM-TBM | |
| T1137s6 | RostlabUeFOFold | UM-TBM | |
| T1137s7 | Shennong | DMP | |
| T1137s8 | McGuffin | McGuffin | |
| T1137s9 | Yang | PEZYFoldings | |
| T1154 | Venclovas | Elofsson | Venclovas |
| T1157s1 | Yang-Multimer | N/A | Yang-Multimer |
| T1157s2 | Yang | N/A | |
| T1158 | MULTICOM | Asclepius | MULTICOM |
| T1169 | Shennong | Shennong | Shennong |
| T1170 | FTBiot0119 | MUFold_H | FTBiot0119 |
| T1185s1 | BhageerathH-Pro | BAKER | Yang-Multimer |
| T1185s2 | Yang-Multimer | OpenFold-SingleSeq | |
| T1185s4 | BAKER | Manifold-E |
These targets were selected in a different way - see section 3.4.3
Fig. 3. Group ranking for cryo-EM targets.
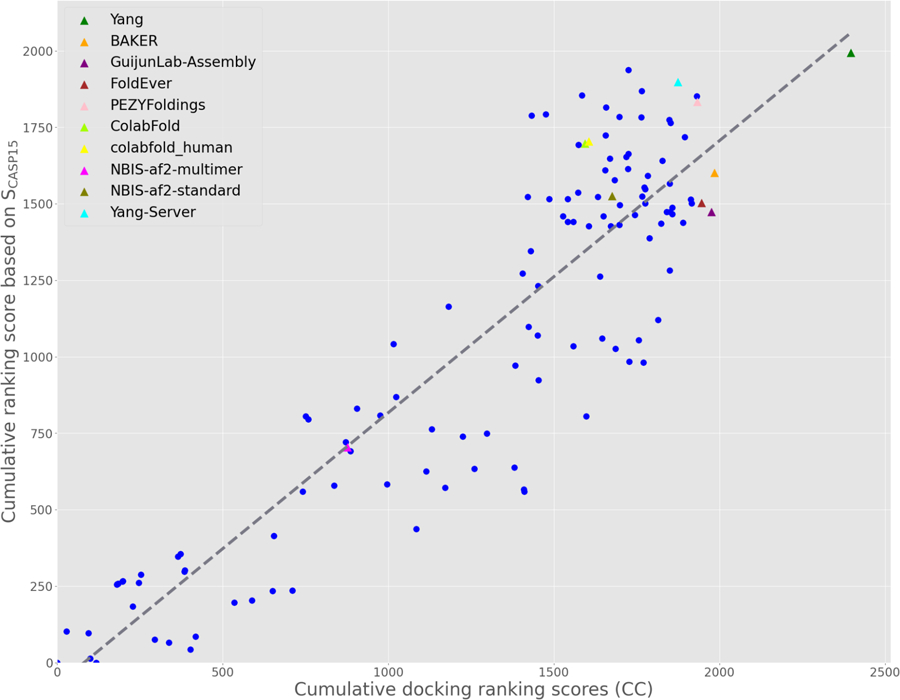
Cumulative per-group docking ranking scores plotted against SCASP15 rankings across docking targets where SCASP15 scores were available (oligomeric reference structures were split into individual chains - see also Table 2). The gray line indicates the line of best fit with a strong positive correlation between the two rankings (r=0.827, p<0.0001). The top five performing docking ranking groups are labeled, as are the ‘control’ AlphaFold 2 submissions. These groups are shown as triangles, others as blue circles.
Table 3:
RNA predictions which were selected for refinement.
| Target | Group | Prediction model numbers |
|---|---|---|
| R1126 | 232 | 1–5 |
| 287 | 2 | |
| R1128 | 232 | 1–5 |
| 287 | 1,3 | |
| R1136v1, R1136v2 | 232 | 1,3,5 |
| 287 | 4 | |
| 325 | 1 | |
| R1138v1, R1138v2 | 232 | 3,4,5 |
| R1149 | 054 | 1 |
| 125 | 3 | |
| 416 | 3 | |
| R1156v1 | 128 | 5 |
| R1156v2 | 128 | 5 |
| R1156v3 | 128 | 1,5 |
| 232 | 3 | |
| 287 | 1 | |
| R1156v4 | 232 | 3 |
| 439 | 2 |
3.2. Protein targets - refinement of top predictions
3.2.1. Selection of protein targets for refinement using CASP criteria
We refined the 118 predictions for multi-domain proteins and protein complexes (Table 1) that either passed our filter based on CASP score (section 2.2.2) or ranked first based on the fit of individual chains (section 2.1). For 6 targets (Table S1), the top-ranked model based on docking of chains was not included in the list of models which passed the CASP filter. However, a comparison between the poses of the top-ranked docked models and the ones determined by superposition and optimisation in ChimeraX shows high similarity (Fig. S3). Except for these 6 top-ranked best models, we used the superposed ones as a starting point for refinement.
The only listed target which did not have models that passed the CASP-based selection criteria was T1169 (Table 1). Predictions of individual domains in T1169 were good but the full protein models were not accurate enough to pass the threshold due to partially inaccurate domain organization. This protein was the largest single chain model in CASP history with 5 domains and over 3000 residues. Here we chose the model with the highest GDT_TS score (GDT_TS=57.7, lDDT=0.63) which was from Yang-server (group 229). Finally, we did not refine predictions for target H1114 for which the corresponding cryo-EM map is at 1.52 Å resolution. Given the high resolution of the map and the high quality of the predictions for this target (the best model had a TM-score=0.97, oligo-lDDT=0.86, QS-score=0.79, F1-score=84.13), we decided to use it for a fine-tuned side-chain analysis instead.
3.2.2. Overall model analysis
Average SMOC scores of predictions prior to refinement were poor with a large degree of variation among the predictions for each target (Fig. 4A). After refinement, average SMOC scores were closer to those of the respective targets, typically with significantly reduced variance. For example, the top models refined from the predictions of target T1154 had a SMOC curve very similar to that of the target SMOC curve (Fig. 4B, C). Interestingly, all top predictions for this target based on the CASP criteria could be refined in the N-terminal part of the structure, despite its initial wrong orientation. This is likely to be attributed to the hierarchical refinement protocol, where the N-terminal is first pulled into the density as one rigid body. On the other hand, in the regions of residues 810–814 (Fig. 5B), there is a sharp drop in the SMOC plot due to the “loopy” characteristics of the region (see below). In fact, most targets had some loops which did not reach the high SMOC scores seen in the rest of the structure after refinement, suggesting these regions were poorly modeled thus bringing down the average SMOC scores. We explore specific cases where loops were poorly modelled in section 3.2.2.
Fig. 4: Overview of protein refinement results.
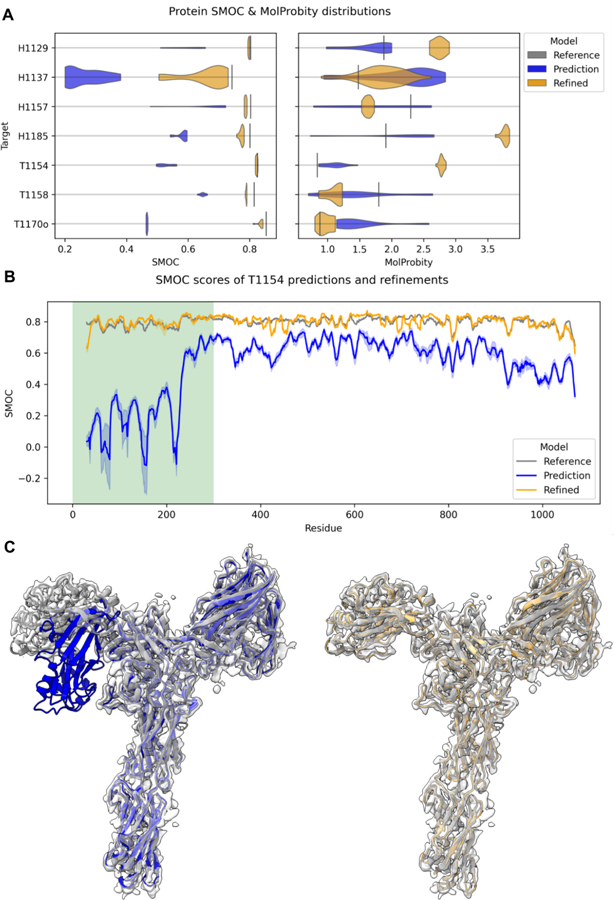
In (A), the distribution of average SMOC scores for the qualified CASP predictions before and after refinement. Score for the experimental model is shown as a vertical line. Target T1169 and T1121o were not included as only two models for each were refined. In (B), the residue level SMOC plot is shown for T1154 and its predictions. The dark orange and blue lines are the mean refined and docked SMOC scores with the minimum and maximum values in light orange and blue. The N-terminal domain, which fitted poorly in all of the predictions (as indicated by the highlighted region), needed significant movement during refinement and is shown in (C) for model 1 from PEZYFoldings (group 278). Plots and 3D structures are in orange for refined models, in gray for reference structures and in blue for predictions.
Fig. 5: Protein loop case-studies.
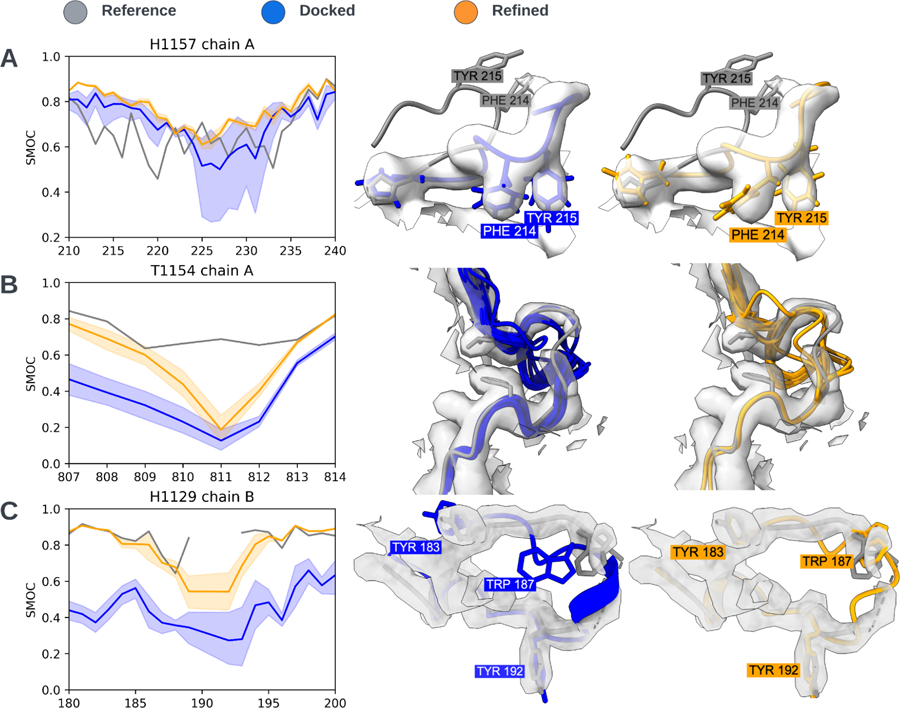
In all the visualizations, the target model is gray and the predictions are blue and orange before and after refinement, respectively. The dark orange line in the plot is the mean SMOC score, with the shaded region representing the minimum and maximum value for the set of predictions. (A) The reference model (for H1157) had a large poorly modeled loop in chain A as indicated by the low SMOC scores in 210–230 region. The best-refined predictions were a much better fit. In orange, a refined prediction from McGuffin (group 180). (B) This short loop, in T1154 was not modeled well enough by any predictions to be refined into the density. The low-intensity density may also be an indicator that this region is disordered. (C) Residues 190–191 of chain B were not modeled in the reference model for H1129 indicated by the dotted line. None of the predictions were able to produce a refinable loop that fitted the DeepEMhancer-sharpened map in this region. However, the model submitted by Wallner (group 037) which is depicted, was visually the best fitting before and after refinement.
Overall MolProbity scores, which are a log-weighted combination of the clash score, percentage of unfavoured Ramachandran dihedrals and unfavorable side-chain rotamers, generally improved after refinement with scores less than 2.0 being common (typically, MolProbity scores below 3.0 are considered good). However, for a number of targets, the MolProbity scores were worse. In these cases (H1129, H1185, T1154), the provided maps had been processed using DeepEMhancer23.
The six models that did not pass the initial CASP scoring criteria but ranked high based on PowerFit docking (section 3.2.1, Table S1) were improved after refinement, generally exceeding the cutoffs for ‘accurate’ models (section 2.2.1). However, some scores for T1154 and T1121o were worse after refinement due to distortions. In the case of T1154, an incorrect interaction at the N-terminus caused a poor set of rigid-bodies to be generated during refinement. In the case of T1121o, a domain was misoriented and couldn’t be optimized.
3.2.2. Analysis of loop predictions
Given that overall the predictions were very accurate for proteins and that the top predictions required very little refinement in order to fit well into their corresponding target cryo-EM maps, we decided to focus next on examining how well the loops in the top predictions were refined. Below are specific targets where the accuracy of loops was examined in detail.
H1157 - Complex of CtEDEM and CtPDI1P at 3.3 Å resolution
This target consists of two proteins, each with multiple domains. These were modeled in a challenging experimental map with varying resolutions. These varying resolutions are clearly reflected by B-factor estimates produced by TEMPy-ReFF (Supp. Fig. 2). Initial inspection of the target revealed minor modeling issues: some aromatic side-chains were not well-fitted to the density and a number of loops were in regions of the map that had resolution too low to be modeled with confidence. Interestingly, many of the predictions managed to produce side-chains which better fit the density than the reference. More intriguingly, the best predictions modeled a loop in chain A between residues 210–230 much better than in the target. These were further improved upon refinement (Fig. 5A). Despite the excellent performance in modeling this large loop, predictors struggled to model some other loops.
T1154 - S-layer protein A (SlaA) at 3.0 Å resolution
Many bacteria and archaea have a protein-based barrier which encapsulates the cell known as an S-layer. A CASP target of the outer S-layer component of the archaea Sulfolobus acidocaldarius24 was well predicted at the domain level, with the model fit to the experimental data improving after the refinement. Despite the overall high-resolution, a short loop between residues 810–814 had very poor density. Predictions were unable to produce loops close enough to the correct geometry to be refined into the map (Fig. 5B). Although automated refinement starting from these models was not possible, the general lack of consensus amongst the predictions likely reflected some degree of disorder which was mirrored by the poor resolution seen in this region of the map.
H1129 - The bacteriophage pb5 protein in complex with FhuA at 3.1 Å DeepEMhancer map
Much like the swift adoption of deep-learning methods in the structure prediction community, deep-learning has been transforming image processing and reconstruction methods in the cryo-EM scene. Here, a dimeric complex of the bacteriophage pb5 protein and its binding partner (the bacterial outer-membrane protein FhuA) is derived from a map which had been sharpened using the deep-learning tool DeepEMhancer23,25. Despite the overall high resolution of this map, residues 190 and 191 of a short loop were not modeled in the target structure with density dropping out in this region. Similar to the short loop in T1154, none of the predictions gave a “refineable” or even visually plausible fit in this region (Fig. 5C). However, the model provided by Wallner (group 037) was, by visual inspection, close and could potentially be locally fitted and refined using interactive tools such as Coot26 or ISOLDE27. Despite often making visual interpretation easier, an unfortunate side effect of DeepEMhancer is that lower-resolution regions of the map tend to be removed. It is possible that the unprocessed map (which we did not have) may have offered better information about this likely disordered region. A number of poorly resolved loops had a higher atomic B-factor, as determined by TEMPy-ReFF (Supp. Methods 1), compared to the rest of the model. Interestingly, we observed a similar pattern in the root mean square fluctuation (RMSF) of the best predictions (Supp. Fig. 2). We thus hypothesize that these poorly resolved portions of the map were caused by increased local mobility, which was also captured by the predictions which deviated from one another in these lower resolution regions.
3.2.3. Analysis of side-chain predictions
To examine how well CASP predictors can predict side chains, we analyzed predictions for target H1114, which was determined based on a high-resolution map (1.52 Å). The target is a hydrogenase isolated from Mycobacterium smegmatis that forms a large oligomeric complex of the HucS, HucL and HucM proteins28. The SMOC scores for backbone and sidechain atoms of unrefined predictions compared against those of the target for each residue are shown in Fig. 6. Sidechain SMOC scores (SMOCs) were clearly not predicted as well as the backbone scores (SMOCb), suggesting poor atom placement (Fig. 6A). An example is model 1 from Yang (group 439). In this case, although the backbone was relatively well fitted (average SMOCb=0.72), some side chains were incorrectly positioned, such as those of GLU15 and HIS166 (Fig. 6B).
Fig 6. Side-chain analysis of H1114.
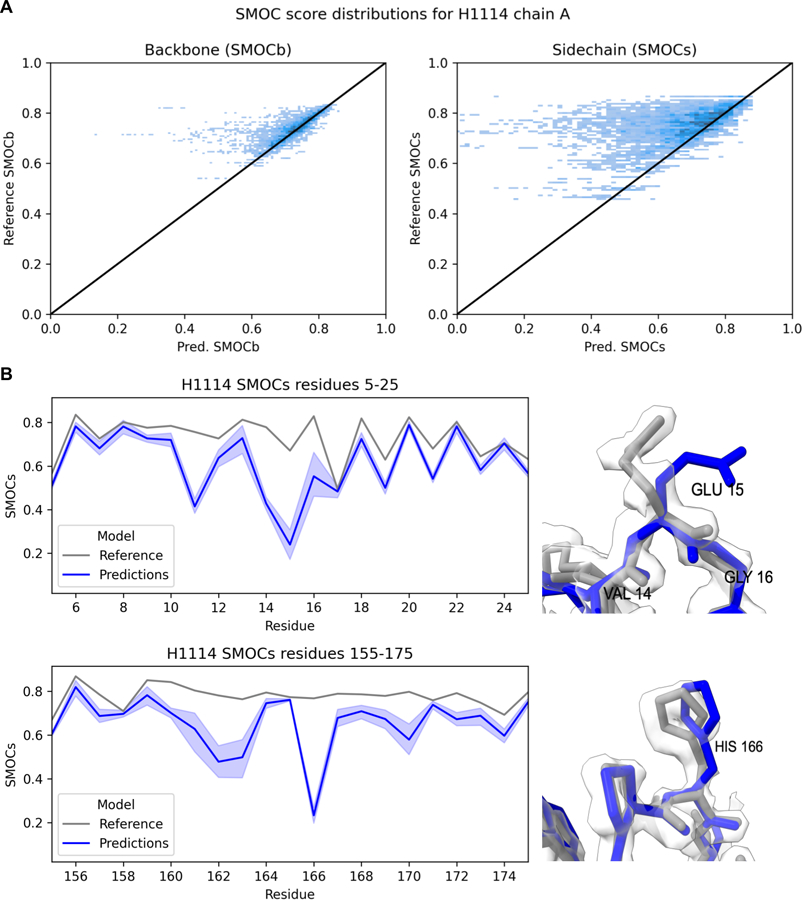
SMOC scores for backbone and sidechain atoms of H1114 predictions compared against those of the target reference structure for each residue (A). Backbone SMOCb scores (left) and sidechain SMOCs scores (right) of the reference structure vs the predictions. In (B) incorrectly positioned side-chains of GLU15 and HIS166 from model 1 prediction by Yang (group 439) (blue) compared to the reference (gray). These residues were consistently poorly placed by predictors.
3.2.4. Refinement of T1169 - the mosquito salivary gland surface protein 1 at 3.3 Å resolution
Target T1169 is the mosquito salivary gland surface protein 1, a monomeric protein composed of more than 3000 residues involved in pathogen transmission from mosquitos. None of the predictions passed our CASP criteria for multidomain protein refinement (GDT-TS > 0.7 and LDDT > 0.7). This is potentially due to the existence of a domain in T1169 with a previously unidentified fold, and others with low sequence homology to known structures29. Therefore, we decided to compare between the top-fit prediction based on chain ranking which was from Shennong (group 466), against the prediction with the highest GDT-TS score (57.7) which was from Yang-server (group 229) (Fig. 7A). The Shennong model was ranked third based on GDT-TS with a score of 54.1. Note that based on global fit-to-density using ChimeraX cross-correlation (CC) scores, the Yang-server model also had a better correlation with the experimental map (CC=0.55 for Shennong and CC=0.61 for Yang-server). The refined models of each of these predictions are shown in the 3.3 Å cryo-EM map (Fig. S4A). SMOC scores of the predicted models show that each prediction has regions that are more accurate than the other. From the corresponding SMOC plot (Fig. S4B), the CASP-criteria selected prediction produced a better refined model with a SMOC profile closer to that of the target. The poorer refinement of the Shennong group prediction (Table S1) is likely due to the incorrect placement of the N-terminal β-propeller towards the center of the molecule (residues 1–340), which could not be fixed during refinement (Fig S4B).
Fig. 7: Overview of RNA refinement results.
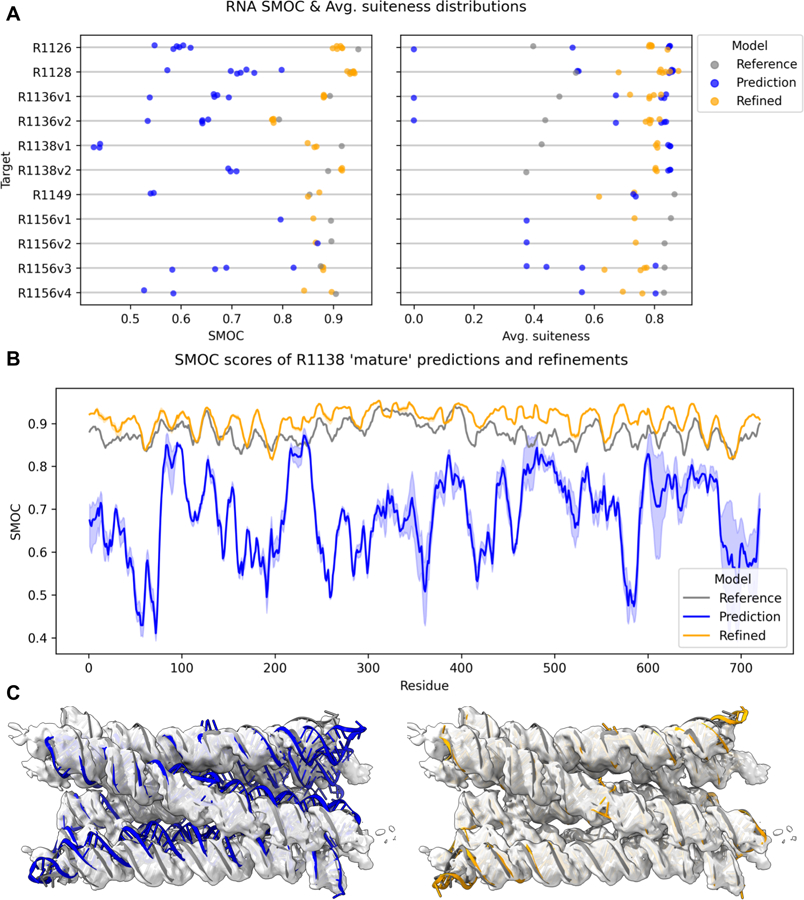
(A) The average SMOC scores for the target, predictions and refined predictions are shown alongside the RNA Validate ‘average suiteness’. (B) The residue level SMOC plots of R1138 in the mature conformation map and the predicted and refined models. The dark blue and orange lines are the average SMOC score for the predictions and refinements respectively, with the lightly shaded area representing the minimum and maximum values. (C) An R1138 prediction by Alchemy_RNA2 (group 232) in the ‘mature’ conformation map. Depicted are the prediction (blue) and refined prediction (orange) with respect to the reference model (gray).
3.3. RNA targets: refinement of top predictions
3.3.1. Selection criterion of RNA targets for refinement
Six of the eight RNA-containing targets were selected for refinement. The two RNA-protein complexes (RT1189, RT1190) were not selected as targets due to poor prediction accuracy (RMSD>15.9Å, GDT_TS<27). A separate analysis of these predictions was performed instead8. Furthermore, no predictions passed the CASP-scored selection for proteins (GDT_TS>0.7, lDDT>0.7) so we used an alternative selection process for RNA models. For each target, the ZEM ranking was used to obtain a top 10 models which were then visually inspected to obtain a set of models we thought most likely to be refined by criteria such as limited geometric problems, and minimal chain distortions needed to move into map8 (Table 3). Targets R1126, R1128, and R1149 had a single experimental structure and thus their top models by ZEM were selected and after manual fitting; 6, 7, and 3 models were refined, respectively. For the three remaining RNA-only cryo-EM targets, multiple experimental maps were used for refining the predicted structures.
For R1136, the two experimental maps, representing the ligand bound and unbound conformations, were topologically very similar, so the same models (5 total) were selected to refine into both maps. R1136 included 15 submitted models with the same RNA structure - they differed in their ligand prediction - so only 325_1 was used for refinement. For R1138, all top predictors were closer to the “mature” state, with no predictions close to the “young” state according to global topological and fit-to-map metrics. The top models (3 total) for the “mature” state were thus refined to both maps. For R1156 each map was considered separately resulting in 8 total refinements.
3.3.2. Overall RNA model analysis
The RNA predictions had average SMOC scores above 0.8 after refinement for all but the young conformation of R1138 discussed below, despite predicted models starting far from the reference structure (all GDT_TS<0.7) (Fig. 7A). In fact, for R1128, R1138v2, R1149, and R1156v3 targets, refined predictions surpassed the SMOC values of models fitted into the same RNA cryo-EM maps as reference models (Fig. 7A). Further, while prediction started with a spread of SMOC scores, the variance in SMOC score was reduced upon refinement. These results indicate that the refinement procedure was successful in fitting the models into the maps, moving all predictions to a similar solution, even in cases where large changes were needed. Compared to protein models where the fit of loops and side-chains could be assessed due to the higher resolution of the experimental maps, here the focus was on the overall fit of high level features.
R1138 a 6-helix bundle at 4.9Å resolution
A particularly interesting example for cryo-EM refinement of RNA models was the predictions and refinement for R1138, a designed 6-helix bundle of RNA with a clasp (6HBC)30. This target had reference structures and experimental maps for two alternative conformations, a short-lived “young” conformation and a stable “mature” conformation. The refinements for the mature conformation gave a better fit to the experimental density than the target reference structure (Fig. 7B) with the majority of residues having higher SMOC scores than those in the target reference structure. These predictions required significant conformational change as seen in Fig. 7C and Supplemental Video 2. The overall geometry, as assessed by the ‘average suiteness’ score (see Methods), was also better in the refined models than the reference structure (Fig. 7A). However, CASP predictions for the ‘young’ conformation failed to refine to the same extent (Fig 7A, Supplemental Video 3). This poorer result might be attributed to the greater degree of rearrangement of the helices and the breaking and reforming of hydrogen bonds in the kissing loop clasp required to convert from models resembling the mature conformation to the early conformation. The breaking and forming of such hydrogen bonds can in principle occur, but is unlikely, in our refinement protocol.
R1126 a designed “Traptamer” at 5.6Å resolution
The refined predictions of the designed RNA target R1126, a designed RNA origami scaffold for a Broccoli and Pepper aptamer pair31, had lower average SMOC scores than the reference target structure. However, this result may be due to the reference structure being overfitted to the cryo-EM map at the expense of realistic RNA geometry, as reflected by the low suiteness scores of the target structure compared to the refined models (Fig. 8A). Selected predictions for this target had a large degree of conformational diversity with models varying between 9 and 13Å RMSD from the target. Despite our refinement protocol improving the overall fit-to-map and improving the geometry of some of these predictions, a number of predictions from Alchemy_RNA2 (group 232) exhibited an incorrect crossover between strands (Fig. 8A). Fixing such issues would require breaking and rebuilding chains which is not allowed in our refinement protocol.
Fig. 8. RNA refinement case studies.
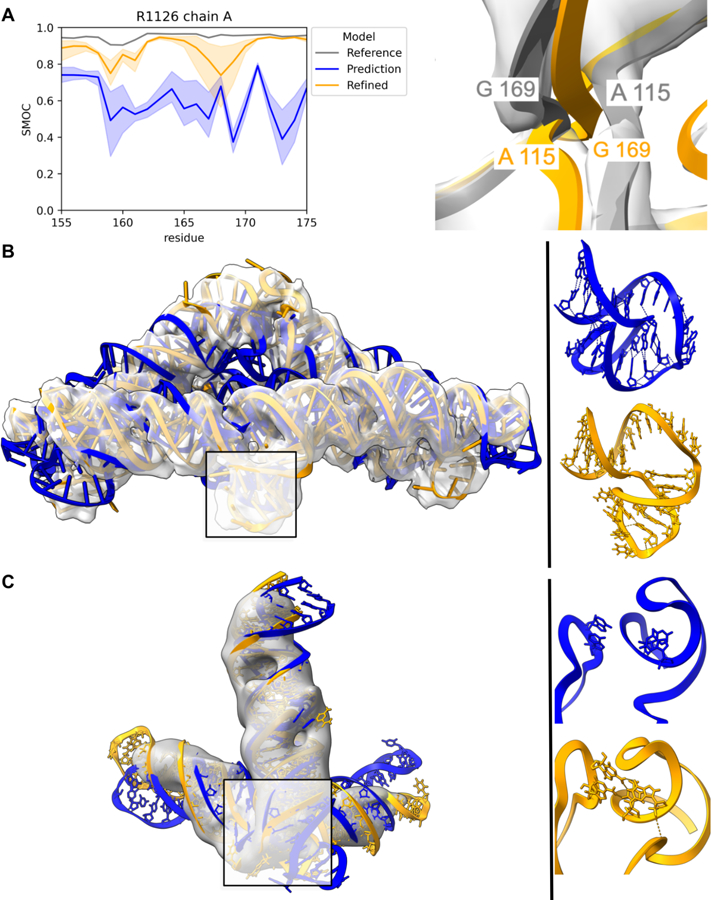
In all the visualizations, the target model is gray and the predictions are blue and orange before and after refinement, respectively. The dark orange line in the plot is the mean SMOC score, with the shaded region representing the minimum and maximum value for the set of predictions. (A) A SMOC plot of R1126 predictions and their refinements. Some refinements had residues between 155–175 with a variable SMOC score, large shaded region. This was due to strands crossing over, in some of the predictions, as shown in the right panel. (B) A model of R1126 from Chen (group 287) and its refinement. Overall, the R1126 predictions were refinable despite large conformational changes often being required. On the right, a close-up of the highlighted area showing the breaking of loop interaction during refinement. (C) A model of R1156 from Alchemy_RNA2 (group 232) and its refinement. After refining the model into the third conformation map, it better fitted the experimental density. On the right, a close-up of the highlighted area showing the formation of new interactions between an apical loop and an internal loop.
Both Alchemy_RNA2 (group 232) and Chen (group 287) provided a number of predictions which offered excellent refined models. All of these predictions required significant conformational changes to fit the experimental map. Often these movements involved breaking predicted interactions. One striking example is in the second prediction from Chen (Fig. 8B, Supplemental Video 1). In the prediction, a stem-loop was curled around and interacting with an upstream helix. In order to fit the density, the stem-loop interaction was broken allowing it to move into density.
R1156v3 - BtCoV-HKU5 SL5 at 7.6Å
Maps and reference structures for four alternative conformations of the SL5 domain from 5’UTR from the Bat coronavirus BtCoV-HKU5 were provided for assessment in this CASP. This domain is known to have a conserved secondary structure in many coronaviruses32,33, which is thought to be important in the packaging of viral particles during infection34. Maps for this target varied in resolution from 5.6 to 7.6 Å. The four refined predictions for the third conformation (R1156v3) exhibited average SMOC values slightly higher than the reference structure. Although the suiteness scores for the refined predictions were lower than for the reference structure, in all but one case they were better than the unrefined predictions. In contrast to the Traptamer example above, where refinement involved the breaking of an interaction of a apical loop, the refinement of the second prediction from Alchemy_RNA2 involved the formation of an interaction between a apical loop and an internal loop in another part of the model (Fig. 8C).
Discussion
In CASP15, 29% of the total targets, including 67% of the RNA-containing targets, were determined using cryo-EM. The accuracy of predictions for protein targets assessed in this paper and the overall quality of experimental maps allowed many predictions to be further refined to near-native conformations. Compared to most CASP assessments, where a single reference model has been used as the ground truth, cryo-EM assessment finds itself in a privileged position. To aid the assessment, cryo-EM maps are typically available in conjunction with target reference models - which are after all just best attempts at model building using the experimental map, human knowledge and current state of the art technology. This is particularly important, as cryo-EM data tends to have lower resolutions than crystallographic experiments. Because 3D reconstructions are built from averages of many particles, they may also capture continuous motions and flexibility of the visualized macromolecule, which can then manifest itself as lower resolution regions. There is thus an added degree of uncertainty in any static 3D structure that is derived from cryo-EM data.
One model, which particularly highlighted the importance of experimental data this year, was H1157. This model had an average resolution of 3.3 Å with many regions of the map having lower local resolution. Intriguingly, a large loop which was erroneously modeled in the target was much better modeled by the top predictions, with aromatic side chains well placed in the density. If, on the other hand, we only had the target model as ground truth (i.e., we did not use the experimental map for assessment), these better predictions would have not been noticed.
For the majority of targets, where the author’s submitted model (target reference model) and experimental map were in good agreement, some parts of the predicted models resulted in better fit to map following refinement. At the same time, many targets had loops which were not well predicted. Typically, the geometry of these loops varied amongst predictions, with many failing to be refined because they were too distant from the target. The lack of consensus amongst some of these loops was often reflected by lower local resolutions in the experimental map (Supp Fig. 2). While we did not investigate the relationship between these two phenomena in this paper, in CASP14 cryo-EM assessment, we showed anticorrelation between the standard deviation of the SMOC scores of the predicted models (SMOC SD) and SMOC scores of the target structures2.
The strong correlation between the rankings based on the cryo-EM-based docking score and the composite SCASP15 score shows that high quality models can often be picked using experimental data alone. For model building practitioners, this is particularly relevant, as reference structures may not be available. Given the difficulty of building models into experimental maps and the fact that there isn’t a single prediction tool which excels across all targets, docking and ranking offers an approach to screen for good starting models, potentially from multiple structural prediction tools.
Some maps provided by the experimentalists had been sharpened with DeepEMhancer23. This caused a degradation in MolProbity scores, likely because the TEMPy-ReFF GMM35 puts more weight on the sharpened map, overpowering the geometry restraints. Another unfortunate side-effect of DeepEMhancer maps was that low-resolution regions tended to disappear entirely in the sharpened maps. DeepEMhancer attempts to reproduce the sharpening produced by LocScale36 but without the need for an atomic model. However, this deep-learning approach tends to remove low resolution regions entirely, creating maps that look like they have been tightly masked, and may also hallucinate density. The current consensus on this emerging technique amongst the cryo-EM community is that such maps should not be used for refinement or measuring map-model quality but rather as an intermediate aid during model building. We would thus advocate for structure providers to offer raw maps with processed maps optional in future CASP challenges. Many of the predictions displayed a diverse set of loops in these regions. While sharpened maps may aid in model building, low-resolution regions can be an important indicator of flexibility and disorder. In future CASP cryo-EM assessments it would be useful to encourage the authors to provide unsharpened maps, and even half maps for further assessments.
For the first time in CASP history, RNA structures were provided as targets and the majority of them had associated cryo-EM density maps. Compared with the proteins, these RNA maps had much lower resolutions. Indeed, in some maps such as those of R1156, pitches of helices were not always visible. Local fit-to-map scores, such as the newly developed SMOCr, can aid the assessment of RNA models in these challenging resolutions. Here, this local fit analysis indicated that many secondary structures and important geometric features can be accurately predicted. Furthermore, we showed that in silico models can, after further refinement, offer plausible models that better reflect the experimental maps even at low resolutions. However, at such low resolutions, it is possible for many alternative structures to fit the density with equal likelihood. Due to both the known flexibility of the RNA molecules and the heterogeneity of the experimental maps, ensembles of models are arguably a more accurate way to describe the underlying experimental data8,37.
Despite the overall quality of predictions, some reorientation of domains and secondary structure elements was often required, particularly for RNA models. The multistage pipeline presented offers an approach to fitting and refinement of structural models into cryo-EM maps at a variety of resolutions. The use of progressively smaller rigid-bodies has been shown to aid the fitting of models that require large conformational changes19. However, if the models contain topological errors or significant misplacements of elements even such a detailed approach will fail.
As mentioned above, in CASP15 there were two RNA-protein complexes (RT1189, RT1190). The predictions associated with these targets were not refined due to poor accuracy8. Given the current progress in the structure prediction field, we expect further improvement on this front in future CASPs.
CryoEM has been an important method for elucidating large atomic structures, albeit often at a lower resolution than crystallographic experiments. This CASP15 for example, the largest monomeric structure in the history of CASPs, T1169, was a cryo-EM target. Moreover, cryo-EM experiments are now not just capturing large molecules but often achieving atomic levels of detail. In CASP15, focussed maps for the target H1114 reached an astonishing resolution of 1.52 Å. While at such resolutions, computational models are not required for model building, high-resolution data offers an opportunity to assess accuracy at an even finer level. Using the SMOC score separately for backbone (SMOCb) and side-chains (SMOCs), allowed us to show that while the overall backbone geometry of H1114 predictions was well modeled, side-chain orientations did not always agree with the experimental map. Given the progress in both protein structure prediction and cryo-EM fields, we foresee such analyses becoming more routine in the future.
Supplementary Material
Acknowledgements
This research was supported by the cooperation of Leibniz Institute of Virology (as part of Leibniz ScienceCampus InterACt, funded by the BWFGB Hamburg and the Leibniz Association) and by the Strategic Incentive Program of LIV and the Landesforschungsförderung Hamburg (Hamburg-X) (to T.M, J.G.B, and M.T). The PhD studentship of L.E. is co-funded by the Collaborative Computational Project for Electron cryo-Microscopy (CCP-EM). This research was supported by the US National Institute of General Medical Sciences (NIGMS, National Institutes of Health) grants R01 GM100482 (A.K.) and R35 GM122579 (R.D.); Stanford Bio-X (to R.D. and R.C.K.); and the Howard Hughes Medical Institute (HHMI, to R.D.). This article is subject to HHMI’s Open Access to Publications policy. HHMI lab heads have previously granted a nonexclusive CC BY 4.0 license to the public and a sublicensable license to HHMI in their research articles. Pursuant to those licenses, the author-accepted manuscript of this article can be made freely available under a CC BY 4.0 license immediately upon publication.
Footnotes
Conflict of interest statement
The authors declare no conflict of interest
References
- 1.Kryshtafovych A, Malhotra S, Monastyrskyy B, et al. Cryo-electron microscopy targets in CASP13: Overview and evaluation of results. Proteins 2019;87(12):1128–1140. doi: 10.1002/prot.25817 [DOI] [PMC free article] [PubMed] [Google Scholar]
- 2.Cragnolini T, Kryshtafovych A, Topf M. Cryo-EM targets in CASP14. Proteins 2021;89(12):1949–1958. doi: 10.1002/prot.26216 [DOI] [PMC free article] [PubMed] [Google Scholar]
- 3.Berman HM, Westbrook J, Feng Z, et al. The Protein Data Bank. Nucleic Acids Res 2000;28(1):235–242. doi: 10.1093/nar/28.1.235 [DOI] [PMC free article] [PubMed] [Google Scholar]
- 4.Ozden B, Kryshtafovych A, Karaca E. Assessment of the CASP14 assembly predictions. Proteins 2021;89(12):1787–1799. doi: 10.1002/prot.26199 [DOI] [PMC free article] [PubMed] [Google Scholar]
- 5.Evans R, O’Neill M, Pritzel A, et al. Protein complex prediction with AlphaFold-Multimer. bioRxiv Published online March 10, 2022:2021.10.04.463034. doi: 10.1101/2021.10.04.463034 [DOI] [Google Scholar]
- 6.Baek M, DiMaio F, Anishchenko I, et al. Accurate prediction of protein structures and interactions using a three-track neural network. Science 2021;373(6557):871–876. doi: 10.1126/science.abj8754 [DOI] [PMC free article] [PubMed] [Google Scholar]
- 7.Gao M, Nakajima An D, Parks JM, Skolnick J. AF2Complex predicts direct physical interactions in multimeric proteins with deep learning. Nat Commun 2022;13(1):1744. doi: 10.1038/s41467-022-29394-2 [DOI] [PMC free article] [PubMed] [Google Scholar]
- 8.Das R, Kretsch RC, Simpkin AJ, et al. Assessment of three-dimensional RNA structure prediction in CASP15. bioRxiv Published online October 3, 2023. doi: 10.1101/2023.04.25.538330 [DOI] [PMC free article] [PubMed] [Google Scholar]
- 9.Pettersen EF, Goddard TD, Huang CC, et al. UCSF ChimeraX: Structure visualization for researchers, educators, and developers. Protein Sci 2021;30(1):70–82. doi: 10.1002/pro.3943 [DOI] [PMC free article] [PubMed] [Google Scholar]
- 10.Vagin A, Teplyakov A. MOLREP: an Automated Program for Molecular Replacement. J Appl Crystallogr 1997;30(6):1022–1025. doi: 10.1107/S0021889897006766 [DOI] [Google Scholar]
- 11.Vagin AA, Isupov MN. Spherically averaged phased translation function and its application to the search for molecules and fragments in electron-density maps. Acta Crystallogr D Biol Crystallogr 2001;57(Pt 10):1451–1456. doi: 10.1107/s0907444901012409 [DOI] [PubMed] [Google Scholar]
- 12.van Zundert G, Bonvin A. Fast and sensitive rigid-body fitting into cryo-EM density maps with PowerFit. AIMS Biophys 2015;2(2):73–87. doi: 10.3934/biophy.2015.2.73 [DOI] [Google Scholar]
- 13.Kryshtafovych A, Rigden DJ. To split or not to split: CASP15 targets and their processing into tertiary structure evaluation units. Proteins Published online May 31, 2023. doi: 10.1002/prot.26533 [DOI] [PMC free article] [PubMed] [Google Scholar]
- 14.Simpkin AJ, Mesdaghi S, Sánchez Rodríguez F, et al. Tertiary structure assessment at CASP15. Proteins Published online September 25, 2023. doi: 10.1002/prot.26593 [DOI] [PMC free article] [PubMed] [Google Scholar]
- 15.Lafita A, Bliven S, Kryshtafovych A, et al. Assessment of protein assembly prediction in CASP12. Proteins 2018;86 Suppl 1(Suppl 1):247–256. doi: 10.1002/prot.25408 [DOI] [PMC free article] [PubMed] [Google Scholar]
- 16.Guzenko D, Lafita A, Monastyrskyy B, Kryshtafovych A, Duarte JM. Assessment of protein assembly prediction in CASP13. Proteins 2019;87(12):1190–1199. doi: 10.1002/prot.25795 [DOI] [PMC free article] [PubMed] [Google Scholar]
- 17.Malhotra S, Mulvaney T, Cragnolini T, et al. RIBFIND2: Identifying rigid bodies in protein and nucleic acid structures. Nucleic Acids Res Published online September 6, 2023. doi: 10.1093/nar/gkad721 [DOI] [PMC free article] [PubMed] [Google Scholar]
- 18.Chou FC, Richardson JS, Das R. ERRASER, a powerful new system for correcting RNA models. Computl Crystallogr Newslett [Google Scholar]
- 19.Joseph AP, Malhotra S, Burnley T, et al. Refinement of atomic models in high resolution EM reconstructions using Flex-EM and local assessment. Methods 2016;100:42–49. doi: 10.1016/j.ymeth.2016.03.007 [DOI] [PMC free article] [PubMed] [Google Scholar]
- 20.Williams CJ, Headd JJ, Moriarty NW, et al. MolProbity: More and better reference data for improved all-atom structure validation. Protein Sci 2018;27(1):293–315. 10.1002/pro.3330 [DOI] [PMC free article] [PubMed] [Google Scholar]
- 21.Adams PD, Afonine PV, Bunkóczi G, et al. PHENIX: a comprehensive Python-based system for macromolecular structure solution. Acta Crystallogr D Biol Crystallogr 2010;66(Pt 2):213–221. doi: 10.1107/S0907444909052925 [DOI] [PMC free article] [PubMed] [Google Scholar]
- 22.Richardson JS, Schneider B, Murray LW, et al. RNA backbone: consensus all-angle conformers and modular string nomenclature (an RNA Ontology Consortium contribution). RNA 2008;14(3):465–481. doi: 10.1261/rna.657708 [DOI] [PMC free article] [PubMed] [Google Scholar]
- 23.Sanchez-Garcia R, Gomez-Blanco J, Cuervo A, Carazo JM, Sorzano COS, Vargas J. DeepEMhancer: a deep learning solution for cryo-EM volume post-processing. Commun Biol 2021;4(1):874. doi: 10.1038/s42003-021-02399-1 [DOI] [PMC free article] [PubMed] [Google Scholar]
- 24.Gambelli L, McLaren M, Conners R, et al. Structure of the two-component S-layer of the archaeon Sulfolobus acidocaldarius. bioRxiv Published online October 7, 2022:2022.10.07.511299. doi: 10.1101/2022.10.07.511299 [DOI] [PMC free article] [PubMed] [Google Scholar]
- 25.van den Berg B, Silale A, Baslé A, Brandner AF, Mader SL, Khalid S. Structural basis for host recognition and superinfection exclusion by bacteriophage T5. Proc Natl Acad Sci U S A 2022;119(42):e2211672119. doi: 10.1073/pnas.2211672119 [DOI] [PMC free article] [PubMed] [Google Scholar]
- 26.Casañal A, Lohkamp B, Emsley P. Current developments in Coot for macromolecular model building of Electron Cryo-microscopy and Crystallographic Data. Protein Sci 2020;29(4):1069–1078. doi: 10.1002/pro.3791 [DOI] [PMC free article] [PubMed] [Google Scholar]
- 27.Croll TI. ISOLDE: a physically realistic environment for model building into low-resolution electron-density maps. Acta Crystallogr D Struct Biol 2018;74(Pt 6):519–530. doi: 10.1107/S2059798318002425 [DOI] [PMC free article] [PubMed] [Google Scholar]
- 28.Grinter R, Kropp A, Venugopal H, et al. Structural basis for bacterial energy extraction from atmospheric hydrogen. Nature 2023;615(7952):541–547. doi: 10.1038/s41586-023-05781-7 [DOI] [PMC free article] [PubMed] [Google Scholar]
- 29.Liu S, Xia X, Calvo E, Zhou ZH. Native structure of mosquito salivary protein uncovers domains relevant to pathogen transmission. Nat Commun 2023;14(1):899. doi: 10.1038/s41467-023-36577-y [DOI] [PMC free article] [PubMed] [Google Scholar]
- 30.McRae EKS, Rasmussen HØ, Liu J, et al. Structure, folding and flexibility of co-transcriptional RNA origami. Nat Nanotechnol Published online February 27, 2023. doi: 10.1038/s41565-023-01321-6 [DOI] [PMC free article] [PubMed] [Google Scholar]
- 31.Sampedro Vallina N, McRae EKS, Hansen BK, Boussebayle A, Andersen ES. RNA origami scaffolds facilitate cryo-EM characterization of a Broccoli-Pepper aptamer FRET pair. Nucleic Acids Res 2023;51(9):4613–4624. doi: 10.1093/nar/gkad224 [DOI] [PMC free article] [PubMed] [Google Scholar]
- 32.Miao Z, Tidu A, Eriani G, Martin F. Secondary structure of the SARS-CoV-2 5’-UTR. RNA Biol 2021;18(4):447–456. doi: 10.1080/15476286.2020.1814556 [DOI] [PMC free article] [PubMed] [Google Scholar]
- 33.Yang D, Leibowitz JL. The structure and functions of coronavirus genomic 3’ and 5’ ends. Virus Res 2015;206:120–133. doi: 10.1016/j.virusres.2015.02.025 [DOI] [PMC free article] [PubMed] [Google Scholar]
- 34.Maclean Bassett, Marco Salemi, Rife Magalis Brittany. Lessons Learned and Yet-to-Be Learned on the Importance of RNA Structure in SARS-CoV-2 Replication. Microbiol Mol Biol Rev 2022;86(3):e00057–21. doi: 10.1128/mmbr.00057-21 [DOI] [PMC free article] [PubMed] [Google Scholar]
- 35.Cragnolini T, Beton J, Topf M. Cryo-EM structure and B-factor refinement with ensemble representation. bioRxiv Published online June 9, 2022:2022.06.08.495259. doi: 10.1101/2022.06.08.495259 [DOI] [PMC free article] [PubMed] [Google Scholar]
- 36.Jakobi AJ, Wilmanns M, Sachse C. Model-based local density sharpening of cryo-EM maps. Elife 2017;6. doi: 10.7554/eLife.27131 [DOI] [PMC free article] [PubMed] [Google Scholar]
- 37.Beton JG, Cragnolini T, Kaleel M, Mulvaney T, Sweeney A, Topf M. Integrating model simulation tools and cryo-electron microscopy. Wiley Interdiscip Rev Comput Mol Sci Published online November 21, 2022. doi: 10.1002/wcms.1642 [DOI] [Google Scholar]
Associated Data
This section collects any data citations, data availability statements, or supplementary materials included in this article.