Abstract
A major impediment to understanding the biological roles of inorganic polyphosphate (polyP) has been the lack of sensitive definitive methods to extract and quantitate cellular polyP. We show that polyP recovered in extracts from cells lysed with guanidinium isothiocynate can be bound to silicate glass and quantitatively measured by a two-enzyme assay: polyP is first converted to ATP by polyP kinase, and the ATP is hydrolyzed by luciferase to generate light. This nonradioactive method can detect picomolar amounts of phosphate residues in polyP per milligram of extracted protein. A simplified procedure for preparing polyP synthesized by polyP kinase is also described. Using the new assay, we found that bacteria subjected to nutritional or osmotic stress in a rich medium or to nitrogen exhaustion had large and dynamic accumulations of polyP. By contrast, carbon exhaustion, changes in pH, temperature upshifts, and oxidative stress had no effect on polyP levels. Analysis of Escherichia coli mutants revealed that polyP accumulation depends on several regulatory genes, glnD (NtrC), rpoS, relA, and phoB.
Inorganic polyphosphates (polyP) are linear polymers of orthophosphate residues linked by high-energy phosphoanhydride bonds. These polymers can vary in size from 3 to over 1,000 phosphate residues. PolyP is ubiquitous, having been found in archaea, bacteria, fungi, plants, insects, and mammals (11, 25). To determine the physiological role(s) of polyP, several polyP-metabolizing enzymes have been purified and their genes have been cloned. The enzyme primarily responsible for polyP synthesis in Escherichia coli is polyP kinase (PPK), which uses the gamma phosphate of ATP to make the polymer (1, 9, 10). PolyP can also be hydrolyzed to Pi either by exopolyphosphatases (PPX) (2, 26) or by endopolyphosphatases (PPN) (12). In E. coli the genes for ppk and ppx are under the control of a common promoter (2). The inability to produce normal amounts of polyP upon deletion of the ppk ppx operon has produced several striking phenotypes: (i) decreased long-term survival in the stationary phase of growth; (ii) increased sensitivity to oxidative, osmotic, and thermal stresses; and (iii) the appearance of morphological variants (19).
Research on polyP has been hampered by the lack of adequate analytic methods. Previous methods were tedious and inexact. With purified enzymes as analytic reagents, analysis of polyP has been made specific, but these methods are still slow, depend on radioactive labeling with 32Pi, and can be used only with a limited range of media.
Here we describe methods for rapid extraction of polyP and a rapid and sensitive two-step conversion of polyP into ATP by PPK and hydrolysis of ATP by luciferase to generate light. With this assay, dynamic accumulations of polyP in bacterial cells have been observed in response to nutrient limitation or osmotic stress. Various E. coli mutants revealed multiple mechanisms for polyP accumulation through NtrC-, RpoS-, RelA-, and PhoB-dependent pathways.
MATERIALS AND METHODS
Sources were ADP, ATP, and the ATP Bioluminescence Assay Kit CLS II from Boehringer Mannheim; [γ-32P]ATP from Amersham; cesium chloride from U.S. Biochemicals; and Glassmilk and New Wash from Bio101. PolyP markers of defined chain lengths were gifts from the late Harland Wood. Purified recombinant E. coli PPK (1) and recombinant S. cerevisiae PPX (26) were prepared as described previously. Strains are described in Table 1. Plasmids containing histidine-tagged ppk or ppx genes and protocols detailing the overexpression and purification of the enzymes are available upon request.
TABLE 1.
Strains used in this studya
| Strain | Genotype | Source or reference | Text designation |
|---|---|---|---|
| E. coli | |||
| AMS150 | K-12 rpoS::Tn10 (Tcr) | 18 | |
| MG1655 | λ− F−; prototroph | 13 | Wild type |
| CF022 | MG1655 rpoN208::Tn10 (Tcr) | MG1655 × YMC18 | RpoN− |
| CF023 | MG1655 rpoS::Tn10 (Tcr) | MG1655 × AMS150 | RpoS− |
| CF029 | MG1655 glnG10::Tn5 (Kmr) | MG1655 × LR1 | NtrC− |
| CF030 | MG1655 glnD99::Tn10 (Tcr) | MG1655 × RB9040 | Utase/UR− |
| CF1652 | MG1655 ΔrelA251 | M. Cashel | RelA− |
| LR1 | lacIqlacL8 glnG10::Tn5/λgln105 (Kmr) | 21 | |
| NR2 | MG1655 phoB::Tn5 (Apr) | 20 | PhoB− |
| RB9040 | endA1 thi-1 hsdR17 supE44 hutCKlebs Δ(lac)U169 glnD99::Tn10; Mu lysogen (Tcr) | 3 | |
| YMC18 | endA1 thi-1 hsdR17 supE44 hutCKlebs Δ(lac)U169 rpoN208::Tn10 (Tcr) | 24 | |
| CF5802 | MG1655 Δppk Δppx::kan (Kmr) | 13 | PPK− PPX− |
| Other | |||
| P. aeruginosa PAO1 | A. Chakrabarty | ||
| A. johnsonii | ATCC 17909 |
Strains constructed for this study were made by standard P1vir transduction methods in which MG1655 was the recipient.
In vitro preparation of [32P]polyP.
A 0.7-ml reaction mixture contained 50 mM Tris-HCl (pH 7.4), 40 mM ammonium sulfate, 4 mM MgCl2, 40 mM creatine phosphate, 20 ng of creatine kinase per ml, 1 mM ATP (pH 7.2), 100 μCi of [γ-32P]ATP, and 72,000 U of PPK. After 30 min at 37°C, the reaction was stopped with 70 μl of 0.5 M EDTA. Conversion of ATP to polyP was determined by ascending thin-layer chromatography (TLC) with polyethyleneimine-cellulose in a solvent of 1 M formic acid–0.75 M LiCl. The TLC was dried and cut, and the polyP was determined by liquid scintillation counting. Yields were about 50% of the [32P]ATP. The polyP reaction mixture was divided into five equal volumes of 154 μl, and each was loaded over a 6×-volume cushion (924 μl) of 2.5 M CsCl–50 mM Tris-HCl (pH 7.4)–10 mM EDTA. After centrifugation at 95,000 rpm for 30 min at 20°C in a TLA 100.2 rotor (Beckman TL100 ultracentrifuge), the bottom 100 μl from each was pooled. With addition of a 0.7× volume of isopropanol, polyP precipitated at room temperature within 30 min and was recovered by centrifugation at 15,000 rpm in a microcentrifuge for 15 min; the pellet was washed with 0.3 ml of 70% ethanol, dried briefly under vacuum, resuspended in 100 μl of distilled water, and stored at 4°C. Recoveries were typically greater than 90%. The purity of the polyP (99%) was determined by susceptibility to hydrolysis in a reaction mixture containing 20 mM Tris-HCl (pH 7.5), 5 mM magnesium acetate, 50 mM ammonium acetate, and 48,000 U of PPX incubated at 37°C for 15 min (26). Pi released was separated by TLC and quantified by liquid scintillation counting (as above). The polyP product contained chains of approximately 750 Pi residues. Ladders of shorter lengths were generated by mild acid hydrolysis (12) as follows: 20 μl of 2 mM [32P]polyP750 prewarmed to 70°C was added to 20 μl of 20 mM HCl prewarmed to 70°C; the mixtures were maintained at 70°C from 0.5 to 1.5 min, after which the reaction was stopped in an ice bath and by the addition of 2 μl of 1 M Tris-HCl (pH 7.4). PolyP hydrolysis products were analyzed on a 6% polyacrylamide–urea gel (12) and compared with polyP markers.
Extraction of polyP with Glassmilk.
E. coli cultures (1 ml if optical density at 600 nm [OD600] <1.5 or 0.5 ml if >1.5) were pelleted in a 1.5-ml tube for 2 min in a tabletop microcentrifuge. The pellet was processed directly or frozen with crushed dry ice and stored at −80°C. To the pellet was added 0.5 ml of 4 M guanidine isothiocyanate (GITC)–50 mM Tris-HCl, pH 7.0 (GITC lysis buffer), prewarmed to 95°C. Tubes were vortexed, incubated for 2 to 5 min in a sand bath at 95°C, and sonicated briefly; a 10-μl sample was removed for protein estimation, with Coomassie Plus Protein Assay Reagent (Pierce) with bovine serum albumin as the standard resuspended in the same buffer as the sample. To each tube was added 30 μl of 10% sodium dodecyl sulfate (SDS), 0.5 ml of 95% ethanol, and 5 μl of Glassmilk. After being vortexed, the tube was centrifuged briefly to pellet the glass, which was then suspended in 0.5 ml of cold New Wash buffer (5 mM Tris-HCl [pH 7.5], 50 mM NaCl, 5 mM EDTA, 50% ethanol) by sonication in a Fisher FS30 ultrasonic cleaning bath and repelleted; washing was repeated twice. The washed pellet was then resuspended in 50 μl of 50 mM Tris-HCl (pH 7.4)–10 mM MgCl2–20 μg each of DNase and RNase per ml and incubated at 37°C for 10 min. The pellet was washed first with 150 μl of 4 M GITC lysis buffer and 150 μl of 95% ethanol and then twice in New Wash buffer. PolyP was eluted from the pellet with 50 μl of 50 mM Tris-HCl (pH 8.0) at 95°C for 2 min; recovery of polyP was complete with two additional elutions.
Assay of polyP.
PolyP was assayed in a 0.1-ml reaction mixture (50 mM Tris-HCl [pH 7.4], 40 mM ammonium sulfate, 4 mM MgCl2, 5 μM ADP, 24,000 U of PPK) incubated at 37°C for 40 min and then at 90°C for 2 min. The reaction mixture was diluted 1:100 in 100 mM Tris-HCl (pH 8.0)–4 mM EDTA, of which 0.1 ml was added to 0.1 ml of luciferase reaction mixture. Luminescence was measured by using a luminometer (Monolight 2010 [Analytical Luminescence Laboratory] or Topcount [Packard Instruments]). A standard curve for ATP (0, 0.55, 1.1, 1.65, and 3.3 pmol) in 100 mM Tris-HCl (pH 8.0)–4 mM EDTA was used for comparison. Concentration of polyP is given in terms of Pi residues. [32P]polyP values are based on specific radioactivity and susceptibility to hydrolysis with PPX.
RESULTS
Estimation of PolyP.
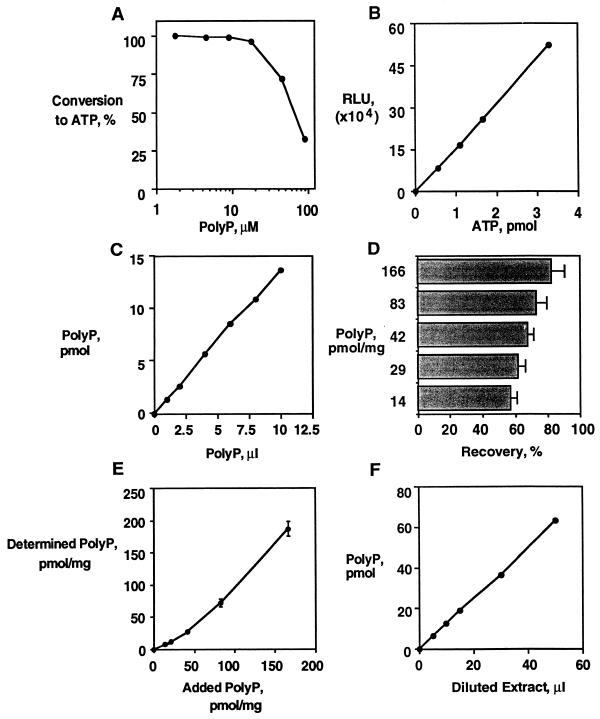
Separation of polyP from ATP was achieved by differential binding to Glassmilk (Table 2). ATP failed to bind to the glass (7% bound), and the remaining ATP was removed in subsequent wash steps with minimal loss of polyP (2 to 3% loss). Addition of SDS minimized the binding of protein to the Glassmilk and enabled polyP to be completely recovered. Greater than 98% conversion of polyP into ATP resulted when the ADP in the reaction mixture was greater than 13-fold in excess of the polyP, while the conversion of polyP into ATP was less than 30% when the ADP was in twofold excess of the polyP (Fig. 1A).
TABLE 2.
Extraction of polyP using silicate glassa
| Fraction | Recovery (%)
|
|||
|---|---|---|---|---|
| PolyP (chain length)
|
ATP | |||
| 60–300 | 100–500 | 750–800 | ||
| Unbound | 5 | 2 | 0 | 93 |
| Wash | 3 | 3 | 2 | 7 |
| Eluted | 92 | 95 | 98 | 0 |
E. coli CF5802 (0.5 ml of a culture with an OD600 of 1.7) was lysed in 0.3 ml of 4 M GITC lysis buffer and kept at 95°C for 2 min and then sonicated for 5 min; 5 μl of [32P]polyP (7 nmol/mg of protein, final concentration) or [γ-32P]ATP (258 nmol/mg of protein, final concentration), 30 μl of 10% SDS, 0.3 ml of 95% ethanol, and 5 μl of Glassmilk were sequentially added, the glass was pelleted, and the supernatant was collected (unbound). The glass pellets were resuspended in New Wash buffer by sonication and pelleted, the supernatant was collected, the wash was repeated, and the supernatants were pooled (wash). The washed pellet was then resuspended in 50 μl of 50 mM Tris-HCl (pH 7.4)–10 mM MgCl2–20 μg each of DNase and RNase per ml and incubated at 37°C for 10 min. The pellet was washed first with 150 μl of 4 M GITC lysis buffer and 150 μl of 95% ethanol and then twice in New Wash buffer. PolyP was eluted from the pellet with 50 μl of 50 mM Tris-HCl (pH 8.0) at 95°C for 2 min; recovery of polyP was complete with two additional elutions (eluted). Values are averages of duplicates and were within 2% of each other.
FIG. 1.
PolyP assay. (A) Conversion of [32P]polyP to ATP. Various concentrations of [32P]polyP were reacted with 24,000 U of PPK and 200 μM ADP in a 0.1-ml reaction mixture for 40 min at 37°C. [32P]polyP and [32P]ATP were separated by TLC and quantitated by scintillation counting. Values are averages of triplicate reactions. (B) ATP estimation with luciferase. A standard curve for ATP (0, 0.55, 1.1, 1.65, 3.3 pmol of ATP) was prepared in 100 mM Tris-HCl (pH 8.0)–4 mM EDTA and added to an equal volume of luciferase reaction mixture, and the luminescence was measured. A linear relationship with a correlation coefficient of 1.00 was obtained. (C) Quantitation of [32P]polyP. [32P]polyP was added to a 0.1-ml reaction mixture containing 12,000 U of PPK–5 μM ADP and incubated at 37°C for 40 min and then 90°C for 5 min and diluted 100-fold with 100 mM Tris-HCl (pH 8.0)–4 mM EDTA. Then 0.1 ml of the diluted reaction mixture was added to 0.1 ml of luciferase reaction mixture and the luminescence was measured. A linear relationship with a correlation coefficient of 1.00 was obtained. (D) Recovery of polyP from Glassmilk. [32P]polyP was added at various concentrations to GITC lysates of ppk ppx cells from 0.5-ml cultures (OD600 of 1.1), and polyP was extracted. Radioactivity eluted and remaining on the Glassmilk pellet was used to estimate recovery. Results are averages of triplicate assays. (E) Variation of polyP assay. PolyP extracts as for panel D were analyzed by conversion with PPK and ADP followed by ATP estimation with luciferase. Results are averages of triplicate assays and include error bars. (F) Quantitation of polyP extracts. ppk ppx cells complemented with a plasmid overexpressing the ppk gene (pGexPPK) were grown to an OD600 of 0.7 and then induced to express PPK by the addition of isopropyl-β-d-thiogalactopyranoside to 50 μM and grown at 30°C for 2 h. PolyP was extracted and analyzed from 1-ml cultures as described in Materials and Methods. Serial dilutions were initially assayed to identify an appropriate dilution of polyP to be examined. A second round of analysis gave a linear correlation over six determinations with a correlation coefficient of 1.00.
ATP was determined in a linear range between 0.55 and 3.3 pmol in a 100-μl sample (Fig. 1B). All commercial samples of ADP contained trace amounts of ATP when tested with the luciferase assay (the purest source [Boehringer] contained 0.2%). To minimize the signal due to ATP contamination, the polyP was converted in a 100-μl reaction mixture containing 5 μM ADP, producing a background signal of 1.04 pmol in the reaction mixture which was further reduced by a 100-fold dilution after incubation with PPK. In vitro-synthesized [32P]polyP could be accurately quantitated with linearity over the concentration range tested (1.4 to 13.6 pmol of polyP in a 100-μl reaction mixture) with a correlation coefficient of 1.00. In this reaction ADP was at least 36-fold in excess of the polyP (Fig. 1C). The estimated concentration (1.36 mM) agrees with the concentration judged by specific radioactivity and PPX hydrolysis (1.37 mM).
Recovery of polyP from Glassmilk decreased at very low polyP concentrations due to a relative increase in the percentage of sites of irreversible binding to the Glassmilk (Fig. 1D). Variation in the analysis comes from variability in the extraction (Fig. 1D) rather than variability in the enzymatic conversion (Fig. 1E). This level of sensitivity (500 pmol/mg of protein) is comparable to the sensitivity of the radioactive methods. Analysis of ppk ppx mutant cells complemented with a plasmid overexpressing the ppk gene (pGexPPK) and induced to express PPK gave a linear correlation over six determinations with a correlation coefficient of 1.00 (Fig. 1F). The linearity implies a complete conversion of polyP into ATP with an eightfold excess of ADP. The signal was completely removed by exposure to PPX followed by heat inactivation prior to analysis with PPK.
Nutrient limitation.
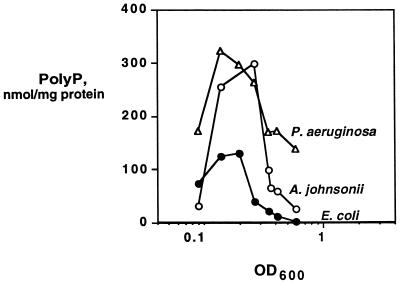
In cells grown overnight in 3-[N-morpholino]propanesulfonic acid (MOPS) medium containing 2 mM Pi and 4 mg of glucose per ml and then reinoculated into the same medium with limited phosphate (0.1 mM) and amino acids (2 μg/ml), a rapid and massive transient accumulation of polyP was observed (Fig. 2). Mutant ppk ppx cells failed to accumulate polyP (<200 pmol/mg of protein). PolyP values measured with the nonradioactive assay for E. coli are in close agreement with those obtained with radiolabeled phosphate, enrichment of [32P]polyP on ion-exchange filters, and quantitation by susceptibility to PPX (within 95%).
FIG. 2.
Phosphate and amino acid limitation. Cells were grown overnight in MOPS medium and then reinoculated into the same medium with limited amounts of phosphate (0.1 mM) and amino acids (2 μg/ml). PolyP was assayed as described in Materials and Methods. E. coli is strain MG1655.
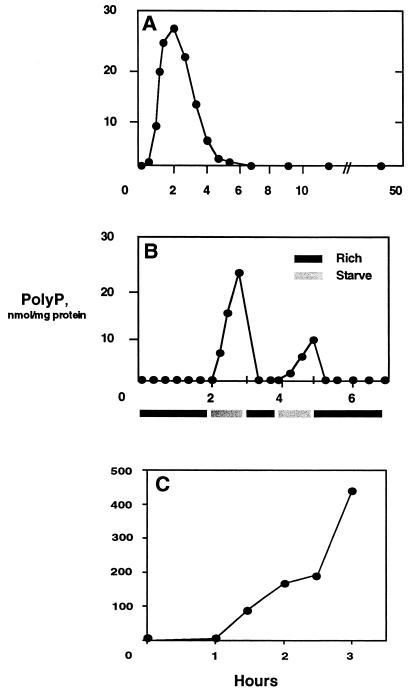
The new assay applied to Acinetobacter johnsonii and Pseudomonas aeruginosa revealed even greater polyP accumulations (Fig. 2). E. coli grown to mid-log phase (OD600 of 0.9) in Luria-Bertani broth (LB) and transferred to MOPS medium with sufficient phosphate (2 mM) but without amino acids or a carbon source accumulated polyP within the first 15 min and continued to do so for the next 2 h before levels returned to background over the next 4 h (Fig. 3A). Cells pelleted and resuspended in fresh LB failed to accumulate polyP, nor did ppk ppx cells subjected to the nutrient downshift (<200 pmol/mg protein). The accumulations in response to the downshift could be reversed by an upshift back into LB (Fig. 3B). This resulted in an extremely rapid decrease in the levels of polyP (within 15 min). This pattern could be repeated with a subsequent round of downshifting and upshifting. In the second downshift, the rate of polyP accumulation was less rapid, while the decrease in polyP levels to background in response to an upshift remained immediate.
FIG. 3.
Nutrient downshifts. (A) E. coli MG1655 cells grown to mid-log phase in LB were downshifted by resuspension in MOPS medium without a carbon source or amino acids. (B) E. coli MG1655 cells grown to mid-log phase in LB were downshifted as above and then upshifted by resuspension in LB. Growth in rich medium (LB) or SM (MOPS medium without a carbon source or amino acids) is indicated by dark or light bars, respectively. (C) E. coli MG1655 cells grown to mid-log phase in LB were downshifted to MOPS medium with low phosphate (0.1 mM) and without amino acids. PolyP was assayed as described in Materials and Methods.
Much greater accumulations of polyP were observed when cells were grown in LB and then downshifted to MOPS medium with a low concentration of Pi (0.1 mM) and 4 mg of glucose per ml and without amino acids (Fig. 3C). After an initial hour lag, the accumulation was extremely rapid (from less than 0.5 to 200 nmol/mg of protein within an hour) and continued to more than double over the next hour. E. coli CF1652, which contains a deletion of the relA gene, failed to accumulate polyP under the same conditions (Table 3).
TABLE 3.
Ability of various E. coli strains to accumulate polyP in response to stresses
| Stress | Accumulation in strainsa
|
|
|---|---|---|
| High | None | |
| Limited nutrient medium | ||
| SM limited for N source | WT | RpoS− |
| RelA− | NtrC− | |
| RpoN− | Utase/UR− | |
| PhoB− | ||
| SM limited for C source | WT | |
| MOPS, 0.1 mM Pi, 2 μg of amino acids/ml | WT | |
| Nutrient downshifts | ||
| LB to MOPS (2 mM Pi, no glucose, no amino acids) | WT | |
| LB to MOPS (0.1 mM Pi, 0.4% glucose, 20 μg of amino acids/ml) | WT | RelA− |
| SM, complete to SM, no N, no amino acids | WT | |
| RpoS− | ||
| RpoN− | ||
| Osmotic (LB, 1.17M NaCl) | WT | RpoS− |
| RelA− | PhoB− | |
| RpoN− | ||
| Acid/alkaline | ||
| LB, pH 4.5 | WT | |
| LB, pH 9.0 | WT | |
| Temperature (LB, 42°C) | WT | |
| Oxidative (LB, 0.1 mM H2O2) | WT | |
High represents polyP accumulation of 20 to 500 nmol/mg of protein. None represents polyP levels below 0.1 nmol/mg of protein. No polyP accumulated in ppk ppx cells under any condition. WT, wild type.
Osmotic stress.
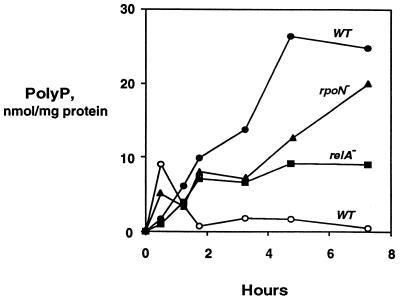
Cells at mid-log phase in LB, pelleted and resuspended in LB containing 1.17 M NaCl, stopped growing immediately and polyP levels rapidly increased (Fig. 4, closed circles). Shifts into LB of the same osmolarity (0.17 M NaCl) did not lead to accumulations of polyP (<200 pmol/mg of protein). A shift to LB with 0.85 M NaCl produced a smaller transient accumulation of polyP (Fig. 4, open circles), while shifts into LB containing 10 or 50 mM procaine, an anesthetic which is known to stimulate the osmotic response protein EnvZ had no effect on polyP levels (<200 pmol/mg of protein). Significant stimulation of EnvZ by procaine is reported to occur at concentrations of 10 mM (17). The large differences in polyP accumulation resulting from only a 27% change in osmolarity (1.17 versus 0.85 M) may indicate a threshold response.
FIG. 4.
Osmotic stress. PolyP was measured for E. coli cultures grown to mid-log phase in LB and then resuspended in LB containing 1.17 M NaCl (closed symbols) or 0.85 M NaCl (open circles). PolyP was assayed as described in Materials and Methods. Strains are described in Table 1.
Osmotic stress of strains with deletions in relA or rpoN led to significant polyP accumulations (10 to 20 nmol/mg of protein) despite the increased sensitivity of the strains to the osmotic stress (indicated by decreases in the ODs during the stress due to lysis or hypertonic dehydration). Strains with deletions in rpoS or phoB failed to accumulate polyP in response to osmotic stress (Table 3). Accumulations of polyP did not occur in response to several other stress conditions: shifts in LB from pH 7.0 to pH 4.5, 7.0, or 9.0 or shifts from 37 to 42°C (Table 3).
Nitrogen limitation.
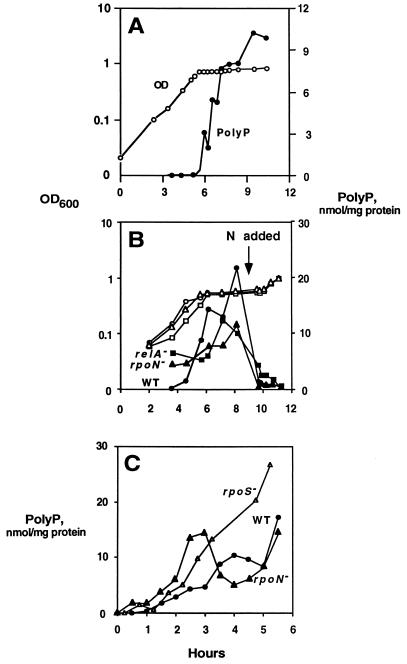
In cells grown in starvation medium (SM) (6) containing a limited amount of nitrogen (2 mM), stoppage of growth due to exhaustion of the nitrogen source coincided with a rapid accumulation of polyP (Fig. 5A). PolyP levels fell and growth resumed immediately after addition of nitrogen to the medium (Fig. 5B). A similar response occurred in strains containing deletions in relA or rpoN (Fig. 5B). In contrast, strains with deletions in rpoS, phoB, glnD (Utase/UR), or glnG (NtrC) did not accumulate polyP (Table 3). PolyP accumulated in cells grown in SM to mid-log phase and then shifted to SM lacking nitrogen and amino acids (Fig. 5C). In contrast to nitrogen exhaustion, RpoS− strains could accumulate polyP under this condition.
FIG. 5.
Nitrogen limitation. (A) E. coli MG1655 cells were inoculated into SM containing limited nitrogen. (B) Cells were grown as for panel A, and nitrogen was added to the culture at 9.5 h. (C) Cells were grown in SM to mid-log phase and then shifted to SM lacking nitrogen and amino acids. All cultures stopped growing after the shift.
DISCUSSION
A major impediment to understanding the physiological role of polyP has been the inadequacy of quantitative methods. The availability of purified polyP-specific enzymes (PPX and PPK) increased the specificity of assays but required extensive enrichment of polyP from the crude extract before enzymatic conversion became feasible. The new method involves a rapid and simple extraction and does not require prior radioactive labeling. A limitation of the new method is its requirement for polyP chains of at least 60 residues. It is possible that smaller, but physiologically relevant, polyP chains escape detection with this method.
The accumulations of polyP in response to nutritional stringencies or osmotic shock link for the first time changes in polyP levels with phenotypes observed in the ppk ppx mutants. Mutants which fail to produce polyP have a decreased ability to survive in the stationary phase and are more susceptible to osmotic stress (19). The phenotypic effects of the ppk ppx deletion on adaptive responses to nitrogen exhaustion require further study.
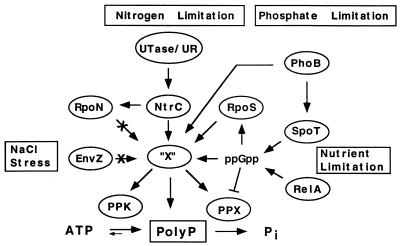
The analyses of mutant strains demonstrate multiple pathways leading to polyP accumulation. Guanosine tetraphosphate (ppGpp) was previously shown to inhibit PPX activity (13), thus providing a mechanism for polyP accumulation independent of stimulated PPK activity (Fig. 6). Accumulation of ppGpp occurs through the actions of RelA and/or SpoT in response to a variety of stringencies and leads to up regulation of biosynthetic operons. The failure of relA mutants to accumulate polyP points to some mechanism for accumulation involving ppGpp (4). Conditions in which relA mutants accumulate polyP may also involve ppGpp synthesized by SpoT.
FIG. 6.
Model for stress-induced polyP accumulation. Nitrogen is regulated by a signal cascade involving Utase/UR, NtrB, NtrC, and RpoN. NtrC, together with RpoS and PhoB, is needed for polyP accumulation in response to nitrogen limitation. Involvement of a sigma factor (RpoS) implies activation of an additional factor (“X”) which could lead to polyP accumulation by direct interaction with polyP, inhibition of PPX, stimulation of PPK, or a combination of all three. Under nutrient limitation, ppGpp accumulates by RelA and SpoT actions, which can lead to polyP accumulation by PPX inhibition and/or RpoS activation. Failure to accumulate polyP when ppGpp and RpoS levels are high (such as under carbon starvation) implies the presence of additional regulator(s). Osmotic stress triggers polyP accumulation through a mechanism that does not involve EnvZ, the osmotic sensor.
Factors in addition to ppGpp are necessary for accumulation under different stress conditions. The rpoS gene of E. coli encodes a sigma factor required for the expression of over 50 genes induced in the stationary phase, involved in stress resistance and long-term survival (16), and known to be partially regulated by ppGpp (4). rpoS mutants failed to accumulate polyP in response to nitrogen exhaustion and osmotic stress. Dependence on a sigma factor implies a requirement for an additional factor(s) for polyP accumulation, designated “X” in Fig. 6. In contrast to the rpoS-dependent polyP accumulation reported here, it has been reported that polyP-depleted cells were unable to induce transcription of both rpoS and katE (an rpoS-dependent gene) (22). An interdependent regulatory mechanism could account for this apparent codependence for stimulation between polyP and rpoS. An inhibition of rpoS expression in the ppk ppx mutant is consistent with the observed phenotypes (19).
Under some conditions in which ppGpp and RpoS accumulations are known to occur, such as carbon starvation, acid or alkaline stress, temperature stress, and oxidative stress (7, 23), polyP failed to accumulate (Table 3), indicating that an additional factor(s) is involved. Clearly then, polyP accumulation is not a general response to stress but occurs as a result of specific stresses. With regard to salt stress, the failure of procaine to trigger polyP accumulation demonstrates that the EnvZ-mediated pathway is not involved. PolyP accumulation in response to salt stress could be triggered by secondary effects of the hyperosmolarity, such as nutrient or nitrogen depletion.
Accumulation of polyP in response to nitrogen exhaustion directly links the nitrogen regulation signaling cascade with rpoS and changes in phosphate metabolism. RpoN mutants were able to accumulate polyP in response to nitrogen exhaustion, but mutations in Utase/UR and NtrC, the regulator, abolished this ability (Table 3), indicating a signaling mechanism in which NtrC can act as the response regulator for RpoS to activate a factor(s), “X”, which could then trigger polyP accumulation by mechanisms involving the stimulation of PPK activity, the inhibition of PPX activity, or both (Fig. 6).
In adaptations to stress, cells must coordinate major changes in the rates of transcription, translation, and replication as well as choices in the genes expressed (8). PolyP could provide activated phosphates or coordinate an adaptive response by binding metals and/or specific proteins. The transient nature of the accumulations and the rapid turnover rate of ATP in the cell (the entire pool of ATP is typically turned over in 0.2 s [5]) argues against polyP simply as an ATP store. As a polyanionic polymer, polyP has chemical similarities to DNA and RNA in interactions with basic domains of proteins that interact with DNA and RNA. PolyP was reported to be associated with RNA polymerase isolated from stationary-phase E. coli (15). Further investigation of the cellular location of polyP, its state of metabolic availability, and identification of its binding partners should help to clarify this issue.
ACKNOWLEDGMENTS
We thank the late Harland Wood for his generous gift of polyP markers; Michael Cashel, Larry Reitzer, and Anand Chakrabarty for their generous gifts of E. coli strains and helpful discussions; Christian Itin for numerous helpful discussions during the course of this study and preparation of the manuscript; and Wayne Fiori for help with the computers.
REFERENCES
- 1.Ahn K, Kornberg A. Polyphosphate kinase from Escherichia coli. Purification and demonstration of a phosphoenzyme intermediate. J Biol Chem. 1990;265:11734–11739. [PubMed] [Google Scholar]
- 2.Akiyama M, Crooke E, Kornberg A. An exopolyphosphatase of Escherichia coli. J Biol Chem. 1993;268:633–639. [PubMed] [Google Scholar]
- 3.Bueno R, Pahel G, Magasanik B. Role of glnB and glnD gene products in regulation of the glnALG operon of Escherichia coli. J Bacteriol. 1985;164:816–822. doi: 10.1128/jb.164.2.816-822.1985. [DOI] [PMC free article] [PubMed] [Google Scholar]
- 4.Cashel M, Gentry D R, Hernandez V J, Vinella D. The stringent response. In: Neidhardt F C, Curtiss III R, Ingraham J L, Lin E C C, Low K B, Magasanik B, Reznikoff W S, Riley M, Shaechter M, Umbarger H E, editors. Escherichia coli and Salmonella typhimurium: cellular and molecular biology. Washington, D.C: American Society for Microbiology; 1996. pp. 1458–1496. [Google Scholar]
- 5.Chapman A G, Atkinson D E. Adenine nucleotide concentrations and turnover rates. Their correlation with biological activity in bacteria and yeast. Adv Microbiol Physiol. 1977;15:253–306. doi: 10.1016/s0065-2911(08)60318-5. [DOI] [PubMed] [Google Scholar]
- 6.Groat R G, Schultz J E, Zychlinsky E, Bockman A, Matin A. Starvation proteins in Escherichia coli: kinetics of synthesis and role in starvation survival. J Bacteriol. 1986;168:486–493. doi: 10.1128/jb.168.2.486-493.1986. [DOI] [PMC free article] [PubMed] [Google Scholar]
- 7.Hengge-Aronis R, Klein W, Lange R, Rimmele M, Boos W. Trehalose synthesis genes are controlled by the putative sigma factor encoded by rpoS and are involved in stationary-phase thermotolerance in Escherichia coli. J Bacteriol. 1991;173:7918–7924. doi: 10.1128/jb.173.24.7918-7924.1991. [DOI] [PMC free article] [PubMed] [Google Scholar]
- 8.Kolter R, Siegele D A, Tormo A. The stationary phase of the bacterial life cycle. Annu Rev Microbiol. 1993;47:855–874. doi: 10.1146/annurev.mi.47.100193.004231. [DOI] [PubMed] [Google Scholar]
- 9.Kornberg A, Kornberg S R, Simms E S. Metaphosphate synthesis by an enzyme from Escherichia coli. Biochim Biophys Acta. 1956;20:215–227. doi: 10.1016/0006-3002(56)90280-3. [DOI] [PubMed] [Google Scholar]
- 10.Kornberg S R. Adenosine triphosphate synthesis from polyphosphate by an enzyme from Escherichia coli. Biochim Biophys Acta. 1957;26:294–300. doi: 10.1016/0006-3002(57)90008-2. [DOI] [PubMed] [Google Scholar]
- 11.Kulaev I S. The biochemistry of inorganic polyphosphates. New York, New York: John Wiley & Sons; 1979. [Google Scholar]
- 12.Kumble K D, Kornberg A. Endopolyphosphatases for long-chain inorganic polyphosphate in yeast and mammals. J Biol Chem. 1996;271:27146–27151. doi: 10.1074/jbc.271.43.27146. [DOI] [PubMed] [Google Scholar]
- 13.Kuroda A, Murphy H, Cashel M, Kornberg A. Guanosine tetra- and pentaphosphate promote accumulation of inorganic polyphosphate in Escherichia coli. J Biol Chem. 1997;272:21240–21243. doi: 10.1074/jbc.272.34.21240. [DOI] [PubMed] [Google Scholar]
- 14.Kuroda A, Kornberg A. Polyphosphate kinase as a nucleoside diphosphate kinase in Escherichia coli and Pseudomonas aeruginosa. Proc Natl Acad Sci USA. 1997;94:439–442. doi: 10.1073/pnas.94.2.439. [DOI] [PMC free article] [PubMed] [Google Scholar]
- 15.Kusano S, Ishihama A. Functional interaction of Escherichia coli RNA polymerase with inorganic polyphosphate. Genes Cells. 1997;2:433–441. doi: 10.1046/j.1365-2443.1997.13203301320330.x. [DOI] [PubMed] [Google Scholar]
- 16.Loewen P C, Hengge-Aronis R. The role of the sigma factor sigma S (katF) in bacterial global regulation. Annu Rev Microbiol. 1994;48:53–80. doi: 10.1146/annurev.mi.48.100194.000413. [DOI] [PubMed] [Google Scholar]
- 17.Lu Q, Park H, Egger L A, Inouye M. Nucleoside-diphosphate kinase-mediated signal transduction via histdyl-aspartyl phosphorelay systems in Escherichia coli. J Biol Chem. 1996;271:32886–32893. doi: 10.1074/jbc.271.51.32886. [DOI] [PubMed] [Google Scholar]
- 18.McCann M P, Kidwell J P, Matin A. The putative sigma factor KatF has a central role in development of starvation-mediated general resistance in Escherichia coli. J Bacteriol. 1991;173:4188–4194. doi: 10.1128/jb.173.13.4188-4194.1991. [DOI] [PMC free article] [PubMed] [Google Scholar]
- 19.Rao N N, Kornberg A. Inorganic polyphosphate supports resistance and survival of stationary-phase Escherichia coli. J Bacteriol. 1996;178:1394–1400. doi: 10.1128/jb.178.5.1394-1400.1996. [DOI] [PMC free article] [PubMed] [Google Scholar]
- 20.Rao, N. N., S. Liu, and A. Kornberg. Inorganic polyphosphate in Escherichia coli: the phosphate regulon and the stringent response. J. Bacteriol., in press. [DOI] [PMC free article] [PubMed]
- 21.Schneider B L, Shiau S-P, Reitzer L J. Role of multiple environmental stimuli in control of transcription from a nitrogen-regulated promoter in Escherichia coli with weak or no activator-binding sites. J Bacteriol. 1991;173:6355–6363. doi: 10.1128/jb.173.20.6355-6363.1991. [DOI] [PMC free article] [PubMed] [Google Scholar]
- 22.Shiba T, Tsutsumi K, Yano H, Ihara Y, Kameda A, Takahashi K, Masanobu M, Rao N N, Kornberg A. Inorganic polyphosphate and the induction of rpoS expression. Proc Natl Acad Sci USA. 1997;94:11210–11215. doi: 10.1073/pnas.94.21.11210. [DOI] [PMC free article] [PubMed] [Google Scholar]
- 23.Small P, Blankenhorn D, Welty D, Zinser E, Slonczewski J L. Acid and base resistance in Escherichia coli and Shigella flexneri: role of rpoS and growth pH. J Bacteriol. 1994;176:1729–1737. doi: 10.1128/jb.176.6.1729-1737.1994. [DOI] [PMC free article] [PubMed] [Google Scholar]
- 24.Ueno-Nishio S, Backman K C, Magasanik B. Regulation at the glnL-operator-promoter of the complex glnAG operon of Escherichia coli. J Bacteriol. 1983;153:1247–1251. doi: 10.1128/jb.153.3.1247-1251.1983. [DOI] [PMC free article] [PubMed] [Google Scholar]
- 25.Wood H G, Clark J E. Biological aspects of inorganic polyphosphates. Annu Rev Biochem. 1988;57:235–260. doi: 10.1146/annurev.bi.57.070188.001315. [DOI] [PubMed] [Google Scholar]
- 26.Wurst H, Kornberg A. A soluble exopolyphosphatase of Saccharomyces cerevisiae. J Biol Chem. 1994;269:10996–11001. [PubMed] [Google Scholar]


