Abstract
Single source contribution to ambient O3 and PM2.5 have been estimated with photochemical grid models to support policy demonstrations for National Ambient Air Quality Standards, regional haze, and permit related programs. Limited field data exists to evaluate model representation of the spatial extent and chemical composition of plumes emitted by specific facilities. New tropospheric column measurements of NO2 and in-plume chemical measurements downwind of specific facilities allows for photochemical model evaluation of downwind plume extent, grid resolution impacts on plume concentration gradients, and source attribution methods. Here, photochemical models were applied with source sensitivity and source apportionment approaches to differentiate single source impacts on NO2 and O3 and compared with field study measurements. Source sensitivity approaches (e.g., brute-force difference method and decoupled direct method (DDM)) captured the spatial extent of NO2 plumes downwind of three facilities and the transition of near-source O3 titration to downwind production. Source apportionment approaches showed variability in terms of attributing the spatial extent of NO2 plumes and downwind O3 production. Each of the Community Multiscale Air Quality (CMAQ) source apportionment options predicted large O3 contribution from the TVA facility in the flight transects nearest the facility when measurements and source sensitivity approaches suggest titration was outpacing production. In general, CMAQ DDM tends to attribute more O3 to boundary inflow and less to within-domain NOX and VOC sources compared to CMAQ source apportionment. The photochemical modeling system captured plumes using 1 to 12 km grid resolution with best representation of plume extent and magnitude at the finer resolutions. When modeled at 1 to 12 km grid resolution, primary and secondary PM2.5 impacts were highest at the source location and decrease as distance increases downwind.
Keywords: NO2column, O3, source apportionment, CMAQ, DDM
INTRODUCTION
The air quality impact of single facility emission controls gets assessed for many regulatory programs in the United States including attainment of the National Ambient Air Quality Standards (NAAQS), regional haze program, and permit related (Nonattainment New Source Review and Prevention of Significant Deterioration) programs. These air quality impacts include both primary and secondarily formed pollutants and cover local to regional scales. Photochemical models have been used to estimate the impacts of specific sources on O3 and PM2.5 at these types of policy relevant spatial scales (Baker et al., 2016b; Bergin et al., 2008; Kelly et al., 2015).
Past model evaluation studies show photochemical grid models can reasonably predict plume placement (Baker et al., 2014; Baker and Kelly, 2014; Baker and Woody, 2017) and chemical composition (Baker and Kelly, 2014; Baker and Woody, 2017) downwind from specific facilities when compared with in-transect plume measurements. A limitation of in-situ in-plume transect measurements is the spatial incongruities of the measurement to the model grid box. While the aircraft intersects a plume cross-section at several downwind distances from the source, the in-situ measurement provides detailed information on concentrations within the plume but a limited picture of the horizontal or vertical extent of a specific plume. Tropospheric column measurements of NO2 plumes from specific facilities or group of facilities allows for photochemical model evaluation of downwind plume extent and grid resolution impacts on plume concentration gradients.
Remotely sensed data from aircraft flights equipped with downward hyper-or-multispectral instrumentation provide an opportunity to provide a complete picture of the horizontal extent of a plume downwind of a facility or source complex (Karambelas, 2020). An advantage of column measurements for photochemical grid model evaluation is that differences in mixing layer structure do not introduce inconsistencies in comparison. Discrepancies between vertical mixing extent can at times confound interpretation of model performance for in-situ measurements, which can be strongly influenced by surrounding air volume (Simon et al., 2018; Toro et al., 2021). The Ozone Water-Land Environmental Transition Study (OWLETS) 2017 (Dacic et al., 2020) and Lake Michigan Ozone Study (LMOS) 2017 (Stanier et al., 2021) field studies included aircraft flights that measured NO2 tropospheric column density (Demetillo et al., 2020; Judd et al., 2020) with the NASA Goddard Geostationary Trace gas and Aerosol Sensor Optimization (GeoTASO) instrument. The flights included measurements over a plume downwind of an industrial source complex in eastern Virginia (referred to collectively as Hopewell here; Figure S1) and Edgewater electrical generating unit (EGU) in eastern Wisconsin.
Here, a photochemical model was applied coincident for these field studies to evaluate the model predicted NO2 plume downwind of Hopewell and Edgewater. In-plume chemical measurements of NO2 and O3 made downwind of Hopewell (Dacic et al., 2020) as part of OWLETS 2017 were used with similar measurements made downwind of a large EGU in central Tennessee (TVA Cumberland) in 1999 (Baker and Kelly, 2014; Luria et al., 2003) to provide information about model representation of downwind plume chemistry. These case studies were also used to evaluate the impact of horizontal grid resolution on plume structure and techniques for estimating single source plumes in grid-based modeling systems (i.e., source sensitivity and source apportionment). In-plume aircraft transect measurements provide an opportunity to evaluate how grid resolution impacts secondary pollutant model predictions and how source apportionment (Kwok et al., 2015; Kwok et al., 2013) and sensitivity (Kelly et al., 2015) approaches characterize more complex pollutants (e.g., O3) from specific sources.
METHODS
This assessment includes a multi-model evaluation with multiple types of measurements (aircraft, ground, and remote sensing) from three separate studies. The 2017 OWLETS (eastern Virginia) and LMOS (eastern Wisconsin) field studies provide measurements of NO2 column density that show the spatial representation of plume extent from specific sources. The 2017 OWLETS (Dacic et al., 2020) and 1999 central Tennessee (Luria et al., 2003) field studies provide in-plume transect measurements of O3 and NO2 made downwind of specific facilities for a comparison of modeled chemical predictions. Ground based NO2 column density measurements made as part of the 2017 OWLETS study were also used as part of this evaluation. Multiple photochemical models were applied with multiple approaches for differentiating the impacts from single sources. The models and techniques applied are shown in Table S-1 and described in more detail in this section.
Model Configuration and Application
The Community Multiscale Air Quality (CMAQ) model (https://www.epa.gov/cmaq) version 5.4 (doi: 10.5281/zenodo.7218076) was applied for the time period coincident with each case study: OWLETS (Dacic et al., 2020), LMOS (Stanier et al., 2021), and TVA Cumberland transect flights (Luria et al., 2003). CMAQ was applied with aqueous chemical reactions (Fahey et al., 2017), Carbon-Bond 6 revision 5 gas phase chemistry (Emery et al., 2015), and ISORROPIA II inorganic chemistry (Fountoukis and Nenes, 2007). Meteorological inputs were generated with the Weather Research & Forecasting model (Skamarock et al., 2008) version 3.4.1 and translated for input to CMAQ (Otte and Pleim, 2010).
The modeling system was applied with 35 vertical layers extending from the surface to 50 mb with thinner layers near the surface (18 layers between the surface and 2 km) to best resolve diurnal variation in the surface mixing layer. Multiple horizontal domains covered the mid-Atlantic, Lake Michigan, and central Tennessee with 4 km sized grid cells. Initial and boundary conditions were provided to the 4 km domain by a coarser domain that covered the contiguous U.S. at 12 km. Meteorological and gridded emissions inputs for the 1 and 2 km sized grid cell domains covering each case study region were interpolated from the 4 km domain while point sources (including the facilities tracked as part of this assessment) were modeled at these finer resolutions.
Anthropogenic emissions from area and mobile sources were based on the 2016 National Emission Inventory (National Emissions Inventory Collaborative, 2019) for the 2017 scenarios and 2001 National Emission Inventory for the 1999 episode (Baker and Kelly, 2014). Biogenic emissions were based on the Biogenic Emission Inventory System version 3.6 (Bash et al., 2016). Wildland fire emissions were day specific and based on satellite information for location (Baker et al., 2016a). EGU point source emissions were based on Continuous Emissions Monitoring information matching the day and hour of each episode. Emissions for each of the case studies tracked for this assessment are provided in Table 1. The Hopewell complex included multiple facilities all within 2.5 km: Dominion-Hopewell Power Station, Hopewell Cogeneration, Westrock, and James River Cogeneration (Figure S1).
Table 1.
Annual total emissions (tpy) for the Hopewell group of facilities for 2017, Edgewater EGU for 2017, and TVA Cumberland EGU in 1999.
| Annual Emissions (tpy) | |||||||
|---|---|---|---|---|---|---|---|
| Tracked Group or Facility | Facility | NOX | CO | SO2 | PM25 | NH3 | VOC |
| Hopewell Group | Dominion-Hopewell Power Station | 241 | 517 | 13 | 17 | 38 | 6 |
| Hopewell Group | Westrock | 440 | 646 | 127 | 99 | - | 34 |
| Hopewell Group | Hopewell Cogeneration | 540 | 50 | 4 | 8 | 31 | 4 |
| Hopewell Group | James River Cogeneration | 971 | 681 | 1,403 | 18 | - | 3 |
| Hopewell Group Total | 2,191 | 1,895 | 1,546 | 142 | 69 | 47 | |
| Edgewater | 1,571 | 858 | 4,510 | 234 | 9 | 93 | |
| TVA Cumberland | 51,190 | 1,830 | 15,572 | 2,783 | 3 | 219 | |
The CMAQ model was applied using source sensitivity and source apportionment to isolate the impacts of the Hopewell complex, Edgewater EGU, and TVA Cumberland EGU. Both provide an estimate of source attribution and will be most similar for pollutants that do not experience complex non-linear chemical formation and destruction reactions. The brute-force source sensitivity approach was used to differentiate model predicted air quality impacts by performing a model simulation with all emissions sources and a second simulation where one emissions source was not included. The difference between these simulations provided an estimate of source attribution (Kelly et al., 2015). First order source sensitivities were calculated in separate simulations for emissions of 1) NOX (NO and NO2) and 2) NOX and speciated VOC compounds using the decoupled direct method (DDM) implemented in the CMAQ model (Napelenok et al., 2008). Total attribution was estimated with DDM sensitivities by assuming a 100% emissions perturbation representing the entirety of each group tracked. Lateral boundary inflow sensitivity was estimated using DDM as the combined sensitivity from O3, NOX, and speciated VOC compounds introduced into the model domain through lateral boundaries.
CMAQ’s Integrated Source Apportionment Method (ISAM) was used to internally track emissions from the TVA Cumberland facility to differentiate the impact of that facility from other sources. The ISAM implementation in CMAQ v5.4 allows for multiple options that generally intend to weight attribution of O3 to NOX and VOC sources depending on the relative influence of each in terms of emissions and generated chemical products (Shu et al., 2022). The combination of nitrogen species, VOC, and oxidants used for this chemical weighting approach for each ISAM option are shown in Table S-2. Some of the ISAM options weight O3 attribution to NOX sources (NO, NO2, NO3, HNO3, HONO, N2O5) and others weight attribution to VOC sources based on chemical compounds that can form NO2 through reactions of NO and peroxy radicals (ALD2, ALDX, FORM, ACET, KEY, XO2, XO2H, ISO2, C2O3, CXO3). ISAM option 5 switches these attribution preferences depending on whether the model predicted O3 formation regime is NOX or VOC limited (Shu et al., 2022) based on the ratio of the production of H2O2 to HNO3 (Sillman, 1995). In situations where O3 production was predicted to be VOC limited then the attribution would be weighted toward VOC sources. Similarly, when NOX limited the attribution would be weighted toward NOX sources.
The Comprehensive Air Quality Model with Extensions (CAMx) version 7.2 (Ramboll, 2022) was applied with Carbon-Bond 6 revision 5 gas phase chemistry and the same emissions data as CMAQ. Meteorological inputs for CAMx were based on the same WRF output that was used for the CMAQ simulations. Multiple ozone source apportionment approaches (Ramboll, 2022; Yarwood and Koo, 2015) were used to track the contribution of NO2 to O3 from the TVA Cumberland plant in the CAMx modeling system. CAMx apportions O3 production to sources of NOX when O3 was produced in a NOX limited regime and to VOC sources in VOC limited regimes in the Ozone Source Apportionment Tool (OSAT) approach. An alternative option called Anthropogenic Precursor Culpability Assessment (APCA) assigns O3 production in VOC limited regimes to anthropogenic NOX sources when the VOC source is biogenic.
Measurement Data
The National Aeronautics and Space Administration’s (NASA) Geostationary Trace Gas and Aerosol Sensor Optimization (GeoTASO) UV-VIS instrument (Nowlan et al., 2016) was operated aboard the NASA Langley Research Center UC-12B aircraft to make measurements of backscattered solar radiation which was used to derived high-resolution amounts of NO2 slant column (Judd et al., 2019). The NO2 slant column density data was extrapolated to each of the model grids by averaging together each GeoTASO pixel that fell within each grid cell. Grid cells which contained less than 5 measurements were not included in a composite image to minimize the impact of areas with little spatial coverage.
The aircraft overflew Hopewell twice on July 8, 2017. The first flight was over Hopewell at 14:45 UTC and another at 19:45 UTC (a morning and an afternoon flight). Both flights took approximately 10 minutes to traverse between the complex of facilities and downwind plume peak NO2 level. The entire flight span for the morning flight was approximately 12–16 UTC and 17–21 UTC for the afternoon flight. The flight over Edgewater was on the afternoon of June 2, 2017 between 20 and 24 UTC.
The GeoTASO slant column data were used to generate maps of the horizonal spatial structure of the plume for a qualitative comparison with model estimates. The slant column data were not converted to approximate vertical column through the application of air mass factors as this conversion typically has minimal impact the spatial pattern of the data (Judd et al., 2019; Judd et al., 2020).
Tropospheric total column NO2 was measured by Pandora spectrometer (Herman et al., 2009) located downwind of Hopewell on the James River at the Virginia Commonwealth University Rice River Center (VCU-RRC). Model predictions were paired with Pandora total tropospheric column NO2 measurements (Judd et al., 2020) in space and time.
Aircraft based measurements of NO2 and O3 were made in plume transects downwind of the TVA Cumberland power plant in 1999 (Luria et al., 2003) and Hopewell during the 2017 OWLETS field study (Dacic et al., 2020). These measurements were matched with model predictions in space and time based on aircraft position. Ambient measurements made downwind of the TVA Cumberland power plant were adjusted to provide an estimate of contribution from the TVA facility by removing an average level of pollution measured at locations considered outside the facility plume (Baker and Kelly, 2014; Luria et al., 2003). Similar adjustments were not made to the aircraft measurements taken during the OWLETS field study due to the large number of NO2 sources in that region.
Measurements made as part of the 2017 OWLETS field study (https://www-air.larc.nasa.gov/cgi-bin/ArcView/owlets.2017) and 2017 LMOS field study (https://www-air.larc.nasa.gov/cgi-bin/ArcView/lmos) are available as part of public data repositories.
RESULTS
Characterization & Evaluation of Horizontal Plume Extent
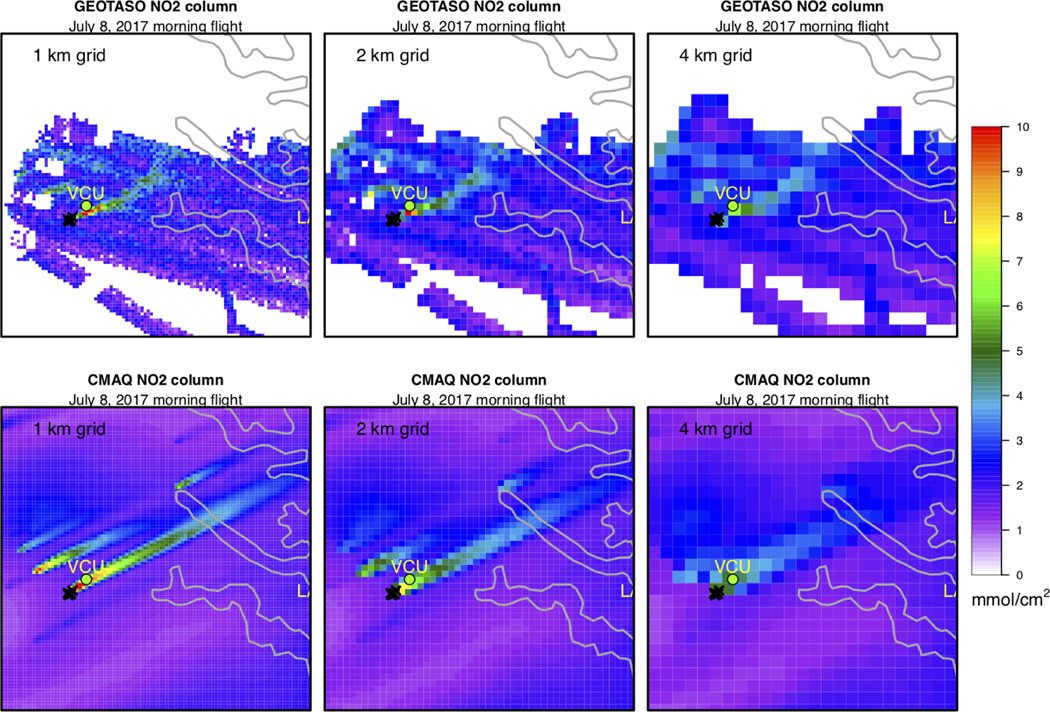
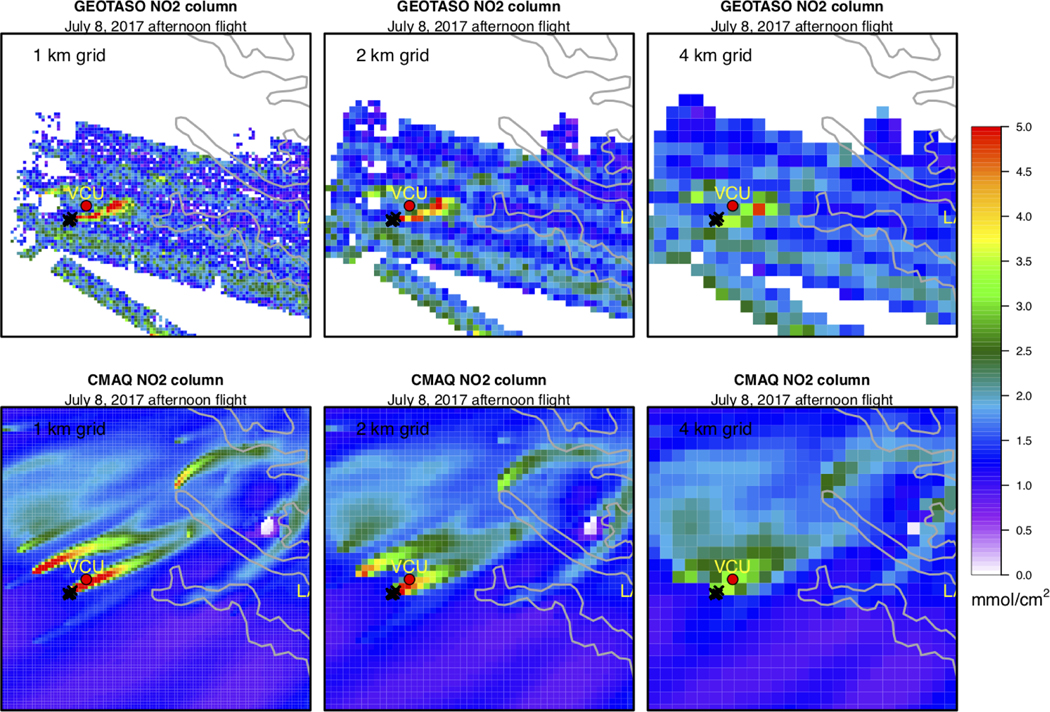
The GEOTASO composite measurements provide a unique opportunity to evaluate plume extent downwind of specific facilities in horizontal space. Figure 1 shows the July 8, 2017 morning and Figure 2 shows July 8, 2017 afternoon NO2 column density composite based on GEOTASO airborne measurements and CMAQ model predicted NO2 tropospheric column density at 4, 2, and 1 km grid resolution. In these Figures, the CMAQ prediction of NO2 is based on all emissions sources and does not reflect any type of approach that attributes the impacts of specific sources.
Figure 1.
July 8, 2017 morning NO2 vertical column density composite measurements made with GEOTASO (top row) and predicted with the CMAQ model (bottom row). The VCU PANDORA is also shown. GEOTASO data are differential slant columns.
Figure 2.
July 8, 2017 afternoon NO2 vertical column density composite measurements made with GEOTASO (top row) and predicted with the CMAQ model (bottom row). The VCU PANDORA is also shown. GEOTASO data are differential slant columns.
The downwind plume is better differentiated from other sources in the region at finer grid resolution. The modeling system does well at predicting the physical orientation of the Hopewell plume, which is to the northeast due to steady southwesterly winds. The model also does well at capturing the horizontal and downwind extent of the plume at each of these grid resolutions. The afternoon NO2 plume is comparatively smaller in magnitude and spatial extent which is likely due to increased photochemical reactions in the afternoon converting NO2 to other compounds. The Pandora spectrometer located at the VCU-RRC site northeast of Hopewell appears to capture impacts from this facility during the morning and afternoon GEOTASO flights (Figure 1 and Figure 2).
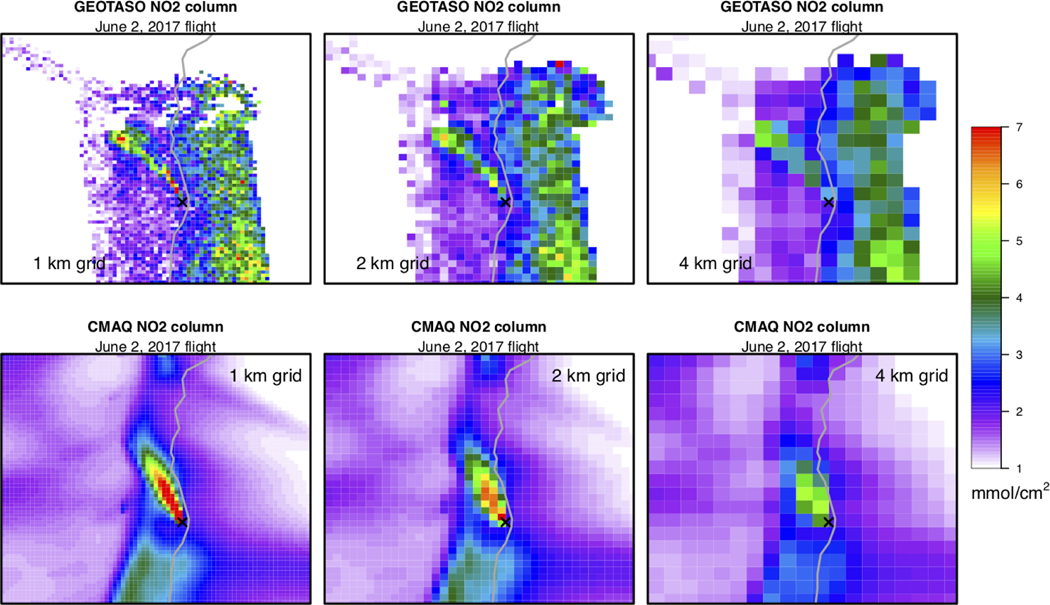
The GEOTASO instrument also made measurements over the Edgewater EGU in eastern Wisconsin along the shore of Lake Michigan. Figure 3 shows the GEOTASTO measured and CMAQ modeled NO2 column density for the Edgewater EGU at multiple grid resolutions. Similar to Figures 1 and 2, Figure 3 shows modeled NO2 from all sources although at this location and time the NO2 is largely from the Edgewater facility. Like the Hopewell case study, the modeling system did well at capturing the magnitude and spatial orientation of the plume with the best representation at finer grid scales. The modeling system did not quite capture the furthest downwind extent of the plume which is most likely related to the meteorological model not always capturing complex winds at the land-lake interface (Baker et al., 2023).
Figure 3.
June 2, 2017 NO2 vertical column density composite measurements made with GEOTASO (top row) and predicted with the CMAQ model (bottom row). GEOTASO data are differential slant columns.
Characterization & Evaluation of Vertical Plume Extent
Ground-based NO2 column density measurements made with a PANDORA instrument located approximately 7 to 9 km downwind of Hopewell provides a high time resolution measure of NO2 impacts and corroboration of the GEOTASO product. The PANDORA does not provide information about vertical structure of NO2 or spatial structure across the region but when winds are from the direction of Hopewell could provide an estimate of NO2 from that facility complex when upwind contribution from other sources in the region can be quantified.
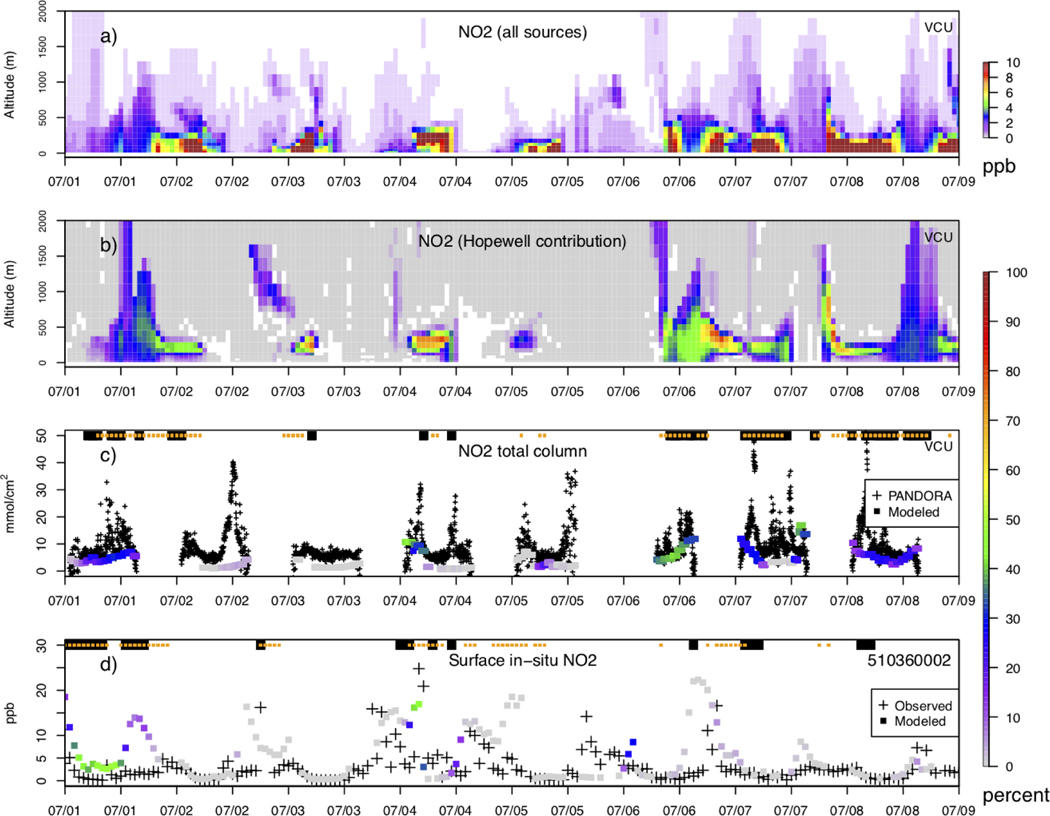
Figure 4 shows the CMAQ modeled vertical structure of NO2 from all sources and just from Hopewell predicted at the PANDORA monitor. This Figure also shows a comparison of model predicted total column NO2 density with PANDORA measurements and surface level NO2 model predictions compared with a nearby surface in-situ monitor that operates as part of the routine regulatory monitoring network. The modeling system indicates that the plume from Hopewell is typically lofted from the surface overnight at the PANDORA location and well mixed through the boundary layer during the daytime. Modeled NO2 from all sources was highest at the surface overnight and decrease rapidly with increasing altitude.
Figure 4.
CMAQ model (2 km resolution) predicted NO2 by vertical layer at the VCU PANDORA monitor location for July 2017 (local time): NO2 from all sources (panel a) and the fraction of total NO2 from Hopewell (panel b). Ground-based NO2 tropospheric column measurements made with a PANDORA located downwind of Hopewell were paired with CMAQ model NO2 tropospheric column predictions colored by the percent contribution of Hopewell (panel c). Observed and CMAQ model predicted NO2 (colored by the percent contribution of Hopewell) at a routine surface monitor near Hopewell is also shown (panel d). The orange (modeled) and black (observed) traces at the top of panels c and d indicate when winds were from the direction of Hopewell.
Modeled NO2 tropospheric column predictions at the PANDORA monitor tend to be lower than these high time resolution measurements (Figure 4). This suggests the modeling system is missing high levels of NO2, but it is not clear that this discrepancy is related to the Hopewell complex, other sources, or related to temporal incommensurability between the model and measurements. The model predicts that Hopewell contributes up to 47% of surface level NO2 at the closest surface monitor over all hours of July 2017. Similarly, the model predicts up to 45% of total column NO2 at the PANDORA location. This indicates that these monitors can provide useful quantitative information about this facility complex, but other sources usually contribute to measurements on any given day and time which makes model evaluation for a specific facility challenging.
Characterization of Plume Chemistry & Source Attribution Evaluation of NO2
CMAQ ISAM and DDM were configured to track other major categories of emissions (including lateral boundary inflow) in addition to Hopewell. The ISAM “leftover” group is a default category that includes emissions not explicitly tracked as part of any other contribution group. Here, zero emissions were assigned to this group since all major source categories were tracked for contribution. NO2 contribution for these categories are shown in the Supporting Information for each ISAM option, DDM, and CAMx source apportionment for the time of the afternoon GEOTASO flight (Figures S8 to S13).
The expected spatial pattern of NO2 attribution for the Hopewell NO2 plume would be similar to the spatial structure measured by GEOTASO (Figure 2) and for lateral boundary inflow to have the highest attribution nearest to the boundary and a relatively small impact in the interior of the domain. These patterns were predicted by DDM and ISAM option 2 (and to some extent option 3) but the spatial patterns for the other ISAM options were not consistent with DDM. One reason for this is the way ISAM treats O3 reacting with NO in a plume to produce NO2 as most ISAM options carry forward attribution from the O3 rather than the source of the nitrogen.
The DDM sensitivities of model predicted NO2 to emissions of NO2 were very similar spatially and in magnitude to ISAM option 2. ISAM options 1 and 4 provide very similar NO2 contribution assignments to each other but were quite different than the DDM attribution. ISAM option 5 contribution predictions do not match those predicted by options 2 or 4 even though option 5 uses these approaches with an O3 formation regime indicator ratio that is intended to impact O3 source attribution. However, it also indirectly influences apportionment of NO2 emissions to NO2 modeled source contribution.
The conflation of NO2 attribution to sources that do not appear spatially commensurate with the nature of emissions from that category is most notable for the biogenic category and “leftover” group which does not include any NO2 emissions (Figures S8, S10 to S12). Each ISAM option that attributes source contribution through radicals or that makes assignments based on stoichiometric products rather than tagged fractional NO2 emissions assigns NO2 to the “leftover” group and to groups with large amounts of VOC, which in this application is the biogenic group.
A notable feature of the apportioned biogenic category for most ISAM options is that NO2 gets attributed to the biogenic category in the plume downwind of Hopewell. This assignment is related to biogenic VOC reacting with emissions from the Hopewell facilities rather than biogenic NO emissions based on comparison with the DDM approach. When biogenic VOC reacts with Hopewell NO2 to form O3 the attribution of that newly formed O3 is assigned by some ISAM to both of these source categories. When that newly formed O3 (biogenic VOC and Hopewell NO2) reacts with NO in the Hopewell plume to form NO2 the biogenic attribution to that O3 gets translated back to NO2 even though the NOX emissions originated from the Hopewell facilities and not from biogenic NO sources. ISAM does not have an option to assign O3 contribution to anthropogenic NOX sources in situations where VOC is limiting O3 production and the VOC source is not anthropogenic similar to the CAMx APCA source apportionment approach.
The attribution of lateral boundary inflow of NO2 to model predicted NO2 is very different between the approaches used in the Hopewell case study. ISAM options 1, 3, 4, and 5 make assignments to lateral boundary inflow at urban areas and large NO2 industrial sources in the interior of the domain. The lateral boundary inflow of NO2 attribution estimated with ISAM option 2 and DDM (using sensitivities only to NO2) are highest at the lateral boundaries and decrease as distance from the boundary increases. When DDM was alternatively applied estimating lateral boundary NO2 sensitivity to NO2, O3, and VOC the results were more like CMAQ ISAM with incongruous spatial assignments inside the model domain, but the spatial features were not consistent.
Characterization of Plume Chemistry & Source Attribution Evaluation of O3
Aircraft based in-plume measurements of NO2 and O3 were made at multiple transects downwind of the TVA Cumberland power plant (Baker and Kelly, 2014; Luria et al., 2003) in 1999 and Hopewell in 2017 (Dacic et al., 2020). This data was used to illustrate how well the model represents near-source and local scale plume chemistry. These in-plume measurements provide an opportunity to evaluate photochemical model NO2 and O3 source attribution approaches. Both source sensitivity (DDM, brute-force difference) and source apportionment (CMAQ ISAM and CAMx OSAT) approaches were included in this assessment.
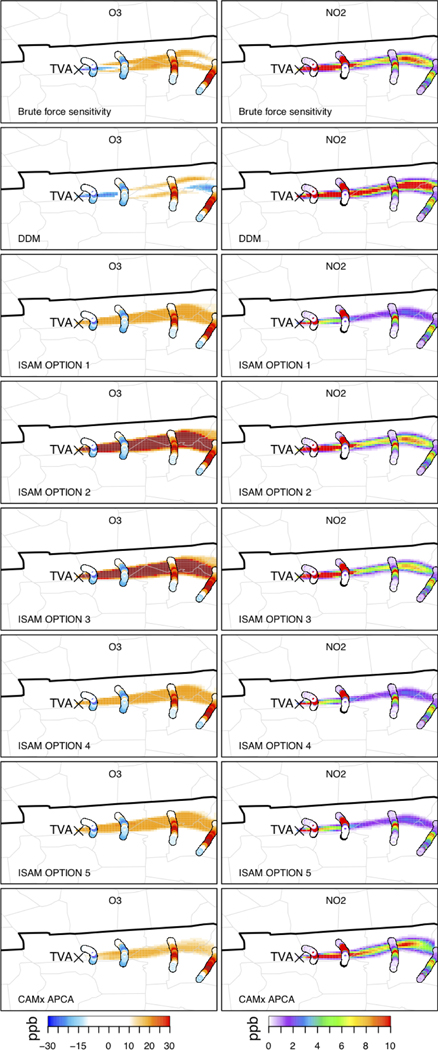
Figure 5 shows NO2 and O3 measurements made in transects downwind of the TVA Cumberland power plant on July 6, 1999 (Luria et al., 2003) with modeled plume predictions based on source apportionment and source sensitivity approaches. The meteorological inputs to the modeling system did well at plume placement downwind but some small-scale features were shifted southward at the closer transects and to the north at the furthest downwind transects (Figure 5).
Figure 5.
Modeled and measured O3 and NO2 in a plume downwind of the TVA Cumberland power plant during July 1999. Model predictions are shown for brute-force difference (zero-out), DDM, and multiple source apportionment approaches.
Like the Hopewell NO2 column density case study, the source sensitivity (DDM and brute-force difference) and ISAM options 2 and 3 best matched NO2 in-plume magnitudes and spatial structure at the various downwind transects. The measurements in the transect nearest to TVA Cumberland (11 km distance) showed O3 levels lower than the surrounding ambient air indicating that fresh NO emissions were destroying O3 faster than it was being produced. A small amount of O3 production was measured in the 2nd transect while the largest amount of O3 production was evident in the 3rd (65 km distance) and 4th (89 km distance) transects downwind. The brute-force difference method best captured the near-source O3 titration and downwind production.
Source apportionment methods are not intended to capture near-source O3 destruction, but rather attribute net produced O3 to sources emitting precursors (Kwok et al., 2015). The CAMx APCA and OSAT approaches predict very little O3 production in the first few transects where titration dominated but did not capture the magnitude of O3 production downwind in the furthest transects (Figure 5 and Figure S2). None of the CMAQ ISAM options replicated near source to downwind O3 plume structure. Options 2 and 3 best replicated the NO2 plume structure but were the poorest match for the O3 plume. Each of the ISAM options predicted large O3 contribution from the TVA facility in the first 2 transects when titration was outpacing production based on measurements. ISAM options 1, 4, and 5 tended to overestimate O3 contribution in the nearest downwind transects and underestimate O3 contribution in the farthest downwind transects (Figure 5). The APCA approach in CAMx source apportionment better captured the downwind O3 magnitude of the plume compared to the OSAT approach which attributed more of the O3 in the plume to other (most likely biogenic VOC) sources (Figure S2).
A previous comparison of source sensitivity (DDM and brute-force difference) predictions of the TVA Cumberland plume showed that these methods captured the transition of near-source O3 titration to downwind O3 production (Baker and Kelly, 2014). However, the CMAQ source apportionment approach (Kwok et al., 2015) applied in that assessment did not attribute O3 to TVA Cumberland in the nearest transects where O3 titration dominated over production. Similarly to some of the ISAM options in this comparison and CAMx source apportionment, that approach tended to underestimate the magnitude of the downwind O3 impacts at the furthest transect compared to ambient data (Baker and Kelly, 2014).
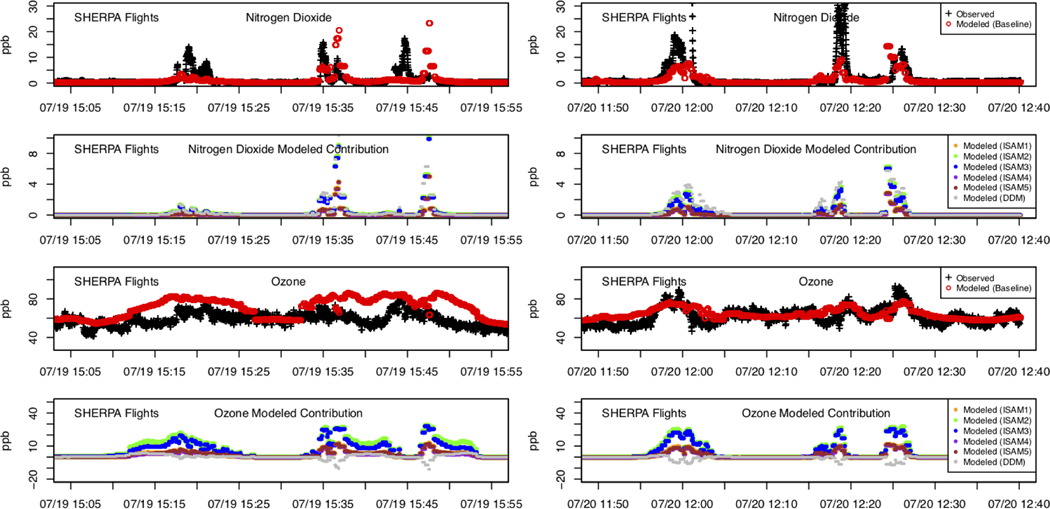
An aircraft made chemical measurements near the Hopewell facilities as part of the OWLETS field study (Dacic et al., 2020). Single passes downwind of Hopewell were made in the afternoon on July 19 and mid-day on July 20, 2017. Large increases in NO2 were evident in 3 different downwind transects on both days (Figure 6), each within 15 km of Hopewell (Figure S3). Measurements of O3 tended to peak at times coincident with increased NO2 for the mid-day flight on July 20 while O3 production and O3 destruction related to NO2 increases on July 19 were less obvious. In-plume measurements on July 19 do not have a strong indication of O3 production while the July 20 measurements do suggest increases in O3 relative to measurements outside the plume. The modeled contribution from Hopewell was less than total modeled NO2 during each of these flights transects which suggests that the aircraft was sampling NO2 from Hopewell and other local sources in the area. Each of the ISAM options predicted an increase in O3 through transects downwind of Hopewell while DDM predicted a negative sensitivity which indicates that the NO2 emissions were destroying O3 faster than it could be produced.
Figure 6.
Aircraft measurements of O3 and NO2 made in the Hopewell plume during the July 19 (left panels) and 20 (right panels), 2017 paired with CMAQ model predictions. Modeled contribution from Hopewell estimated using source attribution approaches is also shown. The distance of the aircraft from Hopewell is shown in Figure S3.
The emission source category attribution using ISAM provides some opportunity to better understand how ISAM O3 contribution assignments for both NOX and VOC sources compare to source sensitivity approaches such as DDM which tended to compare better to in-plume measurements (see Supplemental Section Figures S14 to S20). Similar to NO2 source sector attribution estimates for the Hopewell case study, O3 attribution varies substantially between ISAM options and source sensitivity approaches. ISAM options 1 and 4 compare best to DDM for O3 attribution from the area and mobile source groups and boundary inflow. ISAM option 5 compares best to DDM for biogenics. None of the ISAM approaches compare well with DDM attribution for near-source O3 from large industrial NOX emissions sources located in more rural (and likely NOX limited) areas; each attribute far greater O3 to these kinds of sources than predicted by the DDM approach. ISAM options 1, 3, 4, and 5 have some degree of source attribution to tagged groups that have no emissions (e.g., the “leftover group”). In general, DDM tends to attribute more O3 to boundary inflow and less to within-domain NOX and VOC sources compared to ISAM. It is also important to emphasize that DDM is not intended to fully attribute the entirety of bulk model predictions as the sum of the sensitivities will not equal the bulk model prediction for NO2 or O3. This is partly due to more complex higher-order and interaction sensitivities not being accounted for in this application.
One important consideration in interpreting the O3 production and attribution assignment is that the modeling systems may be over or underestimating O3 due to reasons other than the source apportionment approach (e.g., chemistry, deposition, etc.). However, the source sensitivity approach used the same model configuration options and did well at representing downwind NO2 impacts from Hopewell, Edgewater EGU, and TVA Cumberland EGU and O3 impacts from TVA Cumberland EGU.
Grid Resolution Impacts on Single Source Model Predictions
CMAQ model predictions of secondarily formed pollutants compare well with routine surface network observations and are consistent with model performance shown in other photochemical model assessments (Kelly et al., 2019; Simon et al., 2012). Performance metrics are shown in Table S-3 for PM2.5 species and Table S-4 for maximum daily 8-hr average O3 at monitors in the 4 km model domain used for the Hopewell case study. The same information is shown for individual prediction-observation pairs in Figure S4. The model does not show any systematic biases and these performance features cannot be specifically attributed to how the Hopewell facilities were characterized due to the large number of other sources in the area and sparse nature of monitors downwind of the facility.
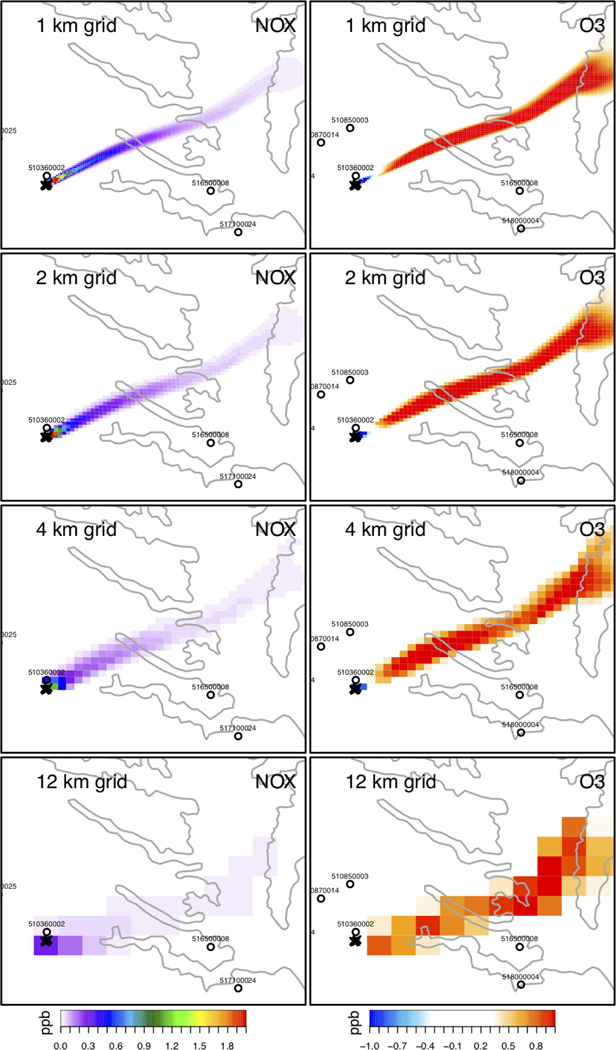
The Hopewell facilities were predicted by the model to contribute a peak of 1.4 ppb of NOX (~3 ppb of CO and 0.15 μg/m3 of PM2.5) at the surface during the morning of July 8, 2017 in eastern Virginia. Figure 7 shows surface level model predicted NO2 and O3 downwind of Hopewell at multiple grid resolutions: 1 km, 2 km, 4 km, and 12 km. The model indicates that fresh NO emissions from the facility destroy O3 faster than it can be produced during this same morning (Figure 7). This regime changes about 10 km downwind of the facility and the model starts to predict O3 production which continues through the further downwind extent of the plume. The model predicted a maximum O3 production of 1.9 ppb at the surface and a peak of 2.7 ppb removed due to emissions from Hopewell for this particular day and time at 1 km resolution compared to a peak O3 production of 1.5 ppb and peak removal of 0.8 ppb at 4 km resolution.
Figure 7.
CMAQ model predicted surface level NOX and O3 from Hopewell at the time of the July 8, 2017 aircraft measurements. Brute-force difference method based model predictions are shown for multiple grid resolutions: 1 km, 2 km, 4 km, and 12 km. Open circles show the location of routine surface monitor sites in the area.
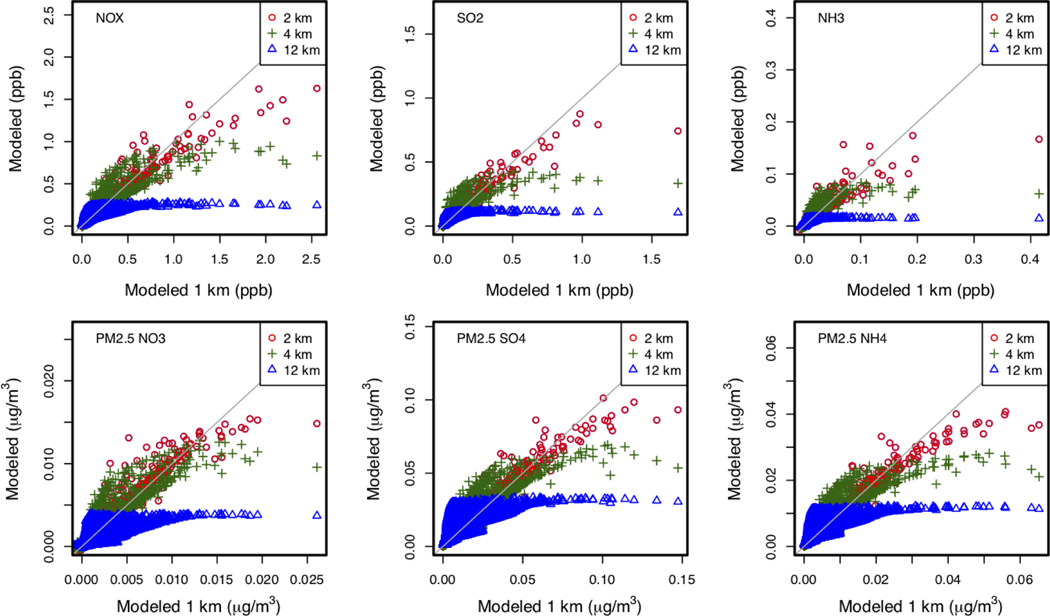
The modeled NO2 plume from the Hopewell group of facilities is clearly discernable at 1 to 12 km resolution (Figure 7). Coarser grid resolution tends to mute the model tendency to favor O3 destruction with fresh NO near the source. However, these near-source differences are not necessarily important when considering O3 production integrated over the entire extent of the plume since downwind O3 production is robust at each of these spatial scales. Figure 8 compares model predicted precursors and secondarily formed PM2.5 near Hopewell (within 50 km) using different grid resolution. The coarser grid resolutions tend to predict lower primary and secondary pollutant impacts near the facility for the highest values. The coarser grid resolutions also often result in larger impacts at the lowest levels when compared to the 1 km simulation.
Figure 8.
CMAQ model predicted precursors and secondarily formed PM2.5 at 2, 4, and 12 km compared with the 1 km simulation. These comparisons include grid cells near Hopewell and match the spatial extent shown in Figure 9.
Other studies also show that NO2 spatial scales are much finer than 4 km over a specific facility, which has implications for nonlinear chemistry but may not be meaningful when considering the full plume (Goldberg et al., 2019; Valin et al., 2011). A previous study showed that a horizontal resolution of 4 km was good enough to capture total mass for large single sources located at the Four Corners region of the western U.S. compared to remotely sensed column data from GOME (300×80 km) and TROPOMI (5×7 km) (Goldberg et al., 2019; Valin et al., 2011). That is consistent with results shown in Figure 7 for each of the grid resolutions modeled as part of this assessment.
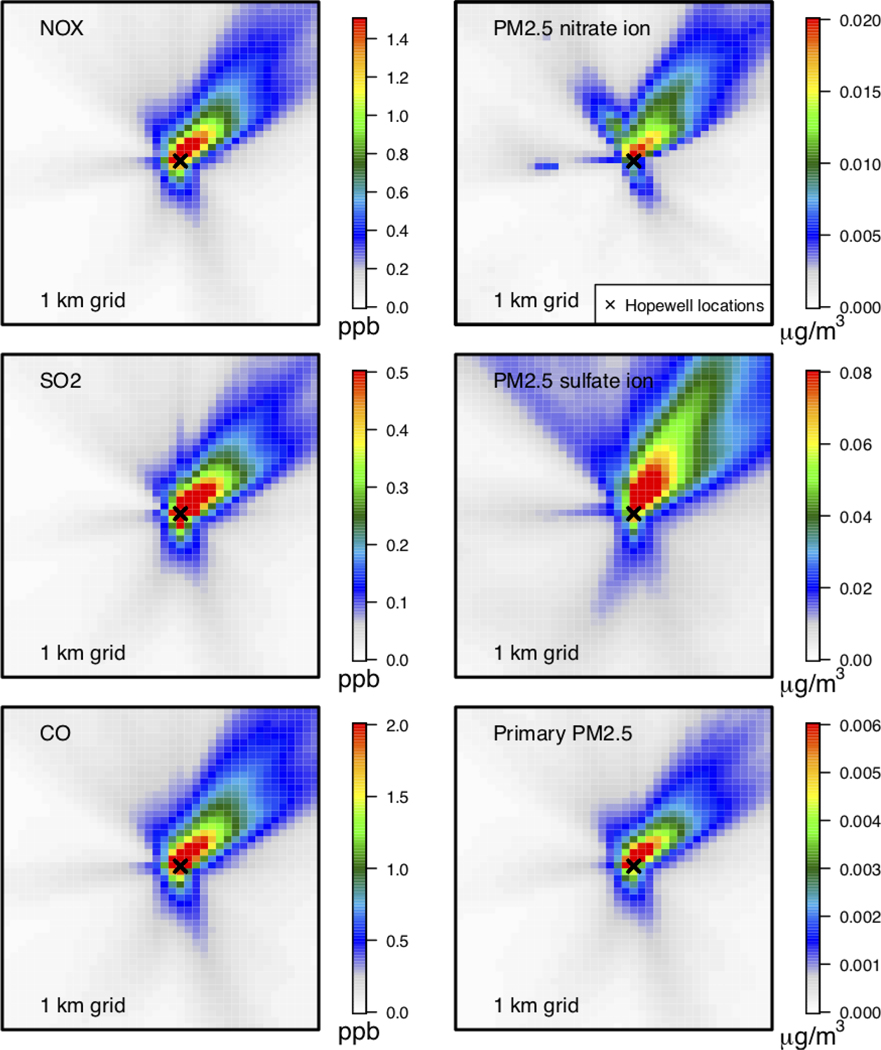
Figure 9 shows July 2017 average model predictions (1 km grid resolution) of primary and secondary pollutants attributed to the Hopewell group of sources using the brute-force difference source sensitivity approach. The spatial nature of primary pollutants was similar, with highest contribution closest to the sources and impacts decreasing as distance from the facility increases. This is consistent with other studies modeling single source primary pollutant impacts at similar grid scales (Baker et al., 2014). Secondarily formed PM2.5 sulfate, nitrate, and ammonium require favorable meteorological conditions and in the case of nitrate available ammonia to form in the atmosphere (Fountoukis and Nenes, 2007). Despite these factors potentially resulting in peak formation further downwind, on average the highest sulfate, nitrate, and ammonium impacts were nearest the facility and decreased as distance from the source increased. This is consistent with similar assessments using coarser spatial resolution (Baker and Kelly, 2014; Baker et al., 2016b; Baker and Woody, 2017; Kelly et al., 2015). The use of coarser grid resolution for single source impacts had a consistent pattern of highest impacts nearest the source but tended to spread impacts out over a larger area resulting in lower peak source specific concentrations (Figure 8; Figures S5, S6, and S7). The results presented here may not be applicable for sources in other types of physical or chemical environments or for non-summer conditions.
Figure 9.
July 2017 episode average surface level 1 km modeled (CMAQ) primary and secondary pollutant impacts from Hopewell.
CONCLUSIONS & FUTURE DIRECTION
Photochemical grid modeling systems were able to differentiate the primary and secondary impacts from single facilities from other emissions sources. The model was able to capture spatial features and magnitude variation in downwind NO2 plumes at 1 to 12 km grid resolution compared to aircraft based spectral measurements. Finer scale simulations better differentiated these plumes from other sources and resulted in larger ambient prediction as grid resolution became finer. Even at 1 km grid resolution, the highest modeled impacts were at or adjacent to the location of the source.
Source sensitivity and source apportionment approaches were able to replicate NO2 plumes downwind of specific facilities. The current CMAQ ISAM formulation had a large amount of variability in NO2 plume prediction among the various run-time configuration options. Some of these options compared well with the spatial extent and magnitude of NO2 measurements. More work is needed to better understand the variability in downwind O3 attribution predictions from source apportionment approaches (ISAM and OSAT) as performance was mixed even when modeled NO2 attribution compared well with measurements. This work was focused largely on NO2 and O3 since measurements of NO2 are more readily available but similar assessments are needed focusing on the treatment of VOC in source attribution tools and implications related to O3 attribution assignments.
Supplementary Material
Acknowledgements
The authors very much appreciate the contribution many made to this manuscript: Jay Al-Saadi, James Beidler, Christine Allen, Kevin Talgo, Lara Reynolds, and Barron Henderson.
Footnotes
The views expressed in this article are those of the authors and do not necessarily represent the views or policies of the U.S. Environmental Protection Agency. It has been subjected to the Agency’s review and has been approved for publication. Note that approval does not signify that the contents necessarily reflect the views of the Agency.
Contributor Information
Kirk R. Baker, U.S. Environmental Protection Agency, Research Triangle Park, North Carolina, USA
Lukas Valin, U.S. Environmental Protection Agency, Research Triangle Park, North Carolina, USA.
Jim Szykman, U.S. Environmental Protection Agency, Research Triangle Park, North Carolina, USA.
Laura Judd, NASA Langley Research Center, Hampton, Virginia, USA.
Qian Shu, U.S. Environmental Protection Agency, Research Triangle Park, North Carolina, USA.
Bill Hutzell, U.S. Environmental Protection Agency, Research Triangle Park, North Carolina, USA.
Sergey Napelenok, U.S. Environmental Protection Agency, Research Triangle Park, North Carolina, USA.
Ben Murphy, U.S. Environmental Protection Agency, Research Triangle Park, North Carolina, USA.
Vickie Connors, Virginia Commonwealth University, Richmond, VA, USA.
REFERENCES
- Baker K, Woody M, Tonnesen G, Hutzell W, Pye H, Beaver M, Pouliot G, Pierce T, 2016a. Contribution of regional-scale fire events to ozone and PM 2.5 air quality estimated by photochemical modeling approaches. Atmospheric Environment 140, 539–554. [Google Scholar]
- Baker KR, Hawkins A, Kelly JT, 2014. Photochemical grid model performance with varying horizontal grid resolution and sub-grid plume treatment for the Martins Creek near-field SO2 study. Atmospheric Environment 99, 148–158. [Google Scholar]
- Baker KR, Kelly JT, 2014. Single source impacts estimated with photochemical model source sensitivity and apportionment approaches. Atmospheric Environment 96, 266–274. [Google Scholar]
- Baker KR, Kotchenruther RA, Hudman RC, 2016b. Estimating ozone and secondary PM 2.5 impacts from hypothetical single source emissions in the central and eastern United States. Atmospheric Pollution Research 7, 122–133. [Google Scholar]
- Baker KR, Liljegren J, Valin L, Judd L, Szykman J, Millet DB, Czarnetzki A, Whitehill A, Murphy B, Stanier CJAE, 2023. Photochemical model representation of ozone and precursors during the 2017 Lake Michigan ozone study (LMOS). Atmospheric Environment 293, 119465. [Google Scholar]
- Baker KR, Woody MC, 2017. Assessing Model Characterization of Single Source Secondary Pollutant Impacts Using 2013 SENEX Field Study Measurements. Environmental Science & Technology 51, 3833–3842. [DOI] [PMC free article] [PubMed] [Google Scholar]
- Bash JO, Baker KR, Beaver MR, 2016. Evaluation of improved land use and canopy representation in BEIS v3. 61 with biogenic VOC measurements in California. Geoscientific Model Development 9, 2191. [Google Scholar]
- Bergin MS, Russell AG, Odman MT, Cohan DS, Chameldes WL, 2008. Single-Source Impact Analysis Using Three-Dimensional Air Quality Models. Journal of the Air & Waste Management Association 58, 1351–1359. [PubMed] [Google Scholar]
- Dacic N, Sullivan JT, Knowland KE, Wolfe GM, Oman LD, Berkoff TA, Gronoff GP, 2020. Evaluation of NASA’s high-resolution global composition simulations: Understanding a pollution event in the Chesapeake Bay during the summer 2017 OWLETS campaign. Atmospheric Environment 222, 117133. [DOI] [PMC free article] [PubMed] [Google Scholar]
- Demetillo MAG, Navarro A, Knowles KK, Fields KP, Geddes JA, Nowlan CR, Janz SJ, Judd LM, Al-Saadi J, Sun K, 2020. Observing Nitrogen Dioxide Air Pollution Inequality Using High-Spatial-Resolution Remote Sensing Measurements in Houston, Texas. Environmental science & technology 54, 9882–9895. [DOI] [PubMed] [Google Scholar]
- Emery C, Jung J, Koo B, Yarwood G, 2015. Improvements to CAMx Snow Cover Treatments and Carbon Bond Chemical Mechanism for Winter Ozone. Prepared for the Utah Department of Environmental Quality, Division of Air Quality, Salt Lake City, UT. Available at: http://www.camx.com/files/udaq_snowchem_final_6aug15.pdf. [Google Scholar]
- Fahey KM, Carlton AG, Pye HO, Baek J, Hutzell WT, Stanier CO, Baker KR, Appel KW, Jaoui M, Offenberg JH, 2017. A framework for expanding aqueous chemistry in the Community Multiscale Air Quality (CMAQ) model version 5.1. Geoscientific Model Development 10. [DOI] [PMC free article] [PubMed] [Google Scholar]
- Fountoukis C, Nenes A, 2007. ISORROPIA II: a computationally efficient thermodynamic equilibrium model for K+-Ca2+-Mg2+-Nh(4)(+)-Na+-SO42--NO3--Cl--H2O aerosols. Atmospheric Chemistry and Physics 7, 4639–4659. [Google Scholar]
- Goldberg DL, Lu Z, Streets DG, de Foy B, Griffin D, McLinden CA, Lamsal LN, Krotkov NA, Eskes H, 2019. Enhanced Capabilities of TROPOMI NO2: Estimating NO X from North American Cities and Power Plants. Environmental science & technology 53, 12594–12601. [DOI] [PubMed] [Google Scholar]
- Herman J, Cede A, Spinei E, Mount G, Tzortziou M, Abuhassan N, 2009. NO2 column amounts from ground-based Pandora and MFDOAS spectrometers using the direct-Sun DOAS technique: Intercomparisons and application to OMI validation. J Journal of Geophysical Research: Atmospheres 114. [Google Scholar]
- Judd LM, Al-Saadi JA, Janz SJ, Kowalewski MG, Pierce RB, Szykman JJ, Valin LC, Swap R, Cede A, Mueller M, 2019. Evaluating the impact of spatial resolution on tropospheric NO 2 column comparisons within urban areas using high-resolution airborne data. Atmospheric measurement techniques 12, 6091–6111. [DOI] [PMC free article] [PubMed] [Google Scholar]
- Judd LM, Al-Saadi JA, Szykman JJ, Valin LC, Janz SJ, Kowalewski MG, Eskes HJ, Veefkind JP, Cede A, Mueller M, 2020. Evaluating Sentinel-5P TROPOMI tropospheric NO 2 column densities with airborne and Pandora spectrometers near New York City and Long Island Sound. Atmospheric Measurement Techniques Discussions, 1–52. [DOI] [PMC free article] [PubMed] [Google Scholar]
- Karambelas A, 2020. LISTOS: Toward a Better Understanding of New York City’s Ozone Pollution Problem, October 2020 issue of Environmental Managers Magazine, a copyrighted publication of the Air & Waste Management Association (A&WMA). Environmental Managers Magazine. [Google Scholar]
- Kelly JT, Baker KR, Napelenok SL, Roselle SJ, 2015. Examining single-source secondary impacts estimated from brute-force, decoupled direct method, and advanced plume treatment approaches. Atmospheric Environment 111, 10–19. [Google Scholar]
- Kelly JT, Koplitz SN, Baker KR, Holder AL, Pye HO, Murphy BN, Bash JO, Henderson BH, Possiel NC, Simon H, 2019. Assessing PM2. 5 model performance for the conterminous US with comparison to model performance statistics from 2007–2015. Atmospheric Environment 214, 116872. [DOI] [PMC free article] [PubMed] [Google Scholar]
- Kwok R, Baker K, Napelenok S, Tonnesen G, 2015. Photochemical grid model implementation of VOC, NO x, and O 3 source apportionment. Geoscientific Model Development 8, 99–114. [Google Scholar]
- Kwok R, Napelenok S, Baker K, 2013. Implementation and evaluation of PM2.5 source contribution analysis in a photochemical model. Atmospheric Environment 80, 398–407. [Google Scholar]
- Luria M, Imhoff RE, Valente RJ, Tanner RL, 2003. Ozone yields and production efficiencies in a large power plant plume. Atmospheric Environment 37, 3593–3603. [Google Scholar]
- Napelenok S, Cohan D, Odman MT, Tonse S, 2008. Extension and evaluation of sensitivity analysis capabilities in a photochemical model. Environmental Modelling & Software 23, 994–999. [Google Scholar]
- National Emissions Inventory Collaborative, 2019. 2016beta Emissions Modeling Platform. Retrieved from http://views.cira.colostate.edu/wiki/wiki/10197.
- Nowlan CR, Liu X, Leitch JW, Chance K, González Abad G, Liu C, Zoogman P, Cole J, Delker T, Good W, 2016. Nitrogen dioxide observations from the Geostationary Trace gas and Aerosol Sensor Optimization (GeoTASO) airborne instrument: Retrieval algorithm and measurements during DISCOVER-AQ Texas 2013. J Atmospheric Measurement Techniques 9, 2647–2668. [Google Scholar]
- Otte T, Pleim J, 2010. The Meteorology-Chemistry Interface Processor (MCIP) for the CMAQ modeling system: updates through MCIPv3. 4.1. Geoscientific Model Development 3, 243–256. [Google Scholar]
- Ramboll, 2022. User’s Guide Comprehensive Air Qualiy Model with Extensions Version 7.20. www.camx.com. [Google Scholar]
- Shu Q, Napelenok SL, Hutzell WT, Baker KR, Murphy B, Hogrefe C, Henderson BH, 2022. Source Attribution of Ozone and Precursors in the Northeast US Using Multiple Photochemical Model Based Approaches (CMAQ v5. 3.2 and CAMx v7. 10). J Geoscientific Model Development Discussions, 1–34. [Google Scholar]
- Sillman S, 1995. The use of NO y, H2O2, and HNO3 as indicators for ozone-NO x-hydrocarbon sensitivity in urban locations. Journal of Geophysical Research: Atmospheres 100, 14175–14188. [Google Scholar]
- Simon H, Baker KR, Phillips S, 2012. Compilation and interpretation of photochemical model performance statistics published between 2006 and 2012. Atmospheric Environment 61, 124–139. [Google Scholar]
- Simon H, Valin LC, Baker KR, Henderson BH, Crawford JH, Pusede SE, Kelly JT, Foley KM, Chris Owen R, Cohen R.C.J.J.o.G.R.A., 2018. Characterizing CO and NOy sources and relative ambient ratios in the Baltimore area using ambient measurements and source attribution modeling. 123, 3304–3320. [DOI] [PMC free article] [PubMed] [Google Scholar]
- Skamarock WC, Klemp JB, Dudhia J, Gill DO, Barker DM, Duda MG, Huang X, Wang W, Powers JG, 2008. A description of the Advanced Reserch WRF version 3. NCAR Technical Note NCAR/TN-475+STR. [Google Scholar]
- Stanier CO, Pierce RB, Abdi-Oskouei M, Adelman ZE, Al-Saadi J, Alwe HD, Bertram TH, Carmichael GR, Christiansen MB, Cleary PA, 2021. Overview of the Lake Michigan Ozone Study 2017. Bulletin of the American Meteorological Society, 1–47. [DOI] [PMC free article] [PubMed] [Google Scholar]
- Toro C, Foley K, Simon H, Henderson B, Baker KR, Eyth A, Timin B, Appel W, Luecken D, Beardsley MJESA, 2021. Evaluation of 15 years of modeled atmospheric oxidized nitrogen compounds across the contiguous United States. 9, 00158. [DOI] [PMC free article] [PubMed] [Google Scholar]
- Valin L, Russell A, Hudman R, Cohen R, 2011. Effects of model resolution on the interpretation of satellite NO 2 observations. Atmospheric Chemistry & Physics 11. [Google Scholar]
- Yarwood G, Koo B, 2015. Final Report Improved OSAT, APCA and PSAT Algorithms for CAMx. Work Order No. 582–15-54388–011. Contract # 582–15-50417. Project 2015–45 task 4. Prepared under contract from the Texas Commission on Environmental Quality. [Google Scholar]
Associated Data
This section collects any data citations, data availability statements, or supplementary materials included in this article.


