Abstract
How enhancers control target gene expression over long genomic distances remains an important unsolved problem. Here we investigated enhancer-promoter communication by integrating data from nucleosome-resolution genomic contact maps, nascent transcription, and perturbations affecting either RNA polymerase II (Pol II) dynamics or the activity of thousands of candidate enhancers. Integration of Micro-C and CRISPRi experiments demonstrated that enhancers spend more time in close proximity to their target promoters in functional enhancer-promoter pairs compared to non-functional pairs, which can be attributed in part to factors unrelated to genomic position. Manipulation of the transcription cycle demonstrated a key role for Pol II in enhancer-promoter interactions. Notably, promoter-proximal paused Pol II itself partially stabilized interactions. We propose an updated model in which elements of transcriptional dynamics shape the duration or frequency of interactions to facilitate enhancer-promoter communication.
Introduction
Much of metazoan cellular diversity is encoded by cis-regulatory elements known as enhancers, which regulate the rate of mRNA production from distal promoters1. Since the landmark discovery of the SV40 enhancer more than 40 years ago2–4 a key goal has been to understand the molecular basis by which enhancers and promoters communicate across long stretches of DNA sequence. The prevailing model proposes that enhancers and promoters loop into close physical proximity in the nucleus5. Classical looping models (which we collectively refer to as the structural bridge model) represent these enhancer-promoter interactions as a physical bridge by which the enhancer and promoter are connected via highly stereotyped protein-protein interactions between transcription factors, Pol II, mediator, cohesin and other proteins6–9. Indeed, chromosome conformation capture (3C) based methods such as in situ Hi-C10 and Micro-C11, which measure the frequency of ligation between DNA sequences that are close together in 3D space12, can be used to predict the functional impact of enhancers on a target gene13–15. Moreover, changes in enhancer-promoter loops16,17, including preestablished loops13,18, are associated with the activation of target promoters.
Despite some support, however, several recent observations are not compatible with the structural bridge model. A key tenet of this model is that enhancer-promoter DNA sequences must come close enough together to establish a continuous protein bridge between the enhancer and promoter. However, measurements of enhancer-promoter distances in several fly and mouse developmental loci, using microscopy in both living and fixed cells, have suggested that enhancers and promoters are, on average, hundreds of nanometers apart at the time of gene activation19–21. At one well-characterized locus, the physical distance between the Shh promoter and several developmental enhancers actually increased following gene activation19. Finally, conflicting results exist regarding the effect of depletion of proteins proposed to constitute a physical bridge, such as mediator and cohesin, on either 3C contact maps or transcription22–26. These studies have demonstrated that we still lack complete answers to long-standing questions about enhancer-promoter communication: Do enhancer-promoter pairs spend more time in close physical proximity as the enhancer activates transcription? Are these interactions necessary, longer-lived, or more frequently established at enhancers that functionally impact expression from their target promoter? And which molecules play a role in facilitating enhancer-promoter communication?
Here we leverage a high-resolution 3C method, Micro-C11,27–29, nascent RNA sequencing30–32, and perturbations to Pol II and thousands of candidate enhancers33,34, to study the interplay between transcription and enhancer-promoter contact dynamics. Integration of new Micro-C data with CRISPR interference (CRISPRi) experiments testing nearly six thousand candidate enhancers33,34 revealed that functional enhancer/ promoter pairs spent more time at very short 3D distances, driven in part by macromolecular interactions that were independent of genomic position. Manipulation of transcription-related proteins revealed a key role for Pol II and its transcriptional dynamics in establishing the frequency of enhancer-promoter contacts. Notably, paused Pol II stabilized enhancer-promoter interactions, suggesting a role for paused Pol II in enhancer-promoter communication. These observations lead us to an updated model that incorporates the effect of transcription on enhancer-promoter communication.
Results
Enhancer function and TSS-proximal enhancer-promoter contact
We asked whether functional enhancer-promoter pairs, where the enhancer elicits a change in expression from its target promoter, spend more time in close proximity. Functional enhancers display more frequent interactions with their target promoter in 3C methods, like Hi-C and Micro-C13,14,33,34. However, since these functional enhancer-promoter pairs are also much more likely to be located within ~50kb than non-functional pairs14,33, it is unclear whether these differences in Hi-C\Micro-C unique paired-end reads (which we will refer to as contacts throughout the manuscript) simply result from the effect of genomic distance, as was recently proposed15, or whether they reflect additional structural or functional aspects of enhancer-promoter communication. We first defined a set of functional enhancer-promoter pairs in K562 cells for which knock down of the enhancer using CRISPRi impacted the expression of a target gene14,33–35. To complement the functional data with corresponding architectural features, we generated a ~1.7 billion contact Micro-C dataset in K562 cells (Fig. 1A). To counter the impact of genomic distance in our measurements, we normalized contact frequencies for the local background and linear distance (Extended Data Fig. 1A; see Methods). This approach allowed us to interpret differences in contact frequency between enhancer-promoter pairs as proportional to the average time each enhancer-promoter pair spends interacting, which may be driven by either differences in contact duration or the rate of initiating interactions, after factoring out the influence of genomic distance.
Figure 1. Micro-C contacts are enriched in functional enhancer-promoter pairs.
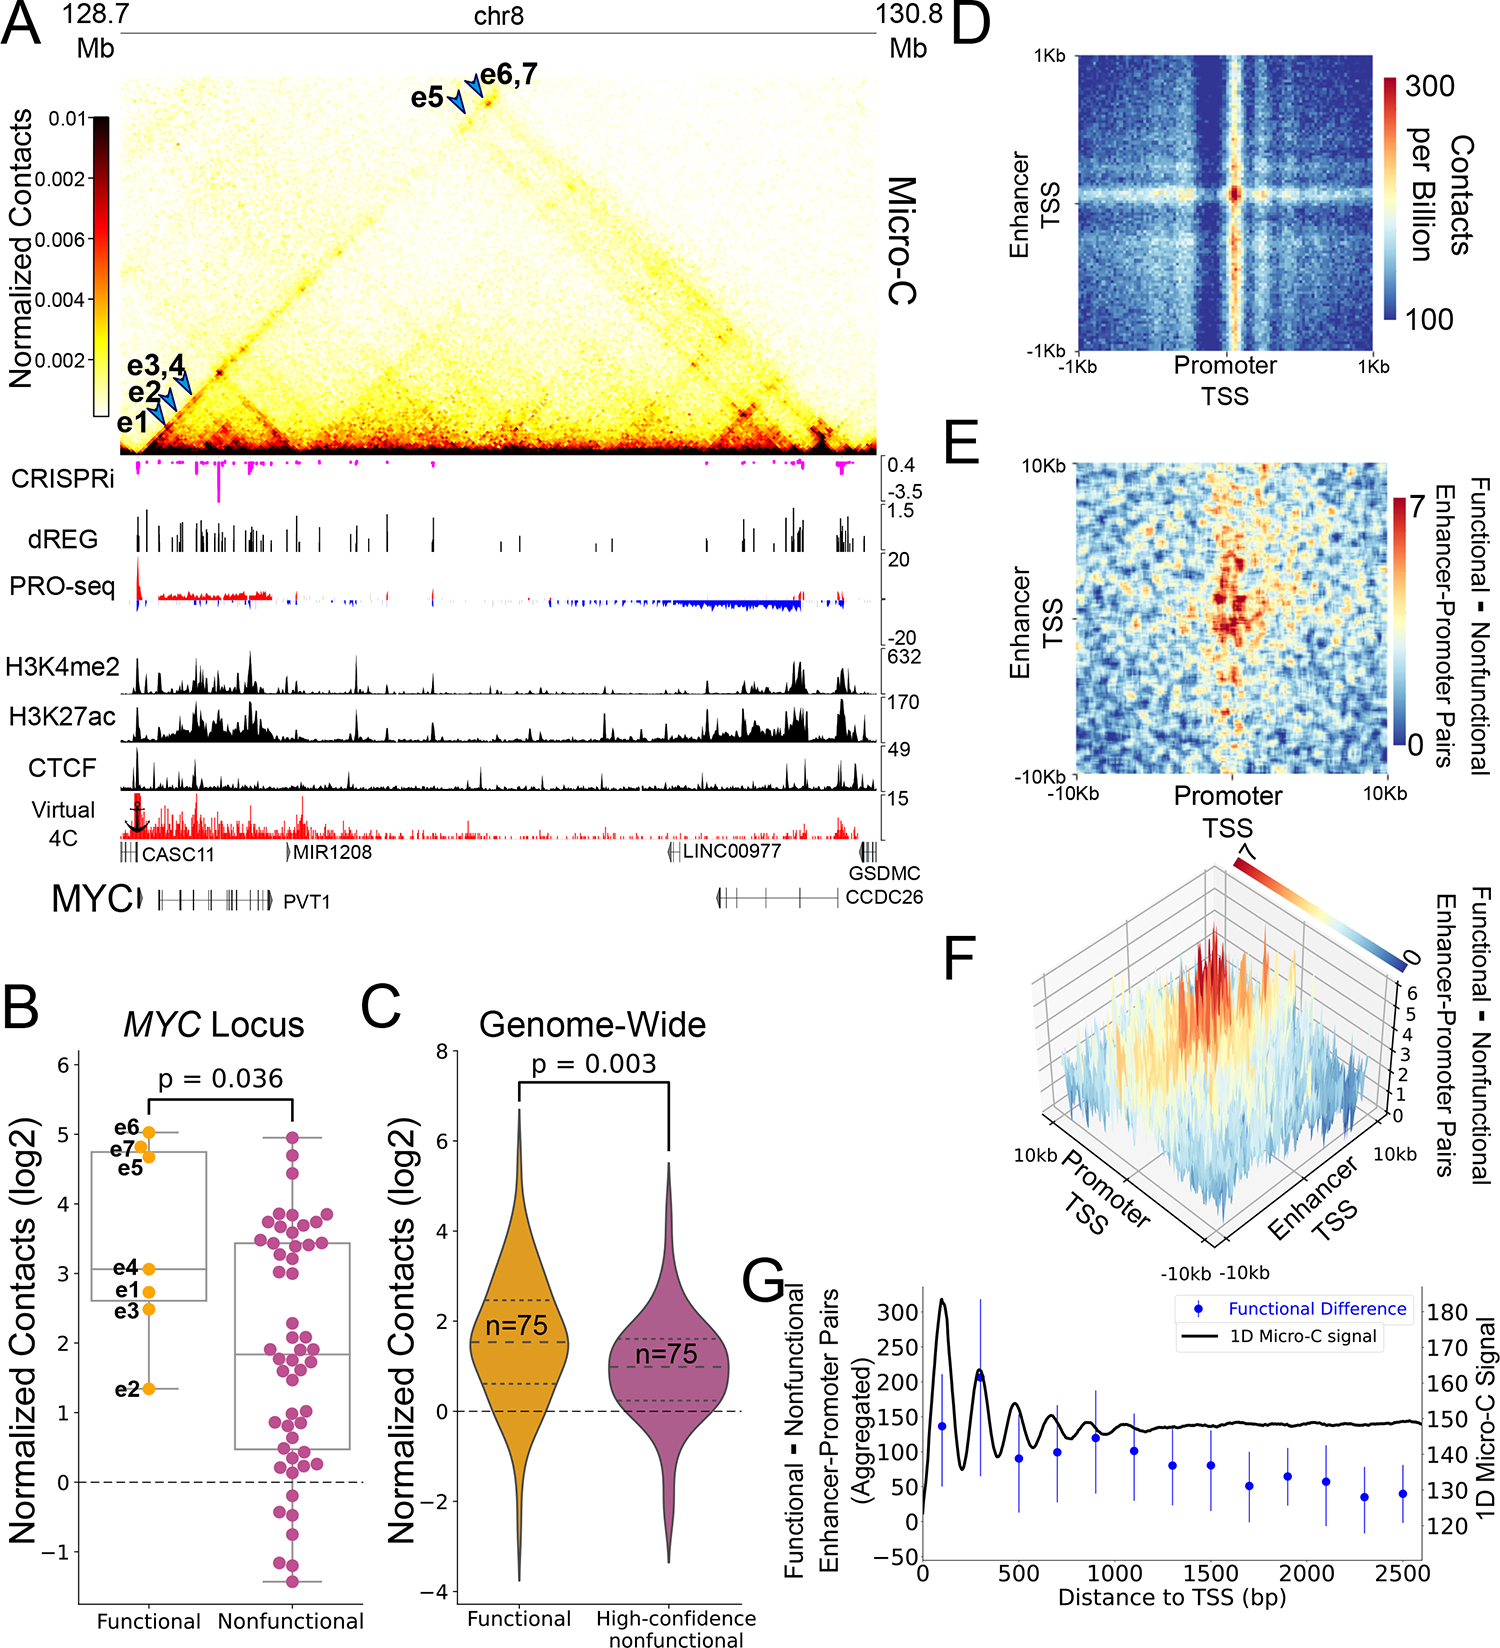
(A) Genome browser tracks showing Micro-C contact maps, CRISPRi-associated changes in cell viability34, dREG-defined TIRs and input PRO-seq signal38, H3K4me2, H3K27ac82 and CTCF83 ChIP-seq signal and a 2D representation (virtual 4C) of Micro-C contacts with the MYC promoter. Blue arrows point to regions in the contacts map representing interaction between the seven CRISPRi-validated MYC enhancers and the MYC promoter (B) Box and dot plot comparing the observed contact frequency relative to expected by a local distance-decay function of the seven MYC enhancers (functional pairs, n=7) compared to other TIRs in the TAD (nonfunctional pairs, n=52) with the MYC promoter. Boxplots boxes show the median, and 25–75 inter quartile range (IQR) and the maximum length of the whiskers is 1.5 IQR. A two-sided Mann-Whitney U test P-value is indicated. (C) Violin-plot comparing contactss relative to expected by a local distance-decay function of functional and nonfunctional enhancer-promoter pairs in the genome33, matched for genomic distance, accessibility and target gene expression distributions. A two-sided Mann-Whitney U test P-value is indicated. (D) An APA for enhancer-promoter contacts at 2kb around the TSSs, oriented such that the gene TSS points to the right and the dominant TSS of the enhancer points upwards. Pixel size is 20bp square(E) APA representing the differences in contacts between functional and nonfunctional pairs based on CRISPRi, 33 oriented such that the gene TSS points to the right and the dominant TSS of the enhancer points upwards. The APA represents smoothed differences in contacts between functional and nonfunctional enhancer-promoter pairs at a region of 20kb around the TSS with original pixel size of 100bp square. (F) A 3D representation of the APA from (E). (G) Blue - dot and error plot showing the median aggregated difference between the 245 functional and 232 high-confidence nonfunctional enhancer-promoter pairs (dot), and associated 95% confidence interval of that median in enhancer-promoter contacts of the +1 and +2 nucleosomes (400bp downstream to the TSS). Black - one dimensional contact signal downstream to enhancers and promoters. Total median signal was smoothed using a sliding window of 100bp.
We first analyzed CRISPRi data tiling the entire MYC locus with sgRNAs, which identified seven functional enhancers that regulate MYC expression34. Each of the seven active MYC enhancers was located near an active regulatory element, marked by a transcription initiation region (TIRs) identified using dREG36,37, as well as chromatin accessibility and active histone modifications (Fig. 1A). Normalized contact signal between the seven CRISPRi-validated enhancers and the MYC promoter were significantly higher than those observed for 52 other TIRs located within the same topologically associated domain (TAD) but which had no detectable effect on MYC (2.3 fold increase in median normalized contacts for functional pairs, p = 0.036; Mann-Whitney U-test) (Fig. 1B, Extended Data Fig. 1B).
We extended our work genome-wide using data from a CRISPRi screen that tested the function of 5,920 candidate enhancers in K562 cells33. We used this dataset to define 3,888 enhancer-promoter pairs that showed robust evidence of having (and not having) a functional impact on target gene expression (n = 245 functional, 3,643 non-functional, from which we further identified a subset of 232 pairs that were non-functional with a higher confidence; see Methods). Consistent with our study of the MYC locus, we found a significantly higher number of normalized contacts in functional enhancer-promoter pairs (31% increase in median normalized contacts for functional pairs, p < 0.001; Mann Whitney U test) (Extended Data Fig. 1C). The difference between functional and non-functional pairs was not driven by the abnormal karyotype of K562 cells (Extended Data Fig. 1C, bottom row), was observed in independent datasets14 (Extended Data Fig. 1C, middle), and was observed using accessible H3K27ac peaks as an alternative definition of enhancer activity (Extended Data Fig. 1C, right column, Extended Data Fig. 1D). Likewise, all results were robust to corrections for differences in genomic distance, target gene transcription levels, and chromatin accessibility by rejection sampling (46% increase in normalized contacts, p = 0.003; Mann Whitney U test; Fig. 1C, Extended Data Fig. 2).
We asked whether the increased contact frequency between functional enhancer-promoter interactions could be reproduced within other individual loci, as observed for MYC. Indeed, similar to all enhancers, constituent enhancers within K562 super enhancers that showed evidence of a functional impact on a target promoter had higher contact frequency than those with no evidence of function (Extended Data Fig. 3A–B). Moreover, within the same super enhancer, functional constituent enhancers had a significantly higher contact frequency with the target promoter compared to non-functional constituents (36% increase in median normalized contacts; p = 0.034, paired Wilcoxon signed rank test across 16 super enhancers; Extended Data Fig. 3C). We conclude that the frequency of enhancer-promoter interactions is higher for functionally active enhancer-promoter pairs even after factoring out the impact of genomic distance, locus-specific regulatory effects, chromatin accessibility, and other confounding factors. These results suggest that an intrinsic physical property of functional enhancer-promoter pairs drives either the duration or frequency of interactions.
We next investigated whether enhancers come into close proximity with their target promoter and, if so, whether the frequency of such interactions correlate with an enhancers’ effect on gene expression. Active enhancers and promoters have well-positioned +1 and +2 nucleosomes downstream of the transcription start site (TSS)38–40 that are readily observed in Micro-C data (Extended Data Fig. 4). Micro-C contacts between these +1 and +2 nucleosomes at enhancers and promoters require enhancer/promoter DNA to come close enough in 3D space to ligate12, and therefore frequent contacts would be difficult to reconcile with the 100–300 nm distances measured by imaging studies19–21,41 (see Discussion). Aggregated peak analysis (APA) between all candidate enhancer and promoter pairs (5kb-100kb) showed that contacts between +1 (promoter)/ +1 (enhancer) nucleosomes were most prominent (Fig. 1D). To determine whether such close interactions are enriched in functional enhancer-promoter pairs, we examined the difference in contact frequency between the CRISPRi functional and high-confidence nonfunctional enhancer-promoter pairs. We observed the greatest enrichment in functional enhancer-promoter pairs near the TSS, especially for interactions involving the +1 and +2 nucleosomes. The enrichment of functional enhancer-promoter pairs decayed as a function of distance to ~2.5kb from the TSS (Pearson’s R = −0.83, p = 8.2X10⁻⁴) (Fig. 1E–G). We thus conclude that the TSSs of functional enhancer-promoter pairs reside in very close physical proximity more frequently than non-functional pairs. This result is consistent with models of enhancer-promoter communication that involve very close interactions between enhancer-promoter DNA stabilized by transcription-associated proteins.
Enhancer-promoter contacts depend on active transcription
We next investigated which cellular factors mediate the increased contacts between enhancers and their target promoters. One model of interaction involves the aggregation of transcription proteins into clusters that contain both enhancers and promoters and act to facilitate communication41–47. Both the C-terminal domain (CTD) of the large subunit of Pol II and nascent RNA are reported to form macromolecular clusters with other transcription-related proteins44,48–50. These results imply that Pol II itself may play a role in mediating enhancer-promoter contacts. However, perturbing Pol II was reported to have modest effects on enhancer-promoter contacts28,51, with the notable exception of a recent study that degraded Pol II52.
We set out to test the hypothesis that Pol II is required for enhancer-promoter contacts. To accommodate global changes in the distribution of contacts, we devised APAs that directly measure changes in contacts after adjusting for local 1D signal intensity near enhancer- and promoter- anchors, between different treatment conditions (Fig. 2A; Extended Data Fig. 5; see Methods). Using this strategy to re-analyze published Micro-C data after blocking either Pol II initiation (triptolide - TRP) or release from pause (flavopiridol - FLV)28 showed that the largest effect of Pol II transcriptional inhibition occurred near the TSS (Fig. 2B, Extended Data Fig. 6A–C), in contrast to the interpretation presented by the original authors. We also explored an alternative background normalization scheme that adjusts contacts in each candidate enhancer-promoter pair for changes in the distribution of signal between conditions and found identical results (Fig 2C–D; see Methods). Changes were specific to enhancer-promoter contacts; we did not observe a similar effect of either TRP or FLV on CTCF-CTCF contact pairs after background normalization (Fig. 2E, Extended Data Fig. 6D). Changes were large enough in magnitude to be observed at individual loci, such as near enhancers regulating the Pou5f1 promoter53 (Extended Data Fig. 7). We do note that while the effect was observed in both of the independent biological replicates used by the authors of their original paper28, no effect was observed in a separate experiment included only in the author’s preprint54, potentially reflecting differences in sequencing depth, FLV concentration, or other technical confounders. Nevertheless, our observations provide further support for a model where Pol II plays a role in facilitating enhancer-promoter contacts, consistent with new data from Pol II degron experiments52 as well as classic studies focused on specific loci55.
Figure 2. Enhancer-promoter contacts depend on active transcription.
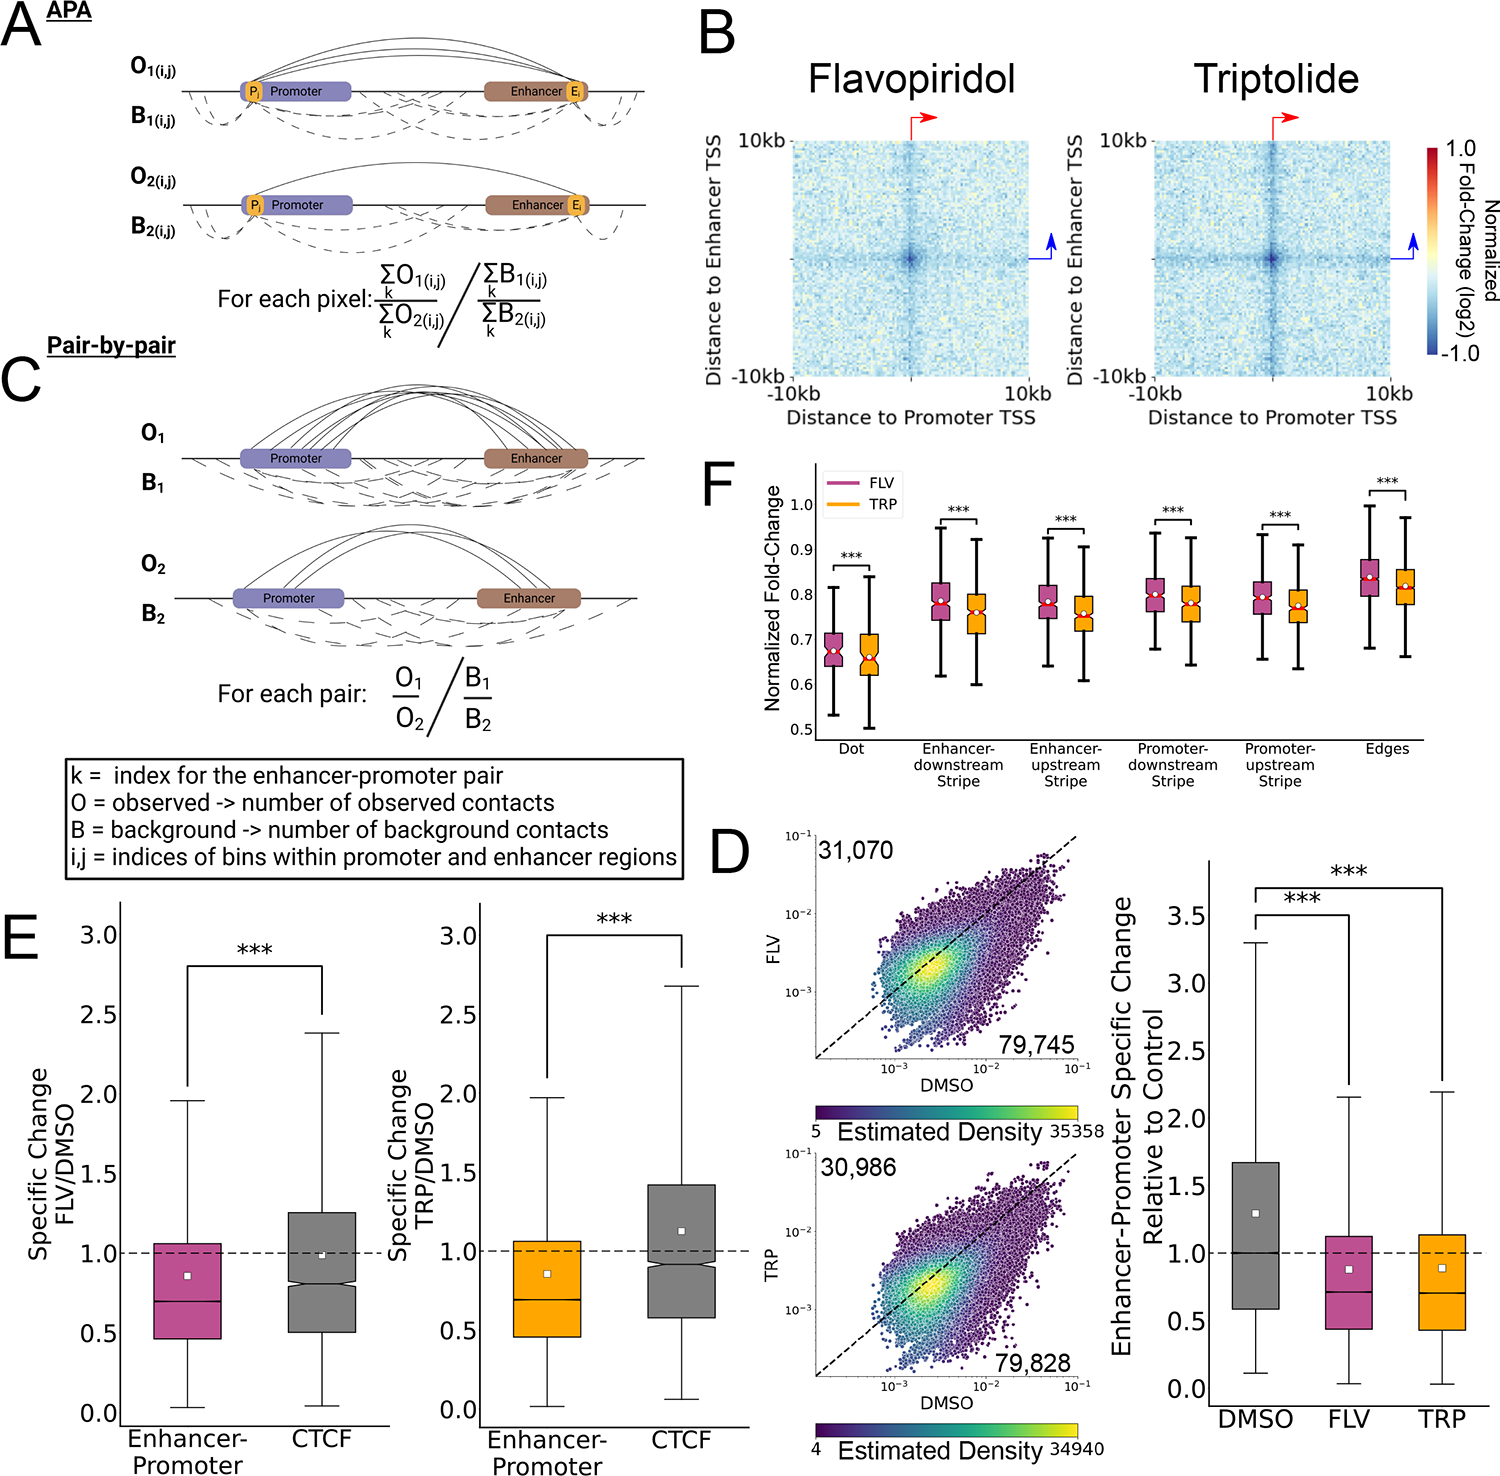
(A) Schematic representation of the strategy used to compute APAs comparing between different conditions. The observes (solid arcs) and background (dashed arcs) contacts associated with the i-th bin relative to the enhancer TSS and the j-th bin relative to the promoter TSS are denoted as O and B, respectively. See also Extended Data Fig. 5 for an elaborated explanation of the method. (B) APA heatmap representation of the log2 fold change in normalized contacts compared to DMSO control for mESCs treated with FLV or TRP. The APA heatmap is oriented such that the gene TSS points to the right and the dominant TSS of the enhancer points upwards, as denoted by the red and blue arrows. (C) Schematic representation of ratio calculation between enhancer-promoter contacts (O, solid arcs) and background (B, dashed arcs) contacts. (D) Scatterplot comparing the enhancer-promoter contacts over background ratio between FLV-treated (top) or TRP-treated (bottom) and DMSO-treated (control) mESCs. The dots are colored based on the density of dots relative to their coordinates. The numbers of pairs in which the ratio was higher in FLV (top) or DMSO control (bottom) are indicated. Boxplots show the ratio distribution relative to the median DMSO control ratio (n=110,815 enhancer-promoter pairs). (*** Two-sided Mann-Whitney p-value < 1X10−100) (E) Boxplots showing the ratio distribution relative to the median DMSO control ratio for enhancer-promoter pairs (n=110,815) and transcriptionally inactive bound CTCF motifs (*** Two-sided Mann-Whitney p-value < 1X10−100). (F) Boxplots quantify the normalized contact changes at the dot (n=100 matrix pixels), the different stripes (n=400 matrix pixels each) and the edges (n=3,200 matrix pixels) of the APA change matrices in each of the TRP and FLV treatments shown in panel B (*** Two-sided Wilcoxon signed-rank test p-value < 1X10−100). For all boxplots, boxes show the median, and 25–75 inter quartile range (IQR) and the maximum length of the whiskers is 1.5 IQR.
By blocking release from pause, FLV not only prevents actively elongating Pol II from entering the gene body, but also leaves paused Pol II near the TSS at most promoters56. We hypothesized that the presence of paused Pol II may retain some of the interactions that are depleted in TRP, in which all Pol II is depleted from chromatin. Indeed, inhibition of Pol II recruitment to promoters and enhancers by TRP had a larger effect on enhancer-promoter contacts compared with the effect of inhibiting pause release by FLV (Fig. 2F; p < 10−100; Wilcoxon signed-rank test, Extended Data Fig. 5–6), indicating that Pol II occupancy at pause sites may have a stabilizing effect on these contacts. These observations suggest that different steps in the transcription cycle may have a fundamentally different impact on enhancer-promoter contacts based on the effect they have on Pol II density near the TSS.
Transcriptional dynamics and enhancer-promoter contacts
We next asked how different steps in the transcription cycle correlate with enhancer-promoter contacts. At steady-state, the rate of transcription initiation is proportional to gene body transcription levels, whereas the rate of release of paused Pol II into productive elongation is proportional to the pausing index57. In order to address how different steps in the transcription cycle affect enhancer-promoter contacts, we first characterized RNA polymerase activity using precision run on and sequencing (PRO-seq), a method which measures the genomic density of RNA polymerase at single nucleotide resolution30. We divided human gene promoters into quartiles based on their gene body transcription levels, the gene body-normalized PRO-seq signal in the first 250bp downstream of the TSS (pausing index), or the pausing signal alone (pausing signal) in K562 cells (Fig 3A,B). Enhancer-promoter contacts were most correlated with gene body transcription levels, in-line with previous findings14,17,58. Increased enhancer-promoter contacts were also associated with higher pausing signal and pausing index. However, whereas the increase in contacts associated with gene body transcription spread across the regions surrounding enhancers and promoters, as well as across the stripe overlapping the transcription unit, the pause-associated correlation was more specific to focal (promoter TSS-enhancer TSS) enhancer-promoter contacts near the location at which paused Pol II resides (Fig 3B).
Figure 3. Changes in Pol II pausing and gene body density correlate with enhancer-promoter contacts.
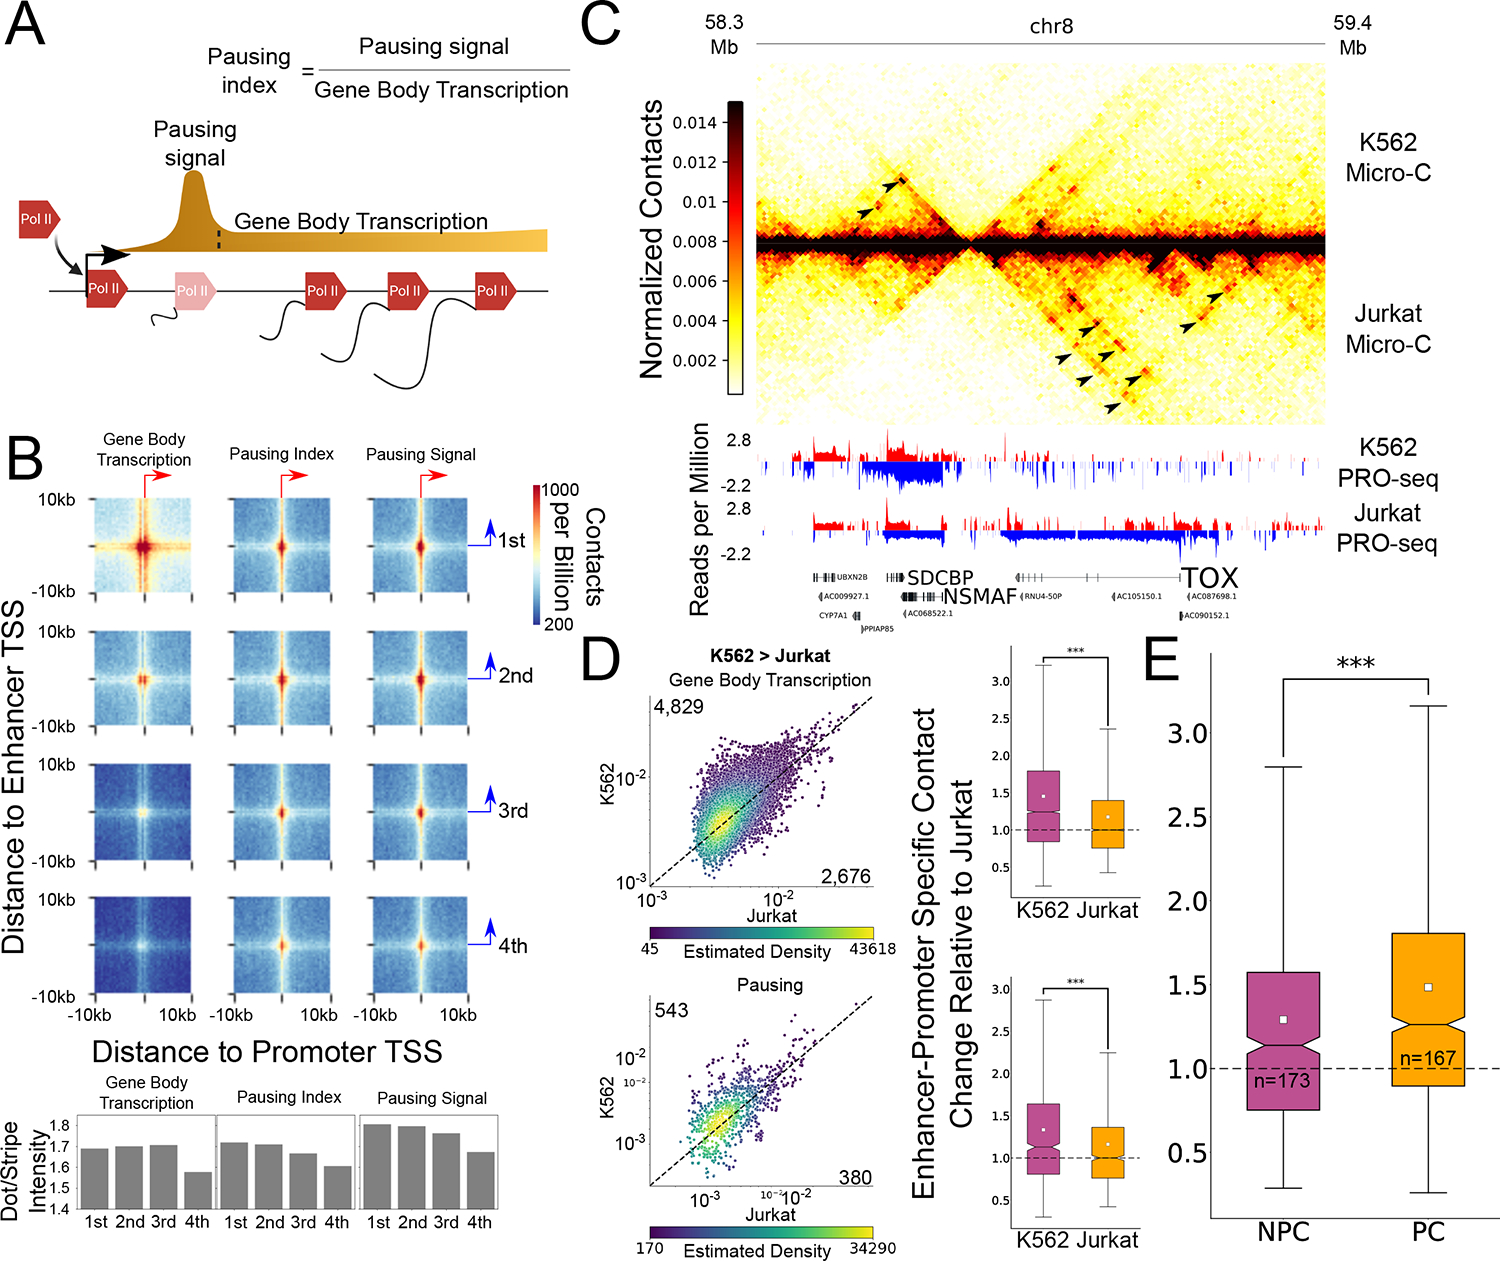
(A) Schematic representation of gene transcription from initiation, pausing and productive elongation at the gene body. The definitions for the PRO-seq signal at the pause peak and gene body, as well as the calculated pausing index for this analysis, are illustrated. (B) APA heatmaps show enhancer-promoter contacts associated with promoters of four gene body transcription (left), pausing index (middle) and pause peak signal (right) quartiles. Bar-plots demonstrate the ratios between the dot- and stripe-associated contacts. All APAs are centered on the max transcription start site of the gene (x-axis) and enhancer (y-axis) and are oriented so that the primary TSS points to the right (gene) or upwards (enhancer), as denoted by the red and blue arrows. (C) Genome-browser shot of a 1.1Mb region containing the TOX and NSMAF genes. The Micro-C contact map pixel size is 10kb. Arrows indicate differential contacts associated with differential transcriptional activity in K56238 and Jurkat T-cells36. (D) Scatterplots where each dot represents a single enhancer-promoter pair where the promoter was associated with higher gene body transcription (top, n=7,505) and pausing signal (bottom, n=923) at K562 compared to Jurkat T cells. The numbers of pairs in which the ratio was higher in K562 (upper number) or Jurkat (lower number) are indicated. The dots are colored based on the density of dots relative to their coordinates. The associated boxplots show the distribution of enhancer-promoter contacts relative to local background in both cell types, relative to the median ratio in Jurkat. (*** Two-sided Wilcoxon signed-rank test p-value < 1X10−100). (E) Boxplot shows the relative increase of enhancer-promoter contacts associated with promoters of genes with upregulated gene body transcription in K562 and with a corresponding significant increase in pausing signal (pause change – PC, n=167) or without a change in pausing signal (no pause change – NPC, n=173) (*** Two-sided Mann-Whitney p-value < 1X10−100). For all boxplots, boxes show the median, and 25–75 inter quartile range (IQR) and the maximum length of the whiskers is 1.5 IQR.
To further isolate the effect of Pol II pausing from productive elongation, we compared changes in contacts and transcription between different cell types. We generated new Micro-C data from Jurkat T-cells (~1.18 billion contacts) and compared them to our K562 Micro-C data. Jurkat and K562 cells model different cell types in the hematopoietic lineage; while K562 show similar properties to cells of the common myeloid progenitor lineage, Jurkat model T-cells. Overall, transcriptional differences between the cell lines were associated with differences in enhancer-promoter contacts (Fig 3C). Differential transcription of gene bodies, and differences in the abundance of paused Pol II near promoters, were both positively correlated with enhancer-promoter contacts (Fig 3D, Extended Data Fig. 8A). We identified gene promoters associated with a significant change in gene body transcription and separated this set to compare promoters exhibiting altered levels of paused Pol II with promoters having unchanged Pol II pausing, while maintaining a similar distribution of change in gene body transcription (Extended Data Fig. 8B; PC = Pause change; NPC = No pause change). We found that genes with a significant increase in productive elongation but no associated change in paused Pol II exhibited, at most, a modest increase in enhancer-promoter contacts, relative to genes associated with increased paused Pol II (Fig. 3E, Extended Data Fig. 8C). Hence, we conclude that paused Pol II has a significant effect on enhancer-promoter contacts that is independent of initiation or productive elongation rates.
NELF degradation depletes enhancer-promoter contacts
To directly test our hypothesis that Pol II pausing affects enhancer-promoter contacts, we asked whether depleting paused Pol II changed enhancer-promoter contacts. Although previously published triptolide and flavopiridol experiments alter Pol II pausing, they also have a substantial inhibitory effect on transcription initiation59. To focus on the effect of Pol II pausing, we used mouse embryonic stem cells (mESCs) in which both copies of the negative elongation factor complex subunit B (NELFB) were tagged with FKBP12F36V, allowing the rapid and reversible degradation of the NELF complex in the presence of a dTAG ligand60 (Fig. 4A). Following 30 minutes of NELFB depletion, Pol II density in TSSs decreased. However, by 60 minutes of NELFB depletion, Pol II signal near the TSS was partially restored (Fig. 4B). Notably, it was recently shown that this recovery of Pol II near the TSS represents transcriptionally inactive Pol II that cannot productively elongate in the absence of NELF61,62. This suggests that while paused Pol II was removed following NELFB depletion, transcription initiation rates were intact or may even increase59.
Figure 4. NELFB depletion and recovery correlates with changes in enhancer-promoter contacts.
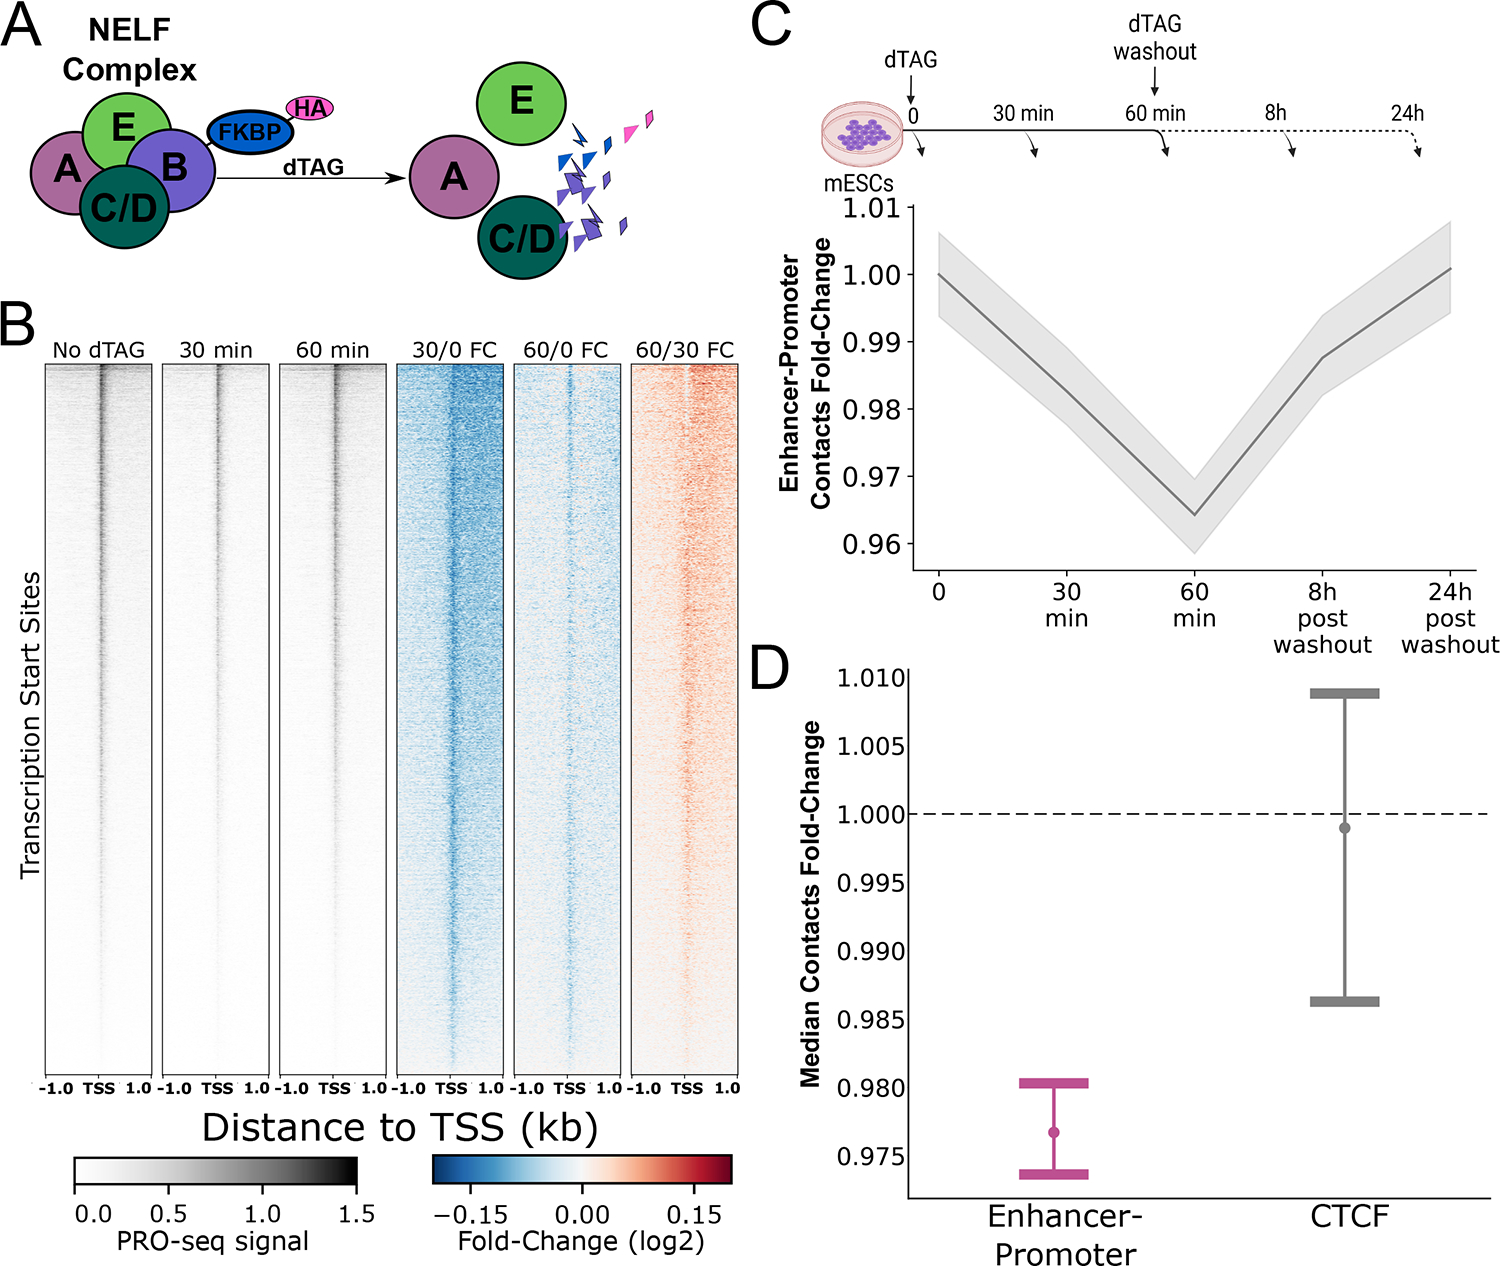
(A) Illustration of the NELFB-dTAG system and the corresponding effect on the NELF complex. Following NELFB depletion with dTAG, the NELF complex dissociates and is no longer found bound to chromatin84 (B) Heatmaps showing PRO-seq signal in untreated (control) mESCs (left) and 30–60min of treatment with dTAG as well as the fold-change in PRO-seq signal following 30 minutes of dTAG treatment and after 60 minutes of dTAG treatment near TSSs and the fold change in PRO-seq signal at 30 minutes and 60 minutes of dTAG treatment compared to untreated control and at 60 minutes compared to 30 minutes of dTAG treatment. (C) A line plot showing the median enhancer-promoter contacts over background ratio change relative to the untreated (T=0) control. Gray shadow represents the 95% confidence interval for the median, based on 1000 bootstrap iterations. (D) Dot and error plot demonstrating the median contact change and the 95% confidence interval of the median based on 1000 bootstrap iterations, after 60 minutes of NELFB depletion, for enhancer-promoter (purple) and transcriptionally inactive bound CTCF motif contacts in mESCs (gray).
To ask if such a drop in Pol II pausing results in a loss of enhancer-promoter contacts, we generated Micro-C libraries (~300 million contacts each) following a time-course of NELFB depletion and recovery after dTAG washout. We found a small but highly reproducible drop in enhancer-promoter contacts beginning at 30 minutes which decreased further at 60 minutes of NELFB depletion (Fig. 4C; Extended Data Fig. 9). This suggests that the accumulation of improperly paused Pol II61,62 cannot rescue the loss of contacts associated with the depletion of a properly paused Pol II. Washout of the dTAG ligand over 8 and 24 hours, corresponding to a ~20–40% restoration of NELFB61 levels, increased enhancer-promoter contacts back to the levels observed in untreated cells (Fig. 4C; Extended Data Fig. 9). The effect of NELF degradation was specific to enhancer-promoter contacts and was not observed at transcriptionally inactive CTCF binding sites (Fig 4D). The magnitude of decrease in contact frequency correlated with the magnitude of paused Pol II loss at 30 minutes (Pearson’s R = 0.24; p = 0.018; see Methods), such that candidate enhancer-promoter pairs which lost more paused Pol II also lost more contacts. Likewise, the magnitude of decrease in contact frequency across all genes was correlated with the effect on NELFB protein abundance (Spearman’s Rho = 0.9, p = 0.037; Pearson’s R = 0.728, p = 0.163). An illustrative example is the ZRS enhancer of the Shh gene, which had a large drop in paused Pol II signal as well as a large reduction in contacts with the Shh promoter following 30 minutes of NELFB depletion (Extended Data Fig. 10). Hence, we conclude that paused Pol II contributes to enhancer-promoter contact levels.
Discussion
Currently two models are proposed to explain how enhancer and promoter regions communicate8. The structural bridge model holds that enhancer and promoter DNA come into close physical contact and are connected by a bridge formed by highly ordered protein-protein interactions6,7. More recently, an alternative model (which we refer to as the “hub” model, following8,41,47) has come into favor which predicts that protein-protein interactions form malleable hubs (Fig. 5). In the hub model, enhancer-promoter communication does not require stable protein-protein interactions to span the gap between the enhancer and promoter DNA sequences. Instead, high local concentrations of transcription-associated proteins, recruited by both the enhancer and promoter DNA into the local hub, facilitate transcriptional bursts63. The hub model has a long history63,64, but has recently come into favor because it explains findings which do not appear compatible with a structural bridge model, including long physical distances between enhancers and promoters upon gene activation19,20,65, the ability of enhancers to activate transcription from multiple promoters simultaneously66, and multi-way interactions of enhancer clusters67.
Figure 5. Updated model integrating Pol II dynamics into enhancer-promoter interactions.
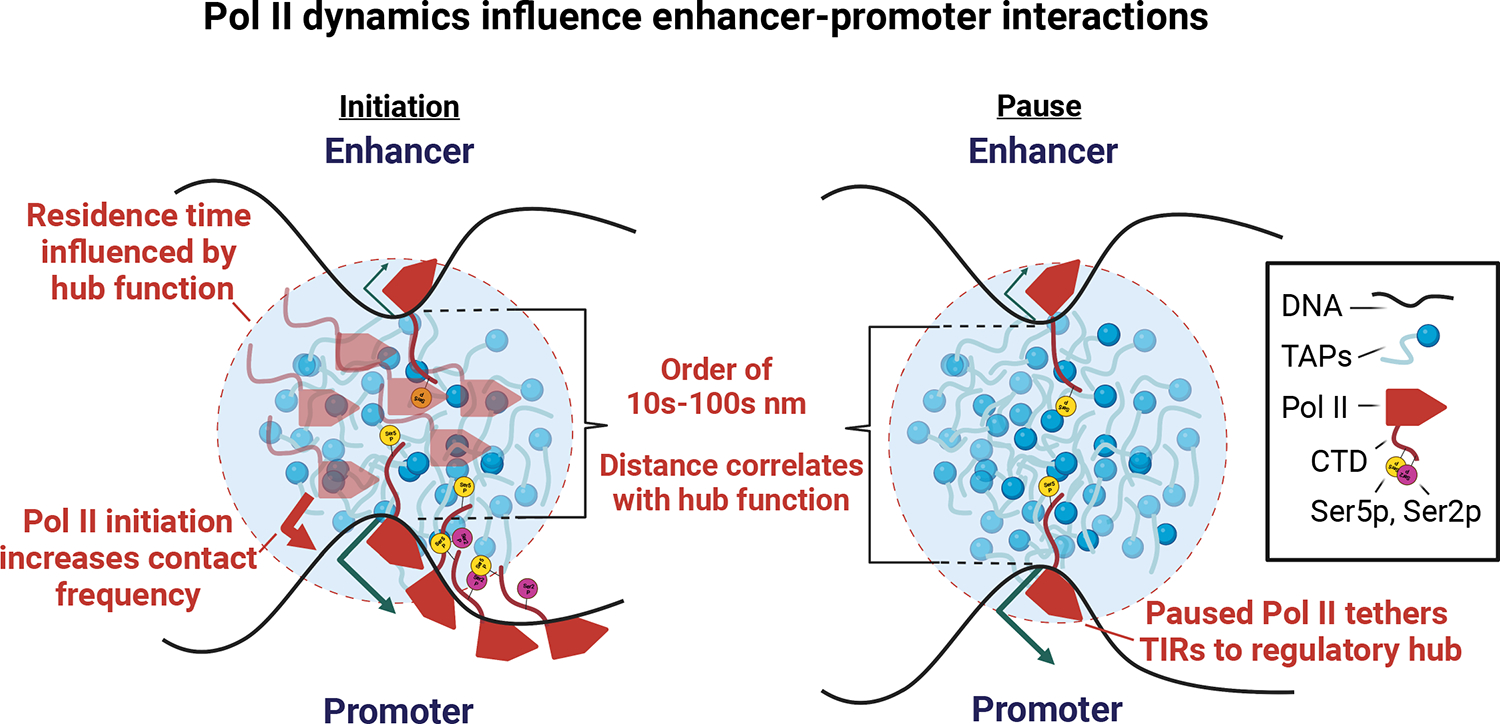
Cartoon depicts our updated model in which enhancers come into close contact with the target promoter during a transcriptional burst. We propose that the rate of initiation and productive elongation increases the mobility of enhancers and promoters in the nuclear space85, and hence can increase the rate of their entanglement or contact frequency. Paused Pol II, which is stable on DNA for long durations, may tether TIRs into a hub for longer durations, providing more stable enhancer-promoter interactions at highly paused genes. In the key, TAPs denotes transcription associated proteins such as transcription factors and co-activations; CTD denotes the C-terminal domain of Pol II; Ser5p, Ser2p represent serine 5 and serine 2 phosphorylation on the Pol II CTD.
A key difference between the structural bridge and hub models is that a structural bridge requires a short physical distance between enhancers and promoters upon interaction. Conversely, while the hub model does not necessarily place constraints on physical distance, proponents of the hub model have argued that enhancers and promoters may not be able to come close together due to issues of molecular crowding within a hub41. We found that functional enhancer-promoter pairs are most enriched in contacts involving the +1 or +2 nucleosomes. Compared with recent work defining contacts between individual transcription factor binding sites68, our study shows that these very proximal interactions are associated with enhancer function, even within individual loci like a super enhancer. Micro-C only detects contacts that are close enough to be crosslinked and ligated12, suggesting that functional enhancer-promoter pairs spend more time at very short interaction distances than current studies suggest. The exact proximity of engaged enhancer and promoter regions remains difficult to say. Even if we consider the most conservative model, in which crosslinks between fully extended N-terminal nucleosome tails was sufficient to gain an interaction in Micro-C, the distance between enhancer-promoter DNA must still be less than 100 nm. In the in situ ligation protocol that we use here, the distance required to generate a contact is likely much less, owing to the widespread availability of DNA in a packed nucleus that competes for ligations, as well as constraints placed on the diffusion of proteins and DNA during ligation by molecular crowding and crosslinks. We emphasize that our findings do not necessitate a structural bridge between enhancers and promoters. Our findings may also be compatible with hubs in which enhancer and promoter DNA is often located more closely together than imaging studies suggest (Fig. 5). Thus, our work may indicate that short-distance enhancer-promoter interactions are important for enhancer function, but that they are more malleable than predicted by a structural bridge model6,7.
Both models predict that transcription-associated proteins, including transcription factors, mediator and Pol II play key roles in enhancer-promoter communication. For this reason, the muted effect that degrading key transcription proteins, including mediator and Pol II, was reported to have on contact frequency was unexpected23,28,51. We report that Pol II contributes to enhancer-promoter interaction frequency, even after normalizing Micro-C for the substantial changes to chromatin observed when Pol II is depleted69,70. Our results are consistent with work that shows an impact of both Pol II and Mediator in enhancer-promoter communication9,26,52,55. Several aspects of Pol II may help facilitate interactions, especially under a hub model: First, the C-terminal heptad repeats on RPB1, the largest subunit of Pol II, have been shown to aid in macromolecular clustering42,45,46,65,71,72. Second, the nascent RNA emerging from the exit channel may also contribute to clustering73,74. For its part, the mediator complex may facilitate enhancer-promoter communication by interacting with transcription factors or other transcription-associated proteins75,76. Thus, Pol II, along with the other molecules affecting enhancer strength like transcription factors and co-activators, has a direct impact on enhancer-promoter interactions (Fig. 5).
Our results reveal a wide variation in the time that functional enhancer-promoter pairs spend in proximity at steady-state. Although some of this variation undoubtedly reflects technical noise in the Micro-C dataset, we do think there is a component of the variation that reflects differences in the underlying biology of different enhancer-promoter interactions. Certain loci (like MYC) appear to have more frequent interactions than the average enhancer-promoter pair. One interpretation is that most enhancer-promoter loops are transient, and that either residence time or interaction frequency is increased by the activity of biological factors specific to each interacting locus, potentially including Pol II and other transcription related proteins which form either a structural bridge or a hub. For the most part, our results address the broader question of whether there is evidence that functional enhancer-promoter pairs spend more time close together, on average. Future work will be required to identify the full complement of factors that influence the variation in contact frequency between loci.
We present several independent lines of evidence that highlight paused Pol II as one of the factors which has a role in stabilizing enhancer-promoter interactions. Paused Pol II can be stable over durations estimated between 1–10 minutes56,77. Given its stable attachment to DNA through the transcription bubble, it is possible that paused Pol II may serve as one of the tethers connecting promoter or enhancer DNA into an enhancer-promoter interaction. Under a hub model, paused Pol II initiated from multiple TSSs within a transcription initiation domain78 may serve to keep both enhancer and promoter DNA tethered to the hub79,80 (Fig. 5). Indeed, paused Pol II tethering enhancers into a hub may serve as one way in which enhancer-templated RNAs (eRNAs) have a sequence-independent biological function81.
In summary, our work suggests several important changes to the prevailing models of enhancer-promoter interactions. First, we find that functional interactions between enhancers and their target promoter spend more time at very short 3D distances driven in part by macromolecular interactions that are independent of genomic position. Second, we provide direct evidence for the effect of Pol II on enhancer-promoter contacts. Our work emphasizes an important effect of Pol II pausing in metazoan cells and sheds light on the evolution of pausing alongside long-range enhancer-promoter interactions. Thus, considering transcription as a modulator of enhancer-promoter contacts may help future studies to better define the temporal correlation between the two.
Methods
Cell culture
Cells were cultured in a humidified 37°C incubator with 5% CO2. K562 (ATCC, CCL-243) and Jurkat (ATCC, TIB-152) cells were grown in RPMI-1640 medium supplemented with 10% fetal bovine serum and 1X penicillin streptomycin antibiotic.
mECSs (Mouse embryonic stem cell line E14, ATCC, CRL-1821) harboring a homozygous endogenous NELFB-FKBP12F36V fusion protein61,84 were cultured on 0.1% gelatin (Millipore) in PBS+/+ coated tissue-culture grade plates. For routine culture, cells were grown in Serum/LIF conditions: DMEM (Gibco), supplemented with 2 mM L-glutamine (Gibco), 1x MEM non-essential amino acids (Gibco), 1 mM sodium pyruvate (Gibco), 100 U/ml penicillin and 100 U/ml streptomycin (Gibco), 0.1 mM 2-mercaptoethanol (Gibco), 15% Fetal Bovine Serum (Gibco), and 1000 U/ml of recombinant leukemia inhibitory factor (LIF).
To induce NELFB degradation, dTAG-13 (Bio-Techne) was reconstituted in DMSO (Sigma) at 5 mM. dTAG-13 was diluted in maintenance medium to 500 nM and added to cells with medium changes for the specified amounts of time. For dTAG washes, the cells were washed 4 times, twice with PBS +/+ and twice with maintenance medium following the treatment time to ensure complete removal of the dTAG ligand. At the end of each dTAG-13 treatment time point, cells were detached using Trypsin-EDTA (0.05%) (Gibco) and counted before crosslinking for Micro-C.
Micro-C
Micro-C for K562, Jurkat and mESCs was performed by following the published protocol for mammalian Micro-C27,28,88. Cells were crosslinked with 1 ml per million cells of 1% formaldehyde for 10 minutes at room temperature and quenched by 0.25 M Glycine for 5 min. After spin-down for 5 minutes at 300Xg at 4 °C, cells were washed at a density of 1 ml per million cells in ice cold PBS. Cells were crosslinked a second time, with 1 ml per 4 million cells of 3 mM disuccinimidyl glutarate (DSG) (ThermoFisher Scientific, 20593) for 40 min at room temperature and quenched by 0.4 M Glycine for 5 min. Following two washes with ice cold PBS, cells were flash-frozen and kept at −80°C until further use. For MNase digestion, cells were thawed on ice for 5 min, incubated with 1ml MB#1 buffer (10 mM Tris-HCl, pH 7.5, 50 mM NaCl, 5 mM MgCl2, 1 mM CaCl2, 0.2% NP-40, 1x Roche cOmplete EDTA-free (Roche diagnostics, 04693132001)) and washed twice with MB#1 buffer. MNase concentration for each cell type was predetermined using MNase titration experiments exploring 2.5–20U of MNase per million cells. We selected the MNase concentration that gives ~90% mononucleosomes. Chromatin was digested with MNase for 10 min at 37 °C and digestion was stopped by adding 8 ul of 500 mM EGTA and incubating at 65 °C for 10 min.
Following dephosphorylation with rSAP (NEB #M0371) and end polishing using T4 PNK (NEB #M0201), DNA polymerase Klenow fragment (NEB #M0210) and biotinylated dATP and dCTP (Jena Bioscience #NU-835-BIO14-S and #NU-809-BIOX-S, respectively), ligation was performed in a final volume of 2.5 ml for 3h at room temperature using T4 DNA ligase (NEB #M0202). Dangling ends were removed by a 5 min incubation with Exonuclease III (NEB #0206) at 37 °C and biotin enrichment was done using 20 ul Dynabeads™ MyOne™ Streptavidin C1 beads (Invitrogen #65001). Libraries were prepared with the NEBNext Ultra II Library Preparation Kit (NEB #E7103). Samples were sequenced on a combination of Illumina’s NovaSeq 6000 and HiSeq 2500 at Novogene.
Micro-C data mapping and visualization
All Micro-C mapping was done using the mirnylab/distiller-nf: v0.3.3 pipeline89. Raw data were mapped to the hg38 human genome assembly (K562 and Jurkat) or mm10 mouse genome assembly (mESCs). For analysis of contacts in the MYC locus, data was mapped to hg19 human genome assembly due to a large gap present in this locus when mapping K562 sequencing data to hg38. For data visualization by contact maps, multi cool (mcool) files, balanced by iterative correction and eigenvector decomposition (ICE) for resolutions of 200 bp to 10 Mb were generated from contacts with both ends having a mapq score ≥ 30. Micro-C data visualization as contact maps in genome-browser shots with available PRO-seq, dREG, CRISPRi and histone marks tracks was done using the HiCExplorer tool v3.7.290 and pyGenomeTracks v3.691. Virtual 4C tracks were prepared as described previously58. 1D signal near enhancer and promoter TSSs (Extended Data Fig. 2) was calculated based on the distiller-nf output pairs files, filtered for intra-chromosomal with mapq ≥ 30. Contacts assigned to the 5’ of single reads were shifted 75bp downstream, based on their orientation, to the probable center of the nucleosome.
PRO-seq and GRO-seq data processing and analysis
Processing PRO-seq and GRO-seq available raw data in this study was done using the Proseq2.0 pipeline available from GitHub (https://github.com/Danko-Lab/proseq2.0)92. Differential expression analyses between K562 and Jurkat cells for pausing signal and gene body transcription levels was performed by DEseq293 either on signal between the TSS and 250bp downstream (pause signal) or signal downstream to the first 250 bp through the annotated (GENCODE V29) polyadenylation cleavage site (gene body signal). For visualization of the changes, fold change in expression following NELFB-dTAG in mESCs we used deepTools (v3.5.1) bigwigCompare command at 1bp resolution, using 0.25 as pseudocount. For the NELFB-dTAG PRO-seq visualization, fold-change and normalized PRO-seq signal matrices were calculated in a stranded manner, followed by a concatenation of the two strands’ matrices to generate a single, stranded matrix (Fig. 4B).
Definition of TIRs, enhancers, promoters and TSSs
For mESCs we first defined TIRs genome-wide as detected by dREG36,37 using available GRO-seq data from mESCs56,94. To finely and unbiasedly define the position of transcription initiation at each of these TIRs, we used the position with the most 5’ mapped GRO-seq or START-seq95 reads within the dREG peak (maxTSN). For the analyses of K562 cells, we first called TIRs using dREG from available PRO-seq data37. The center of these TIRs was defined as the center of enhancers and promoters for the analysis comparison of contacts between functional and nonfunctional enhancer-promoter pairs, based on CRISPRi data. For any further analyses the center of enhancers and promoters was defined as the maxTSNs, called using the data from coPRO with enrichment for 5’ capping (coPRO-capped)78. For the comparison between K562 and Jurkat cell lines, we called TIRs in both K562 and Jurkat using PRO-seq data37 and dREG and determined maxTSN based on coPRO-capped from K562 cells. We defined promoters based on the existence of any known human (K562 and Jurkat) of mouse (mESCs) stable 5’ mapped transcripts from CAGE96 within 5kb away in the direction of maximum initiation. In analyses including Jurkat and K562 cell lines, we considered only shared promoters based on proximity to the best transcription start site defined by the for nascent RNA-sequencing data (DENR v1.0.0)97, based on GENCODE V29 annotations, in both cell types. We used a combined set of enhancers from TIRs detected in both cell lines to define enhancers. Since promoters make a relatively small fraction of all TIRs found in the data and can act as enhancers for other distal genes98 we included promoters under the definition for enhancers whenever we calculated enhancer-promoter contacts genome-wide.
Definition of functional and nonfunctional pairs
Comparison between functional and nonfunctional enhancer-promoter pairs was based either on CRISPRi genetic screens for enhancer function either in the MYC locus, based on cell viability34, based on expression from single-cell RNA sequencing analysis33 or based on CRISPRi-FlowFISH data14. All CRISPRi-targeted enhancers and target promoters were reassigned to their nearest dREG-defined TIR (or H3K27ac overlapping ATAC-seq peak), within 5kb, on the same strand. We defined the center of the TIR as the enhancer center. We filtered out all other reported sgRNA centers that had no such detectable nearby transcription initiation. Functional enhancers of the MYC locus were defined based on the previously CRISPRi-defined K562 enhancers of MYC34. Since the entire TAD harboring the MYC promoter was tiled with sgRNAs, we were able to detect 54 TIRs that were marked by DNase-I hypersensitivity sites (DHSs) and histone modifications, were located in the same TAD, and were tested by CRISPRi, but which did not affect the growth rate of K562 cells. These TIRs were considered nonfunctional and compared to the seven functional MYC enhancers. Notably, this definition refers only to the measured effect on MYC expression and does not suggest that the enhancers associated with these TIRs lack function in other contexts. For the genome-wide analysis based on single-cell RNA-seq33, we defined functional enhancer-promoter pairs, 15kb-1Mb away from each other, as having a minimum reduction of 10% of gene expression, with an empirical p-value < 0.05, following enhancer silencing. For high confidence nonfunctional pairs within the same genomic distance range, we set a cutoff of empirical p-value larger than 0.9 and a change in gene expression smaller than 5%. All other enhancer-promoter pairs within the same genomic distance range were defined as nonfunctional. To remove possible confounding effects, we filtered the functional and nonfunctional pairs to have similar distributions of enhancer-promoter contacts, accessibility (by ATAC-seq) and baseline gene body transcription levels (by PRO-seq) in the target gene (Extended Data Fig. 2). For CRISPRi-FlowFISH data14, due to richer data per sgRNA and the smaller overall number of tested enhancers, we defined functional enhancer-promoter pairs, 15kb-1Mb away from each other, as having a minimum of 1% of gene expression, with an empirical p-value < 0.05. For high confidence nonfunctional pairs within the same genomic distance range, we set a cutoff of adjusted p-value larger than 0.9 and a change in gene expression smaller than 0.1%. All other enhancer-promoter pairs within the same genomic distance range were defined as nonfunctional.
Comparison between functional and nonfunctional pairs
Enhancer-promoter contacts were defined as contacts that map to a 4kb window near the promoter on one end and the enhancer on the other end. Expected number of contacts between enhancers and promoters are often calculated based on a global distribution of contact-associated genomic distances at fairly large genomic regions that encompass them90,99. However, within such large regions, multiple factors like extrusion dynamics or the existence of insulators can affect the distribution of contacts locally. To better capture local fluctuations in background contacts distributions, contacts were normalized to the expected based on a non-parametric LOWESS smoothing of the contacts-by-distance function in a region corresponding to a 1Mb in the orientation of the promoter, relative to each enhancer (Extended Data Fig. 1A). Observed over expected ratios were then compared between functional and high confidence nonfunctional\nonfunctional pairs (Fig. 1B–C, Extended Data Fig. 1B–C). Differences in contacts between CRISPRi-defined functional and high confidence nonfunctional pairs were calculated based on pixel-by-pixel differences between APA matrices for all functional and all high confidence nonfunctional pairs, normalized for the number of pairs. The differences were calculated as the medians (Fig. 1E–F) or the sum (Fig. 1G) of the differences based on 1000 bootstrapping iterations of the functional and high confidence nonfunctional pairs, to remove outlier background. These differences were presented as the number of contact differences per 1000 pairs. The APA matrices were centered on the coPRO-based maxTSN as the TSS assigned for each TIR.
Between and within sample Aggregated Peak Analysis (APA)
Overview
We expected significant changes in chromatin after manipulating Pol II transcription69,70. As such, not only are enhancer-promoter contacts expected to change, but the background contacts with at least one end originating at enhancer- and promoter- regions may be affected between conditions. As APAs are often used to characterize contacts10,28,51, we devised an APA that normalizes enhancer-promoter contacts for changes in the 1D signal mapping to either anchor region. The primary challenge with devising a background-corrected APA is to handle the sparsity of Micro-C data (i.e., most small genomic bins have an observed contact value of 0). To address this challenge, our strategy computes a single observed and background matrix separately that represents the set of all enhancer and promoter regions included in the analysis, and then performs a pixel-by-pixel division of the aggregate observed and background matrices (Fig. 2A, Extended Data Fig. 5).
Computing the observed matrix
We first compute an aggregate observed matrix that represents all enhancer-promoter pairs. To do this calculation, we take the sum over the set of all enhancer-promoter pair matrices, leaving a single aggregate observed matrix (represented in Extended Data Fig. 5A). For a single enhancer-promoter pair,, we calculated an observed contact matrix,:
Where is the number of contacts mapped to the ith window relative to the enhancer TSS and the jth window relative to the promoter TSS for enhancer-promoter pair .
To make a single aggregate matrix, we take the element-wise sum of the matrices for all enhancer-promoter pairs. The result is a single observed () APA matrix that represents the aggregate signal across all enhancer-promoter pairs (Extended Data Fig. 5A). Formally, the computation is was completed as follows:
Where , the number of enhancer-promoter pairs, is restricted by the allowed genomic distance range we defined. In figures calculating APAs within a single sample or condition, we presented the matrix as heatmaps (Figs. 1D and 3B).
Computing the background matrix
Next, we compute a background matrix that represents the aggregate signal near the enhancer-promoter anchors in the same dataset. We compute the background matrix in two steps: (1) We compute the average 1D signal near each enhancer and each promoter anchor, and (2) We turn the average 1D signal into a matrix by computing the outer sum of the signal at enhancer and promoter anchors.
The motivation for this strategy is that we assume the probability of observing a signal in window of the observed matrix is proportional to the probability of observing a read in either window in the enhancer or window in the promoter. Further we assume the probabilities observing reads in window and are statistically independent. These assumptions motivate the use of the sum of signals in each anchor in each window to build the matrix, often called the outer sum, because the probability of observing a read from either the enhancer or promoter is the sum of the two probabilities. We also considered alternative formulations that convert 1D signal vectors into a matrix using the outer product, instead of the outer sum. The problem with this formulation in the setup used here is that the outer product includes terms for potential enhancer-promoter pairs that do not meet the criteria used in our analysis, and therefore were not incorporated in the observed (e.g., including cases where the enhancer-promoter pair reside on different chromosomes) (see Supplementary Note 1).
The computation of the background matrix is performed as follows:
First (step 1), we defined a vector of counts with the same length and width as the APA matrix, , that represents the sum of all Micro-C paired-end tags in which at least one end falls into that window relative to the anchor (usually the enhancer or promoter TSS), and the other end falls between the minimum and maximum distance allowed between enhancers and promoters in the APA. Formally, we first compute vectors that represent the aggregate 1D signal at positions or for enhancers or promoters, respectively. We take the mean signal over the set of all enhancers or promoters in the dataset, as shown:
These vectors are shown in the bottom right panel of Extended Data Fig. 5B. Note that we index using and (instead of ) to emphasize that these reflect individual enhancers and promoters, rather than enhancer-promoter pairs.
Second (step 2), we used vectors and to generate the background matrix . We compute the background matrix using the outer sum. Hence, the calculation of cell in the background matrix is computed as follows:
Or, in vector notation, matrix is defined as the outer sum of vectors and :
Note that is not related to either or for two reasons: first, not all enhancer-promoter pairs are allowed by our distance requirements, and second each enhancer (or promoter) can be paired with multiple promoters (or enhancers).
Computing background corrected APAs
We calculated the background corrected APA matrix by dividing observed and background matrices for each condition, as follows:
Where stands for the treatment condition and for the control condition.
Heuristics for choosing which enhancer-promoter pairs are included in each analysis
The primary concern when choosing window sizes in the APA is to avoid overlapping windows between enhancers and promoters, which would result in crossing the diagonal of the Micro-C matrix. To avoid overlapping windows around enhancers and promoters, we excluded enhancer-promoter pairs for which the separating genomic distance was smaller than the total 1D size of the APA plus the maximal fragment size in the library, which is known for Micro-C libraries due to the agarose gel purification step. For example, for a 20kb x 20kb APA, the minimum enhancer-promoter distance should be larger than 20.3 kb. For APAs calculated at windows of 20kb around the anchors, we considered all possible anchor pairs within a genomic distance of 25–150kb. For the high-resolution APA with 2kb window around enhancer and promoter TSSs (Fig. 1D), we considered all possible enhancer-promoter pairs within a genomic distance of 5–100kb.
Individual contact comparison between samples and treatments
We also devised an alternative normalization scheme which compares the number of contacts between enhancer-promoter pairs to the local background near each enhancer and promoter anchor. The primary goal of this alternative normalization scheme was to assess changes in contact frequency specific to enhancer-promoter pairs, after accounting for changes in contact frequency between the enhancer (or promoter) and flanking regions to the second anchor. We calculated the number of contacts between each pair of anchors (enhancer-promoter or CTCF binding sites) using a 5kb window around each anchor. As a background, we counted the number of contacts between each anchor (in a 5kb window) and regions 10–150 kb from the second anchor (Fig. 2C). As such, the ratio between the anchor-to-anchor (i.e., either enhancer-promoter or CTCF-CTCF) contacts and background contacts was calculated for each pair of anchors using the following formula:
Where represents the number of contacts in which one end is mapped to a 5 kb window around the enhancer and the other to a 5 kb region around the promoter. and represent the number of contacts in which one end maps 5 kb from the enhancer (or promoter) and the other maps in the background window (defined as 10–150 kb) of the promoter (or enhancer).
These background normalized contacts are computed separately for each anchor pair and are presented in scatterplots, box-and-whiskers plots or line plots over the NELFB degradation and dTAG washout time course, to calculate the statistical significance of changes between treatments and samples. To avoid the impact of noise, we analyzed only contacts that met a minimum baseline of anchor-to-anchor contacts (at least 8 contacts per billion contacts (CPB)) in one of the treatment conditions. Since TSS calling data (PRO-seq and coPRO-capped) was more abundant for K562 than Jurkat, when comparing K562 and Jurkat libraries we considered enhancer-promoter pairs with at least 8 CPB in both cell lines, to avoid ascertainment bias. The distribution of ratios between enhancer-promoter and background contacts in treated samples (Olaparib\TRP\FLV or dTAG treated cells) was compared to the median ratio in the respective control samples (Figs 2D–E, 4C–D, 5B and S6A). For comparison between cell lines, enhancer-promoter contacts at promoters with increased gene body transcription and\or Pol II pausing signal in one cell line, were compared to their median at the other cell line (Figs. 3D–E and S4A,C). To calculate Pearson’s correlation between the change in paused Pol II and enhancer-promoter contacts following 30 minutes of NELFB degradation, we first calculated the mean change in Pol II for each enhancer-promoter pair in our data. We then calculated the median change in enhancer-promoter contacts associated with each percentile of paused Pol II change and calculated the correlation between these medians and their corresponding levels of change in pause Pol II density.
To avoid overlap, we had set the minimum genomic distance between anchors in each pair to 25kb. Additionally, as many anchors can be included in the background-associated regions flanking the second anchor, we excluded any contacts where both ends fall within the anchor’s defined window (intra-anchor contact) from the background contacts.
Definition of CTCF binding sites
Contacts between CTCF binding sites were used as a control to determine whether the effects of a treatment were specific to enhancer-promoter contacts. We defined pairs of CTCF binding sites as CTCF motifs that were shown to bind CTCF based on ENCODE ChIP-seq data, within the same minimum and maximum allowed genomic distances as for enhancers and promoters. We focused only on CTCF sites that show no overlap with any dREG-defined TIR within 5kb.
Statistics and Reproducibility
Throughout the manuscript, the Two-sided Mann-Whitney U test is used for independent samples, such as comparison of changes between different sets of genomic loci or pairs. The two-sided Wilcoxon signed-rank test is used for paired samples, usually being the same loci\pairs compared between samples\conditions. For assessment of trends in our data, such as the changes in the difference in contacts between functional and nonfunctional pairs or assessing the effect of changes in paused Pol II occupancy on changes in enhancer-promoter contacts, we used Pearson’s correlation coefficient (R). The confidence intervals for the medians throughout the manuscript were calculated using 1000 iterations of bootstrap. Unless stated otherwise, trends for changes in enhancer-promoter contacts or contacts between other anchors, such as CTCF binding sites, were consistent between replicates for all experiments where bulked data is presented. For Micro-C data, this includes six biological replicates for K562, two for Jurkat and two biological replicates with two technical replicates each for the different time points of the NELF-B dTAG experiments.
For differences between functional and non-functional pairs, the median functional difference presented was calculated with 1000 bootstrapping of the functional and nonfunctional pairs where for each iteration the aggregated signals for functional and nonfunctional pairs were divided by the number of functional (245) and high-confidence nonfunctional (232) pairs, respectively, and multiplied by a factor of 1000 (Fig. 2E–G).
Extended Data
Extended Data Figure 1. Details for the comparison between functional and nonfunctional enhancer-promoter pairs.
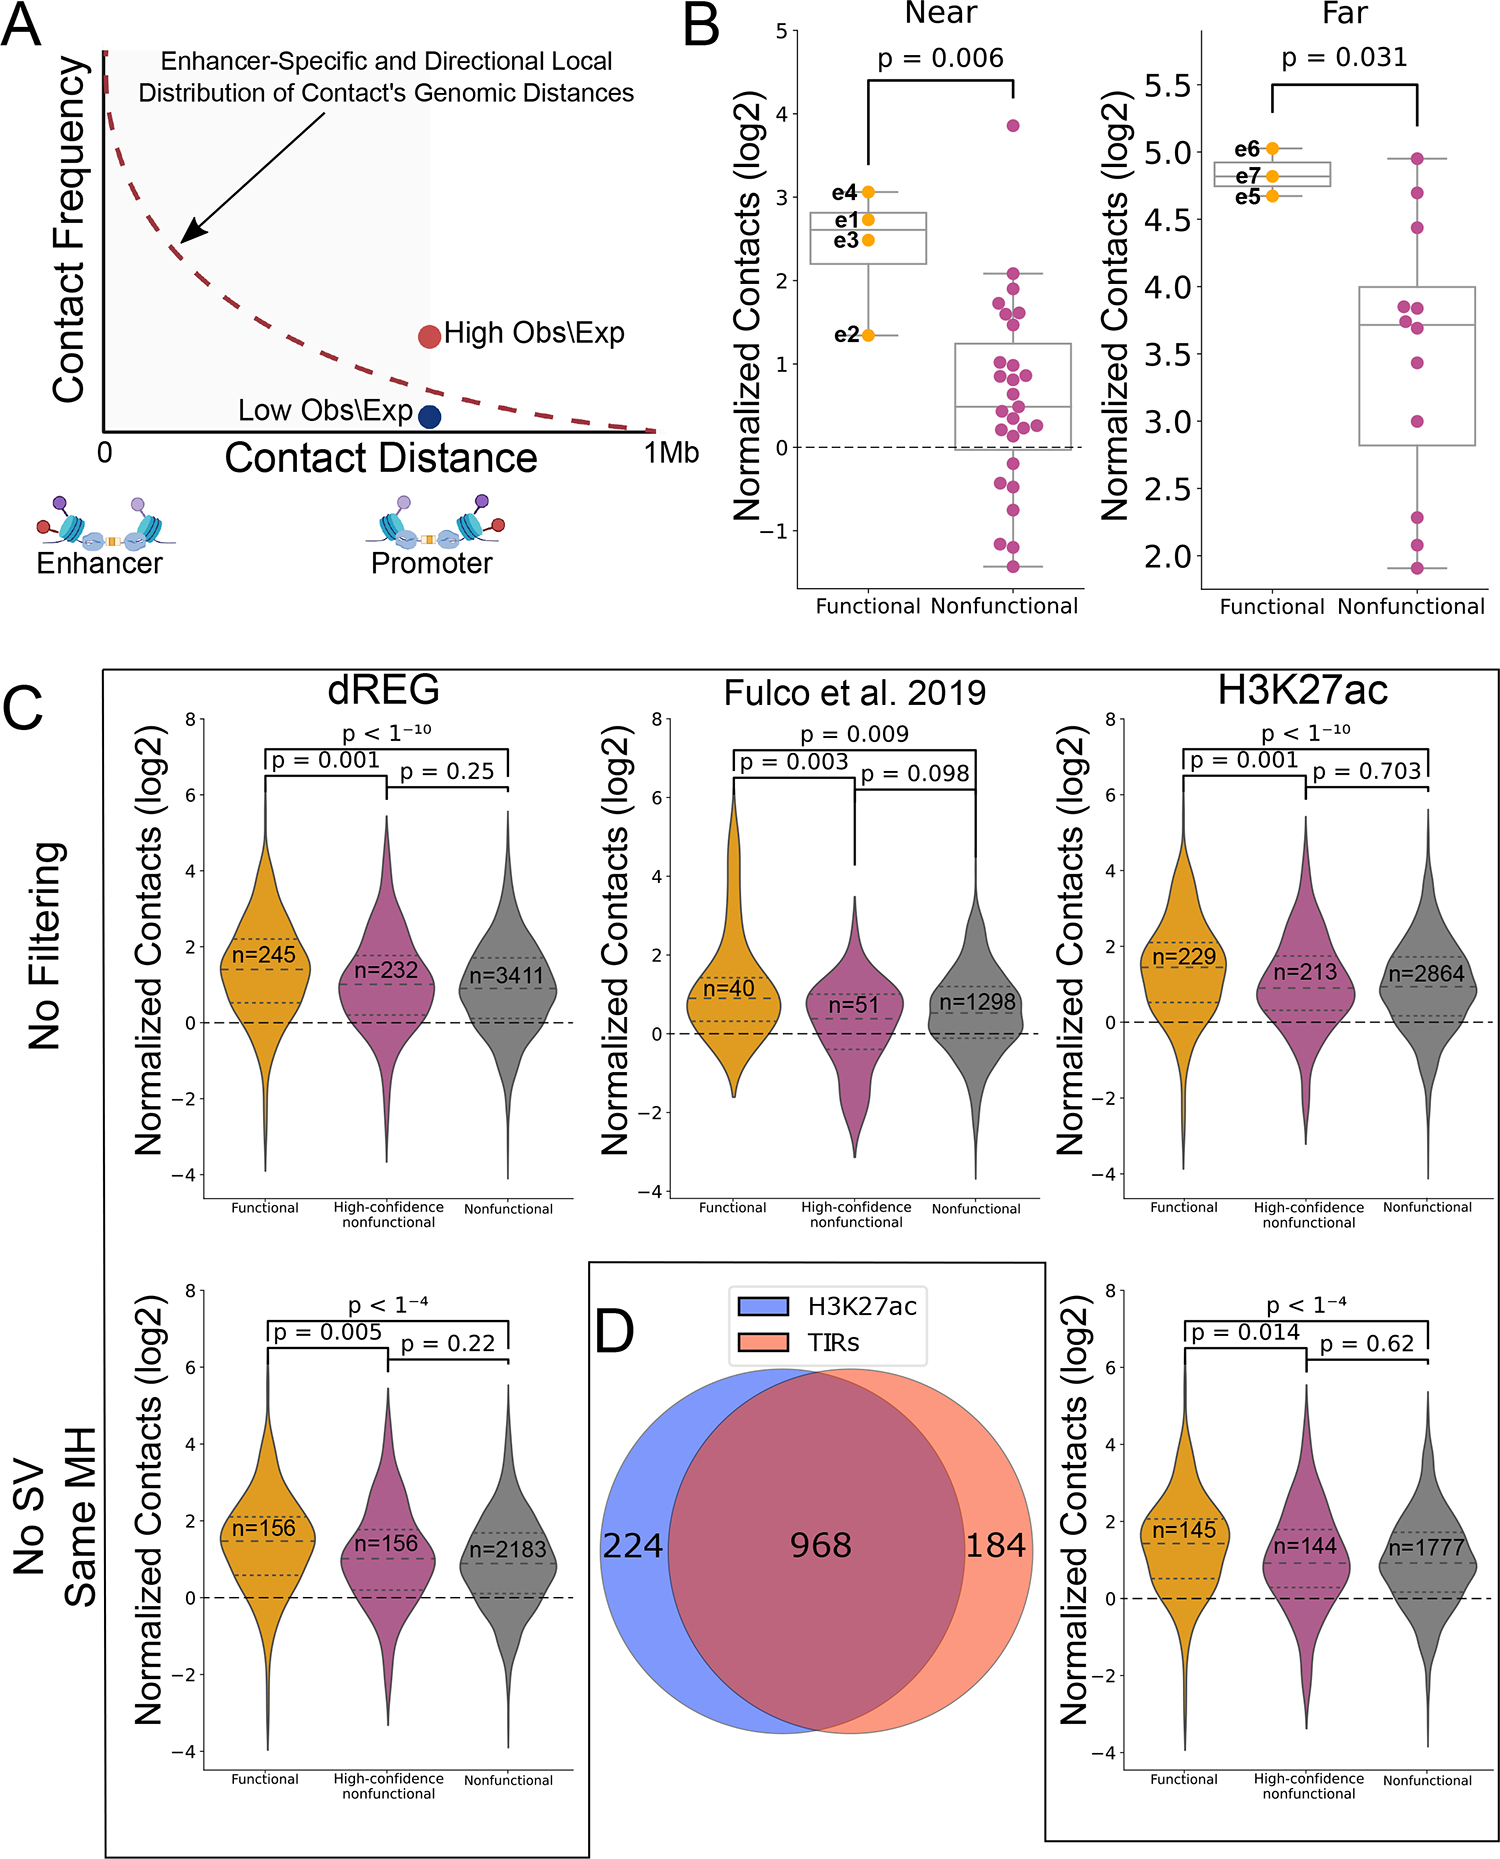
(A) Schematic representation of the LOWESS-based normalization for enhancer-promoter contacts. (B) Box and dot plots, similar to Fig. 1B, comparing the observed contact frequency relative to expected by a local distance-decay function of the validated functional enhancers in the MYC locus (functional pairs) compared to the rest of the dREG-detected TIRs in the TAD (nonfunctional pairs) with the MYC promoter. Here we divided the CRISPRi-tested TIRs to those that fall within the first 0.5Mb (near, functional: n=4, nonfunctional: n=27) or beyond 1.5Mb (far, functional: n=3, nonfunctional: n=12) within the TAD. For both boxplots, boxes show the median, and 25–75 inter quartile range (IQR) and the maximum length of the whiskers is 1.5 IQR. Two-sided Mann-Whitney p-values are indicated. (C) Violin plots comparing contact levels relative to expected by local distance-decay function of functional versus the nonfunctional enhancer-promoter pairs in the genome, before matching for enhancer-promoter distance, accessibility or target gene expression. On the left column, the results are based on dREG CRISPRi-targeted TIRs33 either before (top) and after (bottom) excluding pairs that do not fall into the same mega-haplotype (MH) or fall within known structural variants (SVs) in K562 cells86. The middle violin plot shows the same as the top-left one, but using data from a different CRISPRi dataset14. The two violin plots on the right show the same as the two on the left, using the same CRISPRi dataset33, but centering on H3K27ac overlapping ATAC-peaks instead of TIRs. Two-sided Mann-Whitney p-values are indicated. (D) Venn diagram showing the overlap between H3K27ac+ ATAC-peaks (H3K27ac)- and dREG TIRs-defined enhancers tested by CRISPRi in33.
Extended Data Figure 2. Matching possible confounders between CRISPRi functional and nonfunctional pairs.
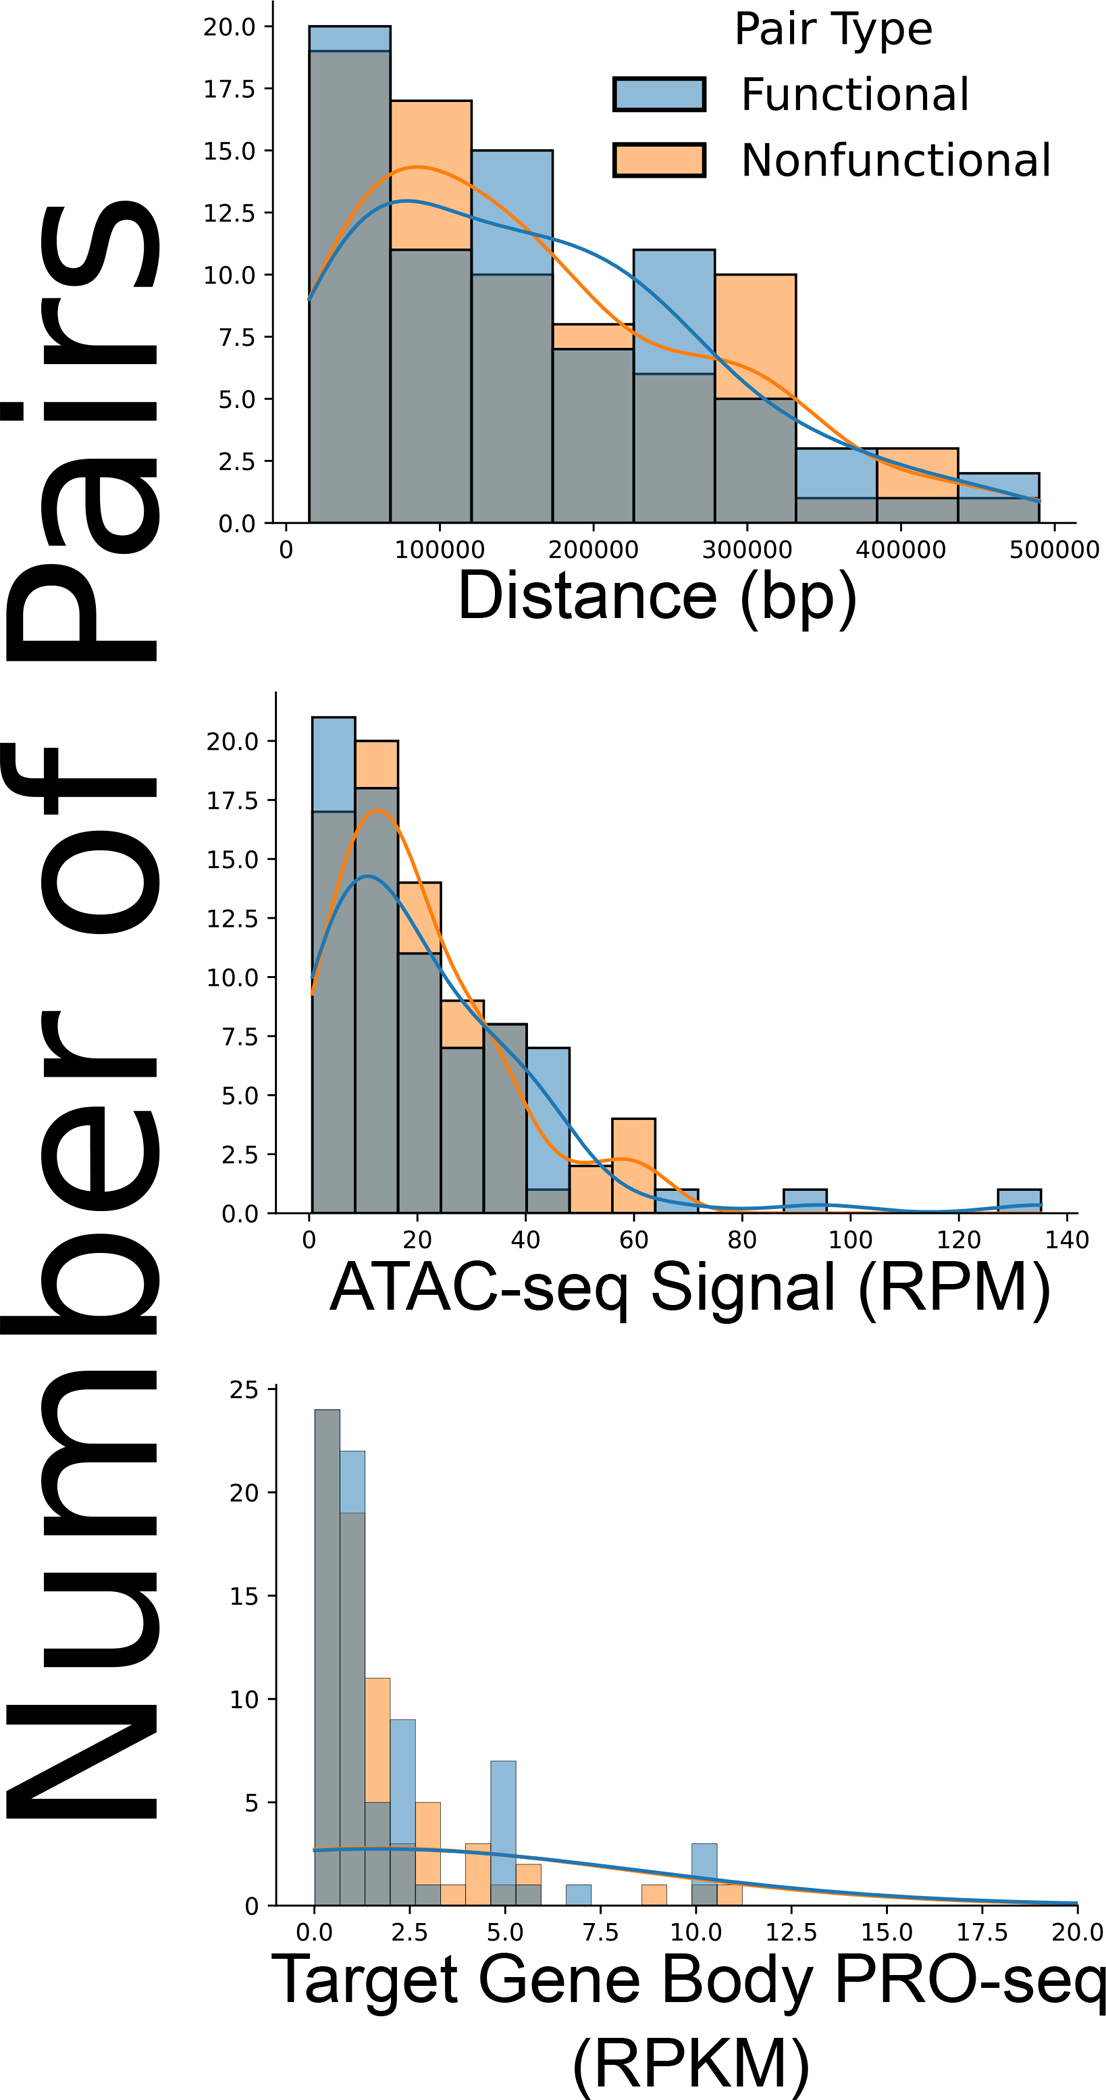
Histograms demonstrating the distribution of functional and high-confidence nonfunctional enhancer-promoter pairs in terms of enhancer-promoter genomic distance (top), accessibility by mean ATAC-seq signal (middle) and PRO-seq target gene transcription signal in reads per kilobase per million reads (RPKM) (bottom), after matching for these possible confounding factors.
Extended Data Figure 3. Functional constituent enhancers within super enhancers interact more with the target promoter.
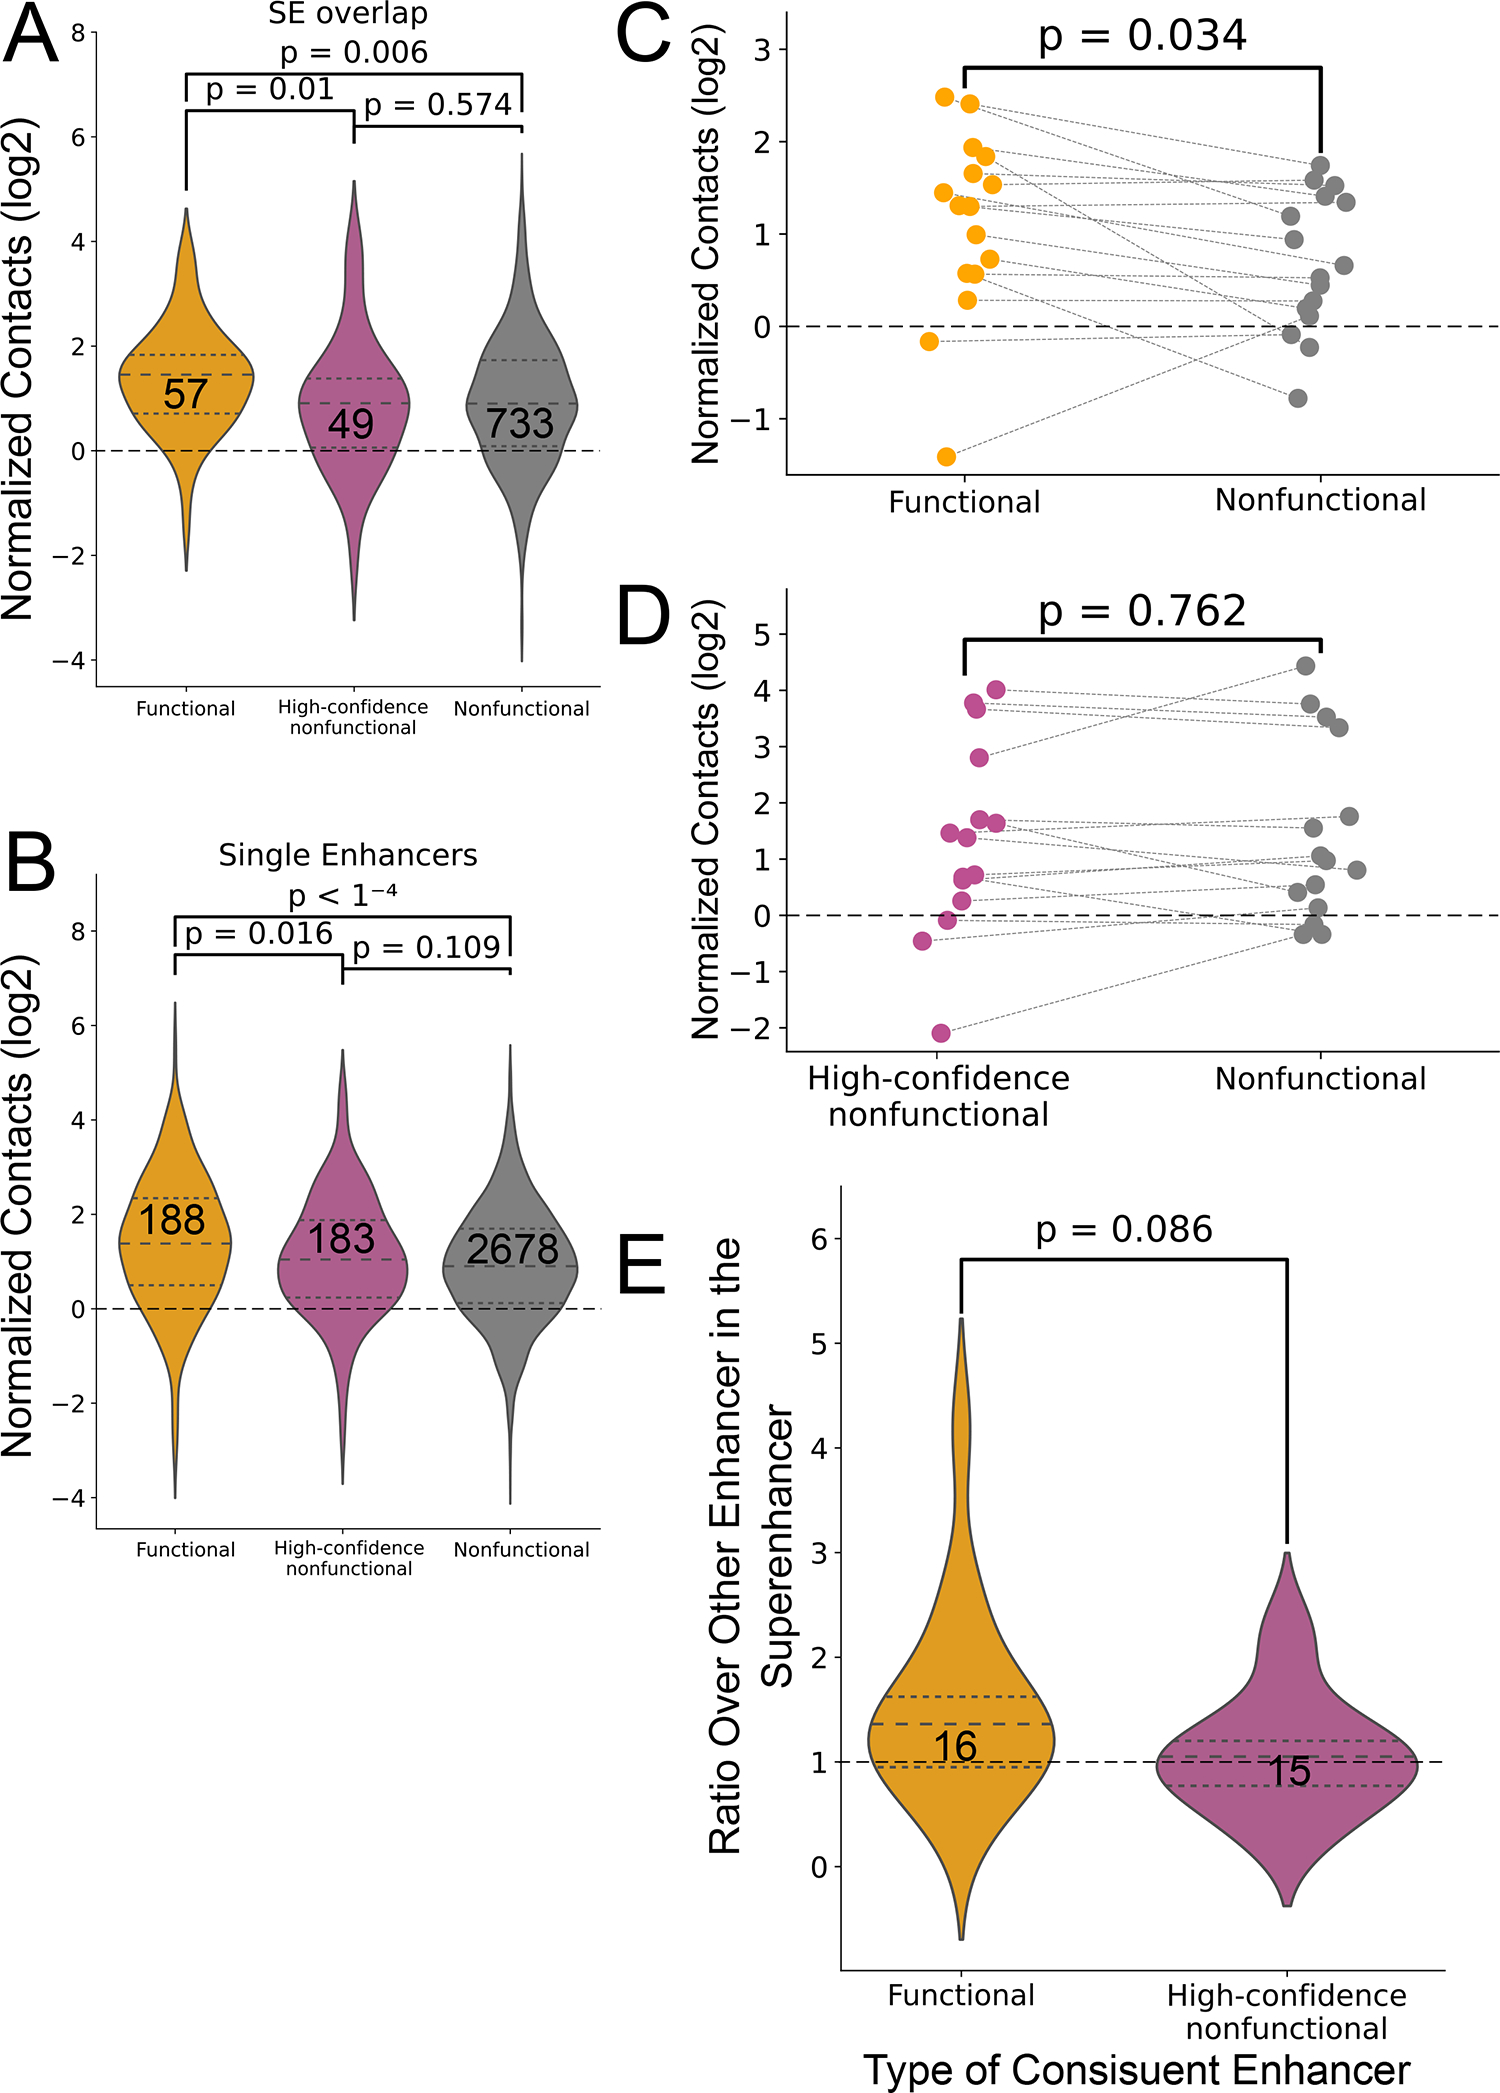
(A-B) Violin plots comparing contact levels relative to expected by local distance-decay function of functional versus the nonfunctional enhancer-promoter pairs in the genome, where the enhancers are mapped within (A) or outside (B) K562 defined super enhancers87. Two-sided Mann-Whitney p-values are indicated (C) Dot plot shows the log2 distribution of local genomic distance-normalized contact frequency between CRISPRi-defined functional constituent enhancers within 16 super enhancers compared to other constituent enhancers within these super enhancers. The dashed lines connect data points representing the median values of the same super enhancer. Two-sided Wilcoxon paired-test p-values is shown. (D) Dot plot shows the log2 distribution of local genomic distance-normalized contact frequency between CRISPRi-defined high-confidence nonfunctional constituent enhancers within 15 super enhancers compared to other constituent enhancers within these super enhancers. The dashed lines connect data points representing the median values of the same super enhancer. Two-sided Wilcoxon paired-test p-values is shown. (E) Violin plot shows the distribution of the ratios between the functional constituent enhancers to other constituent enhancers in the same super enhancer (yellow) and between high-confidence nonfunctional constituent enhancers to other constituent enhancers in the same super enhancer. Two-sided Mann-Whitney p-value is indicated.
Extended Data Figure 4. Micro-C 1D signal near TSSs genome-wide.
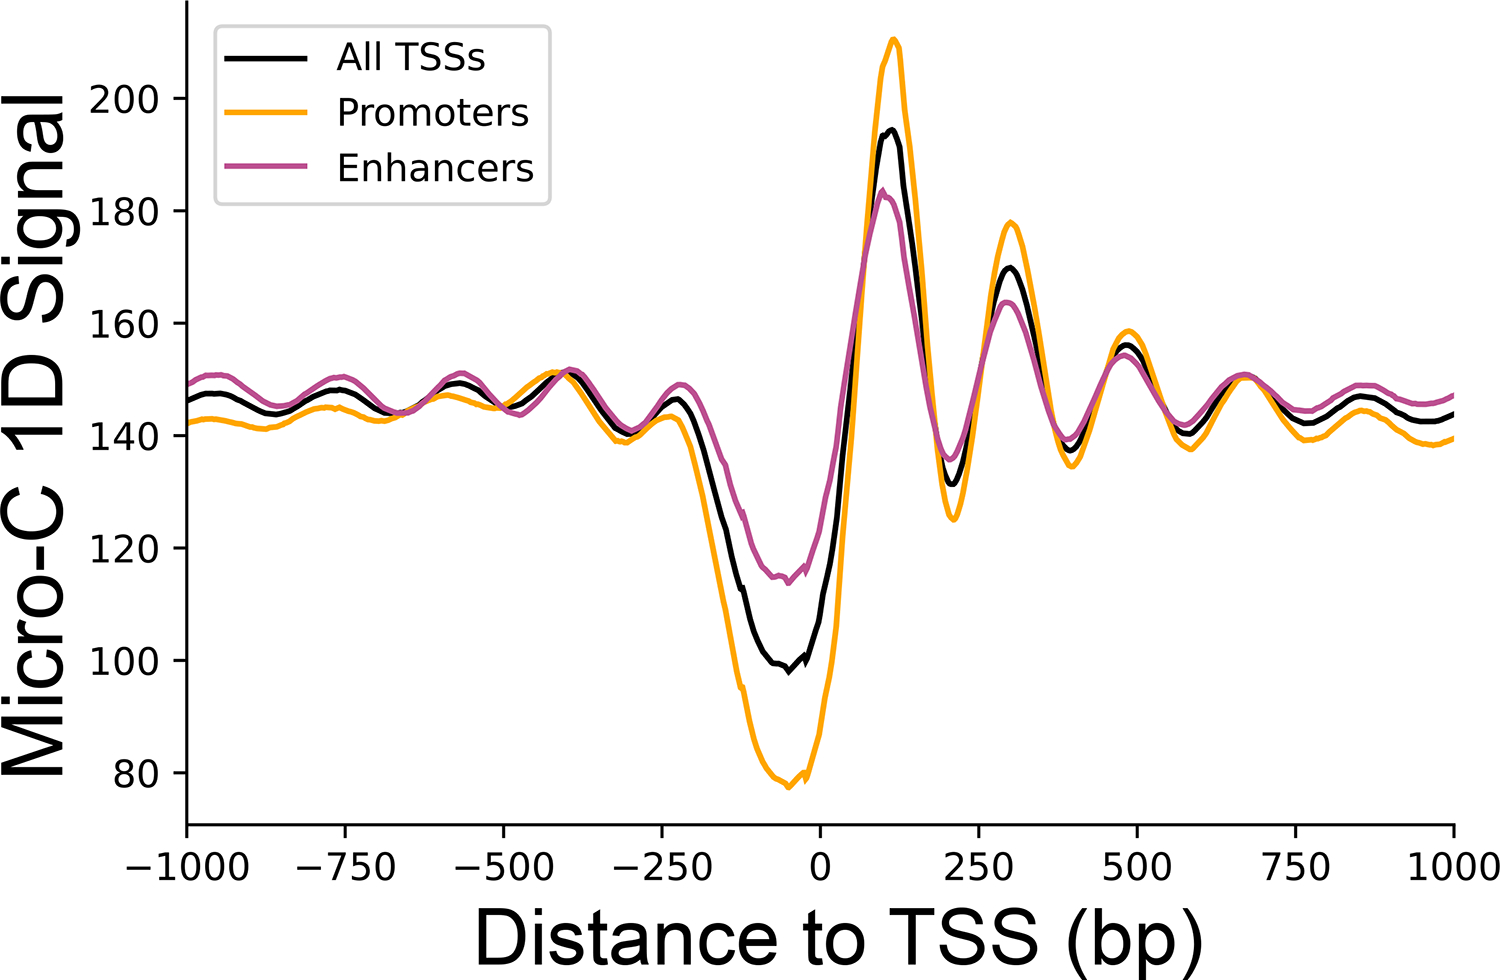
One dimensional contact signal for intra-chromosomal contacts with both sides having mapping quality (mapq) ≥ 30. Total median signal was smoothed using a sliding window of 100bp. Shown are signals around promoter TSSs (orange), enhancer TSSs (purple) and all TSSs genome-wide (black).
Extended Data Figure 5. Elaborated schematic representation of the APA method used to calculate 1D background-normalized changes in contacts between samples.
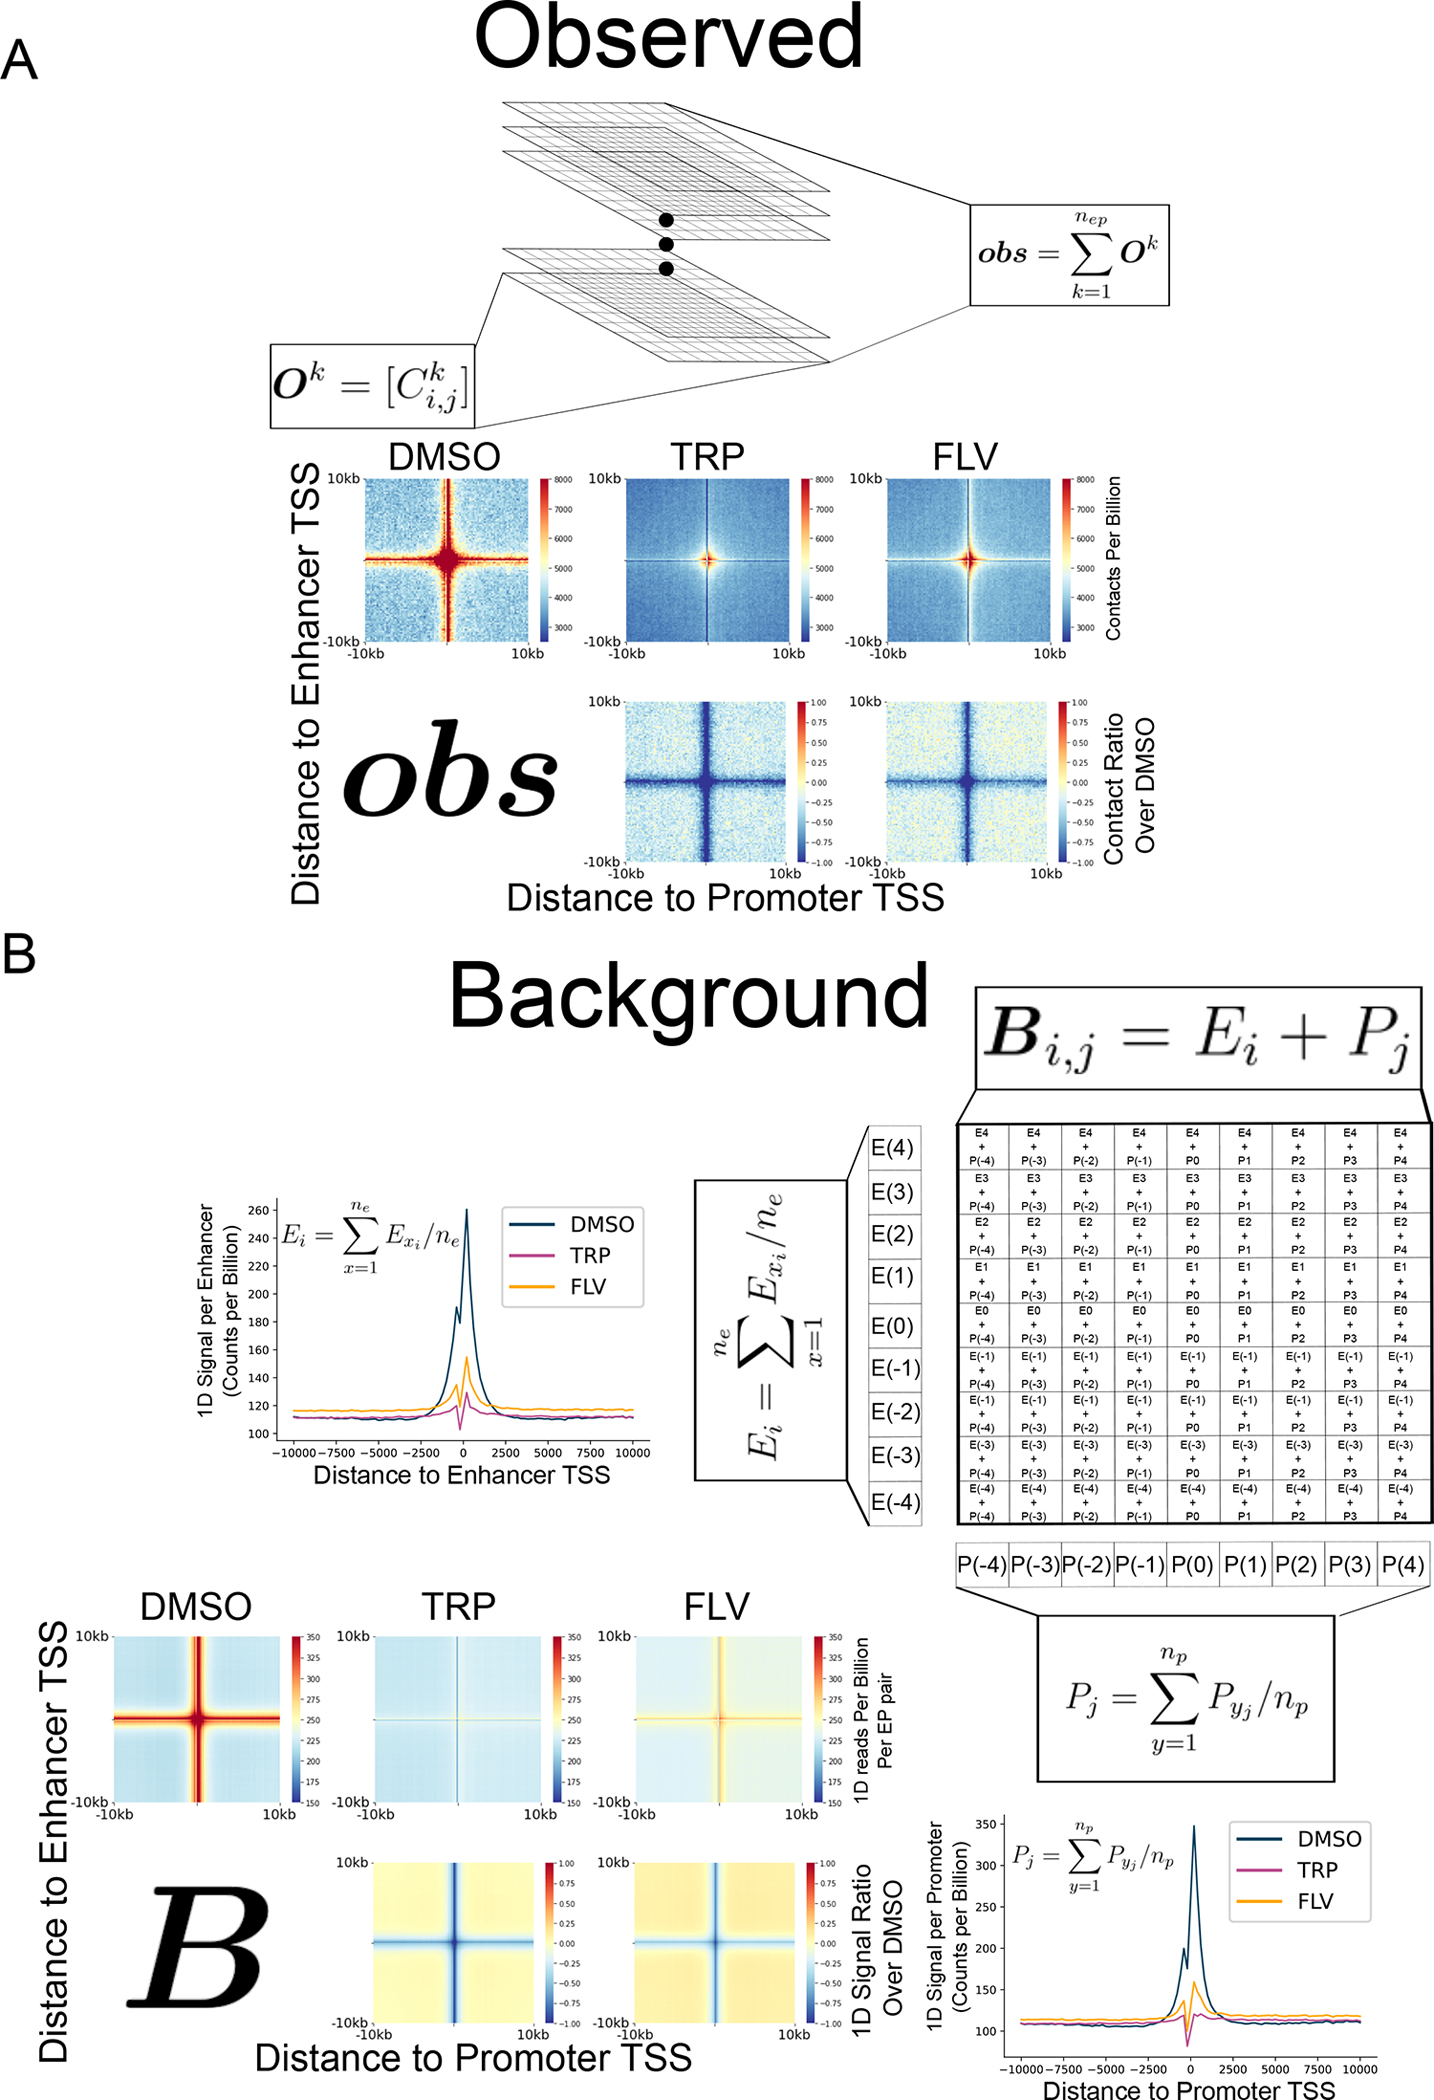
(A) To calculate the observed change in contacts, a matrix of contacts between each enhancer-promoter pair within the limited defined genomic distance range was calculated and then all of these matrices were summed to obtain the observed aggregated matrix. To get the the sequencing depth-normalized aggregated matrices were divided by the control matrix. Shown are also the depth-normalized aggregated matrices for the DMSO control, TRP- and FLV-treated mESCs, as well as the matrices for both treatments. (B) To calculate the 1D signal background matrices we calculated the average of 1D Micro-C signal vectors across cells around enhancers and promoters. Line plot representations of these vectors at 20 kb windows around enhancers and promoters, across cells of 200 bp are shown for both treatment conditions and DMSO control. The 1D background change matrix, B, was calculated by dividing the 1D signal background matrix of each treatment by the control. The 1D background matrices for both treatments and control samples as well as the matrices B for both treatments in mESCs are shown.
Extended Data Figure 6. Genomic distance has little effect on the shape of enhancer-promoter contacts fold change.
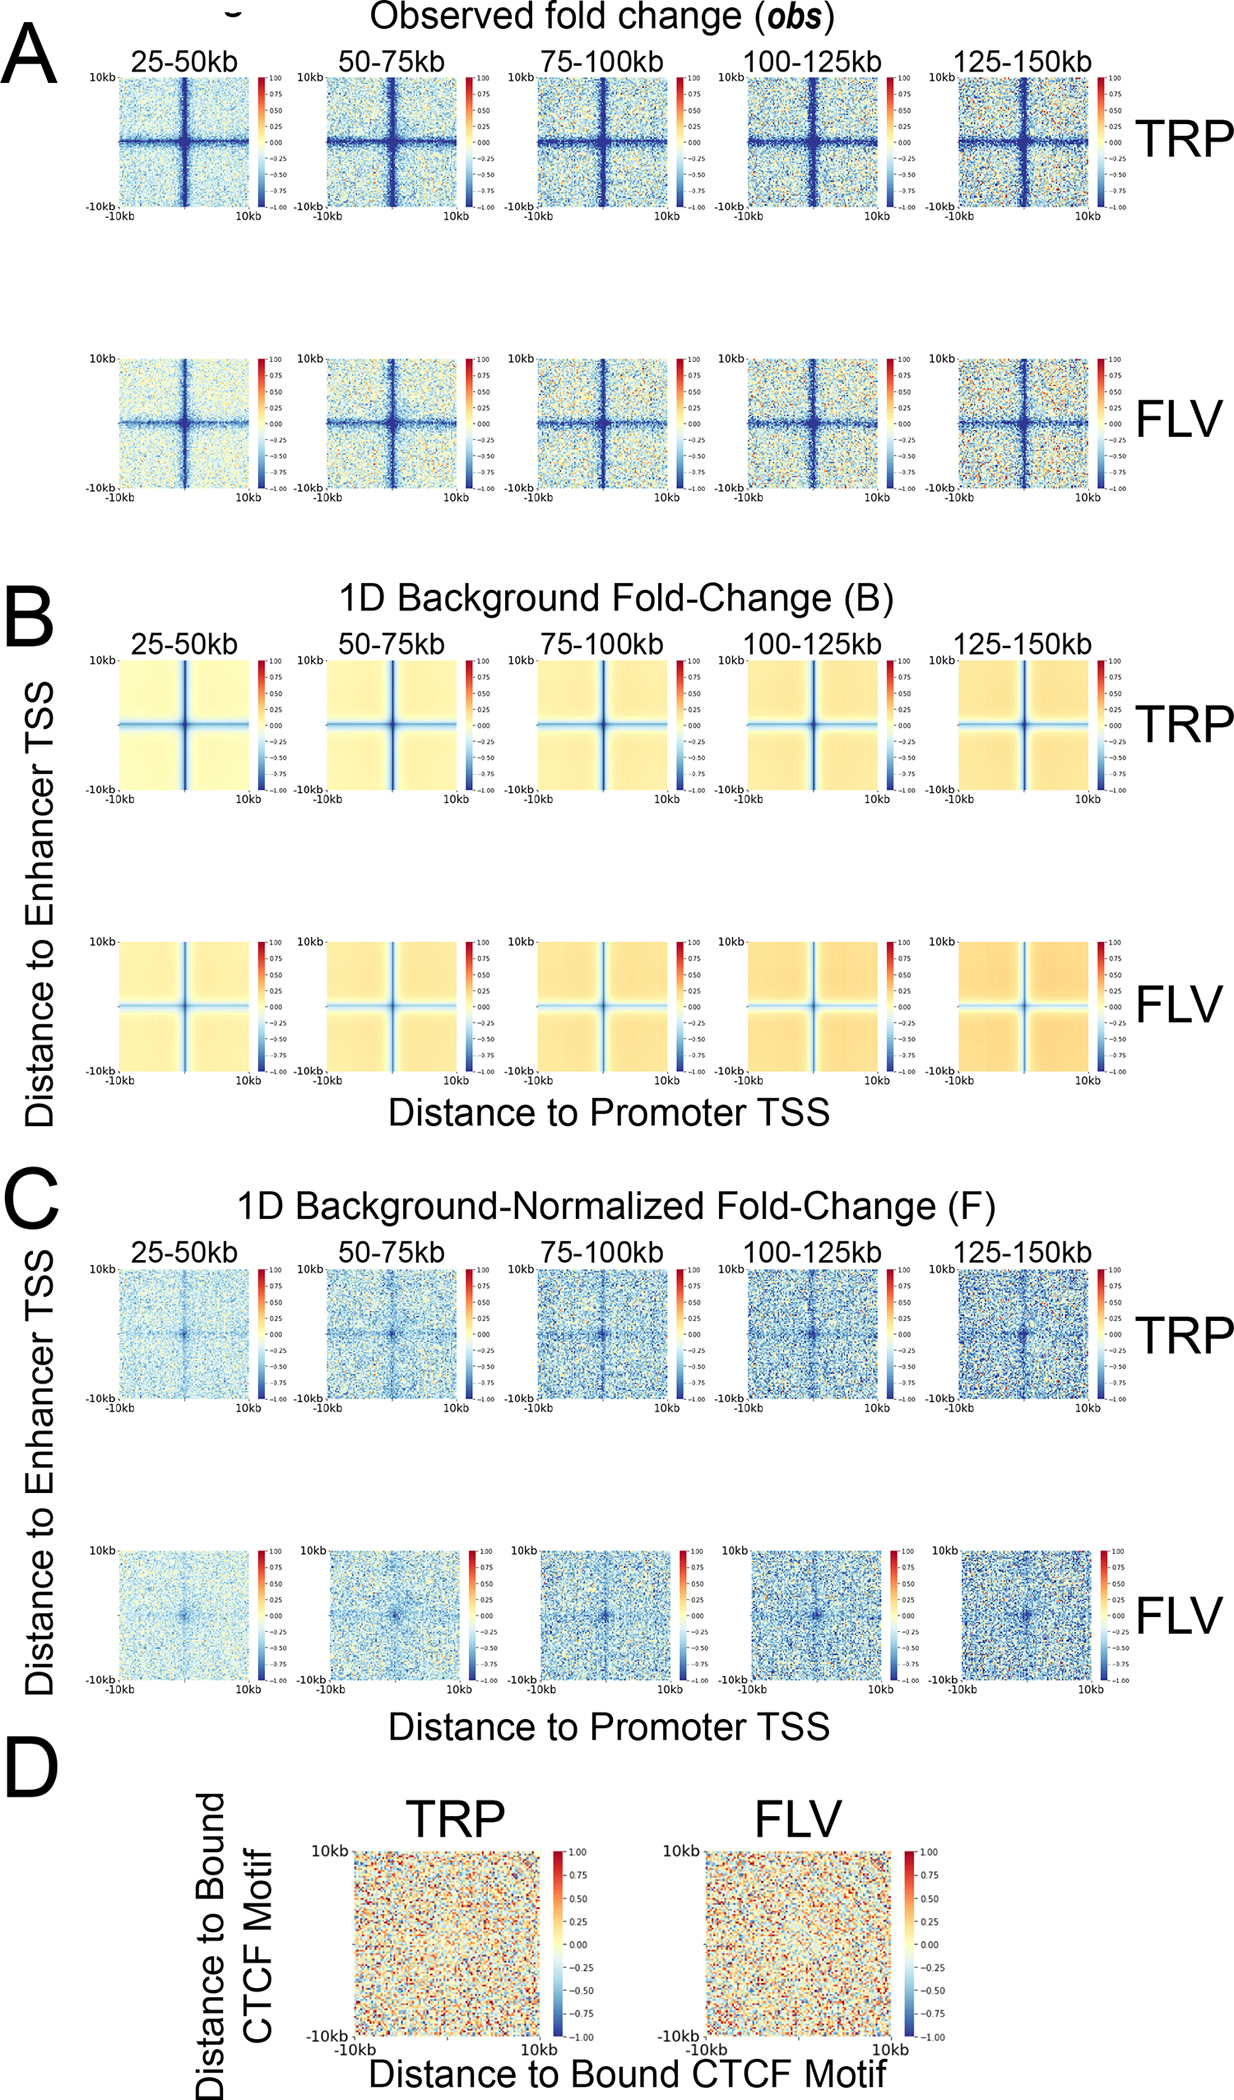
Matrices showing the observed fold-change (A) the 1D background signal fold change (B) and the 1D background-normalized enhancer-promoter fold change (C) following TRP and FLV treatment compared to the DMSO control at distance ranges starting at 25–50kb (leftmost column) and ending at 125–150kb (rightmost column). (D) Matrix showing the 1D background-normalized fold change of contacts between CTCF bound motifs following TRP and FLV treatments, compared with the DMSO control.
Extended Data Figure 7. Changes in enhancer-promoter contacts at the Pou5f1 locus following transcriptional inhibition.
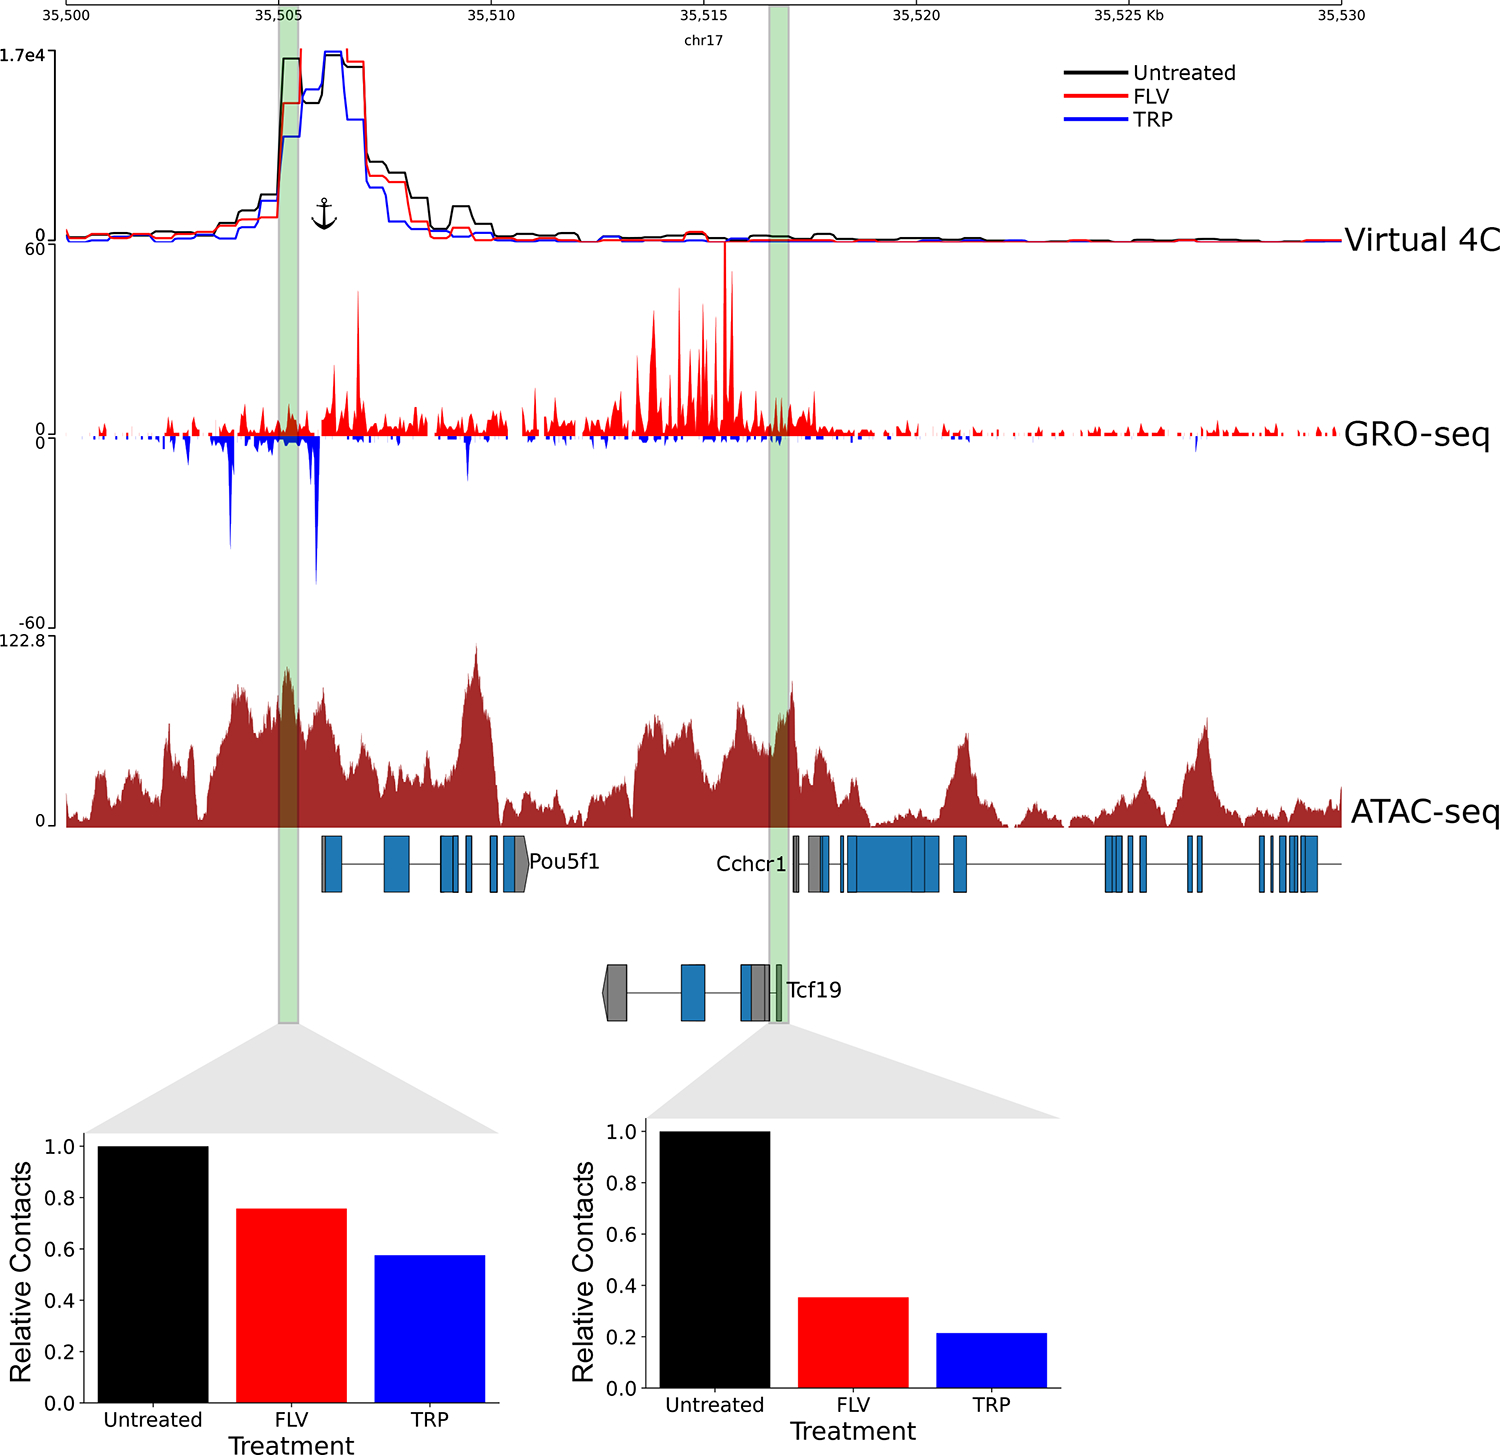
Virtual 4C signal showing Micro-C signal associated with Pou5f1 promoter from a ~1.3 billion contacts library of untreated mESC, as well as the FLV and TRP treated mESCs (~400 million contacts each). Shown are also GRO-seq and ATAC-seq signals. Two regulatory elements shown to induce Pou5f1 gene expression53 are shown in green and the relative contacts between these regulatory elements and the Pou5f1 promoter, relative to the untreated control, in each treatment are shown in the associated bar plots. The position of the anchor for the virtual 4C is shown.
Extended Data Figure 8. Distribution of fold change in gene body transcription for K562 and Jurkat upregulated genes.
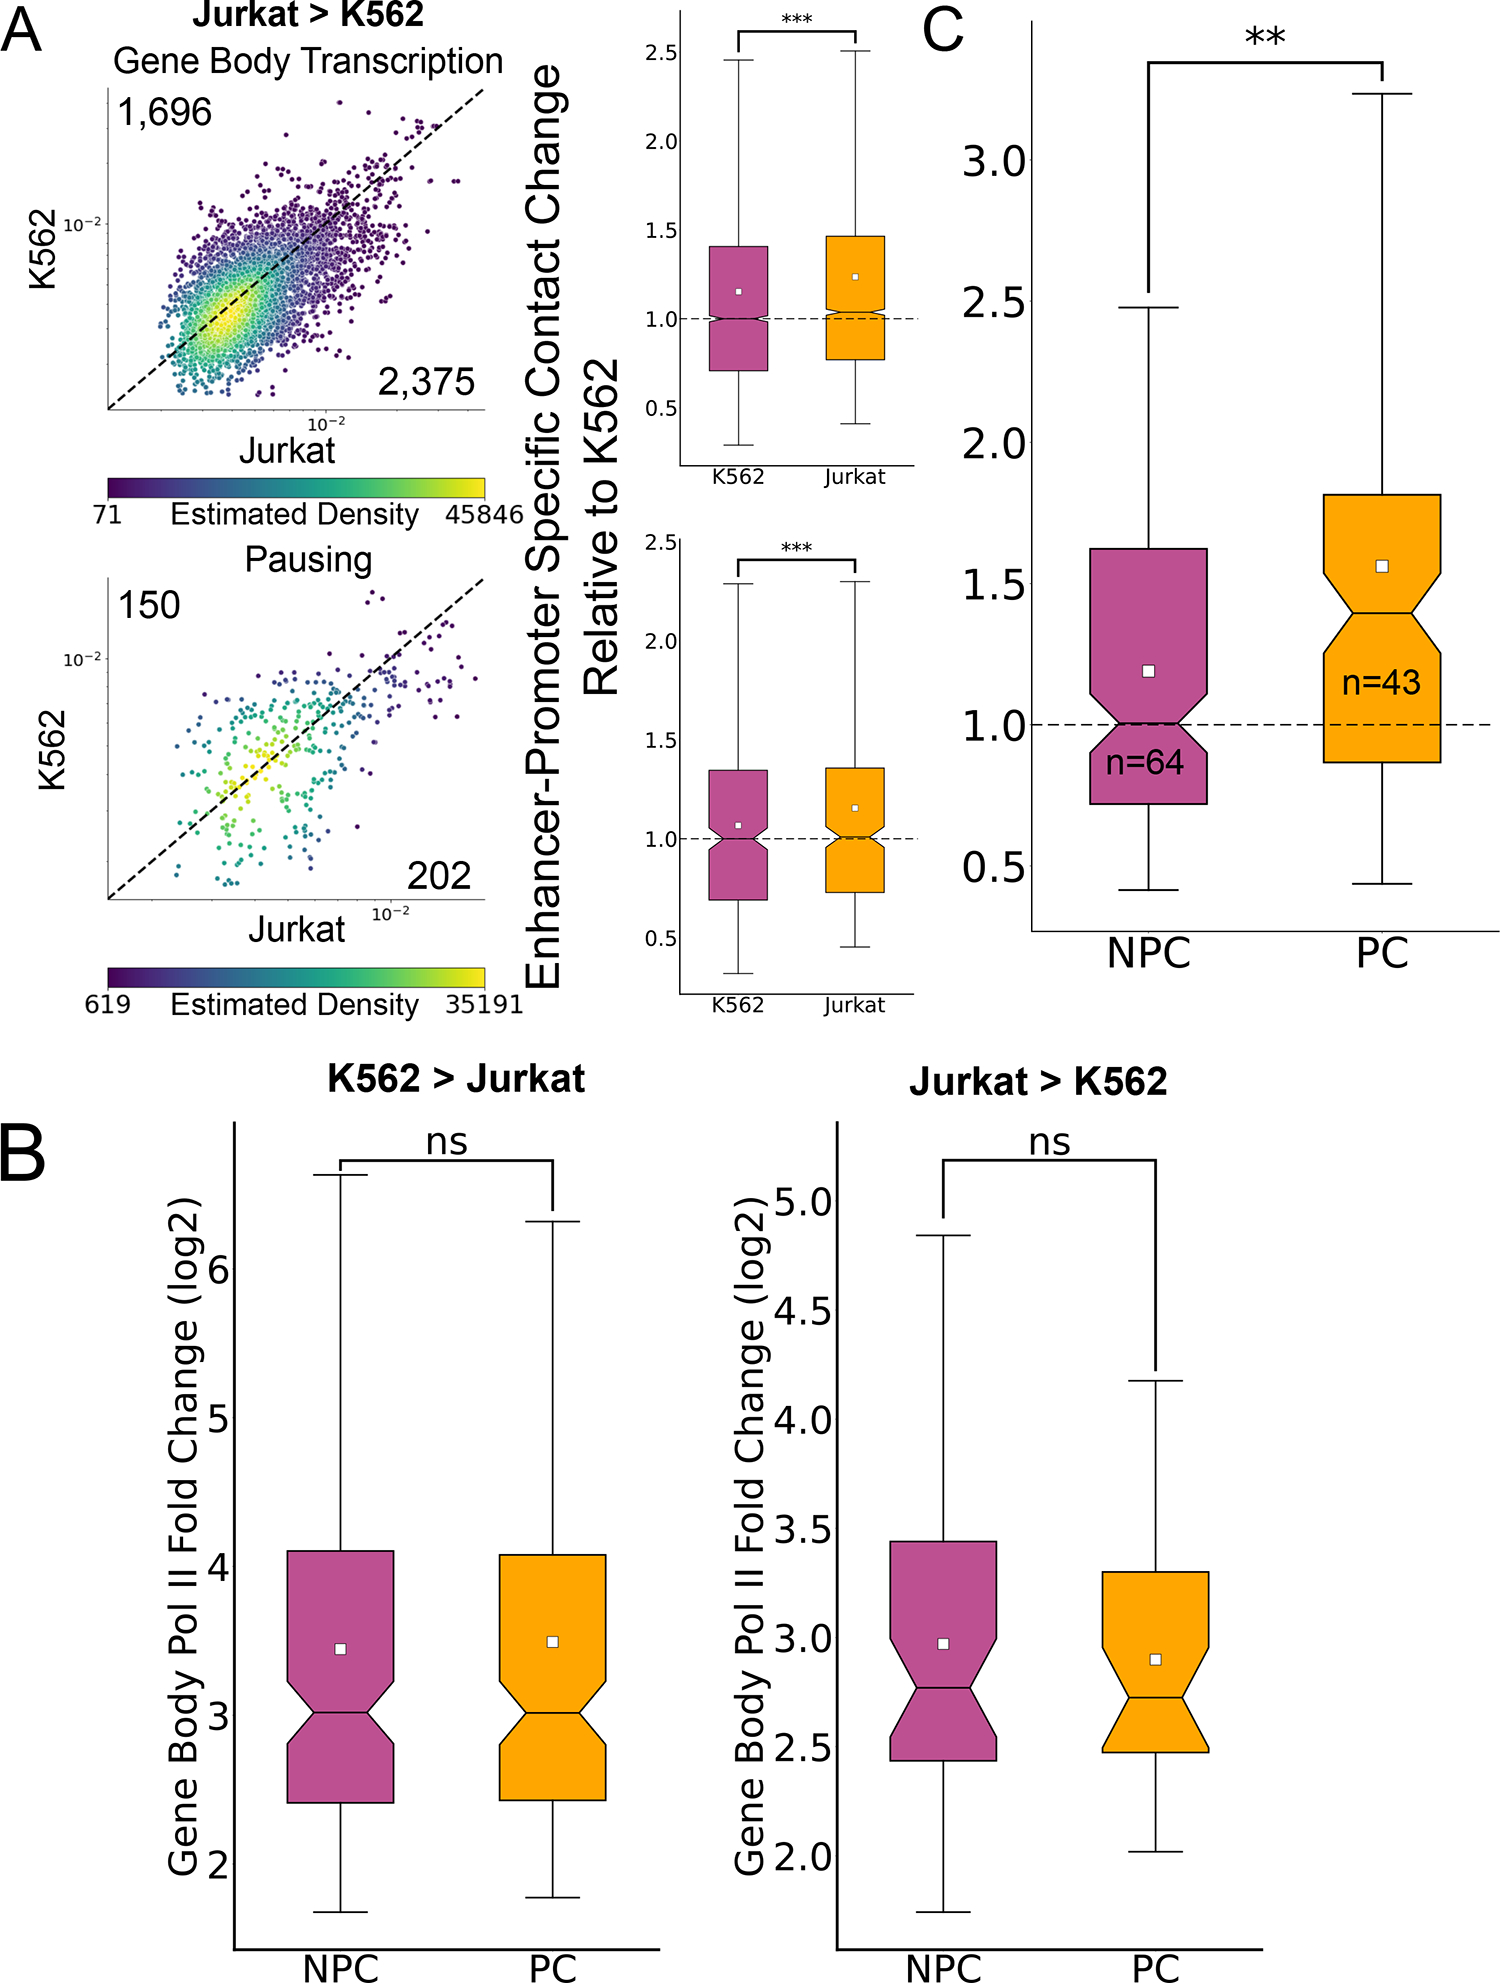
(A) Scatterplots where each dot represents a single enhancer-promoter pair where the promoter was associated with higher gene body transcription (top, n=4,071) and pausing signal (bottom, n=502) at Jurkat T cells compared to K562. The dots are colored based on the density of dots relative to their coordinates. The associated boxplots show the distribution of enhancer-promoter contacts relative to local background in both cell types, relative to the median ratio in K562. (*** Two-sided Wilcoxon signed-rank test p-value < 1X10−100). (B) Boxplots showing the distributions of fold change in gene body signal in genes with no associated paused Pol II change (NPC, K562>Jurkat: n=173, Jurkat>K562: n=64) and associated significant paused Pol II change (PC, K562>Jurkat: n=167, Jurkat>K562: n=43) (“ns” - Two-sided Mann-Whitney p-value > 0.5). (C) Boxplot depicting the relative increase of enhancer-promoter contacts associated with promoters of genes with upregulated gene body transcription in Jurkat T-cells with a corresponding significant increase in pausing signal (pause change – PC, n=43) and without a change in pausing signal (no pause change – NPC, n=64) (** Two-sided Mann-Whitney p-value < 1X10⁻¹⁰). For all boxplots, boxes show the median, and 25–75 inter quartile range (IQR) and the maximum length of the whiskers is 1.5 IQR.
Extended Data Figure 9. Changes in enhance-promoter contacts architecture following NELFB depletion.
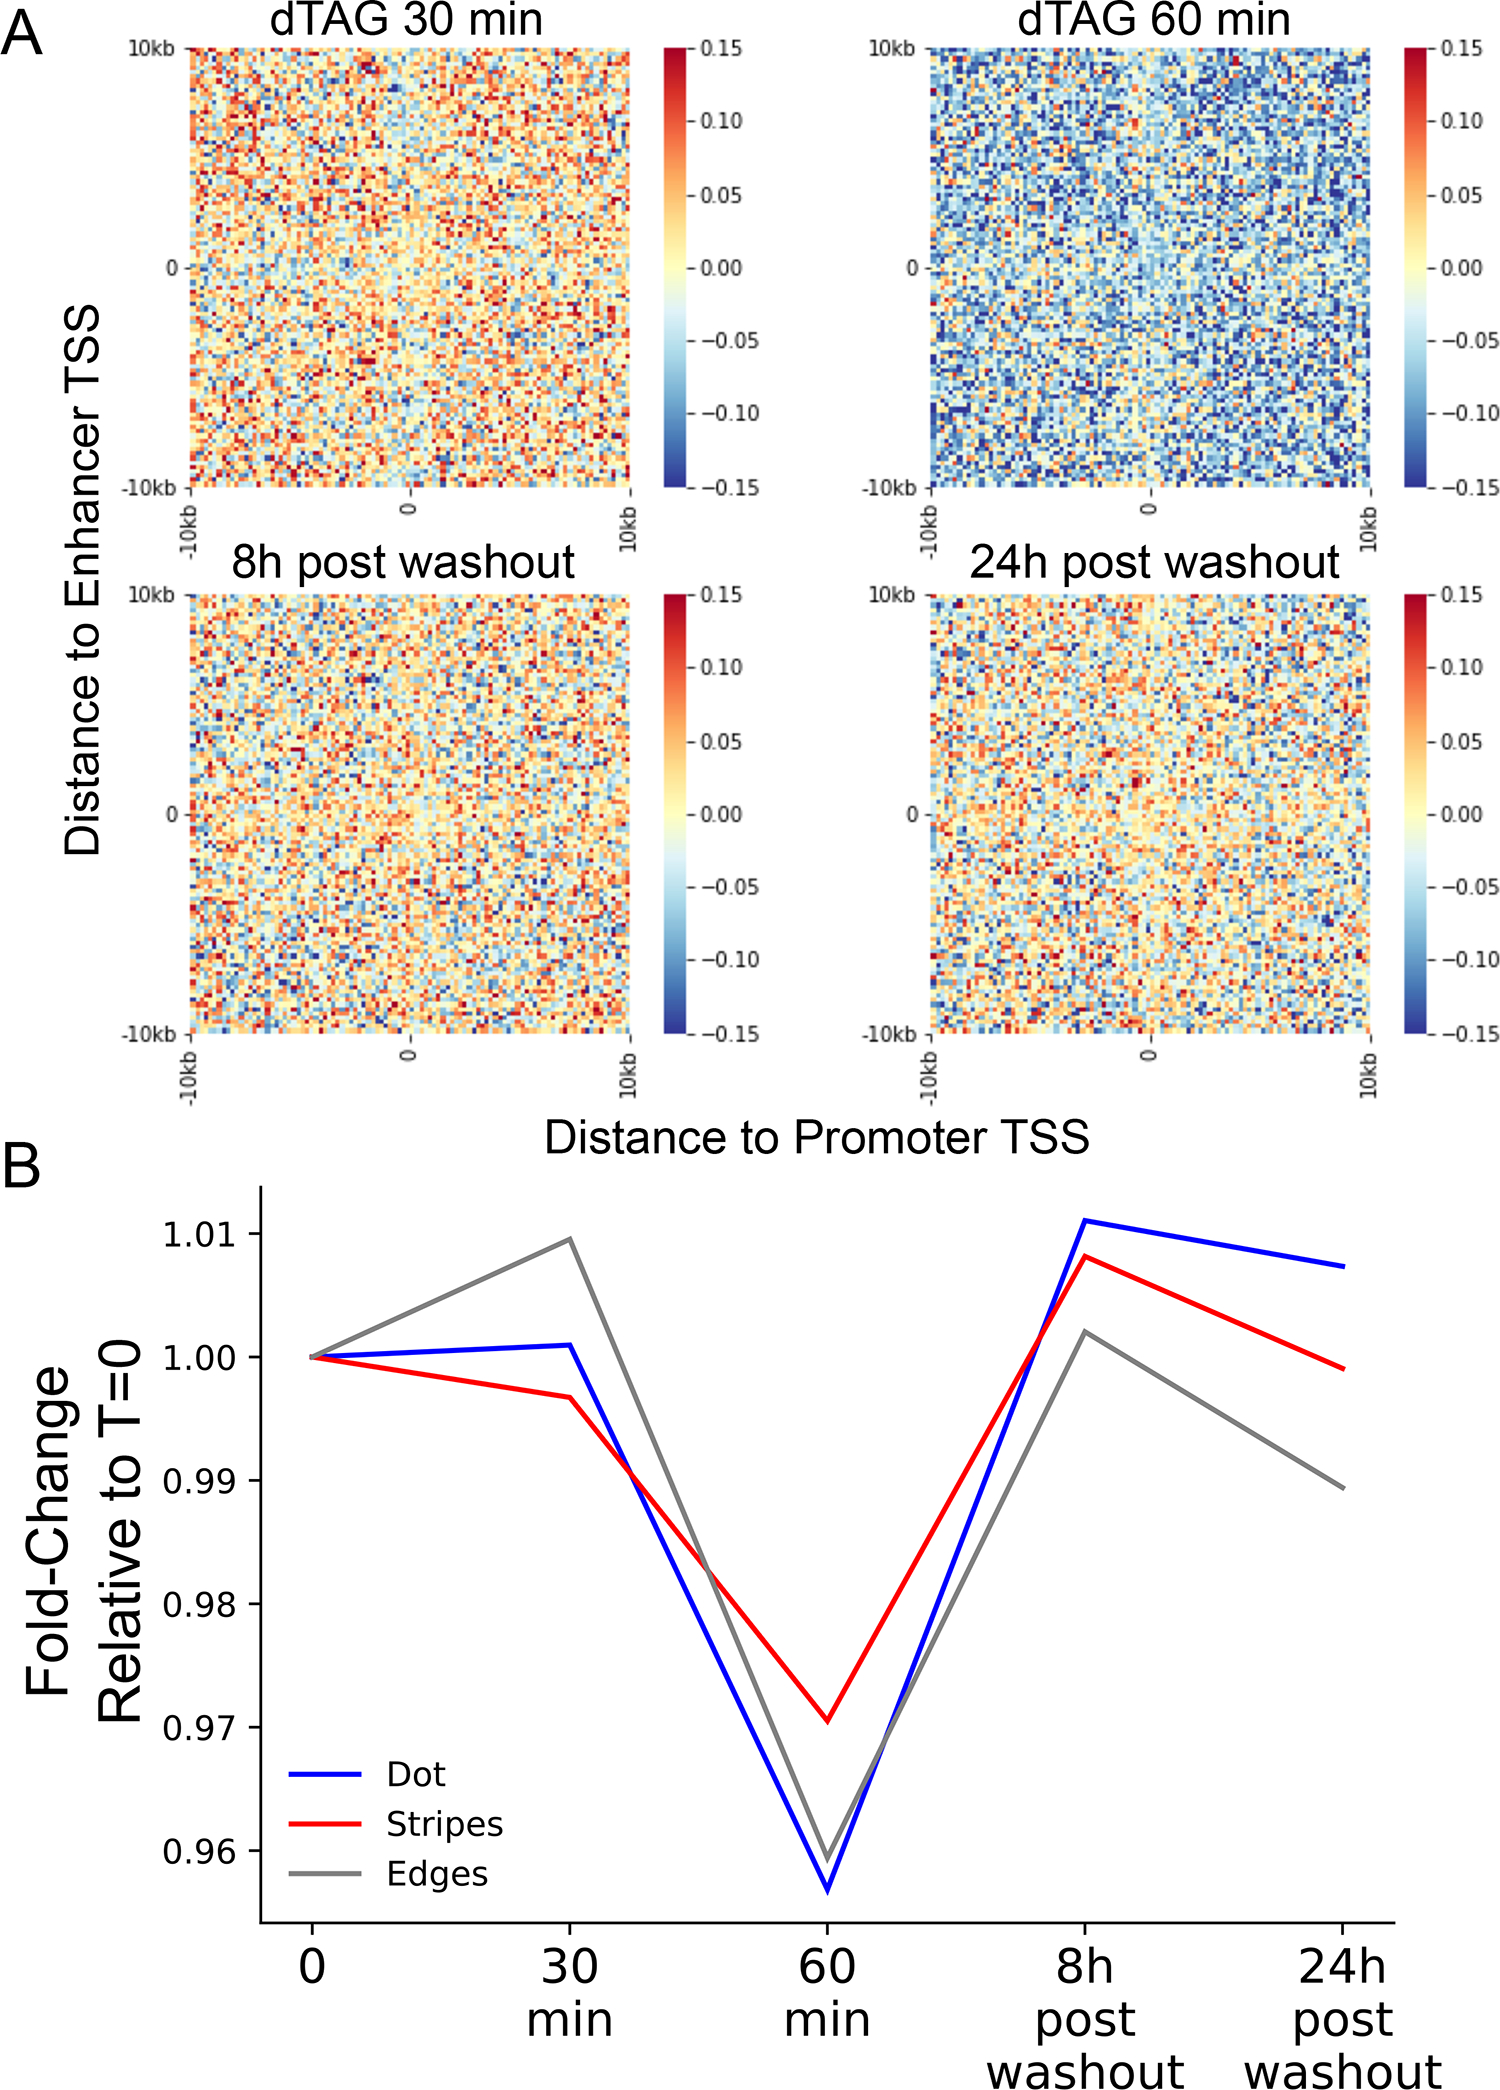
(A) APA heatmaps of the 1D change-normalized contact change (log2) between enhancer and promoter regions at 20kb around TSSs. Pixel size is 200 bp square. The APA heatmaps are oriented such that the gene TSS points to the right and the dominant TSS of the enhancer points upwards. (B) Line plot of the median fold changes at the dot (blue), stripes (red) and edges (gray) relative to T=0 at the different time points of dTAG treatments and following dTAG washout.
Extended Data Figure 10. Changes in ZRS-Shh contacts following NELFB depletion.
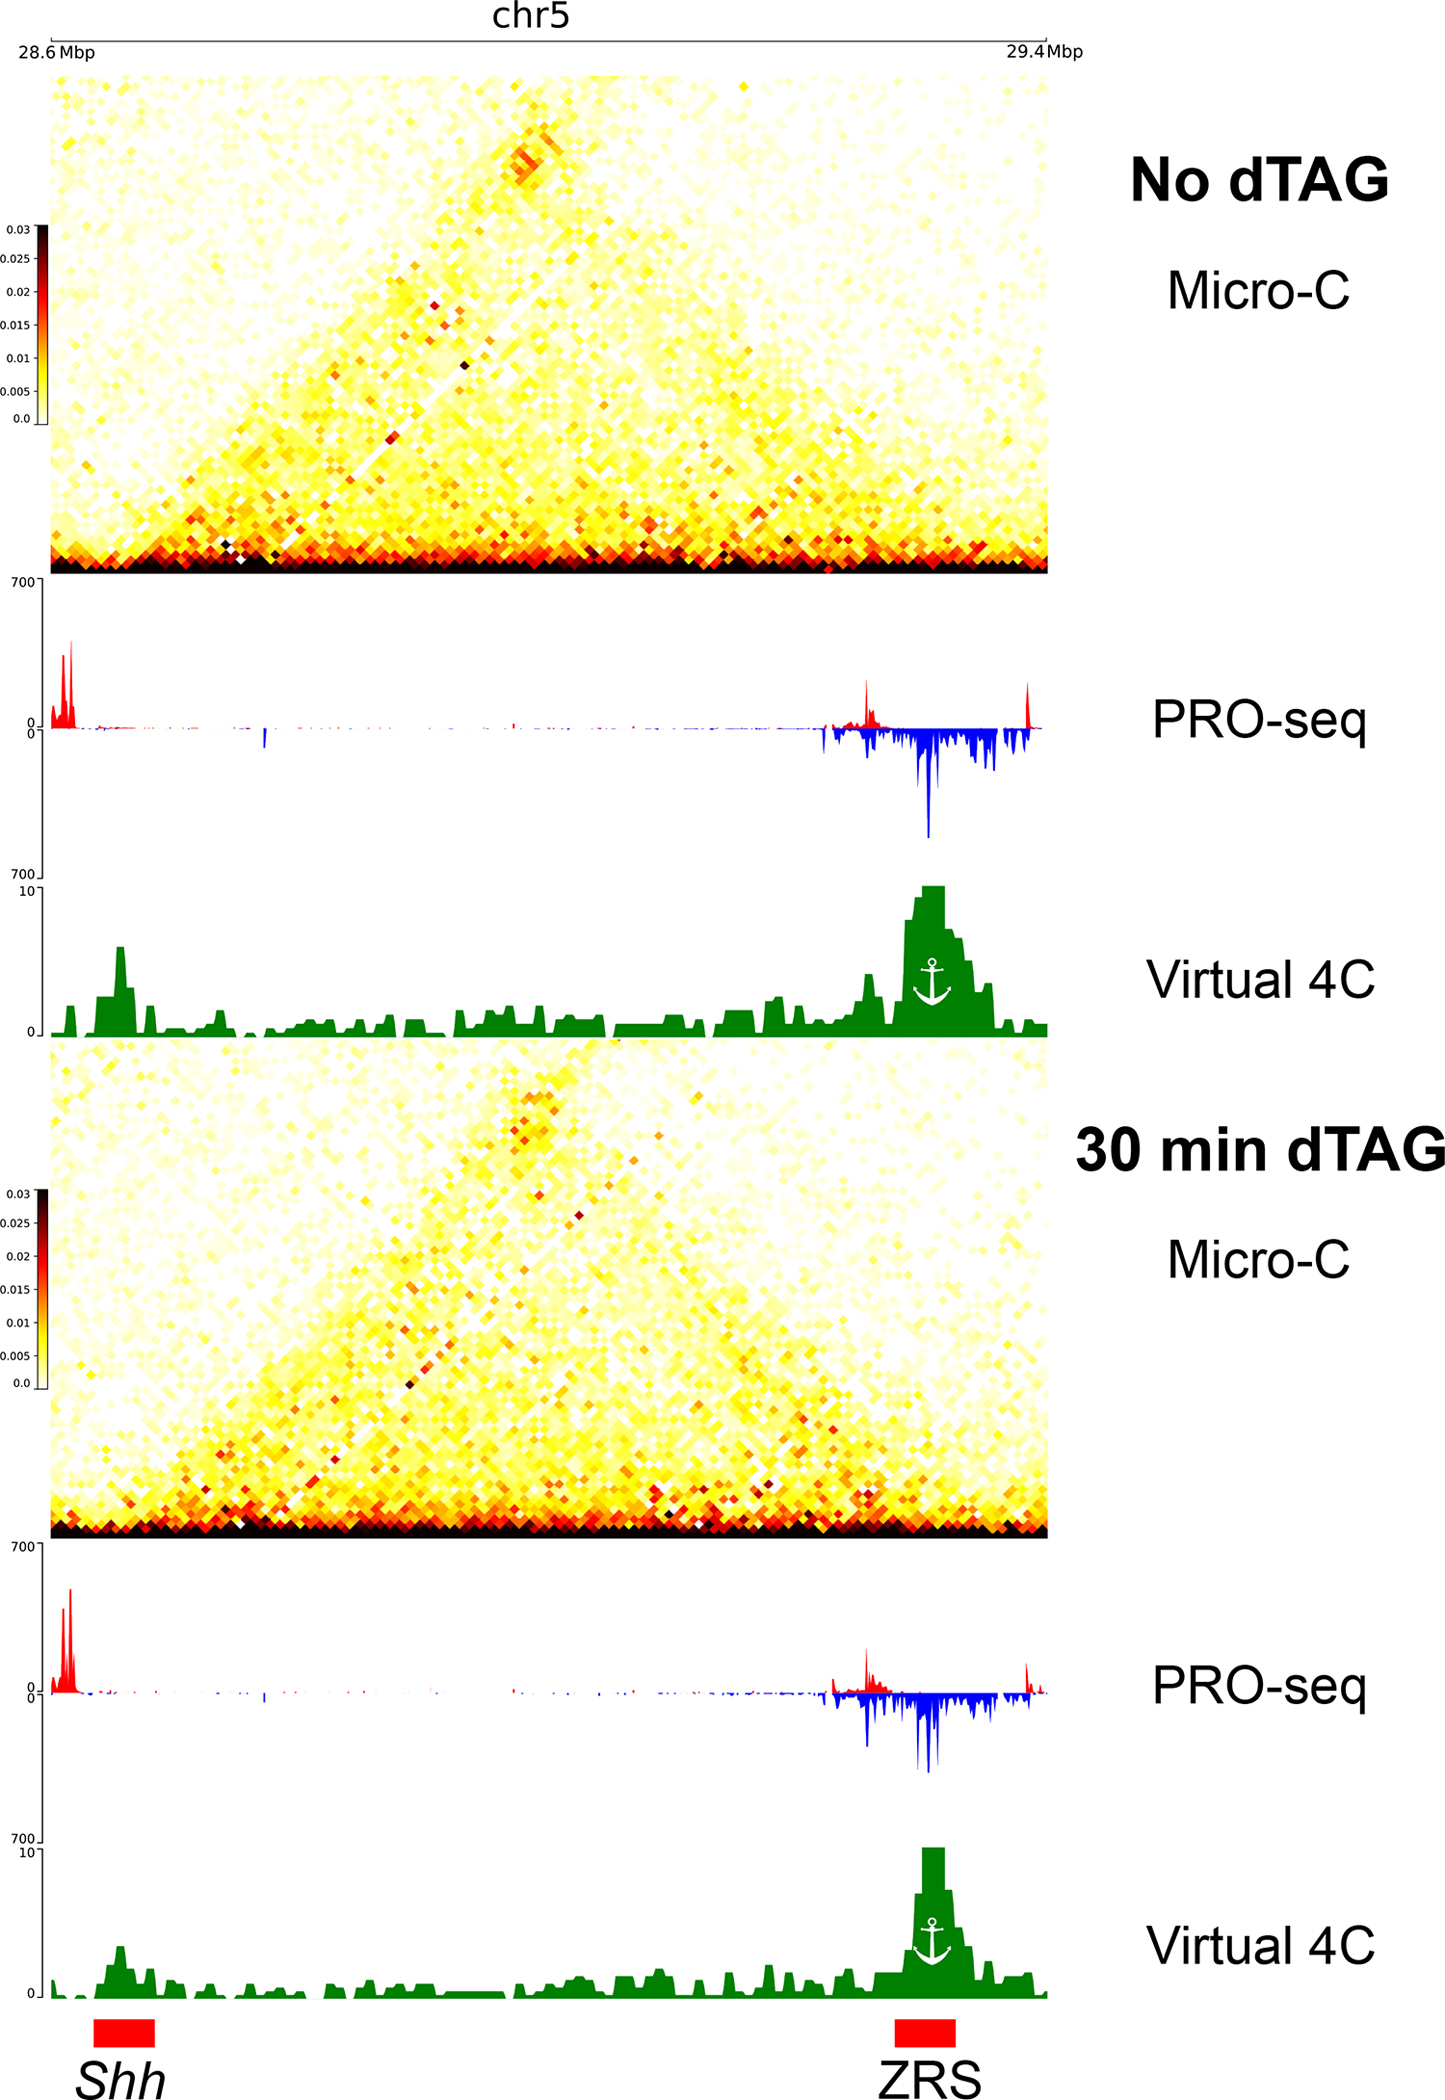
Micro-C contact maps in 10kb resolution along with the associated virtual 4C signal and PRO-seq signal in mESCs not treated (top) or treated (bottom) with the dTAG ligand for 30 minutes to degrade NELFB. The positions of the ZRS enhancer and the Shh promoter are indicated in red rectangles.
Supplementary Material
Acknowledgements
We thank E. Apostolou and members of her lab for commenting on a manuscript draft as well as members of the Danko, Lis, and Yu labs for valuable discussions and suggestions throughout the life of this project. Work in this publication was supported by R01-HG010346 and R01-HG009309 (NHGRI) to CGD. AA is supported by the NIH (T32GM007739, F30HD103398). Work in AKH’s lab is supported by the NIH (R01HD094868, R01DK127821, R01HD086478, and P30CA008748). The content is solely the responsibility of the authors and does not necessarily represent the official views of the US National Institutes of Health. Some of the figures in this manuscript were created using BioRender.
Footnotes
Ethics declarations
Competing interests
The authors declare no competing interests.
Code availability
All data normalization and visualization code is available at https://github.com/Danko-Lab/E-P_contacts100.
Data availability
Micro-C data generated in this study were deposited in the Gene Expression Omnibus (GEO) database under accession number GSE206133. H3K27ac and H3K4me2 ChIP-seq data from K562 cells were downloaded from GSE163043. K562 data for ATAC-seq (ENCSR868FGK), CTCF ChIP-seq (ENCSR447BSF), MNase-seq (ENCSR000CXQ) and NELFE ChIP-seq (ENCSR000DOF) were downloaded from ENCODE. DMSO, TRP and FLV treated mESCs Micro-C data28 were downloaded from GSE130275. PRO-seq data36,38 for Jurkat T-cells were downloaded from GSE66031 and for K562 from GSE60455. PRO-seq data for mECSs harboring a homozygous endogenous NELFB-FKBP12F36V fusion protein, treated and untreated with dTAG-1384, were downloaded from GSE196653. GRO-seq data for mESCs56,94 were downloaded from GSE43390 and GSE48895. Positions for human (hg38) and mouse (mm10) CAGE peaks were downloaded from the FANTOM5 database (https://fantom.gsc.riken.jp/5/).
References
- 1.Levine M & Tjian R Transcription regulation and animal diversity. Nature 424, 147–151 (2003). [DOI] [PubMed] [Google Scholar]
- 2.Banerji J, Rusconi S & Schaffner W Expression of a beta-globin gene is enhanced by remote SV40 DNA sequences. Cell 27, 299–308 (1981). [DOI] [PubMed] [Google Scholar]
- 3.Gruss P, Dhar R & Khoury G Simian virus 40 tandem repeated sequences as an element of the early promoter. Proc. Natl. Acad. Sci. U. S. A. 78, 943–947 (1981). [DOI] [PMC free article] [PubMed] [Google Scholar]
- 4.Benoist C & Chambon P In vivo sequence requirements of the SV40 early promoter region. Nature 290, 304–310 (1981). [DOI] [PubMed] [Google Scholar]
- 5.Choi OR & Engel JD Developmental regulation of beta-globin gene switching. Cell 55, 17–26 (1988). [DOI] [PubMed] [Google Scholar]
- 6.Schoenfelder S & Fraser P Long-range enhancer-promoter contacts in gene expression control. Nat. Rev. Genet. 20, 437–455 (2019). [DOI] [PubMed] [Google Scholar]
- 7.Robson MI, Ringel AR & Mundlos S Regulatory Landscaping: How Enhancer-Promoter Communication Is Sculpted in 3D. Mol. Cell 74, 1110–1122 (2019). [DOI] [PubMed] [Google Scholar]
- 8.Hamamoto K & Fukaya T Molecular architecture of enhancer-promoter interaction. Curr. Opin. Cell Biol. 74, 62–70 (2022). [DOI] [PubMed] [Google Scholar]
- 9.Kagey MH et al. Mediator and cohesin connect gene expression and chromatin architecture. Nature 467, 430–435 (2010). [DOI] [PMC free article] [PubMed] [Google Scholar]
- 10.Rao SSP et al. A 3D map of the human genome at kilobase resolution reveals principles of chromatin looping. Cell 159, 1665–1680 (2014). [DOI] [PMC free article] [PubMed] [Google Scholar]
- 11.Krietenstein N & Rando OJ Mammalian Micro-C-XLMicro-C-XL. in Chromatin: Methods and Protocols (eds. Horsfield J & Marsman J) 321–332 (Springer US, 2022). [Google Scholar]
- 12.Fudenberg G & Imakaev M FISH-ing for captured contacts: towards reconciling FISH and 3C. Nat. Methods 14, 673–678 (2017). [DOI] [PMC free article] [PubMed] [Google Scholar]
- 13.Ray J et al. Chromatin conformation remains stable upon extensive transcriptional changes driven by heat shock. Proc. Natl. Acad. Sci. U. S. A. 116, 19431–19439 (2019). [DOI] [PMC free article] [PubMed] [Google Scholar]
- 14.Fulco CP et al. Activity-by-contact model of enhancer-promoter regulation from thousands of CRISPR perturbations. Nat. Genet. 51, 1664–1669 (2019). [DOI] [PMC free article] [PubMed] [Google Scholar]
- 15.Zuin J et al. Nonlinear control of transcription through enhancer-promoter interactions. Nature (2022) doi: 10.1038/s41586-022-04570-y. [DOI] [PMC free article] [PubMed] [Google Scholar]
- 16.Beagan JA et al. Three-dimensional genome restructuring across timescales of activity-induced neuronal gene expression. Nat. Neurosci. 23, 707–717 (2020). [DOI] [PMC free article] [PubMed] [Google Scholar]
- 17.Mateo LJ et al. Visualizing DNA folding and RNA in embryos at single-cell resolution. Nature 568, 49–54 (2019). [DOI] [PMC free article] [PubMed] [Google Scholar]
- 18.Rubin AJ et al. Lineage-specific dynamic and pre-established enhancer-promoter contacts cooperate in terminal differentiation. Nat. Genet. 49, 1522–1528 (2017). [DOI] [PMC free article] [PubMed] [Google Scholar]
- 19.Benabdallah NS et al. Decreased Enhancer-Promoter Proximity Accompanying Enhancer Activation. Mol. Cell 76, 473–484.e7 (2019). [DOI] [PMC free article] [PubMed] [Google Scholar]
- 20.Alexander JM et al. Live-cell imaging reveals enhancer-dependent Sox2 transcription in the absence of enhancer proximity. Elife 8, (2019). [DOI] [PMC free article] [PubMed] [Google Scholar]
- 21.Chen H et al. Dynamic interplay between enhancer-promoter topology and gene activity. Nat. Genet. 50, 1296–1303 (2018). [DOI] [PMC free article] [PubMed] [Google Scholar]
- 22.Rao SSP et al. Cohesin Loss Eliminates All Loop Domains. Cell 171, 305–320.e24 (2017). [DOI] [PMC free article] [PubMed] [Google Scholar]
- 23.El Khattabi L et al. A Pliable Mediator Acts as a Functional Rather Than an Architectural Bridge between Promoters and Enhancers. Cell 178, 1145–1158.e20 (2019). [DOI] [PMC free article] [PubMed] [Google Scholar]
- 24.Hsieh T-HS et al. Enhancer-promoter interactions and transcription are largely maintained upon acute loss of CTCF, cohesin, WAPL or YY1. Nat. Genet. 54, 1919–1932 (2022). [DOI] [PMC free article] [PubMed] [Google Scholar]
- 25.Malik S & Roeder RG Mediator: A Drawbridge across the Enhancer-Promoter Divide. Molecular cell vol. 64 433–434 (2016). [DOI] [PMC free article] [PubMed] [Google Scholar]
- 26.Ramasamy S et al. The Mediator complex regulates enhancer-promoter interactions. bioRxiv 2022.06.15.496245 (2022) doi: 10.1101/2022.06.15.496245. [DOI] [PMC free article] [PubMed] [Google Scholar]
- 27.Krietenstein N et al. Ultrastructural Details of Mammalian Chromosome Architecture. Mol. Cell 78, 554–565.e7 (2020). [DOI] [PMC free article] [PubMed] [Google Scholar]
- 28.Hsieh T-HS et al. Resolving the 3D Landscape of Transcription-Linked Mammalian Chromatin Folding. Mol. Cell 78, 539–553.e8 (2020). [DOI] [PMC free article] [PubMed] [Google Scholar]
- 29.Hsieh T-HS, Fudenberg G, Goloborodko A & Rando OJ Micro-C XL: assaying chromosome conformation from the nucleosome to the entire genome. Nat. Methods 13, 1009–1011 (2016). [DOI] [PubMed] [Google Scholar]
- 30.Mahat DB et al. Base-pair-resolution genome-wide mapping of active RNA polymerases using precision nuclear run-on (PRO-seq). Nat. Protoc. 11, 1455–1476 (2016). [DOI] [PMC free article] [PubMed] [Google Scholar]
- 31.Chu T et al. Chromatin run-on and sequencing maps the transcriptional regulatory landscape of glioblastoma multiforme. Nat. Genet. 50, 1553–1564 (2018). [DOI] [PMC free article] [PubMed] [Google Scholar]
- 32.Core LJ, Waterfall JJ & Lis JT Nascent RNA sequencing reveals widespread pausing and divergent initiation at human promoters. Science 322, 1845–1848 (2008). [DOI] [PMC free article] [PubMed] [Google Scholar]
- 33.Gasperini M et al. A Genome-wide Framework for Mapping Gene Regulation via Cellular Genetic Screens. Cell 176, 377–390.e19 (2019). [DOI] [PMC free article] [PubMed] [Google Scholar]
- 34.Fulco CP et al. Systematic mapping of functional enhancer-promoter connections with CRISPR interference. Science 354, 769–773 (2016). [DOI] [PMC free article] [PubMed] [Google Scholar]
- 35.Field A & Adelman K Evaluating Enhancer Function and Transcription. Annu. Rev. Biochem. 89, 213–234 (2020). [DOI] [PubMed] [Google Scholar]
- 36.Danko CG et al. Identification of active transcriptional regulatory elements from GRO-seq data. Nat. Methods 12, 433–438 (2015). [DOI] [PMC free article] [PubMed] [Google Scholar]
- 37.Wang Z, Chu T, Choate LA & Danko CG Identification of regulatory elements from nascent transcription using dREG. Genome Res. 29, 293–303 (2019). [DOI] [PMC free article] [PubMed] [Google Scholar]
- 38.Core LJ et al. Analysis of nascent RNA identifies a unified architecture of initiation regions at mammalian promoters and enhancers. Nat. Genet. 46, 1311–1320 (2014). [DOI] [PMC free article] [PubMed] [Google Scholar]
- 39.Scruggs BS et al. Bidirectional Transcription Arises from Two Distinct Hubs of Transcription Factor Binding and Active Chromatin. Mol. Cell 58, 1101–1112 (2015). [DOI] [PMC free article] [PubMed] [Google Scholar]
- 40.Andersson R, Sandelin A & Danko CG A unified architecture of transcriptional regulatory elements. Trends Genet. 31, 426–433 (2015). [DOI] [PubMed] [Google Scholar]
- 41.Lim B & Levine MS Enhancer-promoter communication: hubs or loops? Curr. Opin. Genet. Dev. 67, 5–9 (2020). [DOI] [PMC free article] [PubMed] [Google Scholar]
- 42.Cho W-K et al. Mediator and RNA polymerase II clusters associate in transcription-dependent condensates. Science 361, 412–415 (2018). [DOI] [PMC free article] [PubMed] [Google Scholar]
- 43.Shrinivas K et al. Enhancer Features that Drive Formation of Transcriptional Condensates. Mol. Cell 75, 549–561.e7 (2019). [DOI] [PMC free article] [PubMed] [Google Scholar]
- 44.Lee J-H et al. Enhancer RNA m6A methylation facilitates transcriptional condensate formation and gene activation. Mol. Cell 81, 3368–3385.e9 (2021). [DOI] [PMC free article] [PubMed] [Google Scholar]
- 45.Sabari BR et al. Coactivator condensation at super-enhancers links phase separation and gene control. Science 361, (2018). [DOI] [PMC free article] [PubMed] [Google Scholar]
- 46.Boija A et al. Transcription Factors Activate Genes through the Phase-Separation Capacity of Their Activation Domains. Cell 175, 1842–1855.e16 (2018). [DOI] [PMC free article] [PubMed] [Google Scholar]
- 47.Di Giammartino DC, Polyzos A & Apostolou E Transcription factors: building hubs in the 3D space. Cell Cycle 19, 2395–2410 (2020). [DOI] [PMC free article] [PubMed] [Google Scholar]
- 48.Guo YE et al. Pol II phosphorylation regulates a switch between transcriptional and splicing condensates. Nature 572, 543–548 (2019). [DOI] [PMC free article] [PubMed] [Google Scholar]
- 49.Sigova AA et al. Transcription factor trapping by RNA in gene regulatory elements. Science 350, 978–981 (2015). [DOI] [PMC free article] [PubMed] [Google Scholar]
- 50.Boehning M et al. RNA polymerase II clustering through carboxy-terminal domain phase separation. Nat. Struct. Mol. Biol. 25, 833–840 (2018). [DOI] [PubMed] [Google Scholar]
- 51.Jiang Y et al. Genome-wide analyses of chromatin interactions after the loss of Pol I, Pol II, and Pol III. Genome Biol. 21, 158 (2020). [DOI] [PMC free article] [PubMed] [Google Scholar]
- 52.Zhang S, Uebelmesser N, Barbieri M & Papantonis A Enhancer-promoter contact formation requires RNAPII and antagonizes loop extrusion. bioRxiv 2022.07.04.498738 (2022) doi: 10.1101/2022.07.04.498738. [DOI] [PubMed] [Google Scholar]
- 53.Glaser LV et al. Assessing genome-wide dynamic changes in enhancer activity during early mESC differentiation by FAIRE-STARR-seq. Nucleic Acids Res. 49, 12178–12195 (2021). [DOI] [PMC free article] [PubMed] [Google Scholar]
- 54.Hsieh T-HS et al. Resolving the 3D landscape of transcription-linked mammalian chromatin folding. bioRxiv 638775 (2019) doi: 10.1101/638775. [DOI] [PMC free article] [PubMed] [Google Scholar]
- 55.Mitchell JA & Fraser P Transcription factories are nuclear subcompartments that remain in the absence of transcription. Genes Dev. 22, 20–25 (2008). [DOI] [PMC free article] [PubMed] [Google Scholar]
- 56.Jonkers I, Kwak H & Lis JT Genome-wide dynamics of Pol II elongation and its interplay with promoter proximal pausing, chromatin, and exons. Elife 3, e02407 (2014). [DOI] [PMC free article] [PubMed] [Google Scholar]
- 57.Siepel A A Unified Probabilistic Modeling Framework for Eukaryotic Transcription Based on Nascent RNA Sequencing Data. bioRxiv 2021.01.12.426408 (2022) doi: 10.1101/2021.01.12.426408. [DOI] [Google Scholar]
- 58.Ray J et al. Chromatin conformation remains stable upon extensive transcriptional changes driven by heat shock. bioRxiv (2019) doi: 10.1101/527838. [DOI] [PMC free article] [PubMed] [Google Scholar]
- 59.Shao W & Zeitlinger J Paused RNA polymerase II inhibits new transcriptional initiation. Nat. Genet. 49, 1045–1051 (2017). [DOI] [PubMed] [Google Scholar]
- 60.Nabet B et al. The dTAG system for immediate and target-specific protein degradation. Nat. Chem. Biol. 14, 431–441 (2018). [DOI] [PMC free article] [PubMed] [Google Scholar]
- 61.Abuhashem A et al. RNA Pol II pausing facilitates phased pluripotency transitions by buffering transcription. Genes Dev. 36, 770–789 (2022). [DOI] [PMC free article] [PubMed] [Google Scholar]
- 62.Aoi Y et al. NELF Regulates a Promoter-Proximal Step Distinct from RNA Pol II Pause-Release. Mol. Cell 78, 261–274.e5 (2020). [DOI] [PMC free article] [PubMed] [Google Scholar]
- 63.Palstra R-J et al. The β-globin nuclear compartment in development and erythroid differentiation. Nat. Genet. 35, 190–194 (2003). [DOI] [PubMed] [Google Scholar]
- 64.de Laat W & Grosveld F Spatial organization of gene expression: the active chromatin hub. Chromosome Res. 11, 447–459 (2003). [DOI] [PubMed] [Google Scholar]
- 65.Chong S et al. Imaging dynamic and selective low-complexity domain interactions that control gene transcription. Science 361, (2018). [DOI] [PMC free article] [PubMed] [Google Scholar]
- 66.Fukaya T, Lim B & Levine M Enhancer Control of Transcriptional Bursting. Cell 166, 358–368 (2016). [DOI] [PMC free article] [PubMed] [Google Scholar]
- 67.Beagrie RA et al. Complex multi-enhancer contacts captured by genome architecture mapping. Nature 543, 519–524 (2017). [DOI] [PMC free article] [PubMed] [Google Scholar]
- 68.Hua P et al. Defining genome architecture at base-pair resolution. Nature 1–5 (2021). [DOI] [PubMed] [Google Scholar]
- 69.Wang Z et al. Prediction of histone post-translational modification patterns based on nascent transcription data. Nat. Genet. 54, 295–305 (2022). [DOI] [PMC free article] [PubMed] [Google Scholar]
- 70.Martin BJE et al. Transcription shapes genome-wide histone acetylation patterns. Nat. Commun. 12, 210 (2021). [DOI] [PMC free article] [PubMed] [Google Scholar]
- 71.Banani SF, Lee HO, Hyman AA & Rosen MK Biomolecular condensates: organizers of cellular biochemistry. Nat. Rev. Mol. Cell Biol. 18, 285–298 (2017). [DOI] [PMC free article] [PubMed] [Google Scholar]
- 72.Strom AR et al. Phase separation drives heterochromatin domain formation. Biophys. J. 114, 445a (2018). [DOI] [PMC free article] [PubMed] [Google Scholar]
- 73.Nair SJ et al. Phase separation of ligand-activated enhancers licenses cooperative chromosomal enhancer assembly. Nat. Struct. Mol. Biol. 26, 193–203 (2019). [DOI] [PMC free article] [PubMed] [Google Scholar]
- 74.Barutcu AR, Blencowe BJ & Rinn JL Differential contribution of steady-state RNA and active transcription in chromatin organization. EMBO Rep. 20, e48068 (2019). [DOI] [PMC free article] [PubMed] [Google Scholar]
- 75.Soutourina J Transcription regulation by the Mediator complex. Nat. Rev. Mol. Cell Biol. 19, 262–274 (2018). [DOI] [PubMed] [Google Scholar]
- 76.Malik S & Roeder RG The metazoan Mediator co-activator complex as an integrative hub for transcriptional regulation. Nat. Rev. Genet. 11, 761–772 (2010). [DOI] [PMC free article] [PubMed] [Google Scholar]
- 77.Henriques T et al. Stable pausing by RNA polymerase II provides an opportunity to target and integrate regulatory signals. Mol. Cell 52, 517–528 (2013). [DOI] [PMC free article] [PubMed] [Google Scholar]
- 78.Tome JM, Tippens ND & Lis JT Single-molecule nascent RNA sequencing identifies regulatory domain architecture at promoters and enhancers. Nat. Genet. 50, 1533–1541 (2018). [DOI] [PMC free article] [PubMed] [Google Scholar]
- 79.Pancholi A et al. RNA polymerase II clusters form in line with surface condensation on regulatory chromatin. Mol. Syst. Biol. 17, e10272 (2021). [DOI] [PMC free article] [PubMed] [Google Scholar]
- 80.Hajiabadi H et al. Deep-learning microscopy image reconstruction with quality control reveals second-scale rearrangements in RNA polymerase II clusters. PNAS Nexus gac065 (2022). [DOI] [PMC free article] [PubMed] [Google Scholar]
- 81.RNA-Mediated Feedback Control of Transcriptional Condensates. Cell 184, 207–225.e24 (2021). [DOI] [PMC free article] [PubMed] [Google Scholar]
- 82.Wang Z et al. Interdependence between histone marks and steps in Pol II transcription. Research Square (2021) doi: 10.21203/rs.3.rs-149042/v1. [DOI] [Google Scholar]
- 83.Luo Y et al. New developments on the Encyclopedia of DNA Elements (ENCODE) data portal. Nucleic Acids Res. 48, D882–D889 (2020). [DOI] [PMC free article] [PubMed] [Google Scholar]
- 84.Abuhashem A, Lee AS, Joyner AL & Hadjantonakis A-K Rapid and efficient degradation of endogenous proteins in vivo identifies stage-specific roles of RNA Pol II pausing in mammalian development. Dev. Cell (2022) doi: 10.1016/j.devcel.2022.03.013. [DOI] [PMC free article] [PubMed] [Google Scholar]
- 85.Gu B et al. Transcription-coupled changes in nuclear mobility of mammalian cis-regulatory elements. Science 359, 1050–1055 (2018). [DOI] [PMC free article] [PubMed] [Google Scholar]
- 86.Zhou B et al. Comprehensive, integrated, and phased whole-genome analysis of the primary ENCODE cell line K562. Genome Res. 29, 472–484 (2019). [DOI] [PMC free article] [PubMed] [Google Scholar]
- 87.Super-Enhancers in the Control of Cell Identity and Disease. Cell 155, 934–947 (2013). [DOI] [PMC free article] [PubMed] [Google Scholar]
- 88.Hsieh T-HS et al. Enhancer-promoter interactions and transcription are maintained upon acute loss of CTCF, cohesin, WAPL, and YY1. bioRxiv 2021.07.14.452365 (2021) doi: 10.1101/2021.07.14.452365. [DOI] [PMC free article] [PubMed] [Google Scholar]
- 89.Goloborodko A, Venev S, Abdennur N, azkalot & Di Tommaso P. mirnylab/distiller-nf: v0.3.3. (2019). doi: 10.5281/zenodo.3350937. [DOI] [Google Scholar]
- 90.Ramírez F et al. High-resolution TADs reveal DNA sequences underlying genome organization in flies. Nat. Commun. 9, 189 (2018). [DOI] [PMC free article] [PubMed] [Google Scholar]
- 91.Lopez-Delisle L et al. pyGenomeTracks: reproducible plots for multivariate genomic datasets. Bioinformatics 37, 422–423 (2021). [DOI] [PMC free article] [PubMed] [Google Scholar]
- 92.Chu T, Wang Z, Chou S-P & Danko CG Discovering transcriptional regulatory elements from run-on and sequencing data using the web-based dREG gateway. Curr. Protoc. Bioinformatics 66, e70 (2019). [DOI] [PMC free article] [PubMed] [Google Scholar]
- 93.Anders S & Huber W Differential expression analysis for sequence count data. Derm. Helv. 1–1 (2010). [DOI] [PMC free article] [PubMed] [Google Scholar]
- 94.Williams LH et al. Pausing of RNA polymerase II regulates mammalian developmental potential through control of signaling networks. Mol. Cell 58, 311–322 (2015). [DOI] [PMC free article] [PubMed] [Google Scholar]
- 95.Dorighi KM et al. Mll3 and Mll4 Facilitate Enhancer RNA Synthesis and Transcription from Promoters Independently of H3K4 Monomethylation. Mol. Cell 66, 568–576.e4 (2017). [DOI] [PMC free article] [PubMed] [Google Scholar]
- 96.Noguchi S et al. FANTOM5 CAGE profiles of human and mouse samples. Sci Data 4, 170112 (2017). [DOI] [PMC free article] [PubMed] [Google Scholar]
- 97.Zhao Y et al. Deconvolution of Expression for Nascent RNA sequencing data (DENR) highlights pre-RNA isoform diversity in human cells. Bioinformatics 37, 4727–4736 (2021). [DOI] [PMC free article] [PubMed] [Google Scholar]
- 98.Li G et al. Extensive promoter-centered chromatin interactions provide a topological basis for transcription regulation. Cell 148, 84–98 (2012). [DOI] [PMC free article] [PubMed] [Google Scholar]
- 99.Open2C et al. Cooltools: enabling high-resolution Hi-C analysis in Python. Preprint at 10.1101/2022.10.31.514564. [DOI] [PMC free article] [PubMed] [Google Scholar]
- 100.Barshad G & Wang Z Danko-Lab/E-P_contacts: E-P contacts. (Zenodo, 2023). doi: 10.5281/ZENODO.7948817. [DOI] [Google Scholar]
Associated Data
This section collects any data citations, data availability statements, or supplementary materials included in this article.
Supplementary Materials
Data Availability Statement
Micro-C data generated in this study were deposited in the Gene Expression Omnibus (GEO) database under accession number GSE206133. H3K27ac and H3K4me2 ChIP-seq data from K562 cells were downloaded from GSE163043. K562 data for ATAC-seq (ENCSR868FGK), CTCF ChIP-seq (ENCSR447BSF), MNase-seq (ENCSR000CXQ) and NELFE ChIP-seq (ENCSR000DOF) were downloaded from ENCODE. DMSO, TRP and FLV treated mESCs Micro-C data28 were downloaded from GSE130275. PRO-seq data36,38 for Jurkat T-cells were downloaded from GSE66031 and for K562 from GSE60455. PRO-seq data for mECSs harboring a homozygous endogenous NELFB-FKBP12F36V fusion protein, treated and untreated with dTAG-1384, were downloaded from GSE196653. GRO-seq data for mESCs56,94 were downloaded from GSE43390 and GSE48895. Positions for human (hg38) and mouse (mm10) CAGE peaks were downloaded from the FANTOM5 database (https://fantom.gsc.riken.jp/5/).


