Abstract
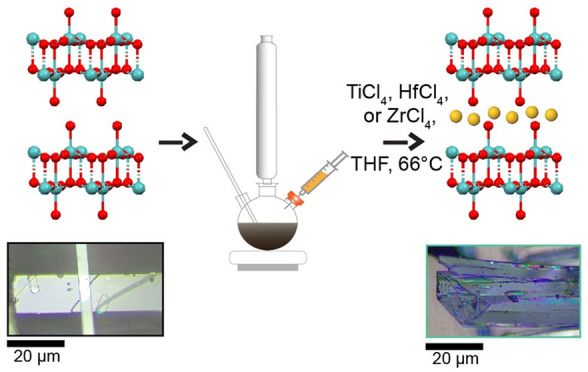
Altering the physical and chemical properties of a layered material through intercalation has emerged as a unique strategy toward tunable applications. In this work, we demonstrate a wet chemical method to intercalate titanium, hafnium, and zirconium into 2D layered nanomaterials. The metals are intercalated using bis-tetrahydrofuran metal halide complexes. Metal intercalation is demonstrated in nanomaterials of Bi2Se3, Si2Te3, MoO3, and GeS. This strategy intercalates, on average, 3 atm % or less of Hf, Ti, and Zr that share charge with the host nanomaterial. This methodology is used to chemochromically alter MoO3 from transparent white to dark blue.
Keywords: 2D layered materials, Bi2Se3, MoO3, GeS, Si2Te3, intercalation
Introduction
Intercalation into layered materials is essential for energy storage applications,1,2 chromic materials,2,3 novel catalytic processes,2,4,5 and other industrial applications such as detergents and lubricants.2,6,7 The introduction of heavier atoms such as transition metals has been proposed as a route to physically and chemically tune properties such as thermal resistivity, electron–phonon scattering, and electronic properties of the host lattice in both 2D and layered nanomaterials.1,8 Intercalation offers a precise and unique route to achieve remarkably new properties.
Several routes to intercalate atoms, molecules, and ions into layered materials have been developed. These include electrochemical intercalation,1,2 chemical reflux,2in situ,2 and zerovalent intercalation.6,7 While there are numerous intercalation methods, heavier and larger atoms such as transition metals have proven difficult to incorporate due to the ionic nature of the transition metal guest species, as well as the charge and size of the guest species limiting the concentration of intercalant.2,6,7
So far, a significant number of zerovalent elements (Ag, Au, Bi, Cu, Co, Cr, Fe, Ge, Hg, In, Mo, Mn, Ni, Os, Pb, Pd, Pt, Rh, Ru, Sb, Sn, W)6,7,9−12 have been intercalated into 2D layered materials using disproportionation redox reactions,1,6,7 decomposition of a coordination compound,6,7 liquid metal immersion,13 and stannous chloride reduction.7 These chemistries have enabled an enormous number of advances. For example, they have enhanced transparency in chalcogenides,14 led to chemo-chromism in MoO3,3 extended the cycle life of battery electrodes,15−17 enhanced water oxidation catalysis and stability,4 created the worlds’ thinnest ferromagnet,18 enabled a 4-fold enhancement of thermoelectric properties,19 and led to tunable, ambipolar electronic properties.20
Here, we devise a new set of chemistries based on the formation of a molecular metal halide using tetrahydrofuran (THF) to intercalate hafnium, titanium, and zirconium into 2D layered nanomaterials. The highly oxyphilic nature of solubilized Hf4+, Ti4+, and Zr4+ drives the intercalation reaction; THF increases the solubility of the ionic species. This process suggests future solvent-based approaches for intercalating other oxyphilic metals. Evidence shows successful intercalation in the expansion of the host lattice, detection of the intercalant guest with several characterization techniques, and optical color changes consistent with the introduction of a metal species inside the van der Waals gap of the host nanocrystal.
Results and Discussion
Several layered nanocrystal chalcogenides and oxides were chosen to demonstrate this intercalation route: Bi2Se3,21 Si2Te3,22 GeS,23 and MoO3.10,24,25 Bi2Se3,21 Si2Te3,22 and GeS23 crystals were grown following published vapor transport procedures.10,21−25 MoO3 was grown both by hydrothermal methods3,25 and vapor transport methods24 following published procedures3,24,25 to identify any potential impact of growth route on intercalation. Hydrothermally grown MoO3 retains a small amount of water in the van der Waals gap as a result of growth conditions, which can affect intercalation. Further details can be found in Materials and Methods.
Intercalation of Hf4+, Ti4+, and Zr4+ was performed through the creation of a solvated molecular metal halide using THF. It has long been established that dissolving MCl4 (where M = Hf, Ti or Zr) into THF forms a 1:2 monomeric complex with tetrahydrofuran.26,27
| 1 |
Titanium can be reduced further to Ti3+ in the presence of THF.28
| 2 |
Hf, Ti, and Zr metal halides are difficult to dissolve in many solvents and, thus, difficult to intercalate. In this monomeric complex, the metal is isolated, soluble, and solvent-bound with weak dative interactions. The metal, Hf, Ti, or Zr, is highly oxyphilic and will intercalate into the host to react with the oxide or chalcogenide environment. The chloride is a good leaving group. Metal ions are intercalated in the highly oxidized state (Zr4+, Hf4+, Ti4+) as opposed to zerovalent intercalation limiting the intercalant concentration.6,7,10
There are several key characteristics that demonstrate intercalation among them: visible optical changes including changes in color and changes in optical transparency, expansion of the host lattice or expansion of the host volume as detected through diffraction, superlattice diffraction patterns, and detection of the elemental intercalants.3,7,9,10
Intercalation in MoO3 can be demonstrated through visible color change.1−3 Zero-valent intercalation of some metals into MoO3 shows a color change from a transparent white to a striking dark blue.3,24Figure 1 is an optical image of laterally large MoO3 grown by using water vapor transport. MoO3 undergoes a remarkable color change with the intercalation of hafnium and zirconium from transparent white to dark blue reminiscent of cobalt or tin intercalation.3,24 In Co, Sn and other ionic intercalants in MoO3, introduction of guest species adds interband electronic states and alters the host lattice structure leading to lower energy electronic transitions which result in a color change.3 The Hf, Ti, and Zr intercalants add interband states in MoO3 and result in a color change from a transparent white to a light or dark blue.2 Titanium intercalated MoO3 has a colorful dark-blue appearance that looks similar in appearance to titanium quartz.29 MoO3 was also refluxed with tetrahydrofuran under the same conditions as for the intercalant reactions as a control. No color change is observed with the tetrahydrofuran treatment (Figure 1) showing that the color change is entirely from the introduction of the metal into the host. Further, THF has been known to take several days to intercalate in layered materials much like other intercalation reactions with organic solvents.30 Three hours or less is generally not enough time to intercalate tetrahydrofuran to any appreciable amount. Hydrothermally grown nanoribbons of MoO3 deposited on fused silica substrates show the same color changes (Supporting Information; Figure S1). Minor color changes are observed in the color and reflectivity of Bi2Se3 nanoribbons and platelets (Supporting Information; Figure S2).
Figure 1.
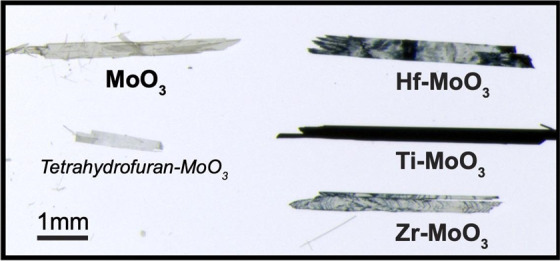
Optical image of ∼200 nm thick MoO3 intercalated with Hf, Ti, and Zr on the same glass substrate showing striking color change with intercalation of Hf, Ti, Zr from transparent white to blue. Tetrahydrofuran used as a control with no metal in solution shows no color change of the MoO3 with tetrahydrofuran treatment.
X-ray diffraction (XRD) can reveal the strongest signature of successful intercalation with a change in the host lattice constants and unit cell volume.31 Intercalation can cause expansion or contraction of the host unit cell volume depending on structural and/or electronic interaction of the guest and host such as through occupancy of specific atomic sites of the guest, size of the intercalant, or through electron charge transfer.31,32 Almost all intercalant concentrations, given this method, are small and involve charge transfer to the host given the ionic nature of the intercalant (<3 atm %). Figure 2 shows the XRD of the unintercalated and Hf, Ti, and Zr-intercalated crystals of Bi2Se3, GeS, Si2Te3, MoO3, and laterally large MoO3. Bi2Se3 has a rhombohedral crystal structure (space group: R3̅m) with lattice constants that we determined as a = 4.14 Å and c = 28.7 Å. Si2Te3 crystallizes in a hexagonal space group: P3̅1c with lattice constants a = 7.43 Å and c = 13.48 Å. Laterally large vapor transport (VT) grown MoO3 has an orthorhombic crystal structure (space group: Pbnm) with lattice constant b = 13.85 Å, and hydrothermally (nano-MoO3) grown MoO3 has an orthorhombic crystal structure (space group: Pbnm) with lattice constant b = 13.83 Å. Only one direction of lattice reflections is measured for MoO3, as MoO3 lies very flat on a surface, but this is in the stacking direction of the layers.24 GeS has an orthorhombic crystal structure (space group: Pbnm) with lattice constants a = 4.30 Å, b = 10.5 Å, and c = 3.64 Å. No obvious superlattice peaks were observed for Hf, Ti, and Zr intercalation; however, most superlattice peaks are not observed unless the crystal is annealed or heated and the intercalant concentration is significant in the host.3,6,7,9 To highlight the effect of the intercalant, to the right of each XRD plot in Figure 2, we show a zoomed-in plot in the vicinity of the reflection in the stacking direction (i.e., Bi2Se3 (003), MoO3 (040), Si2Te3 (002), GeS (111) and (040)). A peak shift to decreasing 2θ correlates to increasing d-spacing and, subsequently, expansion of the host in that direction, while a peak shift to higher 2θ correlates to decreasing d-spacing. Bi2Se3 (003) and MoO3 (040) show notable shifts toward increasing d-spacing in the peak shown which would mean expansion of the van der Waals gap to accommodate the intercalant in the stacking direction. Si2Te3 shows a very small shift toward decreasing d-spacing in the (004) and GeS shows almost no change in the (040) which is likely due to the structure of these hosts and possible guest sites. In Si2Te3, Si–Si dumbbells can sit in the gap, interacting with the guest. GeS has an unusual puckered structure. Plots are given below each respective host of the unit cell volume or, in the case of MoO3, the b-lattice constant with respect to intercalants Hf, Ti, and Zr. Lattice constants can be found in Supporting Information Tables S2–S5. In Figure 2, the unit cell volume, calculated from the determined lattice constants, is provided below each stacked plot. Bi2Se3 and Si2Te3 show an expansion of the host with intercalation of Hf and contraction of the host unit cell volume with intercalation of Ti and Zr. MoO3, and GeS show an expansion of the unit cell volume. (Figure 2). XRD shows distinct domain formation in MoO3. The (0k0) of intercalated MoO3 shows multiple peaks at lower 2θ (i.e., the (040)). This has been seen previously in deintercalated MoO3 where failure to remove all of the intercalant leads to two different domain environments and two different d-spacings within a host.11 Changes in peak intensities in XRD are primarily differences in the texturing and probed crystallite orientation between the different samples.
Figure 2.
(Top) XRD of Bi2Se3, Si2Te3, GeS, vapor phase grown MoO3, and hydrothermally grown MoO3, and GeS. A zoomed-in region of Bi2Se3 (003), Si2Te3 (004), GeS (111) and (040), and MoO3 (040) is shown next to each respective XRD plot. Intercalated MoO3 has additional peaks from different regions of the expanded lattice. (Bottom) Unit cell volume of Bi2Se3, Si2Te3, and GeS and b-lattice constants of vapor phase grown MoO3 and hydrothermally grown MoO3.
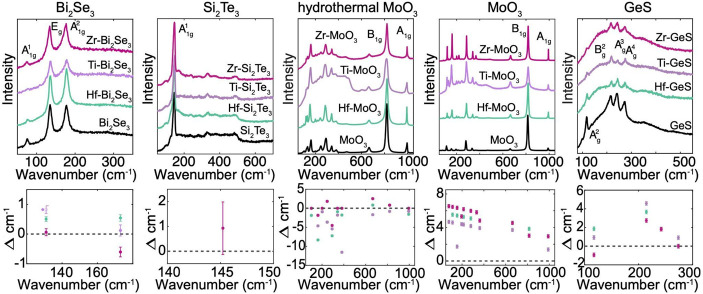
Raman scattering of intercalation compounds is complex but can be used to infer the electron donor–acceptor nature of the intercalant on the host through phonon mode stiffening or softening. Raman spectra (Figure 3; Top) for Bi2Se3, Si2Te3, MoO3, and GeS show no new phonon modes and no presence of THF or any halide salts following intercalation. Increasing frequency shifts of up to +5–10 cm–1 (Figure 3; bottom) are observed with intercalation, which results in significant phonon stiffening. Phonon stiffening of the host often indicates the intercalant transfers charge to the host; phonon softening means the intercalant withdraws charge from the host.3,15,33,34 Without considering structural effects which can yield complex behavior in the Raman spectra,5,33,34 the increase in the phonon frequency shift implies that electrons are donated to the host from the Hf, Ti, or Zr metal intercalant. This is further supported by the X-ray photoelectron spectroscopy (XPS) results (see below). Hydrothermally grown MoO3 shows phonon softening. Hydrothermally grown MoO3 retains water in the van der Waals gap following growth. The interaction between the intercalated water and the intercalated ions may be responsible for phonon softening in hydrothermally grown MoO3.
Figure 3.
(Top) Raman of Bi2Se3, Si2Te3, MoO3 nanoribbons, MoO3 ribbons, GeS, and (bottom) change in wavenumber shift from the unintercalated material. No new Raman peaks are observed. The Raman modes stiffen or soften with intercalation following similar investigations.7
Scanning electron microscopy (SEM) energy-dispersive X-ray (EDX) can spectroscopically detect the presence of the intercalant within the host. EDX maps in 2D of Bi2Se3 (Figure 4) and GeS (Figure 5), Si2Te3 (Supporting Information; Figure S4) and MoO3 (Supporting Information; Figure S5) show that Hf, Ti, and Zr intercalates throughout the samples. GeS shows an interesting nanoribbon such that the top half of the crystal has burst open, better revealing the islanding of the intercalated Hf. For each crystal and intercalant, at least three SEM-EDX spectra were acquired to provide an average and maximum intercalant concentration (Supporting Information; Table S1). Example SEM-EDX spectra are in the Supporting Information and as a table in Figure S6 showing detected signatures of Hf, Ti, or Zr. SEM-EDX was measured from 3–6 different crystals. There is large sample-to-sample variation in the amount of intercalated guest detected across different crystals as well as variation in the amount detected throughout a single crystal. This can be from islanding domain formation and/or presence of defects which hinders the effective diffusion of intercalated ions in a crystal. Acquisition of spectra in different sites shows that the intercalants may form domains within the host similar to other intercalants.2,5,7,35
Figure 4.
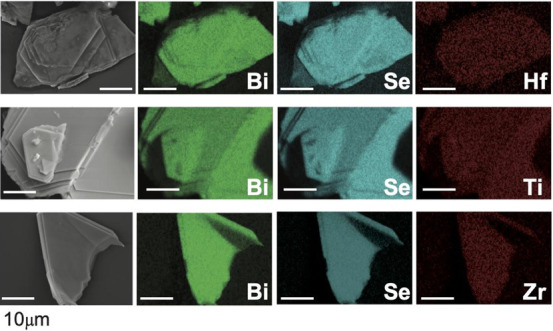
SEM-EDX maps of Bi2Se3 intercalated with Hf, Ti, and Zr. Scale bars are 10 μm.
Figure 5.
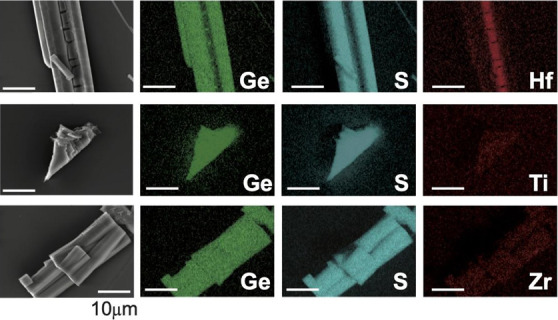
SEM-EDX maps of GeS intercalated with Hf, Ti, and Zr. Scale bars are 10 μm. A large concentration of hafnium is seen in a sheared-off piece.
XPS was used in conjunction with SEM-EDX to determine the average atomic percentage of intercalant. Table 1 provides the atomic percent of the intercalant from XPS measurements. In all intercalated nanocrystals (Figures 6–8, S9, and S10; Table 1), Hf, Ti, and Zr were detected. Almost all high-resolution XPS spectra show evidence of the interaction between the metal intercalant and the host. Generally, the oxidation state of the heavy intercalated atom can be determined by using XPS shifts or satellite peaks. Peak shifts across all samples are calibrated using adventitious carbon set at 284.5 eV.36 In general, a decrease in the binding energy corresponds to an increase in the electron density from the better screening of the core electrons. This can indicate that a charge is transferred to the host. An increase in binding energy corresponds to a withdrawal of electron density and less screening of core electrons. This would be the withdrawal of charge from the host to the intercalant.
Table 1. Average Intercalated atm % Determined by XPSa.
| Hf 4f | Ti 2p | Zr 3d | |
|---|---|---|---|
| Bi2Se3 | 0.6(1) | 3.0(1) | 2.7(1) |
| MoO3 | 2.1(1) | 0.2(1) | 0.8(1) |
| nano-MoO3 | 1.1(1) | 12.2(1) | 1.3(1) |
| GeS | 3.2(1) | 0.2(1) | 1.3(1) |
| Si2Te3 | 1.6(1) | 3.0(1) | 0.7(1) |
nano is hydrothermally grown MoO3..
Figure 6.
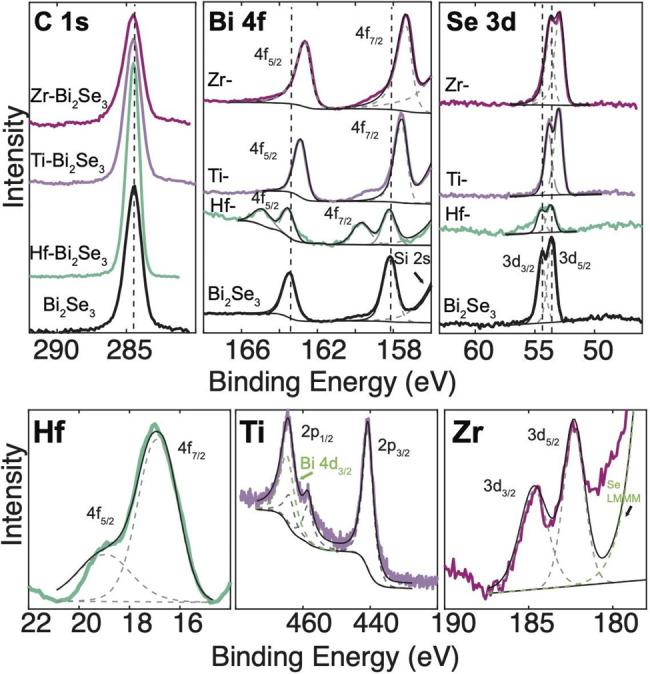
XPS of Bi2Se3 intercalated with Hf, Ti, and Zr. Adventitious carbon was used to calibrate charge across samples. Hf, Ti, and Zr are detected in respective samples.
Figure 8.
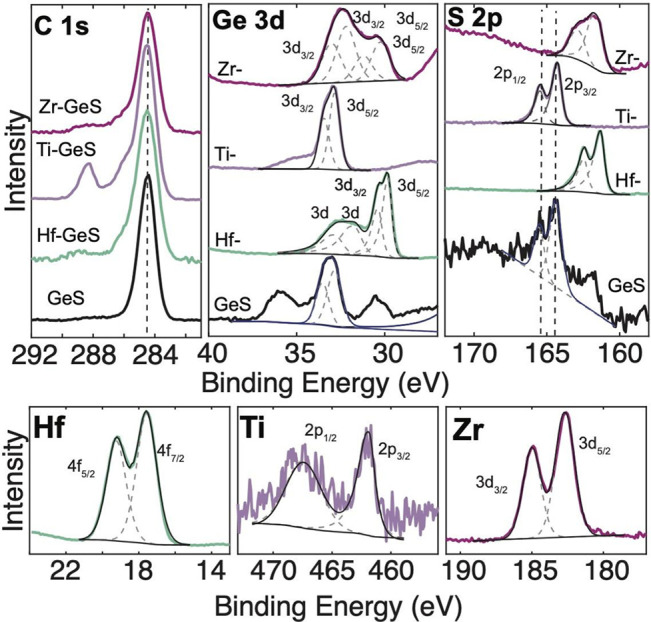
XPS of nanoribbon-GeS intercalated with Hf, Ti, and Zr. Adventitious carbon is used as a calibration of the charge across samples. Hf, Ti, and Zr are detected in respective samples.
Figure 6 shows the XPS spectra of Bi2Se3. Binding energies of the Bi 4f and also Se 3d peaks for Ti and Zr intercalation decrease, indicating donation of electrons to the host from the intercalant. Hf-Bi2Se3 is unique. It shows two different environments in the Bi 4f peak, possibly reflected in the broadening of the Hf 4f states, suggesting different electronic interaction of Hf Bi within Bi2Se3. XRD of Bi2Se3 does not show distinct peak splitting that could be attributed to domains. Additional peaks of Bi 4d3/2 overlapping with Ti and a Se auger peak overlapping with Zr are labeled.
Figure 7 shows the XPS of ∼200 nm thick MoO3 grown through vapor transport. Again, adventitious carbon (284.5 eV) is used to calibrate the charge across different samples. The O 1s and Mo 3d show an increase in binding energies, which would indicate that electrons are withdrawn from the host and donated to the intercalant. This makes sense because in the van der Waals gap in MoO3, a lone pair of electrons sits on the oxygen, which can be donated by the host to the intercalant. The different domain environments seen with XRD of MoO3 are reflected in XPS. Zr-MoO3 shows two oxide environments, but this is not reflected in the Zr high resolution spectra; therefore, it could also be additional atmospheric oxygen surface contamination. The O 1s and Mo 3d of Hf-MoO3 show two distinct peaks representing two distinct environments. XRD of Hf-MoO3 shows three distinct expansions of the MoO3 lattice, thus three different domain thickness sizes, with splitting of the (0k0) lattice reflections. XRD of Ti-MoO3 also shows two distinct environments. The Mo 3d and O 1s for Ti-MoO3 both show broadening that can be attributed to this multiplet of oxidation environments. The oxidation states match with literature values36 of Hf4+, Ti4+, and Zr4+ for intercalation in MoO3.
Figure 7.
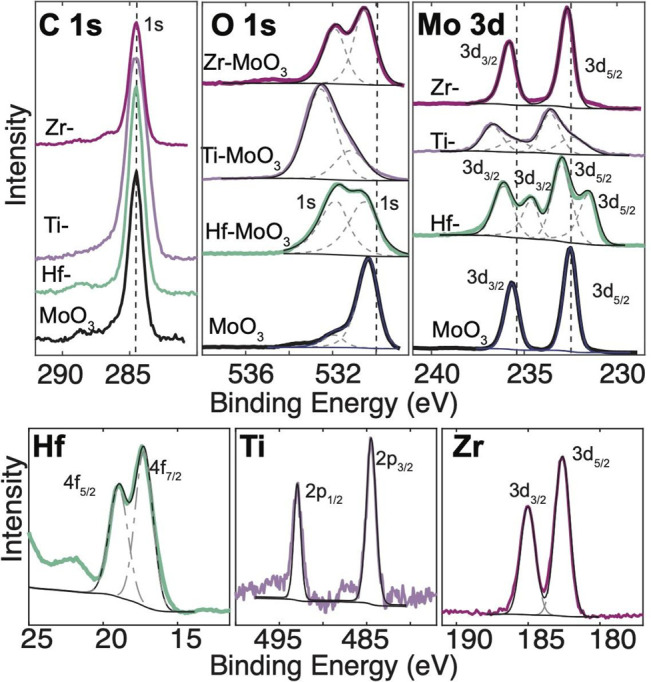
XPS of laterally extended MoO3 intercalated with Hf, Ti, and Zr. Adventitious carbon is used as a calibration of the charge across samples. Hf, Ti, and Zr are detected in respective samples.
Figure 8 shows the XPS measurements of GeS intercalated with Hf, Ti, and Zr. The charge is calibrated across samples from the adventitious carbon. The Ge 3d and S 2p show a decrease in the binding energy with intercalation of Ti and Zr that would occur with a donation of electrons from the intercalant to the host. Hf shows almost no shift or a slight increase in the binding energy, which would correlate to electrons withdrawn from the host and donated to the intercalant Hf guest.
Almost all intercalants show an increase in binding energy from the zerovalent metal with respect to literature values36 implying that the Hf, Ti, or Zr intercalant is oxidized within these hosts and shares electrons with the host. Identification of the oxidation state with XPS is consistent with Hf4+, Ti4+, and Zr4+. Additional XPS spectra for hydrothermally grown MoO3 and Si2Te3 are provided in Supporting Information Figures S9 and S10. All peak fit binding energies and full width at half-maximum (fwhm) are in the Supporting Information Tables S7–S19.
Conclusion
Intercalation of hafnium, titanium, and zirconium through solvation of a molecular metal halide using tetrahydrofuran overcomes challenges distinct to these highly oxyphilic metals. The THF complexes are molecular, unlike the extended solids of the binary halides. Molecules are generally more soluble in organic solvents, kinetically more competent in the sense of reactivity, and more amenable to intercalation. As opposed to zerovalent intercalants,5,7,10 metal ions are intercalated in the highly oxidized state (Zr4+, Hf4+, Ti4+) which can radically alter the host material behavior. We believe that these new intercalation routes offer a unique way to alter the chemical and physical properties of 2D layered nanomaterials.8,37 The greater interaction of these intercalants with the host can yield electronic, chemical, and catalytic properties more akin to those of doping strategies without radically altering the overall structure of the host. We believe that this intercalation chemistry is general to all classes of layered materials. Similar pathways to intercalate other highly oxyphilic metals may also be achievable by using this chemical methodology.
Materials and Methods
2D Layered Nanomaterials and Materials
The 2D layered Bi2Se3 nanoribbons,21 Si2Te3 nanoplates,22 GeS nanoribbons,23 laterally large ∼200 nm thick vapor grown MoO3,25 and hydrothermally grown ∼15 nm thick MoO3 nanoribbons3,25 were synthesized using established published procedures.21−23 Bi2Se3, Si2Te3, and laterally large MoO3 were grown by using vapor transport methods. Hydrothermally grown MoO3 nanoribbons3,25 were drop-cast onto a fused silica substrate and dried in air for intercalation.
Intercalation
Intercalation is performed under an inert N2 atmosphere by using standard Schlenk techniques. The 2D layered material is placed in a three-neck round-bottom flask connected to a reflux condenser connected to a vacuum manifold. The flask is flushed three times alternating vacuum and nitrogen and finally filled with nitrogen. A 5 mL solution of 74 mM stannous chloride and anhydrous tetrahydrofuran (THF) and 31 mM hafnium chloride, 179 mM titanium chloride, or 43 mM zirconium chloride is prepared in a glovebox in a 10 mL vial. The solution is injected into the round-bottom flask and heated to 60 °C for 3 h. After 3 h, the 2D layered material is removed from the flask and rinsed with acetone and/or ethanol. The sample is dried in air to evaporate excess THF. While the recipe above was used for most intercalation, we found that it is possible to successfully intercalate at higher concentrations. For these intercalations, the flask is flushed three times alternating vacuum and nitrogen, and finally filled with nitrogen. A 5 mL solution of 0.74 M stannous chloride and anhydrous tetrahydrofuran (THF) and 0.31 M hafnium chloride, 179 mM titanium chloride, or 0.43 M zirconium chloride is prepared in a glovebox in a 10 mL vial. Bi2Se3, shown here, was intercalated with Hf and Zr by using these concentrations. The TiCl4-THF compound when mixed is a red orange solution. After addition to the round-bottom flask and some time, it turns into a dark red brown solution that is nearly black. Once quenched with ethanol or acetone, the solution turns to purple.
All chemicals are from Sigma-Aldrich unless otherwise specified.
Characterization
Optical images were acquired on a Leica ICC50E microscope with 10×, 50×, and 100× objectives and an AmScope SF-2TRAZZ-TP Trinocular Dual-illumination Stereo Microscope with a 2× Barlow lens. Powder XRD data were collected on a Bruker D8 ECO Advance with a copper source (Cu Kα1 = 1.54060 and Kα2 = 1.54443). Lattice constants (Supporting Information; Tables S2–S6) and unit cell volume were determined with Rietveld Refinement using MAUD38 or Le Bail fit using GSAS-II.39 For the Le Bail fit procedures (Supporting Information; Figure S8), the background was first fit using a tenth-order chebyshev polynomial. An instrument parameter file was created by measuring LaB6 as a standard. An initial Le Bail fit was performed, and then the unit cell was refined. The crystallite size broadening and the microstrain were refined separately as a final step. XPS spectra were collected via a Kratos Axis Supra instrument using an aluminum anode. XPS fitting of wide survey spectra and individual peaks was performed using Kratos ESCApe software with adventitious carbon used for calibration of the charge offset. SEM and EDX data were acquired using a FEI Scios Dual Beam FIB/SEM instrument equipped with an Oxford X-MaxN EDX detector operating at an acceleration voltage of 20 kV. Raman spectra were collected from a home-built Raman system with a 532 nm Hubner Photonics narrow-line width, single-frequency Cobolt Samba laser at 20 mW, Princeton Instruments SCT320 with an 1800 groove/mm grating, and Princeton Instrument Pixis back-illuminated, back thinned CCD.
Acknowledgments
This work was supported by the National Science Foundation under grant NSF DMR-2202472. The XPS instrument used for this project was funded by NSF-MRI-1828238. E.C. was supported by the AMPAC Undergraduate Summer Research Award.
Supporting Information Available
The Supporting Information is available free of charge at https://pubs.acs.org/doi/10.1021/acsnanoscienceau.3c00027.
Optical images of hydrothermally grown MoO3, Bi2Se3, and Si2Te3; additional SEM-EDX maps of Si2Te3, MoO3; SEM-EDX spectra of all hosts and intercalants; tables of lattice constants for all hosts and intercalants; additional XPS of Si2Te3 and MoO3 (PDF)
Author Contributions
† V.H. and K.R.R. contributed equally. The manuscript was written through contributions of all authors. All authors have given approval to the final version of the manuscript
The authors declare no competing financial interest.
Supplementary Material
References
- Rajapakse M.; Karki B.; Abu U. O.; Pishgar S.; Musa M. R. K.; Riyadh S. M. S.; Yu M.; Sumanasekera G.; Jasinski J. B. Intercalation as a Versatile Tool for Fabrication, Property Tuning, and Phase Transitions in 2D Materials. Npj 2D Mater. Appl. 2021, 5, 30. 10.1038/s41699-021-00211-6. [DOI] [Google Scholar]
- Müller-Warmuth W.; Schöllhorn R.. Progress in Intercalation Research; Springer, 1994; Vol. 17. [Google Scholar]
- Wang M.; Koski K. J. Reversible Chemochromic MoO3 Nanoribbons through Zerovalent Metal Intercalation. ACS Nano 2015, 9, 3226–3233. 10.1021/acsnano.5b00336. [DOI] [PubMed] [Google Scholar]
- Thenuwara A. C.; Shumlas S. L.; Attanayake N. H.; Cerkez E. B.; McKendry I. G.; Frazer L.; Borguet E.; Kang Q.; Zdilla M. J.; Sun J.; Strongin D. R. Copper-Intercalated Birnessite as a Water Oxidation Catalyst. Langmuir 2015, 31, 12807–12813. 10.1021/acs.langmuir.5b02936. [DOI] [PubMed] [Google Scholar]
- Dresselhaus M. S.Intercalation in layered materials; Springer, 1986. [Google Scholar]
- Koski K. J.; Wessells C. D.; Reed B. W.; Cha J. J.; Kong D.; Cui Y. Chemical Intercalation of Zerovalent Metals into 2D Layered Bi2Se3 Nanoribbons. J. Am. Chem. Soc. 2012, 134, 13773–13779. 10.1021/ja304925t. [DOI] [PubMed] [Google Scholar]
- Wang M.; Williams D.; Lahti G.; Teshima S.; Dominguez Aguilar D.; Perry R.; Koski K. J. Chemical Intercalation of Heavy Metal, Semimetal, and Semiconductor Atoms into 2D Layered Chalcogenides. 2D Mater. 2018, 5, 045005. 10.1088/2053-1583/aacfc2. [DOI] [Google Scholar]
- Wan J.; Lacey S. D.; Dai J.; Bao W.; Fuhrer M. S.; Hu L. Tuning two-dimensional nanomaterials by intercalation: materials, properties and applications. Chem. Soc. Rev. 2016, 45, 6742–6765. 10.1039/C5CS00758E. [DOI] [PubMed] [Google Scholar]
- Chen K. P.; Chung F. R.; Wang M.; Koski K. J. Dual element intercalation into 2D layered Bi2Se3 nanoribbons. J. Am. Chem. Soc. 2015, 137, 5431–5437. 10.1021/jacs.5b00666. [DOI] [PubMed] [Google Scholar]
- Koski K. J.; Cha J. J.; Reed B. W.; Wessells C. D.; Kong D.; Cui Y. High-Density Chemical Intercalation of Zero-Valent Copper into Bi2Se3 Nanoribbons. J. Am. Chem. Soc. 2012, 134, 7584–7587. 10.1021/ja300368x. [DOI] [PubMed] [Google Scholar]
- Wang M.; Al-Dhahir I.; Appiah J.; Koski K. J. Deintercalation of Zero-Valent Metals from Two-Dimensional Layered Chalcogenides. Chem. Mater. 2017, 29, 1650–1655. 10.1021/acs.chemmater.6b04918. [DOI] [Google Scholar]
- Ong E. W.; McKelvy M. J.; Ouvrard G.; Glaunsinger W. S. Mercury Intercalates of Titanium Disulfide: Novel Intercalation Compounds. Chem. Mater. 1992, 4, 14–17. 10.1021/cm00019a006. [DOI] [Google Scholar]
- Sidorovw M. V.; McKelvy M. J.; Sharma R.; Glaunsinger W. S. Mechanism of Host-Layer Restacking in HgxTiS2. J. Solid State Chem. 1998, 141, 330–337. 10.1006/jssc.1998.7929. [DOI] [Google Scholar]
- Yao J.; Koski K. J.; Luo W.; Cha J. J.; Hu L.; Kong D.; Narasimhan V. K.; Huo K.; Cui Y. Optical Transmission Enhancement through Chemically Tuned Two-Dimensional Bismuth Chalcogenide Nanoplates. Nat. Commun. 2014, 5, 5670. 10.1038/ncomms6670. [DOI] [PubMed] [Google Scholar]
- Shikin A. M.; Farías D.; Rieder K. H. Phonon Stiffening Induced by Copper Intercalation in Monolayer Graphite on Ni(111). EPL 1998, 44, 44–49. 10.1209/epl/i1998-00432-x. [DOI] [Google Scholar]
- Yang W.; Xiao J.; Ma Y.; Cui S.; Zhang P.; Zhai P.; Meng L.; Wang X.; Wei Y.; Du Z.; Li B.; Sun Z.; Yang S.; Zhang Q.; Gong Y. Tin Intercalated Ultrathin MoO3 Nanoribbons for Advanced Lithium-Sulfur Batteries. Adv. Energy Mater. 2019, 9, 1803137. 10.1002/aenm.201803137. [DOI] [Google Scholar]
- Li Y. R.; Poyraz A. S.; Hu X.; Cuiffo M.; Clayton C. R.; Wu L.; Zhu Y.; Takeuchi E. S.; Marschilok A. C.; Takeuchi K. J. Zerovalent Copper Intercalated Birnessite as a Cathode for Lithium Ion Batteries: Extending Cycle Life. J. Electrochem. Soc. 2017, 164, A2151–A2158. 10.1149/2.1431709jes. [DOI] [Google Scholar]
- Husremović S.; Groschner C. K.; Inzani K.; Craig I. M.; Bustillo K. C.; Ercius P.; Kazmierczak N. P.; Syndikus J.; Van Winkle M.; Aloni S.; Taniguchi T.; Watanabe K.; Griffin S. M.; Bediako D. K. Hard Ferromagnetism down to the Thinnest Limit of Iron-Intercalated Tantalum Disulfide. J. Am. Chem. Soc. 2022, 144, 12167–12176. 10.1021/jacs.2c02885. [DOI] [PubMed] [Google Scholar]
- An J.; Han M.-K.; Kim S.-J. Synthesis of Heavily Cu-Doped Bi2Te3 Nanoparticles and Their Thermoelectric Properties. J. Solid State Chem. 2019, 270, 407–412. 10.1016/j.jssc.2018.11.024. [DOI] [Google Scholar]
- Gong Y.; Yuan H.; Wu C.-L.; Tang P.; Yang S.-Z.; Yang A.; Li G.; Liu B.; van de Groep J.; Brongersma M. L.; Chisholm M. F.; Zhang S.-C.; Zhou W.; Cui Y. Spatially Controlled Doping of Two-Dimensional SnS2 through Intercalation for Electronics. Nat. Nanotechnol. 2018, 13, 294–299. 10.1038/s41565-018-0069-3. [DOI] [PubMed] [Google Scholar]
- Kong D.; Randel J. C.; Peng H.; Cha J. J.; Meister S.; Lai K.; Chen Y.; Shen Z.-X.; Manoharan H. C.; Cui Y. Topological Insulator Nanowires and Nanoribbons. Nano Lett. 2010, 10, 329–333. 10.1021/nl903663a. [DOI] [PubMed] [Google Scholar]
- Keuleyan S.; Wang M.; Chung F. R.; Commons J.; Koski K. J. A Silicon-Based Two-Dimensional Chalcogenide: Growth of Si2Te3 Nanoribbons and Nanoplates. Nano Lett. 2015, 15, 2285–2290. 10.1021/nl504330g. [DOI] [PubMed] [Google Scholar]
- Kushnir K.; Wang M.; Fitzgerald P. D.; Koski K. J.; Titova L. V. Ultrafast Zero-Bias Photocurrent in GeS Nanosheets: Promise for Photovoltaics. ACS Energy Lett. 2017, 2, 1429–1434. 10.1021/acsenergylett.7b00330. [DOI] [Google Scholar]
- Reed B. W.; Williams D. R.; Moser B. P.; Koski K. J. Chemically Tuning Quantized Acoustic Phonons in 2D Layered MoO3 Nanoribbons. Nano Lett. 2019, 19, 4406–4412. 10.1021/acs.nanolett.9b01068. [DOI] [PubMed] [Google Scholar]
- Li G.; Jiang L.; Pang S.; Peng H.; Zhang Z. Molybdenum Trioxide Nanostructures: The Evolution from Helical Nanosheets to Crosslike Nanoflowers to Nanobelts. J. Phys. Chem. B 2006, 110, 24472–24475. 10.1021/jp064855v. [DOI] [PubMed] [Google Scholar]
- Manxzer L. E.; Deaton J.; Sharp P.; Schrock R. R.. Tetrahydrofuran Complexes of Selected Early Transition Metals. In Inorganic Syntheses; John Wiley & Sons, Inc.: Hoboken, NJ, 2007; pp 135–140. [Google Scholar]
- Cotton S. A. Chapter 11. Titanium, Zirconium and Hafnium. Annu. Rep. Sect. (Inorg. Chem.) 1995, 92, 147. 10.1039/ic9959200147. [DOI] [Google Scholar]
- Janas Z.; Sobota P.; Lis T. Interaction of Titanium and Tin Chlorides in Tetrahydrofuran. The X-Ray Crystal Structure of [Trans-TiCl2(THF)4]+[SnCl5(THF)]-. Polyhedron 1988, 7, 2655–2658. 10.1016/S0277-5387(00)83888-7. [DOI] [Google Scholar]
- Damyanov D.; Velikova M.; Ivanov I.; Vlaev L. On the mechanism of interaction between TiCl4 vapour and surface OH groups of amorphous SiO2. Journal of non-crystalline solids 1988, 105, 107–113. 10.1016/0022-3093(88)90344-4. [DOI] [Google Scholar]
- Beguin F.; Setton R.; Beguin F.; Setton R.; Hamwi A.; Touzain P. The Reversible Intercalation of Tetrahydrofuran in Some Graphite-Alkali Metal Lamellar Compounds. Mater. Sci. Eng. 1979, 40, 167–173. 10.1016/0025-5416(79)90186-1. [DOI] [Google Scholar]
- Powell A. V. Chapter 7. Intercalation Compounds of Low-Dimensional Transition Metal Chalcogenides. Annu. Rep. Sect. C: Phys. Chem. 1993, 90, 177. 10.1039/pc9939000177. [DOI] [Google Scholar]
- Beneš L.; Melánová K.; Zima V.; Kalousová J.; Votinský J. Possible mechanisms of intercalation. J. Incl. Phenom. 1998, 31, 275. 10.1023/A:1007976213743. [DOI] [Google Scholar]
- Reed B. W.; Huynh V.; Tran C.; Koski K. J. Brillouin Scattering of V2O5 and Sn-Intercalated V2O5. Phys. Rev. B 2020, 102, 054109. 10.1103/PhysRevB.102.054109. [DOI] [Google Scholar]
- Chacón-Torres J. C.; Wirtz L.; Pichler T. Raman Spectroscopy of Graphite Intercalation Compounds: Charge Transfer, Strain, and Electron-Phonon Coupling in Graphene Layers. Phys. Status Solidi B 2014, 251, 2337–2355. 10.1002/pssb.201451477. [DOI] [Google Scholar]
- Gross A. L.; Falling L.; Staab M. C.; Montero M. I.; Ullah R. R.; Nisson D. M.; Klavins P.; Koski K. J.; Curro N. J.; Taufour V.; Nemsak S.; Vishik I. M. Copper Migration and Surface Oxidation of CuxBi2Se3 in Ambient Pressure Environments. J. Phys. Mater. 2022, 5, 044005. 10.1088/2515-7639/ac93b5. [DOI] [Google Scholar]
- Moulder J. F.; Stickle W. F.; Sobol P. E.. Handbook of X-Ray Photoelectron Spectroscopy: A Reference Book of Standard Spectra for Identification & Interpretation of XPS Data; Perkin-Elmer, Physical Electronics Division, 1992. [Google Scholar]
- Li L.; Wang Y.; Meng L.; Wu R.-T.; Gao H.-J. Hafnium Intercalation between Epitaxial Graphene and Ir(111) Substrate. Appl. Phys. Lett. 2013, 102, 093106. 10.1063/1.4793427. [DOI] [Google Scholar]
- Lutterotti L.; Matthies S.; Wenk H.. MAUD: a friendly Java program for material analysis using diffraction. IUCr: Newsletter of the CPD: IUCr, 1999; p 21
- Toby B. H.; Von Dreele R. B. GSAS-II: the genesis of a modern open-source all purpose crystallography software package. J. Appl. Crystallogr. 2013, 46, 544–549. 10.1107/S0021889813003531. [DOI] [Google Scholar]
Associated Data
This section collects any data citations, data availability statements, or supplementary materials included in this article.


