Abstract
Lettuce is an in vitro-evolved DNA that binds and activates conditional fluorophores derived from green fluorescent protein (GFP). To extend to DNA previous structural studies of fluorogenic RNAs as well as GFP and other fluorescent proteins, we have characterized Lettuce-fluorophore complexes by X-ray crystallography and cryo-electron microscopy. These reveal that the 53-nucleotide DNA adopts a four-way junction fold in which four DNA stems associate coaxially to form its fluorophore binding site at a G-quadruplex. This fold is stabilized by stacking, extensive nucleobase hydrogen bonding –including by unusual diagonally stacked bases that bridge successive tiers of the main coaxial stack of the DNA– and coordination of monovalent and divalent cations. Lettuce demonstrates how DNA can form elaborate three-dimensional structures without employing RNA-like tertiary interactions, and suggests that new principles of nucleic acid organization will be forthcoming from the analysis of complex DNAs.
Introduction
DNA exists primarily as a double helix, in which two complementary strands hybridize, making the overall B-form helical geometry largely independent from nucleotide sequence1–3. Functional DNA molecules, whose sophisticated biochemical or biophysical activities arise from their specific nucleotide sequences, have been isolated through in vitro selection4–6. Analogous to their RNA counterparts (including aptamers, ribozymes, and riboswitches), it is thought that the non-helical elements of functional DNAs adopt non-canonical three-dimensional (3D) folds that endow them with unique biochemical properties. However, and in contrast to the rapidly growing body of structures of functional RNAs determined by X-ray crystallography, NMR spectroscopy, or cryo-electron microscopy (cryo-EM)7–12, only limited information is available on the atomistic basis of functional DNA activity.
Lettuce is the first reported DNA mimic of green fluorescent protein (GFP)13. This formally single-stranded DNA (ssDNA) induces fluorescence of conditional fluorophores such as DFHBI-1T (1), DFHO (2) and DFAME (3)14,15 (Fig. 1a,b), which are small molecules derived from the intrinsic fluorophore of GFP. Numerous fluorescent turn-on aptamer RNAs have been characterized, and such RNA mimics of GFP have been widely used as molecular tags in applications ranging from live imaging of cellular RNAs to small-molecule sensors16–24. Structure determination of fluorogenic RNAs has revealed complex, diverse 3D structures that allow those aptamers to recognize their fluorophores and constrain their photoexcited states to produce fluorescence16. To elucidate how DNA can also function as an analog of GFP, we determined the co-crystal structure of Lettuce bound to DFHBI-1T at 2.5-Å resolution (Methods, Extended Data Fig. 1, Extended Data Table 1).
Fig. 1. Overall structure of the Lettuce fluorescence turn-on DNA aptamer.
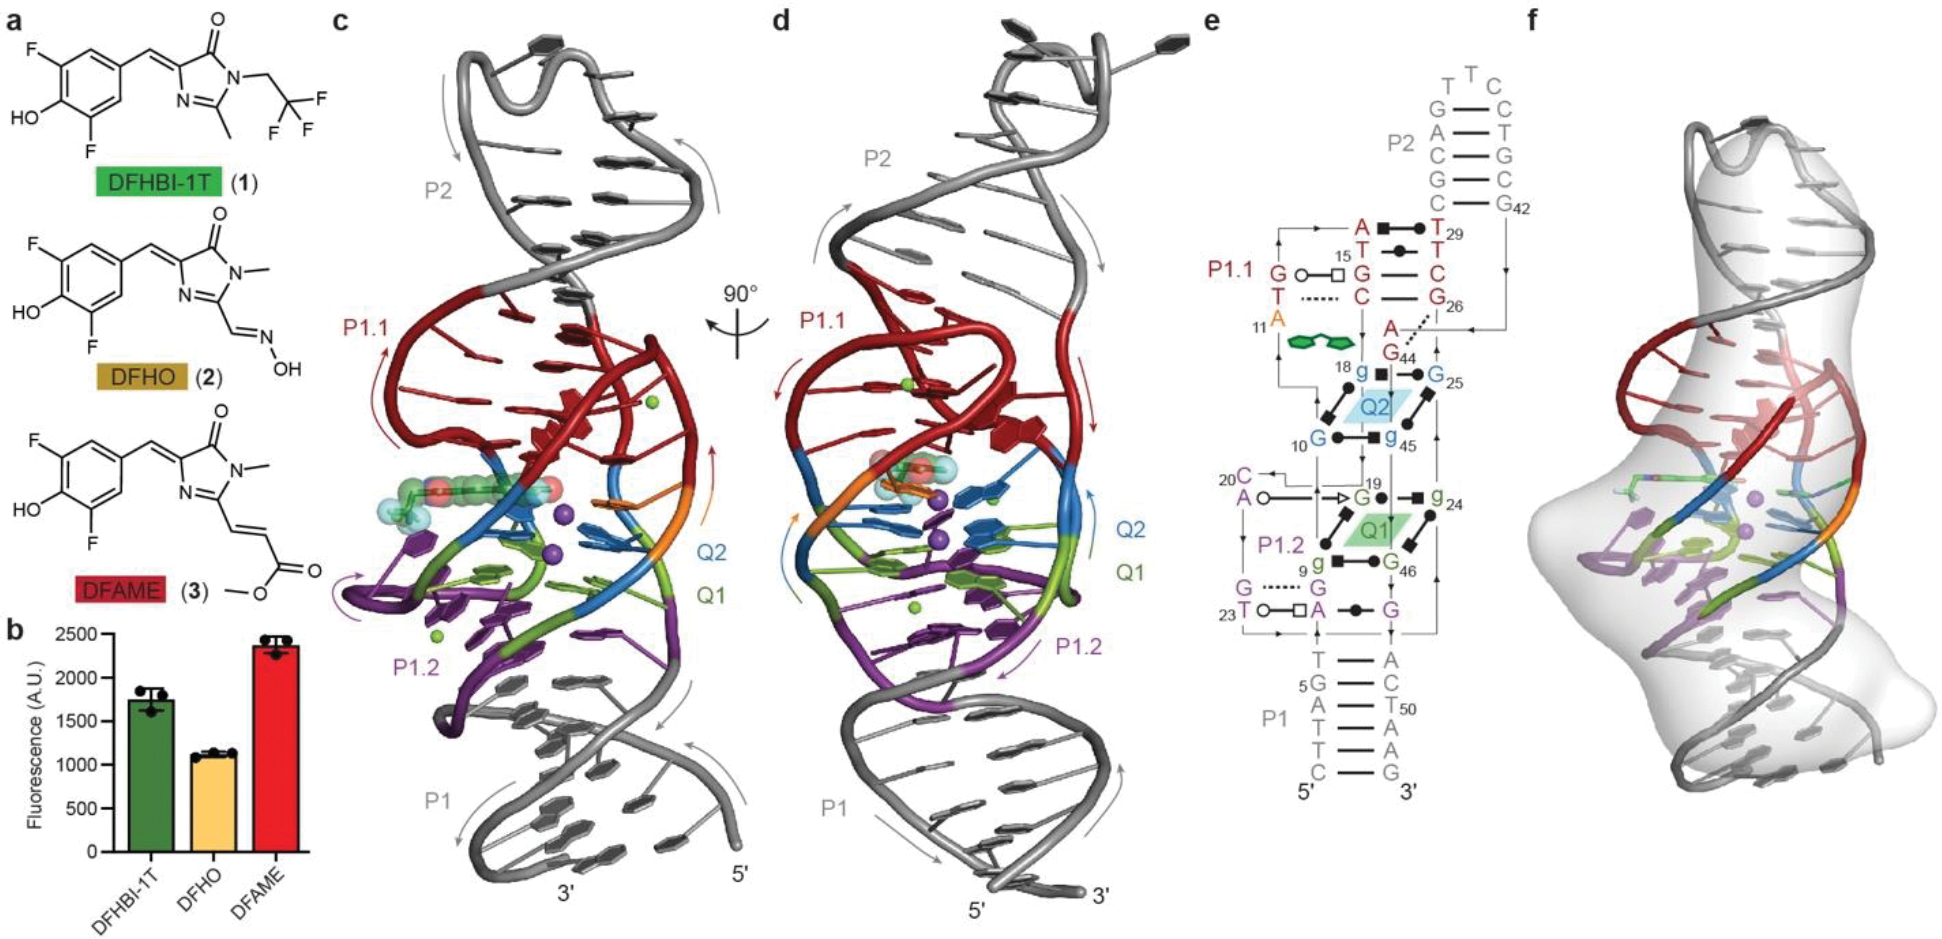
a, Structures of the fluorophores DFHBI-1T (1), DFHO (2), and DFAME (3). b, Fluorescence of Lettuce in the presence of different fluorophores (mean ± s.d., n = 3). c, Cartoon representation of the Lettuce–DFHBI-1T co-crystal structure. Arrows denote 5′-to-3′ chain direction; purple and green spheres represent K+ and Mg2+, respectively. Translucent spheres highlight bound DFHBI-1T molecule. Color scheme used throughout. d, Orthogonal view. e, Secondary structure of Lettuce. Lines with arrowheads and Leontis-Westhof symbols48 denote connectivity and base pairs, respectively. f, Cryo-EM envelope of unliganded Lettuce superimposed on the Lettuce–DFHBI-1T co-crystal structure.
Overall structure of the fluorogenic DNA
The functional core of the 53-nucleotide (nt) Lettuce DNA adopts a convoluted 3D structure. It is flanked on either end by B-form duplexes (paired elements P1 and P2, the latter capped by a trinucleotide loop) (Fig. 1c–e). The two formally ssDNA strands connecting these duplexes on either side fold back on themselves to form two stem-loops (with non-canonical base pairs in their stems), P1.1 and P1.2. This 4-way junction, cloverleaf-like secondary structure folds into a single ~66 Å-long coaxial stack, instead of the L- or T-shaped folds commonly adopted by RNA 4-way junctions. To achieve this, P1.1 packs against the broadened minor groove at the base of P2, while P1.2 packs against the major groove that follows P1. In both sides, this results in close apposition of four DNA strands. At the center of Lettuce, these come together into an antiparallel G-quadruplex25,26, comprised of two canonical G-quartets (Q1 and Q2). The B-form duplexes P1 and P2, their quadruplexes with P1.1 and P1.2, and the G-quadruplex stack coaxially. A single molecule of DFHBI-1T binds between Q2 and P1.1. The presence of a G-quadruplex in Lettuce is consistent with previous biochemical characterization13. Circular dichroism (CD) spectra of fluorophore-bound and -free Lettuce imply the presence of a G-quadruplex in both (Extended Data Fig. 1h). Single-particle cryo-EM analysis of the ligand-free DNA yielded a Coulomb potential map that indicates the DNA is monomeric and largely folded before binding the fluorophore (Fig. 1f, Methods, Extended Data Fig. 2, Extended Data Table 2). Size-exclusion chromatography coupled to multi-angle light scattering confirmed that the monomeric aptamer predominates in solution (Extended Data Fig. 1h).
Structure of the fluorophore-binding site
The fluorophore-binding site of Lettuce is formed by the G-quartet Q2, the four DNA strands adjacent to it, C20 from P1.2, and a monovalent cation (Fig. 1e; Fig. 2a,b). Two monovalent cations (Tl+ in the crystals used for de novo structure determination by the single-wavelength anomalous dispersion method, K+ in the native crystals used for refinement, Methods, Extended Data Fig. 3a–c, Extended Data Table 1) bind at the 4-fold axis of the quadruplex. One is octahedrally coordinated between Q1 and Q2, as is typical for G-quadruplexes27. The second coordinates the carbonyl oxygens of the guanines of Q2, the N1 imino nitrogen of A11, and the phenolate oxygen of the bound DFHB1–1T (additional ligands are presumed to be waters). Consistent with the direct cation-fluorophore coordination, the fluorescence spectrum of Lettuce-DFHBI-1T exhibits an 8 nm bathochromic shift in the presence of Tl+, compared to the spectrum in K+ (Extended Data Fig. 3d). The phenolate of the fluorophore also hydrogen bonds to the N6 amine of A11, and the phenyl ring is sandwiched between G18 and the C17•G26 base pair. The two fluorine substituents of the phenyl ring may also participate in weakly polar interactions28,29 with the N6 of A11 and the N2 of G44. The imidazolone ring of the fluorophore makes no hydrogen bonds with the DNA, although it may be sterically restrained by the deoxyribose of G26. The trifluoromethyl substituent of the imidazolone is in van der Waals contact with the base of C20. The A11 base is unpaired but appears to be held in place by K+ coordination and sandwiching between Q2 and the T12•C17•G26 base triple. Most unusual is the conformation of G44 whose base lies at an angle of ~ 55° relative to the base of G26 (and most of the coaxially stacked nucleotides of Lettuce). This unique arrangement allows a G44-G26 hydrogen bond, while at the same time bringing the N2 of G44 in proximity (3 Å) to a fluorine of the fluorophore. A43 is also at the same unusual angle (as it stacks on the base of G44), allowing it to simultaneously pack against the T12•C17•G26 and G13•G16•C27 base triples (Fig. 2a,b and 3a,b). Overall, a number of atypical interactions form the Lettuce fluorophore binding site.
Fig. 2. The Lettuce fluorophore binding site.
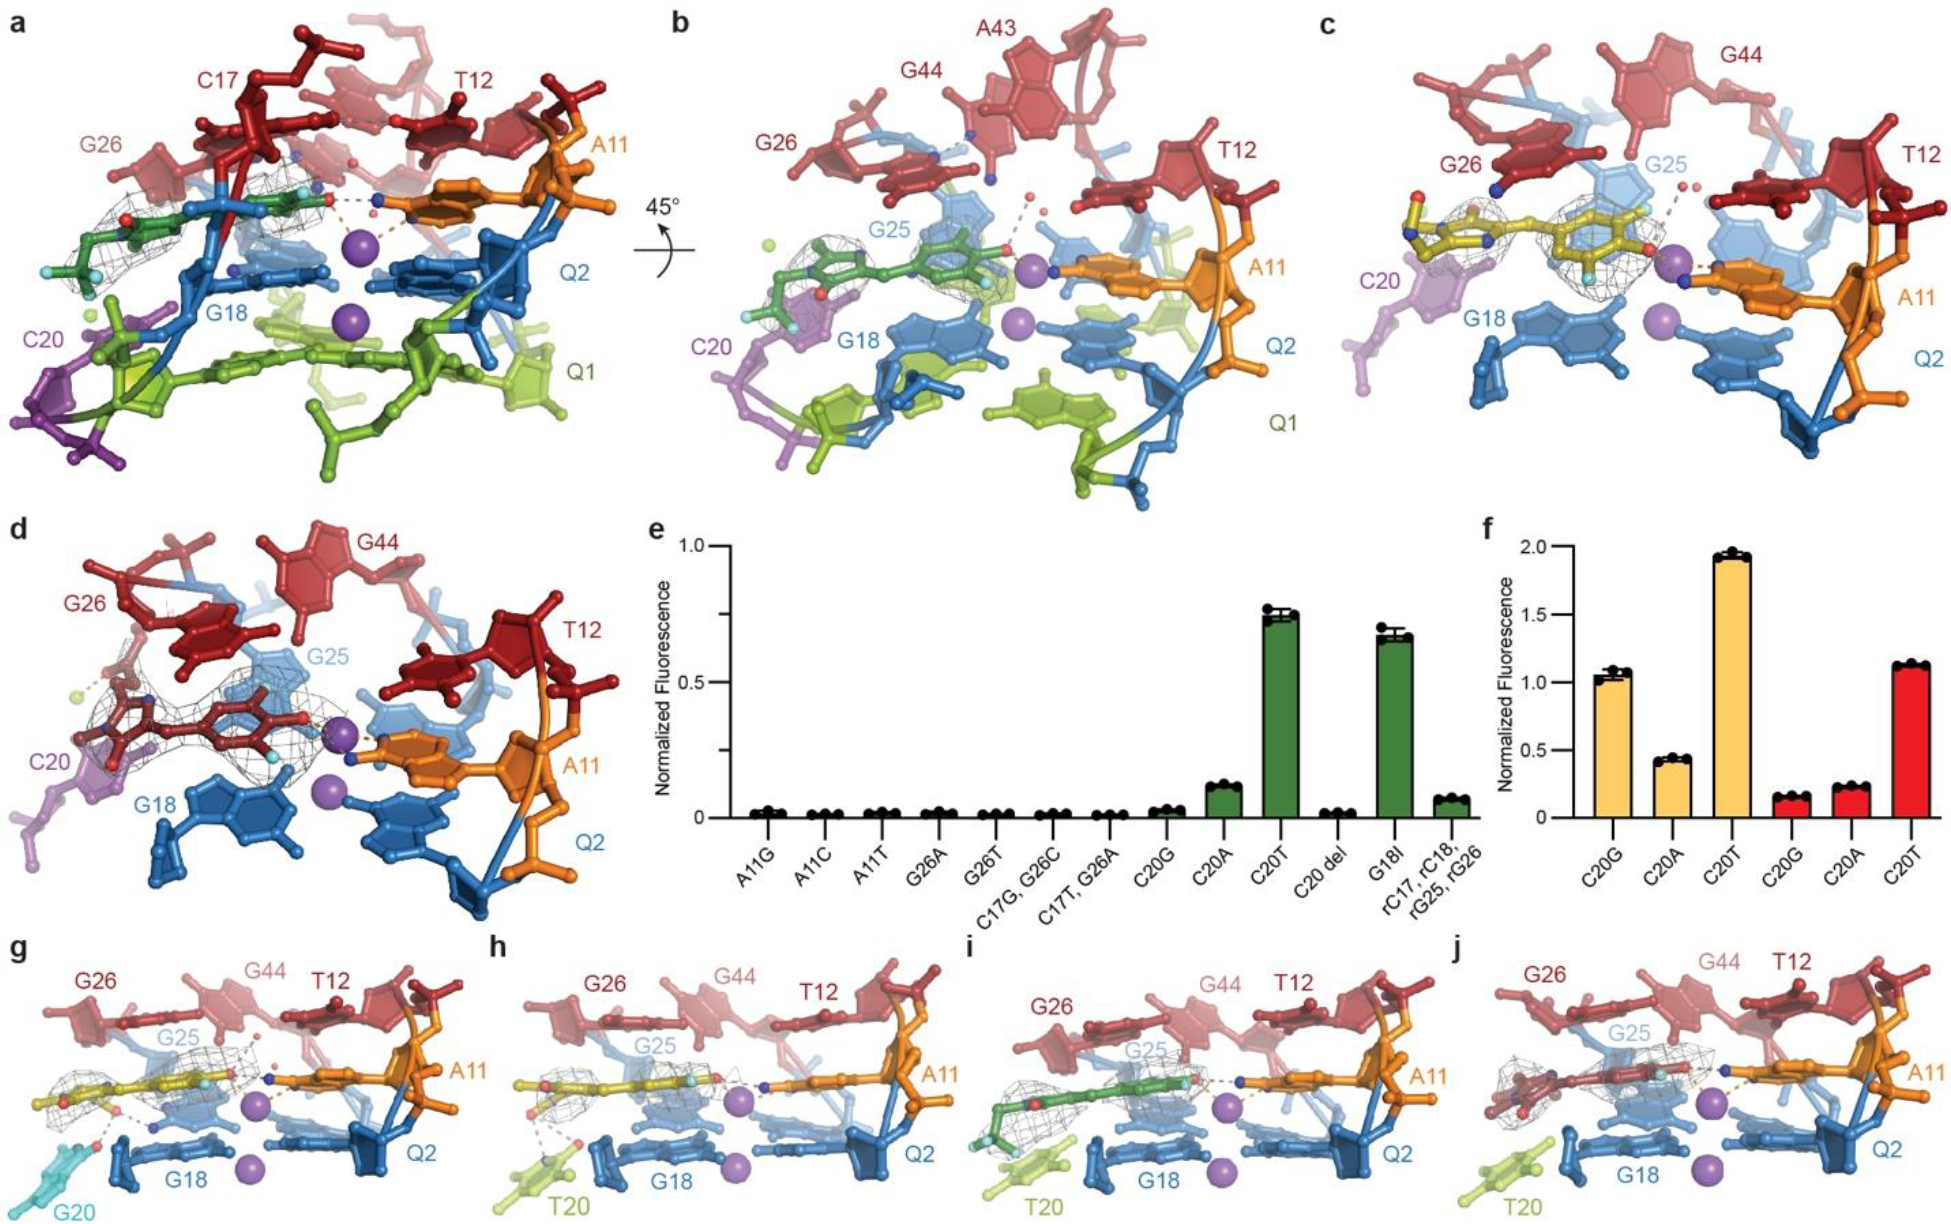
a, View of bound DFHBI-1T. Gray mesh depicts the |Fo| − |Fc| electron density map before building the fluorophore, contoured at 3.0 standard deviations above mean peak height (σ). Gray and orange dashed lines denote hydrogen bonds and metal ion coordination, respectively. Red spheres are water molecules. b, Orthogonal. c, View of bound DFHO. d, View of bound DFAME. Gray mesh depicts the |Fo| − |Fc| electron density before building the fluorophores, contoured at 3.0 (c) or 2.0 σ (d). e, Fluorescence of site-directed mutants of the binding site in the presence of DFHBI-1T, normalized to wild-type (mean ± s.d., n ≥ 3). f, Fluorescence of C20 mutants of Lettuce in presence of DFHO (yellow bars), and DFAME (red bars), normalized to wild-type bound to each fluorophore (mean ± s.d., n ≥ 3). g, View of the Lettuce C20G binding site with bound DFHO, h, Lettuce C20T binding site with bound DFHO, i, Lettuce C20T binding site with bound DFHBI-1T, and j, Lettuce C20T binding site with bound DFAME. Gray mesh depicts the |Fo| − |Fc| electron density map before building the fluorophores, contoured at 3.0 (g, h, and i) or 2.0 (j) σ.
Fig. 3. The Lettuce core and its structure-guided minimization.
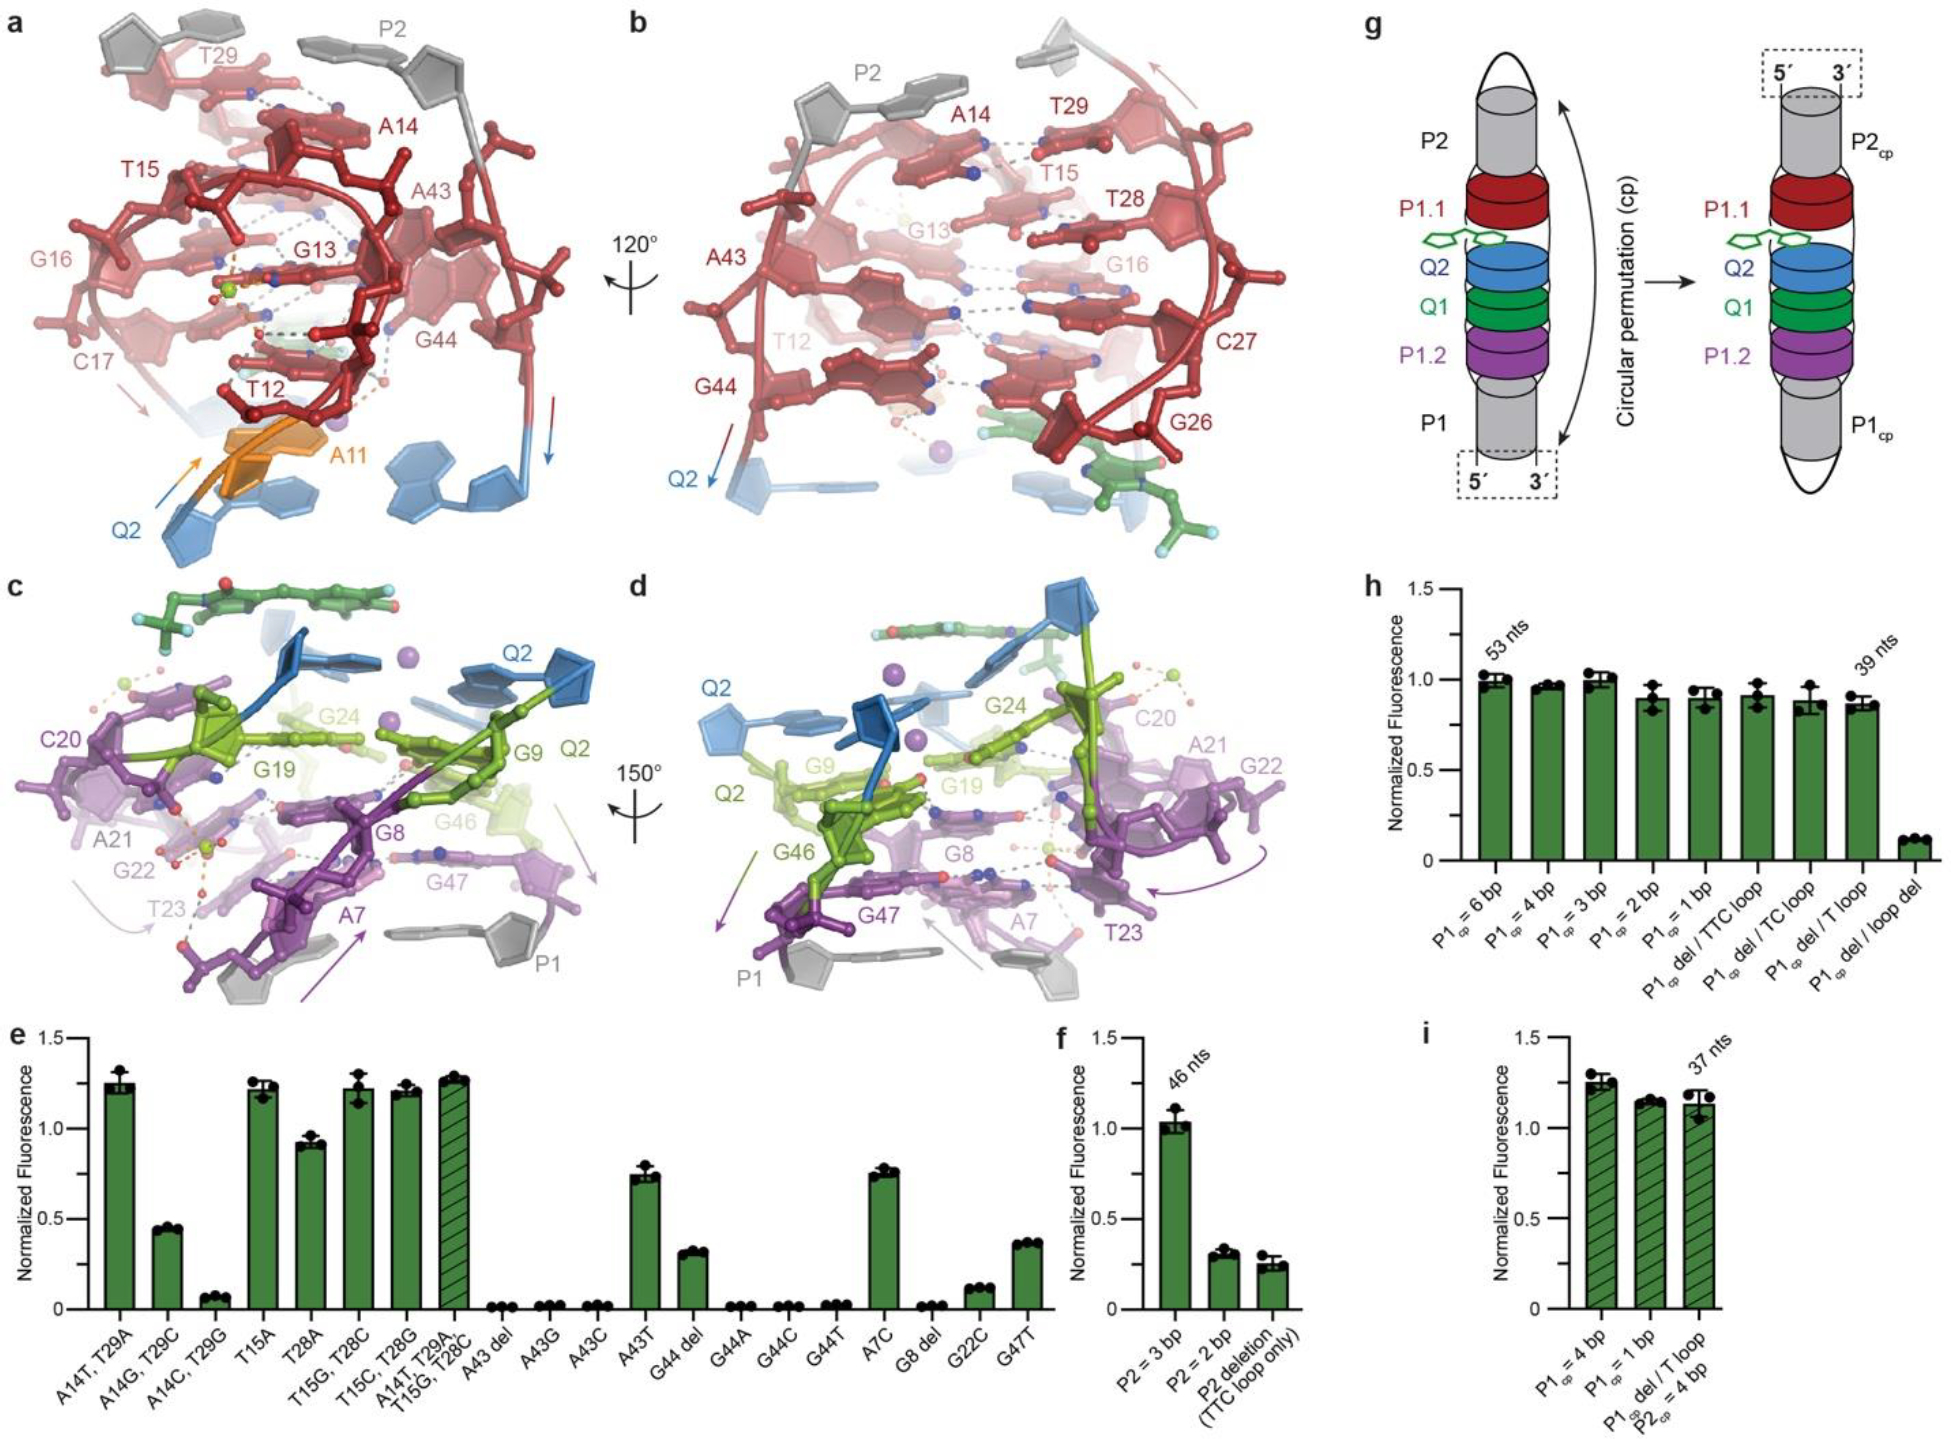
a, View of P1.1. b, Orthogonal view. c, View of P1.2 element of Lettuce. d, Orthogonal view of c. e, Fluorescence of site-directed mutants of P1.1 and P1.2 in the presence of DFHBI-1T, normalized to wild-type (mean ± s.d., n ≥ 3). Striped bar, A14T•T29, T15G•T28C mutant. f, Fluorescence of Lettuce constructs with shortened P1 in the presence of DFHBI-1T, normalized to wild-type (mean ± s.d., n ≥ 3). g, Schematic of circular permutation. h, Fluorescence of Lettuce constructs with permuted P1 (P1cp) in the presence of DFHBI-1T, normalized to wild-type (mean ± s.d., n ≥ 3). i, Fluorescence of Lettuce mutant A14T•T29, T15G•T28C and shortened P1cp in the presence of DFHBI-1T, normalized to wild-type (mean ± s.d., n ≥ 3).
We further examined the role of Lettuce binding-site nucleotides in fluorophore recognition by determining co-crystal structures of Lettuce-DFHO and Lettuce-DFAME complexes (Extended Data Fig. 3e–f, Extended Data Table 1, Methods), and through site-directed mutagenesis. Most of the interactions between the fluorophores and the DNA are conserved between the three structures (Fig. 2a–d). The main differences are in interactions of the divergent exocyclic substituents of the imidazolones of the three fluorophores. Thus, the DFHO oxime hydrogen bonds with N2 of G26, while the methylacrylate of DFAME coordinates a Mg2+ ion. Mutations of A11, C17, and G26, as well as deletion of C20 largely abolished fluorescence, consistent with their importance (Fig. 2e). The importance of close packing of the DNA is underlined by the deleterious effect of replacing C17, C18, G25 and G26 with the corresponding ribonucleotides. Unexpectedly, the C20T mutant activated DFHBI-1T fluorescence nearly as well as wild-type, slightly increased activation of DFAME, and nearly doubled activation of DFHO (Fig. 2f). The importance of residue 20 in conferring fluorophore selectivity is further underscored by the C20G mutant, which activates DFAME poorly, and is 35-fold more selective for DFHO vs. DFHBI-1T.
To better understand the structural basis of the selectivity switches induced by mutations of residue 20, we determined the co-crystal structures of Lettuce C20G bound to DFHO, Lettuce C20T bound to DFHBI-1T, Lettuce C20T bound to DFHO, and Lettuce C20T bound to DFAME (Fig. 2g–j, Extended Data Table 1, Extended Data Fig. 4, Methods). The DFHO complex structures reveal that the imidazolone ring of the fluorophore has flipped from the Z to the E isomer, bringing the oxime of its exocyclic substituent into hydrogen bonding distance of O6 of G20 and N2 of G25 in the C20G mutant, and of O4 and N3 of T20 in the C20T mutant. Since other fluorophore-DNA interactions are conserved between our eight co-crystal structures, we conclude that direct interactions with the nucleobase at position 20, and not second-order effects, are responsible for the divergent fluorophore preferences of the mutants. These results suggest that further structure-guided engineering of the Lettuce scaffold or of the fluorophores could produce improved selectivities.
Stabilization of the overall DNA fold
The compact fold of Lettuce appears to be stabilized by extensive stacking (all nucleobases in its core stack on others), numerous non-Watson-Crick base pairs, triples and quadruples, and divalent cation coordination in P1.1 and P1.2 (in addition to the K+ ions in the G-quadruplex) (Fig. 3a–d). Examination of Lettuce fluorescence as a function of Mg2+ concentration (in the presence of physiologic K+) showed that the DNA is inactive in the absence of the divalent, and exhibits half-maximal activity (K1/2) at ~1.4 mM Mg2+ (Extended Data Fig. 5a). Lettuce is also active when Mg2+ is replaced with Ca2+ or Mn2+ (Extended Data Fig. 5b), indicating that the divalent cation requirement is primarily to shield negative charge (Extended Data Fig. 5c–f). Consistent with this30, our co-crystal structures of Lettuce all share two crystallographically ordered, partially inner-sphere-coordinated, DNA-bound divalent cations at locations where multiple DNA strands are in close apposition (where the electrostatic potential would be most negative): near the sharp backbone turns of P1.1 (Fig. 3a) and P1.2 (Fig. 3d). At both backbone turns, a dense network of hydrogen-bond interactions stitches nucleobases together, and these are further buttressed by hydrogen-bonding to pronouncedly inclined nucleobases (A43 and G44 in P1.1; A21, G22 and T23 in P1.2) that bridge nucleotides in adjacent tiers. Notably absent from this DNA fold are long-range backbone-base and backbone-backbone tertiary contacts (both common in folded RNAs), except when mediated through bound cations.
We tested the functional importance of tertiary interactions in the Lettuce core, as well as the possibility of optimizing its function, by site-directed mutagenesis (Fig. 3e). In the wild-type, A14 closes the apex of the P1.1 turn by pairing through its Hoogsteen face to T29, which is at the base of P2 (Fig. 3a). Mutagenesis shows that inverting this pair to a T•A pair improves activity by 25%. However, strengthening the pair by converting it to either a C•G or G•C pair is detrimental. This differs from the T15•T28 pair at the center of the P1.1 turn, which improves activity when converted to a C•G or G•C pair. A43 and A44 are generally intolerant of mutation or deletion, underscoring the functional importance of these two nucleotides with unusual conformation. Similarly, the inclined G22 of P1.2 is sensitive to mutation. A7, G8 and G47, which participate in the network of hydrogen bonding in P1.2 are also sensitive to mutation.
Structure-guided optimization of a fluorogenic DNA
Initial experiments aimed at minimizing Lettuce showed that the DNA could be split by separating the strands of P1 and P213. Those experiments suggested that stability of the two paired elements is important for activity. By progressively shortening P2, we found that at least three base pairs are needed for optimal function (Fig. 3f). To shorten P1 while maintaining stability, we circularly permuted the DNA, such that its 5’ and 3’ termini are located in P2, and P1 is closed by a loop (Fig. 3g). This rearrangement allowed us to delete P1 entirely, shortening the DNA to 39 nt (Fig. 3h), while retaining 85% of activity. We then improved activity by including the A14T,T29A and T15G,T28C mutations that enhanced fluorescence of wild-type (Fig. 3e), and shortened P2 to 4 nt, thereby producing “Bibb Lettuce” a fluorescent DNA tag ~30% smaller (37 nt) and brighter than the parental Lettuce (Fig. 3i).
A fluorescent reporter for R-loop formation
A number of biological processes, including recombination, repair, replication, and transcription31–33 transiently produce ssDNA, often as R-loops (a DNA duplex where one strand is displaced locally by a complementary RNA, resulting in extrusion a ssDNA segment; ref. 34,35). To test if Lettuce can report on formation of R-loops, we synthesized a 151-bp duplex DNA encoding Bibb Lettuce on one strand. When annealed with a 100-nt RNA, an R-loop should form (Fig. 4a). We find that in this context, Lettuce fluoresces ~30% as brightly much as when in isolation, but at least 15 times more brightly than the free fluorophore (DFHBI-1T; Fig. 4b). Non-denaturing polyacrylamide gel (PAGE) analysis shows that although R-loop formation under these conditions is not very efficient (Fig. 4d; R-loop was confirmed by RNase H and RNase A treatment, Extended Data Fig. 6a), its formation can be detected by soaking the gel in DFHO and illuminating at 488 nm (Fig. 4d). Thus, extrusion of a single strand of DNA bearing Lettuce from a duplex can be monitored directly through fluorescence.
Fig. 4. Detection of R-loop formation by Lettuce, and comparison with RNA and protein counterparts.
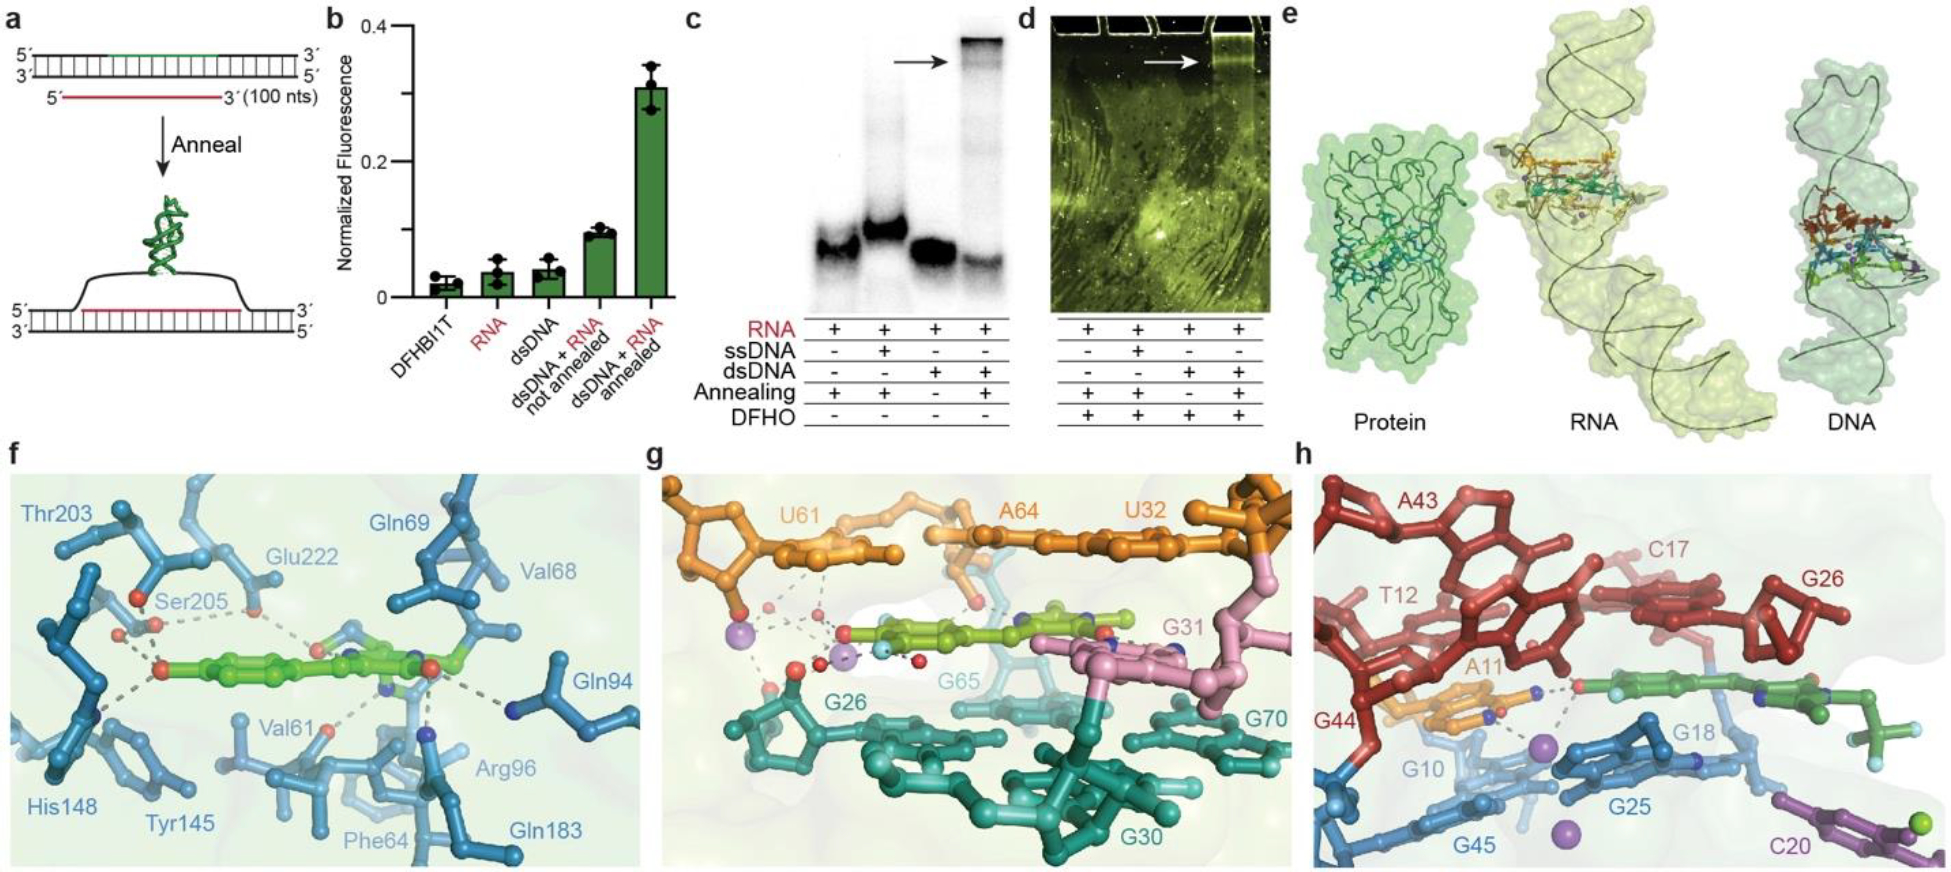
a, Schematic of R-loop assay. b, Fluorescence of DFHBI-1T in the presence of buffer, RNA, dsDNA, dsDNA + RNA not co-annealed, dsDNA + RNA co-annealed, normalized to wild-type Lettuce (mean ± s.d., n ≥ 3). c, Non-denaturing PAGE. Arrow denotes R-loop. d, Fluorescence of same gel as in c, after soaking in DFHO. Arrow denotes R-loop. e, Molecular surfaces and cartoons of GFP36, Spinach38, and Lettuce, to scale. f, GFP chromophore site36. g, Spinach bound to DFHBI38. h, Lettuce bound to DFHBI-1T.
Principles of non-helical DNA architecture
Our co-crystal structures of fluorophore-bound Lettuce provide the first atomic-level information on how a third category of biomolecule can activate a conditional fluorophore (Fig. 4e). Comparison of the fluorophore-binding sites of green fluorescent protein36,37, the RNA aptamer Spinach in complex with DFHBI38,39 and Lettuce shows how the distinct chemical characteristics of the three biopolymers have responded to similar selective pressure. GFP employs a combination of aromatic, non-polar and polar amino acid side-chains to surround its fluorophore, and make hydrogen bonds with every polar atom in it. Even though the maximally fluorescent species of the fluorophore is the phenolate40, GFP does not use a cation to bind the phenolic oxygen. Two aromatic side chains, Phe64 and Tyr145 are at angles of ~45° to the plane of the fluorophore, rather than stacking face-to-face (Fig. 4f). The all-RNA binding site of Spinach also hydrogen bonds to all available polar atoms of the fluorophore, but unlike the protein, stacks face-to-face with the heterocycles of the small molecule, sandwiching it between a G-quartet and a base triple. Spinach employs ribose 2’-OH groups as well as nucleobase polar groups to construct a dense network of direct and water-mediated hydrogen bonds around the fluorophore. Notably, the binding site of the RNA is organized in three distinct stacked layers, with the fluorophore and the functionally essential38 unpaired residue G31 comprising the middle layer (Fig. 4g). When compared to GFP and Spinach, Lettuce is noteworthy in only hydrogen bonding to the phenolate oxygen of the fluorophore (Fig. 4h). Uniquely among the three fluorescent macromolecules, it employs a buried monovalent cation to coordinate directly to this anionic functional group. The Lettuce binding site also is organized in three layers, with the fluorophore•A11 layer sandwiched between a G-quartet and a base triple. However, the DNA augments this with nucleobases that are not parallel to the planes, including the unusual 55°-inclined A43 and G44, and the functionally important extrahelical C20. The more diverse use of nucleobases by the DNA when compared to the RNA likely reflects the unavailability of the ribose 2’-OH to participate in hydrogen bond networks and tertiary interactions abundant in structured RNAs such as ribose zippers41 and A-minor42 motifs.
Our crystallographic and cryo-EM analysis of lettuce extends previous structural studies of smaller DNA aptamers, as well as DNA-RNA complexes, to a functional, all-DNA molecule that is large enough to assemble a binding site by spatially juxtaposing residues separated by as many as 35 nt. Convergence into spatial proximity of multiple residues distant in linear sequence [i.e., with high contact order43] is the key structural problem that biopolymers need to solve in assembling active sites44. Smaller DNA aptamers use nucleotides from the two strands of their often non-canonical duplex stems to assemble their binding sites (Extended Data Fig. 6b–f). In contrast, by virtue of its larger size, Lettuce can recruit nucleotides from four separate strands to construct its fluorophore-binding site. Lettuce has evolved to take advantage of specific properties of DNA. Thus, an RNA comprised of the Lettuce sequence is inactive (Extended Data Fig. 6g). Moreover, analysis of pucker angles shows that the majority of Lettuce nucleotides adopt the C2’-endo conformations that is characteristic of DNA. Only seven core deoxyriboses adopt the C3’-endo furanose puckers typical of RNA (or the rare O4’-endo form). This is a near-mirror of the distribution of pucker angles in the RNA aptamer45 iSpinach (Extended Data Fig. 6h–k, Extended Data Table S2). When extended to the structures of the RNA complexes of deoxyribozymes 9DB1 and Dz3646,47, this analysis shows that in those molecules, the majority of DNA residues are also in the C2’-endo conformation characteristic of deoxyribonucleotides (when their extensive DNA-RNA heteroduplexes, which are constrained to the C3’-endo pucker by the RNA strand, are excluded). Overall, our structural analysis of Lettuce indicates that functional DNAs employ structural strategies different from those of functional RNAs, and suggests that new principles of nucleic acid 3D organization will be forthcoming from the analysis of complex DNA molecules.
MATERIALS AND METHODS
Fluorophores
(Z)-4-(3,5-difluoro-4-hydroxybenzylidene)-2-methyl-1-(2,2,2-trifluoroethyl)-1H-imidazol-5(4H)-one) (DFHBI, 1), (Z)-4-(3,5-Difluoro-4-hydroxybenzylidene)-1-methyl-5-oxo-4,5-dihydro-1H-imidazole-2-carbaldehyde oxime (DFHO, 2), and 3,5-difluoro-4-hydroxybenzylidene imidazolinone-2-acrylate methyl (DFAME, 3) were synthesized as previously described14,15,49 and used without further purification.
DNA preparation
DNA constructs used in this study are listed in Extended Data Table 4. DNAs were purchased from Integrated DNA Technologies (IDT). For crystallographic studies, DNAs were purified by denaturing gel electrophoresis (10% polyacrylamide, 29:1 acrylamide:bisacrylamide; 1× TBE, 8 M urea). After ultraviolet shadowing and excision from gels, DNAs were recovered by electroelution, washed with 1 M KCl, exchanged into H2O, concentrated by centrifugal ultrafiltration (Amicon Ultra, 10 kDa molecular weight cut-off, EMD Millipore), and stored at −20 °C. Prior to use, 10× buffer was added to samples to reach final concentration 20 mM MOPS–KOH pH 7.0, 150 mM KCl, 1 mM MgCl2, and 10 μM EDTA (20 mM MOPS–Ba(OH)2 pH 7.0, 100 mM Tl Acetate, 1 mM MgCl2, and 10 μM EDTA for the thallium folded dataset). Samples were heated to 95 °C for 3 min then allowed to cool at 21 °C for 10 minutes.
RNA preparation
RNA constructs used in this study are listed in Extended Data Table 4. Hybrid deoxyribose and ribose constructs were purchased from IDT. RNAs were transcribed from PCR templates with T7 RNA polymerase, and purified by denaturing gel electrophoresis (10% polyacrylamide, 29:1 acrylamide:bisacrylamide; 1× TBE, 8 M urea). After ultraviolet shadowing and excision from gels, RNAs were recovered by electroelution, washed with 1 M KCl, exchanged into H2O, concentrated by centrifugal ultrafiltration (Amicon Ultra, 10 kDa molecular weight cut-off, EMD Millipore), and stored at −20 °C. Prior to use, 10× buffer was added to samples to reach final concentration 20 mM MOPS–KOH pH 7.0, 150 mM KCl, and 10 μM EDTA. Samples were heated to 85 °C for 3 min then allowed to cool at 21 °C for 10 minutes.
Crystallization and diffraction data collection
Folded DNAs were mixed with equimolar fluorophore (DFHBI-1T, DFHO, or DFAME), then incubated at room temperature for 10 min. For crystallization by the sitting drop vapor diffusion method, 0.2 μl of RNA-fluorophore solution (250 μM) and 0.2 μl reservoir solution [0.05 M Magnesium chloride hexahydrate, 0.1 M HEPES pH 7.5, 30% (v/v) polyethylene glycol monoethyl ether 550) were mixed and equilibrated at 21 °C. Strongly fluorescent rod-shaped crystals grew to maximum dimensions of 150 × 75 × 35 μm3 over several days (3–10 days). Drops were equilibrated for 2 min after addition of 0.3 μl of a solution comprising 125 μM fluorophore, and 50% (v/v) of either polyethylene glycol monoethyl ether 550 or polyethylene glycol 400. Crystals were then mounted in nylon loops and flash-frozen by plunging in liquid nitrogen. Diffraction data (Extended Data Table 1) were collected at 100 K using the rotation method at beamlines 5.0.1 or 5.0.2 of the Advanced Light Source (ALS), or beamlines 24-ID-C or 24-ID-E of the Advanced Photon Source (APS), and reduced using XDS50, or xia251 with Dials52.
Crystal structure determination and refinement
The structure of the anomalous atom substructure for the thallium(I) folded dataset of Lettuce–DFHBI-1T (2 thallium sites) was determined by AutoSol in Phenix53, and yielded a mean overall figure-of-merit of 0.48 prior to density modification. Manual rebuilding in Coot54, interspersed with rounds of simulated annealing, energy minimization and individual B-factor refinement in resulting in a model with Rfree = 0.25 at 2.5-Å resolution. This model without ligand and P2 loop was used to solve all other datasets by molecular replacement using Phaser55 (Extended Data Table 1). The top solutions had a translation function Z-score of 23.7 (Lettuce-DFHBI-1T), 26.0 (Lettuce–DFHO), 17.4 (Lettuce–DFAME), 23.1 (LettuceC20G–DFHO), 22.4 (LettuceC20T–DFHBI-1T), 25.1 (LettuceC20T–DFHO), and 27.5 (LettuceC20T–DFAME). Solutions were subjected to rounds of simulated annealing, energy minimization and B-factor refinement53 interspersed with manual rebuilding54. For all structures, the mean precision of atomic coordinates was estimated using Phenix53. Refinement statistics are summarized in Extended Data Table 1 and composite simulated annealing-omit maps are shown in Extended Data Fig. 1a–g. Structural figures were prepared with PyMOL56. Poisson-Boltzmann electrostatics calculations were performed using APBS electrostatics57 plugin in PyMOL56. Puckers analyses were performed using Web 3DNA 2.058.
Cryo-EM grid preparation and data acquisition
Prior to vitrification, Lettuce was folded as described above, but contained 10 mM MgCl2 in the folding buffer. Cryo grids of unliganded Lettuce were prepared using a FEI Vitrobot Mark IV (Thermo Fisher Scientific), which was equilibrated to 4° C and 100% humidity. A 3 μL aliquot of folded DNA (175 μM) was applied to a freshly discharged QUANTFOIL holey carbon R1.2/1.3–300 mesh grid (Electron Microscopy Sciences). Grids were blotted for 6 seconds and vitrified by immediately plunging into frozen liquid ethane. The dataset was acquired on a Glacios cryo-transmission electron microscope (Thermo Fisher Scientific) operating at 200 kV and equipped with a Falcon 4 detector. The microscope was set to a nominal magnification of 150,000x, which corresponds to an image pixel size of 0.9 Å. A total of 3,769 movies were collected with a defocus range of (−0.8) – (−2.2) μm using the EPU software (Thermo Fisher Scientific). Images were recorded with an exposure time of 8 seconds and a dose rate of 6.6 e/A2/sec. A summary of the microscope parameters during data collection can be found in Extended Data Table 2.
Cryo-EM image processing
Processing of the unliganded Lettuce cryo-EM dataset was performed using RELION v4.059 and cryoSPARC v3.2.360. The general image processing workflow can be found in Extended Data Fig. 2a. Briefly, image stacks were aligned to correct beam-induced motion using RELION’s own implementation of MotionCor261. Defocus parameters of the aligned images were estimated using the contrast transfer function in CTFFind-4.162. Prior to particle picking, aligned images possessing an estimated resolution lower than 5.0 Å were removed. Particles were picked using a previous low-resolution reconstruction of unliganded Lettuce as a reference. Selected particles were extracted using a box size of 240 pixels and subjected to several rounds of 2D classification. After obtaining the highest quality 2D class averages of unliganded Lettuce, the curated particles were used to train the Topaz particle-picking pipeline63. Repicked particles were extracted with a box size of 240 pixels and 2D classified for several rounds. Initial models (N=3) of the curated particles were generated using ab-initio reconstruction and sorted using heterogenous refinement in cryoSPARC60. Particles corresponding to reconstructions that contain similar dimensions to the Lettuce–DFHBI-1T crystal structure were merged and further processed. Following homogenous and non-uniform refinements, the particles were polished using Bayesian Polishing in RELION59,64 and subjected to a final 2D classification to remove additional junk particles. A new initial model was generated with the polished particles using ab-initio reconstruction (N=2) and further sorted with heterogenous refinement. After a final round of homogenous and non-uniform refinement, the final map yielded an average resolution of 6.5 Å based on the criterion of 0.143 from the calculated gold standard Fourier shell correlation curve (Extended Data Fig. 2d). The crystal structure of Lettuce–DFHBI-1T was manually fitted in the reconstructed map with ChimeraX65 and rigid body fitted using the PHENIX suite53.
Fluorescence spectroscopy
Fluorescence scans were performed on a Photon Technologies International/820 Photomultiplier Detection System or on a CLARIOstar Plus 0430 (BMG Labtech) set to excite and measure emission at wavelengths of interest. After preparation and brought up to 5 or 10 mM Mg2+, constructs were folded and then mixed with at least equimolar ligand concentrations. DFHBI-1T was excited at 465 nm and emission measured at 495–510 nm. DFHO was excited at 495 nm and emission measured at 545–565 nm. DFAME was excited at 545 nm and emission measured at 610–630 nm. For fluorescence measurements with Lettuce, a shorter P1 version of the crystallized Lettuce was used (Extended Data Fig. 6g and Extended Data Table 4).
Circular Dichroic spectroscopy
Circular dichroism (CD) and absorbance spectra were recorded in an Applied Photophysics Chirascan Q100 Spectrometer. A 0.1 mm flow cell was used for the recordings. Folded samples containing 50 μM DNA with or without 55 μM DFHBI1-T in buffer (10 mM Tris-HCl pH 7.5, 75 mM KCl, 10 mM MgCl2) were analyzed at 21°C. Data were analyzed using Global 3 Thermal Analysis Software (Applied Photophysics).
Size-exclusion chromatography coupled to multi angle light scattering
SEC-MALS was performed on a Dawn HELEOS-II MALS with QELS DSL and an Optilab T-rEX differential refractive index detector (Wyatt Technology) at 0.5 ml/min over a SW3000 column (Tosoh Bioscience) at room temperature using buffer containing 20 mM HEPES pH 7.0, 150 mM KCl, 10 mM MgCl2, and 10 μM EDTA. Data were analyzed in Astra 7 (Wyatt Technology, CA, USA).
In vitro R-loop formation and detection
Constructs used in this experiment are listed in Extended Data Table 4. The R-loop generation was based on a previously reported R-loop formation and detection using the TCF21 promoter66. For the experiments with fluorimeter redout, 1.4 μM double stranded DNA (one strand containing the Lettuce aptamer) and 1 μM RNA (complementary to the DNA strand without Lettuce) were co-folded or folded separately according to Fig. 4c (95 °C for 3 min then allowed to cool by turning off heat block and waiting for at least 30 minutes) in buffer containing 20 mM MOPS–KOH pH 7.0, 150 mM KCl, 5 mM MgCl2, and 10 μM EDTA, followed by the addition of 2.5 mM DFHBI-1T. Fluorescence recordings were performed as previously described. For non-denaturing PAGE experiments, 15 μM double stranded DNA (one strand containing the Lettuce aptamer), 12.5 μM RNA (complementary to the DNA strand without Lettuce), and 12.5 μM single-stranded DNA without Lettuce (complementary to the RNA strand) were co-folded or folded separately according to Fig. 4d (95 °C for 3 min then allowed to cool by turning off the heat block and waiting for at least 30 minutes) in buffer containing 20 mM MOPS–KOH pH 7.0, 150 mM KCl, 5 mM MgCl2, and 10 μM EDTA. RNA samples were doped with identical 5′−32P phosphate radiolabeled RNA. Samples were treated with 1.25 μg of RNase H or 5 μg of RNase A (prior to enzyme addition, samples were brought up to 400 mM NaCl to confer single strand RNA specificity) for 10 minutes. Samples were resolved on a 6% non-denaturing PAGE with 1× TBE buffer containing 50 mM KCl and 5 mM MgCl2. A phosphor image screen (GE Healthcare) was exposed to the gel for 30 minutes. Next, the gel was soaked in buffer with excess DFHO (~ 25 μM) and gently shook for 30 minutes. Phosphor image screens were scanned with a GE Typhoon phosphor imager, and the gel bathed in buffer with DFHO was imaged using a GE Typhoon phosphor imager set at 488 nm and 515–535 nm for excitation and emission, respectively.
Extended Data
Extended Data Fig. 1. Composite simulated annealing-omit electron density maps for Lettuce-fluorophore complexes and the solution characterization of Lettuce.
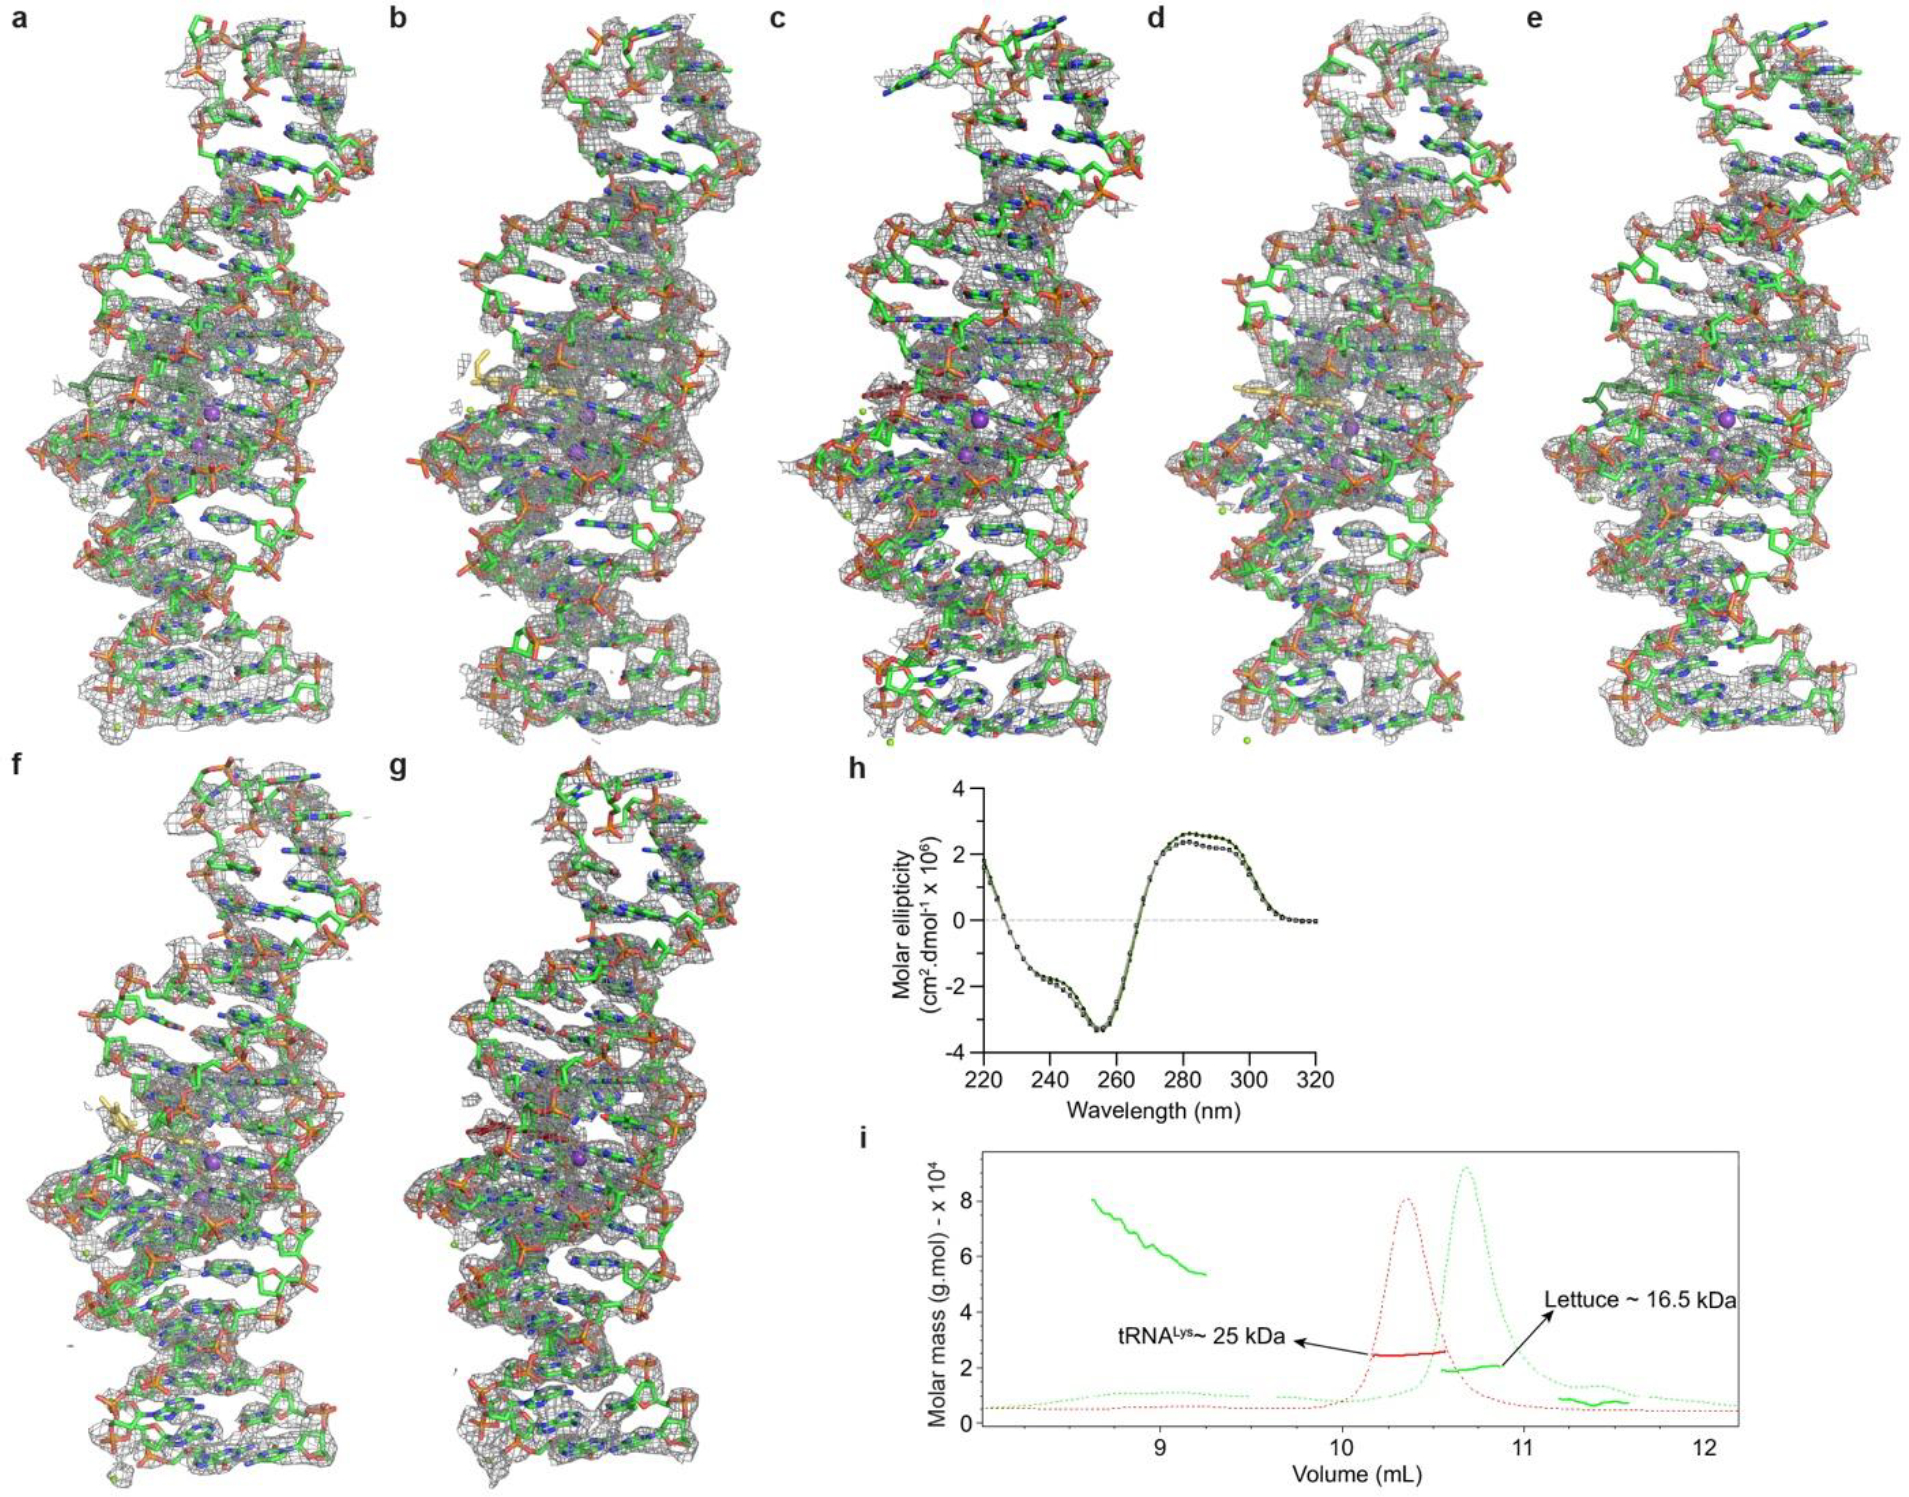
Composite simulated annealing-omit 2|Fo| − |Fc| electron density map for the a, Lettuce-DFHBI-1T, b, Lettuce-DFHO, c, Lettuce-DFAME, d, Lettuce(C20G)-DFHO, e, Lettuce (C20T)-DFHBI-1T, f, Lettuce (C20T)–DFHO, g, Lettuce (C20T)–DFAME complexes contoured at 1.0 σ (gray mesh), superimposed on the respective final refined models. h, Circular dichroism spectra of Lettuce–DFHBI1T (green) and unliganded Lettuce (gray) recorded at 21°C. i, Size-exclusion chromatography-multi-angle light scattering (SEC-MALS) analysis of unliganded Lettuce. Dashed green line is absorbance at 280 nm for unliganded Lettuce, and red line is absorbance at 280 nm for tRNALys control. Colored dots correspond to calculated molar mass (red is tRNALys control, and green is unliganded Lettuce). Exclusion limit (V0 ) for this column is at 4.5 mL (not shown).
Extended Data Fig. 2. Single-particle cryo-EM analysis of the unliganded Lettuce aptamer.
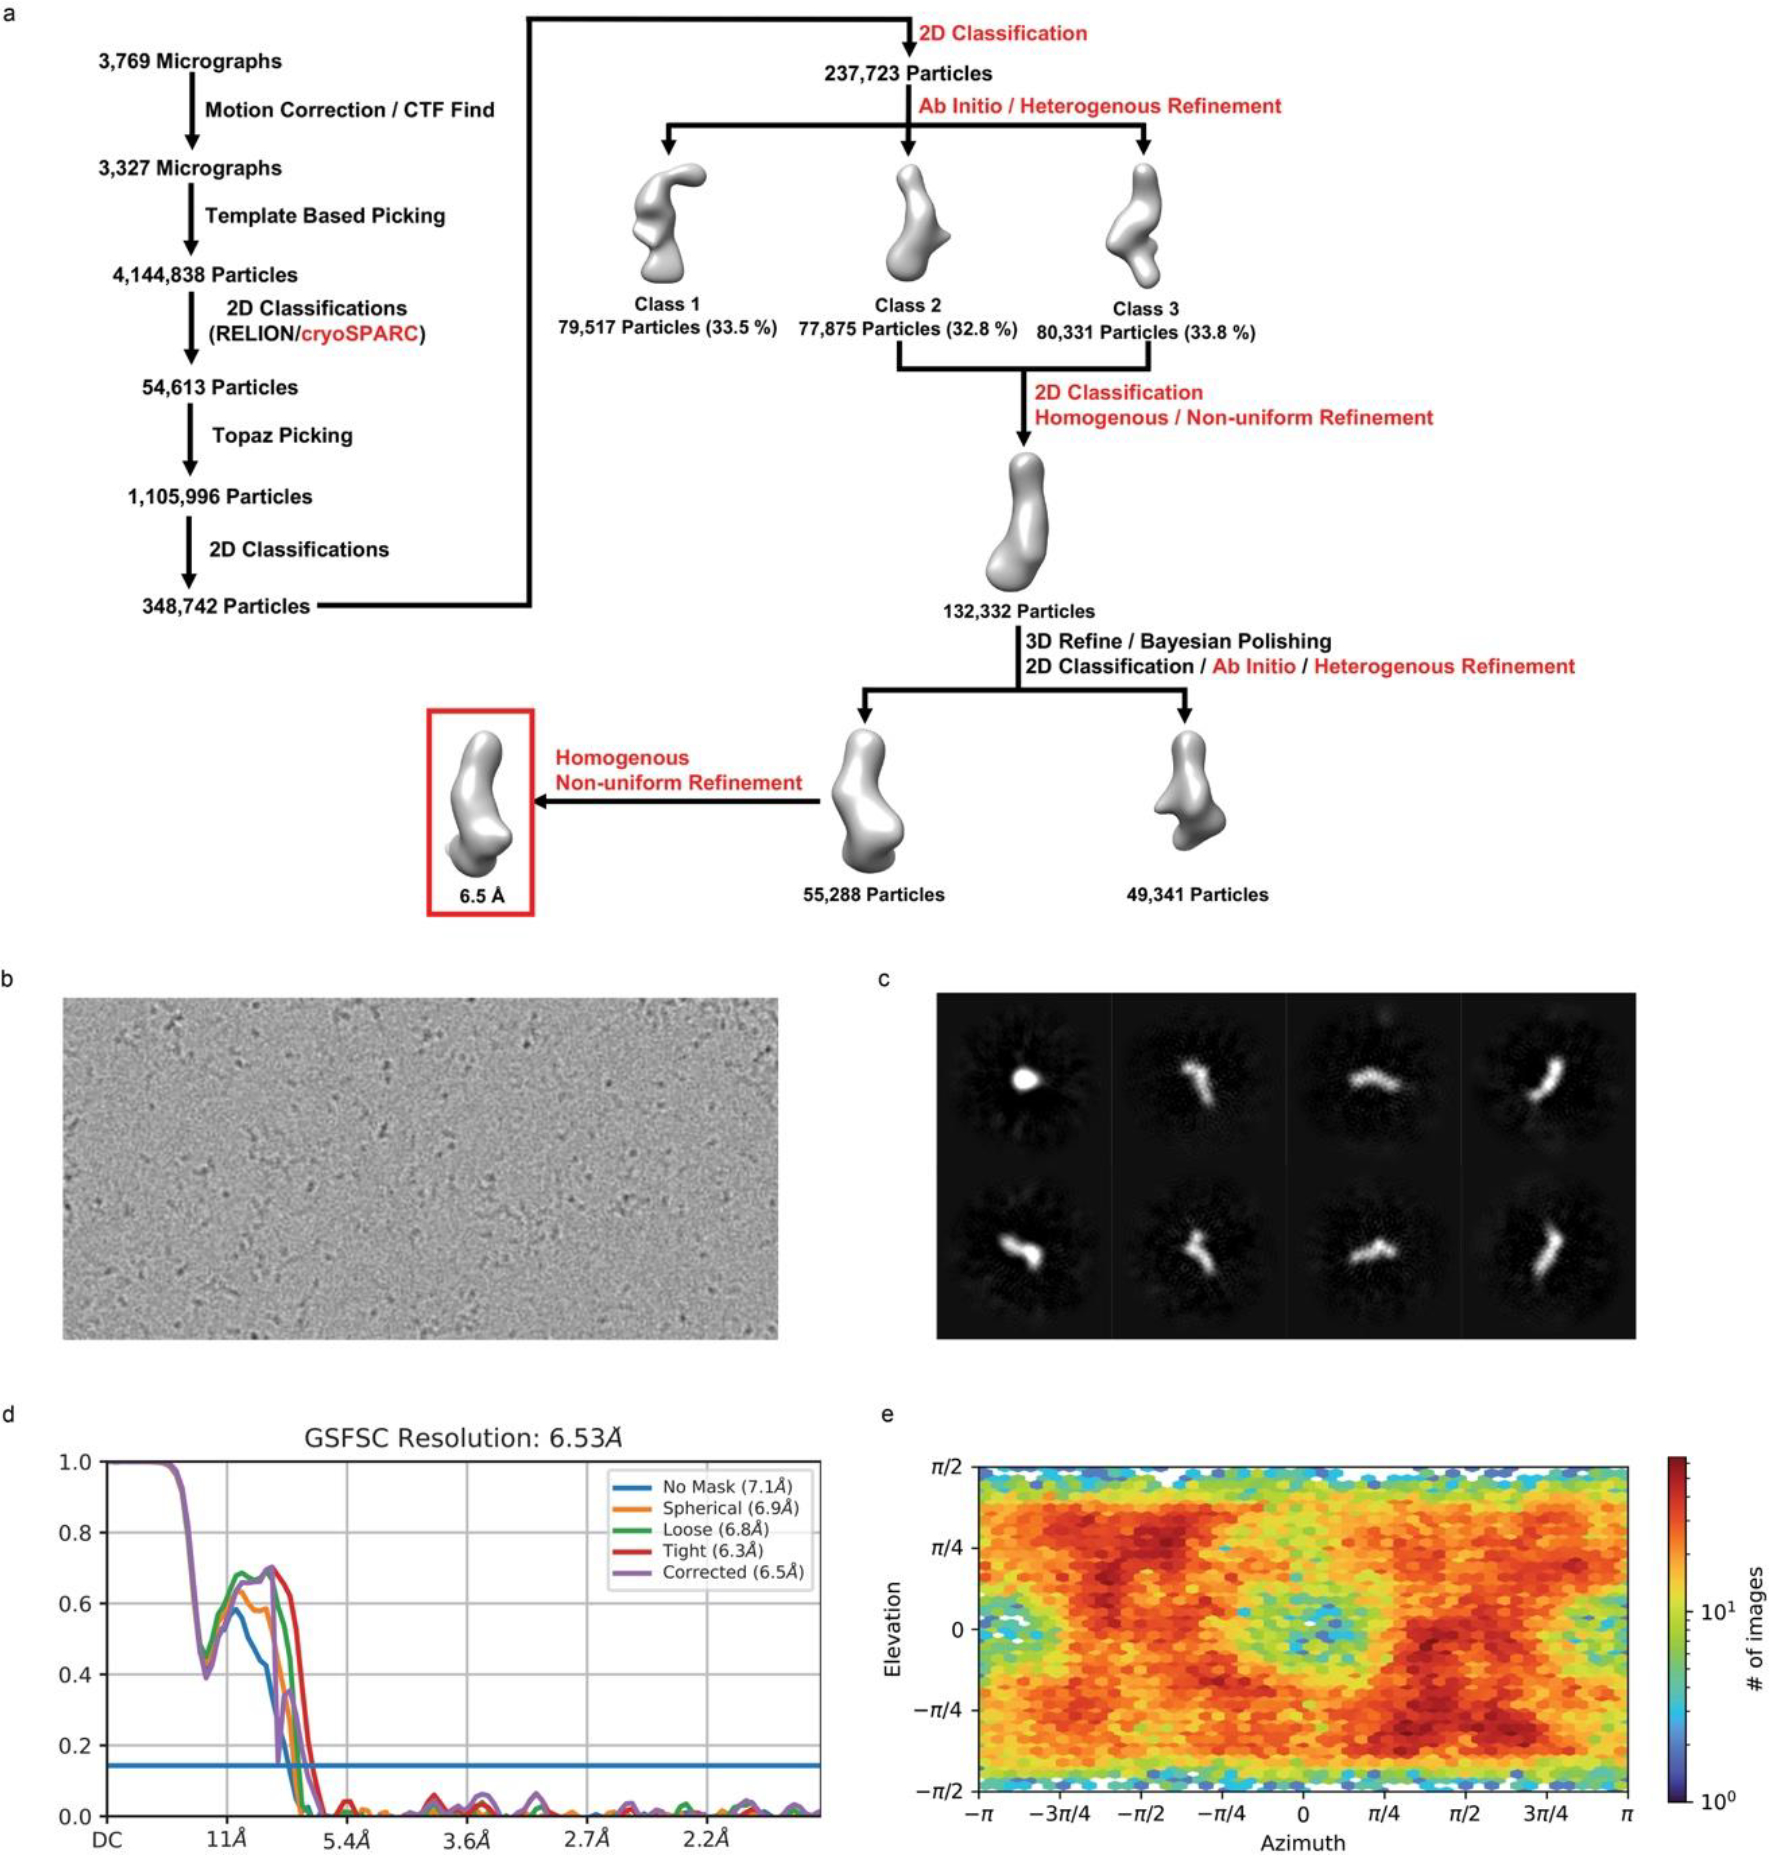
a, Image processing workflow for unliganded Lettuce. Processing steps denoted in red and black represent programs used in either cryoSPARC or RELION, respectively. b, Example of a motion-corrected micrograph. c, Representative 2D class averages of unliganded Lettuce from the final 2D classification. d, Global resolution assessment by Fourier shell correlation curve with the 0.143 gold standard threshold. e, Distribution of orientations over azimuth and elevation angles for particles included in the calculation of the final map.
Extended Data Fig. 3. Lettuce–DFHBI-1T in complex with thallium (I) and overall structures of Lettuce in complex with DFHO and DFAME.
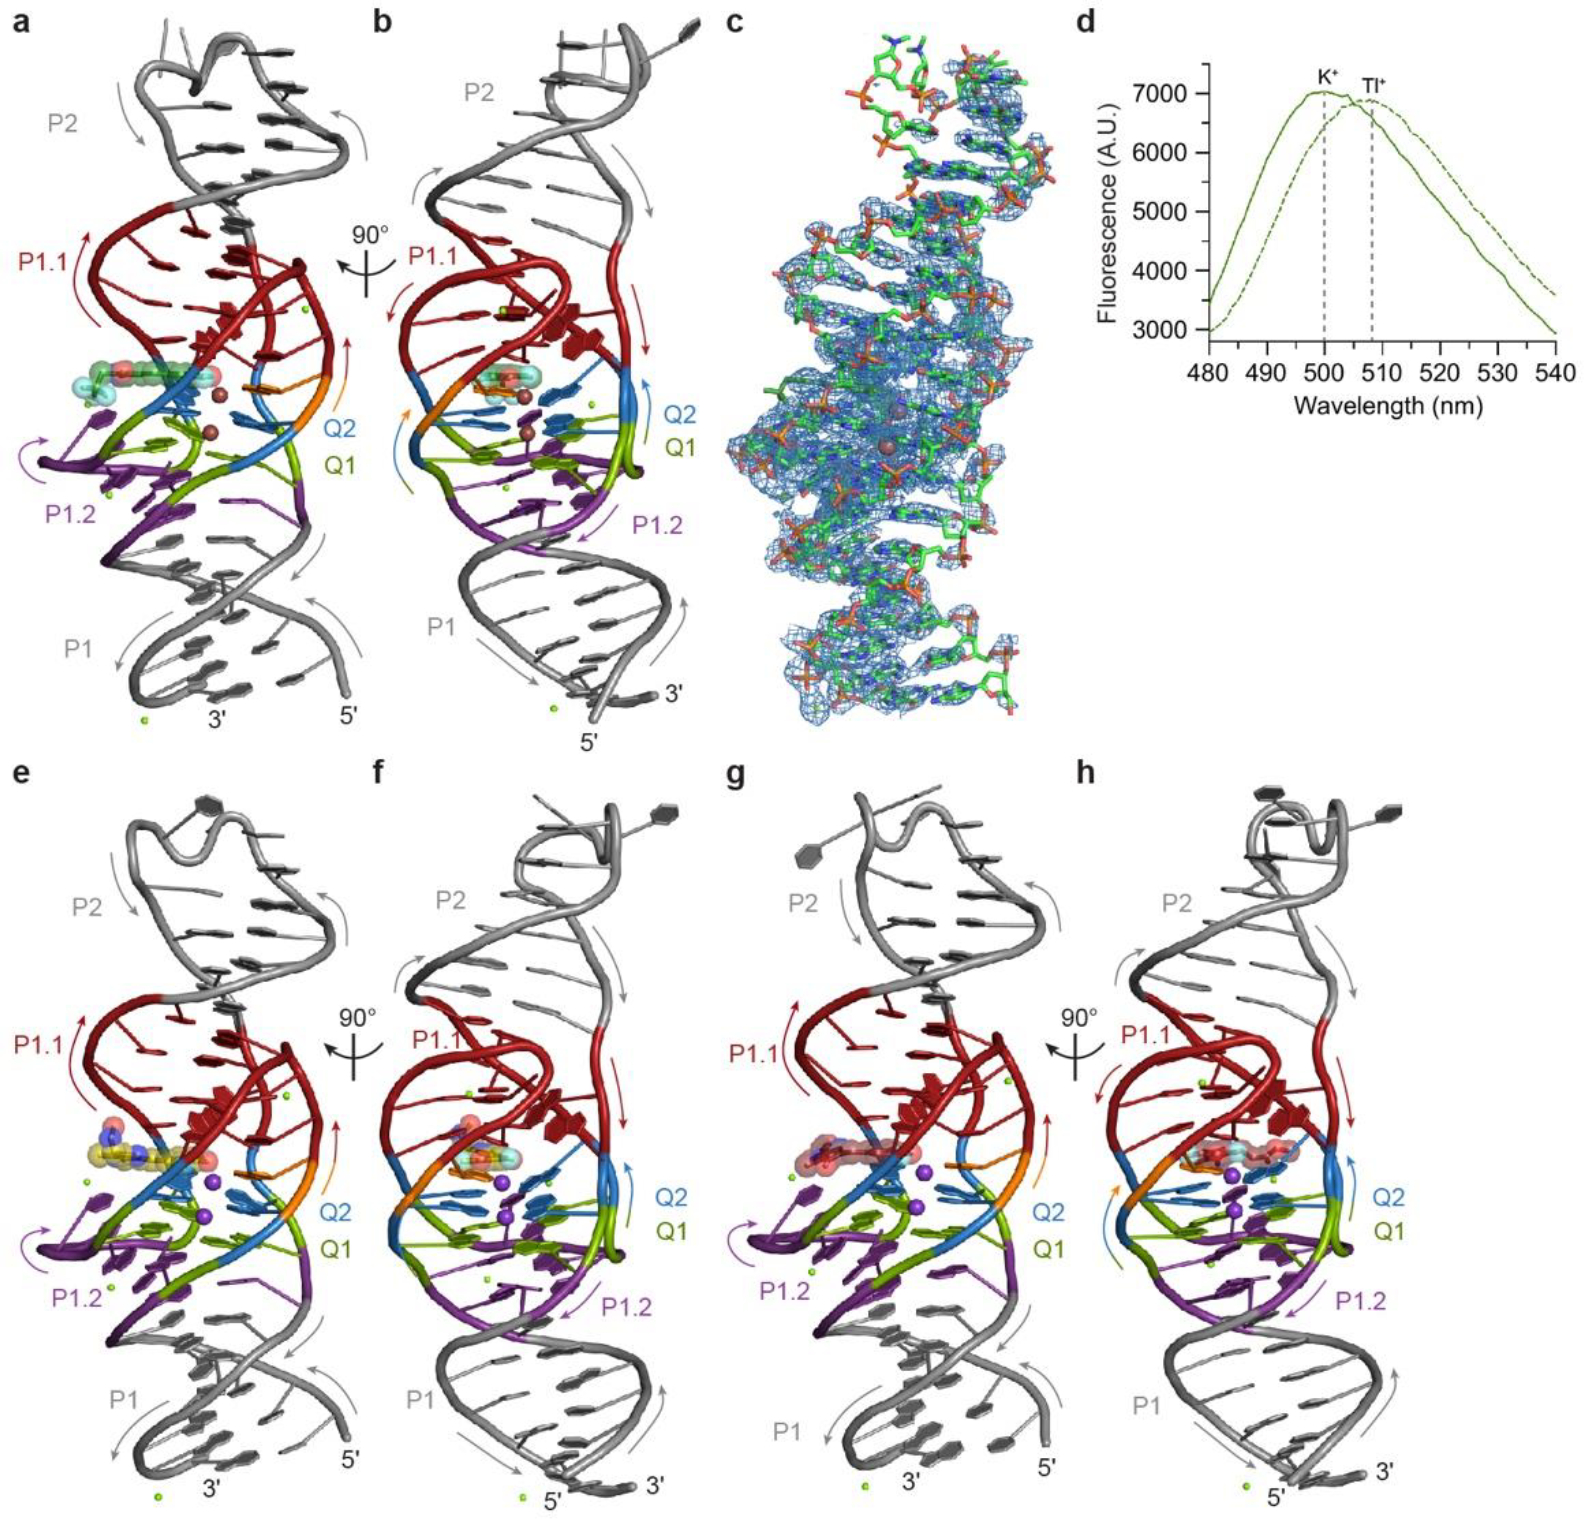
a, Cartoon representation of the Lettuce–DFHBI-1T Tl+ complex. Arrows denote 5′ to 3′ chain direction, brown and green spheres represent Tl+ and Mg2+, respectively. The bound DFHBI-1T molecule is shown in ball-and-stick representation with translucent spheres. DNA color as in Fig. 1c. b, Orthogonal view of a. c, Density-modified SAD electron density map for the Lettuce–DFHBI-1T Tl+ complex contoured at 1.0 σ (blue mesh), superimposed on the final refined model. d, Emission spectra of Lettuce–DFHBI-1T in the presence of K+ (solid green line) or Tl+ (dashed green line). e, Cartoon representation of the Lettuce–DFHO complex. Arrows indicate 5′ to 3′ chain direction, purple and green spheres represent K+ and Mg2+, respectively. The bound DFHO molecule is shown in ball-and-stick representation with translucent spheres. DNA color as in Fig. 1c. f, Orthogonal view of e. g, Cartoon representation of the Lettuce–DFAME complex. Arrows indicate 5′ to 3′ chain direction, purple and green spheres represent K+ and Mg2+, respectively. The bound DFAME molecule is shown in ball-and-stick representation with translucent spheres. DNA color as in Fig. 1c. h, Orthogonal view of g.
Extended Data Fig. 4. Overall structure of Lettuce C20 specificity mutants complexed with different fluorophores.
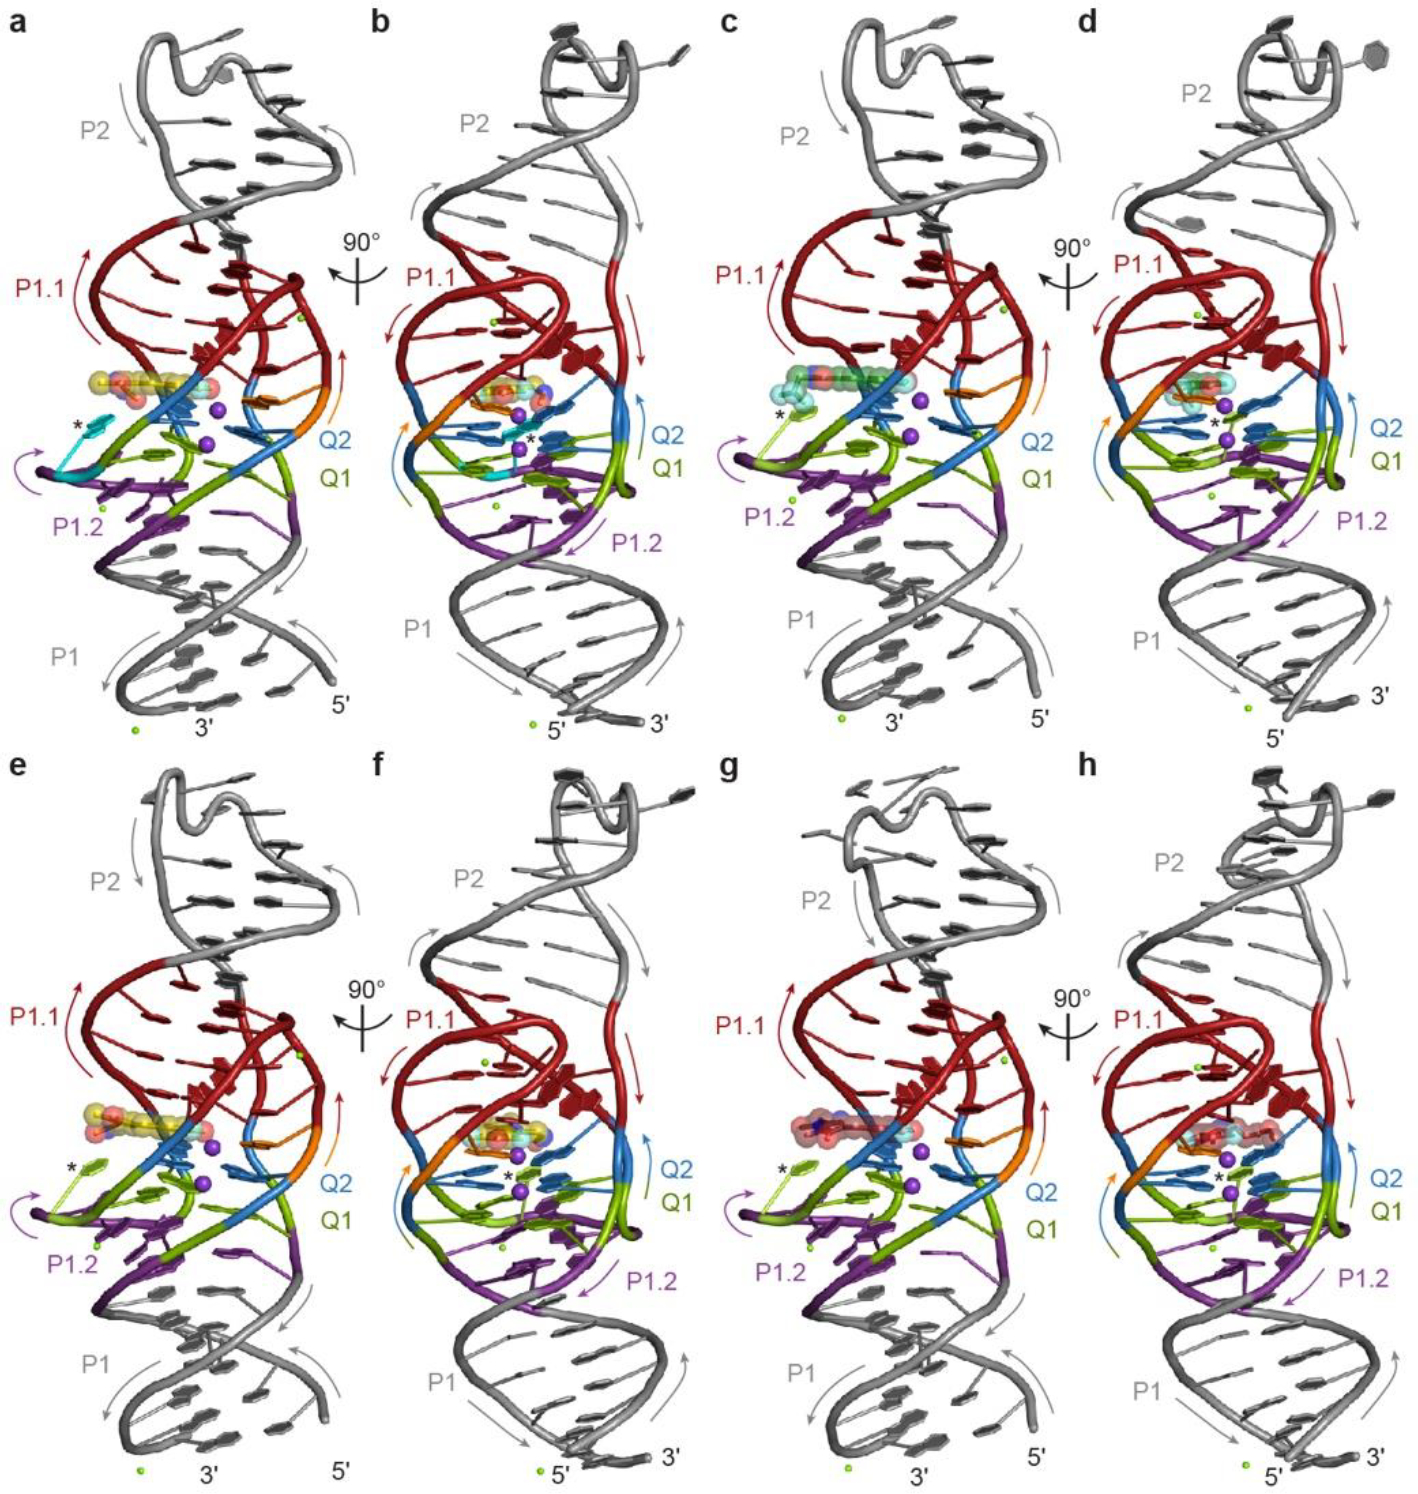
a, Cartoon representation of the C20G Lettuce–DFHO complex. Arrows indicate 5′ to 3′ chain direction, purple and green spheres represent K+ and Mg2+, respectively. Asterisk marks the mutated residue. The bound DFHO molecule is shown in ball-and-stick representation with translucent spheres. DNA color as in Fig. 1c. b, Orthogonal view of a. c, Cartoon representation of the C20T Lettuce–DFHO, e, –DFHBI1T, and g, –DFAME complexes. Arrows indicate 5′ to 3′ chain direction, purple spheres represent K+, and green spheres represent Mg2+. The bound fluorophore molecules are shown in ball-and-stick representation with translucent spheres. Asterisk marks the mutated residue. DNA color as in Fig. 1c. d, Orthogonal view of c. f, Orthogonal view of e. h, Orthogonal view of g.
Extended Data Fig. 5. Divalent cation dependence of Lettuce fluorescence.
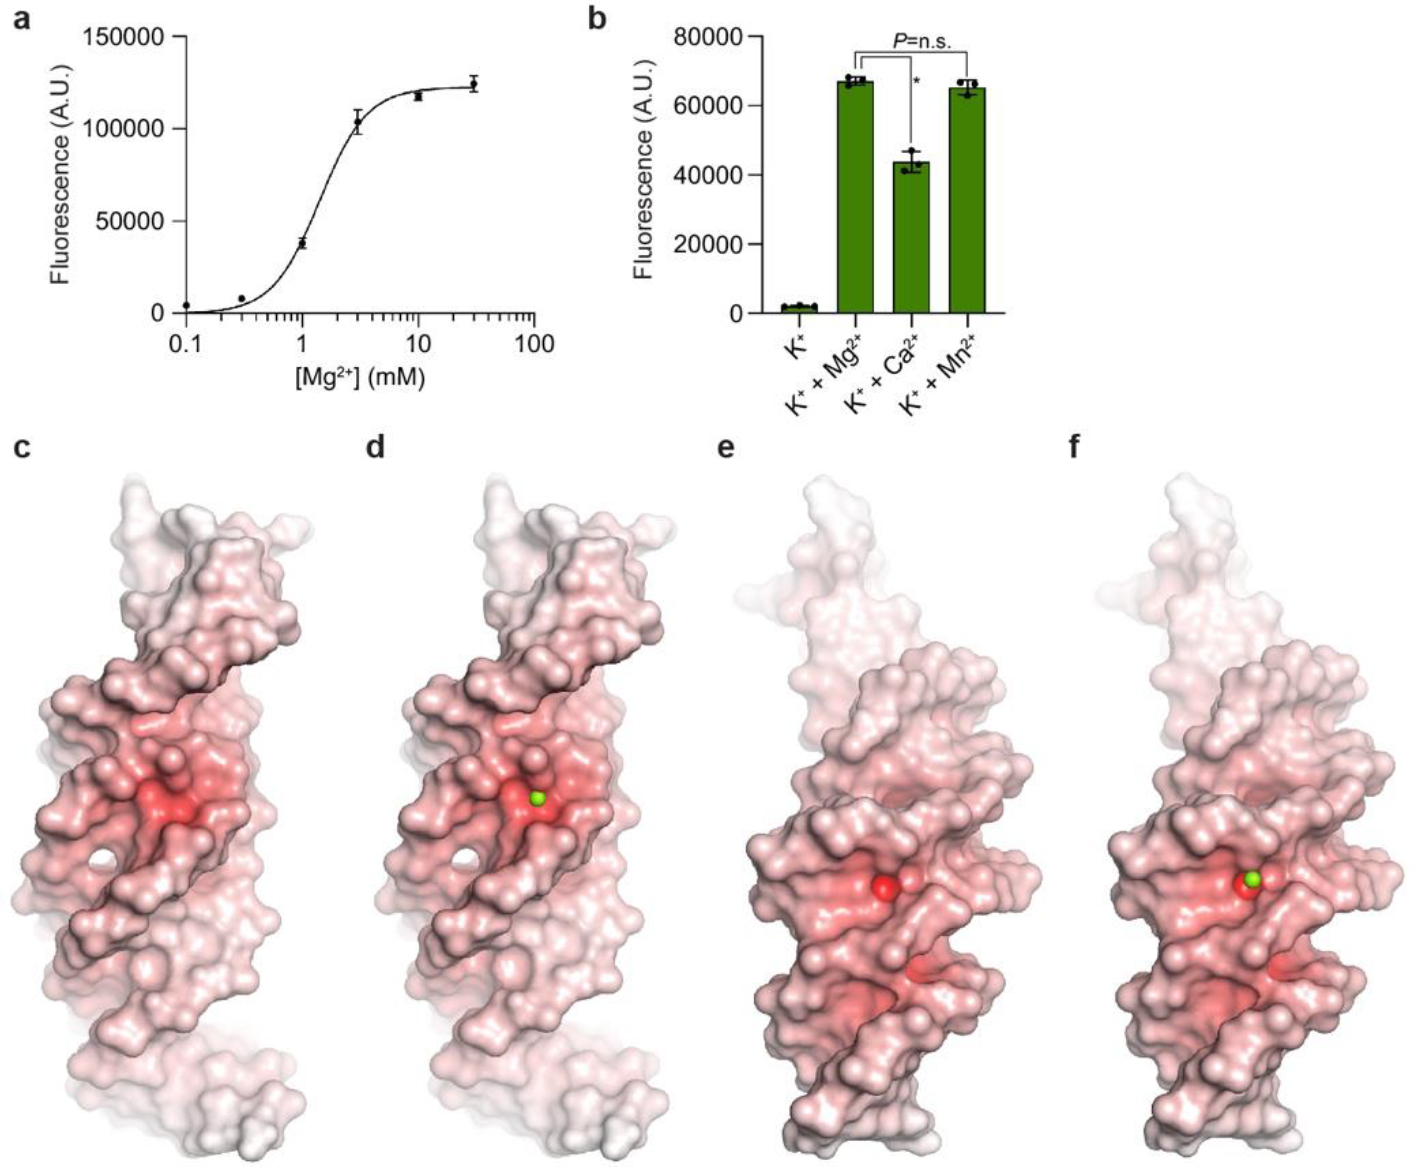
a, Fluorescence of Lettuce-DFHBI-1T as a function of Mg2+ concentration (in the presence of 150 mM K+). The half-maximal activity (K1/2) is at 1.4 mM Mg2+ (mean ± s.d.; n = 3). b, Fluorescence activation of Lettuce–DFHBI-1T in 150 mM K+ alone, or supplemented with 10 mM Mg2+, Ca2+, or Mn2+ (mean ± s.d., n = 3). * denotes P= 0.0002 (two-sided t-test). No significancy (P= 0.251) between K+ + Mg2+ and K+ + Mn2+ (two-sided t-test). c, Electrostatic potential of Lettuce mapped on its molecular surface. Color ramp from 0 to +20 kBT (white to red). d, Green sphere shows Mg2+ ion bound in the P1.1 loop. e, Molecular surface of Lettuce (same color scheme as c) showing the P1.2 loop at its center. f, Green sphere shows Mg2+ ion bound in the P1.2 loop.
Extended Data Fig. 6. Structure and functions of DNA and RNA aptamers.
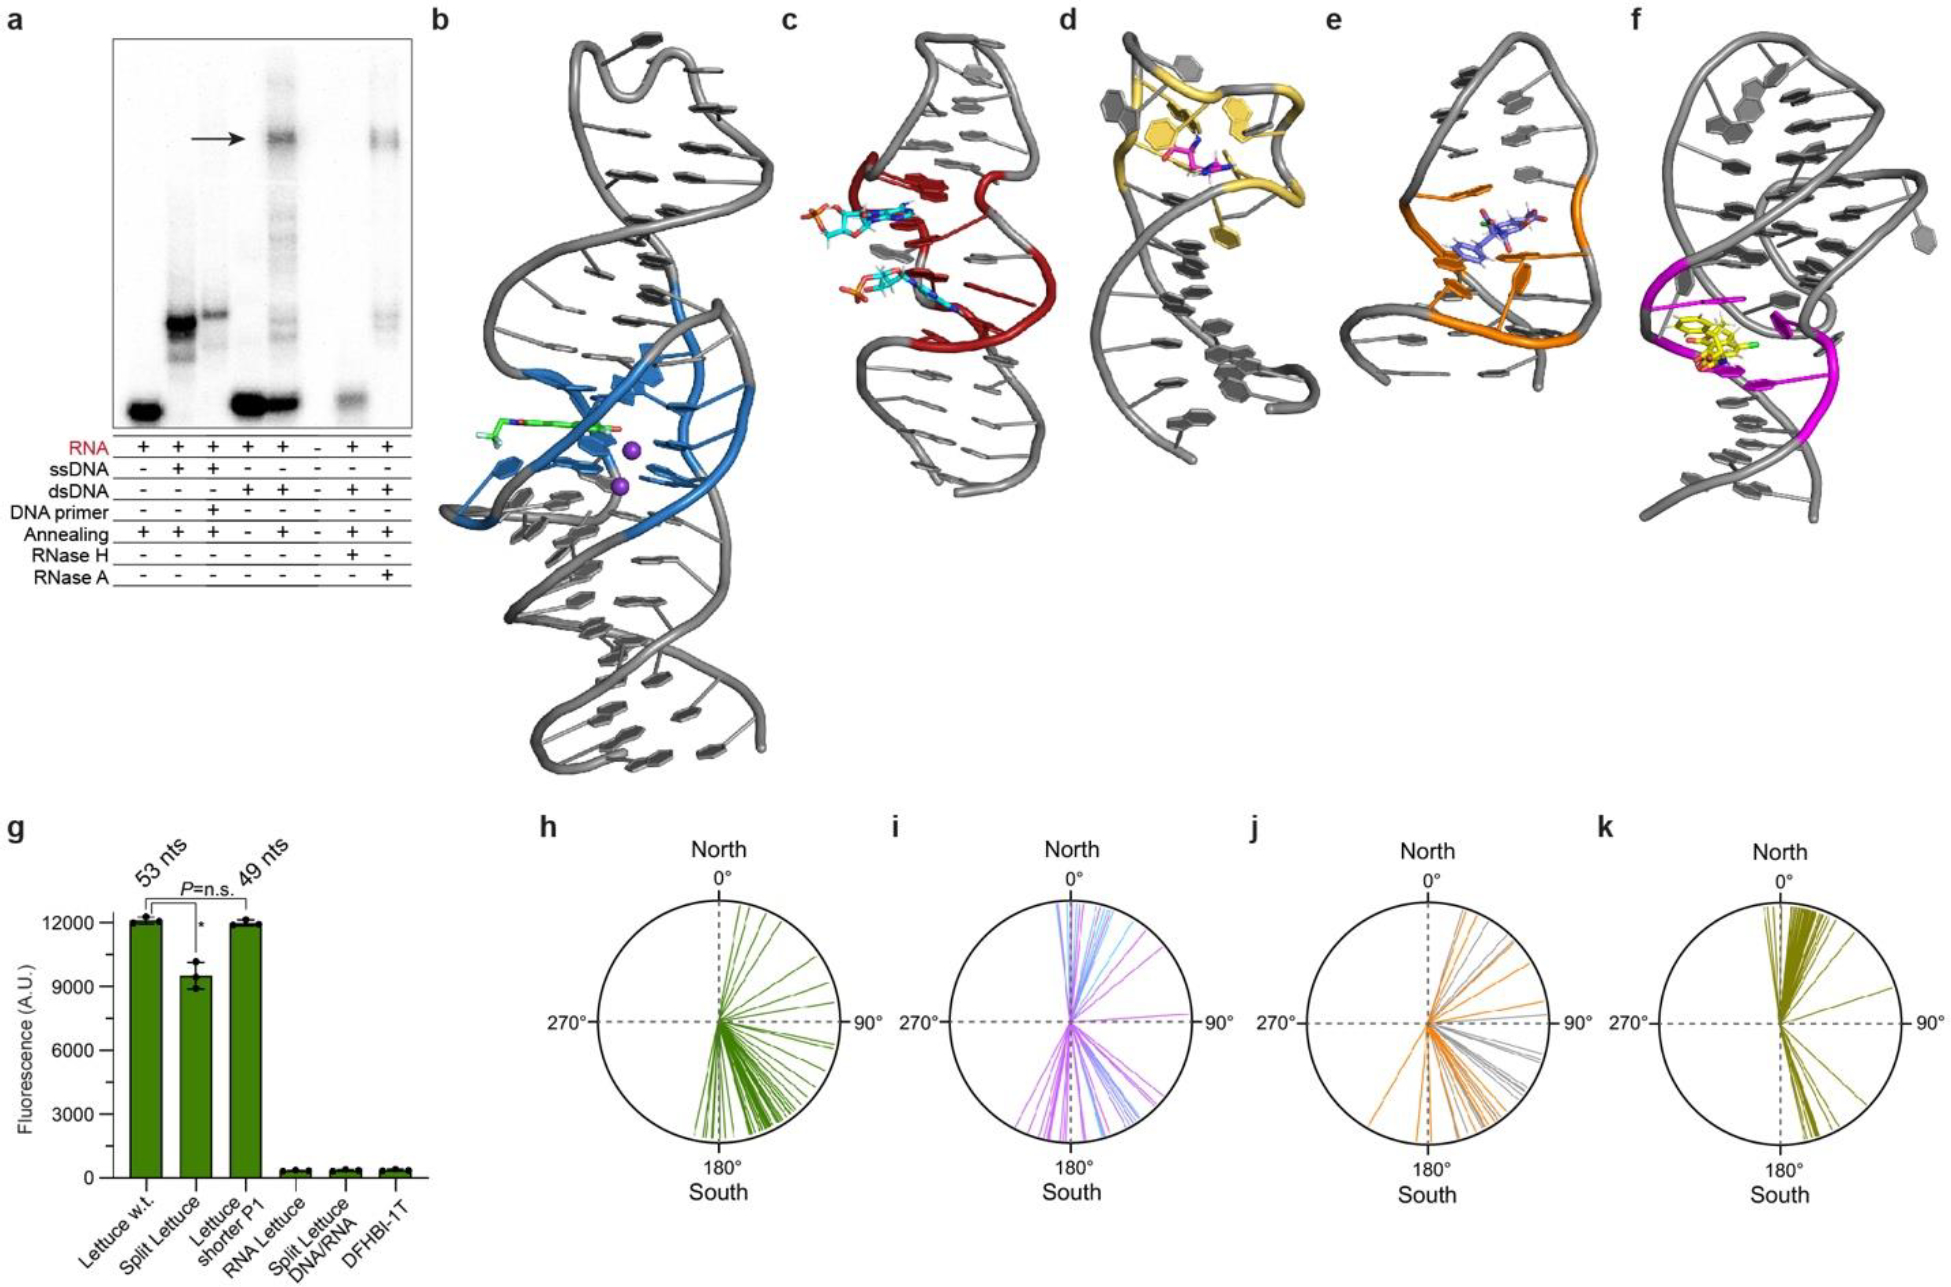
a, Autoradiogram of 6% native polyacrylamide gel electrophoresis demonstrating R-loop formation (arrow). b, Lettuce–DFHBI-1T co-crystal structure (this study). c, NMR structure of the AMP-binding DNA aptamer in complex with two AMP molecules [1; PDB:1AW4]. d, NMR structure of a DNA aptamer bound to argininamide [2; PDB:1DB6]. e, NMR structure of the OBA3 DNA aptamer bound to ochratoxin A [3; PDB:6J2W]. E, NMR structure of the OBA36 DNA aptamer bound to ochratoxin A [4; PDB:7W9N]. f, Fluorescence of wild=type Lettuce w.t. used in the crystallographic studies, Split Lettuce, Lettuce with shorter P1 used in fluorescence studies (Extended Data Table S4), RNA comprised of the Lettuce sequence, and split Lettuce comprised by DNA (34 nts) and RNA (16 nts of 3’ terminus) in the presence of DFHBI-1T (mean ± s.d., n = 3). Asterisk denotes P= 0.002 (two-sided t-test). No significant difference (P= 0.407) between Lettuce w.t. and Lettuce with shorter P1 (two-sided t-test). g, Pucker angles of each deoxynucleotide of Lettuce–fluorophore complexes (mean of 8 structures). h, Pucker angles of each deoxynucleotide of the RNA-ligating deoxyribozyme 9DB1 [5; PDB:5CKK]. Puckers of core deoxynucleotides are in magenta; puckers of deoxynucleotides that hybridize to the RNA product strand are in cyan. j, Pucker angles of each deoxynucleotide of the RNA-cleaving deoxyribozyme Dz36 [6; PDB: 5XM8]. Puckers of core deoxynucleotides are in orange; puckers of deoxynucleotides that hybridize to the RNA substrate strand are in gray. k, Pucker angles for each ribose of the RNA fluorogenic aptamer iSpinach in complex with DFHBI [7; PDB:5OB3]. Individual puckers for all four aptamers are in Extended Data Table 2. Puckers calculated using ref 8.
Supplementary Material
ACKNOWLEDGMENTS
We thank the staff of beamlines 5.0.1 and 5.0.2 of the Advanced Light Source, Lawrence Berkeley National Laboratory (ALS), 24-ID-C and 24-ID-E of the Advanced Photon Source, Argonne National Laboratory (APS) and 22-ID-D (CCP4-APS Summer School) for crystallographic data collection; G. Piszczeck and D. Wu of the Biophysics Core of the National Heart, Lung and Blood Institute (NHLBI) for fluorescence and CD; H. Wang and U. Baxa of the NIH Multi-Institute Cryo-EM Facility (MICEF) for Cryo-EM data collection assistance; and C. Bou-Nader, N. Demeshkina, A. Elghondakly, C. Jones, and R. Trachman for discussions.
Funding:
This research used resources of the APS, a U.S. Department of Energy (DOE) Office of Science User Facility operated for the DOE Office of Science by Argonne National Laboratory under Contract No. DE-AC02-06CH11357. This work is based upon research conducted at the Northeastern Collaborative Access Team beamlines, which are funded by the National Institute of General Medical Sciences from the National Institutes of Health (NIH P30 GM124165). The Pilatus 6M detector on 24-ID-C beam line is funded by a NIH-ORIP HEI grant (S10 RR029205). L.F.M.P. and M.T.B. are Lenfant Postdoctoral Fellows of the NHLBI. This work was supported in part by NIH awards R35NS111631 (to S.R.J) and T32GM007739 (J.D.M.) and by the intramural program of the NHLBI, NIH.
Footnotes
Competing interests: S.R.J. is the co-founder and has equity in Chimerna Therapeutics and Lucerna Technologies. Lucerna has licensed technology related to Spinach and other RNA-fluorophore complexes.
Data availability:
Atomic coordinates and structure factor amplitudes have been deposited with Protein Data Bank (PDB) under accession codes 8FHV (Lettuce-Tl-DFHBI-1T), 8FHX (Lettuce-DFHBI-1T), 8FHZ (Lettuce-DFHO), 8FI0 (Lettuce-DFAME), 8FI1 (Lettuce C20G-DFHO), 8FI2 (Lettuce C20T-DFHBI-1T), 8FI7 (Lettuce C20T-DFHO), and 8FI8 (Lettuce C20T-DFAME). Cryo-EM data were deposited in the Electron Microscopy Data Bank (EMDB) under accession code EMD-29329.
REFERENCES
- 1.Watson JD & Crick FHC Molecular structure of nucleic acids; a structure for deoxyribose nucleic acid. Nature 171, 737–738, doi: 10.1038/171737a0 (1953). [DOI] [PubMed] [Google Scholar]
- 2.Wilkins MH, Stokes AR & Wilson HR Molecular structure of deoxypentose nucleic acids. Nature 171, 738–740, doi: 10.1038/171738a0 (1953). [DOI] [PubMed] [Google Scholar]
- 3.Franklin RE & Gosling RG Molecular configuration in sodium thymonucleate. Nature 171, 740–741, doi: 10.1038/171740a0 (1953). [DOI] [PubMed] [Google Scholar]
- 4.Ellington AD & Szostak JW In vitro selection of RNA molecules that bind specific ligands. Nature 346, 818–822, doi: 10.1038/346818a0 (1990). [DOI] [PubMed] [Google Scholar]
- 5.Robertson DL & Joyce GF Selection in vitro of an RNA enzyme that specifically cleaves single-stranded DNA. Nature 344, 467–468, doi: 10.1038/344467a0 (1990). [DOI] [PubMed] [Google Scholar]
- 6.Tuerk C & Gold L Systematic evolution of ligands by exponential enrichment: RNA ligands to bacteriophage T4 DNA polymerase. Science 249, 505 LP–510, doi: 10.1126/science.2200121 (1990). [DOI] [PubMed] [Google Scholar]
- 7.Ferré-D’Amaré AR & Scott WG Small self-cleaving ribozymes. Cold Spring Harbor Perspect. Biol. 2, a003574–a003574, doi: 10.1101/cshperspect.a003574 (2010). [DOI] [PMC free article] [PubMed] [Google Scholar]
- 8.Serganov A & Patel DJ Molecular recognition and function of riboswitches. Curr. Opin. Struct. Biol. 22, 279–286, doi: 10.1016/j.sbi.2012.04.005 (2012). [DOI] [PMC free article] [PubMed] [Google Scholar]
- 9.Jones CP & Ferré-D’Amaré AR RNA quaternary structure and global symmetry. Trends Biochem. Sci. 40, 211–220, doi: 10.1016/j.tibs.2015.02.004 (2015). [DOI] [PMC free article] [PubMed] [Google Scholar]
- 10.Trachman RJ 3rd, Truong L & Ferré-D’Amaré AR Structural principles of fluorescent RNA aptamers. Trends Pharmacol. Sci. 38, 928–939, doi: 10.1016/j.tips.2017.06.007 (2017). [DOI] [PMC free article] [PubMed] [Google Scholar]
- 11.Banco MT & Ferré-D’Amaré AR The emerging structural complexity of G-quadruplex RNAs. RNA 27, 390–402, doi: 10.1261/rna.078238.120 (2021). [DOI] [PMC free article] [PubMed] [Google Scholar]
- 12.Kappel K et al. Accelerated cryo-EM-guided determination of three-dimensional RNA-only structures. Nat. Methods 17, 699–707, doi: 10.1038/s41592-020-0878-9 (2020). [DOI] [PMC free article] [PubMed] [Google Scholar]
- 13.VarnBuhler BS, Moon J, Dey SK, Wu J & Jaffrey SR Detection of SARS-CoV-2 RNA using a DNA aptamer mimic of Green Fluorescent Protein. ACS Chem. Biol. 17, 840–853, doi: 10.1021/acschembio.1c00893 (2022). [DOI] [PMC free article] [PubMed] [Google Scholar]
- 14.Song W, Strack RL, Svensen N & Jaffrey SR Plug-and-play fluorophores extend the spectral properties of Spinach. J. Am. Chem. Soc. 136, 1198–1201, doi: 10.1021/ja410819x (2014). [DOI] [PMC free article] [PubMed] [Google Scholar]
- 15.Song W et al. Imaging RNA polymerase III transcription using a photostable RNA-fluorophore complex. Nat. Chem. Biol. 13, 1187–1194, doi: 10.1038/nchembio.2477 (2017). [DOI] [PMC free article] [PubMed] [Google Scholar]
- 16.Trachman RJ & Ferré-D’Amaré AR Tracking RNA with light: selection, structure, and design of fluorescence turn-on RNA aptamers. Q. Rev. Biophys. 52, e8, doi: 10.1017/S0033583519000064 (2019). [DOI] [PMC free article] [PubMed] [Google Scholar]
- 17.Wu J & Jaffrey SR Imaging mRNA trafficking in living cells using fluorogenic proteins. Curr. Opin. Chem. Biol. 57, 177–183, doi: 10.1016/j.cbpa.2020.07.007 (2020). [DOI] [PMC free article] [PubMed] [Google Scholar]
- 18.Truong L & Ferré-D’Amaré AR From fluorescent proteins to fluorogenic RNAs: Tools for imaging cellular macromolecules. Protein Sci. 28, 1374–1386, doi: 10.1002/pro.3632 (2019). [DOI] [PMC free article] [PubMed] [Google Scholar]
- 19.Su Y & Hammond MC RNA-based fluorescent biosensors for live cell imaging of small molecules and RNAs. Curr. Opin. Biotechnol. 63, 157–166, doi: 10.1016/j.copbio.2020.01.001 (2020). [DOI] [PMC free article] [PubMed] [Google Scholar]
- 20.Al Mazid MF, Shkel O, Kharkivska Y & Lee J-S Application of fluorescent turn-on aptamers in RNA studies. Mol. Omics 17, 483–491, doi: 10.1039/D1MO00085C (2021). [DOI] [PubMed] [Google Scholar]
- 21.Neubacher S & Hennig S RNA structure and cellular applications of fluorescent light-up aptamers. Angew. Chem. Int. Ed. Engl. 58, 1266–1279, doi: 10.1002/anie.201806482 (2019). [DOI] [PMC free article] [PubMed] [Google Scholar]
- 22.Braselmann E, Rathbun C, Richards EM & Palmer AE Illuminating RNA biology: tools for imaging RNA in live mammalian cells. Cell Chem. Biol. 27, 891–903, doi: 10.1016/j.chembiol.2020.06.010 (2020). [DOI] [PMC free article] [PubMed] [Google Scholar]
- 23.Lee E-S, Lee JM, Kim H-J & Kim Y-P Fluorogenic aptasensors with small molecules. Chemosensors 9, 54, doi: 10.3390/chemosensors9030054 (2021). [DOI] [Google Scholar]
- 24.Le P, Ahmed N & Yeo GW Illuminating RNA biology through imaging. Nature Cell Biol. 24, 815–824, doi: 10.1038/s41556-022-00933-9 (2022). [DOI] [PMC free article] [PubMed] [Google Scholar]
- 25.Gellert M, Lipsett MN & Davies DR Helix formation by guanylic acid. Proc. Natl. Acad. Sci. U.S.A. 48, 2013–2018, doi: 10.1073/pnas.48.12.2013 (1962). [DOI] [PMC free article] [PubMed] [Google Scholar]
- 26.Spiegel J, Adhikari S & Balasubramanian S The structure and function of DNA G-quadruplexes. Trends in Chemistry 2, 123–136, doi: 10.1016/j.trechm.2019.07.002 (2020). [DOI] [PMC free article] [PubMed] [Google Scholar]
- 27.Phan AT, Kuryavyi V, Luu KN & Patel DJ in Quadruplex Nucleic Acids (ed Balasubramanian S, Neidle S) 81–99 (The Royal Society of Chemistry, 2006). [Google Scholar]
- 28.Giese M, Albrecht M & Rissanen K Anion-π interactions with fluoroarenes. Chem. Rev. 115, 8867–8895, doi: 10.1021/acs.chemrev.5b00156 (2015). [DOI] [PubMed] [Google Scholar]
- 29.Dalvit C & Vulpetti A Weak intermolecular hydrogen bonds with fluorine: detection and implications for enzymatic/chemical reactions, chemical properties, and ligand/protein fluorine NMR screening. Chemistry 22, 7592–7601, doi: 10.1002/chem.201600446 (2016). [DOI] [PubMed] [Google Scholar]
- 30.Hermann T & Westhof E Exploration of metal ion binding sites in RNA folds by Brownian-dynamics simulations. Structure 6, 1303–1314, doi: 10.1016/s0969-2126(98)00130-0 (1998). [DOI] [PubMed] [Google Scholar]
- 31.Marceau AH Functions of single-strand DNA-binding proteins in DNA replication, recombination, and repair. Methods Mol. Biol. 922, 1–21, doi: 10.1007/978-1-62703-032-8_1 (2012). [DOI] [PubMed] [Google Scholar]
- 32.Maffeo C & Aksimentiev A Molecular mechanism of DNA association with single-stranded DNA binding protein. Nucleic Acids Res. 45, 12125–12139, doi: 10.1093/nar/gkx917 (2017). [DOI] [PMC free article] [PubMed] [Google Scholar]
- 33.Anindya R Single-stranded DNA damage: Protecting the single-stranded DNA from chemical attack. DNA Repair 87, 102804, doi: 10.1016/j.dnarep.2020.102804 (2020). [DOI] [PubMed] [Google Scholar]
- 34.Thomas M, White RL & Davis RW Hybridization of RNA to double-stranded DNA: formation of R-loops. Proc. Natl. Acad. Sci. U.S.A. 73, 2294–2298, doi: 10.1073/pnas.73.7.2294 (1976). [DOI] [PMC free article] [PubMed] [Google Scholar]
- 35.Niehrs C & Luke B Regulatory R-loops as facilitators of gene expression and genome stability. Nat Rev Mol Cell Biol 21, 167–178, doi: 10.1038/s41580-019-0206-3 (2020). [DOI] [PMC free article] [PubMed] [Google Scholar]
- 36.Ormö M et al. Crystal structure of the Aequorea victoria green fluorescent protein. Science 273, 1392–1395, doi: 10.1126/science.273.5280.1392 (1996). [DOI] [PubMed] [Google Scholar]
- 37.Shimomura O, Johnson FH & Saiga Y Extraction, purification and properties of aequorin, a bioluminescent protein from the luminous hydromedusan, Aequorea. J. Cell Comp. Physiol. 59, 223–239, doi: 10.1002/jcp.1030590302 (1962). [DOI] [PubMed] [Google Scholar]
- 38.Warner KD et al. Structural basis for activity of highly efficient RNA mimics of green fluorescent protein. Nat. Struct. Mol. Biol. 21, 658–663, doi: 10.1038/nsmb.2865 (2014). [DOI] [PMC free article] [PubMed] [Google Scholar]
- 39.Paige JS, Wu KY & Jaffrey SR RNA mimics of green fluorescent protein. Science 333, 642–646, doi: 10.1126/science.1207339 (2011). [DOI] [PMC free article] [PubMed] [Google Scholar]
- 40.Heim R, Cubitt AB & Tsien RY Improved green fluorescence. Nature 373, 663–664, doi: 10.1038/373663b0 (1995). [DOI] [PubMed] [Google Scholar]
- 41.Cate JH et al. Crystal structure of a group I ribozyme domain: principles of RNA packing. Science 273, 1678–1685, doi: 10.1126/science.273.5282.1678 (1996). [DOI] [PubMed] [Google Scholar]
- 42.Nissen P, Ippolito JA, Ban N, Moore PB & Steitz TA RNA tertiary interactions in the large ribosomal subunit: The A-minor motif. Proc. Natl. Acad. Sci. U.S.A. 98, 4899–4903, doi: 10.1073/pnas.081082398 (2001). [DOI] [PMC free article] [PubMed] [Google Scholar]
- 43.Jones CP & Ferré-D’Amaré AR Long-range interactions in riboswitch control of gene expression. Annu. Rev. Biophys. 46, 455–481, doi: 10.1146/annurev-biophys-070816-034042 (2017). [DOI] [PMC free article] [PubMed] [Google Scholar]
- 44.De Gennes P-G Minimum numer of aminoacids required to build up a specific receptor with a folded polypeptide chain. In Introduction to polymer dynamics. Cambridge, Cambridge University Press, 17–27 (1990). [Google Scholar]
- 45.Fernandez-Millan P, Autour A, Ennifar E, Westhof E & Ryckelynck M Crystal structure and fluorescence properties of the iSpinach aptamer in complex with DFHBI. RNA 23, 1788–1795, doi: 10.1261/rna.063008.117 (2017). [DOI] [PMC free article] [PubMed] [Google Scholar]
- 46.Ponce-Salvatierra A, Wawrzyniak-Turek K, Steuerwald U, Höbartner C & Pena V Crystal structure of a DNA catalyst. Nature 529, 231–234, doi: 10.1038/nature16471 (2016). [DOI] [PubMed] [Google Scholar]
- 47.Liu H et al. Crystal structure of an RNA-cleaving DNAzyme. Nat. Commun. 8, 2006, doi: 10.1038/s41467-017-02203-x (2017). [DOI] [PMC free article] [PubMed] [Google Scholar]
- 48.Leontis NB & Westhof E Geometric nomenclature and classification of RNA base pairs. RNA 7, 499–512, doi: 10.1017/s1355838201002515 (2001). [DOI] [PMC free article] [PubMed] [Google Scholar]
- 49.Wu J et al. Self-assembly of intracellular multivalent RNA complexes using dimeric Corn and Beetroot aptamers. J. Am. Chem. Soc. 144, 5471–5477, doi: 10.1021/jacs.1c13583 (2022). [DOI] [PMC free article] [PubMed] [Google Scholar]
- 50.Kabsch W XDS. Acta Crystallogr. D Biol. Crystallogr. 66, 125–132, doi: 10.1107/s0907444909047337 (2010). [DOI] [PMC free article] [PubMed] [Google Scholar]
- 51.Winter G xia2: an expert system for macromolecular crystallography data reduction. J. Appl. Crystallogr. 43, 186–190, doi: 10.1107/S0021889809045701 (2010). [DOI] [Google Scholar]
- 52.Winter G et al. DIALS: implementation and evaluation of a new integration package. Acta Crystallogr. D Struct. Biol. 74, 85–97, doi: 10.1107/s2059798317017235 (2018). [DOI] [PMC free article] [PubMed] [Google Scholar]
- 53.Adams PD et al. PHENIX: a comprehensive Python-based system for macromolecular structure solution. Acta Crystallogr. D Biol. Crystallogr. 66, 213–221, doi: 10.1107/s0907444909052925 (2010). [DOI] [PMC free article] [PubMed] [Google Scholar]
- 54.Emsley P & Cowtan K Coot: model-building tools for molecular graphics. Acta Crystallogr. D Biol. Crystallogr. 60, 2126–2132, doi: 10.1107/s0907444904019158 (2004). [DOI] [PubMed] [Google Scholar]
- 55.McCoy AJ et al. Phaser crystallographic software. J. Appl. Crystallogr. 40, 658–674, doi: 10.1107/s0021889807021206 (2007). [DOI] [PMC free article] [PubMed] [Google Scholar]
- 56.The PyMOL Molecular Graphics System, Version 2.0 Schrödinger, LLC. [Google Scholar]
- 57.Dolinsky TJ, Nielsen JE, McCammon JA & Baker NA PDB2PQR: an automated pipeline for the setup of Poisson-Boltzmann electrostatics calculations. Nucleic Acids Res. 32, W665–667, doi: 10.1093/nar/gkh381 (2004). [DOI] [PMC free article] [PubMed] [Google Scholar]
- 58.Li S, Olson WK & Lu X-J Web 3DNA 2.0 for the analysis, visualization, and modeling of 3D nucleic acid structures. Nucleic Acids Res. 47, W26–W34, doi: 10.1093/nar/gkz394 (2019). [DOI] [PMC free article] [PubMed] [Google Scholar]
- 59.Kimanius D, Dong L, Sharov G, Nakane T & Scheres SHW New tools for automated cryo-EM single-particle analysis in RELION-4.0. Biochem. J. 478, 4169–4185, doi: 10.1042/bcj20210708 (2021). [DOI] [PMC free article] [PubMed] [Google Scholar]
- 60.Punjani A, Rubinstein JL, Fleet DJ & Brubaker MA cryoSPARC: algorithms for rapid unsupervised cryo-EM structure determination. Nat. Methods 14, 290–296, doi: 10.1038/nmeth.4169 (2017). [DOI] [PubMed] [Google Scholar]
- 61.Zheng SQ et al. MotionCor2: anisotropic correction of beam-induced motion for improved cryo-electron microscopy. Nat. Methods 14, 331–332, doi: 10.1038/nmeth.4193 (2017). [DOI] [PMC free article] [PubMed] [Google Scholar]
- 62.Rohou A & Grigorieff N CTFFIND4: Fast and accurate defocus estimation from electron micrographs. J. Struct. Biol. 192, 216–221, doi: 10.1016/j.jsb.2015.08.008 (2015). [DOI] [PMC free article] [PubMed] [Google Scholar]
- 63.Bepler T et al. Positive-unlabeled convolutional neural networks for particle picking in cryo-electron micrographs. Nat. Methods 16, 1153–1160, doi: 10.1038/s41592-019-0575-8 (2019). [DOI] [PMC free article] [PubMed] [Google Scholar]
- 64.Zivanov J, Nakane T & Scheres SHW A Bayesian approach to beam-induced motion correction in cryo-EM single-particle analysis. IUCrJ 6, 5–17, doi: 10.1107/s205225251801463x (2019). [DOI] [PMC free article] [PubMed] [Google Scholar]
- 65.Pettersen EF et al. UCSF ChimeraX: Structure visualization for researchers, educators, and developers. Protein Sci. 30, 70–82, doi: 10.1002/pro.3943 (2021). [DOI] [PMC free article] [PubMed] [Google Scholar]
- 66.Arab K & Niehrs C In vitro binding of GADD45A to RNA:DNA hybrids. Methods Mol. Biol. 2528, 277–287, doi: 10.1007/978-1-0716-2477-7_18 (2022). [DOI] [PubMed] [Google Scholar]
Associated Data
This section collects any data citations, data availability statements, or supplementary materials included in this article.
Supplementary Materials
Data Availability Statement
Atomic coordinates and structure factor amplitudes have been deposited with Protein Data Bank (PDB) under accession codes 8FHV (Lettuce-Tl-DFHBI-1T), 8FHX (Lettuce-DFHBI-1T), 8FHZ (Lettuce-DFHO), 8FI0 (Lettuce-DFAME), 8FI1 (Lettuce C20G-DFHO), 8FI2 (Lettuce C20T-DFHBI-1T), 8FI7 (Lettuce C20T-DFHO), and 8FI8 (Lettuce C20T-DFAME). Cryo-EM data were deposited in the Electron Microscopy Data Bank (EMDB) under accession code EMD-29329.


