Abstract
Bioimaging harnessing optical contrasts and chemical specificity is of vital importance in probing complex biology. Vibrational spectroscopy based on mid-infrared (mid-IR) excitation can reveal rich chemical information about molecular distributions. However, its full potential for bioimaging is hindered by the achievable sensitivity. Here, we report bond selective fluorescence-detected infrared-excited (BonFIRE) spectral microscopy. BonFIRE employs two-photon excitation in the mid-IR and near-IR to upconvert vibrational excitations to electronic states for fluorescence detection, thus encoding vibrational information into fluorescence. The system utilizes tuneable narrowband picosecond pulses to ensure high sensitivity, biocompatibility, and robustness for bond-selective biological interrogations over a wide spectrum of reporter molecules. We demonstrate BonFIRE spectral imaging in both fingerprint and cell-silent spectroscopic windows with single-molecule sensitivity for common fluorescent dyes. We then demonstrate BonFIRE imaging on various intracellular targets in fixed and live cells, neurons, and tissues, with promises for further vibrational multiplexing. For dynamic bioanalysis in living systems, we implement a high-frequency modulation scheme and demonstrate time-lapse BonFIRE microscopy of live HeLa cells. We expect BonFIRE to expand the bioimaging toolbox by providing a new level of bond-specific vibrational information and facilitate functional imaging and sensing for biological investigations.
Our understanding of biological processes has been significantly advanced by powerful optical bioimaging techniques that allow visualization of subcellular components with superb specificity, resolution, and sensitivity. Versatile fluorescence strategies with single-molecule sensitivity have generated a profound impact from fundamental biology to translational medicine.1–3 Complementarily, vibrational imaging, harnessing exquisite chemical contrasts from Raman scattering or mid-infrared (IR) absorption, can uniquely inform the distribution, transformation, and micro-environment of biomolecules and are quickly evolving. While Raman microscopy, such as stimulated Raman scattering (SRS) microscopy, is pushing the boundaries for metabolic imaging and optical super-multiplexing,4,5 IR microscopy has yet to unleash its full potential for modern bioimaging due to inherent limitations, such as coarse spatial resolution, strong water background, and the low detectability of dilute samples. However, IR presents several prominent spectroscopic features over its Raman counterparts.6–9 IR cross sections are 108 to 1010 times that of Raman, promising a much-increased sensitivity. Therefore, IR has the potential in fast widefield imaging with high-throughput dynamic analysis. Moreover, as IR and Raman selection rules are complementary, utilizing IR would expand the repertoire of versatile chemical bonds for functional imaging.
Many techniques were developed to address the limitations associated with direct IR imaging utilizing secondary readout schemes.10–12 For example, mid-IR photothermal (MIP) microscopy13–16 and ultraviolet (UV)-localized mid-IR photoacoustic microscopy (ULM-PAM)17 record IR-induced photothermal and photoacoustic responses with short-wavelength visible and UV probes, respectively, detecting biomolecules with sub-IR-diffraction-limited resolution in cells and clinical tissues. However, the detection sensitivity is still limited to tens of μM to mM, restricting applications of these methods to abundant macromolecules (e.g., proteins and lipids). While single-protein IR detection has been achieved with near-field methods,18 it is not readily applicable to general and quantitative bioimaging.
Here, we report Bond-selective Fluorescence-detected IR-Excited (BonFIRE) spectro-microscopy, an IR-bioimaging approach with a narrowband laser excitation setup suited for quantitative intracellular interrogations with high spatial and spectral resolution and unprecedented single-molecule sensitivity. BonFIRE harnesses a nonlinear double-resonance scheme, encrypting the bond-selective IR spectroscopic features into fluorescence – the most sensitive measurables in bioimaging – with an additional up-conversion probe laser in the near-IR range (Fig. 1a). The resulting fluorescence reports vibrational details with high sensitivity, and achieves subcellular spatial resolution determined by the up-conversion laser. Such IR-promoted double-resonance spectroscopy was introduced in 1975 mainly for vibrational lifetime studies.19–21 It was recently revisited by utilizing an amplified broadband femtosecond (fs) system in fluorescence-encoded IR (FEIR) spectroscopy (Fig. S1a), which demonstrated single-molecule sensitivity in IR-transparent acetonitrile-d3 solutions.22,23 However, the excessive peak intensity and low repetition rate of the fs system make FEIR unfeasible for bioimaging due to sample damage and a slow acquisition rate.24,25 The interferometric detection of FEIR also requires a second IR pulse, adding more complexities to the setup. We also note another recently-introduced Raman-pumped double-resonance scheme, stimulated Raman excited fluorescence26 (SREF, Fig. S1b). However, SREF imposes a strict requirement on the electronic pre-resonance stimulated Raman excitation for optimal signal-to-background (S/B) ratios, restricting the choice of reporter molecules and vibrational modes.27
Figure 1. Principle, setup, and broad spectral coverage of BonFIRE spectro-microscopy.
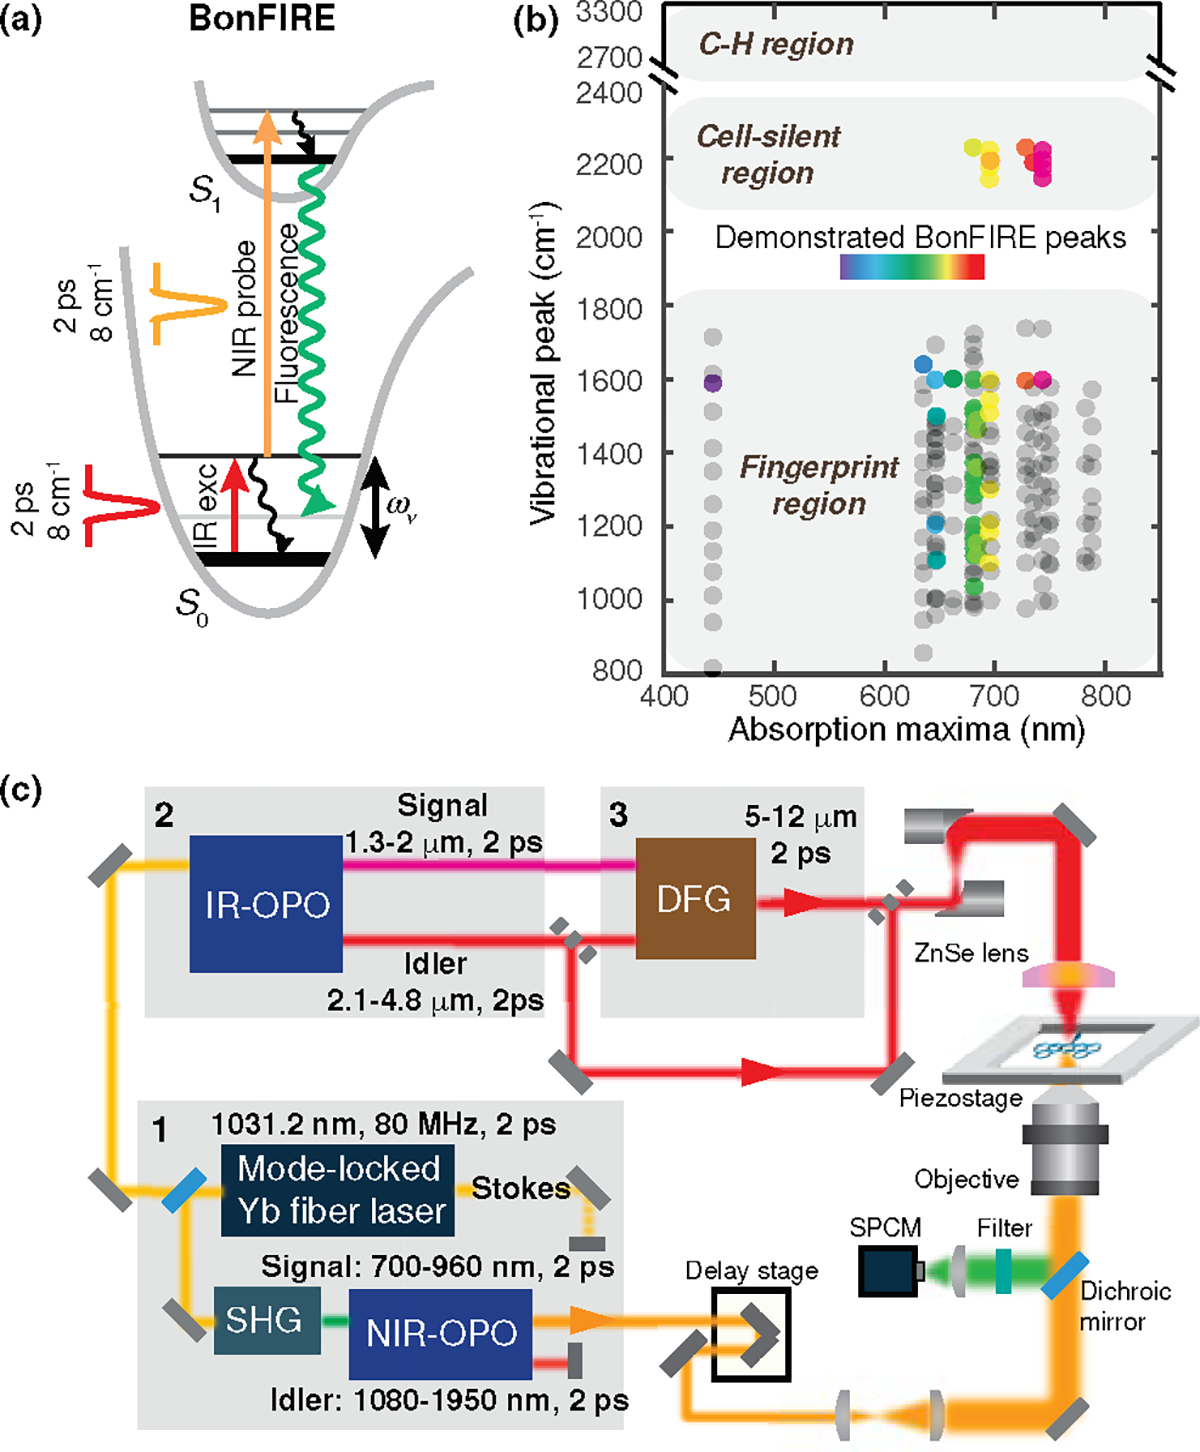
(a) Energy diagram of bond-selective fluorescence-detected IR-excited (BonFIRE) spectroscopy. and : Ground and first electronic excited states. : Ground-state vibrational energy. (b) Spectral coverage of BonFIRE. Grey dots are vibrational peaks of 18 dyes measured by FTIR (see Table S1 and Extended Data Fig. 3 for details). Rainbow-coloured dots are vibrational peaks that are already detected by BonFIRE. (c) BonFIRE experimental setup. Grey rectangles indicate flip mirrors. Grey-shaded boxes labelled with numbers 1, 2, and 3 indicate three interdependent laser modules for generating coherent and tuneable 2-ps near-IR (NIR) and mid-IR pulses in BonFIRE. SHG: second-harmonic generation; OPO: optical parametric oscillator; DFG: difference frequency generation; SPCM: single-photon counting module.
In our approach, we chose 2-ps narrowband (~8 cm−1) pulses for both IR and up-conversion probe lasers with wide tunability (Fig. 1b–c). This new setup ensures biocompatibility with much lower peak power compared to the fs pulses; efficient up-conversion with matched vibrational relaxation lifetime (~ps, see Methods for simulation); explicit bond selectivity for functional and multiplexed imaging; and broad vibrational spectral coverage (Extended Data Fig. 1) with flexible BonFIRE dye options (Fig. 1b), which greatly outnumber those offered by FEIR or SREF. We first demonstrated BonFIRE spectro-microscopy in fingerprint (800–1800 cm−1) and cell-silent (18002800 cm−1) regions. Then, we achieved the first far-field single-molecule IR imaging for conjugated C=C and C≡N bonds. We next applied BonFIRE in targeted imaging with labelled nucleic acids and specific protein species in cells, neurons, and tissues with high spatial resolution and sensitivity, demonstrating vibrational multiplexing beyond what fluorescence alone could offer. For optimal live-cell applications, we implemented a high-frequency modulation scheme for background-free time-lapse imaging. We also benchmarked the unique advantages of BonFIRE, such as super-multiplexing, vibrational lifetime investigation, and widefield imaging over existing techniques. We expect BonFIRE to enable sensitive bond-selective bioimaging that complements fluorescence with rich vibrational information and functions, facilitating novel biological and biophysical discoveries.
Results
BonFIRE spectroscopy in the fingerprint region
Details of the customized BonFIRE setup (Fig. 1c) are in Methods. We validated BonFIRE spectroscopy by targeting the skeletal C=C mode at 1598 cm−1 of a red dye ATTO680 (Fig. 2a). ATTO680 has high IR and absorption cross sections and a quantum yield of 30%, enabling efficient BonFIRE transitions (see Methods and Fig. S2). A 765-nm up-conversion probe wavelength is chosen (Fig. 2a, orange line) so that the excitation from the combined energy of IR and probe lasers (IR+probe, Fig. 2a, dashed purple line) reaches the absorption maximum, while the background excitation from the probe alone is low. We obtained a fluorescence-detected peak as a function of the IR-probe temporal delay () (Fig. 2b). The time scale of the negative (i.e., the probe is ahead) matches with the temporal overlap profile of the 2-ps lasers. The resulting longer tail toward positive (i.e., the IR is ahead) indicates the vibrational lifetime of C=C bonds.28 The S/B (peak height/background) is about 8% (Fig. 2b), higher than IR-photothermal-induced fluorescence change.29,30 Note that the background is much smaller in more IR-transparent solvents (Extended Data Fig. 2, S/B ~56%).
Figure 2. Double-bond BonFIRE characterizations.
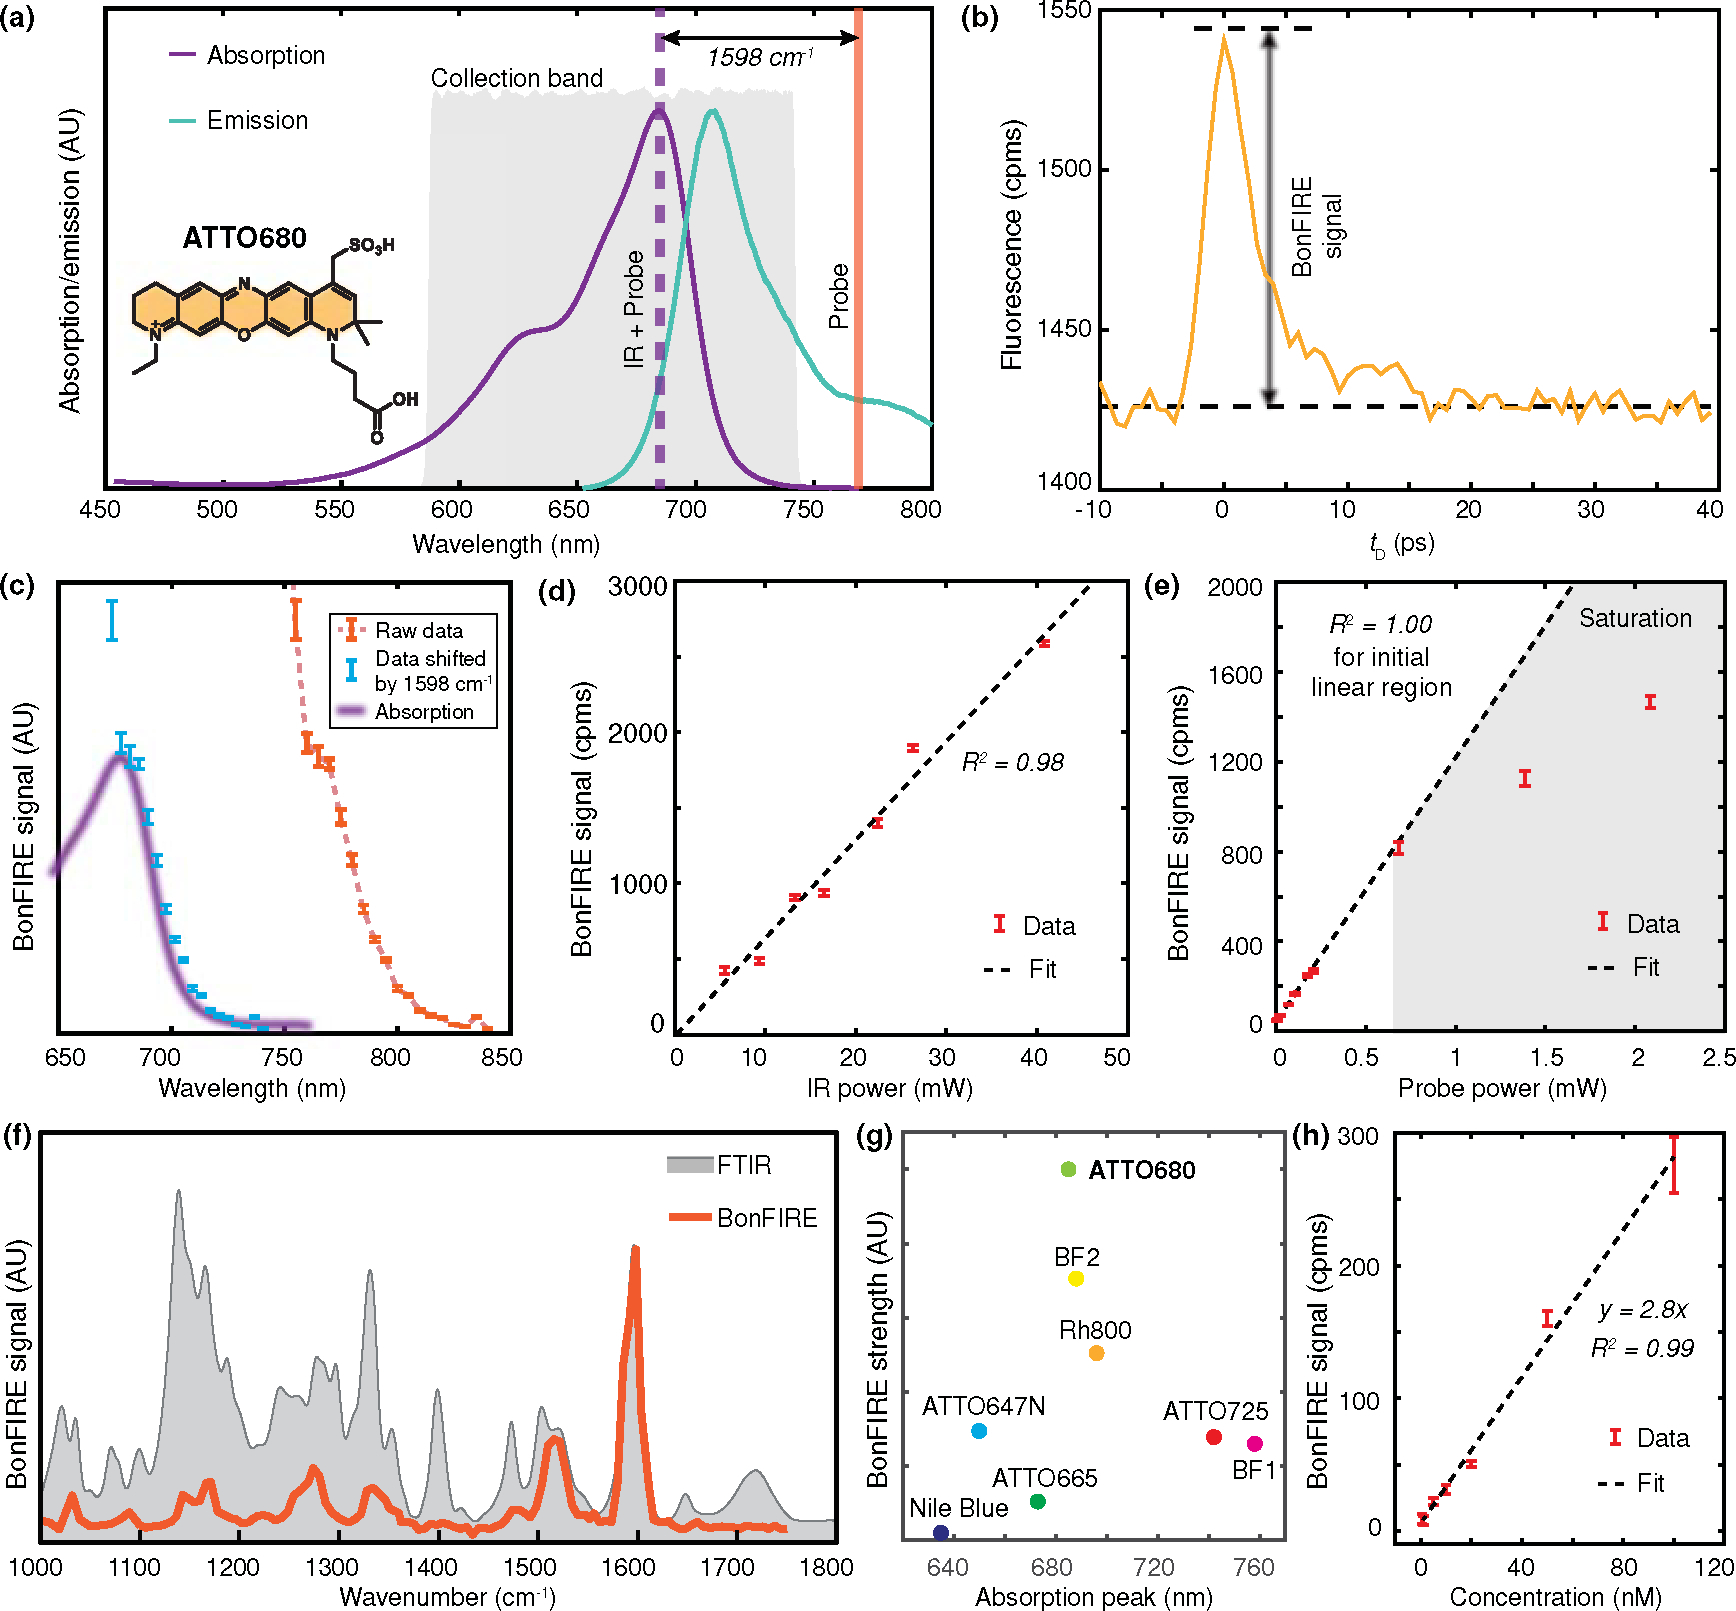
(a) Fluorescence absorption/emission spectra of ATTO680 with indicated optimal BonFIRE up-conversion probe wavelength (orange) and collection band (grey), targeting the IR vibrational peak at 1598 cm−1. (b) BonFIRE signal dependence on IR-probe pulse delay. cpms: counts per millisecond. (c) BonFIRE signal dependence on probe wavelength (dashed orange). The BonFIRE excitation profile (orange dots, by horizontally shifting the raw data by adding the IR frequency of 1598 cm−1) is also overplotted with the absorption spectrum of ATTO680 (purple). Data are presented as peak values +/− SD from the background (n = 13). (d-e) BonFIRE signal dependences on IR power (d) and probe power (e) on sample, measured from 10 μM ATTO680 in DMSO. Data are presented as peak values +/− SD from the background (n = 18). (f) Overplot of BonFIRE (red) and FTIR (grey) spectra of ATTO680. (g) Comparison of BonFIRE signals among eight dyes (1 μM in DMSO), targeting the IR excitation for their corresponding C=C bonds around 1600 cm−1. Details are provided in Table S2. (h) The dependence of BonFIRE signal on the ATTO680 concentration in DMSO. A detection limit of 0.5 nM was obtained with a signal-to-noise ratio (S/N) of 3. Data are presented as mean +/− SD (n = 3).
To characterize BonFIRE, we swept the probe wavelength across the excitation range at the red tail of the absorption spectrum (750–850 nm) while fixing the IR excitation at 1598 cm−1. The shifted BonFIRE excitation profile from the combined energy of IR+probe (Fig. 2c, blue) overlaps with ATTO680 absorption tail (Fig. 2c, purple), confirming the optimal upconverting wavelength is around 765 nm (Fig. 2c, dashed curve). Tuning the probe wavelength to the bluer side causes reduced S/B and increased noises (Figs. 2c and S3), likely due to other multiphoton processes (e.g., excited-state absorptions). We also confirmed that the BonFIRE signals are linearly dependent on the IR power (Fig. 2d) and show a saturated trend on the probe power (Fig. 2e), consistent with the simulation (Methods and Fig. S2).
We obtained the BonFIRE spectrum of ATTO680 in reference to its FTIR (Fig. 2f). Most fingerprint features were revealed.31 The intensity mismatch between BonFIRE and FTIR is primarily due to lower Franck-Condon (F-C) constants of less conjugated modes.32 The correspondence between BonFIRE and FTIR has been confirmed to be explicit for all investigated dyes (Extended Data Fig. 3). We compared eight molecules and identified ATTO680 as the best-performing dye with the highest signal (Fig. 2g and Table S2). Targeting the C=C excitation in ATTO680, the BonFIRE sensitivity reached 0.5 nM (Fig. 2h), well below the calculated single-molecule-equivalent concentration of 5 nM.
Cell-silent BonFIRE spectroscopy
With broad laser tuneability, it is now possible to investigate modes in the cell-silent window, the key spectral region for emerging applications such as super-multiplexing5,33 and electrostatic sensing.34,35 So far, no silent-region IR-pumped double-resonance spectroscopy has been demonstrated. Toward this front, we adopted a probe, BF1 (Fig. 3a, more details in Table S3), bearing a C≡N conjugated to the dye resonance structure with strong F-C coupling.5 We first calculated an optimal upconverting wavelength of 890 nm by matching the combined energy of probe+IR with the absorption peak at 743 nm (Fig. 3a). The resulting BonFIRE signal (Fig. 3b, blue) targeting the 2224 cm−1 IR excitation for BF1 C≡N is only about 1.2% compared to that of C=C (1598 cm−1, Fig. 3b, orange). This is mainly due to a much smaller of conjugated C≡N (Table S4) with a faster vibrational decay (observable from the decay trends in Fig. 3b) than that of C=C.28 Subsequent BonFIRE characterizations (Extended Data Fig. 4) confirm the optimal probe wavelength around 890 nm and similar power dependence on IR and probe power to fingerprint-BonFIRE.
Figure 3. Cell-silent BonFIRE spectroscopy.
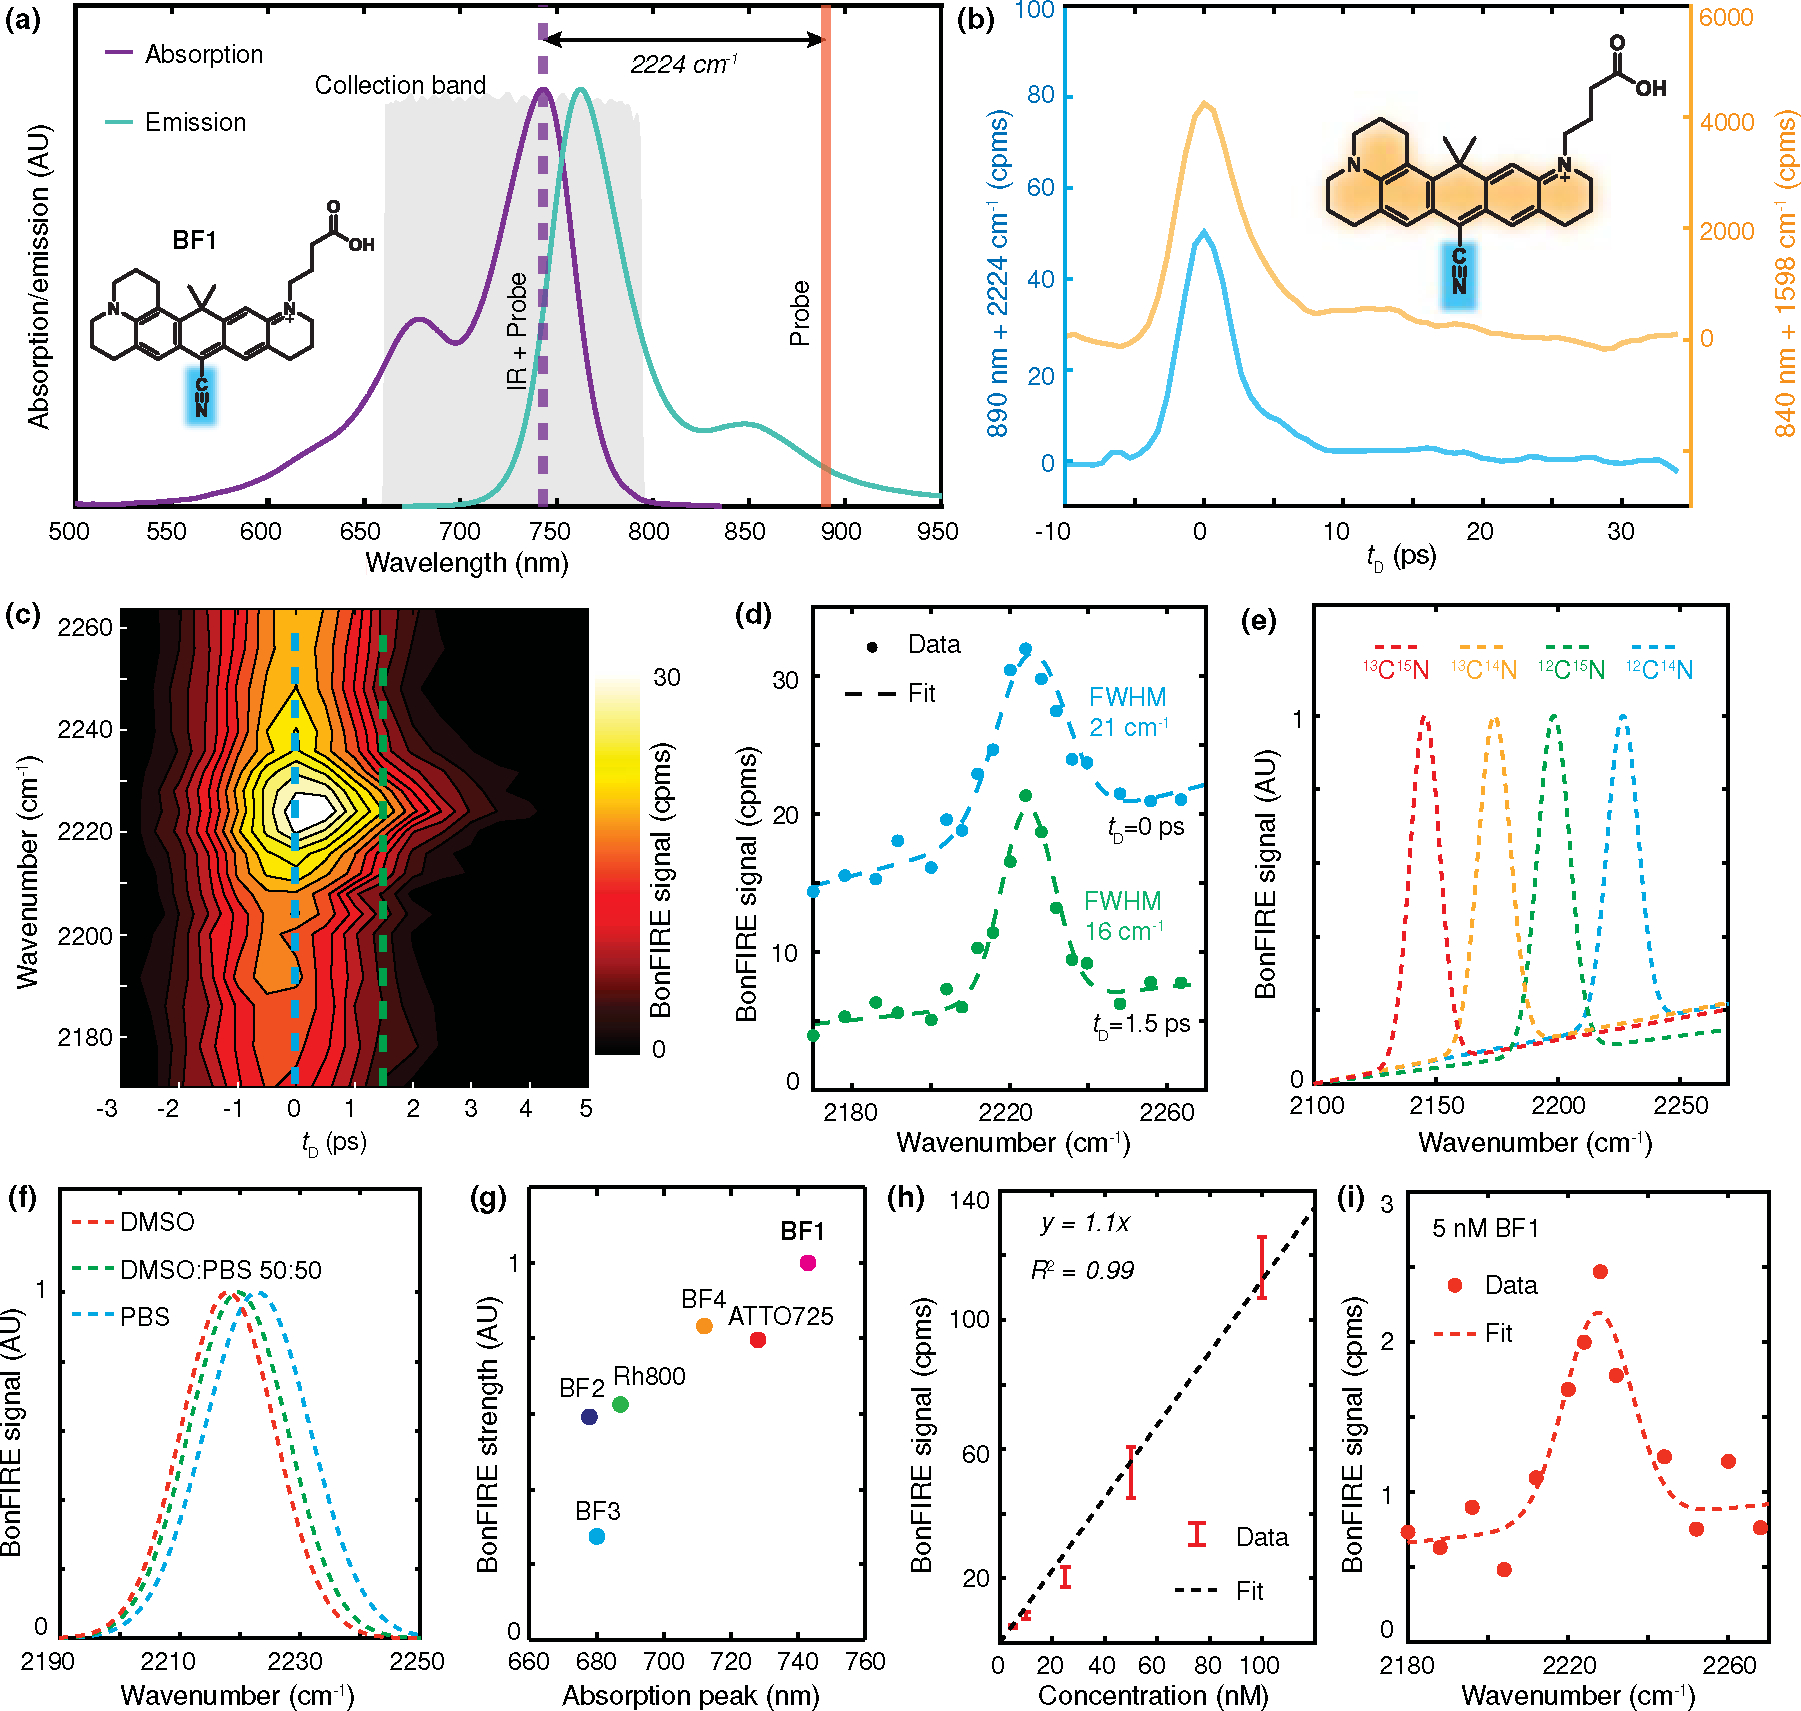
(a) Fluorescence absorption/emission spectra of BF1 with optimal BonFIRE up-conversion probe wavelength (orange) and collection band (grey), targeting the IR vibrational peak at 2224 cm−1. (b) BonFIRE signal dependence on IR-probe temporal delay for C=C (yellow) and C≡N (blue) in BF1. Backgrounds were subtracted to compare the BonFIRE peak heights directly. cpms: counts per millisecond. (c) Contour map of C ≡N BonFIRE signals as functions of IR frequency (vertical) and IR-probe delay (horizontal). (d) BonFIRE spectra of C≡N extracted at (blue) and (green). Data are shown as dots, and fittings (Gaussian + linear) are shown as dashed lines. The calculated full width at the half maximum (FWHM) is displayed along each peak. (e) BonFIRE spectra of four C≡N isotopes of BF1. Fitted spectra are shown for clarity. AU: arbitrary unit. (f) Solvatochromism of C≡N measured from 10 μM BF1 in three different PBS/DMSO mixtures. (g) Comparison of BonFIRE signals targeting the triple bonds from six dyes (1 μM in PBS). Details are provided in Table S4. (h) Concentration curve of C≡N in BF1 in water. The detection limit was 5 nM with a signal-to-noise ratio (S/N) of 6. Data are presented as mean +/− SD (n = 3). (i) BonFIRE spectrum of 5 nM BF1 in water.
Unlike fingerprint-BonFIRE (Fig. 2f), we observed a background across a broad off-resonance frequency range around the C≡N band (Fig. 3c, blue dashed line). This background is unlikely caused by the excited-state absorption, as it is absent for double-bond BonFIRE and the probe wavelength is at the far red of the excitation tail. We tentatively attribute this background to broadband overtones and combinational modes, as previously reported.36,37 A more detailed investigation is undergoing. Experimentally, this background decays faster with detuning than the desired signal. Hence, we chose to extract BonFIRE signal at (Fig. 3c, green dashed line) in all following experiments unless otherwise mentioned, a sweet spot to maintain signal strength and spectral fidelity with diminished background interference (Fig. 3d).
After validating cell-silent BonFIRE spectroscopy, we demonstrated its potential of vibrational super-multiplexing by detecting four C≡N isotopologues of BF1. Four distinct vibrational peaks are resolved (Fig. 3e, raw data in Fig. S4), although the absorption spectra are almost identical (Fig. S5). To confirm the environmental-sensing capability, we proved that BonFIRE could identify the vibrational shift of C≡N bond in solutions with varying hydrogen-bonding conditions. The C≡N peak shifts from 2224 cm−1 (in PBS) to 2220 cm−1 (in 50:50 PBS/DMSO) and 2218 cm−1 (in DMSO) (Fig. 3f). Moreover, to identify the brightest cell-silent BonFIRE probe, we compared six C≡N and C≡C bearing dyes and confirmed that BF1 has the strongest signal (Fig. 3g), which agrees with prediction (Table S4). The detection limit targeting C≡N in BF1 reaches the single-molecule level of 5 nM (Fig. 3h) with an S/N of 6 and a clearly resolved spectrum (Fig. 3i).
Single-molecule BonFIRE imaging
With the superb sensitivity in solutions for both C=C and C≡N bonds, we aimed to perform single-molecule IR imaging. We first characterized the spatial resolution of BonFIRE microscope on 100-nm fluorescent beads, obtaining lateral and axial resolutions of 600 nm and 1.8 μm, respectively (Extended Data Fig. 5). We then confirmed the quality of the single-molecule samples (Figs. S6&S7) prepared following two common approaches (Methods).
Single-molecule BonFIRE images were obtained for C=C bonds in ATTO680 and Rh800 (Fig. 4a–b), where the most intense signal appears at the on-resonance frequency of 1598 cm−1 and diminishes sharply toward the off-resonance frequencies. The fitted spectra at the single-molecule level (Fig. 4a–b, right) closely resemble the bulk spectra (Fig. S6c). We also achieved clear single-molecule imaging and spectroscopy for the weaker C≡N mode in BF1 and isotope-labelled (i.e., 13C≡15N) BF1-conjugated antibodies (Fig. 4c–d). Moreover, BonFIRE can identify multiple isotopologues at the single-molecule level. Fig. 4e shows the fluorescence image of a mixture of 13C≡14N, 12C≡15N, and 12C≡14N labelled BF1 single molecules. The same image is colour-coded (Fig. 4f) based on in-situ BonFIRE spectra (Fig. 4g). Notably, the co-existence of multiple isotopologues within the same diffraction-limited spot was revealed (Extended Data Fig. 6). To our knowledge, this is the first all-far-field single-molecule IR imaging and spectroscopy. The reproducibility of BonFIRE single-molecule imaging is shown in Extended Data Fig. 7, where the S/B ratios of C≡N reach ~3. The imaging results demonstrated here bring the sensitivity of BonFIRE comparable to that of confocal fluorescence.
Figure 4. Single-molecule BonFIRE imaging and spectroscopy.
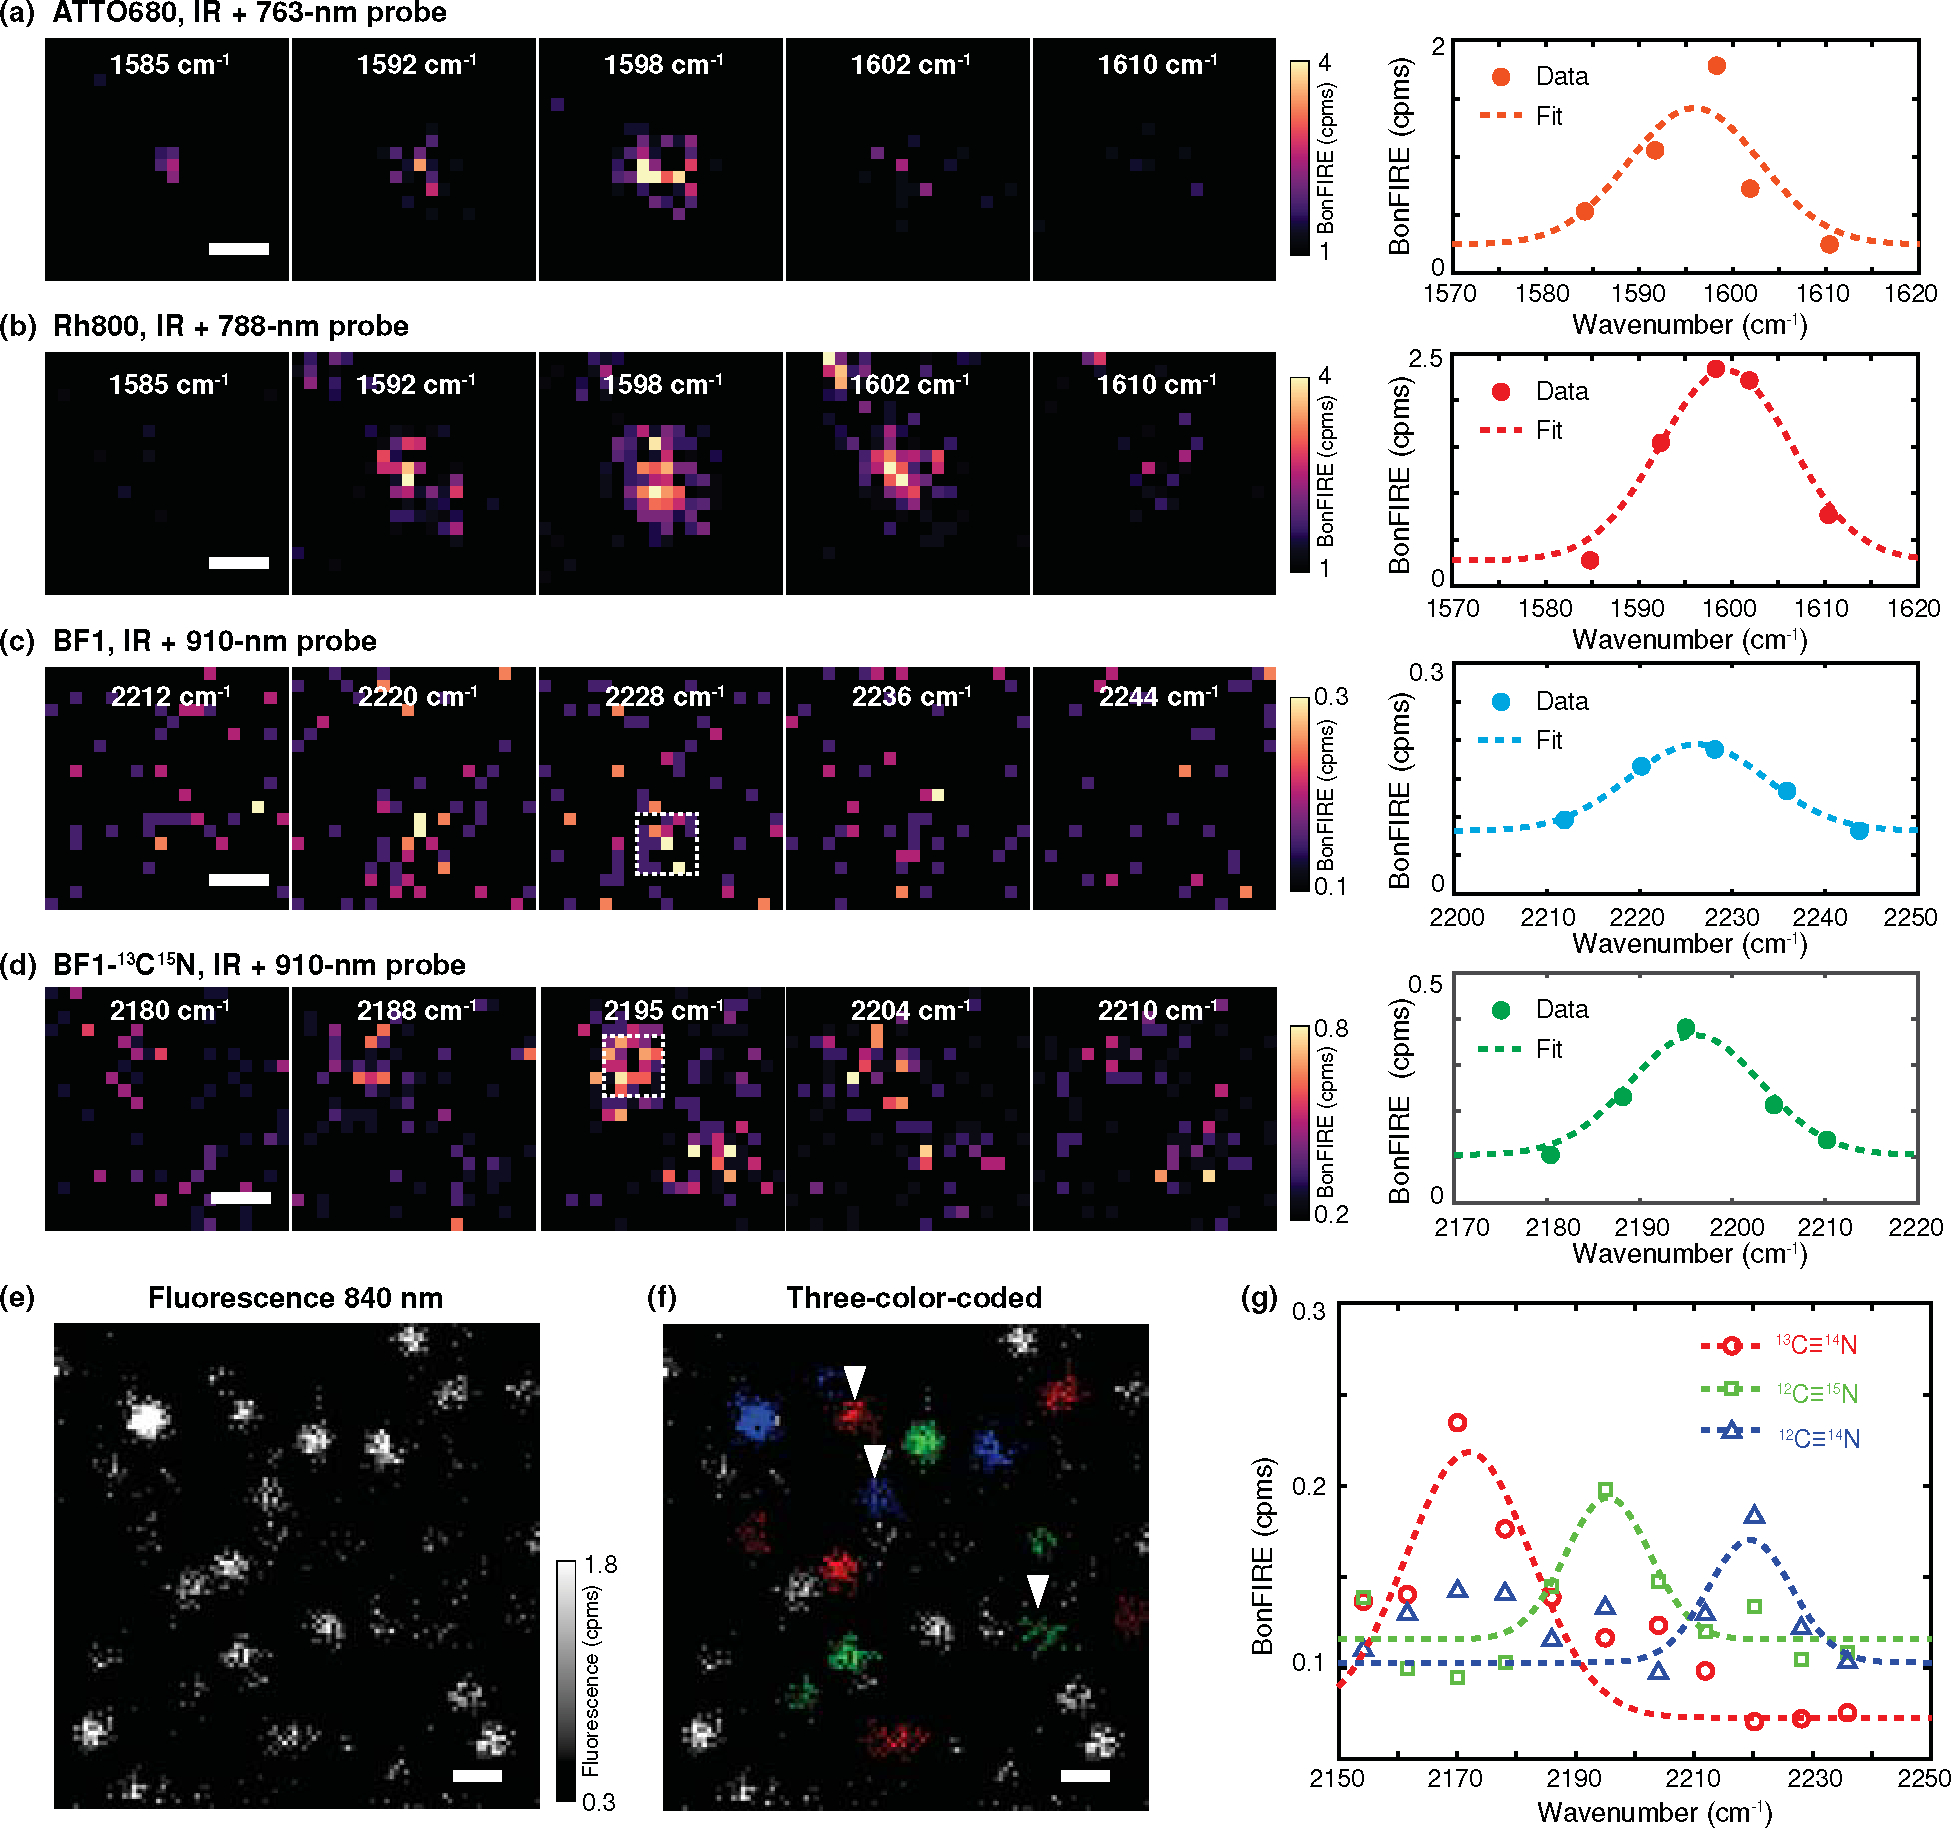
(a-b) Left: single-molecule BonFIRE images of C=C modes in ATTO680 (a) and Rh800 (b) across IR frequencies. The corresponding IR frequencies and the probe wavelengths used are indicated in each image. Right: The spectra with Gaussian fittings are obtained by plotting the average BonFIRE signals within the central 500×500 nm2 area. (c-d) Left: single-molecule BonFIRE images of C≡N bonds in BF1 (c) and its 13C≡15N isotopologue (d) across IR frequencies. Right: The spectra with Gaussian fittings are obtained by plotting average BonFIRE signals within the 500×500 nm2 area indicated by white dashed boxes in (c) and (d). Single dye-conjugated antibodies are used. (e-g) Fluorescence image (e) of the single-molecule mixture with three BF1 isotopologues, resolved and colour-coded (i.e., 13C≡14N (red), 12C≡15N (green), and 12C≡14N (blue)) in (f) based on their in-situ BonFIRE spectra (g, representative spectra plotted from arrowhead-indicated single molecules from f). Unassigned (grey) dots in (f) are due to either a poor S/N or the existence of more than one colour. Cpms: counts per millisecond. Scale bars: 500 nm (a-d) and 1 μm (e-f).
Bond selective bioimaging by BonFIRE microscopy
With narrow bond selectivity and single-molecule sensitivity, we sought to explore BonFIRE’s bio-imaging compatibility. Fig. 5a (left) shows a BonFIRE image of ATTO680-azide-click-labelled 5-ethynyl-2′-deoxyuridine (EdU) from newly synthesized DNA in HeLa cells, targeting the C=C vibration at 1598 cm−1 for ATTO680. As expected, clear patterns of cell nuclei are highlighted. Tuning the IR to an off-resonant frequency with the same probe setting yielded a dark background (Fig. 5a, 1650 cm−1), underlining the bond selectivity. Negligible photobleaching in BonFIRE was confirmed by continuously scanning the same area of the ATTO680-labelled EdU over 100 frames with only ~1% signal fluctuations, comparable to that from direct electronic excitation from the probe alone (Fig. S8). To showcase the high spatial resolution, we imaged ATTO680-click-labelled EdU in extracted chromosomes and ATTO680-immunolabelled fibrillarin from nucleoli (Figs. 5b and 5c, 1598 cm−1), with spatial contrast close to that of standard confocal fluorescence.
Figure 5. Bond-selective bioimaging by BonFIRE microscopy.
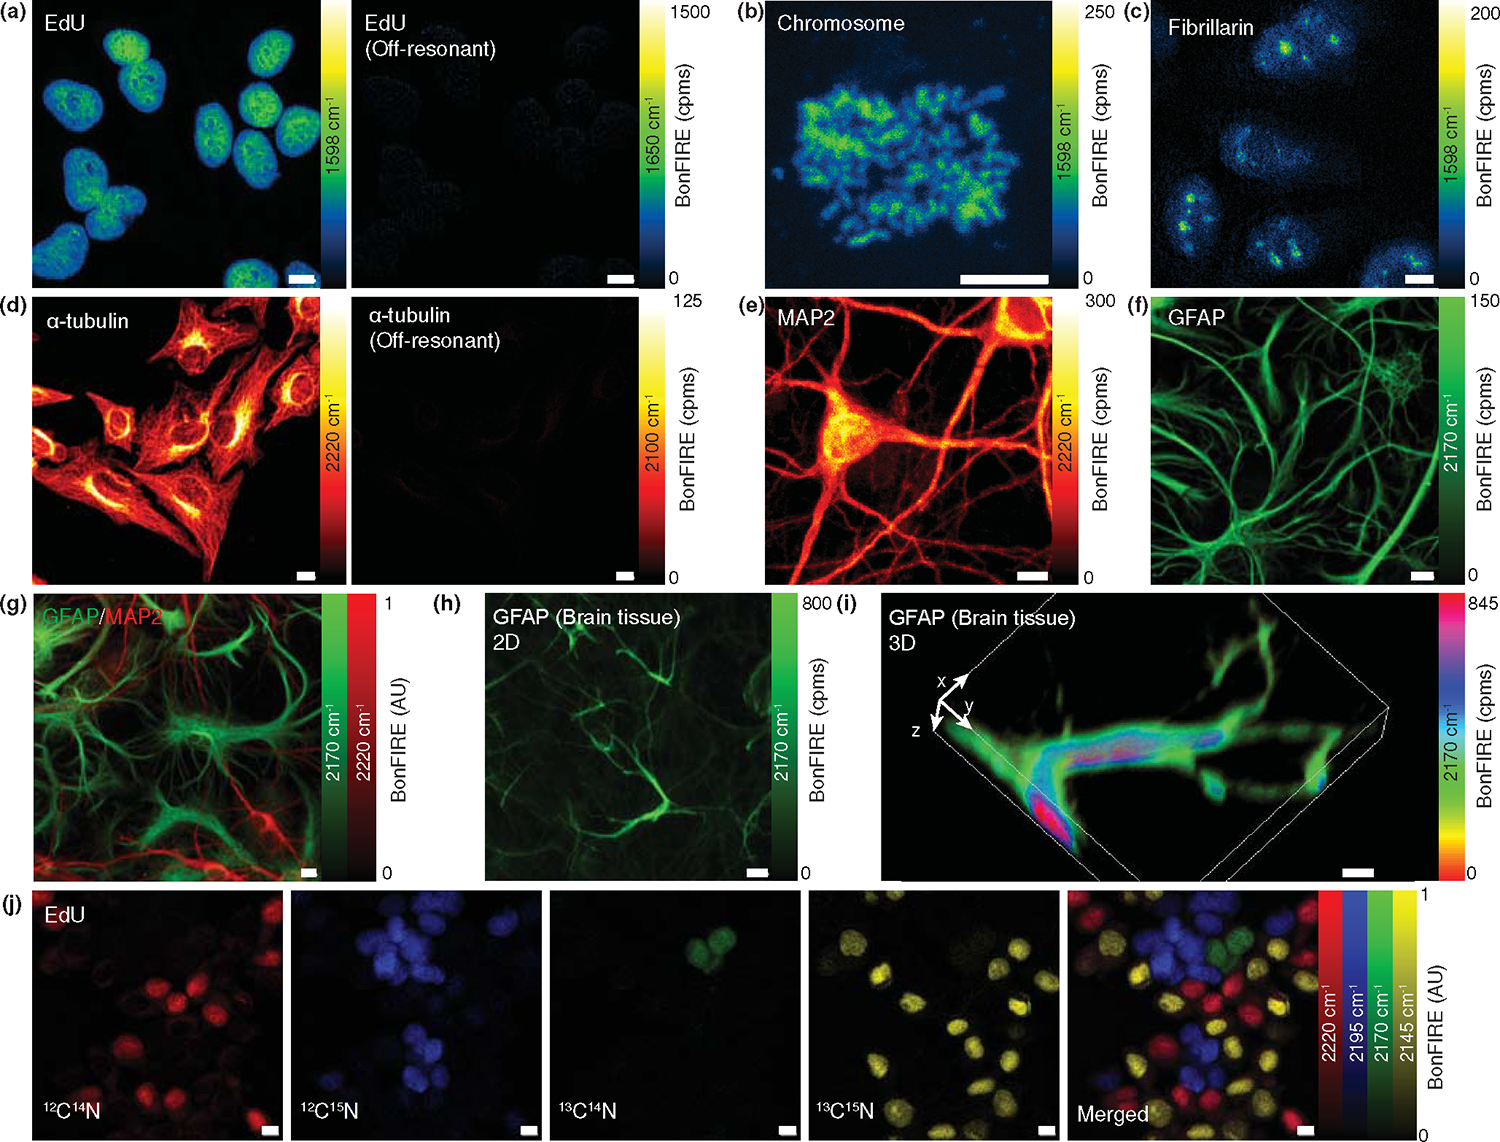
(a) On-resonance (left, 1598 cm−1) and off-resonance (right, 1650 cm−1) BonFIRE images of C=C vibration in ATTO680-click-labelled EdU in nuclei of HeLa cells. (b-c) BonFIRE images targeting C=C vibration in ATTO680-click-labelled EdU in extracted chromosomes (b) and ATTO680-immunolabelled-fibrillarin in nucleoli (c) from HeLa cells. (d) On-resonance (left, 2220 cm−1) and off-resonance (right, 2100 cm−1) BonFIRE images of C≡N vibrations in BF1-immunolabelled α-tubulin in HeLa cells. (e-f) BonFIRE images of 12C≡14N (2220 cm−1, e) in BF1-immunolabelled MAP2 (marker for mature neurons) and 13C≡14N (2170 cm−1, f) in BF1-isotopologue-immunolabelled GFAP (marker for astrocytes) in mouse neuronal co-cultures. (g) Two-colour BonFIRE imaging of 13C≡14N (green, 2170 cm−1) and 12C≡14N (red, 2220 cm−1) in BF1- and BF1-isotopologue-immunolabelled GFAP and MAP2 from the same set of neuronal co-culture. (h-i) 2D (h) and 3D rendering (i) BonFIRE images of BF1-13C≡14N-immunolabelled GFAP in a mouse brain tissue slice. (j) Four-colour BonFIRE images of 12C≡14N (red, 2220 cm−1), 12C≡15N (blue, 2195 cm−1), 13C≡14N (green, 2170 cm−1), and 13C≡15N (yellow, 2145 cm−1) BF1-isotopologue-click-labelled EdU in nuclei of HeLa cells. The merged image is shown to the right. Cpms: counts per millisecond. Scale bars: 10 μm.
In addition to C=C bonds, we performed cell-silent BonFIRE imaging targeting C≡N bonds. Fig. 5d (left) displays the spatial pattern of BF1-immunolabelled α-tubulin targeting its C≡N vibration at 2220 cm−1. Detailed contrast from microtubules in the cytoskeleton of HeLa cells is clearly shown. Such low-abundance delicate cellular structures would not have been detected by mid-IR-photothermal or photoacoustic imaging. BonFIRE signal disappears at an off-resonant frequency, confirming the bond-selectivity (Fig. 5d, right). We also applied the C≡N BonFIRE to map the distribution of MAP2 and GFAP, characteristic marker proteins for mature neurons and astrocytes, respectively, and obtained highly-specific images with BF1 and its 13C≡14N isotopologue immune-labelled antibodies in neuronal co-cultures (Fig. 5e–f). Such narrowband resolvability also allows two-colour imaging for BF1-MAP2 neurons and BF1-13C≡14N-GFAP astrocytes in the same neuronal co-culture (Fig. 5g). BonFIRE also works with tissue imaging, which is exemplified in Fig. 5h and a 3D volumetric rendering in Fig. 5i of mouse brain tissues. To exploit vibrational super-multiplexed imaging beyond fluorescence “colour barrier”,1,5 we imaged four isotopologues of BF1 through four-colour BonFIRE imaging of labelled and mixed HeLa cells (Fig. 5j). Combining the narrowband selectivity, isotope-edited multiplexed probes, and specific labelling methods, BonFIRE microscopy could encode rich vibrational information into fluorescence, opening new avenues for resolving many biomolecular targets in complex biosystems.
Background-free BonFIRE imaging
The BonFIRE S/B is only 8% for C=C bonds in ATTO680 (DMSO) and 23% for C≡N bonds in BF1 (PBS). Such a high background comprises two major sources: anti-Stokes fluorescence from the thermal population38 and the IR-induced photothermal modulation of fluorescence, which is absent of vibrational signatures as it mainly comes from the collective solvent/background absorption (Figs. 6a & S9). For the above static BonFIRE images, we retrieved pure signals by subtracting fluorescence images at non-overlapped delays (e.g., and 10 ps for C=C and C≡N) from that at overlapped delays (e.g., and 1.5 ps for C=C and C≡N). However, such subtraction requires two consecutive frames and slows down imaging speed. In addition, subtraction artefacts exist when the sample moves between two consecutive frames (Fig. S10). We reasoned that a fast modulation of the IR beam in the MHz range should significantly remove both backgrounds, given that the photothermal background builds up at the timescale of tens of μs (Figs. S11&S12). An acoustic optical modulator (AOM) is then used to modulate the IR beam (Fig. 6b). The SPCM is correspondingly replaced by a photomultiplier tube (PMT) with an 80-MHz bandwidth for fast signal detection. The demodulated AC signals from a lock-in amplifier are recorded as BonFIRE signals. Although PMT has a lower quantum efficiency than SPCM, the single-molecule sensitivity in solution could still be reached (Extended Data Fig. 8).
Figure 6. Background-free BonFIRE microscopy.
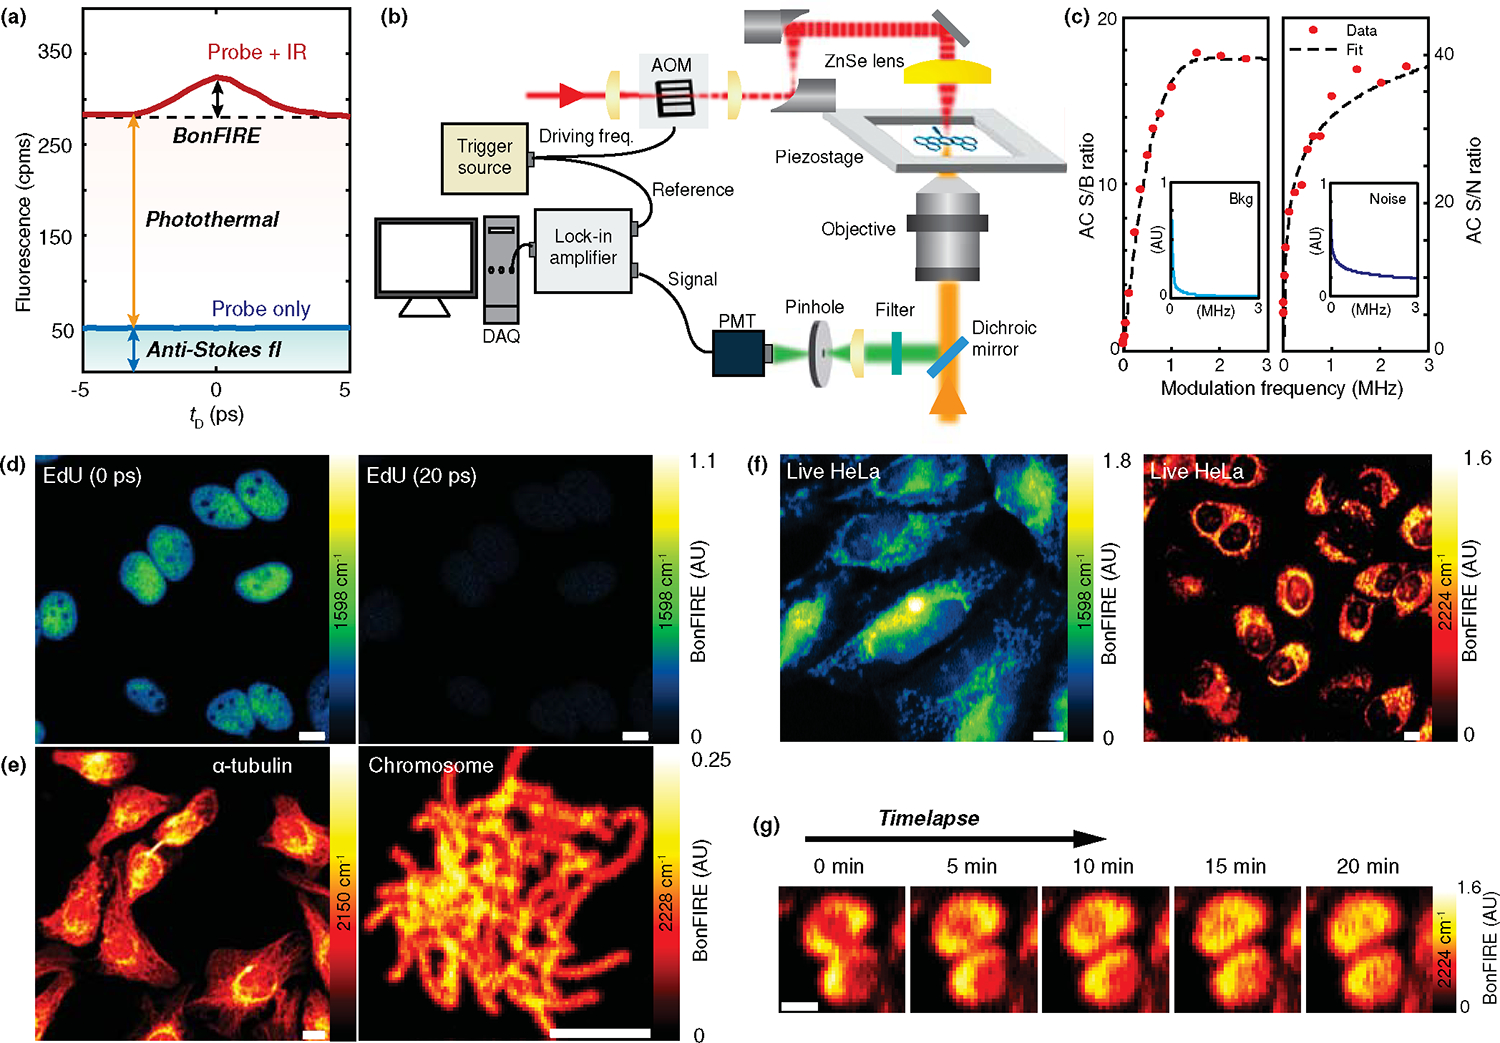
(a) Two major background sources in BonFIRE: anti-Stokes fluorescence (blue-shaded) and photothermal induced fluorescence (red-shaded). Signals shown are from the C≡N of 10 μM BF1 in PBS. cpms: counts per millisecond. (b) Experimental setup of background-free BonFIRE microscopy with fast modulation. AOM: acoustic optical modulator, PMT: photomultiplier tube, DAQ: data acquisition. (c) Dependence of BonFIRE AC S/B (left) and S/N (right) on the AOM modulation frequency. Reductions of background and noise as modulation frequency increases are shown in the insets. Data shown are extracted from a series of BonFIRE images of neuron cells (not shown). Signals are mean values from an area of 4.7×4.7 μm2 (n = 400 pixels). Background and noise are from the mean and SD of the same area (n = 400 pixels) in fluorescence images at . Data are fitted and connected by polynomial curves (order = 4). (d) 0-ps delay (left) and 20-ps delay (right) BonFIRE images of C=C in BF1-click-labelled-EdU in nuclei of HeLa cells. (e) BonFIRE imaging of BF1-13C≡15N-immunolabelled α-tubulin in HeLa cells (left, 2150 cm−1) and BF2-click-labelled EdU of extracted chromosomes (right, 2228 cm−1). (f) Background-free live-cell BonFIRE imaging of Rh800-stained HeLa cells in PBS. Left: IR at 1598 cm−1; right: IR at 2224 cm−1. (g) Representative time-lapse BonFIRE imaging (targeting C≡N at 2224 cm−1) for dividing live HeLa cells stained with Rh800 in PBS. Scale bars: 10 μm.
Experimentally, we confirmed that background and noise decrease exponentially as modulation frequency increases (Fig. 6c, insets), with S/B and S/N levelling off at approximately 2 MHz (Fig. 6c). Background-free BonFIRE imaging is directly obtained from multiple biomolecule targets without subtraction. Fig. 6d shows images from ATTO680-click-labelled-EdU at (left) and 20 ps (right), where signals at 20 ps were turned-off. Similarly, in Fig. 6e, BonFIRE images of BF1-13C≡15N-immuno-labelled α-tubulin of HeLa cells and BF2-click-labelled EdU of extracted chromosomes present clear spatial resolution with high S/Ns on fine subcellular structures. The elimination of two-frame subtraction allows BonFIRE to image live cells (Fig. 6f). In Fig. 6g, the dividing process of Rh800-stained live HeLa cells was time-lapse imaged. The stained mitochondria migrate from peripherals and dividing junction to the whole cell body as the cell goes through telophase to cytokinesis. The background-free BonFIRE is imperative for obtaining spatial and kinetic information in live-cell imaging.
Discussion
In this work, we designed and developed BonFIRE spectro-microscopy, which realizes the IR-electronic double-resonance excitation with a pair of 2-ps narrowband mid-IR and near-IR pulses. BonFIRE has been demonstrated with high signal fidelity, subcellular spatial resolution, straightforward signal analysis with strict linear concentration dependence, minimum photobleaching, accurate bond selectivity and multiplexing with broad spectral coverage. Notably, BonFIRE achieved the first all-far-field single-molecule IR-vibrational imaging without plasmonic enhancements. These features of BonFIRE make it ideal for versatile spatially-resolved functional bio-analysis, including super-multiplexed imaging, live-cell time-lapse imaging, and micro-environment sensing, pushing the boundary of vibrational microscopy one step further to address real-world biological questions.
Admittedly, with the required fluorescence detection scheme, BonFIRE cannot detect nonfluorescent endogenous biomolecules compared to label-free vibrational techniques. However, with proper labelling strategies (e.g., isotope editing, click chemistry, immunolabelling, etc.), BonFIRE can enable multiplexed bioimaging for dilute biomolecules in live cells, which is challenging for label-free methods. With instrument upgrades (e.g., frequency-doubling), we envision that BonFIRE could be applicable to more bio-relevant investigations based on naturally-fluorescent endogenous biomolecules such as chlorophyll, FAD, NADH, as well as fluorescent proteins, such as GFP for genetically-encoded live-cell applications.
With multi-dimensional information, BonFIRE offers unique bioimaging opportunities beyond existing techniques. First, the narrowband and broadly tuneable mid-IR sources allow BonFIRE to investigate many specific bonds of interest for super-multiplexed imaging. In Extended Data Fig. 9, BonFIRE images of six vibrational modes of Rh800, ranging from 1100 cm−1 to 2860 cm−1, were acquired, greatly exceeding the spectral coverage offered by SREF or FEIR. Second, beyond intensity-based measurement, BonFIRE lifetime imaging microscopy (BLIM) can achieve bond-specific vibrational sensing (Fig. S13). In particular, we found the lifetime of conjugated C≡N is linearly dependent on the hydrogen-bonding abilities and electrostatic fields of solvents (Fig. S13b), and can be used to differentiate the local environment in subcellular compartments (Fig. S13c–f). Interestingly, we found that the BLIM of aromatic C-N (around 1300 cm−1 for Rh800) shows high solvatochromism sensitivity and could selectively differentiate the environment between the endoplasmic reticulum (ER) and other structures in the cytoplasm (Fig. S13g–j). This is potentially due to the positive charge from the resonance structure of aromatic C-N, which renders it sensitive to mapping the various charged membrane structures. The vibrational lifetime of C=C, however, lacks environmentally sensitive features in subcellular reporting (Fig. S13k–n). Compared to spectral linewidth or peak shift, the lifetime measured in BLIM is also more sensitive to environmental changes (Fig. S14). Third, widefield BonFIRE has been proven promising in our preliminary data with single-molecule sensitivity (Fig. S15), thanks to the large IR cross section. Such widefield capability is a key step toward localization-based super-resolution imaging and fast widefield mapping for dynamic biological activities (e.g., neuronal firing). These unique advantages in bioimaging distinguish BonFIRE from SREF and FEIR. We summarized the three techniques in Table S5 for a more detailed comparison.
It is also worth mentioning that each laser module (Fig. 1c, lasers 1–3) in BonFIRE setup is commercially available with high stability that ensures day-to-day data reproducibility, which is essential for modern spectroscopic and biological investigations. The current laser system also features an easy conversion to perform state-of-the-art multi-modal vibrational bio-imaging. For example, the signal output from NIR-OPO and the Stokes output (Fig. 1c, laser 1) could allow SREF and stimulated Raman scattering (SRS) imaging, which we have already achieved in preliminary tests. The upgradability of BonFIRE and smooth integration with other modalities would open new opportunities from fundamental nonlinear optics to biological analysis and beyond.
Methods
Experimental setup of BonFIRE
As shown in Fig. 1c, the BonFIRE system consists of two arms of laser outputs pumped by the primary source of a 2-ps 80 MHz mode-locked Yb fiber laser centered at 1031.2 nm (inside laser 1). First, mid-IR sources are composed of an optical parametric oscillator (OPO) with IR outputs (Levante IR, APE GmbH, laser 2) synchronously pumped by the 1031.2-nm laser, and a difference frequency generation (DFG) system (Harmonixx DFG, APE GmbH, laser 3) fed by the signal and idler from the IR-OPO. The combined 2-ps tunable idler and DFG outputs cover the range of 800–4800 cm−1 (2.1–12 μm) (Extended Data Fig. 2). Second, a separate portion of the 1031.2-nm pump is frequency-doubled to 515.6 nm through a second harmonic generation (SHG) crystal before being used to pump a second OPO with a tunable (700–960 nm, 2 ps) near-IR probe output (PicoEmerald, APE GmbH, laser 1) for upconverting excitation. The probe beam was guided to a spatial filter with a 70-μm pinhole (P75HK, Thorlabs) to obtain a Gaussian beam profile and then expanded by a pair of lenses by a factor of 4. The IR beam was expanded by a factor of 1.5 through a pair of off-axis parabolic mirrors (Thorlabs). IR and probe beams are then aligned to a customized stage-scan (P-545, PI) confocal microscope in a counter-propagating configuration, with a ZnSe lens (NA = 1) and a water-immersion near-IR-coated objective (25×, NA = 1.05), respectively, for optimal focusing and throughput of each beam. A delay stage (DL325, Newport) is added to the probe beam path for precise temporal overlapping of the two pulse trains. The backward fluorescence is collected by a single-photon-counting module (SPCM) with proper optical filter sets. All data acquisition, stage scanning, and laser tuning are controlled by a home-written LabVIEW program.
Fluorescence signals were separated and collected by a set of a long-pass dichroic mirror and filter through epi-detection and collected by a single-photon counting module (SPCM-AQRH-16, dark count 11 cps, Excelitas). The collected fluorescence was focused by a tube lens (150 mm) onto the 180-μm aperture of the SPCM, ensuring a loose confocal condition. The TTL counts from SPCM were recorded by a multifunctional data acquisition card (PCIe-6351, NI) in the counter mode and read by the customized LabVIEW program. SPCM readings were corrected according to the calibration curve provided by the manufacturer during post-processing. For ATTO680 C=C, the dichroic/filter set was FF738-FDi01/FF01-665/150 (Semrock). For BF1 C≡N, the dichroic/filter set was Di02-R830/FF01-775/140 (Semrock). For single-molecule imaging of BF1 C≡N, double filters (FF731/137 and FF709/167, Semrock) were used to minimize the background.
For background-free BonFIRE, IR modulation was enabled by two AOMs with coatings centered at 4500 nm (GEM-40-4-4500/4mm, Brimrose) for C≡N and 6282 nm (GEM-40-4-6282/4mm, Brimrose) for C=C. The IR was focused on the AOM aperture (4 mm) and collimated by a pair of CaF2 (LA5255, Thorlabs) or ZnSe (LA7228-E2, Thorlabs) lenses. A 0–5V square wave trigger was generated by a function generator (DG2102, RIGOL) to trigger the AOM. The same trigger was routed to a lock-in amplifier (HF2LI, 50MHz bandwidth, Zurich) for signal demodulation. Fluorescence was detected by a PMT (PMT1002, Thorlabs) installed after a 400-μm confocal pinhole (P400K, Thorlabs). The DC signal from PMT and AC signal from the lock-in amplifier were recorded simultaneously and processed in the customized LabVIEW program.
For widefield BonFIRE microscopy in Fig. S15, the SPCM in was replaced by an sCMOS camera (ORCA-Fusion BT, Hamamatsu, with 2304×2304 pixels of 6.5 μm × 6.5 μm each). The same objective and a 200-mm focal length tube lens (AC254-200-B, Thorlabs) were used to achieve a 27.8× magnification, resulting in a 0.23-μm pixel size on the image plane on camera. A ZnSe lens (NA = 1, Edmund) was used to focus the IR beam to a spot of ~ 5 μm diameter to guarantee the maximal IR transition for the single-molecule sensitivity. The illumination area of the probe beam was enlarged to ~10 μm by adjusting the expansion telescope. The field of view (FOV) of BonFIRE was measured to be 5 μm (Fig. S15a) from a Rh800-stained PVA thin film. Each widefield BonFIRE image is the difference between two consecutive fluorescence frames, one at of 0 ps and the other at 20 ps, to remove the background. For single-FOV imaging demonstrated in Fig. S15g, 2-ms imaging speed per BonFIRE frame is achieved from the subtraction of the two consecutive fluorescence frames each with ~1 ms exposure. For scanning and stitching individual FOVs to form a large-area image (Fig. S15h), we picked a smaller square FOV with size of 3 μm at the center, where the illumination is uniform. The step size of the piezo sample stage (P-545, PI) was set to match 3 μm during the scan. A customized LabVIEW code was used to synchronize image acquisition with the stage scan. The total time needed for capturing all frames used in Fig. S15h (87×87 μm2, 29×29 FOVs) is 51 s, about 30 times faster than using the point-scan scheme with the same parameters (i.e., pixel size and dwell time). The total time needed for stitching large-area images was mostly dominated by the movement speed of the piezostage and the time needed for the data synchronization between the camera and PC (~ 60 ms per step instead of 2 ms). For biological samples where the single-molecule sensitivity is not necessary, the acquisition time can be further reduced by expanding IR and probe illumination with increased FOV.
For BLIM images, all data were collected based on the background-free BonFIRE setup using IR modulation implemented by a chopper (MC2000B, Thorlabs) at 10 kHz and lock-in demodulation, at multiple steps with small spacings. The signal decay at each pixel is fitted with a single exponential function to extract the 1/e vibrational lifetime.
Modeling of the double-resonance in BonFIRE
Similar to physical modeling in SREF,1 it is feasible to model the BonFIRE process with a three-level system with populations of , and (Fig. S2a). The transition rates between the three states can be written as (IR-excitation rate), (probe up-conversion rate), and (vibrational relaxation rate). The rate equations can be written as follows:
| (1) |
| (2) |
| (3) |
Table S4 summarizes absorption coefficients and calculated F-C factors of six triple-bond bearing dyes. Considering the C≡N bond of BF1 with IR extinction coefficient of 70 M−1 cm−1 (2.7 × 10 cm2 per molecule). With 100-mW IR power on the sample at 2224 cm−1 (4496 nm), there are about 2.8 × 10 IR photons in one pulse (the laser repetition rate is 80 MHz). The diffraction-limited focal area of IR is . The transition rate for a single molecule could be estimated as:
| (4) |
For the second up-conversion step, we use the extinction coefficient of 1.2 × 10 M−1 cm−1 at the absorption peak of BF1 as an estimation of the electronic cross section (4.6 × 10 cm2) and use an F-C factor of 0.1.2 We assume a probe (890 nm) power of 10 mW with 5.6 × 10 photons per pulse. The probe focal area can be estimated from the spatial resolution measurements, which is 3.6 × 10⁻⁹ cm2. Therefore:
| (5) |
Finally, we assume the vibrational lifetime of C≡N to be 0.4 ps, which is estimated from the 13 cm−1 linewidth obtained by deconvoluting the Gaussian peak in Fig. 3d with 8 cm−1 laser bandwidth. Thus, .
Similarly, for BF1 C=C bonds, we can obtain for 10 mW IR power at 6257 nm (1598 cm−1) and for 10 mW probe power at 845 nm. We used a longer lifetime of 0.6 ps2 and for C=C. Given all these values, we can numerically solve rate equations (1–3) and investigate the properties of BonFIRE signals.
First, changes in and are plotted over time in Figs. S2b&e for double and triple bonds, respectively. The vibrationally excited-state population of saturates within the 2-ps duration. The electronic excited-state population , which is proportional to the emitted fluorescence, also starts to level off at the end of the 2-ps duration. The saturated can be found by arbitrarily extending the pulse duration to 10 ps, and the from 2-ps excitation is already 82% of the saturated value for C=C and 88% for C≡N. The transition efficiency of BonFIRE could be defined as . As a result, transition efficiencies are 10.0% and 2.4% for C=C and C≡N, respectively, with 2-ps radiations. Compared to fs pulses, 2-ps pulses reach a balance between the high spectral resolution (~8 cm−1) and sufficient transition efficiency. Note that by updating the used lifetimes of 0.6 ps and 0.4 ps with 1.8 ps and 0.9 ps (experimentally obtained from BLIM), transition rates can increase up to 14.8% and 3.8% for C=C and C≡N, respectively.
In Figs. S2c–d and S2f–g, is plotted as the function of transition rates and , respectively. A monotonic trend, which is linear at the beginning and saturates later, is observed in both curves. This trend successfully reproduces the experimental observations of probe power dependence. Regarding the IR excitation rate, the trend is quite linear within the experimental conditions, agreeing with the linear trend observed in BonFIRE experiments.
Linear unmixing post-processing
BonFIRE signal can be expressed as a multiplication of the normalized cross sections matrix and dye concentrations . Using the cross section matrix of C≡N BF1 isotopologues derived from Fig. 3e, unmixed images in Fig 5g&j were generated via matrix multiplication implemented using MATLAB.
Materials
Dyes.
ATTO, Alexa, and cyanine dyes were purchased from ATTO-TEC GmbH, Thermo Fisher, and Lumiprobe. Nile blue and Rh800 were purchased from Sigma Aldrich. All dyes were aliquoted in DMSO as stock solutions (10 mM) upon receiving and stored at −20°C. Synthesis of customized BF dyes and their isotopologues was conducted using published procedures (Table S3).
Antibodies.
Primary antibodies:
Anti-α-tubulin in rabbit (ab18251, Abcam); Anti-GFAP in mouse (3670S, Cell Signaling Technology); Anti-MAP2 in rabbit (ab32454, Abcam). Secondary antibodies: Goat anti-mouse antibody (31160, Invitrogen); Goat anti-rabbit antibody (31210, Invitrogen).
UV-vis absorption, fluorescence emission, and FTIR
UV-vis spectra were obtained from dye solutions with concentrations of 1~10 μM in DMSO or PBS on a Varian Cary 500 Scan UV-Vis near-IR spectrophotometer (Agilent). Fluorescence emission spectra were recorded on an RF-6000 spectrofluorometer (Shimadzu) with dye concentrations of 1~10 μM in DMSO or PBS. FTIR spectroscopy was performed with a VERTEX 80v FTIR spectrometer (Bruker). FTIR were measured from either 10 mM DMSO solution or KBr.
Preparation of single-molecule samples
For the spin-coated samples, a dilute solution of dyes (5–20 pM) in 0.2% PVA was prepared freshly from the stock solution and then deposited on a fresh CaF2 window by a spin coater (BSC-100, MicroNano Tools) at 5000 rpm for 30 s.1, 3 For dye-antibody conjugates, the CaF2 window was first coated with poly-l-lysine by incubating 200 μL of 0.01 mg/mL poly-l-lysine (Sigma) on the surface at room temperature for 1h. Then, the CaF2 window was rinsed with DI water several times before being incubated with diluted (e.g., 1 × 10⁶ diluted from the stock) dye-antibody solutions for 40 min. Finally, the sample was rinsed with DI water and dried under air at room temperature.4 The concentrations of BF1-antibody stock solutions for 13C≡14N, 12C≡15N, and 12C≡14N are 0.93 mg/mL, 0.51 mg/mL, and 1.54 mg/mL with dye: protein ratios of 2.4, 1.7, and 2.6, respectively, confirmed with UV-vis absorption measurements. For the mixed single-molecule sample, the BF1-antibody stock solutions of 13C≡14N, 12C≡15N, and 12C≡14N were diluted by 0.5 × 10⁶, 1 × 10⁶, and 0.75 × 10⁶ times in PBS and incubated on a poly-l-lysine coated CaF2 window simultaneously for 30 min.
Preparation of biological samples
HeLa culture.
Cultured HeLa-CCL2 (ATCC) cells were seeded onto 0.3-mm thick CaF2 windows with a density of 1 × 10⁵ cells/mL in 4-well plates with 0.3 mL DMEM culture medium at 37 °C and 5% CO2. DMEM culture medium was made of 90% Dulbecco’s modified Eagle medium (DMEM; 11965, Invitrogen), 10% fetal bovine serum (FBS; 10082, Invitrogen), and 1× penicillin/streptomycin (15140, Invitrogen). For the cells with EdU labelling, DMEM culture medium was then changed to DMEM medium (FBS-free, Gibco) for 20–22 h for cell cycle synchronization. After synchronization, the medium was replaced back to DMEM culture medium and EdU (10 mM stock in H2O) was simultaneously added with a concentration of 100 μM for 20–24 h. Then 4% PFA was added for 20 min for fixation. After that, DPBS was used to wash away PFA and fixed cells could be stored in DPBS at 4 °C for several days.
Neuron culture.
Primary rat hippocampal neurons were isolated from neonatal Sprague–Dawley rat (CD® (Sprague Dawley) IGS Rat, Charles River) pups with a protocol (IA22-1835) approved by Caltech’s Institutional Animal Care and Use Committee (IACUC). The brains were dissected from the skull and placed into a 10 cm petri dish with ice-chilled HBSS (Hanks’ Balanced Salt Solution, Gibco). The hippocampus was isolated from the brains under a dissection scope, cut into small pieces (~0.5 mm), and incubated with 5 ml of Trypsin-EDTA (0.25%, Gibco) at 37 °C with 5% CO for 15 min. The Trypsin-EDTA liquid was aspirated and replaced with 2 ml of DMEM containing 10% FBS to stop the digestion. The tissue fragments were changed into 2 mL neuronal culture medium (Neurobasal A medium, B-27 supplement, GlutaMAX supplement, Thermos Fisher, and 1x penicillin-streptomycin) and were dispersed by repeated pipetting several times. The supernatant was collected and further diluted by neuronal culture medium to a final cell density of 9 × 10⁴ cells/mL. A 0.7-ml volume of cell suspension was added to each well of a 24-well plate on the coated CaF2 windows. For pre-coating, sterile CaF2 windows were incubated with 100 μg/ml poly-D-lysine (Sigma) solution at 37 °C with 5% CO2 for 24 h in a 24-well plate. The CaF2 windows were washed twice with ddH2O and incubated with 10 μg/ml laminin mouse protein (Gibco) solution at 37 °C with 5% CO2 overnight. Thereafter, the CaF2 windows were washed twice with ddH2O and allowed to dry at room temperature inside of biosafety cabinet. Half of the neuron culture medium was replaced with fresh medium every four days. At DIV14, 4% PFA was added for 20 min for fixation. DPBS was used to wash away PFA and fixed cells could be stored in DPBS at 4 °C for several days.
Click-reaction of EdU labelled samples.
After permeabilization, the EdU labelled cells were incubated with reaction buffer prepared following the procedure specified in the Click reaction buffer kit (C10269, Thermo Fisher). For the four-colour BonFIRE imaging experiment, four cell suspensions were each clicked-labelled with the four C≡N isotopologues of BF1-azide. Then, a mixture of the clicked-cell suspensions was deposited onto a CaF2 window.
Spread chromosome preparation.
HeLa cells were seeded in a 35-cm dish and labelled with EdU. Cells were incubated with 1 μg/mL colcemid (KaryoMAX™ Colcemid™ Solution in PBS, Gibco) for 4 hours. Cells were trypsinized into single cells with Trypsin-EDTA (0.25%, Gibco). To stop the digestion, 5 mL DMEM containing 10% FBS was added. The cell suspensions were centrifuged at 120 × g for 5 min and the supernatant was aspirated with about 200 μL left in the tube. Clumps were removed by gently tapping the bottom of the tube. 5 mL of ice-cold 0.56% KCl solution was added to the cell suspensions gently. After putting it at room temperature for 10 min, the cell suspensions were centrifuged at 120 × g for 5 min and the supernatant was aspirated with about 200 μl left in the tube. 5 ml of methanol: glacial acetic acid (3:1) fixative solution was added to the cell suspensions gently and slowly. The cell suspensions were centrifuged at 120 × g for 5 min and the cells were resuspended with PBS, after aspirating the supernatant. The cells were then clicked-labelled using the procedure described above. The clicked chromosomes were deposited onto a CaF2 window and were dried for BonFIRE imaging.
Rh800-stained HeLa cell.
Live HeLa cells seeded on 0.3-mm thick CaF2 windows were incubated in DMEM with 0.5–2 μM Rh800 for 30 min at 37 °C. After incubation, DMEM was replaced with PBS containing 1 μM Rh800 and was transferred to the sample holder. The CaF2 window was then sealed using another CaF2 window with a 12-μm-thick spacer before imaging. For BLIM, fixed HeLa cells were incubated in 10 μM Rh800 (PBS) for 15 min at room temperature and sealed with a 56-μm-thick spacer.
Secondary antibody-dye conjugation.
The secondary antibody was diluted to 2 mg/mL using 0.1 M NaHCO3. To reach a final pH of ~8.3, one-tenth volume of 1 M NaHCO3 was added to the diluted antibody solution. To start the conjugation reaction, 3 mM of N-hydroxysuccinimide ester-activated BF1 dye was added at a dye-to-protein ratio of ~30:1. The reaction was incubated in the dark for 1.5 h under slow stirring. Gel permeation chromatography was used to remove the excess dye from the conjugated protein. The Sephadex G-25 was first swelled at 90 °C for 1 h and was used to pack a 1 cm diameter column with >12 cm length. After the reaction, the solution was loaded onto the column and the first eluted dye band was collected. The collected proteins were then concentrated using Amicon ultra-centrifugal filters (UFC501096, EMD, Millipore, 14000 × g for concentrating and 1000 × g for recovering) to a final concentration of 1–2 mg/mL in PBS.
Immuno-staining of fixed HeLa/neurons/brain tissue.
Fixed cells were first permeabilized using 0.1% Triton X-100 (T8787, Sigma) for 20 min. After blocking for 1–3 h in 10% goat serum/1% BSA/0.3 M glycine/0.1% PBST, the cells were incubated overnight at 4 °C in 10 μg/mL primary antibody in 3% BSA. After washing with PBS, the cells were blocked using 10% goat serum in 0.1% PBST for 1–3 h, followed by overnight incubation at 4 °C in ~10 μg/mL secondary antibody in 10% goat serum. The cells were blocked with 10% goat serum for 30 min and dried before imaging.
Extended Data
Extended Data Fig. 1. Power outputs of the Idler and the DFG IR lasers.
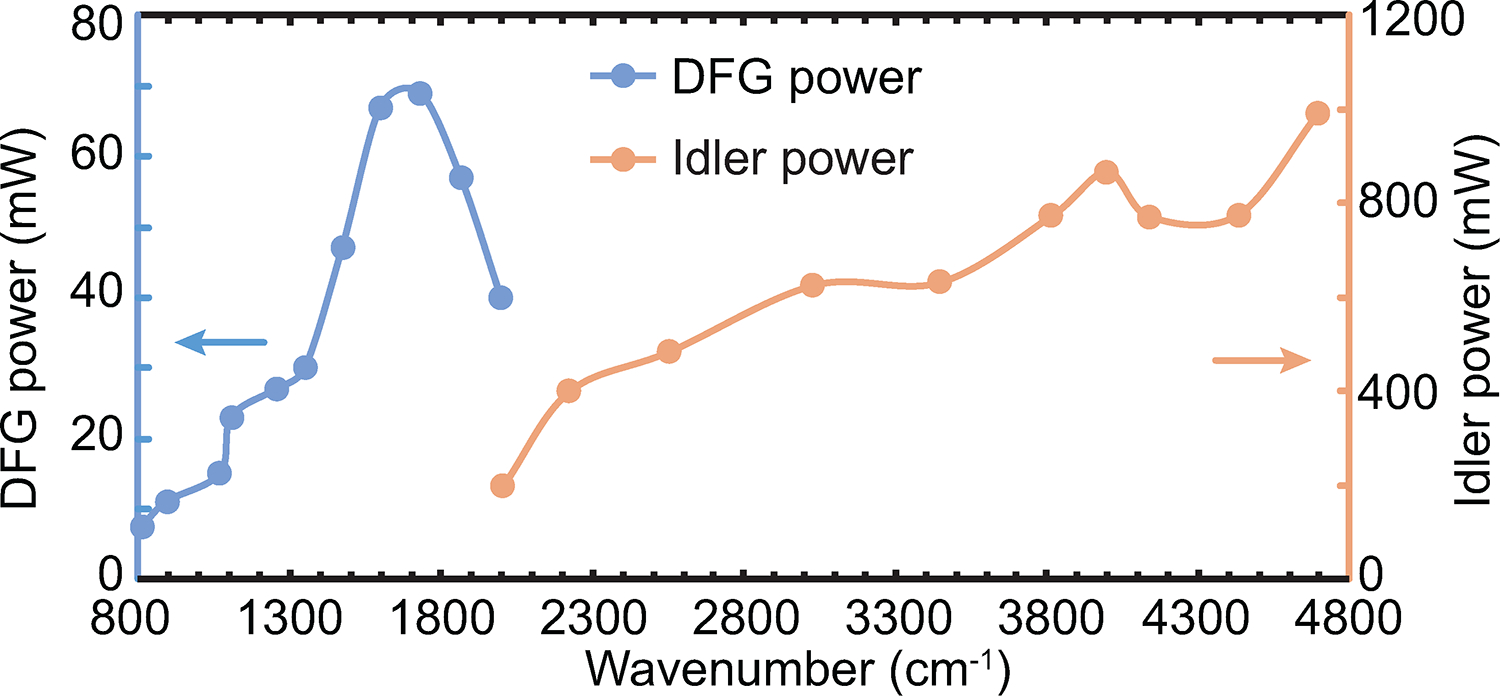
The power is measured at the laser outputs using a thermopile power meter (919P-003-10, Newport). All wavenumbers between 800 and 4800 cm−1 (2.1–12 μm) are covered. The pulse width is 2 ps with a bandwidth of 8–10 cm−1 according to the manufacturer (APE Angewandte Physik & Elektronik GmbH, Berlin, Germany).
Extended Data Fig. 2. Reduced photothermal background in acetonitrile-d3.
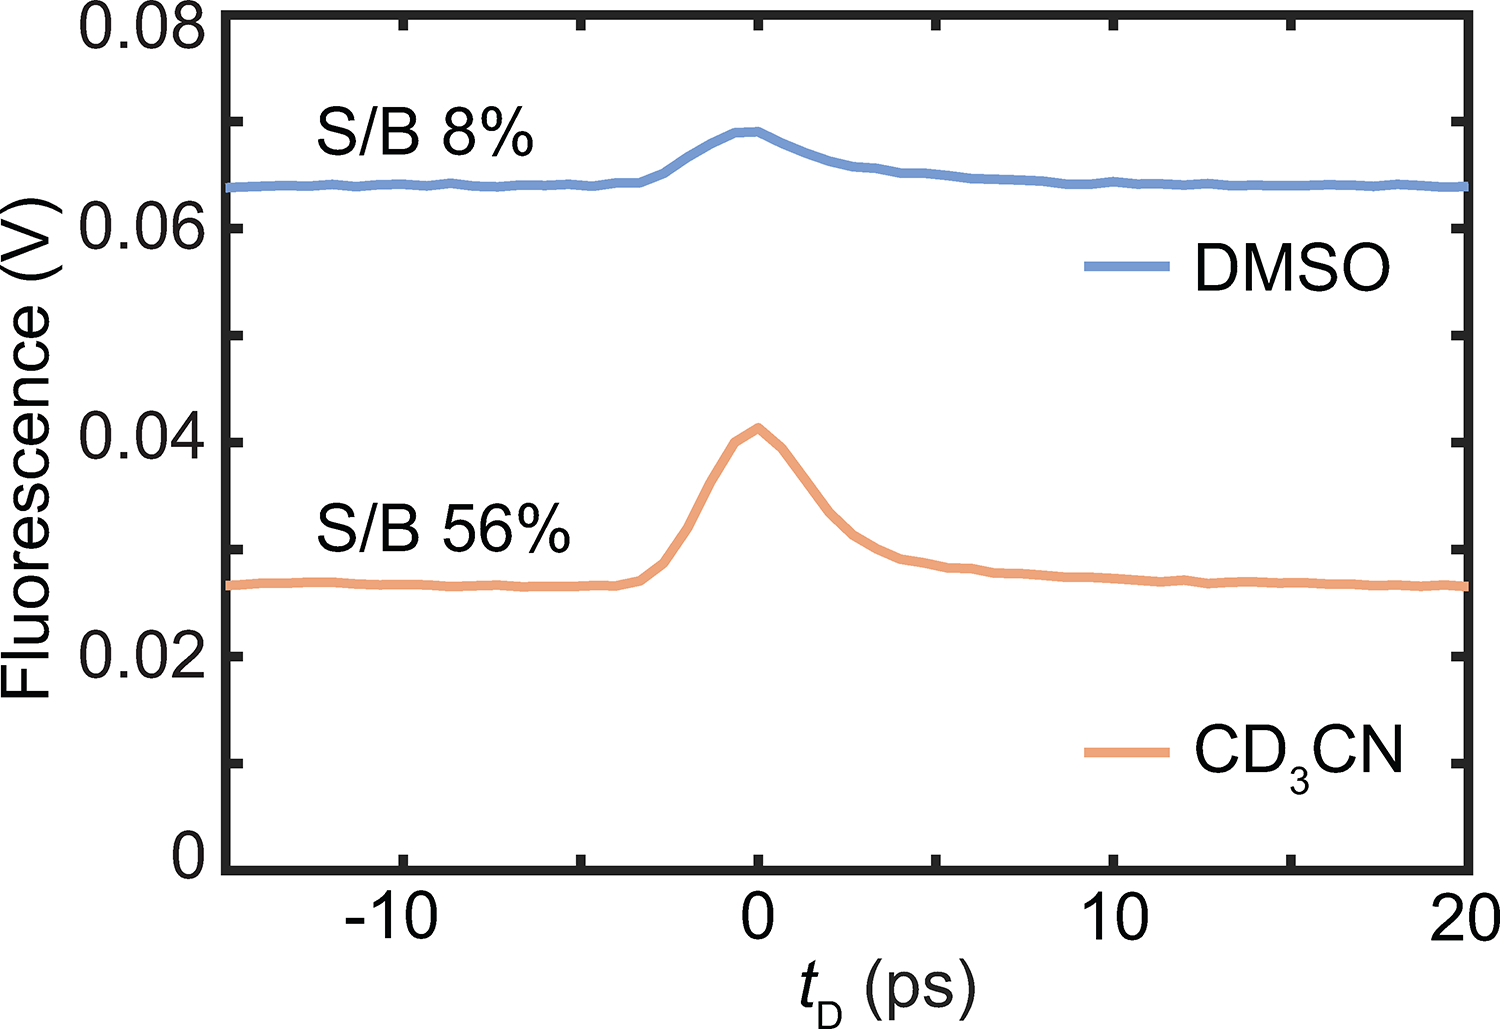
The fluorescence vs. IR-probe delay () of ATTO680 in DMSO (blue) and acetonitrile-d3(orange) obtained using 1598 cm−1 IR frequency and 765-nm probe wavelength. While the signal-to-background (S/B) ratio is about 8% in DMSO, it increases to 56% in acetonitrile-d3.
Extended Data Fig. 3. Correlation between BonFIRE and FTIR spectra.
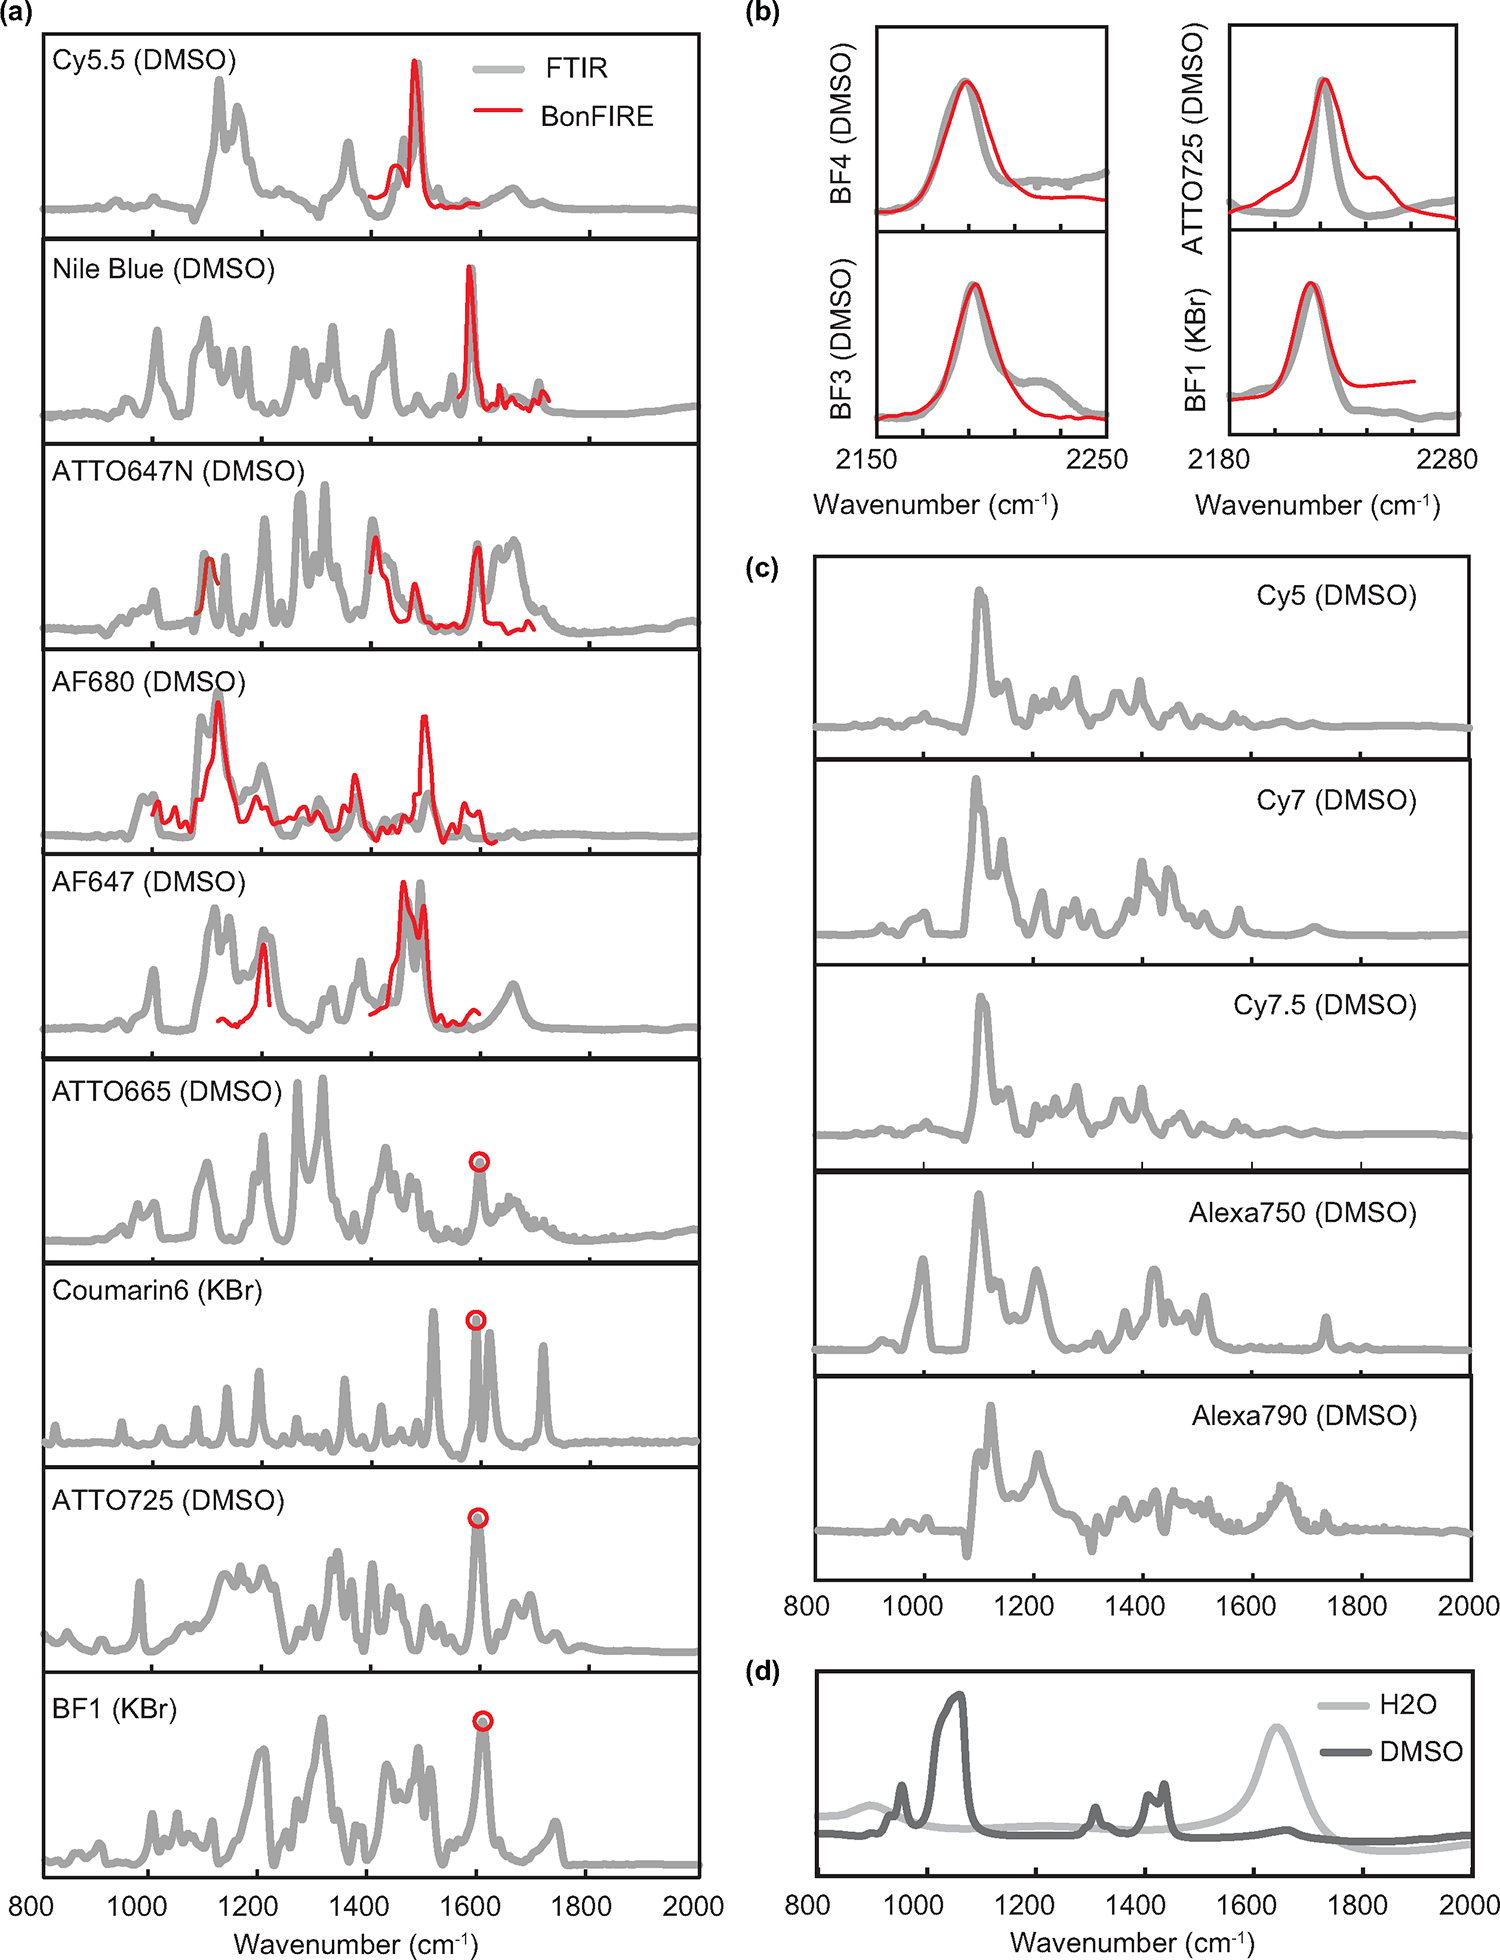
a, FTIR (grey) and BonFIRE (red) spectra obtained for dyes in the fingerprint region. The dye and the experimental conditions (either in 10 mM DMSO solutions or in KBr pellets) for obtaining FTIR spectrum are indicated in each spectrum. The BonFIRE spectra (red curves) and single-point BonFIRE measurements (red circles, BonFIRE vs. IR-probe delay obtained for the single wavenumber) are scaled and overplotted on top of the FTIR reference for better comparison. b, FTIR and BonFIRE spectra of four dyes in the cell-silent region. c, FTIR spectra of other dyes expected to be measured in BonFIRE (for grey dots in Fig. 1b). The FTIR spectra in (a) and (c) measured in DMSO are often complicated by the IR absorption of DMSO and water (DMSO is hygroscopic), whose spectra are plotted in (d) for reference. The spectra of ATTO680 and Rh800 are not shown here as they are shown in Fig. 2f and Extended Data Fig. 9.
Extended Data Fig. 4. Characterization of cell-silent BonFIRE.
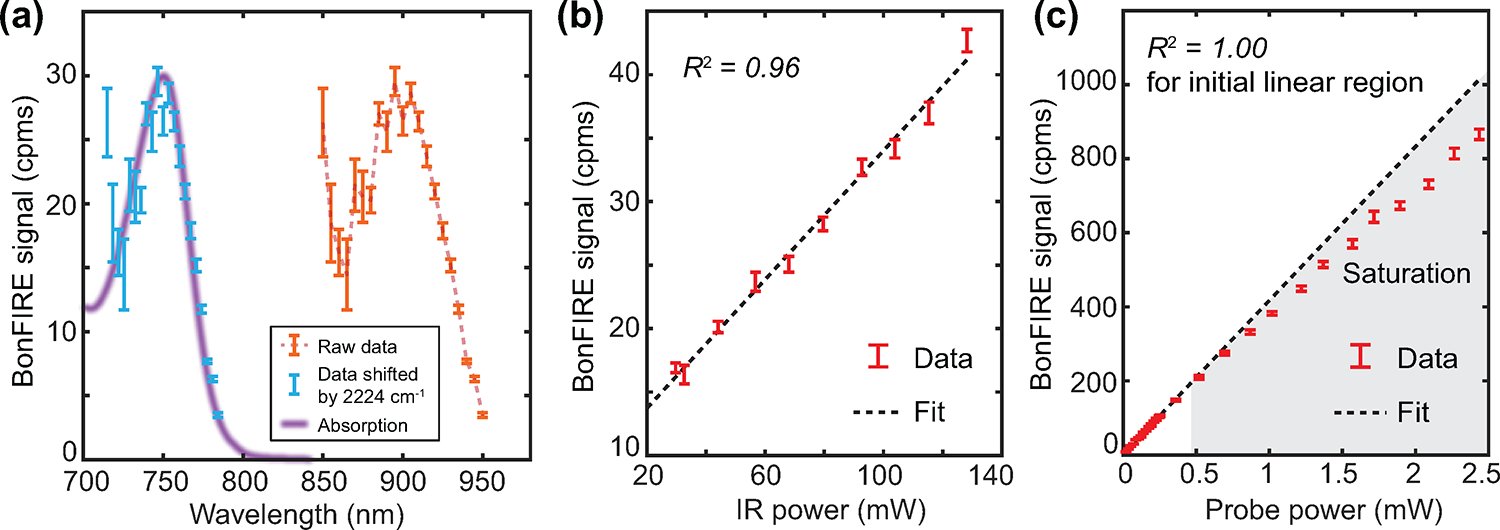
a, BonFIRE signal dependence on the probe wavelength (orange). The BonFIRE excitation profile (blue, by horizontally shifting the raw data by adding the IR frequency of 2224 cm−1) is overplotted with the absorption spectrum of BF1 (purple). Data are presented as peak values +/− s.d. from the background (n = 14). b,c, BonFIRE signal dependence on the IR power (b) and the probe power (c) on sample, measured from 10 μM BF1 in PBS. The probe power dependence shows good linearity (R2 = 1.00) at low power levels but quickly saturates. Data are presented as peak values +/− s.d. from the background (n = 17).
Extended Data Fig. 5. Spatial resolution of BonFIRE microscopy.

a, BonFIRE images of 100-nm fluorescent beads (Invitrogen™ FluoSpheres™ carboxylate-modified microspheres, 0.1 μm, 715/755 nm, Fisher Scientific) embedded in PVA film on a CaF2 substrate. The image was obtained with 1592 cm−1 IR (~24 mW on sample) and 815 nm probe (~180 μW on sample). Scale bar, 1 μm. b, A sectional profile obtained from XY plane from a location indicated by the white dashed line in (a), a lateral resolution (FWHM) of 0.6 μm is obtained from Gaussian fitting. The Z-resolution of 1.8 μm is determined by fitting the sectional profile from the ZY plane (shown as inset). a.u., arbitrary unit.
Extended Data Fig. 6. Observation of multiple single-molecule isotopologues within the same diffraction-limited spot.
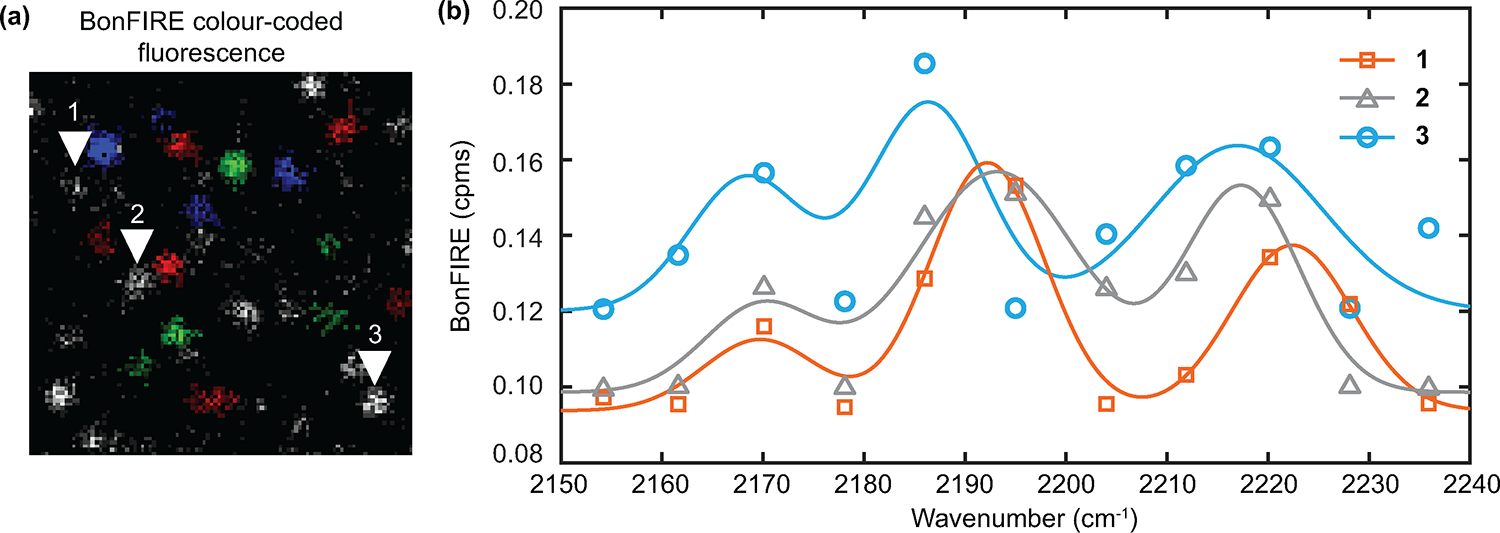
a, Colour-coded fluorescence imaging for a mixture of single-molecule BF1 isotopologues as shown in Fig. 4i. Red: BF1-13C ≡ 14N (2170 cm−1); green: BF1-12C ≡ 15N (2195 cm−1); and blue: BF1-12C ≡ 14N (2220 cm−1). b, In-situ BonFIRE spectra obtained from three spots indicated by the corresponding numbered arrowheads in (a). Gaussian fittings (and a linear background) are shown as solid curves. Spectra of spots 1 (orange), 2 (grey), and 3 (blue) contain all three vibrational peaks. Slight variations in peak positions are possibly due to local interactions41. c.p.ms, counts per millisecond. These results demonstrate BonFIRE can resolve multiple vibrational colours within the same diffraction-limited spot at the single-molecule level.
Extended Data Fig. 7. Evidence for robust single-molecule sensitivity of BonFIRE.
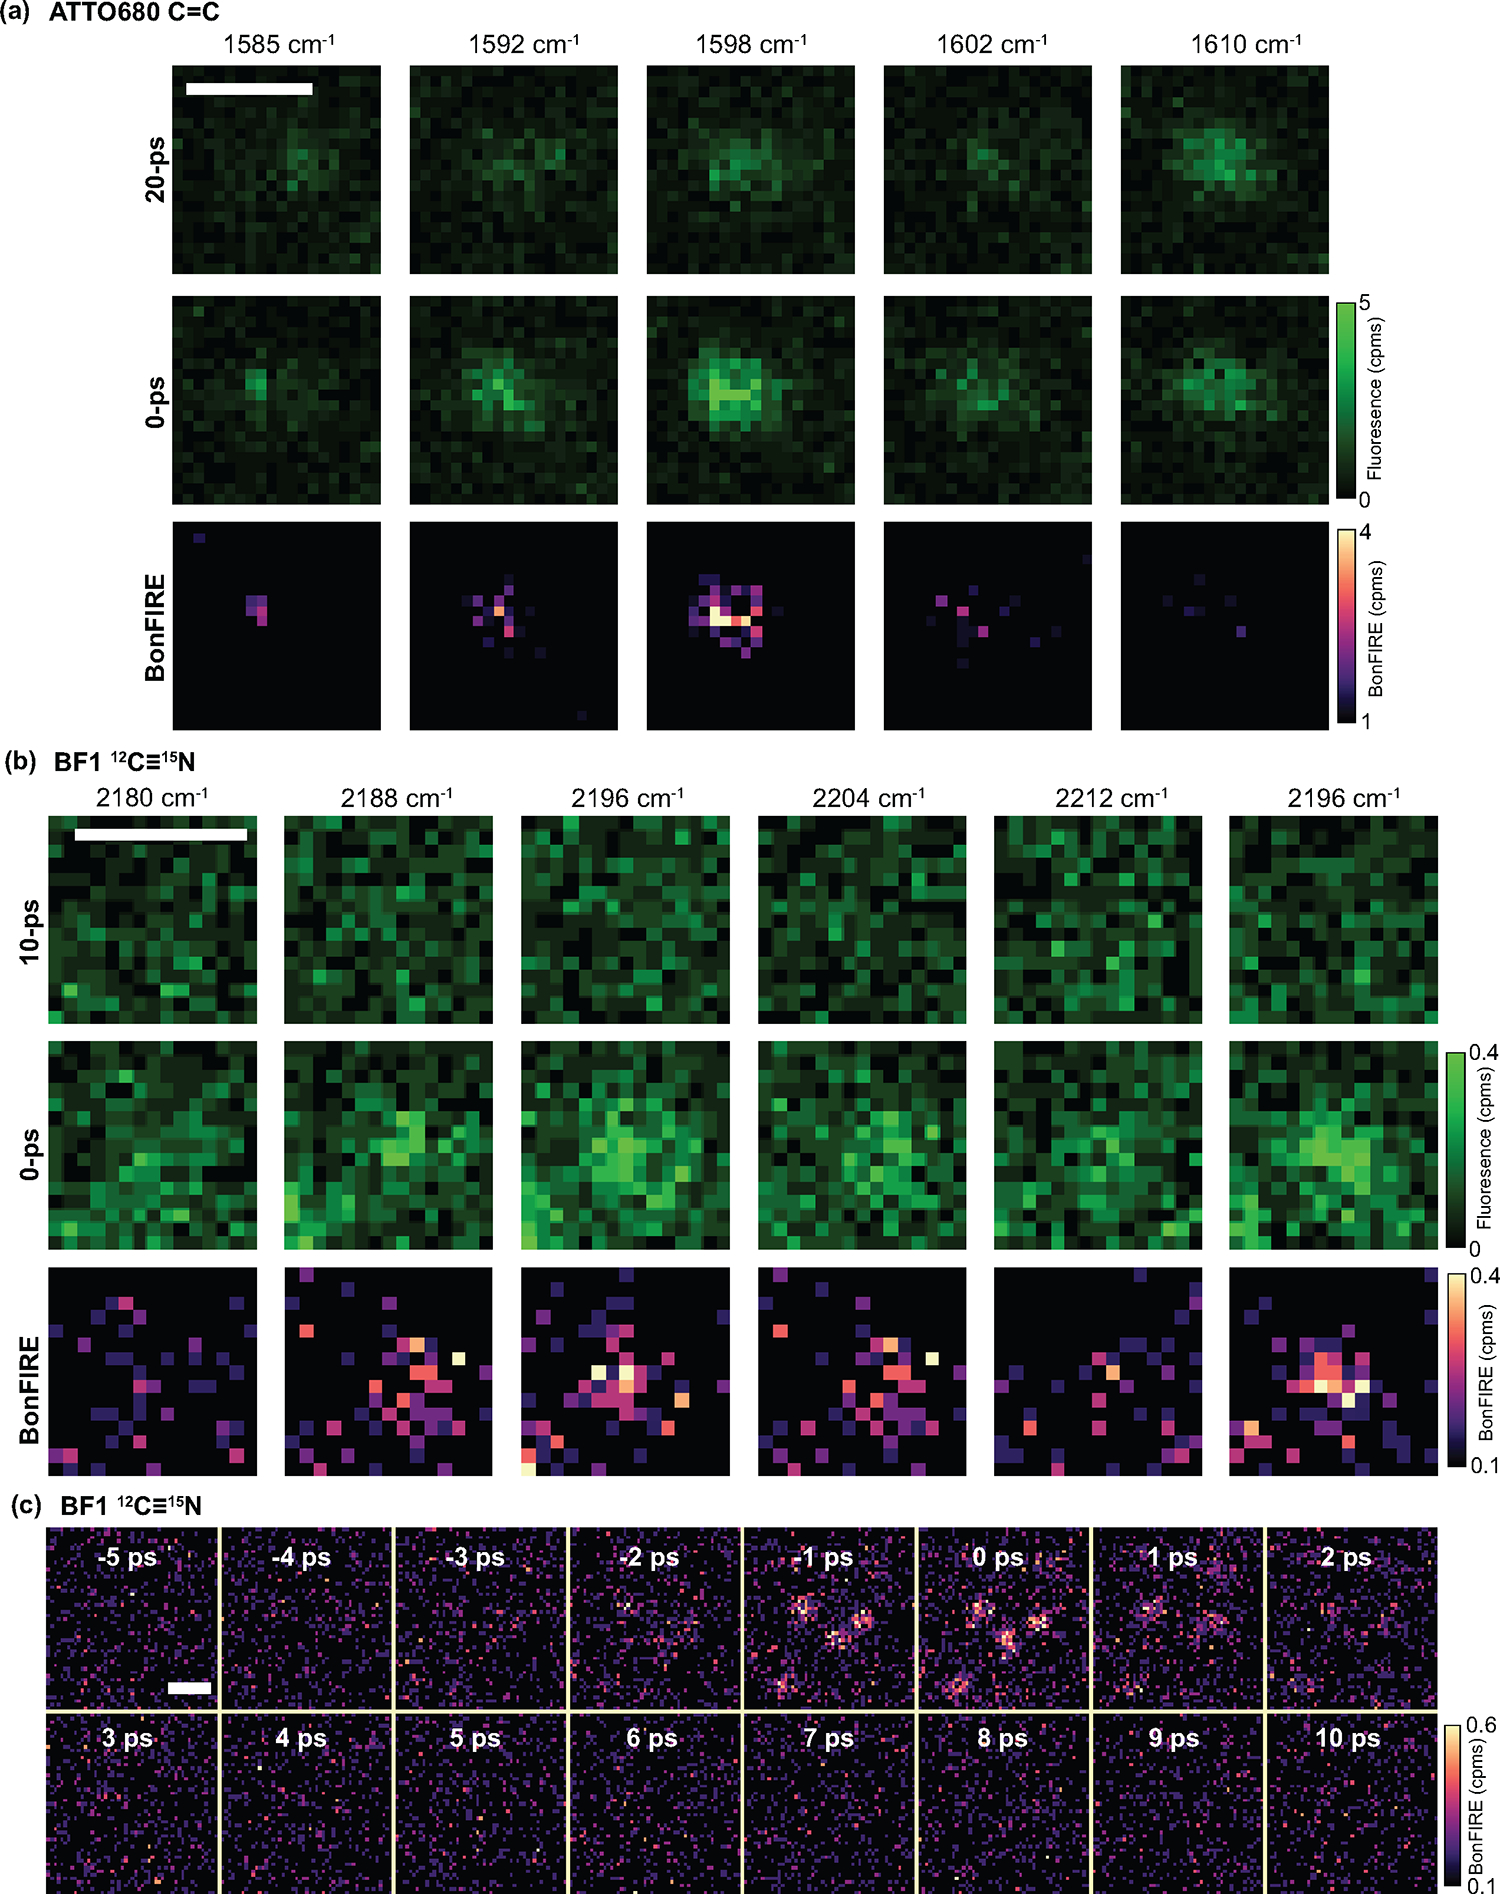
a, Raw data of single-molecule BonFIRE imaging of ATTO680 C = C in Fig. 4a, confirming that BonFIRE data from subtraction are not from single-molecule bleaching or blinking. The S/Bs reach >1 because of the much-reduced photothermal background of the dilute single-molecule sample and the IR-transparent PVA matrix. c.p.ms, counts per millisecond. b, Raw data of single-molecule BonFIRE imaging of 12C ≡ 15N labelled BF1, the same sample is used in Fig. 4e–g. Repeatable BonFIRE contrast and no photobleaching are confirmed by the continuous scan. c, Signal vs. IR-probe delay () of a small region containing multiple single BF1 molecules. The S/Bs reach ~3. The signal on/off as the function of is another evidence of the BonFIRE’s single-molecule sensitivity. Scale bars, 1 μm.
Extended Data Fig. 8. BonFIRE concentration curves with PMT AC detection.
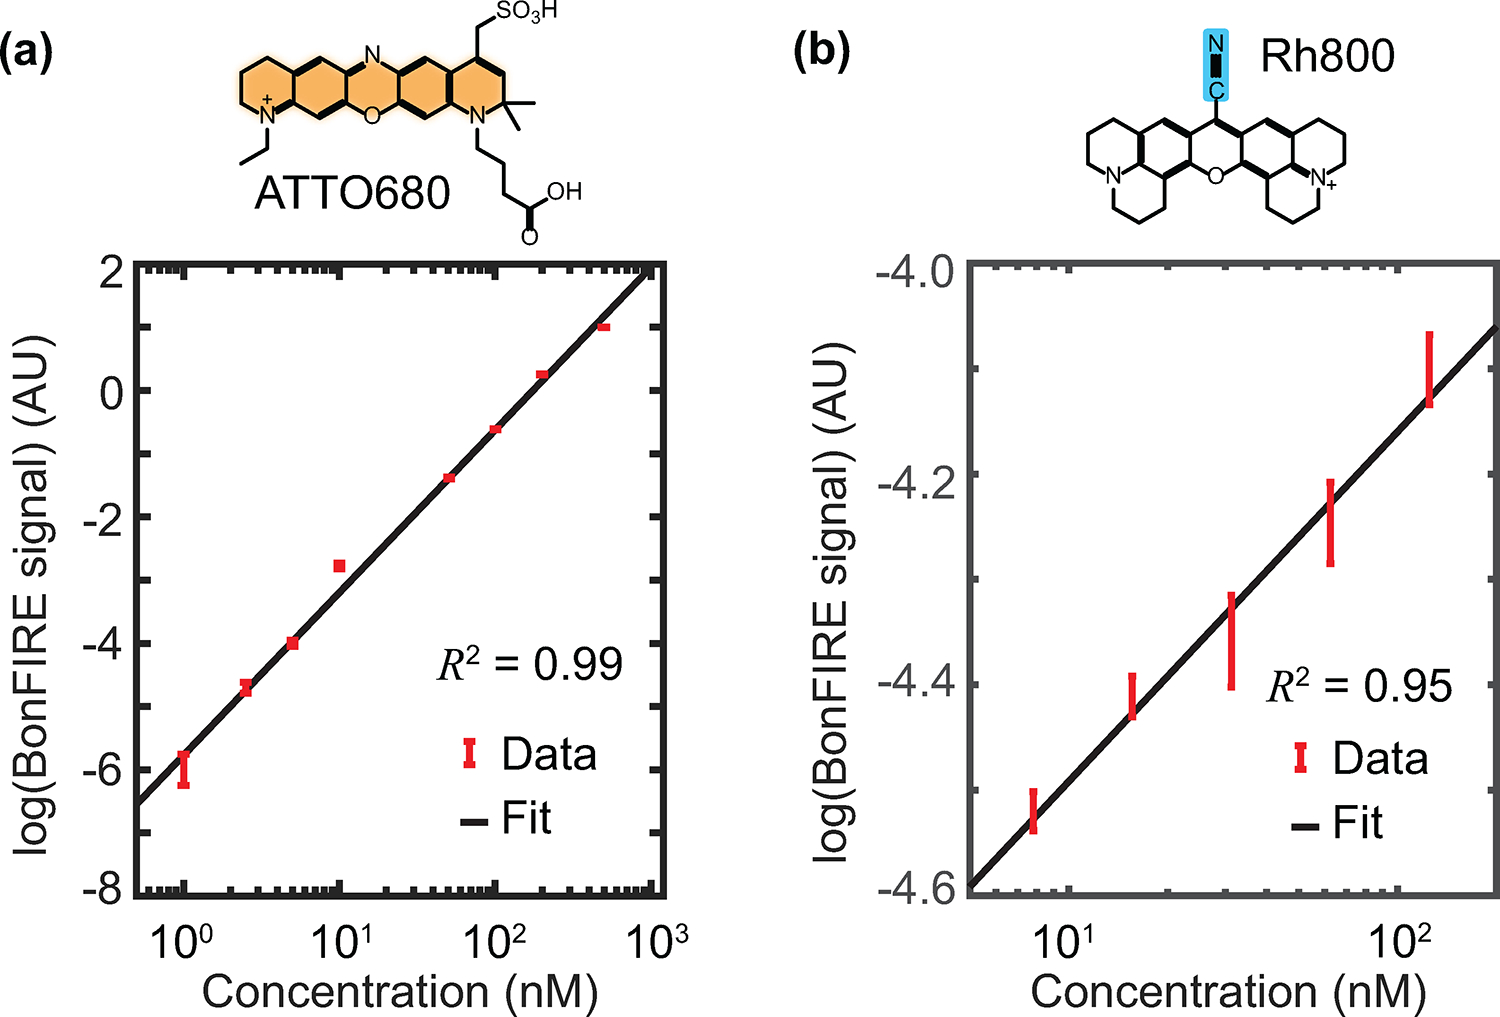
a, The concentration curve of C = C in ATTO680 in DMSO. The lowest concentration measured is 1 nM. The probe wavelength is 765 nm, and the IR frequency is 1592 cm−1. Data are presented as peak values +/− SD from the background (n = 9). a.u., arbitrary unit. b, Concentration curve of C ≡ N in Rh800 in DMSO. The lowest concentration measured is 8 nM. The probe wavelength is 830 nm, and the IR frequency is 2228 cm−1. Both minimum concentrations are close to or below the calculated single-molecule threshold of 5 nM. Data are presented as peak values +/− s.d. from the background (n = 22).
Extended Data Fig. 9. Broad spectral coverage of BonFIRE microscopy.
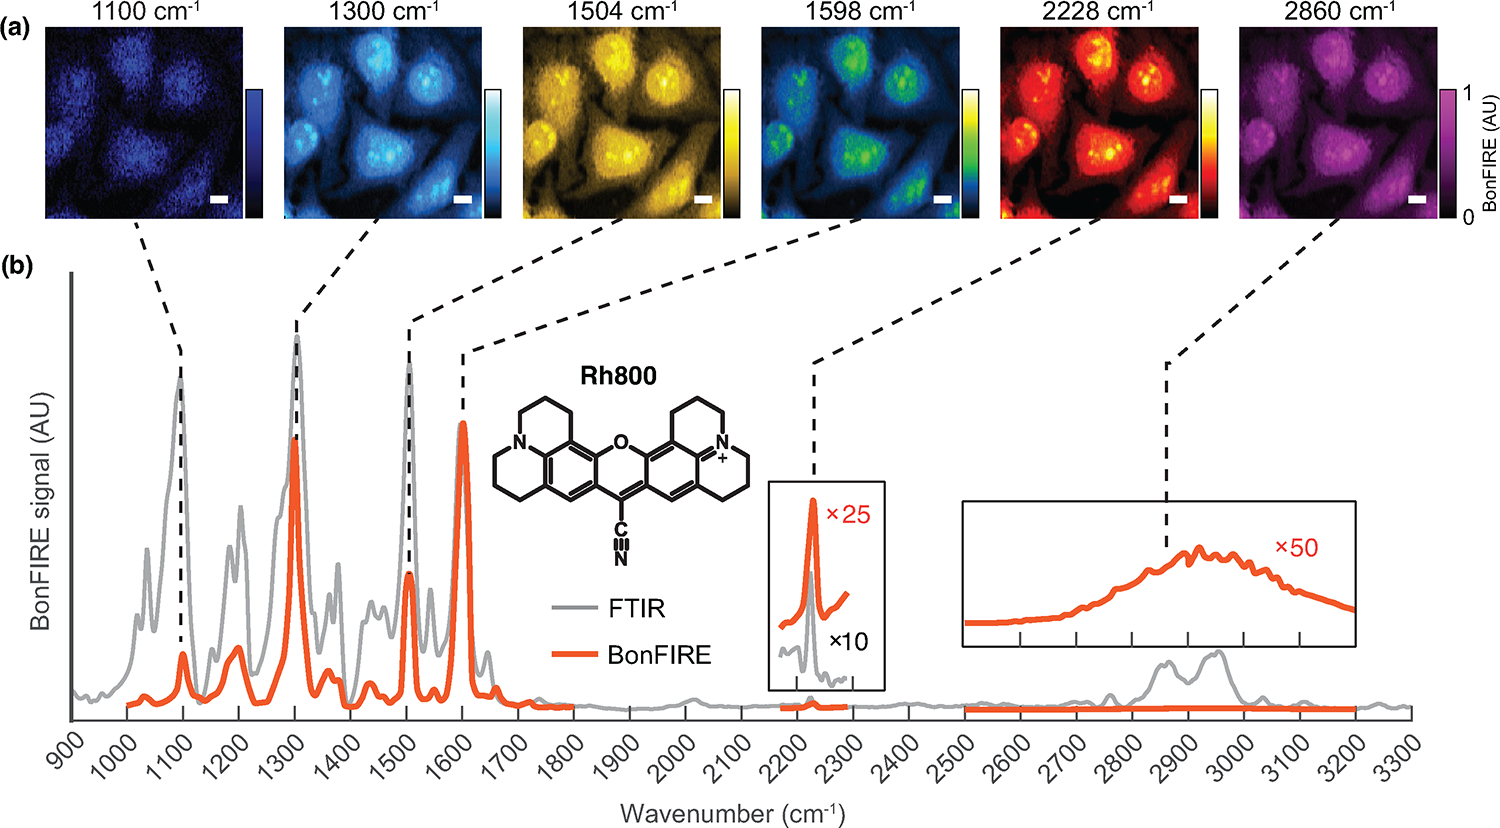
a, BonFIRE images of Rh800-stained HeLa cells targeting six different vibrational modes. Vibrations of phenolic C-O (1100 cm−1), aromatic C-N (1300 cm−1), conjugated C = C (1504 cm−1 and 1598 cm−1), conjugated C ≡ N (2228 cm−1), and C-H stretch (2860 cm−1) can all serve for BonFIRE imaging. a.u., arbitrary unit. Scale bars, 10 μm. b, BonFIRE spectrum (red) and FTIR spectrum (grey) of Rh800. BonFIRE spectrum is normalized to the most intense peak at 1598 cm−1. The C ≡ N peak around 2228 cm−1 and a weak broad peak of the C-H region (2700 cm−1–3200 cm−1) are enlarged in insets for better comparison.
Supplementary Material
Acknowledgements
We thank Caltech Beckman Institute Laser Resource Center (BILRC) and Office of Laboratory Animal Resources (OLAR) for research resources. We thank Prof. Mitchio Okumura and Prof. Scott Cushing for kindly sharing research resources. We thank Dr. Xuecheng Tao and Dr. Tomislav Begusic for calculating the Frank-Condon factors and Adrian Colazo for helpful discussions. This work is supported by NIH Director’s New Innovator Award, DP2 GM140919-01 for L.W. and the Alfred P. Sloan Research Fellowship for L. W. L.W. is a Heritage Principal Investigator supported by the Heritage Medical Research Institute at Caltech.
Footnotes
Competing interests
The authors have filed a provisional patent application based on this work.
Code availability
The codes for experimental data acquisition, physical model simulation, and Franck-Condon factor calculation are available from the corresponding author.
Data availability
The minimum dataset necessary to reproduce the results is available from the corresponding author.
References
- 1.Dean KM & Palmer AE Advances in fluorescence labeling strategies for dynamic cellular imaging. Nature Chemical Biology 10, 512–523 (2014). 10.1038/nchembio.1556 [DOI] [PMC free article] [PubMed] [Google Scholar]
- 2.Möckl L & Moerner WE Super-resolution Microscopy with Single Molecules in Biology and Beyond–Essentials, Current Trends, and Future Challenges. Journal of the American Chemical Society 142, 17828–17844 (2020). 10.1021/jacs.0c08178 [DOI] [PMC free article] [PubMed] [Google Scholar]
- 3.Wu J, Ji N & Tsia KK Speed scaling in multiphoton fluorescence microscopy. Nature Photonics 15, 800–812 (2021). 10.1038/s41566-021-00881-0 [DOI] [Google Scholar]
- 4.Cheng J-X & Xie XS Vibrational spectroscopic imaging of living systems: An emerging platform for biology and medicine. Science 350, aaa8870 (2015). 10.1126/science.aaa8870 [DOI] [PubMed] [Google Scholar]
- 5.Wei L et al. Super-multiplex vibrational imaging. Nature 544, 465–470 (2017). 10.1038/nature22051 [DOI] [PMC free article] [PubMed] [Google Scholar]
- 6.Bhargava R Infrared Spectroscopic Imaging: The Next Generation. Applied Spectroscopy 66, 1091–1120 (2012). 10.1366/12-06801 [DOI] [PMC free article] [PubMed] [Google Scholar]
- 7.Ma J, Pazos IM, Zhang W, Culik RM & Gai F Site-Specific Infrared Probes of Proteins. Annual Review of Physical Chemistry 66, 357–377 (2015). 10.1146/annurev-physchem-040214-121802 [DOI] [PMC free article] [PubMed] [Google Scholar]
- 8.Ostrander JS, Serrano AL, Ghosh A & Zanni MT Spatially Resolved Two-Dimensional Infrared Spectroscopy via Wide-Field Microscopy. ACS Photonics 3, 1315–1323 (2016). 10.1021/acsphotonics.6b00297 [DOI] [PMC free article] [PubMed] [Google Scholar]
- 9.Shi L et al. Mid-infrared metabolic imaging with vibrational probes. Nature Methods 17, 844–851 (2020). 10.1038/s41592-020-0883-z [DOI] [PMC free article] [PubMed] [Google Scholar]
- 10.Dazzi A & Prater CB AFM-IR: Technology and Applications in Nanoscale Infrared Spectroscopy and Chemical Imaging. Chemical Reviews 117, 5146–5173 (2017). 10.1021/acs.chemrev.6b00448 [DOI] [PubMed] [Google Scholar]
- 11.Pleitez MA et al. Label-free metabolic imaging by mid-infrared optoacoustic microscopy in living cells. Nature Biotechnology 38, 293–296 (2020). 10.1038/s41587-019-0359-9 [DOI] [PubMed] [Google Scholar]
- 12.Bai Y, Yin J & Cheng J-X Bond-selective imaging by optically sensing the mid-infrared photothermal effect. Science Advances 7, eabg1559 (2021). 10.1126/sciadv.abg1559 [DOI] [PMC free article] [PubMed] [Google Scholar]
- 13.Zhang D et al. Depth-resolved mid-infrared photothermal imaging of living cells and organisms with submicrometer spatial resolution. Science Advances 2, e1600521 (2016). 10.1126/sciadv.1600521 [DOI] [PMC free article] [PubMed] [Google Scholar]
- 14.Li Z, Aleshire K, Kuno M & Hartland GV Super-Resolution Far-Field Infrared Imaging by Photothermal Heterodyne Imaging. The Journal of Physical Chemistry B 121, 8838–8846 (2017). 10.1021/acs.jpcb.7b06065 [DOI] [PubMed] [Google Scholar]
- 15.Lim JM et al. Cytoplasmic Protein Imaging with Mid-Infrared Photothermal Microscopy: Cellular Dynamics of Live Neurons and Oligodendrocytes. The Journal of Physical Chemistry Letters 10, 2857–2861 (2019). 10.1021/acs.jpclett.9b00616 [DOI] [PubMed] [Google Scholar]
- 16.Schnell M et al. All-digital histopathology by infrared-optical hybrid microscopy. Proceedings of the National Academy of Sciences 117, 3388–3396 (2020). 10.1073/pnas.1912400117 [DOI] [PMC free article] [PubMed] [Google Scholar]
- 17.Shi J et al. High-resolution, high-contrast mid-infrared imaging of fresh biological samples with ultraviolet-localized photoacoustic microscopy. Nature Photonics 13, 609–615 (2019). 10.1038/s41566-019-0441-3 [DOI] [PMC free article] [PubMed] [Google Scholar]
- 18.Ruggeri FS, Mannini B, Schmid R, Vendruscolo M & Knowles TPJ Single molecule secondary structure determination of proteins through infrared absorption nanospectroscopy. Nature Communications 11, 2945 (2020). 10.1038/s41467-020-16728-1 [DOI] [PMC free article] [PubMed] [Google Scholar]
- 19.Laubereau A, Seilmeier A & Kaiser W A new technique to measure ultrashort vibrational relaxation times in liquid systems. Chemical Physics Letters 36, 232–237 (1975). 10.1016/0009-2614(75)87023-0 [DOI] [Google Scholar]
- 20.Kryukov PG, Letokhov VS, Matveets YA, Nikogosyan DN & Sharkov AV Selective two-stage excitation of an electronic state of organic molecules in aqueous solution by picosecond light pulse. Soviet Journal of Quantum Electronics 8, 1405–1407 (1978). 10.1070/qe1978v008n11abeh011337 [DOI] [Google Scholar]
- 21.Sakai M, Kawashima Y, Takeda A, Ohmori T & Fujii M Far-field infrared super-resolution microscopy using picosecond time-resolved transient fluorescence detected IR spectroscopy. Chemical Physics Letters 439, 171–176 (2007). 10.1016/j.cplett.2007.03.035 [DOI] [Google Scholar]
- 22.Whaley-Mayda L, Guha A, Penwell SB & Tokmakoff A Fluorescence-Encoded Infrared Vibrational Spectroscopy with Single-Molecule Sensitivity. Journal of the American Chemical Society 143, 3060–3064 (2021). 10.1021/jacs.1c00542 [DOI] [PubMed] [Google Scholar]
- 23.Whaley-Mayda L, Guha A & Tokmakoff A Resonance conditions, detection quality, and single-molecule sensitivity in fluorescence-encoded infrared vibrational spectroscopy. The Journal of Chemical Physics 156, 174202 (2022). 10.1063/5.0088435 [DOI] [PubMed] [Google Scholar]
- 24.Hopt A & Neher E Highly Nonlinear Photodamage in Two-Photon Fluorescence Microscopy. Biophysical Journal 80, 2029–2036 (2001). 10.1016/S0006-3495(01)76173-5 [DOI] [PMC free article] [PubMed] [Google Scholar]
- 25.Talone B et al. Phototoxicity induced in living HeLa cells by focused femtosecond laser pulses: a data-driven approach. Biomed. Opt. Express 12, 7886–7905 (2021). 10.1364/BOE.441225 [DOI] [PMC free article] [PubMed] [Google Scholar]
- 26.Xiong H et al. Stimulated Raman excited fluorescence spectroscopy and imaging. Nature Photonics 13, 412–417 (2019). 10.1038/s41566-019-0396-4 [DOI] [PMC free article] [PubMed] [Google Scholar]
- 27.Xiong H, Qian N, Miao Y, Zhao Z & Min W Stimulated Raman Excited Fluorescence Spectroscopy of Visible Dyes. The Journal of Physical Chemistry Letters 10, 3563–3570 (2019). 10.1021/acs.jpclett.9b01289 [DOI] [PMC free article] [PubMed] [Google Scholar]
- 28.Kurochkin DV, Naraharisetty SRG & Rubtsov IV A relaxation-assisted 2D IR spectroscopy method. Proceedings of the National Academy of Sciences 104, 14209–14214 (2007). 10.1073/pnas.0700560104 [DOI] [PMC free article] [PubMed] [Google Scholar]
- 29.Zhang Y et al. Fluorescence-Detected Mid-Infrared Photothermal Microscopy. Journal of the American Chemical Society 143, 11490–11499 (2021). 10.1021/jacs.1c03642 [DOI] [PMC free article] [PubMed] [Google Scholar]
- 30.Li M et al. Fluorescence-Detected Mid-Infrared Photothermal Microscopy. Journal of the American Chemical Society 143, 10809–10815 (2021). 10.1021/jacs.1c03269 [DOI] [PubMed] [Google Scholar]
- 31.Watanabe H, Hayazawa N, Inouye Y & Kawata S DFT Vibrational Calculations of Rhodamine 6G Adsorbed on Silver: Analysis of Tip-Enhanced Raman Spectroscopy. The Journal of Physical Chemistry B 109, 5012–5020 (2005). 10.1021/jp045771u [DOI] [PubMed] [Google Scholar]
- 32.Hübner HJ, Wörner M, Kaiser W & Seilmeier A Subpicosecond vibrational relaxation of skeletal modes in polyatomic molecules. Chemical Physics Letters 182, 315–320 (1991). 10.1016/0009-2614(91)80221-I [DOI] [Google Scholar]
- 33.Du J, Wang H & Wei L Bringing Vibrational Imaging to Chemical Biology with Molecular Probes. ACS Chemical Biology 17, 1621–1637 (2022). 10.1021/acschembio.2c00200 [DOI] [PMC free article] [PubMed] [Google Scholar]
- 34.Levinson NM & Boxer SG A conserved water-mediated hydrogen bond network defines bosutinib’s kinase selectivity. Nature Chemical Biology 10, 127–132 (2014). 10.1038/nchembio.1404 [DOI] [PMC free article] [PubMed] [Google Scholar]
- 35.Suydam IT, Snow CD, Pande VS & Boxer SG Electric Fields at the Active Site of an Enzyme: Direct Comparison of Experiment with Theory. Science 313, 200–204 (2006). 10.1126/science.1127159 [DOI] [PubMed] [Google Scholar]
- 36.Seilmeier A, Kaiser W & Laubereau A Vibrational combination states of polyatomic molecules investigated by ultrashort two-pulse spectroscopy. Optics Communications 26, 441–445 (1978). 10.1016/0030-4018(78)90242-0 [DOI] [Google Scholar]
- 37.Maier JP, Seilmeier A & Kaiser W Population lifetime of CH-stretching modes in mediumsize molecules. Chemical Physics Letters 70, 591–596 (1980). 10.1016/0009-2614(80)80132-1 [DOI] [Google Scholar]
- 38.Clark JL, Miller PF & Rumbles G Red Edge Photophysics of Ethanolic Rhodamine 101 and the Observation of Laser Cooling in the Condensed Phase. The Journal of Physical Chemistry A 102, 4428–4437 (1998). 10.1021/jp980589c [DOI] [Google Scholar]
Methods-only references
- 1.Xiong H et al. Stimulated Raman excited fluorescence spectroscopy and imaging. Nature Photonics 13, 412–417 (2019). 10.1038/s41566-019-0396-4 [DOI] [PMC free article] [PubMed] [Google Scholar]
- 2.Hübner HJ, Wörner M, Kaiser W & Seilmeier A Subpicosecond vibrational relaxation of skeletal modes in polyatomic molecules. Chemical Physics Letters 182, 315–320 (1991). 10.1016/0009-2614(91)80221-I [DOI] [Google Scholar]
- 3.Egner A et al. Fluorescence Nanoscopy in Whole Cells by Asynchronous Localization of Photoswitching Emitters. Biophysical Journal 93, 3285–3290 (2007). 10.1529/biophysj.107.112201 [DOI] [PMC free article] [PubMed] [Google Scholar]
- 4.Dempsey GT, Vaughan JC, Chen KH, Bates M & Zhuang X Evaluation of fluorophores for optimal performance in localization-based super-resolution imaging. Nature Methods 8, 1027–1036 (2011). 10.1038/nmeth.1768 [DOI] [PMC free article] [PubMed] [Google Scholar]
- 5.Gaudioso J & Ho W Single-Molecule Vibrations, Conformational Changes, and Electronic Conductivity of Five-Membered Heterocycles. Journal of the American Chemical Society 123, 10095–10098 (2001). 10.1021/ja016363w [DOI] [PubMed] [Google Scholar]
Associated Data
This section collects any data citations, data availability statements, or supplementary materials included in this article.
Supplementary Materials
Data Availability Statement
The minimum dataset necessary to reproduce the results is available from the corresponding author.


