

Abstract
Current risk assessments for environmental carcinogens rely on animal studies utilizing doses orders of magnitude higher than actual human exposures. Epidemiological studies of people with high exposures (e.g., occupational) are of value, but rely on uncertain exposure data. In addition, exposures are typically not to a single chemical but to mixtures, such as polycyclic aromatic hydrocarbons (PAHs). The extremely high sensitivity of accelerator mass spectrometry (AMS) allows for dosing humans with known carcinogens with de minimus risk. In this study UPLC-AMS was used to assess the toxicokinetics of [14C]-benzo[a]pyrene ([14C]-BaP) when dosed alone or in a binary mixture with phenanthrene (Phe). Plasma was collected for 48 hours following a dose of [14C]-BaP (50 ng, 5.4 nCi) or the same dose of [14C]-BaP plus Phe (1250 ng). Following the binary mixture, Cmax of [14C]-BaP significantly decreased (4.4-fold) whereas the volume of distribution (Vd) increased (2-fold). Further, the toxicokinetics of twelve [14C]-BaP metabolites provided evidence of little change in the metabolite profile of [14C]-BaP and the pattern was overall reduction consistent with reduced absorption (decrease in Cmax). Although Phe was shown to be a competitive inhibitor of the major hepatic cytochrome P-450 (CYP) responsible for metabolism of [14C]-BaP, CYP1A2, the high inhibition constant (Ki) and lack of any increase in unmetabolized [14C]-BaP in plasma makes this mechanism unlikely to be responsible. Rather, co-administration of Phe reduces the absorption of [14C]-BaP through a mechanism yet to be determined. This is the first study to provide evidence that, at actual environmental levels of exposure, the toxicokinetics of [14C]-BaP in humans is markedly altered by the presence of a second PAH, Phe, a common component of environmental PAH mixtures.
Keywords: Benzo[a]pyrene, Polycyclic aromatic hydrocarbon mixtures, Human micro-dosing, UPLC-Accelerator Mass Spectrometry, Phenanthrene
Graphical Abstract

1. Introduction
1.1. Polycyclic aromatic hydrocarbon formation, prevalence, and toxicity
Hundreds of polycyclic aromatic hydrocarbons (PAHs) are formed by the incomplete combustion of organic materials. Fires, smoking, the use of petroleum products, wood burning, and coal consumption all release mixtures of PAHs into the atmosphere [1–7]. Humans are exposed to combinations of PAHs through inhalation, drinking water, diet, and dermally [8–13]. Occupational exposures are common, as PAHs have industrial uses, such as in wood treatment products, dyes, and as chemical intermediates for products like pesticides and herbicides [14–16]. As a group, PAHs are ubiquitous and persistent in the environment, almost exclusively found in mixtures, and many are known to cause adverse health effects including carcinogenesis and decreased immune function, as well as kidney, liver, and lung damage [17–19].
1.2. Benzo[a]pyrene prevalence and toxicity
Benzo[a]pyrene (BaP) is the most widely studied PAH and has been linked to many types of cancers along with immunological, reproductive, developmental, cardiovascular, and neurological toxicities [15,18–21]. In the general human population, the greatest BaP exposure is dietary intake after deposition of BaP from the atmosphere onto food and water, along with food packaging, processing, and cooking [9,12,13]. BaP is ubiquitous in the environment and often used as an indicator to estimate PAH exposure and risk for human populations [22,23]. BaP is ranked number 8 out of 275 chemicals on the Agency for Toxic Substances and Disease Registry Priority List of Hazardous Substances and classified as a Group 1 known carcinogen for humans by the International Agency for Research on Cancer (IARC) [17–22]. BaP was proposed as the reference PAH in a Relative Potency Factor (RPF) approach (since suspended), similar to the Toxic Equivalency Factor (TEF) used for dioxins and dibenzofurans, to evaluate the carcinogenicity of other PAHs or PAH mixtures [24,25].
1.3. BaP and phenanthrene in humans
Another common PAH, phenanthrene (Phe) is present in most environmental PAH mixtures and typically found at a ratio of Phe:BaP approximately 25:1 in environmental samples and in diet [26]. Phe is a three-ring PAH, and the lowest molecular weight PAH containing a “bay region” (Figure 1). Metabolic activation of BaP to the ultimate mutagen and carcinogen, (+)-anti-BaP-7,8-dihydrodiol-9,10-epoxide (BaP-DHDE), occurs at this bay region. Due to this similar structure, Phe bay region tetraols (isomers of 1,2,3,4-tetraol) [27] can be used in estimating PAH exposures in general [28,29], as well as production of the carcinogenic bay BaP-DHDE via 7,8,9,10-tetraol isomers [30,31]. In contrast to BaP, Phe is not classified as a human carcinogen. A partial explanation could be that, unlike BaP for which the major tetraol in urine is the 7R,8S,9R,10S isomer (expoxygenation of BaP-7,8-DHD), greater than 96% of Phe tetraols in urine are formed from the epoxygenation of Phe-3,4-DHD followed by hydrolysis to the 1S,2R,3S,4R-tetraol (reverse bay region) [31]. The environmental relevance, structural similarity, and likely similar toxicokinetics of Phe and BaP provides a rationale for these two compounds to be microdosed as a PAH binary mixture.
Figure 1.
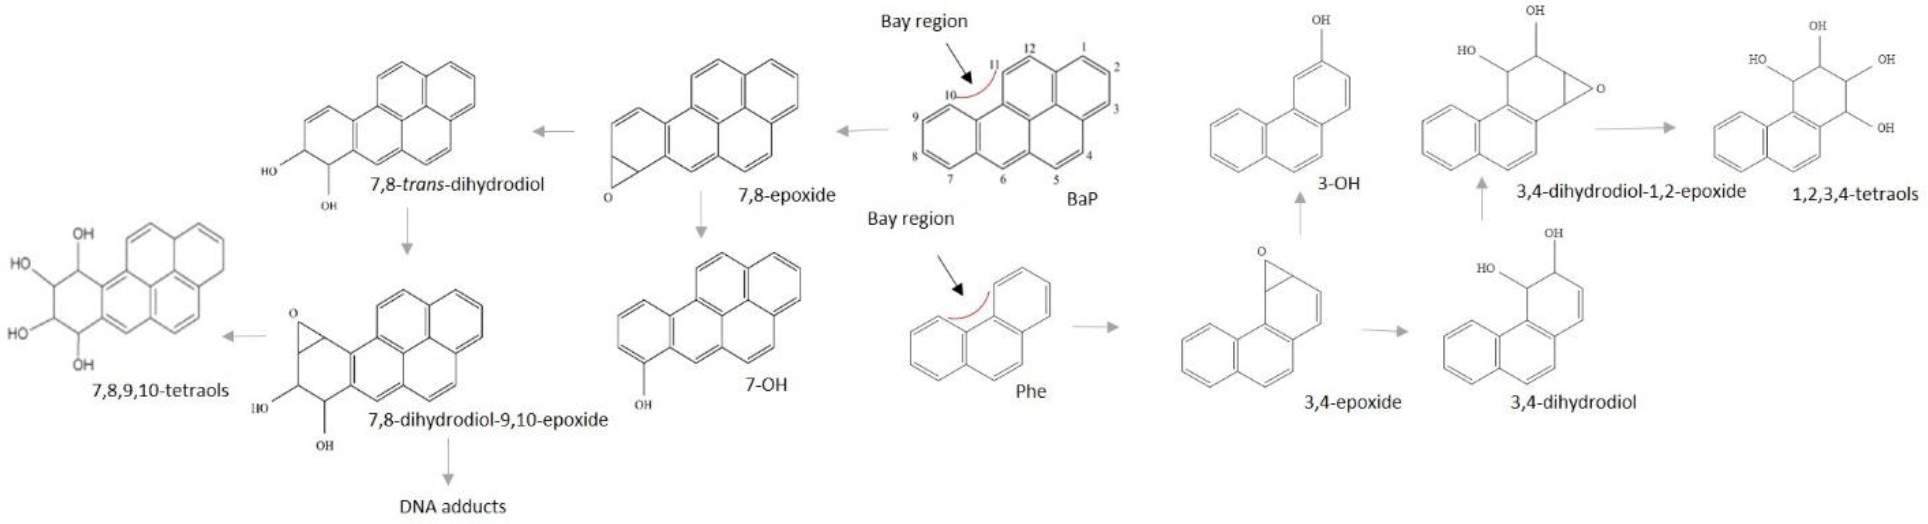
Metabolic activation at the bay region of BaP and Phe
Biomonitoring studies examining urinary levels of 1-hydroxyphenanthrene, 2-hydroxyphenanthrene, 3-hydroxyphenanthrene, 4-hydroxyphenanthrene and 1,2,3,4-tetraols document the level of Phe exposure in the general population and in children. Smoking in adults increases mean concentrations of Phe metabolites, whereas children and adults in housing where coal tar flooring glue was applied also had mean levels of Phe metabolites higher than levels for similar age groups [32–34]. Occupational exposures have been associated with median urinary Phe metabolite concentrations 10 to 100 times higher than median values in the general population [34–36]. Urine and blood are most often used for assessing BaP exposure and risk, though tissue concentrations and adducts have also been used [5,37–39]. BaP has also been identified in human milk (mean of 6.5 ng/kg in Japan) [40].
1.4. Phe and BaP metabolism and DNA adduction
Risk following PAH exposure is largely determined by the route of exposure, the toxicity of the PAHs in the mixture, and metabolism. Cytochromes P-450 (CYPs) oxygenate PAHs creating epoxides that can then be conjugated with glutathione and excreted, or be further hydrolyzed into phenols and dihydrodiols. These metabolites can undergo conjugation with glucuronic or sulfuric acids to enable excretion or, like BaP, undergo further epoxygenation producing BaP-7,8-dihydrodiol-9,10-epoxides (BaP-DHDE, 4 enantiomers with the (+)-anti-BaP-DHDE being the most carcinogenic). The electrophilic BaP-DHDE can covalently bind to deoxyadenine but has a preference for the N2 position of deoxyguanine (dG) in DNA, resulting in G to T transversion mutations [41–48].
Exposure is almost never to a solitary PAH, so understanding the toxicokinetics of both individual PAHs and PAH mixtures is necessary to accurately assess potential toxicological events and risk. This is true for both the general population who are exposed at relatively low levels of PAHs as well as those who are exposed to typically higher concentrations through their occupation. In vitro [49–51] and in vivo [52,53] studies with PAH binary or complex mixtures provide evidence for non-additivity supporting the EPA decision not to use a RPF approach for PAH risk assessment [25,54]. CYP1 competitive inhibition [55–59] is evident, a mechanism likely responsible in part for reductions in metabolic activation, DNA adduction, and tumorigenesis. Using the mouse skin tumor model we have demonstrated that PAH mixtures exhibit potency and efficacy not predicted by the RPF approach [53] suggesting individual PAHs in mixtures can alter the toxicokinetics of others by inducing gene expression [60–64] and/or inhibiting metabolic activation or detoxification.
1.5. Accelerator mass spectrometry and dosing humans with Phe plus BaP
Testing the impact of Phe on BaP toxicokinetics in vivo in humans could not be done with de minimus risk without the incredible sensitivity (atto-zepto mole) of AMS [65,66]. We previously applied graphite AMS (total [14C]) to examine the toxicokinetics of dibenzo[def,p]chrysene (DBC) by micro-dosing humans and assessing plasma and urine levels of [14C] as well as [14C]-DNA binding in peripheral blood mononuclear cells (< 1 adduct in 1011 bp) over 72 hours [67]. Graphite AMS has also been employed for determination of DNA adduction in target tissues of humans following microdosing of [14C]-labeled carcinogens, including amino acid pyrolysis products found in cooked meats, PAHs, and the mycotoxin aflatoxin B1 [67–69]. The development of a UPLC interface with AMS now allows for assessing not just total [14C] but metabolites in addition to the parent compound [70]. Utilizing UPLC-AMS, we found rapid and extensive metabolism of BaP in vivo following doses ranging from 25–250 ng [71,72].
In this study, five human participants were dosed with [14C]-BaP (50 ng) or [14C]-BaP plus Phe (50 ng BaP + 1250 ng Phe) to compare the toxicokinetics of [14C]-BaP when administered alone or as a binary PAH mixture. Plasma extracts (0–48 hours) analyzed by UPLC-AMS revealed rapid and extensive [14C]-BaP metabolism with high inter-individual variability. Phe did not alter the metabolic profile of [14C]-BaP but did significantly reduce absorption (reduced Cmax and increased Vd).
2. Materials and methods
2.1. Human participants
2.1.1. Recruitment, enrollment and pre-dosing protocol
Under guidelines of IRBs at both Oregon State University (OSU; IRB #8554) and Lawrence Livermore National Laboratory (LLNL; Protocol #2017–008), as well as an FDA IND (#117175), five participants (4 males and 1 female) with BMIs of 27.1–33.7 from 36 to 65 years old were recruited using inclusion and exclusion criteria previously described [72] at ClinicalTrials.gov (NCT03631667). Participant demographic data can be seen in Table 1. Study protocol required abstention from eating smoked meats and cheeses, charcoal-broiled meats, and cruciferous vegetables and condiments for two weeks prior to administration of [14C]-BaP or [14C]-BaP plus Phe and throughout the 48 hour study period (Supplemental Table 1). Dietary questionnaires designed to assess total BaP consumption were collected for 3 days prior to dosing and throughout the 48 hours post-dose. Blood was drawn to determine background concentrations of 64 PAHs by GC-MS/MS just prior to capsule ingestion [73]. Doses were separated by a minimum washout period of three weeks, and both doses were administered in less than one year.
Table 1.
Demographics of participants and dosing dates
| Participant | Age | Gender | Race | Ethnicity: Hispanic (Y/N) | BaP | BaP + Phe | ||
|---|---|---|---|---|---|---|---|---|
| Date | BMI | Date | BMI | |||||
|
| ||||||||
| 022 | 65 | M | Caucasian | N | 7/25/2018 | 31.8 | 11/13/2018 | 31.8 |
|
| ||||||||
| 025 | 44 | M | Caucasian | N | 7/23/2018 | 28.0 | 1/28/2019 | 27.2 |
|
| ||||||||
| 027 | 36 | M | More than one race | N | 9/17/2018 | 33.7 | 5/20/2019 | 33.2 |
|
| ||||||||
| 028 | 49 | M | Caucasian | N | 3/18/2019 | 28.0 | 8/19/2019 | 28.1 |
|
| ||||||||
| 031 | 59 | F | Caucasian | N | 1/22/2019 | 33.4 | 3/4/2019 | 33.7 |
2.1.2. Micro-dosing with [14C]-BaP, timed blood collection, and preparation of plasma
Participants fasted overnight prior to ingesting the morning capsule dose. Quality control of the purity and amount of [14C]-BaP as well as preparation of the food-grade [14C]-BaP capsule has been previously described [74]. Fasting continued for 2 hours following dosing with 50 ng of [14C]-BaP (5.4 nCi, radiochemical purity >95%) or 50 ng [14C]-BaP plus 1250 ng Phe with water. Using an in-dwelling catheter, blood (10 mL) was drawn into heparinized tubes prior to dosing (time 0) and at 0.25, 0.5, 1, 1.5, 2, 3, and 4 hours post-dose (0.25 hour draw not analyzed). Later collections at 8, 24, and 48 hours post-dose were done by straight needle stick. Blood was centrifuged (rcf’~1000 for 10 min) immediately following collection and plasma extracted within 2 hours.
2.2. Extraction of plasma and UPLC-AMS at LLNL
Following centrifugation, samples were held at 4°C until extraction by previously published methods [74,75]. Briefly, plasma aliquots (1.5 mL) were acidified and vortexed with ethyl acetate (3x with 1.5 mL) in the presence of K2SO4. The ethyl acetate layer of each sample was pooled, evaporated to dryness under nitrogen, reconstituted with 100 μL ethyl acetate, and shipped on dry ice to the BioAMS Center at LLNL. Samples used to determine pre-dosing levels of PAHs were stored at −80°C until analysis by the Analytical Chemistry Core of the Oregon State University (OSU) Superfund Research Program.
Samples were vacuumed to dryness and reconstituted in 50 μL acetonitrile immediately preceding analysis. A Waters Acquity UPLC H-Class System with a Waters Acquity UPLC BEH C18 1.7 μm 2.1 × 50 mm column with a Vanguard HSS PFP 1.8 μm 2.1 × 5 mm guard column (at 28°C ) was used for separation with 0.3% formic acid in water (A) and PEG-free acetonitrile (B) over 20 min at 0.25 mL/min (0.0 min 70:30 A:B; 0.1 60:40; 10.0 54:46; 10.1 43:57; 14.3 to 16.3 0:100; 16.4 to 20 min 70:30). Sample temperature was maintained at 20°C over the course of the analysis, and injection volume 10 μL. [14C]-BaP and metabolites were identified by retention time using analytical standards obtained from the OSU Superfund Research Program PAH repository (http://limsweb.science.oregonstate.edu/). Elution times of metabolites and parent compound included in the analytical standard are in Supplemental Table 2 and Supplemental Figure 1 showing a representative collective chromatogram image.
After passage through a PDA detector, the UPLC eluate was split for AMS analysis, with 0.12 mL/min (48%) deposited onto a periodically indented nickel wire interface. The eluate was carried through a drying oven then a combustion oven, evaporating solvent and combusting analytes to [14C]-CO2, allowing transfer to the CO2-gas-accepting ion source of the 250 kV AMS [66,76]. Measurements of 13C and 14C and known isotope ratios allow for calculations of [14C]-BaP and [14C]-metabolite concentrations. Previously established validation parameters include accuracy (1–3%), precision (coefficient of variation, 1–6%), and sensitivity expressed as limit of detection (LOD) of 1 attomole of [14C] (0.58 fg for [14C]-BaP) [77–79]. The lower limit of quantitation (LOQ, 0.60 fg/mL) was established using measurements at the known elution times for each compound in extracted plasma blanks from each individual [72].
2.2.1. UPLC-AMS detection and identification
Due to the unavailability of radiolabeled BaP metabolite standards, metabolite identification cannot be confirmed with AMS directly. In order to use BaP metabolite standards with known retention times to identify metabolites, the UPLC eluate went to a PDA detector prior to the moving wire interface for AMS analysis. Not all peaks seen using UPLC-AMS could be identified using the analytical standard mix. BaP phenols, dihydrodiols, dihydrodiol-epoxides, and diones are subject to conjugation (glucuronides, sulfates, and glutathione) and would be the most polar metabolites observed (Unknown A at 0.48 min). Research is in progress to identify conjugates in the urine of participants. Based on retention time and known metabolite standard Unknowns B (3.16 min) and C (4.85 min) are possibly additional dihydrodiols, while Unknown D (5.39 min) may be either a late eluting dihydrodiol or a quinone. Unknown E (9.18 min) is likely a quinone. Further, the peak identified as 3-phenol may contain small amounts of the 7- and/or 1-phenol as these minor metabolites tend to co-elute.
2.3. Toxicokinetic analysis
Time-course concentrations of [14C]-BaP, individual BaP metabolites, a sum of BaP metabolites, and a sum of BaP bay-region metabolites were evaluated using non-compartmental analyses, consistent with previous work [72]. Area under the curve (AUC) of concentrations in plasma from time zero to the last measured time point and extrapolated to infinity (using last 3 time points) were calculated using the trapezoidal rule [80]. Mean residence times were calculated as a ratio of AUC under the 1st moment curve extrapolated to infinity to AUC extrapolated to infinity. Non-compartmental half-lives were calculated as the product of mean residence times with the natural log of two. Linear regression models were used to evaluate impact of BMI on non-compartmental pharmacokinetic parameters from participants receiving [14C]-BaP only. Linear mixed effects models were used to examine the relationship between non-compartmental BaP and BaP metabolite pharmacokinetic parameters maximum concentration (Cmax), AUC to last time point (AUC(0,48), a measure of the total systemic exposure to the drug over the 48 hour study period), AUC to infinity (AUC(0,∞), the total systemic exposure to the drug if extrapolated to infinity), half-life (T1/2), clearance (Cl, the volume of plasma cleared of a substance per unit of time), and volume of distribution (Vd) and effect of dosing with Phe. In order to account for repeated measures, linear mixed effects models set treatment effects (i.e. BaP only, BaP with Phe) as fixed effects with random intercepts for participants. P-values were obtained using the likelihood ratio tests of the full model with the effect in question against the model without the effect in question. The non-parametric Friedman Rank Sum Test was used to evaluate treatment effects on Tmax (Supplemental Table 3). Non-detect data was analyzed using two assumptions consistent with maximum upper and lower biases. First, we assumed non-detects were 0, providing a maximum lower bias to the data. Second, we assumed non-detects were approximate limits of detection (0.6 fg BaP/mL), providing the maximal upper bias. We acknowledge that the true value is somewhere between these two assumptions. Major overall conclusions did not change when using both assumptions, and we reported p-values assuming non-detects were 0 in the text but provide both p-values in the supplemental information (Supplemental Table 4). Software used to statistically analyze data was “R: A language and environment for statistical computing” Version 4.0.3 (R Foundation for Statistical Computing, Vienna, Austria). Linear mixed effects models were fit using the lme4 package [81].
2.4. Phe inhibition of human CYP1A2 utilizing the P-450-Glo™ assay
The P450-Glo™ assay (Promega) was utilized with microsomes from baculovirus-infected Sf9 insect cells expressing human CYP1A2 (Corning) with 0.5 pmol CYP1A2 for 30 minutes at 37°C using the substrate, ME-luciferin, and conditions specified by Promega. The reactions were carried out in 96-well plates, and the luciferin product (generated by Ultra-Glo™ luciferase) measured by a luminometer (Synergy HTX plate reader, BioTek, Winooski, VT). Microsomes from Sf9 insect cells not expressing any CYP were used as a control. To assess Phe as an inhibitor of hCYP1A2, additions of 0, 0.5, 2, 10 and 25 μM were added prior to initiation of the reaction. A known competitive inhibitor of hCYP1A2, α-naphthoflavone, was used as a positive control.
3. Results and Discussion
3.1. Consumption of BaP estimated from diet diaries
We employed a food diary approach to estimate background levels of BaP (Table 2.) along with GC-MS/MS analysis of plasma to quantitate background levels of BaP and total PAHs (Table 3.) to assess the potential impact on [14C]-BaP toxicokinetics. The estimated BaP dietary intake prior to dosing with [14C]-BaP alone was 228 ± 95 ng for the low estimate and 295 ± 83 ng for the high estimate. During the 48-hour period post-dose, the estimates were 443 ± 339 ng and 581 ± 453 ng for the low and high estimates, respectively (Table 2). Prior to individuals being given the binary PAH mixture of [14C]-BaP plus Phe, the dietary BaP low and high estimates levels 182 ± 87 ng and 251 ± 70 ng, respectively, and 151 ± 95 ng and 192 ± 92 ng during the 48 hours post-dose. For the most part our efforts to restrict high PAH-containing foods in the diets of the participants was successful, and the estimated daily intake was at the lower-mid portion of the range of 250–700 ng for daily dietary intake for a non-smoking individual in the U.S. pre- and post- both dosing schemes [85].
Table 2.
Estimated Average Low and High Daily Dietary Consumption of BaP (ng)a
| Participant | Pre-[14C]-BaP | Post-[14C]-BaP | Pre-[14C]-BaP + Phe | Post-[14C]-BaP + Phe | Average ± SD | Average ± SD | ||||
|---|---|---|---|---|---|---|---|---|---|---|
|
| ||||||||||
| L | H | L | H | L | H | L | H | L | H | |
|
| ||||||||||
| 022 | 138 | 208 | 247 | 325 | 221 | 284 | 128 | 172 | 147±59 | 247±70 |
|
| ||||||||||
| 025 | 331 | 393 | 274 | 368 | 104 | 231 | 75 | 169 | 157±126 | 290±108 |
|
| ||||||||||
| 027 | 324 | 364 | 84 | 116 | 317 | 353 | 317 | 353 | 208±118 | 297±120 |
|
| ||||||||||
| 028 | 141 | 222 | 783 | 1220 | 129 | 175 | 128 | 137 | 236±325 | 437±520 |
|
| ||||||||||
| 031 | 208 | 289 | 829 | 876 | 140 | 210 | 107 | 127 | 257±341 | 376±340 |
|
| ||||||||||
| Average | 228 | 295 | 443 | 581 | 182 | 251 | 151 | 192 | ||
| ± SD | 95 | 83 | 339 | 453 | 87 | 70 | 95 | 92 | ||
The source of the low (L) and high (H) estimates in foods from Jakszyn et al., 2004 [82], Kazerouni et al., 2001[13], EU Scientific Committee on Food, 2002 [83] or EU Food Safety Committee, 2009 [84]
The “pre-“ is the 3 days prior to dosing and the estimates for columns labeled “post-“ are throughout the 48 hours post-dose
Table 3.
| Participant and Treatment | 1-methylnaphthalene | 1-methylpyrene | 2,6-dimethylnaphthalene | 2-methylnaphthalene | Anthanthrene | Fluorene | Naphthalene | Perylene | Phenanthrene | Pyrene | Retene |
|---|---|---|---|---|---|---|---|---|---|---|---|
|
| |||||||||||
| 022 BaP only | - | 0.32 | 1.00 | 0.99 | - | 0.53 | 1.45 | - | - | - | 3.05 |
| 022 BaP + Phe | 0.11 | 0.68 | - | 0.24 | - | - | 0.94 | - | - | - | 8.99 |
|
| |||||||||||
| 025 BaP only | - | - | 2.58 | - | - | 0.4 | 0.38 | - | - | - | 1.01 |
| 025 BaP + Phe | - | 0.53 | - | - | - | - | 0.64 | - | 0.11 d | - | 6.84 |
|
| |||||||||||
| 027 BaP only | 0.11 | 0.74 | - | 0.18 | - | - | 1.06 | - | - | - | 9.70 |
| 027 BaP + Phe | - | - | - | - | - | - | 0.23 | 23.3 | - | 1.29 | 8.80 |
|
| |||||||||||
| 028 BaP only | - | 0.34 | - | - | - | - | 0.67 | - | - | - | 4.64 |
| 028 BaP + Phe | - | - | - | - | 0.41 | - | 0.25 | 17.6 | - | 1.04 | 5.56 |
|
| |||||||||||
| 031 BaP only | - | 0.35 | - | - | - | - | 0.88 | - | - | - | 4.38 |
| 031 BaP + Phe | 0.08 | 0.42 | - | - | - | - | 0.46 | - | - | - | 5.21 |
64 PAHs were analyzed in plasm from blood taken just prior to the dosing of [14C]-BaP and [14C]-BaP + Phe
Results are in ng/mL of plasma
Only the PAHs above the LOQ for at least one occurrence are tabulated and no BaP or any other PAH classified by IARC as a known or probable human carcinogen was present above the LOQ
Note the single background Phe detected in bold
3.2. Background levels of PAHs in plasma
As previously described, GC-MS/MS analysis capable of quantifying 64 PAHs (LOQ 0.04 – 0.20) was used to analyze levels in plasma for all individuals prior to each microdosing [72]. Only 11 of the 64 PAHs screened for were quantifiable in at least one plasma sample (Table 3). Naphthalene and retene (7-isopropyl-1-methylphenanthrene) were present in all samples examined with a range of 0.23 – 1.45 and 1.01 – 9.70 ng/mL, respectively. Retene is a major PAH produced by wood smoke and wildfires impacting indoor and outdoor air quality [86,87]. Firefighters are exposed to high levels of retene [88]. Due to the location of the alkylation sites, retene has no bay region, cannot form reactive dihydrodiol-epoxides (DHDE), and is negative for mutagenicity with Salmonella strains sensitive to various types of mutations (TA100 (base pair), TA 97a, TA98 (frameshift) and TA102 (transition and transversion)) [89]. Retene is oxygenated by CYP to DHDs that, in the presence of aldo-keto reductase, are converted to mono- and bis-ortho-catechols that undergo redox cycling to quinones, producing toxicity through oxidative stress [90]. Production of oxidative stress and associated cardiovascular toxicity in zebrafish is consistent with the results obtained with human cell lines [91]. These effects of retene are AHR-dependent [91–93]. Interestingly, participant 022 exhibited a 3-fold increase in plasma levels of retene prior to the binary mixture, the dosing of which was 3 days after a significant exposure to the Woolsey fire in Southern California (November 8–21, 2018). However, participant 025 also exhibited a marked increase in plasma retene levels prior to dosing with the binary mixture (January 28, 2019), but there were no known exposures to wildfire smoke.
Perylene was the PAH found at the highest concentration in plasma but in only 2 of the 10 samples examined. Anthanthrene was not previously found by our lab in plasma but was only present here in 1 of the 10 samples. The previous studies [72,94] each had one sample of seven PAHs (benzo[c]fluorene, benzo[l]fluoranthene, 2-methylanthracene, 2-ethylnaphthalene, 6-methylchrysene, 7,12-dimethylbenz[a]anthracene and 9-methylanthracene) or one PAH (2-methylphananthrene) not seen in the present study (Table 4). It is important to note that no PAH listed by IARC as a probable or known human carcinogen was present including BaP (LOQ 0.2 ng/mL). Dosing of participants in these two previous studies with 50 ng [14C]-BaP resulted in Cmax values of 5.68 ± 4.70 [72] and 3.69 ± 4.12 [94] fg/mL,1.8–2.8 × 10−5 below the GC-MS/MS LOQ for BaP. For the most part the mean and range of plasma levels were consistent with our previous two studies (Table 4) [72,94].
Table 4.
Comparison of Plasma PAH Background Levels with Previous Studies
| PAH | Mean ± SD (ng/mL) | Range (ng/mL) | Frequency | LOQ (ng/mL) |
|---|---|---|---|---|
|
| ||||
| 1-Methynaphthalene | 0.10 ± 0.02 | ND- 0.11 | 3/10 (30%) | 0.06 |
| Maier et al., 202272 | 0.13 ± 0.07 | ND- 0.29 | 8/28 (57%) | |
| Maier et al., 202394 | 0.17 ± 0.02 | ND -0.20 | 5/21 (24%) | |
|
| ||||
| 1-Methypyrene | 0.48 ± 0.17 | ND- 0.74 | 7/10 (70%) | 0.08 |
| Maier et al., 202272 | 0.79 ± 0.97 | ND- 4.73 | 19/28 (68%) | |
| Maier et al., 202394 | 0.50 ± 0.13 | ND- 0.77 | 16/21 ((76%) | |
|
| ||||
| 2,6-Dimethylnaphthalene | 1.79 | ND- 2.58 | 2/10 (20%) | 0.2 |
| Maier et al., 202272 | 2.17 ± 1.01 | ND- 4.01 | 11/28 (37%) | |
| Maier et al., 202394 | 0.49 ± 0.05 | ND- 0.55 | 7/21 (33%) | |
|
| ||||
| 2-Methylnaphthalene | 0.47 ± 0.45 | ND- 0.99 | 3/10 (30%) | 0.1 |
| Maier et al., 202272 | 0.41 ± 0.32 | ND- 0.99 | 10/28 (36%) | |
| Maier et al., 202394 | 0.54 ± 0.28 | ND- 1.08 | 12/21 (57%) | |
|
| ||||
| Anthanthrene | 0.41 | ND- 0.41 | 1/10 (10%) | |
| Maier et al., 202272 | ND | 0/28 (0%) | ||
| Maier et al., 202394 | ND | 0/21 (0%) | ||
|
| ||||
| Fluorene | 0.46 | ND- 0.53 | 2/10 (10%) | 0.2 |
| Maier et al., 202272 | 0.48 ± 0.32 | ND- 1.36 | 12/28 (43%) | |
| Maier et al., 202394 | 0.23 ± 0.13 | ND- 0.53 | 12/21 (57%) | |
|
| ||||
| Naphthalene | 0.70 ± 0.39 | 0.23– 1.45 | 10/10 (100%) | 0.2 |
| Maier et al., 202272 | 0.84 ± 0.55 | 0.16– 2.99 | 28/28 (100%) | |
| Maier et al., 202394 | 0.52 ± 0.35 | 0.14– 1.45 | 21/21 (100) | |
|
| ||||
| Perylene | 20.4 | ND- 23.3 | 2/10 (20%) | 1 |
| Maier et al., 202272 | 35.4 ± 22.2 | ND- 52.2 | 4/28 (14%) | |
| Maier et al., 202394 | 20.5 ± 3.2 | ND- 24.1 | 3/21 (14%) | |
|
| ||||
| Phenanthrene | 0.11 | ND- 0.11 | 1/10 (10%) | 0.09 |
| Maier et al., 202272 | 0.47 ± 0.16 | ND- 0.64 | 5/28 (18%) | |
| Maier et al., 202394 | 0.53 ± 0.17 | ND- 0.97 | 11/21 (52%) | |
|
| ||||
| Pyrene | 1.16 | 1.04– 1.29 | 2/10 (20%) | 0.08 |
| Maier et al., 202272 | 1.94 ± 2.35 | ND- 6.80 | 7/28 (25%) | |
| Maier et al., 202394 | 0.69 ± 0.25 | ND- 1.20 | 15/21 (71%) | |
|
| ||||
| Retene | 5.82 ± 2.78 | 1.01– 9.70 | 10/10 (100%) | 0.2 |
| Maier et al., 202272 | 8.81 ± 10.7 | 1.01– 57.8 | 28/28 (100%) | |
| Maier et al., 202394 | 5.49 ± 2.25 | ND- 11.8 | 20/21 (95%) | |
3.3. Toxicokinetics of [14C] BaP in plasma
Following an oral dose of 50 ng [14C]-BaP, maximum concentrations (Cmax) of [14C]-BaP in blood peaked at 7.07 ± 4.89 fg/mL (mean ± SD) at a median time of 0.5 hours (Figure 2). [14C]-BaP T1/2 in blood was 1.1 ± 1.1 hours (mean ± SD) with two samples (of 5) having detectable BaP at 24 hours and no detectable BaP at 48 hours. No statistically significant relationships among Cmax, AUC(0,48 h), AUC(0,∞), T1/2, Cl, or Vd were observed as a function of BMI or age (p ≥ 0.21).
Figure 2.
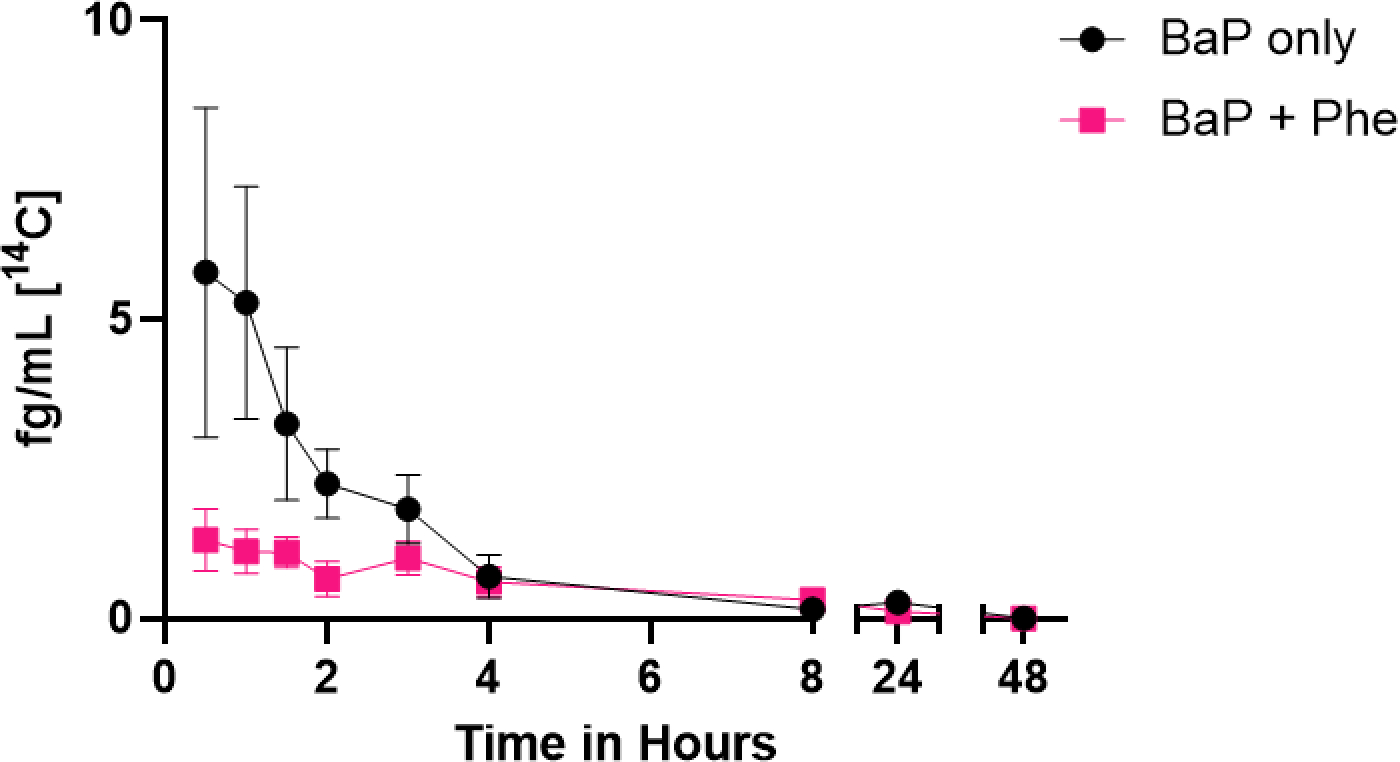
Time course of [14C]-BaP in plasma from five participants over 48 h. Mean plasma levels (fg/mL) ± SE for [14C]-BaP are shown following [14C]-BaP only dose (black circles) and [14C]-BaP + Phe (pink squares).
Dosing with Phe significantly altered [14C]-BaP toxicokinetics in plasma of human participants with reduced [14C]-BaP Cmax (p = 0.017) and significantly increased Vd (p = 0.039) compared to dosing with [14C]-BaP alone (Figure 2, Table 5). BaP Tmax, AUCs, T1/2, and Cl were not significantly affected by dosing with both compounds (p ≥ 0.85). These changes provide evidence that dosing with both [14C]-BaP and Phe reduced BaP absorption (reduced Cmax and increased Vd) compared to [14C]-BaP alone.
Table 5.
Summary of pharmacokinetic constants for [14C]-BaPa
| Dose | ||
|---|---|---|
| Parameter | BaP only | BaP + Phe |
|
| ||
| Cmax (fg BaP/L)b | 7.07 ± 4.89 | 1.60 ± 0.86 |
| Tmax (h) | 1.1 ± 1.1 | 1.7 ± 1.3 |
| AUC (fg BaP/mL×h) | 17.88 ± 9.56 | 10.07 ± 9.32 |
| AUC(0,∞) (fg BaP/mL×h) | 17.88 ± 9.56 | 10.07 ± 9.32 |
| T1/2 (h) | 4.78 ± 4.45 | 3.92 ± 4.12 |
| Cl (L/h) | 3707 ± 2267 | 12680 ± 11850 |
| Vd (L)c | 17550 ± 9725 | 35730 ± 18330 |
The values shown are the mean ± SD of all participants. Toxicokinetic constants that were significantly different are shown in bold as determined by the Freidman test (Tmax only), or the likelihood ratio tests of mixed effect models.
Cmax was significantly reduced following the BaP + Phe dose, comparatively (p = 0.017).
Vd was significantly reduced following the BaP + Phe dose, comparatively (p = 0.039).
3.5. Toxicokinetics of [14C] BaP metabolites in plasma over 48 hours
The toxicokinetics for the sum of all [14C]-BaP metabolites in plasma (Figure 3) followed similar patterns with both dosing schemes (Figure 3, Table 6). Both the Cmax of the combined total metabolites from [14C]-BaP and summed bay region (7,8,9,10-tetraols, 7,8-DHD and 9,10-DHD) metabolites from plasma following the [14C]-BaP dose alone appeared higher than those following the combined dose (p = 0.015 and 0.028, respectively). The combined total metabolites AUC(0,∞) was also significantly reduced (p = 0.019), and while not significant, AUC(0,48) was reduced as well (p = 0.054). As in our previous studies, total [14C]-BaP metabolites made up more than 95% of the total [14C] in plasma even at the earliest assay time (0.5 hours), indicating rapid and extensive metabolism of [14C]-BaP (Figure 3) [72,94]. Also consistent with previous work, Tmax ranged between 1–2 hours, and little or no [14C] remained in plasma 24–48 hours post-dose. Total [14C]-BaP metabolite T1/2 and Tmax values were not significantly affected by Phe co-treatment (p ≥ 0.317).
Figure 3.
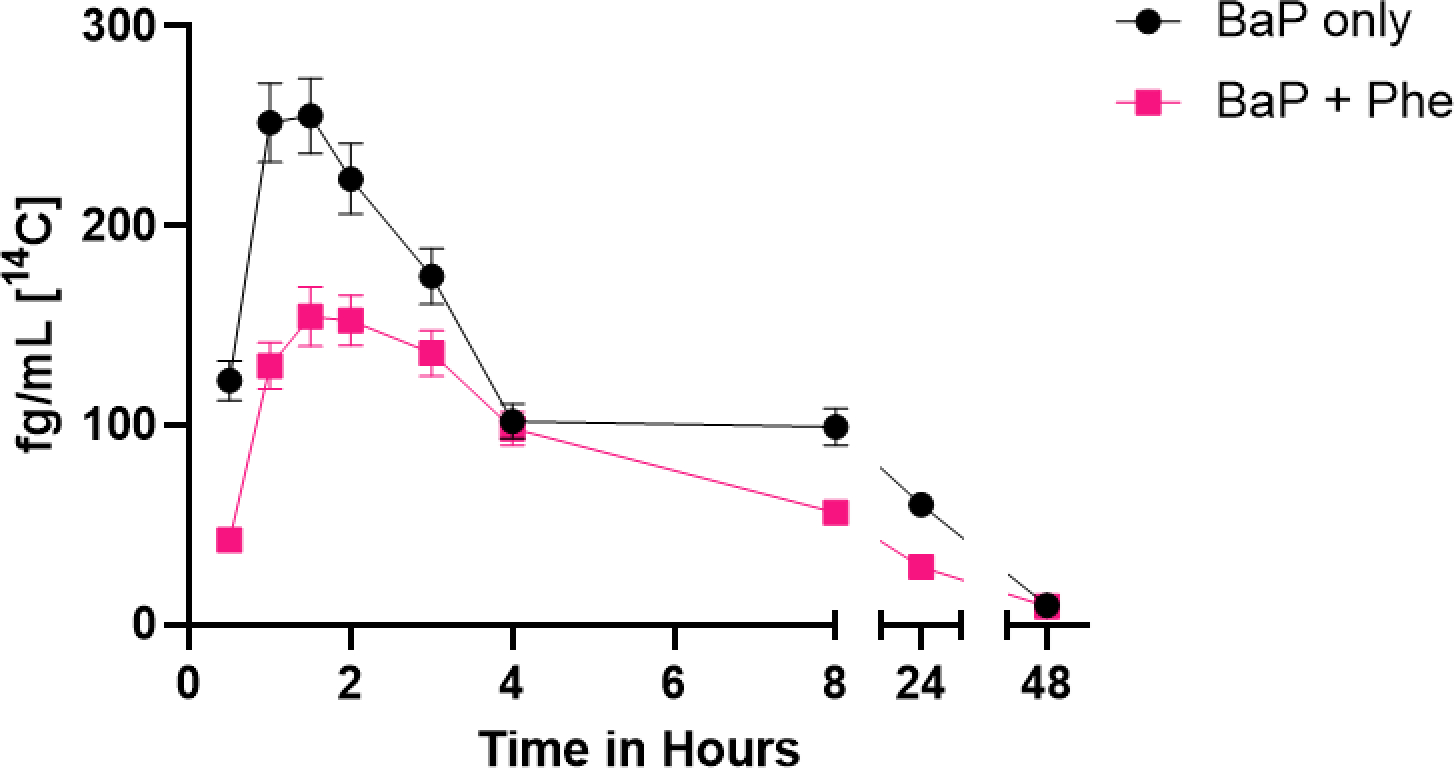
Time course of the sum of total [14C]-BaP metabolites over 48 h. The total [14C] plasma levels (fg/mL) of the combined twelve metabolites from five participants is shown following [14C]-BaP only dose (black circles) and [14C]-BaP + Phe (pink squares). The bars are ± SE.
Table 6.
Pharmacokinetic constants for [14C]-BaP individual metabolitesa
| Compound | Dose | Cmaxb (fg BaP/mL) | Tmax (h) | AUC (fg BaP/mL×h) | AUC(0,∞)c (fg BaP/mL×h) | T1/2 (h) |
|---|---|---|---|---|---|---|
|
| ||||||
| Unknown A | BaP only | 16.36 ± 7.56 | 1.7 ± 0.8 | 112.60 ± 63.99 | 128.17 ± 60.68 | 17.55 ± 20.72 |
| BaP + Phe | 8.67 ± 5.23 | 2.2 ± 1.0 | 65.74 ± 22.32 | 65.74 ± 22.32 | 6.70 ± 3.49 | |
|
| ||||||
| Tetraols | BaP only | 10.30 ± 3.82 | 1.7 ± 0.8 | 106.06 ± 59.91 | 124.71 ± 69.23 | 17.41 ± 22.60 |
| BaP + Phe | 6.63 ± 4.72 | 2.3 ± 1.2 | 83.43 ± 26.12 | 140.15 ± 117.45 | 29.94 ± 28.05 | |
|
| ||||||
| 9,10-dihydrodiol | BaP only | 8.58 ± 3.15 | 1.7 ± 1.4 | 77.68 ± 32.39 | 96.14 ± 53.86 | 19.30 ± 27.16 |
| BaP + Phe | 5.26 ± 2.99 | 2.1 ± 1.1 | 57.24 ± 23.46 | 57.06 ± 23.26 | 8.95 ± 3.09 | |
|
| ||||||
| Unknown B | BaP only | 9.46 ± 7.44 | 1.5 ± 0.4 | 43.52 ± 40.22 | 43.52 ± 40.22 | 4.56 ± 2.89 |
| BaP + Phe | 5.32 ± 5.50 | 2.2 ± 1.0 | 24.43 ± 16.99 | 24.43 ± 16.99 | 3.97 ± 3.13 | |
|
| ||||||
| 7,8-dihydrodiol | BaP only | 4.12 ± 3.04 | 1.7 ± 0.8 | 28.04 ± 34.04 | 28.04 ± 34.04 | 4.72 ± 4.18 |
| BaP + Phe | 2.54 ± 2.07 | 2.3 ± 1.2 | 10.53 ± 9.26 | 10.53 ± 9.26 | 2.25 ± 0.55 | |
|
| ||||||
| 1,6-quinone | BaP only | 3.89 ± 2.06 | 3.4 ± 2.8 | 55.07 ± 49.81 | 55.07 ± 49.81 | 7.29 ± 3.58 |
| BaP + Phe | 2.42 ± 1.25 | 2.9 ± 1.1 | 22.54 ± 13.09 | 22.54 ± 13.09 | 4.97 ± 3.58 | |
|
| ||||||
| Unknown C | BaP only | 6.50 ± 3.17 | 3.7 ± 2.6 | 147.30 ± 91.04 | 198.60 ± 102.19 | 27.72 ± 27.11 |
| BaP + Phe | 4.81 ± 1.72 | 3.6 ± 0.5 | 78.39 ± 23.52 | 107.66 ± 49.04 | 24.74 ± 16.32 | |
|
| ||||||
| Unknown D | BaP only | 3.30 ± 1.93 | 3.2 ± 2.9 | 47.96 ± 40.26 | 52.56 ± 52.23 | 10.42 ± 4.69 |
| BaP + Phe | 2.08 ± 1.26 | 3.1 ± 1.0 | 25.35 ± 15.98 | 25.35 ± 15.98 | 7.53 ± 3.87 | |
|
| ||||||
| 3,6-quinone | BaP only | 0.81 ± 0.23 | 2.8 ± 2.9 | 6.29 ± 12.44 | 6.29 ± 12.44 | 3.09 ± 4.43 |
| BaP + Phe | 0.46 ± 0.65 | 1.3 ± 1.1 | 1.01 ± 1.54 | 1.01 ± 1.54 | 1.76 ± 0.01 | |
|
| ||||||
| Unknown Ed | BaP only | - - | - - | - - | - - | - - |
| BaP + Phe | 0.28 ± 0.62 | 0.5 ± - | 3.84 ± 8.59 | 3.84 ± 8.59 | 15.48 ± - | |
|
| ||||||
| 9-OH | BaP only | 2.32 ± 2.36 | 1.4 ± 0.7 | 3.40 ± 3.83 | 3.40 ± 3.83 | 1.33 ± 0.39 |
| BaP + Phe | 0.66 ± 0.38 | 2.0 ± 0.7 | 0.74 ± 0.82 | 0.74 ± 0.82 | 1.40 ± 0.49 | |
|
| ||||||
| 3-OH | BaP only | 4.85 ± 3.31 | 1.7 ± 0.8 | 9.99 ± 7.43 | 9.99 ± 7.43 | 1.85 ± 0.56 |
| BaP + Phe | 2.00 ± 1.03 | 2.2 ± 0.8 | 5.90 ± 4.33 | 5.90 ± 4.33 | 1.59 ± 0.36 | |
The values shown are the mean ± SD of all participants. Toxicokinetic constants that were significantly different are shown in bold as determined by the Freidman test (Tmax only), or the likelihood ratio tests of mixed effect models.
Cmax was significantly reduced following the BaP + Phe dose, comparatively, for Unknown A (p = 0.009), Unknown B (p = 0.024), and 7,8-dihydrodiol (p = 0.027).
AUC(0,∞) of Unknown A was significantly reduced following the BaP + Phe dose, comparatively (p = 0.022).
Unknown E was only seen following the BaP + Phe dose in one individual.
Early eluting peaks, indicative of more water-soluble metabolites, predominate (Figure 4). We have posited that Unknown A (no reference standard available for any of the metabolites labeled as unknowns) likely represents highly polar glucuronide, sulfate, and/or glutathione conjugates [72,94]. The hydrolysis of the four enantiomers of the carcinogenic metabolite BaP-7,8-DHD-9,10-E create a mix of 7,8,9,10-tetraol isomers. The 9,10-DHD, unknown B (which may be another dihydrodiol), and 7,8-DHD are the next to elute followed by additional diols or quinones (unknowns C and D), 1,6- and 3,6-quinones, unknown E (likely a quinone), the 3- and 9-phenols, and finally parent [14C]-BaP.
Figure 4.
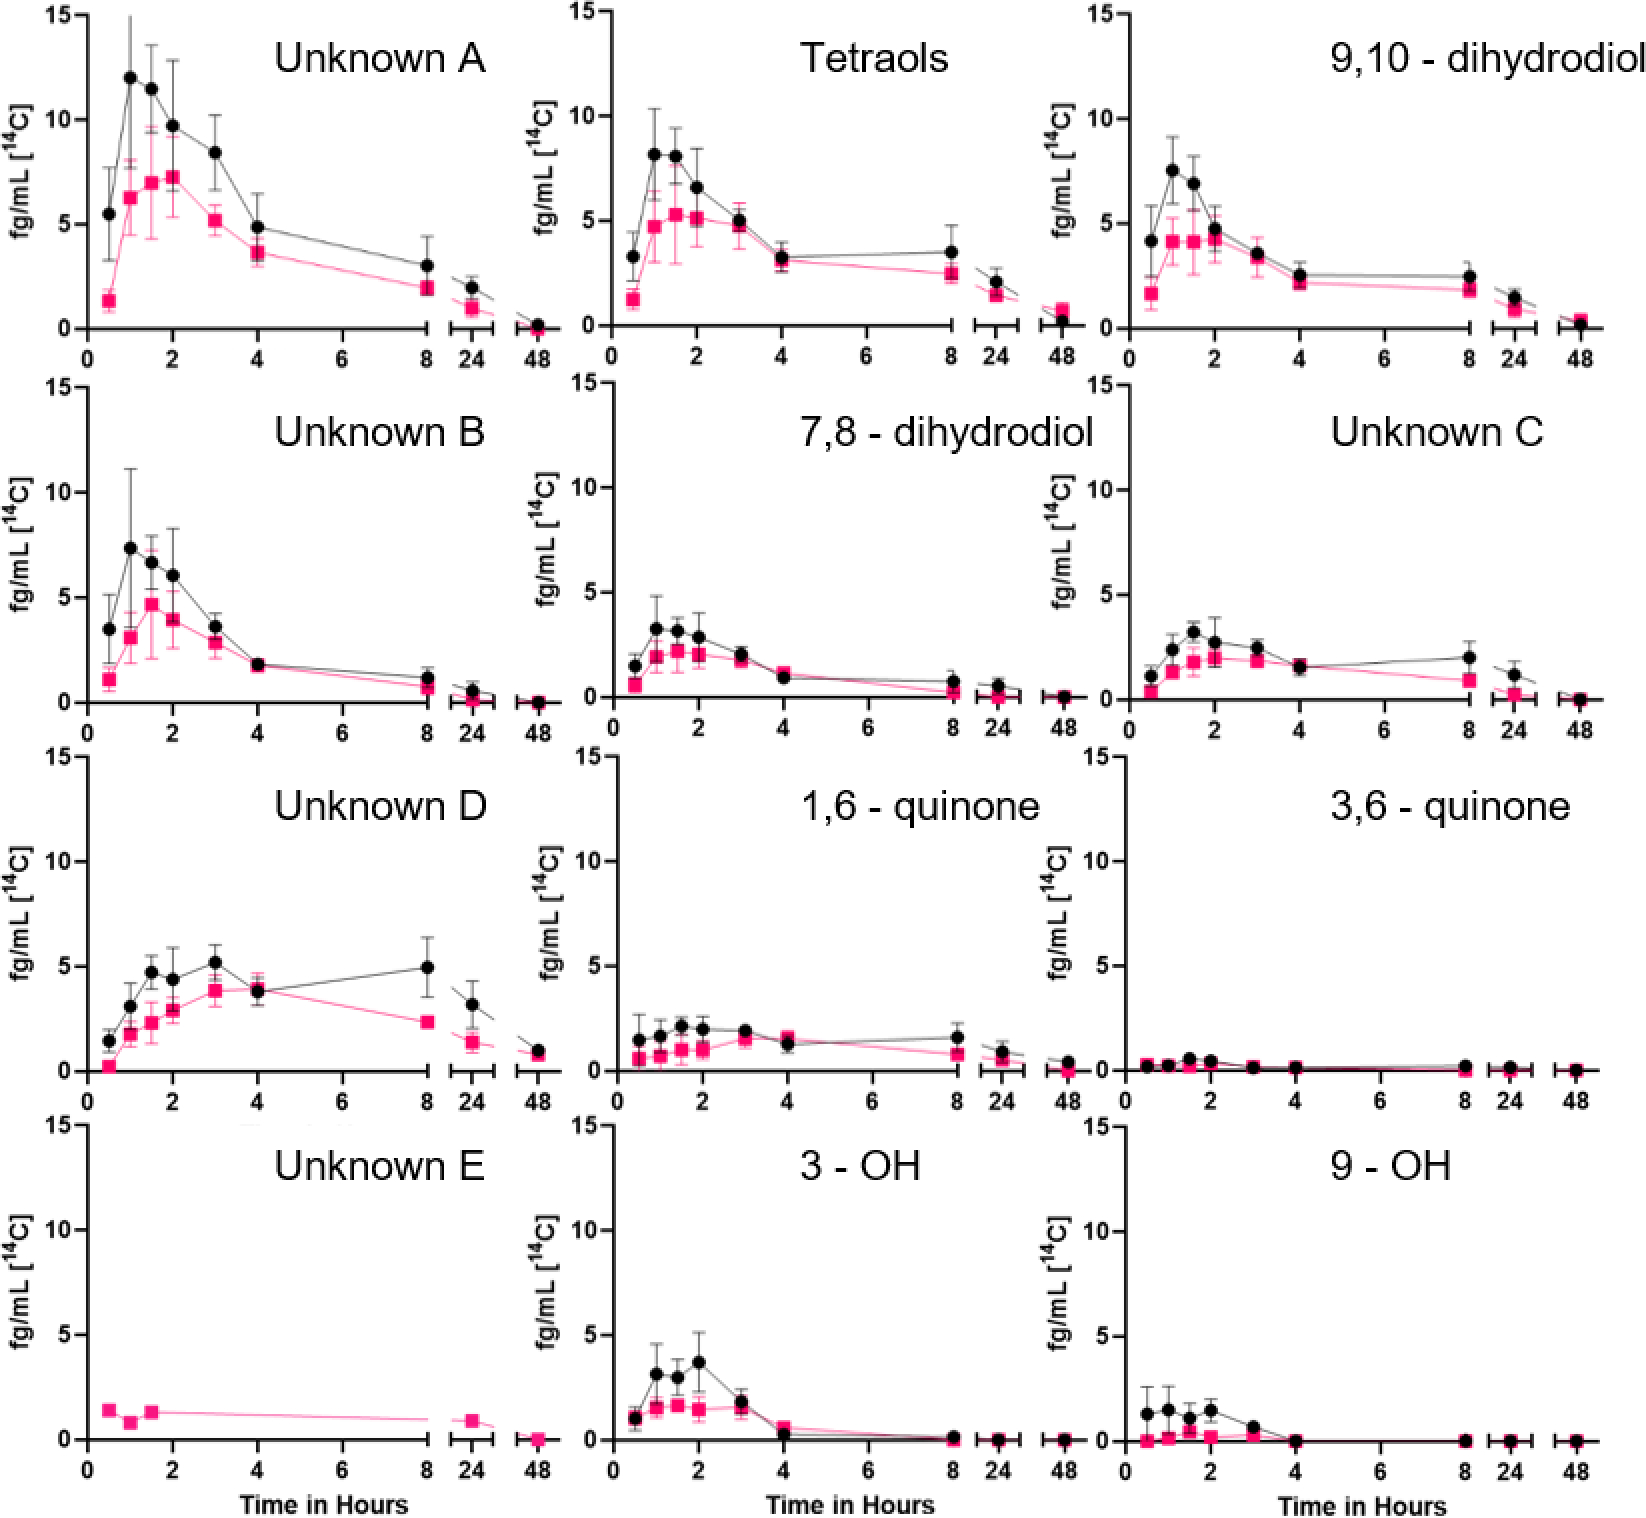
Time course of the [14C] plasma metabolites over 48 h from five participants. The mean plasma levels (fg/mL) ± SE following dosing with [14C]-BaP only (black circles) and [14C]-BaP + Phe (pink squares) for each metabolite, featured in elution order.
Combined dosing caused significant changes to a number of non-compartmental pharmacokinetic parameters of certain metabolites when compared to the [14C]-BaP dose alone. Cmax of three different metabolites (Unknown A, Unknown B, and 7,8-DHD) were significantly reduced following combined dosing (p = 0.009, 0.024, and 0.027, respectively, Table 6). These effects are consistent with combined dosing attenuating [14C]-BaP absorption. Unknown metabolite E was only detected following co-dosing (in one individual, 022). The AUC(0,∞) of Unknown A was significantly reduced following combined dosing (p = 0.022).
While not significant, Cmax of other metabolites trended down as well (tetraols, p = 0.065; 9,10-DHD, p = 0.071; 1,6-quinone, p = 0.060; and 3-phenol, p = 0.054) (Table 6). Unknown C AUC(0,48) and AUC(0,∞) showed a similar pattern (p = 0.067 and 0.064, respectively). The observed downstream impacts on metabolite non-compartmental toxicokinetic parameters are consistent with co-dosing effects on [14C]-BaP absorption. As noted in earlier studies a significant percentage of the metabolism occurred at the bay region of BaP (Figure 4) [72,94].
3.6. Phe as a competitive inhibitor of human CYP1A2
In humans, members of the CYP1 family (1A1, 1A2 and 1B1) have the highest activity toward BaP and Phe with a preference for oxygenation at the bay region [27,46–48,95]. Following an oral dose, BaP and Phe would travel to the liver via the portal vein prior to appearance in plasma. As CYPs 1A1 and 1B1 are constitutively expressed at very low levels in liver, we focused on CYP1A2 inhibition by Phe as a potential mechanism for effects on the toxicokinetics of [14C]-BaP and [14C]-BaP metabolites. A necessary caveat to this assumption is that intestinal CYP metabolism of BaP is much lower than liver. Phe inhibition of hCYP1A2 appears competitive, and the Ki was calculated to be 12.6 μM (Figure 5).
Figure 5.
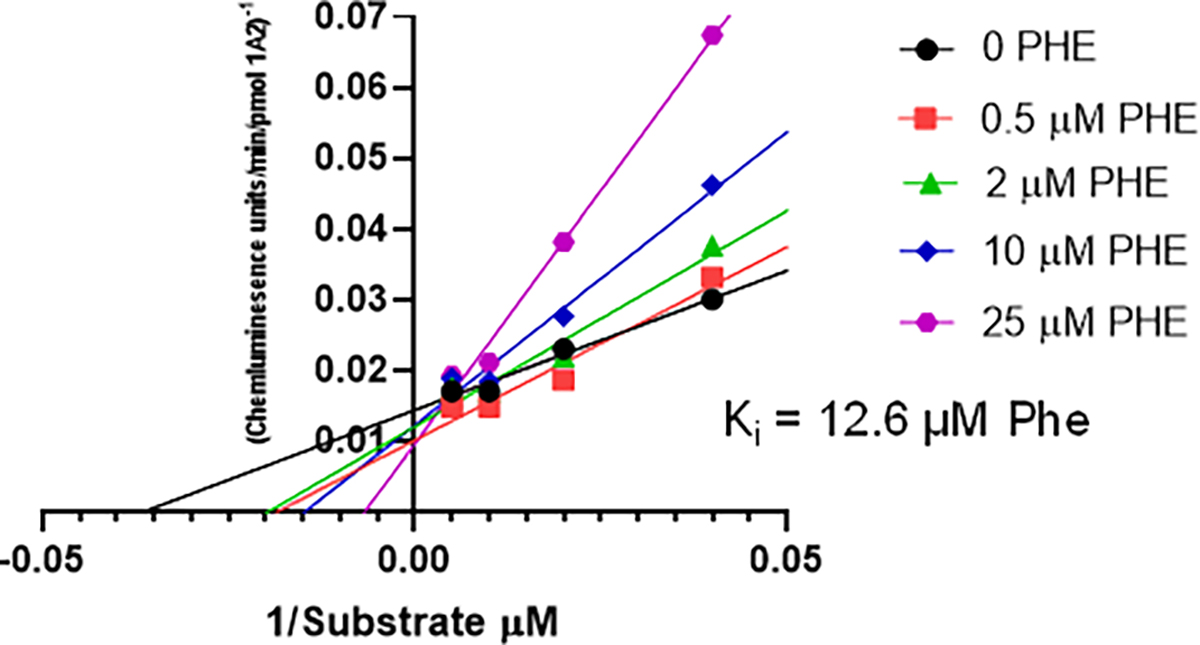
Lineweaver-Burk plot of human CYP1A2 inhibition by Phe. A plot of Phe concentration versus the slope of each line resulted in a -x intercept of 12.6 μM.
4. Conclusions
A Toxic Equivalency Quotient (TEQ) approach for PAH mixtures (termed RPF) requires complete and accurate TEFs (Toxic Equivalency Factors) for all components with TEFs remaining constant in a mixture. Utilizing the power of AMS, we were able, for the first time in vivo with humans, to test if BaP toxicokinetics remained constant in a simple binary mixture dosed at actual environmental levels of exposure. [14C]-BaP, when in the binary mixture, exhibited toxicokinetics different than when dosed alone. This is consistent with previous in vitro and in vivo animal studies, providing evidence that PAH mixture toxicity and carcinogenesis (RPF) cannot be accurately predicted using the TEQ approach as used for dioxins/dibenzofurans. Utilizing UPLC-AMS, we further showed that a reduced absorption into plasma (decreased Cmax and increased Vd) is responsible rather than altered metabolism or elimination as metabolite profiles remained relatively the same with no significant change in plasma half-life or clearance. Although Phe is a competitive inhibitor of the major hepatic CYP responsible for BaP metabolism, CYP1A2, this is unlikely to be the mechanism given the Ki of Phe is 12.6 μM. The cost and access limitations of UPLC-AMS studies preclude adoption as a standard tool for risk assessment but selective use with chemicals representative of a class (e.g., PAHs, PCBs, PFAS, etc.) could be a powerful approach for testing assumptions about behavior in vivo after micro-dosing at environmental levels rather than reliance solely on high dose animal data.
Supplementary Material
HIGHLIGHTS.
Toxicokinetics of [14C]-BaP was assessed dosed singularly and as binary mixture
UPLC-AMS shows BaP absorption altered by Phe in the binary mixture
Phe is a competitive inhibitor of CYP1A2 but altered metabolism unlikely mechanism
First in vivo test in humans at environmental levels doesn’t support TEQ for PAHs
Acknowledgements
The authors would like to thank the participants who volunteered to be part of this study. Special thanks are also given to Carolyn Kinzie, Danny Chen, and Peter Scruggs for their contributions with sample extractions and preparation.
Funding sources
This study was funded by Public Health Service NIH grants P42ES016465, R01ES028600, T32ES07060, and P30ES030287. Work was performed in part at the National User Resource for Biological Accelerator Mass Spectrometry, which is operated at LLNL under the auspices of the US Department of Energy under contract DE-AC52-07NA27344. The User Resource is supported by the National Institutes of Health (NIH), National Institute of General Medical Sciences (NIGMS) under grant R24GM137748. Toxicokinetic modeling was completed at PNNL, a multi-program laboratory operated by Battelle for US Department of Energy under contract DE-AC06-76RL01830.
Abbreviations
- AMS
accelerator mass spectrometry
- AUC
area under the curve
- BaP
benzo[a]pyrene
- BaP-7,8
DHD (±) trans-benzo[a]pyrene-7,8-dihydrodiol
- BaPDHDE
BaP-DHD-9,10-epoxide
- Cmax
maximum concentration in plasma
- Cl
clearance
- CYP
cytochrome P-450
- DBC
dibenzo[def,p]chrysene
- FDA IND
US Food and Drug Administration Investigational New Drug application
- IARC
International Agency for Research on Cancer
- IRB
Institutional Review Board
- Ki
inhibition constant
- LLNL
Lawrence Livermore National Laboratory
- LOD
limit of detection
- LOQ
limit of quantitation
- N2-dG
nitrogen at the 2 position of deoxyguanosine
- OSU
Oregon State University
- PAH
polycyclic aromatic hydrocarbon
- Phe
phenanthrene
- RPF
Relative Potency Factor
- T1/2
time required for 50% elimination from plasma
- TEF
Toxic Equivalency Factor
- TEQ
Toxic Equivalency Quotient
- Tmax
time at which Cmax is reached
- UPLC
ultra-pressure liquid chromatography
- EPA
United States Environmental Protection Agency
- Vd
volume of distribution
Footnotes
CRediT authorship contribution statement
Monica L. Vermillion Maier: Data curation; Formal analysis; Investigation; Methodology; Validation; Visualization; Writing-original draft; Writing-review and editing. Lisbeth K. Siddens: Data curation; Investigation; Methodology; Supervision; Validation; Writing-review and editing. Jamie M. Pennington: Data curation; Investigation; Writing-review and editing. Sandra L. Uesugi: Data curation; Methodology; Project administration, Resources; Supervision; Writing-review and editing. Edward Labut: Methodology, Data curation; Emily A. Vertel: Methodology, Data curation; Susan C. Tilton: Methodology; Resources; Supervision; Writing-review and editing. Kim A. Anderson: Data curation; Formal analysis; Methodology; Resources; Validation. Lane G. Tidwell: Formal analysis; Writing-review and editing. Ted J. Ognibene: Formal analysis; Methodology; Resources; Software; Validation; Writing-review and editing. Kenneth W. Turteltaub: Project administration, Resources. Jordan N. Smith: Formal analysis; Methodology; Software; Visualization; Writing-original draft; Writing-review and editing. David E. Williams: Conceptualization; Funding acquisition; Investigation; Project administration, Resources; Supervision; Validation; Writing-original draft; Writing-review and editing.
5. References
- 1.Sadiktsis I, Bergvall C, Johansson C, Westerholm R (2012) Automobile tires—a potential source of highly carcinogenic dibenzopyrenes to the environment. Environ. Sci. Technol. 46, 3326–34, doi: 10.1021/es204257d. [DOI] [PubMed] [Google Scholar]
- 2.Titaley I, Chlebowski A, Truong L, Tanguay RL, Massey Simonich SL (2016) Identification and toxicological evaluation of unsubstituted PAHs and novel PAH derivatives in pavement sealcoat products. Environ. Sci. Technol. Lett 3, 234–42, [PMC free article] [PubMed] [Google Scholar]
- 3.Simoneit BR, Bi X, Oros DR, Medeiros PM, Sheng G, Fu J (2007) Phenols and hydroxy-PAHs (arylphenols) as tracers for coal smoke particulate matter: source tests and ambient aerosol assessments. Environ. Sci. Technol. 41, 7294–302, doi: 10.1021/es071072u. [DOI] [PubMed] [Google Scholar]
- 4.Li Z, Sjödin A, Romanoff LC, Horton K, Fitzgerald CL, Eppler A, Aguilar-Villalobos M, Naeher LP (2011) Evaluation of exposure reduction to indoor air pollution in stove intervention projects in Peru by urinary biomonitoring of polycyclic aromatic hydrocarbon metabolites. Environ. Int. 37, 1157–63, doi: 10.1016/j.envint.2011.03.024. [DOI] [PubMed] [Google Scholar]
- 5.Hecht SS (2003) Tobacco carcinogens, their biomarkers and tobacco-induced cancer. Nat. Rev. Cancer 3, 733–44, doi: 10.1038/nrc1190. [DOI] [PubMed] [Google Scholar]
- 6.Staretz ME, Murphy SE, Patten CJ, Nunes MG, Koehl W, Amin S, Koenig LA, Guengerich FP, Hecht SS (1997) Comparative metabolism of the tobacco-related carcinogens benzo[a]pyrene, 4-(methylnitrosamino)-1-(3-pyridyl)-1-butanone, 4-(methylnitrosamino)-1-(3-pyridyl)-1-butanol, and N’- nitrosonornicotine in human hepatic microsomes. Drug Metab. Dispos. 25, 154–62, [PubMed] [Google Scholar]
- 7.Stepanov I, Villalta PW, Knezevich A, Jensen J, Hatsukami D, Hecht SS (2010) Analysis of 23 polycyclic aromatic hydrocarbons in smokeless tobacco by gas chromatography-mass spectrometry. Chem. Res. Toxicol. 23, 66–73, doi: 10.1021/tx900281u. [DOI] [PMC free article] [PubMed] [Google Scholar]
- 8.Vu AT, Taylor KM, Holman MR, Ding YS, Hearn B, Watson CH (2015) Polycyclic aromatic hydrocarbons in the mainstream smoke of popular U.S. cigarettes. Chem. Res. Toxicol. 28, 1616–26, doi: 10.1021/acs.chemrestox.5b00190. [DOI] [PMC free article] [PubMed] [Google Scholar]
- 9.Bansal V, Kim K-H (2015) Review of PAH contamination in food products and their health hazards. Environ. Int. 84, 26–38, doi: 10.1016/j.envint.2015.06.016. [DOI] [PubMed] [Google Scholar]
- 10.Lao J-Y, Xie S-Y, Wu C-C Bao L-J, Tao S, Zeng EY (2018) Importance of dermal absorption of polycyclic aromatic hydrocarbons derived from barbecue fumes. Environ. Sci. Technol. 52, 8330–8, doi: 10.1021/acs.est.8b01689. [DOI] [PubMed] [Google Scholar]
- 11.Karyab H, Yunesian M, Nasseri S, Mahvi AH, Ahmadkhaniha R, Rastkari N, Nabizadeh R (2013) Polycyclic aromatic hydrocarbons in drinking water of Tehran, Iran. J. Environ. Health Sci. Eng. 11, 25, doi: 10.1186/2052-336X-11-25. [DOI] [PMC free article] [PubMed] [Google Scholar]
- 12.Domingo JL, Nadal M (2015) Human dietary exposure to polycyclic aromatic hydrocarbons: a review of the scientific literature. Fd. Chem. Toxicol. 86, 144–53, doi: 10.1016/j.fct.2015.10.002. [DOI] [PubMed] [Google Scholar]
- 13.Kazerouni N, Sinha R, Hsu CH, Greenberg A, Rothman N (2001) Analysis of 200 food items for benzo[a]pyrene and estimation of its intake in an epidemiologic study. Fd. Chem. Toxicol. 39, 423–36, doi: 10.1016/j.fct.2015.10.002. [DOI] [PubMed] [Google Scholar]
- 14.Lang C, Tao S, Liu W, Zhang Y, Simonich S (2008) Atmospheric transport and outflow of polycyclic aromatic hydrocarbons from China. Environ. Sci. Technol. 42, 5196–201, doi: 10.1021/es800453n. [DOI] [PubMed] [Google Scholar]
- 15.Brandt HCA, Watson WP (2003) Monitoring human occupational and environmental exposures to polycyclic aromatic compounds. Ann. Occup. Hyg 47, 349–78, doi: 10.1093/annhyg/meg052. [DOI] [PubMed] [Google Scholar]
- 16.Ikarashi Y, Kaniwa M, Tsuchiya T (2005) Monitoring of polycyclic aromatic hydrocarbons and water-extractable phenols in creosotes and creosote-treated woods made and procurable in Japan. Chemosphere 60, 1279–87, doi: 10.1016/j.chemosphere.2005.01.054. [DOI] [PubMed] [Google Scholar]
- 17.IARC (2021). IARC monographs on the identification of carcinogenic hazards to humans. International Agency for Research on Cancer, https://monographs.iarc.who.int/list-of-classifications (accessed 12.27.22). [Google Scholar]
- 18.Mumtaz MM, George JD, Gold KW, Cibulas W, DeRosa CT (1996) ATSDR evaluation of health effects of chemicals. IV. Polycyclic aromatic hydrocarbons (PAHs): understanding a complex problem. Toxicol. Ind. Health 12, 742–971, doi: 10.1177/074823379601200601. [DOI] [PubMed] [Google Scholar]
- 19.Abdel-Shafy HI, Mansour MSM (2016) A review on polycyclic aromatic hydrocarbons: Source, environmental impact, effect on human health and remediation. Egypt. J. Pet. 25, 107–23. [Google Scholar]
- 20.Miller KP, Ramos KS (2001) Impact of cellular metabolism on the biological effects of benzo[a]pyrene and related hydrocarbons. Drug Metab. Rev. 33, 1–35, doi: 10.1081/dmr-100000138. [DOI] [PubMed] [Google Scholar]
- 21.Bukowska B, Mokra K, Michalowicz J (2022) Benzo[a]pyrene-environmental occurrence, human exposure, and mechanisms of toxicity. Internatl. J. Molec. Sci. 23, 6348, doi: 10.3390/ijms23116348. [DOI] [PMC free article] [PubMed] [Google Scholar]
- 22.ATSDR (2020) ATSDR substance priority list. Agency for Toxic Substances and Disease Registry https://www.atsdr.cdc.gov/spl/index.html, (accessed 12.28.22).
- 23.Boström CE, Gerde P, Hanberg A, Jernström B, Johansson C, Kyrklund T, Rannug A, Törnqvist M, Victorin K, Westerholm R (2002) Cancer risk assessment, indicators, and guidelines for polycyclic aromatic hydrocarbons in the ambient air. Environ. Health Perspect. 110 (Suppl 3), 451–88, doi: 10.1289/ehp.110-1241197. [DOI] [PMC free article] [PubMed] [Google Scholar]
- 24.U.S. EPA. (2017) Toxicological Review of Benzo[a]pyrene [CASRN 50–32-8].
- 25.U.S. EPA. (2010) Development of a Relative Potency Factor (Rpf) Approach for Polycyclic Aromatic Hydrocarbon (PAH) Mixtures (External Review Draft, Suspended). United States Environmental Protection Agency: Science Inventory; https://cfpub.epa.gov/si/si_public_record_report.cfm?Lab=NCEA&dirEntryId=194584, (accessed 12.28.22). [Google Scholar]
- 26.Phillips DH (1999) Polycyclic aromatic hydrocarbons in the diet. Mutat. Res. 443, 139–47, doi: 10.1016/s1383-5742(99)00016-2. [DOI] [PubMed] [Google Scholar]
- 27.Schober W, Pusch G, Oeder S, Reindl H, Behrendt H, Buters JTM (2010) Metabolic activation of phenanthrene by human and mouse cytochromes P450 and pharmacokinetics in CYP1A2 knockout mice. Chem. Biol. Interact. 183, 57–66, doi: 10.1016/j.cbi.2009.09.008. [DOI] [PubMed] [Google Scholar]
- 28.Carmella SG, Chen M, Yagi H, Jerina DM, Hecht SS (2004) Analysis of phenanthrols in human urine by gas chromatography-mass spectrometry: potential use in carcinogen metabolite phenotyping. Cancer Epidemiol. Biomark. Prev. 13, 2167–74, [PubMed] [Google Scholar]
- 29.Hecht SS, Chen M, Yagi H, Jerina DM, Carmella SG (2003) r-1,t-2,3,c-4-Tetrahydroxy-1,2,3,4-tetrahydrophenanthrene in human urine: a potential biomarker for assessing polycyclic aromatic hydrocarbon metabolic activation. Cancer Epidemiol. Biomark. Prev. 12, 1501–8, [PubMed] [Google Scholar]
- 30.Hochalter JB, Zhong Y, Han S, Carmella SG, Hecht SS (2011) Quantitation of a minor enantiomer of phenanthrene tetraol in human urine: correlations with levels of overall phenanthrene tetraol, benzo[a]pyrene tetraol, and 1-hydroxypyrene. Chem. Res. Toxicol. 24, 262–8, doi: 10.1021/tx100391z. [DOI] [PMC free article] [PubMed] [Google Scholar]
- 31.Hecht SS, Carmella SG, Villalta PW, Hochalter JB (2010) Analysis of phenanthrene and benzo[a]pyrene tetraol enantiomers in human urine: relevance to the bay region diol epoxide hypothesis of benzo[a]pyrene carcinogenesis and to biomarker studies. Chem. Res. Toxicol. 23, 900–8, doi: 10.1021/tx9004538. [DOI] [PMC free article] [PubMed] [Google Scholar]
- 32.Cheng G, Zarth AT, Upadhyaya P, Villalta PW, Balbo S, Hecht SS (2017) Investigation of the presence in human urine of mercapturic acids derived from phenanthrene, a representative polycyclic aromatic hydrocarbon. Chem. Biol. Interact. 274, 80–8, doi: 10.1016/j.cbi.2017.07.005. [DOI] [PMC free article] [PubMed] [Google Scholar]
- 33.Hecht SS, Chen M, Yoder A, Jensen J, Hatsukami D, Le C, Carmella SG (2005) Longitudinal study of urinary phenanthrene metabolite ratios: Effect of smoking on the diol epoxide pathway. Cancer Epidemiol. Prev. Biomark. 14, 2969–74, doi: 10.1158/1055-9965.EPI-05-0396. [DOI] [PubMed] [Google Scholar]
- 34.Gündel J, Schaller KH, Angerer J (2000) Occupational exposure to polycyclic aromatic hydrocarbons in a fireproof stone producing plant: biological monitoring of 1-hydroxypyrene, 1-, 2-, 3- and 4-hydroxyphenanthrene, 3-hydroxybenz(a)anthracene and 3-hydroxybenzo(a)pyrene. Int. Arch. Occup. Environ. Health 73, 270–4, doi: 10.1007/s004200050427. [DOI] [PubMed] [Google Scholar]
- 35.Elovaara E, Mikkola J, Mäkelä M, Paldanius B, Priha E (2006) Assessment of soil remediation workers’ exposure to polycyclic aromatic hydrocarbons (PAH): biomonitoring of naphthols, phenanthrols, and 1-hydroxypyrene in urine. Toxicol. Lett. 162, 158–63, doi: 10.1016/j.toxlet.2005.09.028. [DOI] [PubMed] [Google Scholar]
- 36.Butler JP, Post GB, Lioy PJ, Waldman JM, Greenberg A (1993) Assessment of carcinogenic risk from personal exposure to benzo(a)pyrene in the total human environmental exposure study (THEES). Air Waste 43, 970–7, doi: 10.1080/1073161x.1993.10467179. [DOI] [PubMed] [Google Scholar]
- 37.Obana H, Hori S, Kashimoto T, Kunita N (1981) Polycyclic aromatic hydrocarbons in human fat and liver. Bull. Environ. Contam. Toxicol. 27, 23–7, doi: 10.1007/BF01610981. [DOI] [PubMed] [Google Scholar]
- 38.Boysen G, Hecht SS (2003) Analysis of DNA and protein adducts of benzo[a]pyrene in human tissues using structure-specific methods. Mutat. Res. 543, 17–30, doi: 10.1016/s1383-5742(02)00068-6. [DOI] [PubMed] [Google Scholar]
- 39.Lodovici M, Akpan V, Giovannini L, Migliani F, Dolara P (1998) Benzo[a]pyrene diol-epoxide DNA adducts and levels of polycyclic aromatic hydrocarbons in autoptic samples from human lungs. Chem. Biol. Interact. 116, 199–212, doi: 10.1016/s0009-2797(98)00091-x. [DOI] [PubMed] [Google Scholar]
- 40.IPCS. Selected non-heterocyclic polycyclic aromatic hydrocarbons (EHC 202) [Monograph]. (WHO Library Cataloguing in Publication Data, 1998). [Google Scholar]
- 41.Bauer E, Guo Z, Ueng YF, Bell LC, Zeldin D, Guengerich FP (1995) Oxidation of benzo[a]pyrene by recombinant human cytochrome P450 enzymes. Chem. Res. Toxicol. 8,136–42, doi: 10.1021/tx00043a018. [DOI] [PubMed] [Google Scholar]
- 42.Cavalieri EL, Rogan EG (1995) Central role of radical cations in metabolic activation of polycyclic aromatic hydrocarbons. Xenobiotica 25, 677–88, doi: 10.3109/00498259509061885. [DOI] [PubMed] [Google Scholar]
- 43.Conney AH, Chang RL, Jerina DM, Wei S-JC (1994) Studies on the metabolism of benzo[a]pyrene and dose-dependent differences in the mutagenic profile of Its ultimate carcinogenic metabolite. Drug Metab. Rev. 26, 125–63, doi: 10.3109/03602539409029788. [DOI] [PubMed] [Google Scholar]
- 44.Kim JH, Stansbury KH, Walker NJ, Trush MA, Strickland PT, Sutter TR (1998) Metabolism of benzo[a]pyrene and benzo[a]pyrene-7,8-diol by human cytochrome P450 1B1. Carcinogenesis 19, 1847–53, doi: 10.1093/carcin/19.10.1847. [DOI] [PubMed] [Google Scholar]
- 45.Melendez-Colon VJ, Luch A, Seidel A, Baird WM (1999) Cancer initiation by polycyclic aromatic hydrocarbons results from formation of stable DNA adducts rather than apurinic sites. Carcinogenesis 20, 1885–91, doi: 10.1093/carcin/20.10.1885. [DOI] [PubMed] [Google Scholar]
- 46.Shimada T, Gillam EM Oda Y, Tsumura F, Sutter TR, Guengerich FP, Inoue K (1999) Metabolism of benzo[a]pyrene to trans-7,8-dihydroxy-7, 8-dihydrobenzo[a]pyrene by recombinant human cytochrome P450 1B1 and purified liver epoxide hydrolase. Chem. Res. Toxicol. 12, 623–9, doi: 10.1021/tx990028s. [DOI] [PubMed] [Google Scholar]
- 47.Shimada T, Gillam EM, Sutter TR, Strickland PT, Guengerich FP, Yamazaki H (19997) Oxidation of xenobiotics by recombinant human cytochrome P450 1B1. Drug Metab. Dispos. 25, 617–22, [PubMed] [Google Scholar]
- 48.Shimada T, Fujii-Kuriyama Y (2004) Metabolic activation of polycyclic aromatic hydrocarbons to carcinogens by cytochromes P450 1A1 and 1B1. Cancer Sci. 95, 1–6, doi: 10.1111/j.1349-7006.2004.tb03162.x. [DOI] [PMC free article] [PubMed] [Google Scholar]
- 49.Staal YCM, Hebels DGAJ, van Herwijnen MHM, Gottschalk RWH, van Schooten FJ, van Delft JHM (2007) Binary PAH mixtures cause additive or antagonistic effects on gene expression but synergistic effects on DNA adduct formation. Carcinogenesis 28, 2632–40, doi: 10.1093/carcin/bgm182. [DOI] [PubMed] [Google Scholar]
- 50.Staal YCM Pushparajah DS, van Herwijnen MHM, Gottschalk RWH, Maas LM, Ioannides C, van Schooten FJ, van Delft JHM (2008) Interactions between polycyclic aromatic hydrocarbons in binary mixtures: effects on gene expression and DNA adduct formation in precision-cut rat liver slices. Mutagenesis 23, 491–9, doi: 10.1093/mutage/gen041. [DOI] [PubMed] [Google Scholar]
- 51.Tarantini A, Maître A, Lefèbvre E, Marques M, Rajhi A, Douki T (2011) Polycyclic aromatic hydrocarbons in binary mixtures modulate the efficiency of benzo[a]pyrene to form DNA adducts in human cells. Toxicology 279, 36–44, doi: 10.1016/j.tox.2010.09.002. [DOI] [PubMed] [Google Scholar]
- 52.Courter LA, Luch A, Musafia-Jeknic T, Arlt VM, Fischer K, Bildfell R, Pereira C, Phillips DH, Poirier MC, Baird WM (2008) The influence of diesel exhaust on polycyclic aromatic hydrocarbon-induced DNA damage, gene expression, and tumor initiation in Sencar mice in vivo. Cancer Lett. 265, 135–47, doi: 10.1016/j.canlet.2008.02.017. [DOI] [PMC free article] [PubMed] [Google Scholar]
- 53.Siddens LK, Larkin A, Krueger SK, Bradfield CA, Waters KM, Tilton SC, Pereira CB, Löhr CV, Arlt VM, Phillips DH, Williams DE, Baird WM (2012) Polycyclic aromatic hydrocarbons as skin carcinogens: comparison of benzo[a]pyrene, dibenzo[def,p]chrysene and three environmental mixtures in the FVB/N mouse. Toxicol. Appl. Pharmacol. 264, 377–86, doi: 10.1016/j.taap.2012.08.014. [DOI] [PMC free article] [PubMed] [Google Scholar]
- 54.Haber LT, Pecquet AM, Vincent MJ, White LM (2022) The Long Goodbye: Finally moving on from the relative potency approach to a mixtures approach for polycyclic aromatic hydrocarbons (PAHs). Int. J. Environ. Res. Public Health 19, 9490, doi: 10.3390/ijerph19159490. [DOI] [PMC free article] [PubMed] [Google Scholar]
- 55.Mahadevan B, Marston CP, Luch A, Dashwood WM, Brooks E, Pereira C, Doehmer J, Baird WM (2007) Competitive inhibition of carcinogen-activating CYP1A1 and CYP1B1 enzymes by a standardized complex mixture of PAH extracted from coal tar. Int. J. Cancer 120, 1161–8, doi: 10.1002/ijc.22466. [DOI] [PubMed] [Google Scholar]
- 56.Shimada T, Guengerich FP (2006) Inhibition of human cytochrome P450 1A1-, 1A2-, and 1B1-mediated activation of procarcinogens to genotoxic metabolites by polycyclic aromatic hydrocarbons. Chem. Res. Toxicol. 19, 288–94, doi: 10.1021/tx050291v. [DOI] [PubMed] [Google Scholar]
- 57.Courter LA, Musafia-Jeknic T, Fischer K, Bildfell R, Giovanini J, Pereira C, Baird WM (2007) Urban dust particulate matter alters PAH-induced carcinogenesis by inhibition of CYP1A1 and CYP1B1. Toxicol. Sci. 95, 63–73, doi: 10.1093/toxsci/kfl137. [DOI] [PubMed] [Google Scholar]
- 58.Smith JN, Gaither KA, Pande P (2022) Competitive metabolism of polycyclic aromatic hydrocarbons (PAHs): An assessment using in vitro metabolism and physiologically based pharmacokinetic (PBPK) modeling. Int. J. Environ. Res. Public Health 19, 8266, doi: 10.3390/ijerph19148266. [DOI] [PMC free article] [PubMed] [Google Scholar]
- 59.Genies C, Jullien A, Lefebvre E, Revol M, Maitre A, Douki T (2016) Inhibition of the formation of benzo[a]pyrene adducts to DNA in A549 lung cells exposed to mixtures of polycyclic aromatic hydrocarbons. Toxicol. In Vitro 35, 1–10, doi: 10.1016/j.tiv.2016.05.006. [DOI] [PubMed] [Google Scholar]
- 60.Lampen A, Ebert B, Stumkat L, Jacob J, Seidel J (2004) Induction of gene expression of xenobiotic metabolism enzymes and ABC-transport proteins by PAH and a reconstituted PAH mixture in human Caco-2 cells. Biochim. Biophys. Acta 1681, 38–46, doi: 10.1016/j.bbaexp.2004.09.010. [DOI] [PubMed] [Google Scholar]
- 61.Mahadevan B, Keshava C, Musafia-Jeknic T, Pecaj A, Weston A, Baird WM (2005) Altered gene expression patterns in MCF-7 cells induced by the urban dust particulate complex mixture standard reference material 1649a. Cancer Res. 65,1251–8, doi: 10.1158/0008-5472.CAN-04-2357. [DOI] [PubMed] [Google Scholar]
- 62.Tilton SC, Siddens LK, Krueger SK, Larkin AJ, Löhr CV, Williams DE, Baird WM, Waters KM (2015) Mechanism-based classification of PAH mixtures to predict carcinogenic potential. Toxicol. Sci.146, 135–45, doi: 10.1093/toxsci/kfv080. [DOI] [PMC free article] [PubMed] [Google Scholar]
- 63.Stoddard EG, Nag S, Martin J, Tyrrell KJ, Gibbins T, Anderson KA, Shukla AK, Corley R, Wright AT, Smith JN (2021) Exposure to an environmental mixture of polycyclic aromatic hydrocarbons induces hepatic cytochrome P450 enzymes in mice. Chem. Res. Toxicol. 34, 2145–56, doi: 10.1021/acs.chemrestox.1c00235. [DOI] [PMC free article] [PubMed] [Google Scholar]
- 64.Chang Y, Rager JE, Tilton SC (2021) Linking coregulated gene modules with polycyclic aromatic hydrocarbon-related cancer risk in the 3D human bronchial epithelium. Chem. Res. Toxicol. 34, 1445–55, doi: 10.1021/acs.chemrestox.0c00333. [DOI] [PMC free article] [PubMed] [Google Scholar]
- 65.Enright HA, Malfatti MA, Zimmermann M, Ognibene T, Henderson P, Turteltaub KW (2016) Use of accelerator mass spectrometry in human health and molecular toxicology. Chem. Res. Toxicol. 29, 1976–86, doi: 10.1021/acs.chemrestox.6b00234. [DOI] [PMC free article] [PubMed] [Google Scholar]
- 66.Ognibene TJ, Haack KW, Bench G, Turteltaub KW (2019) Trials and tribulations in the first three years in operation of the SSAMS for biomedical 14C-AMS at LLNL. Nucl. Instrum. Methods Phys. Res. B. 438, 166–71, doi: 10.1016/j.nimb.2018.05.008. [DOI] [PMC free article] [PubMed] [Google Scholar]
- 67.Madeen E, Corley RA, Crowell S, Turteltaub K, Ognibene T, Malfatti M, McQuistan TJ, Garrard M, Sudakin D, Williams DE. (2015) Human in vivo pharmacokinetics of [(14)C]dibenzo[def,p]chrysene by accelerator mass spectrometry following oral microdosing. Chem. Res. Toxicol. 28, 126–34, doi: 10.1021/tx5003996. [DOI] [PMC free article] [PubMed] [Google Scholar]
- 68.Turteltaub KW, Dingley KH, Curtis KD, Malfatti MA, Turesky RJ, Garner RC, Felton JS, Lang NP (1999) Macromolecular adduct formation and metabolism of heterocyclic amines in humans and rodents at low doses. Cancer Lett. 43,149–55, doi: 10.1016/s0304-3835(99)00116-0. [DOI] [PubMed] [Google Scholar]
- 69.Jubert C, Mata J, Bench G, Dashwood R, Pereira C, Tracewell W, Turteltaub K, Williams D, Bailey G (2009) Effects of chlorophyll and chlorophyllin on low-dose aflatoxin B(1) pharmacokinetics in human volunteers. Cancer Prev. Res. 2, 1015–22, doi: 10.1158/1940-6207.CAPR-09-0099. [DOI] [PMC free article] [PubMed] [Google Scholar]
- 70.Ognibene TJ Thomas AT, Daley PF, Bench G, Turteltaub KW (2015) An interface for the direct coupling of small liquid samples to AMS. Nucl. Instrum. Methods Phys. Res. B. 361, 173–7, doi: 10.1016/j.nimb.2015.05.018. [DOI] [PMC free article] [PubMed] [Google Scholar]
- 71.Madeen E, Siddens LK, Uesugi S, McQuistan T, Corley RA, Smith J, Waters KM, Tilton SC, Anderson KA, Ognibene T, Turteltaub K, Williams DE (2019) Toxicokinetics of benzo[a]pyrene in humans: extensive metabolism as determined by UPLC-accelerator mass spectrometry following oral micro-dosing. Toxicol. Appl. Pharmacol. 364, 97–105, doi: 10.1016/j.taap.2018.12.010. [DOI] [PMC free article] [PubMed] [Google Scholar]
- 72.Maier MLV, Siddens LK, Pennington JM, Uesugi SL, Anderson KA, Tidwell LG, Tilton SC, Ognibene TJ, Turteltaub KW, Smith JN, Williams DE (2022) Benzo[a]pyrene (BaP) metabolites predominant in human plasma following escalating oral micro-dosing with [14C]-BaP. Environ. Int 159,107045, doi: 10.1016/j.envint.2021.107045. [DOI] [PMC free article] [PubMed] [Google Scholar]
- 73.Anderson KA, Szelewskib MJ, Wilson G, Quimbyb BD, Hoffman PD (2015) Modified ion source triple quadrupole mass spectrometer gas chromatograph for polycyclic aromatic hydrocarbon analyses. J. Chromatography A 1419, 89–98, doi: 10.1016/j.chroma.2015.09.054. [DOI] [PMC free article] [PubMed] [Google Scholar]
- 74.Hummel JM, Madeen EP, Siddens LK, Uesugi SL, McQuistan T, Anderson KA, Turteltaub KW, Ognibene TJ, Bench G, Krueger SK, Harris S, Smith J, Tilton SC, Baird WM, Williams DE (2018) Pharmacokinetics of [14C]-benzo[a]pyrene (BaP) in humans: Impact of co-administration of smoked salmon and BaP dietary restriction. Fd. Chem. Toxicol. 115, 136–47, doi: 10.1016/j.fct.2018.03.003. [DOI] [PMC free article] [PubMed] [Google Scholar]
- 75.Crowell SR, Amin SG, Anderson KA, Krishnegowda G, Sharma AK, Soelberg JJ, Williams DE, Corley RA (2011) Preliminary physiologically based pharmacokinetic models for benzo[a]pyrene and dibenzo[def,p]chrysene in rodents. Toxicol. Appl. Pharmacol. 257, 365–76, doi: 10.1016/j.taap.2011.09.020. [DOI] [PMC free article] [PubMed] [Google Scholar]
- 76.Thomas AT, Ognibene T, Daley P, Turteltaub K, Radousky H, Bench G (2011) Ultrahigh efficiency moving wire combustion interface for online coupling of high-performance liquid chromatography (HPLC). Anal. Chem. 83, 9413–7, doi: 10.1021/ac202013s. [DOI] [PMC free article] [PubMed] [Google Scholar]
- 77.Keck BD, Ognibene T, Vogel JS (2010) Analytical validation of accelerator mass spectrometry for pharmaceutical development. Bioanalysis 2, 469–85, doi: 10.4155/bio.10.14. [DOI] [PMC free article] [PubMed] [Google Scholar]
- 78.Salehpour M, Possnert G, Bryhni H (2008) Subattomole sensitivity in biological accelerator mass spectrometry. Anal. Chem. 80, 3515–21, doi: 10.1021/ac800174j. [DOI] [PubMed] [Google Scholar]
- 79.FDA, 1995. International conference on harmonization; guideline on validation of analytical procedures: definitions and terminology; availability. Fed. Regist. https://www.federalregister.gov/documents/1995/03/01/95-4956/international-conference-on-harmonisation-guideline-on-validation-of-analytical-procedures, (accessed 12.28.22). [Google Scholar]
- 80.Gibaldi M and Perrier D, 1982. Pharmacokinetics, M. Dekker, New York. [Google Scholar]
- 81.Bates D, Maechler M, Bolker B, Walker S (2015) Fitting linear mixed-effects models using lme4. J. Stat. Software 67, 1–48, doi: 10.18637/jss.v067.i01. [DOI] [Google Scholar]
- 82.Jakszyn P, Agudo A, Ibáñez R, García-Closas R, Pera G, Amiano P, González CA (2004) Development of a food database of nitrosamines, heterocyclic amines, and polycyclic aromatic hydrocarbons. J. Nutr. 134, 2011–4, doi: 10.1093/jn/134.8.2011. [DOI] [PubMed] [Google Scholar]
- 83.European Commission Scientific Committee on Food (2002) Opinion of the Scientific Committee on Food on the risks to human health of polycyclic aromatic hydrocarbons in food. SCF/CS/CNTM/PAH/29/Final. [Google Scholar]
- 84.European Food Safety Authority (2008) Scientific opinion of the panel on contaminants in the food chain on a request from the European commission on polycyclic aromatic hydrocarbons in food. Eur. Fd. Saf. Auth. J. 724, 1–114. [Google Scholar]
- 85.JEFCA (Joint FAO/WHO Expert Committee on Food Additives) (2005) Sixty-fourth Meeting (JECFA/64/SC), Rome, https://www.fao.org/documents/card/en/c/f95956a6-c4ac-4843-bd48-b6a1fbe3afac/, (accessed 12.28.22). [Google Scholar]
- 86.Messier KP, Tidwell LG, Ghetu CC, Rohlman D, Scott RP, Bramer LM, Dixon HM, Waters KM, Anderson KA (2019) Indoor versus outdoor air quality during wildfires. Environ. Sci. Technol. Lett 6, 696–701, doi: 10.1021/acs.estlett.9b00599. [DOI] [PMC free article] [PubMed] [Google Scholar]
- 87.Ghetu CC, Rohlman D, Smith BW, Scott RP, Adams KA, Hoffman PD, Anderson KA (2022) Wildfire impact on indoor and outdoor PAH air quality. Environ. Sci. Technol. 56,10042–52, doi: 10.1021/acs.est.2c00619. [DOI] [PMC free article] [PubMed] [Google Scholar]
- 88.Navarro KM, Cisneros R, Noth EM, Balmes JR, Hammond SK (2017) Occupational exposure to polycyclic aromatic hydrocarbon of wildland firefighters at prescribed and wildland fires. Environ. Sci. Technol. 51, 6461–9, doi: 10.1021/acs.est.7b00950. [DOI] [PubMed] [Google Scholar]
- 89.Milena Simões Peixoto MS, da Silva Junior FC, de Oliveira Galvão MF, Roubicek DA, de Oliveira Alves N, de Medeiros SRB (2019) Oxidative stress, mutagenic effects, and cell death induced by retene. Chemosphere 231, 518–27, doi: 10.1016/j.chemosphere.2019.05.123. [DOI] [PubMed] [Google Scholar]
- 90.Huang M, Mesaros C, Hackfeld LC, Hodge RP, Zang T, Blair IA, Penning TM. (2017) Potential metabolic activation of a representative C4-alkylated polycyclic aromatic hydrocarbon retene (1-methyl-7-isopropyl-phenanthrene) associated with the Deepwater Horizon oil spill in human hepatoma (HepG2) cells. Chem. Res. Toxicol. 30, 1093–1101, doi: 10.1021/acs.chemrestox.6b00457. [DOI] [PMC free article] [PubMed] [Google Scholar]
- 91.Scott JA, Incardona JP, Pelkki K, Shepardson S, Hodson PV (2011) AhR2-mediated, CYP1A-independent cardiovascular toxicity in zebrafish (Danio rerio) embryos exposed to retene. Aquat. Toxicol. 101, 165–74, doi: 10.1016/j.aquatox.2010.09.016. [DOI] [PubMed] [Google Scholar]
- 92.Shankar P, Garcia GR, La Du JK, Sullivan CM, Dunham CL, Goodale BC, Waters KM, Stanisheuski S, Maier CS, Thunga P, Reif DM, Tanguay RL (2022) The Ahr2-dependent wfikkn1 gene influences zebrafish transcriptome, proteome, and behavior. Toxicol. Sci. 187, 325–44, doi: 10.1093/toxsci/kfac037. [DOI] [PMC free article] [PubMed] [Google Scholar]
- 93.Wilson LB, McClure RS, Waters KM, Simonich MT, Tanguay RL (2022) Concentration-response gene expression analysis in zebrafish reveals phenotypically-anchored transcriptional responses to retene. Front. Toxicol. 4, 950503, doi: 10.3389/ftox.2022.950503. [DOI] [PMC free article] [PubMed] [Google Scholar]
- 94.Maier MLV, Siddens LK, Pennington JM, Uesugi SL, Tilton SC, Vertel EA, Ognibene TJ, Turteltaub KW, Smith JN and Williams DE (2023) Benzo[a]pyrene toxicokinetics in humans following dietary supplementation with 3,3’-diindolylmethane (DIM) or brussels sprouts. Toxicol. Appl. Pharmacol.doi: 10.1016/j.taap.2023.11637 [DOI] [PMC free article] [PubMed] [Google Scholar]
- 95.Uppstad H, Øvrebø S, Haugen A, Mollerup S (2010) Importance of CYP1A1 and CYP1B1 in bioactivation of benzo[a]pyrene in human lung cell lines. Toxicol. Lett. 192, 221–8, doi: 10.1016/j.toxlet.2009.10.025. [DOI] [PubMed] [Google Scholar]
Associated Data
This section collects any data citations, data availability statements, or supplementary materials included in this article.