Abstract
Imaging mass spectrometry (IMS) provides untargeted, highly multiplexed maps of molecular distributions in tissue. Ion images are routinely presented as heatmaps and can be overlaid onto complementary microscopy images that provide greater context. However, heatmaps use transparency blending to visualize both images, obscuring subtle quantitative differences and distribution gradients. Here, we developed a contour mapping approach that combines information from IMS ion intensity distributions with that of stained microscopy. As a case study, we applied this approach to imaging data from Staphylococcus aureus-infected murine kidney. In a univariate, or single molecular species, use-case of the contour map representation of IMS data, certain lipids colocalizing with regions of infection were selected using Pearson’s correlation coefficient. Contour maps of these lipids overlaid with stained microscopy showed enhanced visualization of lipid distributions and spatial gradients in and around the bacterial abscess as compared to traditional heatmaps. The full IMS data set comprising hundreds of individual ion images was then grouped into a smaller subset of representative patterns using non-negative matrix factorization (NMF). Contour maps of these multivariate NMF images revealed distinct molecular profiles of the major abscesses and surrounding immune response. This contour mapping workflow also enabled a molecular visualization of the transition zone at the host–pathogen interface, providing potential clues about the spatial molecular dynamics beyond what histological staining alone provides. In summary, we developed a new IMS-based contour mapping approach to augment classical stained microscopy images, providing an enhanced and more interpretable visualization of IMS-microscopy multimodal molecular imaging data sets.
Graphical Abstract
INTRODUCTION
Matrix assisted laser desorption/ionization (MALDI) imaging mass spectrometry (IMS)1 enables label-free analysis of hundreds to thousands of chemical species (proteins, metabolites, lipids, and others) within a tissue section in a single experiment.1–5 However, interpretation of the molecular images can be challenging.6 Often, to aid human interpretation, these molecular images must be contextualized by other well-characterized and established microscopy modalities, such as histological stains or immunohistochemistry.7
Experiments that combine MALDI IMS and microscopy have become routine, and most IMS software, open-source or commercial, have support for simultaneous visualization of microscopy and IMS images. For multimodal molecular imaging, the goal is both spatial co-registration and computational integration of the modalities. Advanced machine learning (ML) methods have been developed to mathematically integrate the observations in IMS measurements with the observations reported by microscopy into a combined form.8,9 However, for studies including human interpretation by domain experts, it is important to provide an easily understood visual representation that does not compromise the interpretability of either modality. This simplifies interpretation but still allows the content of the source modalities to be viewed separately. Viewing the original microscopy content, textures, and coloring can be important for domain experts’ interpretation.
Ion images are often presented side-by-side or overlaid with microscopy images by co-registering and adjusting the opacity of each. Although using transparencies to visualize both images offers qualitative insight, novel visualizations that make molecular differences clearer or depictions tailored toward particular applications can be valuable. In this work, we are particularly interested in making high-dimensional multimodal IMS and microscopy data easier to interpret and more clearly delineating important spatial areas of molecular change, making their correspondence to specific microscopic areas more accessible for domain experts.
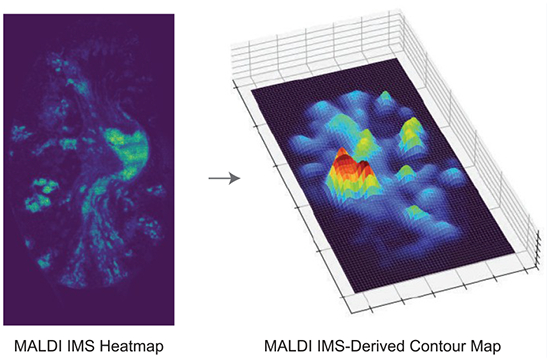
We address this by developing a contour mapping approach that combines the untargeted molecular information from IMS with biologically informative microscopy. Contour maps have historically been used in geography to depict land structures and elevations. In these maps, the proximity of the contour lines represents the change in altitude, allowing the viewer to visualize in a two-dimensional space the localized height of geographical objects such as mountains, as well as the degree of altitude change across space. Within the biomedical community, contour maps have been used to visualize EEG brain activity10 and to project computational Mueller matrix mapping results onto histological samples.11 We introduce the application of contour maps to depict changes in ion intensity. As a case study, we highlight the molecular landscape of Staphylococcus aureus-infected murine kidney tissue. A hallmark of S. aureus infection is the formation of abscesses in soft tissues, which are localized regions of bacterial communities separated from surrounding host tissue containing layers of necrotic and healthy innate immune cells.12 These abscesses often look identical to one another under histopathological staining, yet still exhibit heterogeneous molecular signatures.12–15 Combining the spatially resolved molecular information from IMS measurements with the pathology information provided by stained microscopy has helped reveal changes in molecular distributions across the abscess that would otherwise remain difficult to discern.
METHODS/EXPERIMENTAL SECTION
Ethics Statement.
All animal experiments under protocol M1900043 were reviewed and approved by the Institutional Animal Care and Use Committee of Vanderbilt University. Procedures were performed according to the institutional policies, Animal Welfare Act, NIH guidelines, and American Veterinary Medical Association guidelines on euthanasia.
Murine Model of Systemic S. aureus Infection.
Six- to eight-week-old female mice were anesthetized with tribromoethanol (Avertin) and retro-orbitally infected with ~(1.5–2) × 107 CFUs of S. aureus USA300 LAC constitutively expressing sfGFP from the genome (PsarA-sfGFP integrated at the SaPI1 site). Infection was allowed to progress for 7 days, the animal was humanely euthanized, and the kidney was removed for molecular studies.
MALDI Imaging Mass Spectrometry Sample Preparation and Data Acquisition.
A 10 μm cryosection of the frozen infected murine kidney was thaw-mounted on a conductive indium-tin-oxide (ITO)-coated slide, and 1,5-diaminonapthalene was sprayed using an automated pneumatic TM sprayer from HTX Technologies.16 Images were acquired in positive ionization mode at 10 μm raster size using a Bruker Daltonics timsToF with beam-scanning mode turned off.17 After MALDI IMS was acquired, the tissue section was scanned using autofluorescence (AF) microscopy with the matrix present on the tissue section to reveal laser ablation marks of the MALDI IMS to drive the IMS-microscopy image registration.18
Microscopy Data Acquisition.
AF microscopy was performed before and after MALDI IMS. The AF images were captured using DAPI (ex 335–383, em 420–470), GFP (ex 450–490, em 500–550), and DsRed (ex 538–562, em 570–640) filters on a Zeiss AxioScan.Z1 equipped with a Zeiss HXP 120 V fluorescent metal halide lamp. A 10× Plan-Apochromat (NA = 0.45) objective was used, resulting in a pixel side size of 0.65 μm/px when combined with a Hamamatsu ORCA flash monochromatic camera. Exposure times were 180, 142, and 242 ms for the DAPI, GFP, and DsRed filters, respectively. Following this image acquisition, the slide was stained using a periodic acid-Schiff (PAS) stain according to existing protocols for human kidney tissue.19 PAS-stained tissue sections were scanned using the Zeiss AxioScan.Z1 slide scanner using a Plan-Aprochomat 20× (NA = 0.8) objective with a Hitachi HV-F202SCL RGB camera for an effective pixel size of 0.22 μm/px.
Microscopy/MALDI IMS Image Registration.
Microscopy and MALDI IMS data were registered in two steps. In the first step, laser ablation marks captured by the post-IMS AF image were registered to MALDI IMS pixels using IMS MicroLink20 by manually selecting corresponding pairs of laser ablation marks and IMS pixels. After directly mapping pixels to laser ablation marks in the microscopy pixel space, PAS and pre-MALDI AF microscopy images were registered to the IMS data via the previously registered post-IMS AF image in the wsireg21 software.
Data Analysis.
The registered PAS whole slide image (WSI) was imported into QuPath,22 and the kidney and infection regions were annotated by a board-certified veterinary pathologist. The remainder of the analysis was performed in Python version 3.7 and napari.23 Pathology annotations were exported from QuPath using the GeoJSON standard and imported into Python, along with IMS data (TIC normalized using a 5–95% normalization). Preliminary lipid identifications (Table S1) were made on the basis of high mass accuracy and matching to LIPIDMAPS lipidomics gateway using a ppm threshold of <5 ppm (lipidmaps.org).24,25 The adrenal gland was excluded from the analysis because the molecular species within this organ were vastly different from that of the kidney, with the potential of introducing extensive variation that could skew the analysis.
A pixelwise Pearson correlation analysis was performed on the normalized intensity data and pathology annotations to distinguish ions highly correlating with each region of interest and to generate corresponding ion images. A Gaussian blur from the scikit image26 library was applied (σ = 2.0, truncate = 3.5) to the ion images to attenuate single-pixel variations and to emphasize multipixel variational patterns. Contour maps were generated from these smoothed images using the Matplotlib27 library (levels = 10, all other hyper-parameters were set to the default). Non-negative matrix factorization (NMF) using scikit learn’s NMF implementation was applied to the full IMS data set.28 To determine the optimal n number of components, a range of n values from 1 to 100 were tested using reconstruction error as a performance metric. The reconstruction error within this implementation is the Frobenius norm29 of the matrix difference between the training data and reconstructed data from the fitted model. Upon determining the optimal n value to be 13, where the number of components and reconstruction error were both minimized (Figure S3), the NMF algorithm was deployed onto the full IMS data set and a result with 13 components was generated. A similar Gaussian blur (σ = 2.0, truncate = 3.5) and contour map method (levels = 10) was applied to the spatial signatures of these NMF components, generating contour maps. Output images were exported in the pyramidal OME-TIFF format for visualization in napari23 alongside MALDI IMS and contour maps.
RESULTS
Elucidating the molecular changes in and around the staphylococcal abscess is critical to understanding how S. aureus proliferates and persists within host tissue and withstanding both host defenses and antibiotic drug treatments. For this case study, a mouse was inoculated with a fluorescently labeled strain of S. aureus, the animal was euthanized, and its kidney was excised for analysis using the histological stain PAS, MALDI IMS, and AF (in the order pre-MALDI AF, MALDI IMS, post-MALDI AF, and PAS). We identified one major abscess and smaller satellite infections throughout the kidney (Figure 1A,B). A board-certified veterinary pathologist annotated regions of the kidney (renal pelvis, medulla, and cortex) and the adrenal gland, as well as the primary abscess and inflammatory cell infiltrate, noting that there were freeze artifacts throughout the sections (Figures 1C and 2A).
Figure 1.
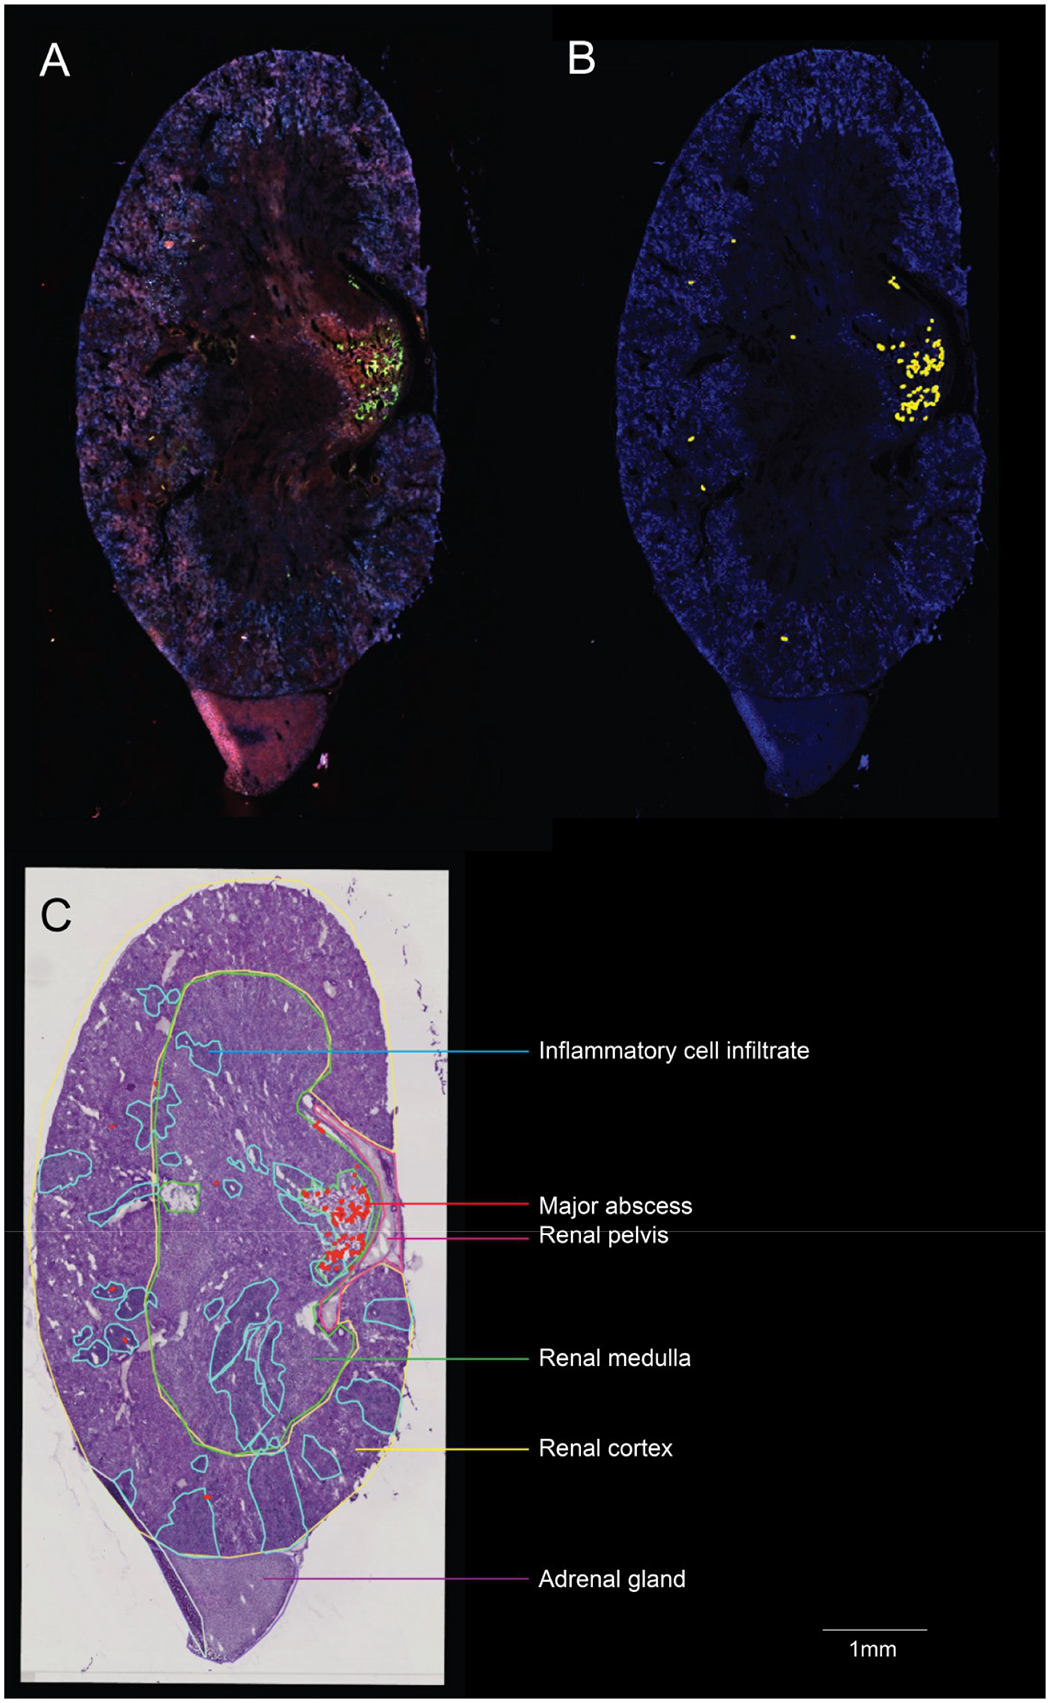
Annotated murine kidney. (A) Autofluorescence microscopy image of a murine kidney. Fluorescently labeled S. aureus can be seen by the green fluorescence. (B) QuPath software was used to perform threshold-based segmentation of fluorescently labeled S. aureus, shown in yellow. (C) Pathologist-annotated regions of the kidney (renal pelvis, renal medulla, renal cortex, adrenal gland) and regions pertaining to infection (inflammatory cell infiltrate, major abscess).
Figure 2.
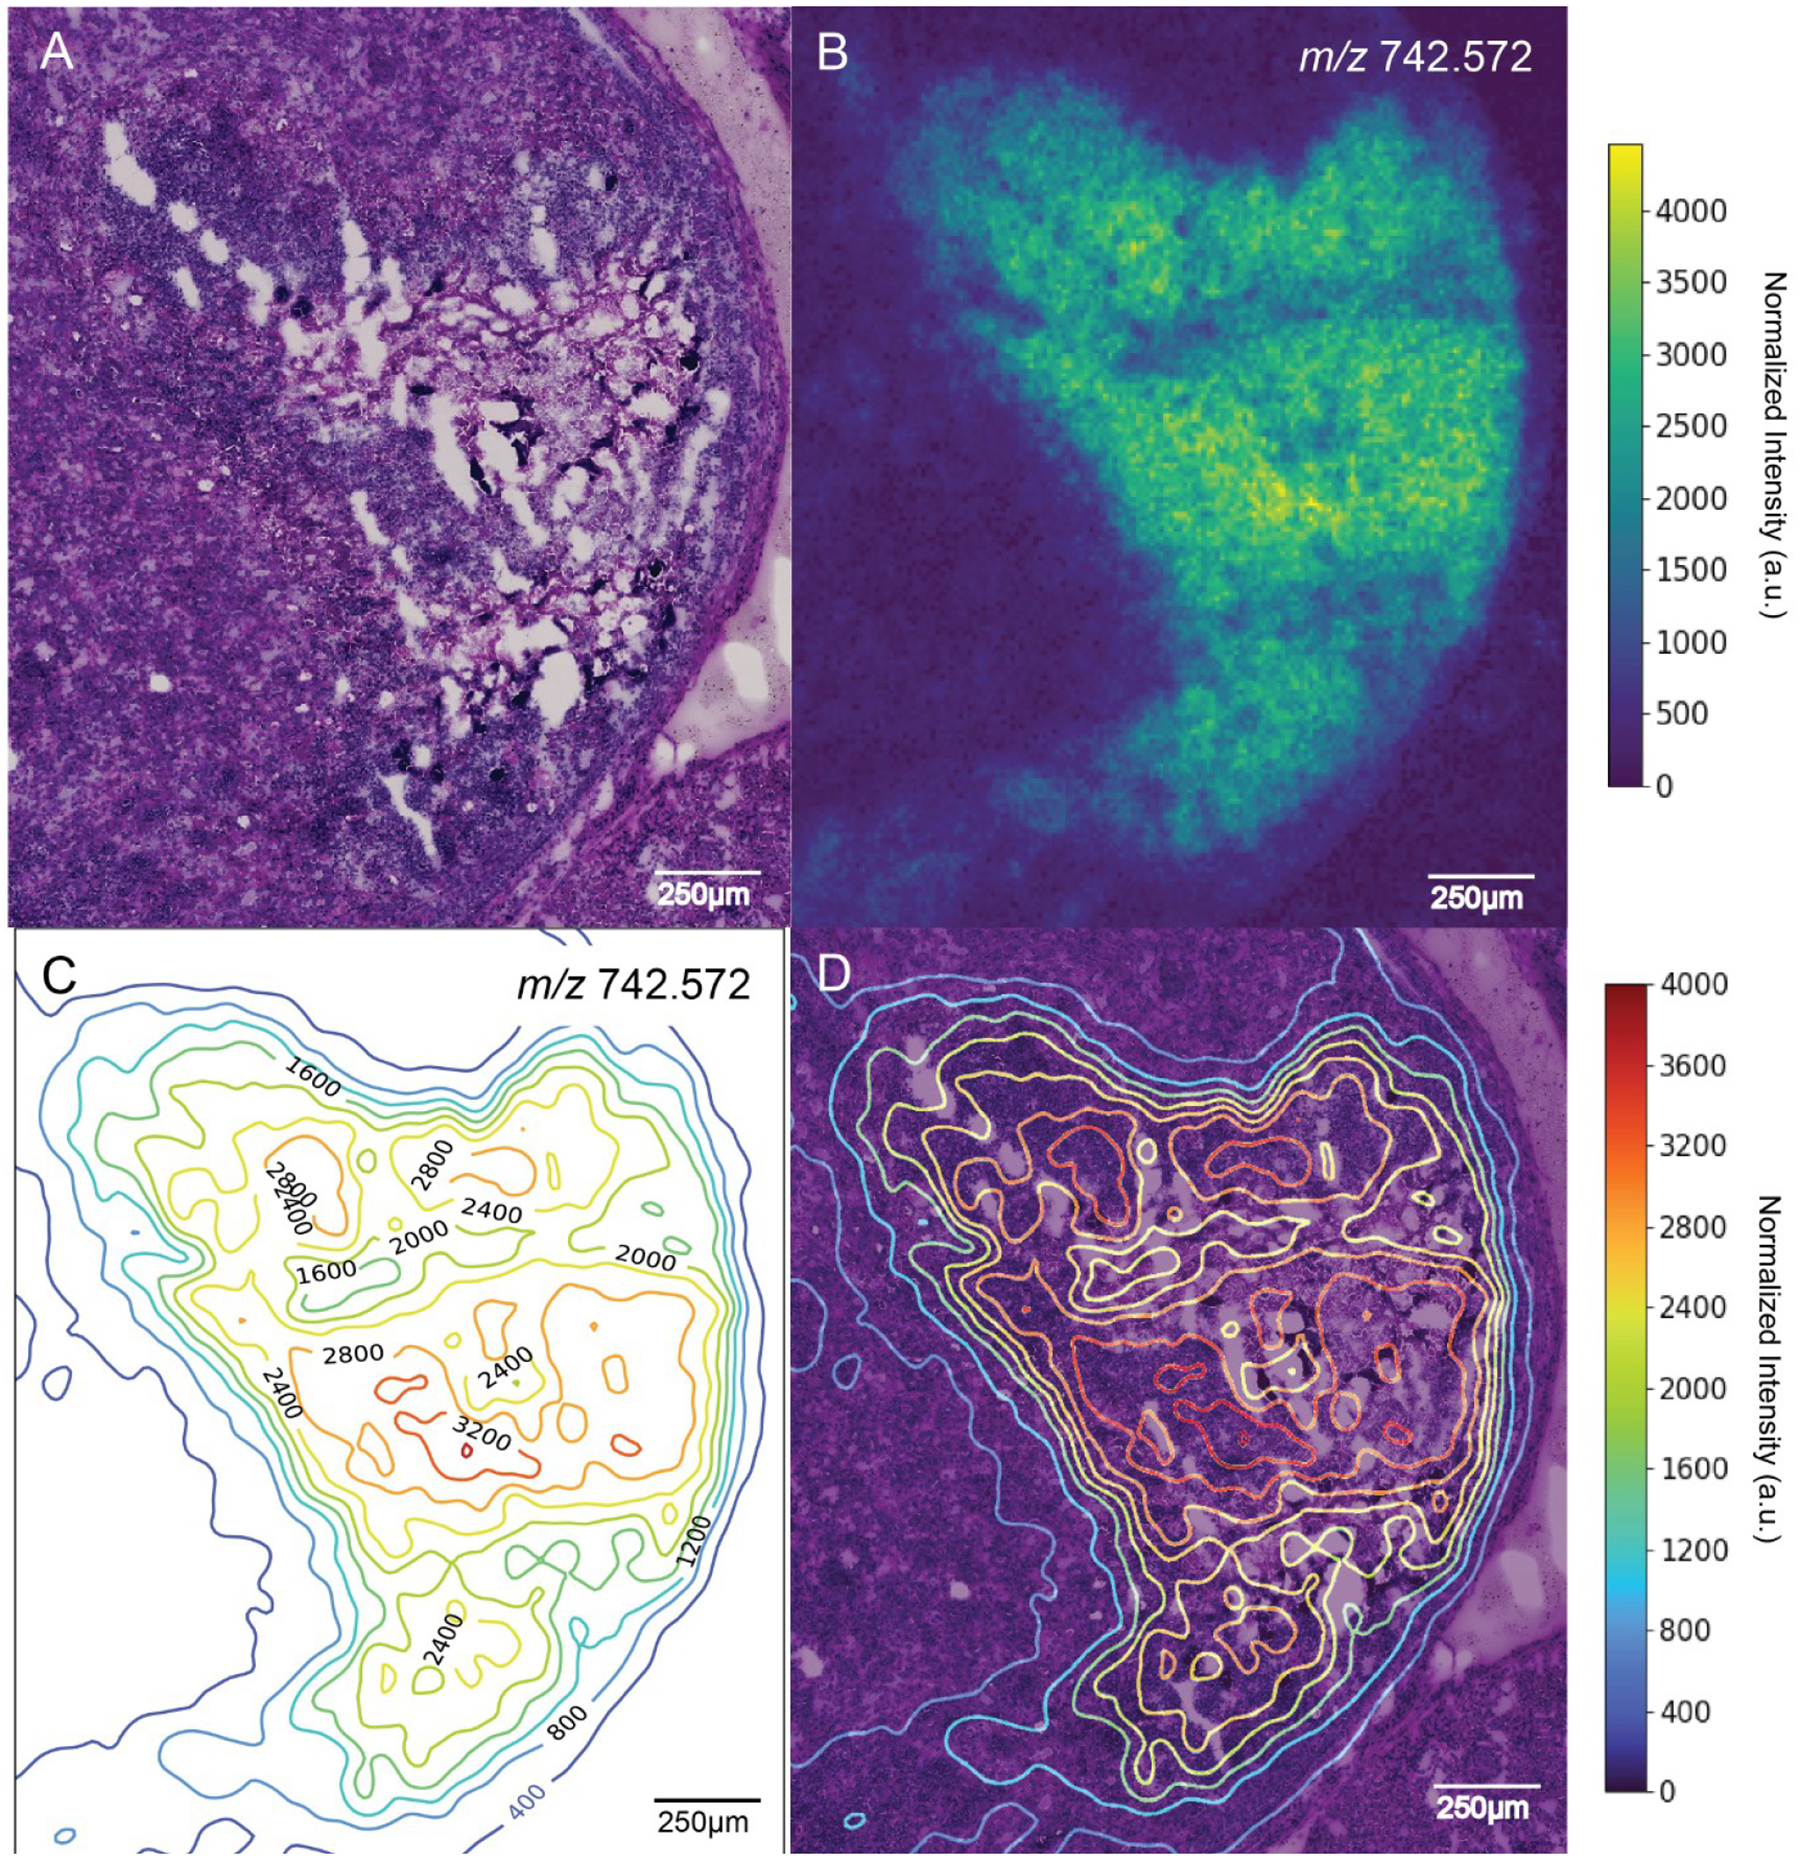
Contour map of a single MALDI IMS ion image correlating to a staphylococcal abscess. (A) Periodic acid-Schiff (PAS) stain of an S. aureus abscess within the renal cortex of a murine kidney. White areas in the tissue show freeze artifacts resulting from tears. (B) Image of [PC(O-32:0) + Na]+ (m/z 742.572, −0.09 ppm) that was found to colocalize with regions of staphylococcal infection based on a pixelwise Pearson correlation analysis. (C) Contour map generated using the ion image for [PC(O-32:0) + Na]+, with contours labeled by m/z intensity values. (D) Contour map overlaid with PAS.
Univariate Contour Maps.
We used the annotations provided on PAS microscopy and the IMS-PAS co-registration obtained through AF microscopy to transfer annotation labels to the IMS data and calculated a pixelwise Pearson correlation coefficient between each discernible lipid in the IMS data and each major annotated tissue structure. This allowed us to recognize ions colocalizing to each of the annotated tissue structure types (Figure S1). As an example to demonstrate the contour mapping method, m/z 742.572 ([PC(O-32:0) + Na]+, −0.09 ppm) was found to colocalize with bacterial colonies and the major abscess (Figures 2B and S2).
We generated contour maps from the IMS ion images, setting the contour levels manually at “10”, providing an approximate value for the relative ion intensity at any given location within the tissue (Figure 2C). The choice of contour levels is a hyperparameter to be set by the user in this type of visualization, with an appropriate value largely dictated by the localized density of isolines for a particular data set. These contour lines were then overlaid with PAS (Figure 2D). Tissue areas dense in contours exhibit rapid rates of ion intensity change, and areas sparsely populated with contour lines report little ion intensity change. In this example, the visualization plot combining microscopy as a color image and IMS as an overlaid contour plot reports the molecular changes for a specific ion across the primary abscess, m/z 742.572 ([PC(O-32:0) + Na]+).
Multivariate Contour Maps.
In cases without prior information about important molecular species, manual inspection of each ion image from an experiment is not practical. It is usually more efficient to search for multivariate trends that describe spatial and spectral variations from multiple colocalized molecular species. Similar to how the spatial distribution of a single ion (i.e., an ion image) can be represented as a contour plot, the spatial distribution of a multi-ion trend in the tissue (e.g., a component image, a cluster image, etc.) can be depicted as a multivariate contour plot.
Computational approaches allow us to take the hundreds of ion images and process them using unsupervised methods that reduce the dimensionality of the IMS data, generating a subset of images that summarize molecular trends and spatial and/or spectral correlations.30–32 In this work, NMF was selected to go beyond single molecular species (or single m/z) images and to expand toward multivariate (or molecular panel) views into the molecular content of tissue.28,33,34 NMF is well-suited for mass spectrometry data, as compared to other dimensionality reduction methods such as PCA. Not only are the original mass spectrometry measurements in the non-negative domain, but NMF is also easier to interpret and more intuitive.33,35 NMF reveals a subset of underlying spatial and molecular patterns in the IMS data such that the empirically measured mass spectra and pixels are considered linear combinations of those underlying patterns. Such patterns or “components” consist of a pseudospectrum, showing which molecular species along the m/z axis tend to appear in the same locations, and a spatial distribution, which tells us where in the tissue those molecular species appear.
We performed NMF on the MALDI IMS, first determining the number of components within the data (Figure S3) and then constructing contour maps of them to aid interpretation. A few of the resultant components correlated with the renal medulla (Figure 3A) and renal cortex (Figure 3B) as well as regions of the infection (Figure 3C,D). Of the 13 total NMF components (Figure S4), NMF component 5 was found to correlate with the inflammation region surrounding the abscess (Figure 4A,C), revealing key differences between the molecular composition of the inflammation and abscess. Conversely, NMF component 6 correlated with the major abscess (Figure 4B,D), revealing not only the spatially resolved molecular morphology of the abscess but also the key areas of interest within the abscess based on the IMS data. The top left region of the infection had a stronger molecular signal than the rest of the abscess, indicated by the red lines showing higher intensity. We also observed two additional areas of high intensity, one toward the center of the abscess and one toward the bottom. Studying these two components in the form of contour maps allowed for better visualization of the transition zone at the interface between the abscess and normal tissue regions. The transition zone was observed to be much narrower toward the top and right sides of the abscess than the left, evidenced by the increased proximity of contour lines toward the right. The average spectra corresponding to each component further revealed distinct molecular profiles for the surrounding inflammation and bacterial abscess (Figure 4E).
Figure 3.
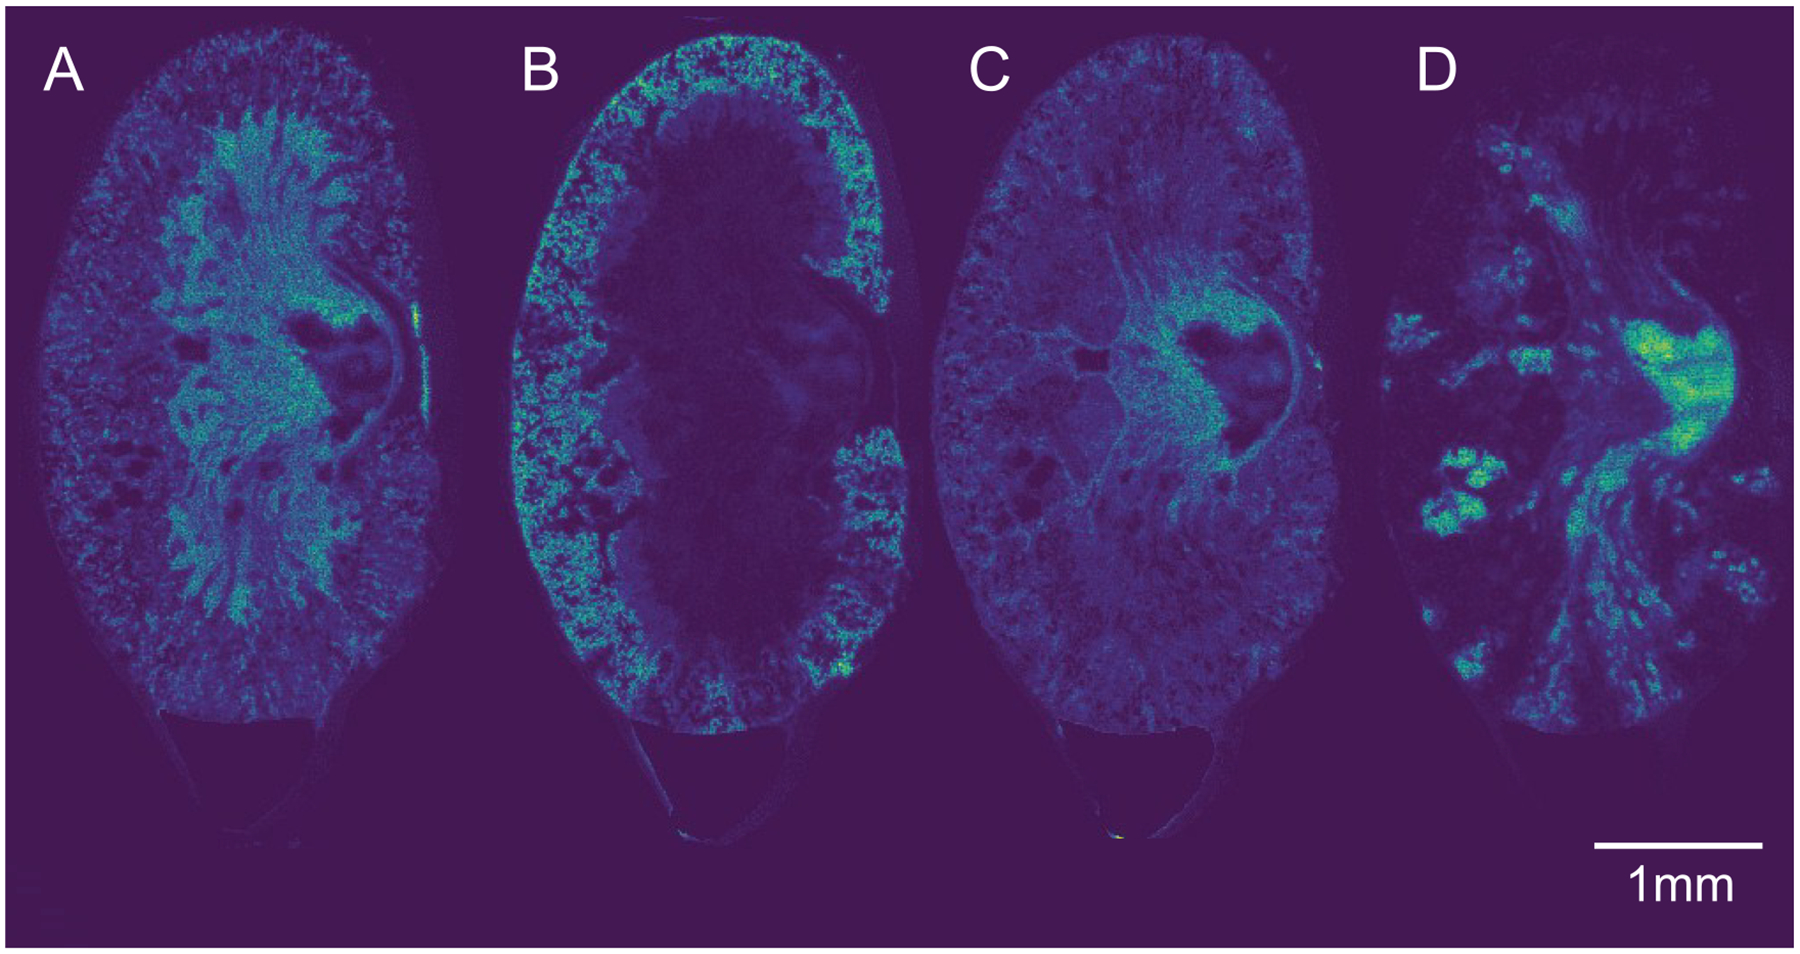
NMF components of IMS data. Non-negative matrix factorization (NMF) was performed on the IMS data, and each of the resultant components were visualized as heat maps. (A) NMF component corresponding with the renal medulla. (B) NMF component corresponding to the renal cortex. (C) NMF component corresponding to the inflammation surrounding the major abscess. (D) NMF component corresponding to the inflammatory cell infiltrate.
Figure 4.
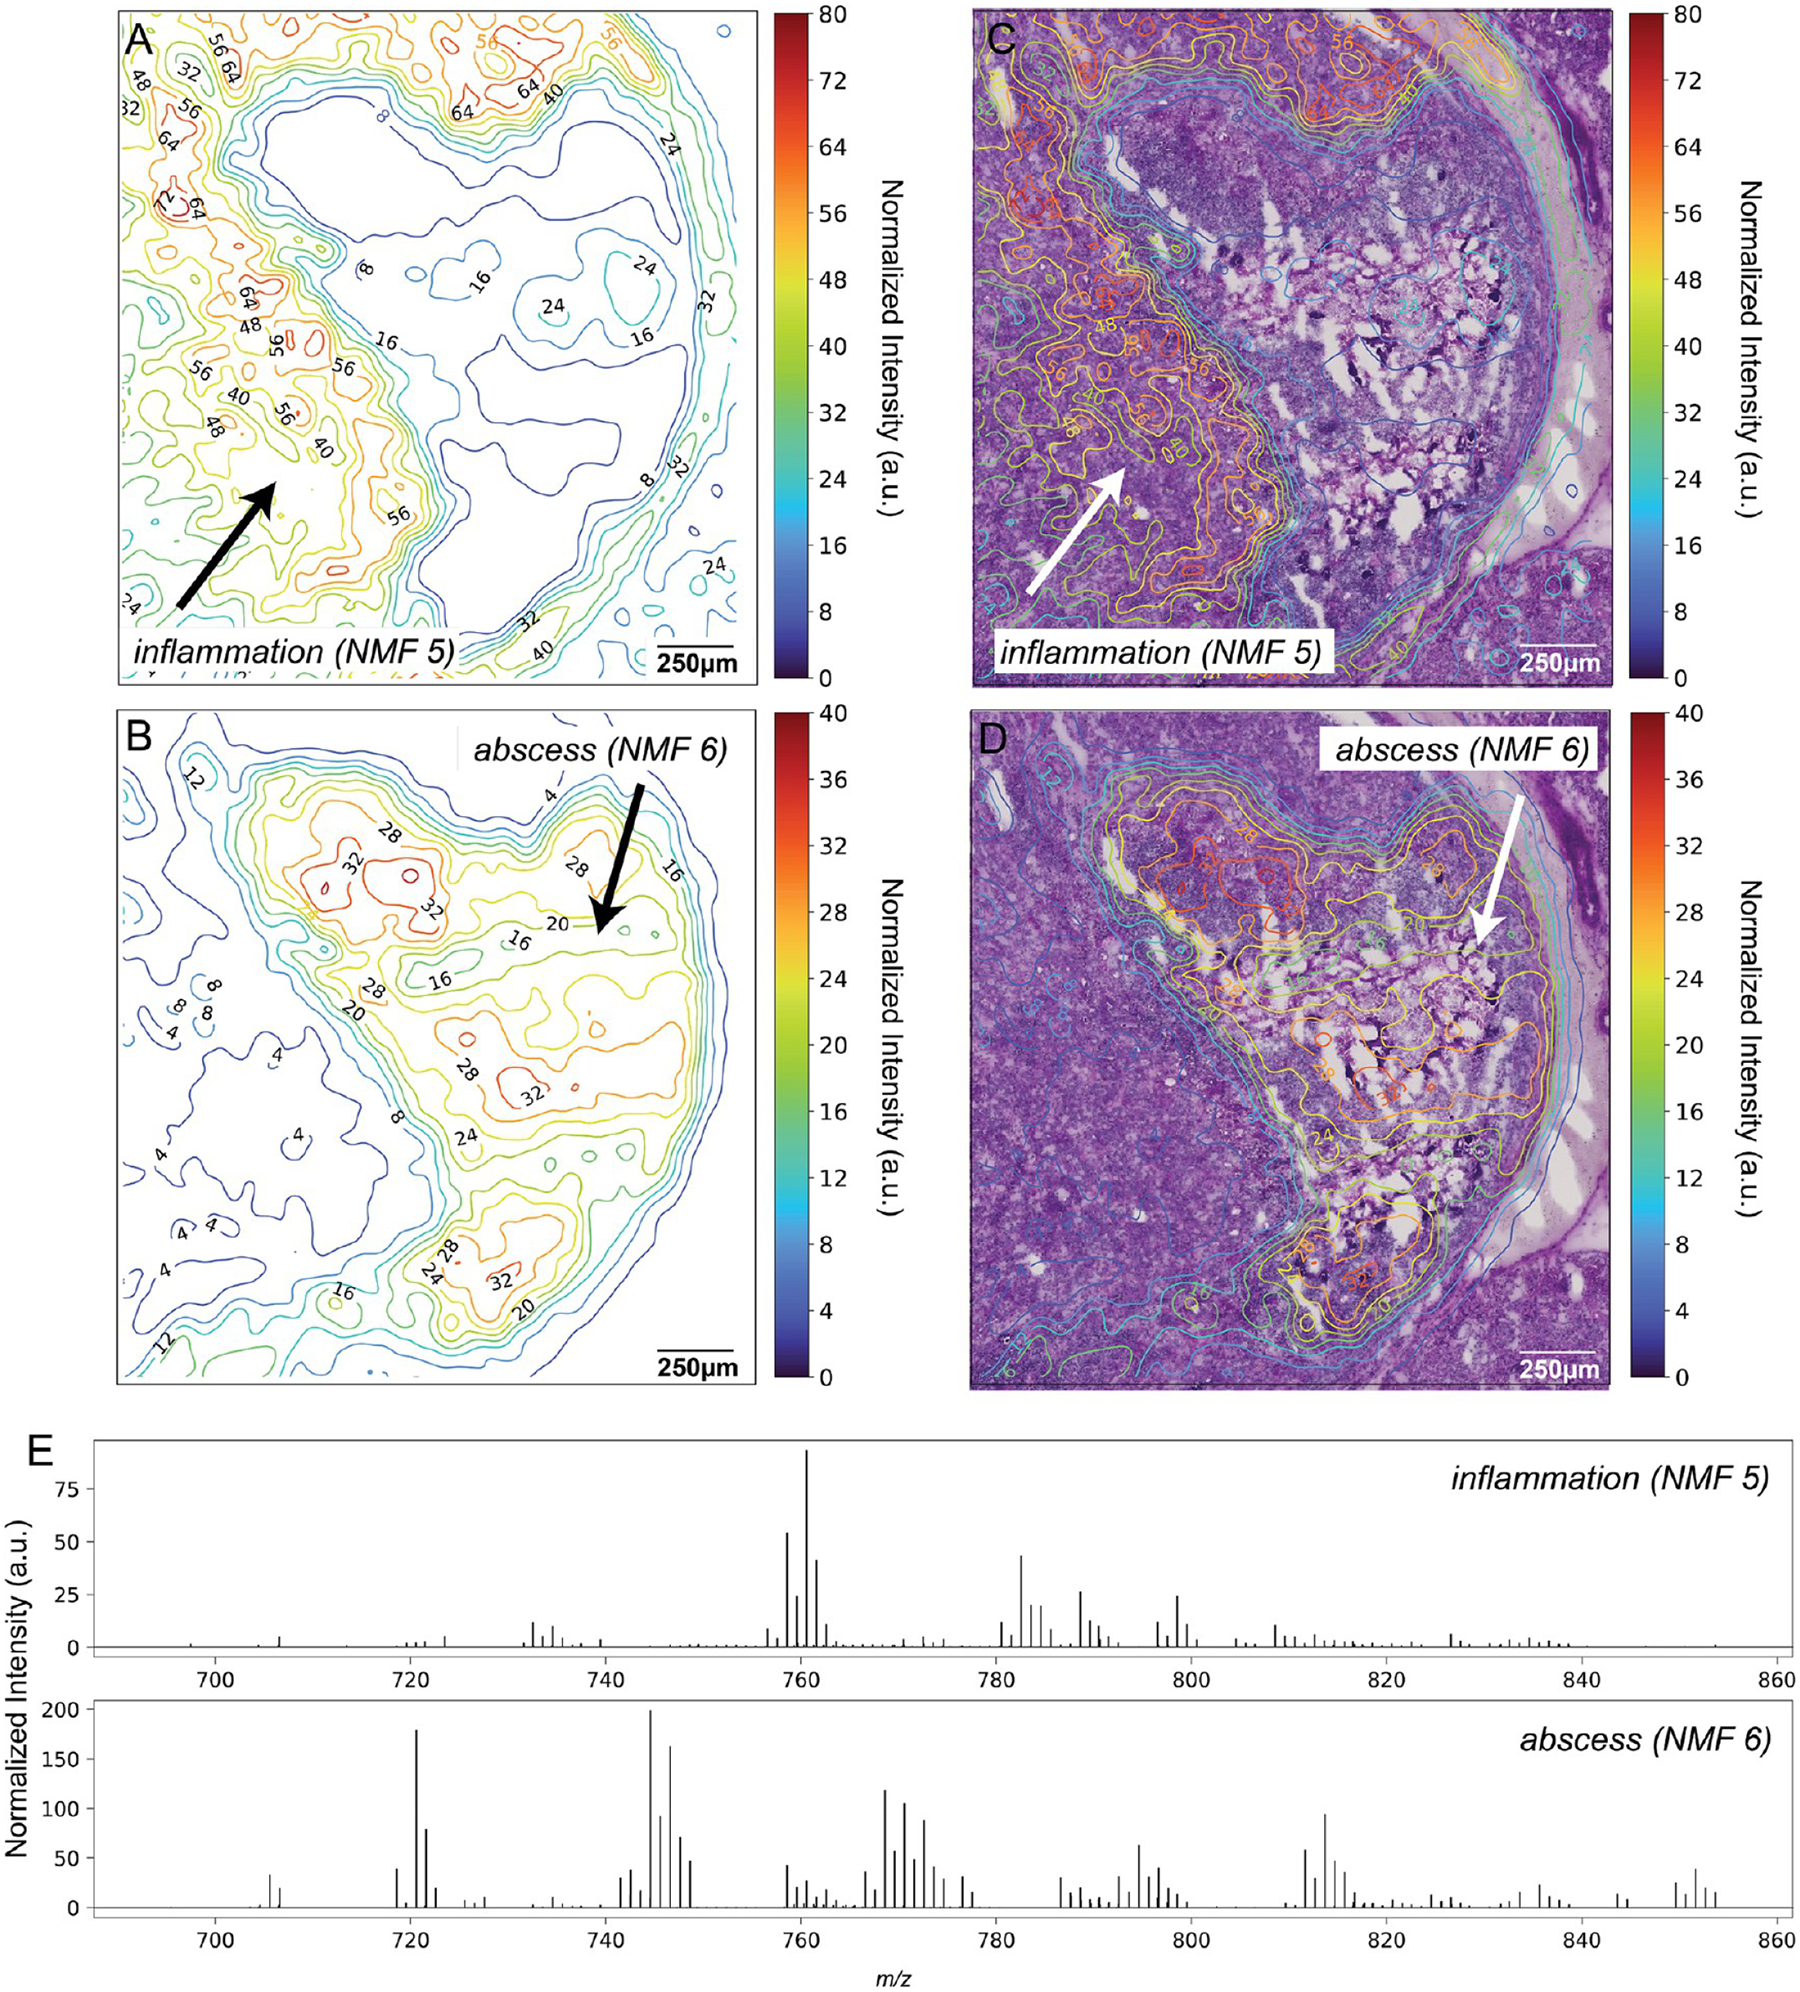
Contour maps built upon results of multivariate NMF analysis. Non-negative matrix factorization (NMF) was applied to the MALDI IMS data, discerning 13 notable molecular patterns. (A) Contour map of NMF component 5, which correlates to the lipids surrounding inflammatory response. Contours are labeled by intensity values. (B) Contour map of an NMF component 6, which correlates to the lipids in the bacterial abscess. Contours are labeled by intensity values. (C) Contour map of NMF component 5 overlaid with PAS. (D) Contour map of NMF component 6 overlaid with PAS. (E) Average spectra corresponding to each of the NMF components, revealing distinct molecular profiles between the surrounding inflammation (top) and bacterial abscess (bottom).
Contour maps can also be represented in three dimensions to further reveal the molecular topography observed in tissue (Figure 5). Contour map of NMF component 6, correlating with the bacterial abscess, reveals the major abscess along with some smaller satellite infections across the murine kidney (Figure 5A). Contour map of NMF component 5, correlating with the surrounding inflammatory region, reveals the inflammation immediately surrounding the abscess along with an elevated inflammatory response across the kidney (Figure 5B). In this visualization, regions of inflammation can be seen surrounding the major abscess, providing more information about the molecular differences between the infection and surrounding inflammatory response.
Figure 5.

Three-dimensional contour map based on results of multivariate NMF analysis. (A) 3D contour map of NMF component 6, correlating with the bacterial abscess. (B) 3D contour map of NMF component 5, correlating with the inflammatory response.
CONCLUSIONS
We have introduced an augmented visualization of digital pathology whole-slide images, combining contour maps reporting ion intensity acquired by mass spectrometry with stained microscopy. Similar to how contour lines enable data interpretation in geographical maps, we applied the same concept to ion images to enable a multimodal IMS-microscopy data visualization strategy that integrates spatially, yet still yields easy interpretation by domain experts. We applied this contour map approach to visualize spatially resolved molecular changes within an S. aureus-infected murine kidney. Univariate contour maps on the basis of single ion images revealed the spatial differences of an individual ion intensity across the whole slide image. Multivariate contour maps built upon results of NMF reported the spatial distribution on microscopy of a panel of correlating molecular species rather than the distribution of a single molecular species. These maps overlaid onto high-resolution stained microscopy exposed staphylococcal abscess morphology and the molecular transition zone at the host–pathogen interface. These findings were not easily discernible in the PAS nor IMS data alone, demonstrating the effectiveness of an augmented visualization of multimodal IMS data that provided the molecular composition of an S. aureus-infected murine kidney. Augmented visualization strategies such as this contour mapping approach are broadly applicable to multimodal IMS and microscopy experiments and will become more critical with the continued advancement of multimodal workflows.
Supplementary Material
ACKNOWLEDGMENTS
This work was funded by the NIH National Institute of Allergy and Infectious Diseases (Grants R01AI138581 and R01AI145992 awarded to J.M.S. and E.P.S. and supporting R.V.d.P. and Grants R01AI069233 and R01AI073843 awarded to E.P.S.). This work was also supported by the National Institutes of Health (NIH)’s Common Fund, the National Institute of Diabetes and Digestive and Kidney Diseases (NIDDK), and the Office of the Director (OD) under Awards U54DK120058 and U54DK134302 (J.M.S., R.M.C., and R.V.d.P.), by NIH’s Common Fund, National Eye Institute, and the Office of The Director (OD) under Award U54EY032442 (J.M.S., R.M.C., and R.V.d.P.). E.K.N. was supported by National Institute of Environmental Health Sciences Training Grant T32ES007028. The content is solely the responsibility of the authors and does not necessarily represent the official views of the National Institutes of Health. The authors also thank Angela Kruse for productive discussions and feedback.
Footnotes
Supporting Information
The Supporting Information is available free of charge at https://pubs.acs.org/doi/10.1021/jasms.2c00370.
Formulas, m/z results, intensities, ppm values, and lipid annotations (XLSX)
Spatially correlating lipids colocalizing with regions of the kidney and regions associated with infection (Figure S1), heatmap of ion image overlaid with PAS at 50% opacity (Figure S2), reconstruction error of NMF components (Figure S3), NMF components of IMS data (Figure S4), and lipid annotations (Table S1) (PDF)
Complete contact information is available at: https://pubs.acs.org/10.1021/jasms.2c00370
Notes
The authors declare no competing financial interest. Data presented in the manuscript are available at https://figshare.com/projects/Contour_Maps/155753, and code can be found at https://github.com/kavyasharman/contourmap.
Contributor Information
Kavya Sharman, Mass Spectrometry Research Center, Vanderbilt University, Nashville, Tennessee 37235, United States; Program in Chemical & Physical Biology, Vanderbilt University Medical Center, Nashville, Tennessee 37232, United States;.
Nathan Heath Patterson, Mass Spectrometry Research Center, Vanderbilt University, Nashville, Tennessee 37235, United States; Department of Biochemistry, Vanderbilt University, Nashville, Tennessee 37232, United States;.
Lukasz G. Migas, Delft Center for Systems and Control, Delft University of Technology, 2628 CD Delft, The Netherlands;
Elizabeth K. Neumann, Mass Spectrometry Research Center, Vanderbilt University, Nashville, Tennessee 37235, United States; Department of Biochemistry, Vanderbilt University, Nashville, Tennessee 37232, United States;
Jamie Allen, Mass Spectrometry Research Center, Vanderbilt University, Nashville, Tennessee 37235, United States; Department of Biochemistry, Vanderbilt University, Nashville, Tennessee 37232, United States.
Katherine N. Gibson-Corley, Department of Pathology, Microbiology, and Immunology, Vanderbilt University Medical Center, Nashville, Tennessee 37232, United States
Jeffrey M. Spraggins, Mass Spectrometry Research Center, Vanderbilt University, Nashville, Tennessee 37235, United States; Department of Biochemistry, Department of Cell and Developmental Biology, and Department of Chemistry, Vanderbilt University, Nashville, Tennessee 37232, United States;
Raf Van de Plas, Mass Spectrometry Research Center, Vanderbilt University, Nashville, Tennessee 37235, United States; Department of Biochemistry, Vanderbilt University, Nashville, Tennessee 37232, United States; Delft Center for Systems and Control, Delft University of Technology, 2628 CD Delft, The Netherlands;.
Eric P. Skaar, Department of Pathology, Microbiology, and Immunology, Vanderbilt University Medical Center, Nashville, Tennessee 37232, United States
Richard M. Caprioli, Mass Spectrometry Research Center, Vanderbilt University, Nashville, Tennessee 37235, United States; Department of Biochemistry, Department of Chemistry, and Department of Pharmacology, Vanderbilt University, Nashville, Tennessee 37232, United States;
REFERENCES
- (1).Caprioli RM; Farmer TB; Gile J Molecular Imaging of Biological Samples: Localization of Peptides and Proteins Using MALDI-TOF MS. Anal. Chem 1997, 69, 4751. [DOI] [PubMed] [Google Scholar]
- (2).Spraggins JM; Rizzo DG; Moore JL; Rose KL; Hammer ND; Skaar EP; Caprioli RM MALDI FTICR IMS of Intact Proteins: Using Mass Accuracy to Link Protein Images with Proteomics Data. J. Am. Soc. Mass Spectrom 2015, 26, 974–985. [DOI] [PMC free article] [PubMed] [Google Scholar]
- (3).Longuespée R; Casadonte R; Kriegsmann M; Pottier C; Picard de Muller G; Delvenne P; Kriegsmann J; De Pauw E MALDI mass spectrometry imaging: A cutting-edge tool for fundamental and clinical histopathology. PROTEOMICS—Clin. Appl 2016, 10, 701–719. [DOI] [PubMed] [Google Scholar]
- (4).Nilsson A; Goodwin RJA; Shariatgorji M; Vallianatou T; Webborn PJH; Andrén PE Mass spectrometry imaging in drug development. Anal. Chem 2015, 87, 1437–1455. [DOI] [PubMed] [Google Scholar]
- (5).Heeren RMA Getting the picture: The coming of age of imaging MS. Int. J. Mass Spectrom 2015, 377, 672–680. [Google Scholar]
- (6).Norris JL; Caprioli RM Analysis of tissue specimens by matrix-assisted laser desorption/ionization imaging mass spectrometry in biological and clinical research. Chem. Rev 2013, 113, 2309–2342. [DOI] [PMC free article] [PubMed] [Google Scholar]
- (7).Patterson NH; Neumann EK; Sharman K; Allen J; Harris R; Fogo AB; de Caestecker M; Caprioli RM; Van de Plas R; Spraggins JM Autofluorescence microscopy as a label-free tool for renal histology and glomerular segmentation. bioRxiv 2021, 2021.07.16.452703. [Google Scholar]
- (8).Van de Plas R; Yang J; Spraggins J; Caprioli RM Image fusion of mass spectrometry and microscopy: a multimodality paradigm for molecular tissue mapping. Nat. Methods 2015, 12, 366–372. [DOI] [PMC free article] [PubMed] [Google Scholar]
- (9).Tideman LEM; Migas LG; Djambazova KV; Patterson NH; Caprioli RM; Spraggins JM; Van de Plas R Automated biomarker candidate discovery in imaging mass spectrometry data through spatially localized Shapley additive explanations. Anal. Chim. Acta 2021, 1177, 338522. [DOI] [PMC free article] [PubMed] [Google Scholar]
- (10).Han C; Sun X; Yang Y; Che Y; Qin Y Brain Complex Network Characteristic Analysis of Fatigue during Simulated Driving Based on Electroencephalogram Signals. Entropy 2019, 21, 353. [DOI] [PMC free article] [PubMed] [Google Scholar]
- (11).Ushenko VA; Hogan BT; Dubolazov A; Grechina AV; Boronikhina TV; Gorsky M; Ushenko AG; Ushenko YO; Bykov A; Meglinski I Embossed topographic depolarisation maps of biological tissues with different morphological structures. Sci. Rep 2021, 11, 3871. [DOI] [PMC free article] [PubMed] [Google Scholar]
- (12).Perry WJ; Spraggins JM; Sheldon JR; Grunenwald CM; Heinrichs DE; Cassat JE; Skaar EP; Caprioli RM Staphylococcus aureus exhibits heterogeneous siderophore production within the vertebrate host. Proc. Natl. Acad. Sci. U. S. A 2019, 116, 21980–21982. [DOI] [PMC free article] [PubMed] [Google Scholar]
- (13).Cassat JE; Moore JL; Wilson KJ; Stark Z; Prentice BM; Van De Plas R; Perry WJ; Zhang Y; Virostko J; Colvin DC; Rose KL; Judd AM; Reyzer ML; Spraggins JM; Grunenwald CM; Gore JC; Caprioli RM; Skaar EP Integrated molecular imaging reveals tissue heterogeneity driving host-pathogen interactions. Sci. Transl. Med 2018, 10, 6361. [DOI] [PMC free article] [PubMed] [Google Scholar]
- (14).Guiberson ER; Weiss A; Ryan DJ; Monteith AJ; Sharman K; Gutierrez DB; Perry WJ; Caprioli RM; Skaar EP; Spraggins JM Spatially Targeted Proteomics of the Host-Pathogen Interface during Staphylococcal Abscess Formation. ACS Infect. Dis 2021, 7, 101–113. [DOI] [PMC free article] [PubMed] [Google Scholar]
- (15).Sharman K; Patterson NH; Weiss A; Neumann EK; Guiberson ER; Ryan DJ; Gutierrez DB; Spraggins JM; Van de Plas R; Skaar EP; Caprioli RM Rapid Multivariate Analysis Approach to Explore Differential Spatial Protein Profiles in Tissue. J. Proteome Res 2022, DOI: 10.1021/acs.jproteome.2c00206. [DOI] [PMC free article] [PubMed] [Google Scholar]
- (16).Neumann E; Romer C; Allen J; Spraggins J Automatic Deposition of DAN Matrix using a TM Sprayer for MALDI Analysis of Lipids. protocols.io; 2021. [Google Scholar]
- (17).Neumann E; Allen J; Anderson D; Gutierrez D; Spraggins J High Resolution Imaging Mass Spectrometry Analysis using Bruker Daltonics Platforms. protocols.io; 2019. [Google Scholar]
- (18).Patterson NH; Tuck M; Lewis A; Kaushansky A; Norris JL; Van De Plas R; Caprioli RM Next Generation Histology-Directed Imaging Mass Spectrometry Driven by Autofluorescence Microscopy. Anal. Chem 2018, 90, 12404. [DOI] [PMC free article] [PubMed] [Google Scholar]
- (19).Neumann E; Allen J; Harvey J; Brewer M; Romer C; De Caestecker M; Spraggins J PAS Staining of Fresh Frozen or Paraffin Embedded Human Kidney Tissue. protocols.io; 2021. [Google Scholar]
- (20).Patterson H NHPatterson/napari-imsmicrolink: IMS MicroLink v0.1.7; 2022; DOI: 10.5281/ZENODO.6562052. [DOI] [Google Scholar]
- (21).Patterson H; Manz T NHPatterson/wsireg: wsireg v0.3.5; 2022; DOI: 10.5281/ZENODO.6561996. [DOI] [Google Scholar]
- (22).Bankhead P; Loughrey MB; Fernández JA; Dombrowski Y; McArt DG; Dunne PD; McQuaid S; Gray RT; Murray LJ; Coleman HG; James JA; Salto-Tellez M; Hamilton PW QuPath: Open source software for digital pathology image analysis. Sci. Rep 2017, 7, 16878. [DOI] [PMC free article] [PubMed] [Google Scholar]
- (23).Chiu C-L; Clack N napari: a Python Multi-Dimensional Image Viewer Platform for the Research Community. Microsc. Microanal 2022, 28, 1576–1577. [Google Scholar]
- (24).Fahy E; Sud M; Cotter D; Subramaniam S LIPID MAPS online tools for lipid research. Nucleic Acids Res 2007, 35, W606–W612. [DOI] [PMC free article] [PubMed] [Google Scholar]
- (25).Fahy E; Subramaniam S; Murphy RC; Nishijima M; Raetz CRH; Shimizu T; Spener F; van Meer G; Wakelam MJO; Dennis EA Update of the LIPID MAPS comprehensive classification system for lipids1. J. Lipid Res 2009, 50, S9–S14. [DOI] [PMC free article] [PubMed] [Google Scholar]
- (26).van der Walt S; Schönberger JL; Nunez-Iglesias J; Boulogne F; Warner JD; Yager N; Gouillart E; Yu T & the scikit-image contributors. scikit-image: image processing in Python. PeerJ 2014, 2, No. e453. [DOI] [PMC free article] [PubMed] [Google Scholar]
- (27).Hunter JD Matplotlib: A 2D graphics environment. Comput. Sci. Eng 2007, 9, 90–95. [Google Scholar]
- (28).Pedregosa F; Varoquaux G; Gramfort A; Michel V; Thirion B; Grisel O; Blondel M; Prettenhofer P; Weiss R; Dubourg V; Vanderplas J; Passos A; Cournapeau D; Brucher M; Perrot M; Duchesnay E Scikit-learn: Machine Learning in Python. J. Mach. Learn. Res 2011, 12, 2825–2830. [Google Scholar]
- (29).Févotte C; Idier J Algorithms for Nonnegative Matrix Factorization with the β-Divergence. Neural Comput 2011, 23, 2421–2456. [Google Scholar]
- (30).Bemis KD; Harry A; Eberlin LS; Ferreira C; Van De Ven SM; Mallick P; Stolowitz M; Vitek O Cardinal: An R package for statistical analysis of mass spectrometry-based imaging experiments. Bioinformatics 2015, 31, 2418–2420. [DOI] [PMC free article] [PubMed] [Google Scholar]
- (31).Verbeeck N; Caprioli RM; Van de Plas R Unsupervised machine learning for exploratory data analysis in imaging mass spectrometry. Mass Spectrom. Rev 2020, 39, 245–291. [DOI] [PMC free article] [PubMed] [Google Scholar]
- (32).Chung H-H; Huang P; Chen C-L; Lee C; Hsu C-C Next-generation pathology practices with mass spectrometry imaging. Mass Spectrom. Rev 2022, No. e21795. [DOI] [PubMed] [Google Scholar]
- (33).Lee DD; Seung HS Learning the parts of objects by non-negative matrix factorization. Nature 1999, 401, 788–791. [DOI] [PubMed] [Google Scholar]
- (34).Verbeeck N; Yang J; De Moor B; Caprioli RM; Waelkens E; Van De Plas R Automated Anatomical Interpretation of Ion Distributions in Tissue: Linking Imaging Mass Spectrometry to Curated Atlases. 2014, 86, 8974. [DOI] [PMC free article] [PubMed] [Google Scholar]
- (35).Verbeeck N; Caprioli RM; Van de Plas R Unsupervised machine learning for exploratory data analysis in imaging mass spectrometry. Mass Spectrom. Rev 2020, 39, 245–291. [DOI] [PMC free article] [PubMed] [Google Scholar]
Associated Data
This section collects any data citations, data availability statements, or supplementary materials included in this article.


