

Summary
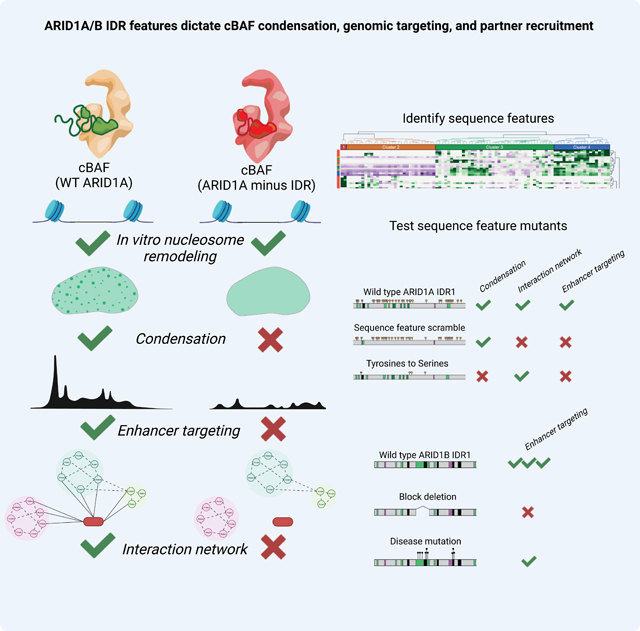
Intrinsically disordered regions (IDRs) represent a large percentage of overall nuclear protein content. The prevailing dogma is that IDRs engage in non-specific interactions because they are poorly constrained by evolutionary selection. Here, we demonstrate that condensate formation and heterotypic interactions are distinct and separable features of an IDR within the ARID1A/B subunits of the mSWI/SNF chromatin remodeler, cBAF, and establish distinct ‘sequence grammars’ underlying each contribution. Condensation is driven by uniformly distributed tyrosine residues, and partner interactions are mediated by non-random blocks rich in alanine, glycine, and glutamine residues. These features concentrate a specific cBAF protein-protein interaction network and are essential for chromatin localization and activity. Importantly, human disease-associated perturbations in ARID1B IDR sequence grammars disrupt cBAF function in cells. Together, these data identify IDR contributions to chromatin remodeling and explain how phase separation provides a mechanism through which both genomic localization and functional partner recruitment are achieved.
eTOC blurb
Intrinsically disordered regions (IDRs) together with the ARID DNA-binding domain of ARID1A/B subunits dictate cBAF chromatin remodeler complex condensate formation, chromatin localization, and protein-protein interactions, governed by specific IDR sequence grammars.
Graphical Abstract
Introduction
Intrinsically disordered regions (IDRs) comprise 37–50% of the human proteome1 and are especially enriched in nuclear proteins2. Rather than a singular structure, IDRs are defined by heterogeneous conformational ensembles3,4 which has led to the prevailing view that IDR-mediated interactions are less specific than those mediated by folded domains5. However, associations driven by specific IDRs are known to play important roles in forming biomolecular condensates, which are regions of high local protein concentration formed via the process of phase separation or related phase transitions8. IDRs and their role in driving phase separation are implicated in various aspects of nuclear organization, but much remains unclear, particularly in the context of chromatin remodeling.
The mammalian SWI/SNF (mSWI/SNF or BAF) ATP-dependent chromatin remodeling complexes collectively represent one of the most frequently mutated cellular entities in human cancer, second only to TP539,10. Indeed, mutational frequencies for all 29 human genes that encode for mSWI/SNF complex subunits tally to over 20% across all human cancers9. mSWI/SNF subunit mutations and translocations represent cancer-initiating events in a number of rare cancers11–13 and are among the most frequently perturbed genes in neurodevelopmental disorders (NDDs)14–20.
The most frequently mutated genes within the mSWI/SNF family are the ARID1 genes, ARID1A and ARID1B, which encode 250-kDa paralog subunits (ARID1A and ARID1B) that define and assemble into cBAF subcomplexes in a mutually exclusive manner9,21. ARID1A is mutated in over 8% of all human cancers arising from a range of cell lineages, while in neurodevelopmental disorders, ARID1B is the most recurrently mutated chromatin regulatory gene and one of the top five genes associated with autism19,22–24. These human genetic data imply critical functional contributions of the ARID1 subunits as well as differences between the two paralogs. Recent studies21,25–27 have revealed that the large ARID1 subunits (Swi1 in yeast SWI/SNF) connect the cBAF core with the ATPase module via a conserved core-binding region (CBR) containing 6 tandem Armadillo (Arm) repeats21,27 (Fig. 1A, Fig. S1A). Expression of this CBR is sufficient for cBAF complex biochemical assembly, specifically, binding of the ATPase module on to the cBAF core21. Cancer-associated missense mutations in the C-terminal region destabilize ARID1A and/or prevent its assembly into cBAF complexes21,27; disease-associated mutations in both ARID1A and ARID1B are nonsense and frameshift in nature (Fig. S1B). Intriguingly, the role of the remaining two-thirds of these proteins (65.69% of ARID1A, 1501 amino acids; 68.74% of ARID1B, 1537 amino acids) remains uncharacterized. ARID1A/B N-termini contain two IDRs bridged by a structured ARID DNA-binding domain (Fig. 1A-B, Fig. S1C-D). Most cancer-associated mutations in ARID1A/B genes and NDD-associated mutations in ARID1B fall within the IDRs (~58% and ~83%, respectively) (Fig. 1C). Further, the IDRs of the ARID1A/B N-termini make up ~33% of the IDR content of the entire cBAF complex. Disorder scores (using MobiDB-Lite 3.028) for these ARID1A/B regions are similar to those of prion-like domains known to phase separate, including TDP-43, DDX4, FUS, and others29 (Fig. S1E).
Figure 1. The IDRs of ARID1A/B are dispensable for cBAF assembly and in vitro nucleosome remodeling.

A. Human cBAF complex (PDBDEV_00000056) with putative ARID1A N-terminal region of unassigned cryo-EM density and C-terminal CBR highlighted. B. Disease-associated mutations mapped onto ARID1A/B and disorder as PONDR score. C. Distribution of disease-associated missense and indel mutations in ARID1A/B’s N-terminus. D. Schematic of HA-tagged ARID1A expression constructs. E. Immunoblots of nuclear protein input and anti-HA IPs in AN3CA (ARID1A/B-deficient) cells expressing HA-tagged ARID1A WT or mutant variants. F. TMT mass spectrometric signal for cBAF components from anti-HA ARID1A WT or mutant immunoprecipitation. G. Top, restriction enzyme accessibility assay (REAA) time course using 2.5 nM purified cBAF carrying ARID1A WT or mutant variants; Bottom, REAA using 0–5 nM cBAF (t=30min) (n=2 experimental replicates each). H. ATPase (ADP-Glo) measurements for indicated conditions and timepoints. ns, not significant by one-way ANOVA test.
IDRs within chromatin-bound proteins have putative functional roles including influencing dynamics of chromatin-bound proteins30 and transcriptional activation31, creating reaction crucibles32–34, and heterochromatic silencing35–37. Several pathogenic mutations in human cancer and Mendelian diseases map to condensate-forming proteins39. The functions imparted to nuclear proteins by IDRs remain incompletely understood, particularly in the context of ATP-dependent chromatin remodelers.
Here, we find that the ARID1A/B IDRs and DNA-binding ARID domain direct genomic targeting of the cBAF complex and subsequent generation of DNA accessibility, enhancer activation and gene expression, through an IDR-encoded specific biomolecular interaction network.
Results
The ARID1A/B N-terminus is dispensable for cBAF assembly and in vitro nucleosome remodeling
To define the role of the IDR-rich ARID1A/B N-termini with respect to complex assembly and ATPase dependent nucleosome remodeling activities, we generated HA-tagged ARID1A full-length (wild-type, WT) or ARID1A mutant variants that lack IDR1 (ΔIDR1), contain mutations in the ARID DNA-binding domain that compromise DNA binding as assayed by electrophoretic mobility shift assay (S1086E, S1087E, S1090E) (DBDmut) (Fig. S1F-G), or lack the entire N-terminus, including IDR1, the ARID domain, and IDR2 (CBR only) (Fig. 1D). We introduced these into AN3CA cells derived from a dedifferentiated endometrial carcinoma lacking both ARID1A and ARID1B subunits (and hence, lacking functional cBAF complexes) as well as ARID1A/B-deficient HEK293T cells generated using CRISPR/Cas9-based editing21 (Fig. 1E, Fig. S1H). The C-terminal CBR was sufficient to enable assembly of complexes in both cell types (Fig. 1E, S1I). Protein levels across all mutants were similar to WT and unaffected by proteasome inhibition (Fig. S1J). cBAF complexes purified from cells expressing WT or mutant ARID1A contained similar levels of BAF core and ATPase module subunits, by immunoblot and tandem-mass-tag (TMT) mass spectrometric analyses of HA immunoprecipitations (IPs) (Fig. 1E-F, Table S1). As expected, expression of ARID1A in ARID1A/B-null cells restored cBAF assembly, demonstrated by density sedimentation analysis21 (Fig. S1K). Intriguingly, restriction enzyme accessibility assays (REAA) revealed both WT and mutant complexes purified via HA-IP from ΔARID1A/B HEK293T cells have equivalent nucleosome remodeling activities in vitro, and ATPase catalytic activities in solution (Fig. 1G-H, Fig. S1L-M), suggesting the ARID1A C-terminus is sufficient for cBAF complex assembly, nucleosome remodeling, and catalytic activities, underscoring the need to investigate alternate functional contributions of the large N-terminal region.
The ARID1 disordered regions confer phase separation potential to cBAF complexes
Coupled with the high predictions for disorder and disease relevance of the N-terminal regions, we sought to examine their potential role in cBAF phase separation. We expressed individual C-terminally eGFP-tagged ARID1A WT, DNA-binding mutant, or truncation variants in ΔARID1A/B HEK293T cells, isolated fully assembled cBAF complexes, and performed in vitro condensation (phase separation) assays (Fig. 2A, Fig. S2A-B). Purified protein complexes diluted to 2, 0.66, 0.2, and 0.074 μM in physiological salt buffer with no additional crowding agent (150 mM NaCl, 25 mM HEPES pH 7.5), were imaged after 30 minutes on a spinning disc confocal microscope to query the presence of condensates. Complexes incorporating WT- or DBDmut-ARID1A formed condensates in solution, while loss of one or both IDRs nearly completely attenuated condensate formation (Fig. 2A, left, S2C). We quantified the presence of condensates using a two-dimensional proxy for volume fraction: percent of the field of view covered by eGFP-positive droplets (Condensate Area, WT 9.05%; DBDmut 8.63%; ΔIDR1 0.59%; CBR 0.04%) (Fig. 2A, right). Addition of 100 nM DNA (linear, dsDNA of random sequence), nucleosomes (mixed mono-, di-, and tri-nucleosomes) or RNA showed that condensate formation was enhanced by DNA and nucleosomes, but not by RNA (Condensate Area WT Only 9.05%; WT + DNA 14.89%, WT + nucleosomes 15.50%, WT + RNA 8.24%), implicating cBAF complex DNA- and nucleosome-binding regions in promoting phase separation (Fig. 2B, Fig. S2D). In addition, WT but not DBDmut samples formed strings of condensates in reactions containing DNA, similar to observations of a pioneer transcription factor40 (Fig. S2E). Of note, cBAF complexes contain several other DNA-binding domains within the core module; so attenuated condensation upon inactivation of the ARID domain alone suggests a prominent role for this domain. Interestingly, while the condensation of cBAF complexes carrying the DBDmut mutant was not enhanced by the addition of DNA, it was enhanced by the addition of nucleosomes, suggesting that bilateral engagement of cBAF at the acidic patch regions27,41 can enhance phase separation independent of ARID domain-mediated DNA binding (Fig. 2B). Addition of either DNA or nucleosomes moderately enhanced condensation of ΔIDR1-containing cBAF complexes presumably via ARID domain-mediated DNA and nucleosome binding, though not significantly relative to complex-only control (Fig. 2B, Fig. S2D). Further, cBAF complexes nucleated by the ARID1A CBR alone failed to form condensates in any of the conditions tested, suggesting that although additional IDRs are present in other cBAF subunits27, they are not sufficient to induce condensation of complexes (Fig. 2B).
Figure 2. ARID1A IDRs dictate cBAF complex condensation in vitro and in cells, which is enhanced by DNA binding.

A. Left, in vitro condensation experiments of indicated 0.66 μM eGFP-tagged cBAF complexes; Right, condensate area per field of view. B. Percent condensate-covered area with 100 nM DNA, nucleosomes, or RNA. C. Confocal imaging of eGFP-tagged cBAF complexes containing ARID1A WT or mutant variants in live AN3CA cells. D. Saturation concentration, condensate count and area ARID1A puncta in AN3CA cells. PS: Phase Separation. E. Immunoblot for ARID1A and other cBAF subunits in AN3CA cells −/+ doxycycline alongside human and murine cell types. F. Immunofluorescence of AN3CA cells without or with doxycycline induction of exogenous eGFP-tagged ARID1A. PCC between eGFP-ARID1A and anti-ARID1A immunostaining. Bottom: Immunostain for endogenous ARID1A in KLE (human endometrial), C2C12 myoblast (mouse), MCF10A (human breast cancer), and primary rat neurons. G. Top, schematic of Corelet system used to evaluate self-interaction propensity of IDRs; Bottom, schematic of IDR-containing constructs evaluated. H. Representative images of U2OS cell nuclei without (-light) and with (+light) light-induced oligomerization. I. Top, phase diagram schematic; Bottom, phase diagrams of ARID1A constructs; shaded area indicates two-phase region. In A and B, P-values calculated by one-way ANOVA test. In D, by unpaired student’s t-test.
Next, we evaluated protein dynamics and exchange using Fluorescence Recovery After Photobleaching (FRAP) in AN3CA cells expressing eGFP-tagged ARID1A/B. Addition of eGFP to ARID1A did not disrupt cBAF complex assembly in AN3CA cells as assayed by IP-immunoblot and density sedimentation analyses (Fig. S2F-H). Indeed, WT ARID1A-carrying cBAF complexes showed a clear punctate pattern by microscopy while disruption of IDRs nearly completely attenuated the presence of nuclear puncta (Fig. 2C-D). ARID1A DBDmut-expressing cells had consistently fewer condensates, each with increased area, likely reflecting enhanced coarsening enabled by loss of targeted interaction with genomic DNA (Fig. 2C-D). Concentration-calibrated fluorescence imaging of eGFP-tagged ARID1A constructs demonstrated a threshold concentration of 1.13 ± 0.11 μM for WT and 1.08 ± 0.16 μM for DBDmut, above which the punctate nuclear pattern is observed (Fig. 2D). Condensation and threshold concentration of all four ARID1A mutants were unaffected by proteasome inhibitor treatment (Fig. S2I). Similar condensation patterns were obtained for the ARID1B paralog subunit (Fig. S2J). Time-lapse imaging showed that individual ARID1A/B nuclear puncta are present over tens of minutes and exhibit fusion and coalescence, which characterizes either purely viscous fluids or viscoelastic materials with terminally viscous properties (Supplemental Movie S1). FRAP experiments in the ARID1A WT condition demonstrated rapid recovery (half time of recovery T1/2 ~5.7 sec and T1/2 ~7 sec for ARID1A and ARID1B, respectively) with low immobile fraction (27%), consistent with viscoelastic materials that feature mobile and immobile species (Fig. S2K). The ARID1A and ARID1B DNA-binding mutants (DBDmut) demonstrated similar dynamics with slight but statistically significant increases in half time of recovery (to T1/2 = 9.4 sec for ARID1A, T1/2 = ~15 seconds for ARID1B) but no change in immobile fraction, indicating that loss of DNA binding activity does not drastically alter protein dynamics (Fig. S2K). By immunoblot, levels of exogenous ARID1A expression in AN3CA cells were comparable to endogenous ARID1A levels across a range of human and murine cell types (Fig. 2E) and immunofluorescence detected punctate nuclear cBAF structures in endogenous contexts (Fig. 2F, Fig. S2L). These data provide the first visual evidence of cBAF condensates under endogenous expression levels.
To further characterize the self-interaction capabilities of the ARID1A/B N-terminal IDRs, we employed the Corelet System42, which makes use of a multivalent ‘Core’ particle (24-mer Ferritin) to act as a scaffold for assembly of phase-separation-prone proteins in a light-dependent manner (Fig. 2G, top). We generated variants of ARID1A containing IDR1, IDR2, or the full N-terminus (IDRs and ARID domain, FL), each lacking the C-terminal BAF-binding CBR region to enable us to study the low-complexity N-terminus in isolation (Fig. 2G, bottom). Notably, the ARID1A N-terminus formed light-dependent condensates over a wide range of concentrations and valences, while IDR alone or DBDmut exhibited significant attenuation in phase separation potential (Fig. 2H-I, Fig. S2M). Again, the DNA-binding domain mutant formed fewer droplets of larger size (Fig. 2H, S2N). Similar results were obtained for ARID1B N-terminus, except that IDR1 more closely mirrored the full-length N-term variant, perhaps suggesting its stronger phase separation propensity (Fig. S2O-P). Repeated on-off light cycles revealed that the specific nuclear localization of ARID1A IDR puncta, observed as high correlation between nuclear positioning in subsequent cycles, was dependent on the ARID domain (Fig. S2Q-R). Together, these data highlight the functionality of the IDRs and ARID DNA-binding domain of ARID1A/B subunits in conferring phase separation and sub-nuclear localization properties to cBAF remodeling complexes.
ARID1A IDRs and ARID domain are required for cBAF targeting, chromatin accessibility and gene expression in cells
To determine the functional contributions of the IDRs and ARID domain of ARID1A/B, we introduced ARID1A WT, ΔIDR1, DBDmut, CBR-only mutant variants (Fig. 1C) or empty vector control into AN3CA cells and performed CUT&Tag43, ATAC-Seq44,45, and RNA-Seq to evaluate chromatin localization of cBAF, DNA accessibility, and gene expression, respectively. We first examined the chromatin occupancy of cBAF complexes, the enhancer mark H3K27ac, and DNA accessibility. Global clustering analyses performed on over 40,964 merged SMARCC1/SMARCA4 sites revealed a set over which only WT ARID1A restored complex occupancy and accessibility, whereas IDR deletion (ΔIDR1, CBR) and ARID domain (DBDmut) mutants were unable to restore these features (Cluster 2: 5042 sites; 12.3%) (Fig. 3A, Fig. S3A). We also identified a cluster that exhibits a similar trend to a lesser extent, with CBR-only mutant being the most deleterious (Cluster 3: 4705 sites; 11.5%) (Fig. 3A, Fig. S3A). Clusters 2 and 3 sites were largely Transcriptional Start Site (TSS)-distal, consistent with an important role for cBAF complexes in enhancer accessibility41,46 (Fig. 3B). Cluster 1 (unaffected by ARID1A expression) contains promoter-proximal sites (Figure 3A-B). Principal component analysis (PCA) of cBAF-occupied enhancer sites demonstrated a distinct clustering pattern, with the DBDmut most similar to WT, and ΔIDR1 and CBR mutants closest to empty vector control (Fig. 3C). These findings are exemplified at intragenic enhancers at the MAP2 and NCAPH loci and an intergenic enhancer within chromosome 2 (Fig. 3D). Consistent with in vitro remodeling data demonstrating that the N-terminus is not required for ATPase activity (Fig. 1G-H), we did not identify sites with intact mutant complex targeting but loss of accessibility, suggesting genomic targeting of the complex, not core enzymatic remodeling activity, is compromised in these mutants (Fig. 3A). The number of sites affected genome-wide (n= 9747 total for Clusters 2 and 3) mirror those affected by complexes containing defects in the ATPase activity itself (i.e., K785R of SMARCA4), or complexes lacking core components such as SMARCB1 or SMARCE112,13,41,46, suggesting that disruption of the IDRs of the ARID1 proteins direct similar consequences for cBAF complex targeting as disruption of these structurally integral subunits.
Figure 3. ARID1A IDRs and DNA-binding functions govern cBAF occupancy, DNA accessibility and gene expression in cells.

A. Chromatin occupancy of cBAF complexes marked by HA (ARID1A), SMARCA4, and SMARCC1, H3K27ac enhancer mark occupancy and DNA accessibility (ATAC) at cBAF-occupied sites in AN3CA cells, divided into 4 clusters using k-means clustering. B. Distance-to-TSS distribution of merged CUT&Tag and ATAC-Seq peaks for all conditions, across Clusters 1–4 from (A). C. Principal Component Analysis (PCA) of cBAF-occupied enhancer sites across conditions as assayed by SMARCA4 and SMARCC1 signals. D. Representative CUT&Tag and ATAC-Seq tracks at the MAP2, NCAPH, and intergenic enhancer loci in AN3CA cells across Empty and ARID1A WT or mutant conditions. E. Overlap of accessible sites by ATAC-Seq in empty vector control (Empty) versus ARID1A WT or mutant conditions in AN3CA cells. Gained sites relative to empty condition are highlighted in bold. F. Transcription factor motif enrichment analysis (HOMER) at Clusters 2, 3, and 4 from (A). G. Box and whisker plot for all conditions comparing expression levels of top differentially expressed genes (DEGs) upon ARID1A WT introduction versus empty control.
At a global level, WT ARID1A expression led to a significant increase in accessibility by ATAC-Seq compared to empty vector control (39170 de novo sites) (Fig. 3E). Accessibility gains were reduced upon expression of each mutant variant relative to WT (DBDmut = 20797, ΔIDR1= 9931, CBR= 8539 sites), with CBR mutant resulting in the lowest accessibility, followed by the ΔIDR1 and DBDmut mutants (WT > DBDmut > ΔIDR1 > CBR) (Fig. 3E, Fig. S3B). PCA performed across all ATAC-Seq and RNA-Seq conditions similarly revealed the DBDmut clusters closer to WT than ΔIDR1 and CBR mutants (Fig. S3C-D). These data collectively indicate that loss of the ARID1A N-terminal IDR and/or DNA-binding regions of BAF complexes result in substantial changes in targeting and genomic accessibility in cells. Accessible sites in ARID1A-mutant conditions represented a subset of those generated by ARID1A WT (Fig. S3E), with significant overlap among one another, exemplifying the convergent deficits in differentially perturbed cBAF complexes (Fig. S3E-F).
Sites most affected by disruption of the ARID N-terminus were enriched in transcription factor (TF) motifs corresponding to the AP-1, FOS/Jun, NF1, and TEAD factors, several of which have been shown to localize to enhancers via interaction with mSWI/SNF complexes (Fig. 3F)47,48. 72% of accessible sites gained in cells expressing WT ARID1A showed a concordant increase in occupancy of H3K27ac, and were enriched for similar transcription factor motifs as Cluster 2 and 3 sites (Fig. S3G-H, Fig. 3A, Fig. 3E). Intriguingly, sites at which cBAF complex occupancy and DNA accessibility were reduced upon rescue with WT ARID1A but not the mutant variants or empty vector control were significantly enriched for CTCF and CTCFL (BORIS) motifs (Cluster 4: 5915 sites), consistent with recent observations that lack of cBAF assembly and/or function results in increased non-canonical BAF (ncBAF) complex abundance and function at its key target sites (CTCF) (Fig. 3F, Fig. 3A, Cluster 4, Fig. S3A)49,50.
Finally, we found that relative to WT ARID1A, expression of ARID1A N-terminal mutants resulted in attenuation of gene expression (Fig. 3G, Fig. S3I). Globally, we identified a greater number of upregulated and downregulated transcripts in mutant conditions, with the CBR mutant resulting in the fewest upregulated transcripts (Fig. S3J-K). In this AN3CA endometrial cellular context specifically, N-terminal mutants failed to rescue expression of genes involved in endometrial cell differentiation (Fig. S3L), suggesting that condensation of cBAF is essential to its genome-localized nucleosome remodeling function. These data demonstrate that the IDR-rich N-terminus, coupled with the ARID DNA-binding domain, are together required for the stable occupancy of cBAF complexes at distal enhancers over which they establish and maintain accessibility.
Heterotypic cBAF interactions with transcription factors require IDR sequences and the ARID DNA-binding domain of ARID1A
We sought to define the mechanistic basis underlying the necessity of the ARID1A/B N-termini for cBAF function. We reasoned that proteins localizing into ARID1A/B-containing nuclear condensates could be identified by their proximity, and so performed proximity labeling followed by mass-spectrometry by fusing an engineered biotin ligase TurboID (TbID)51,52 to the C-terminus of ARID1A WT and mutant variants to map changes in the proximal protein repertoire of cBAF complexes (Fig. S4A). TbID fusion did not disrupt nucleation and assembly of cBAF (Fig. 4A). Upon confirmation of self labeling of the bait (ARID1A), non-self labeling with biotin (50μM for 10 minutes), and visualization with streptavidin (Fig. S4B), we performed TMT mass spectrometry to identify proximal proteins for each cBAF complex variant (Fig. S4C). Notably, truncation of the full N-terminal region or IDR1 alone, but not inactivation of the ARID DNA-binding domain (DBDmut), resulted in a significantly depleted repertoire of proximal proteins (Fig. 4B, Table S2). This set of proteins was enriched in factors associated with chromatin organization, histone modification, and transcription (Fig. 4C, Fig. S4D). Losses in associated proteins were IDR-dependent with no significant changes in the DBDmut mutant (relative to WT) (Fig. 4C). We found that mSWI/SNF components themselves (cBAF as well as PBAF and ncBAF) were markedly reduced near cBAF complexes lacking the IDRs of ARID1A (Fig. S4E, left), with no change in total nuclear protein level (Fig. S4E, right), indicative of reduced proximity due to a loss of condensate formation. Furthermore, we measured a marked reduction in the abundance of Mediator complex components, RNA Polymerase II, the p300 acetyl transferase, and selected TFs in proximity of IDR-mutant complexes relative to WT, again, absent changes in corresponding nuclear protein levels (Fig. S4F-G). To validate these data, we performed immunofluorescence colocalization studies of p300 with ARID1A-WT or -mutant cBAF complexes. Consistently, we found altered nuclear distribution of p300 and a loss of co-condensation with cBAF (Fig. 4D, Fig. S4H-I). These findings demonstrate the critical role of the ARID1A N-terminal IDR1 in facilitating localized condensation of cBAF complexes and their association with the transcriptional machinery, TFs, and other factors required for functional chromatin remodelling.
Figure 4. ARID1A IDRs mediate local proximity of cBAF complex with cellular transcriptional machinery, enabling ARID domain-dependent TF binding.

A. Immunoblot for input and anti-HA IP from AN3CA cells expressing HA-ARID1A fused to biotin ligase TurboID (TbID). B. Distribution of biotinylated proteins fold changes. C. Volcano plots comparing biotinylated protein levels. D. Immunofluorescence analysis of ARID1A and p300 in AN3CA cells. E. Volcano plots comparing detected protein levels following IP-Mass Spec. F. Overlap of ARID1A WT-carrying cBAF interactomes measured using proximity labeling or IP-Mass Spec. G. Protein class enrichment of detected cBAF interacting proteins via IP-MS (DNA interactors in red). H. Input and selected transcription factor (cJUN, NFIA, TEAD1) reciprocal IPs using AN3CA cells expressing empty vector or WT- and mutant-ARID1A.
Though the proximal protein repertoire of ARID1A DBDmut carrying cBAF complexes was similar to that of WT cBAF, these complexes were defective in genomic localization (Fig. 3A). To identify the reason behind this observation, we used IP-Mass Spectrometry (IP-MS) to identify high-stringency protein interactors of cBAF complexes and determine whether these interactors are lost upon ARID mutation. We identified 1076 interacting proteins that were dependent on ARID1A WT for association with cBAF, >90% of which overlapped with those identified in the TurboID-based proximity labeling experiments (Fig. 4E-F, Fig. S4J, Table S2). cBAF-interacting factors were particularly enriched for TFs such as FOS/Jun, TEAD1, NFIA, NFIB, RELA, GATA2, ATF3, and CUX1, consistent with the roles of TF-cBAF interactions in genomic navigation53,54 (Table S2). The identified TFs correspond to key cognate DNA motifs that were enriched under ARID1A IDR-dependent sites genome-wide (Fig. 4G, Fig. 3F, Fig. S4K). Of the DNA-interacting IP-MS hits, 75% are transcription factors, of which, six that interact with cBAF by IP-MS also have motifs enriched in Cluster 2/3 sites, including cJUN, NFIA and TEAD1 (Fig. 4G). Importantly, by IP-MS, ARID1A DBDmut-carrying complexes were equally deficient for TF tethering as IDR-mutant complexes (Fig. 4E, Fig. 3A), suggesting that the ARID domain stabilizes a broad set of TF-cBAF interactions. Similarly, transcription initiation machinery components detected by proximity labeling were not enriched by IP-MS, indicating these factors localize near to but do not directly bind cBAF complexes (Fig. 4F, Table S1). Finally, reciprocal co-immunoprecipitation followed by immunoblots for selected TFs demonstrated specific binding to WT but not mutant ARID1A-containing cBAF complexes, indicating these interactions are dependent on the N-terminus (Fig. 4H, Fig. S4L). These parallel proximity labeling and IP-MS experiments define the related but distinct sets of proximal and stringent interactions mediated by the ARID1A N-terminus, and the role of the ARID domain in stabilizing functional associations with TFs mediated by disordered regions within ARID1A.
Genomic targeting and protein interactions of cBAF complexes requires the ARID1A-specific IDR
Given the critical role of the ARID1A/B IDRs in driving condensation, protein interactions, and genomic localization of cBAF in cells, we sought to determine whether these functions can be performed by other phase separation-prone IDRs. To evaluate this, we generated constructs replacing IDR1 of ARID1A with alternate well-known self-interacting IDRs from FUS and DDX455 (Fig. 5A). As expected, given the retention of the ARID1A CBR, these fusion constructs were able to nucleate cBAF assembly in AN3CA cells (Fig. S5A). Live-cell microscopy revealed the presence of condensates in FUSIDR- and DDX4IDR-ARID1A mutant expressing cells, comparable in count, area, saturation concentration and FRAP dynamics to those detected in the ARID1A WT condition (Fig. 5B-D, Fig. S5B-C), suggesting that these alternate IDRs are sufficient for condensation of cBAF in living cells.
Figure 5. Sequence-specific heterotypic interactions of ARID1A IDR1 are required for cBAF-mediated chromatin and gene regulation.

A. Schematic of ARID1A FUSIDR and DDX4IDR fusion mutant variants. B. Representative images of eGFP-tagged constructs in live AN3CA cells. C. Count and average area of condensates. Statistical test: one way ANOVA. D. FRAP curves, Immobile fraction, and half time of recovery (T1/2) quantification for indicated constructs. Error bars: standard deviation. n = 3 biological trials, 15 cells each. Statistical test, one way ANOVA. E. Chromatin occupancy of cBAF complexes marked by HA (ARID1A), SMARCA4 and SMARCC1, H3K27ac enhancer mark occupancy and DNA accessibility (ATAC-Seq) at Cluster 2 and 3 sites from Fig. 3A. F. Fold change of differentially expressed genes (DEGs) relative to empty vector. G. Volcano plots comparing detected protein levels by IP-MS. Hits meeting the cut off of log2 fold change <−1 and >1 and p-value <0.25 are blue and red, respectively. H. Immunofluorescence analysis of ARID1A and p300. I. Top, metaplots of SMARCA4 occupancy over cBAF sites (shared SMARCA4/SMARCC1 sites) ΔIDR1 (left) or CBR-only (right) cBAF complex target sites; Bottom, metaplots of ATAC-Seq accessibility. J. Example tracks of SMARCA4 occupancy and DNA accessibility in the ARID1A CBR-only, FUSIDR, and DDX4IDR mutant conditions at the BRD2 and CD320 genomic loci.
To define whether FUSIDR/DDX4IDR-ARID1A can rescue cBAF chromatin-targeting, we profiled complex occupancy, DNA accessibility and gene expression in AN3CA cells. We focused specifically on de novo cBAF-occupied and accessible sites that were specific to the WT ARID1A condition (Fig. 3A, Clusters 2, 3). Importantly, cBAF complexes containing FUSIDR/DDX4IDR-ARID1A were unable to recapitulate WT targeting, indicating sequence-specific functions of ARID1A IDR1 (Fig. 5E, Fig. S5D-E). PCA of ATAC-Seq sites revealed that FUSIDR and DDX4IDR ARID1A mutants clustered more closely with ΔIDR1 than ARID1A WT, suggesting that although they rescue cBAF condensation, they fail to recapitulate genomic targeting, and implicating ARID1A IDR1 in cBAF chromatin occupancy (Fig. S5E). Importantly, FUSIDR/DDX4IDR-ARID1A variants failed to activate gene expression relative to WT ARID1A (Fig. 5F, Fig. S5F).
Next, we investigated the underlying basis for the specificity of ARID1A IDR1 in mediating cBAF activity using IP-MS experiments. Following confirmation that replacement of ARID1A IDR1 with FUS- or DDX4-derived IDRs does not alter cBAF assembly (Fig. S5G), we found that FUSIDR- and DDX4IDR-ARID1A mutant carrying cBAF complexes each failed to capture TFs associating with WT cBAF complexes (Fig. 5G, Table S1). As expected, proximity labeling experiments using a FUSIDR-ARID1A-TbID fusion construct confirmed that FUSIDR-ARID1A failed to restore proximity of cBAF to TFs and the transcriptional machinery relative to ARID1A WT (Fig. S5H-I, Table S2). Instead, the repertoire of proteins nearby FUSIDR-ARID1A containing cBAF complexes were more similar to the ΔIDR1 ARID1A mutant-carrying BAF (Fig. S5J, Fig. S4F). Further, immunofluorescence confirmed that p300 does not colocalize with cBAF complexes carrying FUS/DDX4IDR-ARID1A fusions, without affecting nuclear protein levels of p300 (Fig. 5H, Fig. S5K-L). Finally, FUS/DDX4IDR-ARID1A fusions had increased occupancy over ΔIDR1 or CBR-only ARID1A bound sites, absent any corresponding changes in chromatin accessibility (Fig. 5I), exemplified over the BRD2 and CD320 loci (Fig. 5J), suggesting similar off-target binding in all these mutant conditions. These data indicate that generic condensation of BAF is insufficient for genomic targeting in cells, imparting a marked specificity to the ARID1A N-terminal IDR and indicating that condensate-driving IDRs need not be functionally interoperable with one another.
Analysis of ARID1A IDR1 sequence features enables uncoupling of condensation and heterotypic protein-protein interactions
To decipher the underlying basis of the specificity of ARID1A IDR1, we performed IDR-specific comparative analyses of the “sequence grammar” of ARID1A/B IDRs, including distinctive compositional biases, non-random binary sequence patterns that influence conformational properties of IDRs, and the presence, if any, of short linear motifs56. To uncover these features, we collated all disordered sequences across the entire mSWI/SNF family of protein subunits (within cBAF, PBAF, ncBAF complexes) and analyzed their amino acid compositional and sequence patterning features using the NARDINI+ algorithm6,56,57, which combines the work of Zarin et al., and Cohan et al, and enunciates the findings in terms of sequence feature vectors. These vectors were then hierarchically clustered using Euclidean distance and Ward’s clustering6,56. We found that IDR1 of ARID1A and ARID1B cBAF-defining subunits represents a distinct evolutionary cluster away from all other mSWI/SNF IDRs, including IDR2 of ARID1A/B, indicating that they harbor distinctive non-random sequence features (Fig. 6A).
Figure 6. Sequence patterning analysis enabled separation of condensation and heterotypic interaction functions in ARID1A IDR1.

A. Clustering analysis of non-random amino acid sequence features performed across all IDRs within mSWI/SNF proteins. Z-scores for enriched/’blocky’ or depleted/’well-mixed’ sequence features are shown as a green-to-purple color scale. Red arrow: ARID1A/B IDRs. IDR sequence feature key in panel B. B. Left, enrichment of amino acid sequence features across Clusters 1–4 of mSWI/SNF IDR patterns; Right, IDR sequence feature key. C. Schematic for 42YS and AQG scramble ARID1A IDR1 rationally designed mutant variants. D. NARDINI plots of ARID1A IDR1 WT, AQG scramble and 42YS mutant IDRs. Amino acid key on left. E. Immunoblot for input and anti-HA IP from AN3CA cells. F. Live cell imaging of eGFP-tagged cBAF complexes containing WT ARID1A and the 42YS or AQG scramble IDR1 variants. G. Condensation metrics for ARID1A WT and mutants (3 biological trials of n=25 cells each); error bars represent SEM. **p=0.002 by unpaired t-test. H. Clustered heatmap of chromatin occupancy of cBAF complexes marked by HA (ARID1A), SMARCA4 and H3K27ac enhancer mark occupancy and DNA accessibility (ATAC-Seq) across empty, WT ARID1A and the 42YS or AQG scramble IDR1 ARID1A mutants. I. Overlap between Cluster B lost sites from H and Clusters 2,3 lost sites from Figure 3A. J. Top DEGs in WT and 42YS and AQGscram conditions relative to empty control. K. TbID proximity labeling results for the AQG scramble and 42YS mutants compared to ARID1A WT. Hits meeting the cut off log2 fold change < −1 and >1 and p-value <0.2 are labeled in blue. L. Immunofluorescence of p300 and eGFP-tagged cBAF complexes containing WT ARID1A or AQG scramble. M. Nuclear protein input and anti-TF IP-immunoblot studies.
The ARID1A/B IDR1s are uniquely enriched in Alanine-Glutamine-Glycine stretches or “blocks” (Fig. 6B, Fig. S6A). This highly non-random blocky patterning in the ARID1A/B IDR1s was found to be conserved across eukaryotes (at the phyla level) despite divergence in the amino acid sequence across homologs (Fig. S6B). Additionally, we identified a pronounced compositional bias, with more than 40 aromatic residues (Tyrosine, Tryptophan, and Phenylalanine) distributed uniformly across the 1016-amino acid IDR; aromatic residues contribute to pi-pi and cation-pi interactions that have been shown to drive homotypic (self) interactions and phase separation in IDRs from other condensation-prone proteins including FUS58,59. Given these features, we next generated ARID1A IDR1 mutant variants that either disrupt blockiness of AQG patches by scrambling the amino acid content within them (AQGscram), or disrupt aromatic character by mutating 42 Tyrosines to Serines (42YS) (Fig. 6B-C). Both designs maintain the overall IDR length. Disruption of AQG blocks in the AQGscram mutant and preservation in the 42YS mutant were confirmed using NARDINI6 (Fig. 6D). Following confirmation that these mutant variants maintained expression level and complex integration when expressed in AN3CA cells, we performed live condensate imaging. ARID1A 42YS mutant-containing cBAF complexes failed to form condensates in cells, while the AQGscram mutant-containing complexes formed condensates comparable to those carrying WT ARID1A, with slightly increased area and attenuated FRAP recovery times (Fig. 6E-G, Fig. S6C). These data indicate that the 42 Tyrosine residues found in ARID1A IDR1 are the main “stickers”60 that drive phase separation of the 1.04 MDa cBAF complex, and that the evolutionarily conserved, non-random AQG blocks found in this region are not essential for cBAF condensate formation.
Importantly, both the 42YS and AQGscram ARID1A mutant variants show equivalent failure to rescue cBAF localization and DNA accessibility at de novo WT cBAF-occupied sites (n=9159 sites), in a manner similar to the DBDmut, ΔIDR1, and CBR mutants (Fig. 6H, Fig. S6D-H, Fig. 3A). >60% of the sites with reduced occupancy of these two convergent mutants overlapped with reduced occupancy sites in ΔIDR1, CBR, or DBDmut contexts (Fig. 6I, S6F-G, Fig. 3A, Clusters 2 and 3). At the gene expression level, expression of 42YS and AQGscram ARID1A mutants resulted in overall downregulation of genes relative to WT ARID1A (Fig. 6J, S6H).
To further understand the mechanism of action of these two IDR disruptions, we mapped the proximal protein repertoire of complexes containing the 42YS or AQGscram mutant using TbID-based proximity labeling. Intriguingly, we find that complexes carrying the 42YS mutant have a comparable proximal protein repertoire to WT, while complexes containing the AQGscram are severely deficient in their interaction network (Fig. 6K, Table S2). Indeed, we found a significant reduction in p300 colocalization in the setting of the ARID1A AQG scramble variant (Fig. 6L, Fig. S6J). Both mutants are deficient in direct TF tethering, as assayed by coimmunoprecipitation immunoblot analysis of the TFs NFIA and TEAD1 (Fig. 6M). This suggests a sequence-encoded separation of functions for the ARID1A N-terminal IDR1 region, namely condensate formation through Tyrosine residues, and partner protein interactions through specificity imparted by AQG blocks. Both roles together are essential for direct TF tethering and proper genomic localization of cBAF in cells. Of note, FUS and DDX4 IDRs also utilize aromatic residues for pi-pi (FUS) and cation-pi (DDX4) interactions as drivers of condensation though they lack the AQG blocks found in the ARID1A IDR. Therefore, while these orthogonal systems were able to rescue condensation of cBAF in cells, they were unable to recapitulate the network of functionally relevant heterotypic interactions (Fig. S6H, Fig. 6A-C).
NDD-associated mutations in ARID1B IDR1 sequence blocks disrupt cBAF condensate formation and chromatin localization
Finally, we sought to utilize our understanding of IDR sequence grammar to rationalize human disease-associated missense mutations that localize to the IDRs of ARID1A/B. Referencing a collated list of neurodevelopmental disorder (NDD)-associated mutations from the DECIPHER database, we find that ARID1B is enriched for this category of mutations relative to its paralog, ARID1A (Fig. 7A, Fig. S7A).
Figure 7. Mutations in ARID1B IDR1 sequence pattern disrupt condensation and genomic targeting of cBAF.

A. Mutational frequencies in ARID1A/B IDRs associated with neurodevelopmental disorders (NDD) from DECIPHER. B. NDD-associated mutations (DECIPHER) plotted across the 26 sequence blocks within IDR1 of ARID1B. C. Schematic of ARID1B WT, block deletion, and NDD mutants. D. Immunoblot for nuclear input and anti-HA IP experiments in AN3CA cells expressing HA-tagged ARID1B WT or mutants. E. Representative images of eGFP-tagged ARID1B in AN3CA cells. F. Condensation metrics of ARID1B in AN3CA cells. G. SMARCA4 genomic localization over severely lost sites in Block 9 deletion (left) and Block 13 deletion (right). H. PCA of ATAC-Seq peaks across ARID1B WT and mutant conditions. I. Example tracks of cBAF localization and ATAC accessibility over NCAPH and IL1B loci in ARID1B WT and mutant conditions. J. Transcription factor motif enrichment analysis (HOMER) of Cluster Y sites (Figure S7). K. Change in NFI TF family TMT-MS signal in the S320_G327del mutant condition relative to WT ARID1B. L. Differential gene expression changes for top upregulated genes in WT versus Block 9 and 13 deletions and mutant conditions. M. Relative gene expression changes of top differential genes across WT and mutant conditions. N. Model highlighting the role of the ARID1A N-terminus.
Mapping the occurrence of NDD-associated mutations within the 26 AQG-rich blocky sequences (Fig. 6) reveals that Block 9, a large A/G-rich block, and Block 13, a shorter polyA-rich sequence, are disproportionately perturbed (Fig. 7B, 7C). We designed and cloned ARID1B in-frame truncation variants lacking these regions (Block 9 or Block 13 deletion) and selected causal NDD-associated mutations falling within these regions (S320_327del within Block 9, and A457_G461del within Block 13) (Fig. 7C) to test for condensation, genomic localization, and accessibility generation in cells. As expected, the ARID1B mutant variants did not affect cBAF complex assembly (Fig. 7D). We found that the block deletions and patient-derived ARID1B mutant-carrying complexes are still capable of condensation (Fig. 7E), and their mobility by FRAP is not significantly different from wild-type (Fig. S7B), in line with the result that scrambling the blocky AQG sequences did not abolish condensation propensity or significantly affect cBAF complex diffusion (Fig. 7E, Fig. 6F). Interestingly, the saturation concentration of Block 13 del mutant is higher than wild type, suggesting that deleting this block disrupts self-interaction, though this phenotype is not significant in the shorter patient derived A457_G461del mutant (Fig. 7E-F). While we do not observe major changes in condensate count (except for the S320_G327del mutant), we notice an overall increase in condensate area (Fig. 7F), similar to that observed for the ARID DNA-binding domain mutant variant (Fig. 2D), suggesting that these mutations may disrupt TF tethering or chromatin-bound stability. To contextualize these results, we measured the effect of the SMARCA2/4 ATPase inhibitor, Compound 14, on the condensation propensity of the complex61,62. ATPase inhibition has been demonstrated to result in destabilized cBAF complexes at distal enhancers at which they interact with key TFs, resulting in accumulation of complexes over open promoters46,63. Consistently, upon ATPase inhibition, we find formation of cBAF condensates, albeit fewer puncta and with greater area per nucleus (Fig. S7C).
We mapped chromatin occupancy of cBAF carrying ARID1B WT or mutants (CUT&RUN) and measured DNA accessibility (ATAC-Seq) as well as gene expression (RNA-Seq) to test the functional impact of deletion and disease-associated IDR perturbations on cBAF function. We found that the Block 9 and Block 13 deletion mutants exhibit substantial loss of localization, while patient-derived mutants S320_G327del and A457_G461del that map to Blocks 9 and 13, respectively, result in partial but significant localization defects, consistent with their compatibility with life in individuals with NDDs (Fig. 7G-H, S7D-F). These findings are exemplified at the NCAPH and IL1B loci on chromosome 2 (Fig. 7I). Importantly, HOMER TF motif enrichment analyses identified motifs corresponding to the AP-1, FOS/Jun, NF1, and TEAD factors to be enriched over sites at which cBAF complexes were defective in targeting and accessibility generation in the mutant conditions relative to WT ARID1B (Fig. 7J). In line with this, by IP-mass spectrometry, we identified a significant reduction in association of the NFI TF family with cBAF complexes carrying the NDD-associated S320_327del ARID1B variant (Fig. 7K, Table S1). Finally, NDD-associated mutations and block deletions resulted in a significant attenuation in gene expression activation relative to ARID1B WT, particularly over key differentiation-associated genes (Fig. 7L-M). These results underscore the impact of in-frame disruptions within the ARID1A/B IDRs on cBAF remodeler function and present a foundation for the mechanistic assignment and characterization of such mutations in human disease.
Discussion
Most studies on chromatin regulatory complexes, including mSWI/SNF complexes, have focused on highly structured domains, characterizing how their physical features dictate chromatin binding and activity. Our findings provide understanding of a unique disordered domain present on a remodeler, the mSWI/SNF family cBAF complex, for which localized condensation and heterotypic interactions are both essential, and independently directed by a distinct set of non-random sequence features encoded within ARID1A/B N-terminal IDRs (Fig. 7N). These features are critical in governing cBAF-mediated genome-wide targeting, accessibility generation, and gene regulatory activities.
Our results reveal that IDR1 of ARID1A/B carries a set of unique sequence features relative to all IDR sequences within the mSWI/SNF family subunits (Fig. 6A). We found that deleting IDR1 alone almost entirely prevents condensate formation of full, >1.5 MDa cBAF complexes in cells. Additionally, within IDR1, short GA/A block deletions or NDD-associated mutations within these blocks maintained condensation but attenuated TF binding and genomic targeting of WT cBAF complexes. Furthermore, our data imply that while other cBAF complex subunits contain IDRs, they do not confer self-interaction properties sufficient for condensation. Beyond cBAF, additional subunits within the mSWI/SNF family contain IDRs, suggesting by extension that IDRs of related chromatin remodelers may serve as critical components of spatial genome organization (Fig. S6A). Further, the protein subunits that comprise human cBAF complexes contain increased intrinsic disorder relative to those of yeast SWI/SNF complexes27. This suggests a model in which additional IDRs evolved to confer condensation properties and highly specific protein-protein interaction networks, to facilitate gene regulation in the mammalian nucleus.
Incubation of cBAF complexes with DNA in vitro potentiates condensation. This can be reversed by inactivation of ARID DNA-binding domain, despite the fact that the core module of cBAF complexes contain several other sequence non-specific DNA-binding domains, highlighting its unique function (Fig. 2A-B). Moreover, the ARID domain is required for cBAF to appropriately interact with TFs in the nucleus (Fig. 4E), implying a distinct role for the ARID1A/B ARID domain. These results begin to provide insights regarding the order of events of nucleation and assembly of cBAF complexes on chromatin, their interactions with DNA, and their association with binding partners.
One notable finding of our study is that alternate low complexity IDRs derived from unrelated proteins cannot rescue cBAF genomic targeting and protein interactions in cells (Fig. 5E, Fig 5G) despite identical condensation properties (Fig. 5C-D), underscoring the key roles for condensation-specific and interaction-specific sequence grammars in IDRs64–75. The integrative approach used here enabled our conclusions; indeed, quantification of condensation alone would have suggested the IDR swap mutants are functionally comparable to WT ARID1A, yet when combined with genomic and biochemical evaluation, we found that condensation alone does not confer cBAF function.
Importantly, condensate formation and heterotypic biomolecular interaction networks can be distinct, each playing critical but separable roles in biological function. We demonstrate here that condensate formation and protein-protein interactions of the ARID1A N-terminal IDR are independent of each other, but they are both required for chromatin targeting of cBAF in cells. Our results suggest that cells may be able to regulate and evolve these features independently to create localized, compositionally defined, and functionalized, high concentration compartments in a modular way.
Our analysis of the non-random sequence features of cBAF IDRs provides a framework upon which to mechanistically assign the extensive number of disease-associated missense and indel mutations that fall within the ARID1A/B IDRs (Fig. 1C). Our data suggest that NDD-associated changes of just a few amino acids within the ARID1B IDR partially alters condensation properties, TF interactions, and chromatin-level targeting in cells (Fig. 7), though expectedly these changes are more subtle than full block deletions or complete IDR deletion (Fig. S7G), in agreement with the knowledge that NDD-associated mutations are live birth compatible. Intellectual disability (Coffin-Siris syndrome)-associated mutations in the C-terminal domain of the SMARCB1 subunit result in similarly subtle live-cell phenotypes41.
Limitations of the Study:
Significant additional investigation will be needed to define the similarities and differences between these frameworks and other nuclear, and even other mSWI/SNF family subunit, IDRs, particularly given that repertoires of TFs and other IDR-interacting factors expressed among different cell types are highly variable. Further, it remains to be determined whether chemical approaches to disrupt the protein interaction network encoded by the ARID1A/B IDRs, inhibit the DNA-binding domain, or affect the biophysical properties leading to condensate formation may represent viable targeted strategies for specific cancers in which BAF complexes represent synthetic lethal dependencies.
STAR Methods
Resource Availability
Lead Contact
Further information and requests for resources and reagents should be directed to and will be fulfilled by the lead contact, Cigall Kadoch (cigall_kadoch@dfci.harvard.edu).
Materials Availability
Cell lines generated in this study will be available upon reasonable request from the Lead Contact.
Data and Code Availability
All genomic data have been deposited on the NCBI Gene Expression Omnibus via GSE209961.
No original code was created in this study.
Any additional information required to reanalyze the data reported in this paper is available from the lead contact upon request.
Experimental Models and Study Participant Details
Cell lines and culture conditions
All human and mouse cell lines were grown at 37 °C with 5% CO2. HEK293T and U2OS cell lines are female human cells. HEK293T ΔARID1A/B and U2OS cells were grown in DMEM media (Gibco) supplemented with 10% FBS (Gibco), 1X GlutaMAX (Gibco), 100 U/mL Penicillin-Streptomycin (Gibco), 1 mM Sodium Pyruvate (Gibco), 1X MEM NEAA (Gibco), and 10 mM HEPES (Gibco). AN3CA endometrial cancer cells are human female cells and were grown in EMEM media (Gibco) supplemented with 15% tetracycline-free FBS (Omega), 1X GlutaMAX (Gibco), 100 U/mL Penicillin-Streptomycin (Gibco), 1 mM Sodium Pyruvate (Gibco), 1X MEM NEAA (Gibco), and 10 mM HEPES (Gibco). For immunofluorescence data, U2OS and MDA-MB-231 (human female breast-cancer derived) cells were grown in DMEM media with glucose, glutamine and pyruvate (ThermoFisher) supplemented with 10% FBS (Avantor) and 100 U/mL Penicillin-Streptomycin (Gibco). KLE (ATCC CRL-1622, human female uterine cell line), C2C12 (ATCC CRL-1772, female mouse myoblast cells) and CRL-7250 male human foreskin fibroblast cells were cultured in the same but with 20% FBS. MCF10A and MCF10-CA human female breast cancer cells were cultured in DMEM:F12 (Gibco 21041025) supplemented with 5% Horse serum (Sigma), 20 ng/mL EGF, 1 μg/mL Hydrocortisone, and 10 μg/mL Insulin. U2OS cell lines were authenticated by STR profiling.
Primary rat neuron dissection and culture
The inner 60 wells of 96 well glass bottom plates were treated with 0.01 mg/mL poly-D-lysine at 37 °C overnight and washed x4 in HBSS. The outer 36 wells of the 96 well plate were filled with ultrapure water. 50 μL of neuron media (Gibco Neurobasal Plus with 2% Gibco B27 Plus, 1% penstrep, and 250 ng/mL Amphotericin B) with 2% Gibco CultureOne supplement (antimitotic) was added to each well, and the plates were stored at 37 °C overnight, 5% CO2. Embryos were collected from euthanized Sprague-Dawley rats (Hilltop Lab Animals Inc.) at embryonic day 17 via caesarian section. The embryos in placentas were transferred to HBSS in 10 cm glass plates. The placenta was cut from each embryo, the heads were removed and transferred to a new glass plate with HBSS. Using a dissection microscope, the skull was removed by making a medial cut from caudal to rostral following the central sulcus using small scissors held parallel to the brain, cutting just the skull layer and not into cortex. Closed scissors were used to get under the brain from the caudal side and gently flip brain out, cutting away any remaining attachment. Brains were transferred to a new glass plate with HBSS. Meninges were carefully and thoroughly removed starting with the ventral side, flipping to dorsal side, removing caudal to rostral along the central sulcus, gently unraveling the cortex from the central sulcus. The cortex was cut away from the striatum and other structures and transferred to a 10 mL conical with HBSS.
Worthington papain dissociation kit was used to dissociate cortices into individual cells in a biosafety cabinet using sterile technique. Reagents were prepared as described by the kit. HBSS was carefully removed from the cortices and 5 mL papain solution was added (100 units papain, 1000 units DNase I, 1 mM L-cysteine, 0.5 mM EDTA in HBSS). The conical was inverted thrice and then incubated at 37 °C for 20 minutes, with no agitation or inversion after the incubation. The papain solution was removed, and 3 mL of inhibitor solution (3 mg ovomucoid inhibitor, 3 mg albumin, and 500 units DNase I in HBSS) was added to the cortices, inverted thrice, and sat upright for 5 min. Supernatant was removed and replaced with 3 mL additional inhibitor solution, inverted thrice, and sat upright for 5 min. Supernatant was removed and 1.5 mL neuron media was added. A flame-treated Pasteur pipette was used to slowly triturate up and down ten times, avoiding bubbles. Cells were allowed to settle in the upright tube for 2 min. The top 750 μL of dissociated cells were removed and added to a new 10 mL conical. 750 μL neuron media was added to the original tube, triturated ten times, settled in the upright tube for 2 min, and the top 750 μL of dissociated cells were transferred to the new 10 mL conical. This process was repeated one more time, for a total of three trituration steps, adding all of the media with cells to the new tube after the final trituration. Cells were centrifuged for 5 min at 300 g, supernatant removed, resuspended in 1 mL neuron media, and counted using a hemocytometer. Cells were diluted in additional neuron media to achieve 25,600 cells in 50 μL per well (80,000 cells per cm2 growing area). 50 μL of diluted cells were added to each well of the previously prepared plates to bring the final volume to 100 μL with 1% CultureOne supplement. CultureOne supplement was not used again after this treatment on day in vitro (DIV) 0. Cells were grown at 37 °C with 5% CO2. On DIV3 100 μL more neuron media was added. Every 3–4 days after that, 95 μL media was removed from each well and replaced with 100 μL fresh media and 5 μL ultrapure water to counter evaporation. Neurons were fixed and used for immunofluorescence on DIV11.
Quantification and statistical analysis
Statistical analyses on quantified imaging data was performed with Prism. Statistical details, exact values of n and what n represents (individual cells or biological replicates) for each experiment can be found in the figure legends. In general, p values of significance less than 0.05 are denoted with one asterisk ‘*’, less than 0.01 with two asterisks ‘**’, less than 0.001 with three ‘***’ and less than 0.0001 with four asterisks ‘****’. No outlier data was omitted, no samples were excluded from our analyses. To identify differentially expressed genes (DEGs) or differentially interacting proteins, t-tests were performed on RNA-sequencing and mass spec data respectively. Error bar representation is indicated in the figure legends.
Method Details
Plasmids, cloning and expression
All ARID1A/B constructs used in this study were HA-tagged at the N-terminus and cloned into a piggybac vector downstream of a Doxycycline-inducible promoter. The vector also contains a separate Tet-On 3G gene and Blasticidin or Puromycin resistance gene cassette separated by a P2A sequence, under the human EF1a promoter. All constructs were sequence verified using Sanger sequencing. Piggybac plasmids were co-transfected with a mammalian expression plasmid carrying a transposase gene cassette in AN3CA using Lipofectamine 3000 (Thermo Fisher) and selected with 10 ug/ml Blasticidin or 2 ug/ml Puromycin 24 h post transfection for 3–5 days. Expression of the transgene was induced by addition of 200 ng/ml Doxycyline for 48 hours. All plasmids used in this study are listed in the STAR Methods section.
Coimmunoprecipitation
cBAF complex coimmunoprecipitation
BAF complex immunoprecipitation was performed as described previously21. Cells were washed with cold PBS and resuspended in EB0 hypotonic buffer containing 50 mM Tris-HCl pH7.5, 0.1% NP-40,1 mM EDTA, 1 mM MgCl2 supplemented with protease inhibitors. Lysates were pelleted at 5,000 rpm for 5 min at 4 °C. Supernatants were discarded, and nuclei were resuspended in EB300 high salt buffer containing 50 mM Tris pH 7.5, 300 mM NaCl, 1% NP-40, 1 mM EDTA, 1 mM MgCl2 supplemented with protease inhibitors. Lysates were incubated on ice for 10 min with occasional vortexing and then spun at 21000 g for 11 min at 4 °C. 0.5–1 mg of nuclear lysate was used for immunoprecipitation with rabbit anti-HA antibody (1:200 v/v) (Cell Signaling Technology) overnight at 4 °C to bind to HA-tagged ARID1A/B (bait). Protein-G Dynabeads (ThermoFisher) were then added for 2 hours and washed five times with EB300. Protein was eluted from beads with 4X LDS buffer by boiling for 7 min and loaded onto SDS-PAGE gels for Western blotting. Antibodies are listed in the STAR Methods section.
Transcription factor-cBAF complex coimmunoprecipitation
Reciprocal immunoprecipitations to validate cBAF Immunoprecipitation-Mass Spectrometry results were performed as follows: Cells were washed with cold PBS and resuspended in EB0 hypotonic buffer containing 50 mM Tris-HCl pH 7.5, 0.1% NP-40, 1 mM EDTA, 1 mM MgCl2 supplemented with protease inhibitors. Lysates were pelleted at 5,000 rpm for 5 min at 4 °C. Supernatants were discarded, and nuclei were resuspended in EB150 salt buffer containing 50 mM Tris-HCl pH 7.5, 150 mM NaCl, 1% NP-40, 1 mM EDTA, 1 mM MgCl2 supplemented with protease inhibitors. Lysates were incubated on ice for 10 min with occasional vortexing and then spun at 21000 g for 11 min at 4 °C. 1–2.2 mg of nuclear lysate was used for immunoprecipitation with rabbit anti-NFIA, rabbit anti-TEAD1, or rabbit anti-cJUN antibodies (1:200 v/v) (Cell Signaling Technology) overnight at 4 °C. Protein-G Dynabeads (ThermoFisher) were then added for 2 hours. The beads were then extremely gently washed on a magnet three times with EB150 supplemented with protease inhibitors to avoid disrupting low affinity interactions, followed by boiling in 4X LDS buffer for 7–10 min and loading onto SDS-PAGE gels for Western blotting. Antibodies are listed in STAR Methods.
Western blotting
Western blot analysis was performed using a standard protocol. Nuclear extracts were separated using a 4%–12% Bis-Tris PAGE gel (Bolt 4%–12%Bis-Tris Protein Gel, Thermo Fisher) and transferred onto 0.2 μm Nitrocellulose membranes (Biorad) at 400 mA for 2 hours on ice. Membranes were blocked with 5% milk in 1X TBST for 30 min at room temperature and then incubated with primary antibody overnight at 4 °C (1:2000 v/v for Cell Signaling antibodies, 1:1000 v/v for others). They were then washed thrice with 1X TBST and incubated with near-infrared fluorophore-conjugated species-specific secondary antibodies (LI-COR Biosciences) for 1 hour at room temperature (1:10,000 v/v). Following secondary antibody incubation, membranes were washed twice with 1X TBST, once with 1X TBS, and imaged using a Li-Cor Odyssey CLx imaging system (LI-COR Biosciences).
ATAC-seq
Omni-ATAC protocol was used to measure DNA accessibility with slight modifications covered below91. 100,000 cells per sample were trypsinized and washed with cold PBS to remove trypsin. Cell pellets were lysed in 50 μL cold resuspension buffer (RSB) supplemented with fresh NP40 (final 0.1% v/v), Tween-20 (final 0.1% v/v), Digitonin (final 0.01% v/v) (RSB recipe: 10 mM Tris-HCl pH 7.4, 10 mM NaCl, and 3 mM MgCl2). Lysis step was quenched with 1 mL of RSB supplemented with Tween-20 (final 0.1% v/v) and nuclei were pelleted at 500 g for 10 min at 4 °C after incubating on ice for 3 minutes. Nuclei were then resuspended in 50 μL transposition reaction mix containing 25 μL 2X Tagment DNA buffer (Illumina), 2.5 μL Tn5 transposase (Illumina), 16.5 μL 1X PBS, 0.5 μL 1% digitonin (final 0.01% v/v), 0.5 μL 10% Tween-20 (final 0.1% v/v), and 5 μL nuclease-free water. The transposition reaction was °C for 30 min with constant shaking (1000 rpm) on a thermomixer. Tagmented DNA was purified using the MinElute Reaction Cleanup Kit (Qiagen). Standard ATAC-seq amplification protocol with 7 cycles of amplification was used to amplify tagmented libraries45. Libraries were sequenced on a NextSeq 500 (Illumina) using 37 bp pair-end sequencing.
CUT&Tag
CUT&Tag was performed as described previously62 using a protocol developed by Epicypher (https://www.epicypher.com/content/documents/protocols/cutana-cut&tag-protocol.pdf) in 8-strip PCR tubes with slight modifications as described below. Briefly, Concanavalin A (ConA) coated magnetic beads (Polysciences) were activated with Bead Activation Buffer containing 20 mM HEPES pH 7.9, 10 mM KCl, 1 mM CaCl2, 1 mM MnCl2; beads were stored on ice until used. 300,000 cells/sample were trypsinized and pelleted by centrifugation at room temperature (600g for 3 min). Cells were lysed using cold Nuclear Extraction Buffer containing 20 mM HEPES–KOH pH 7.9, 10 mM KCl, 0.1% Triton X-100, 20% Glycerol supplemented with fresh 0.5 mM Spermidine and 1X protease inhibitor (Roche) for 2 min. Nuclei were pelleted by centrifugation (600 g for 3 min), resuspended in 100 ul/sample Resuspension buffer (20 mM HEPES pH 7.5, 150 mM NaCl supplemented with fresh 0.5 mM Spermidine and 1X protease inhibitor) and incubated with activated ConA beads at room temperature for 15 min. The nuclei-ConA bead complexes were then resuspended in Antibody 150 Buffer containing 20 mM HEPES pH 7.5, 150 mM NaCl, 2 mM EDTA supplemented with fresh 0.5 mM Spermidine, 1X protease inhibitor, 0.01% Digitonin, and 0.5 ug primary antibody/sample. Following overnight incubation at 4°C on a nutator, supernatant was discarded, and the ConA-nuclei complexes were then incubated with Digitonin 150 buffer (20 mM HEPES pH 7.5, 150 mM NaCl, 0.5 mM Spermidine, 1X protease inhibitor, 0.01% Digitonin) supplemented with 0.5 ug/sample Secondary antibody for 1 hour at room temperature on a nutator. They were then washed with Digitonin 150 Buffer twice before resuspension in 50 μL cold Digitonin 300 Buffer containing 20 mM HEPES, pH 7.5, 300 mM NaCl, 0.5 mM Spermidine, 1X protease inhibitor, and 0.01% Digitonin. 2 μL CUTANA pAG-Tn5 (Epicypher) was added to each sample and incubated on a nutator for 1 hr at room temperature. Following incubation, beads were washed twice with cold Digitonin 300 Buffer. Targeted chromatin tagmentation and library amplification were carried out according to Epicypher’s protocol mentioned above. Size distribution was measured on a D1000 ScreemTape run on a TapeStation 2200 (Agilent). Equimolar amounts of barcoded libraries were pooled and sequenced on a NextSeq 500 (Illumina) using 37 bp pair-end sequencing with the goal of achieving a minimum of 8–10 million reads per library.
CUT&RUN
CUT&RUN was performed based largely on Epicypher’s protocol (https://www.epicypher.com/content/documents/protocols/cutana-cut&run-protocol.pdf) and the CUT&Tag protocol described above but with key modifications as described below. Briefly, Concanavalin A (ConA) coated magnetic beads (Polysciences) were activated with Bead Activation Buffer containing 20 mM HEPES pH 7.9, 10 mM KCl, 1 mM CaCl2, 1 mM MnCl2; beads were stored on ice until used. 500,000 cells/sample were trypsinized and pelleted by centrifugation at room temperature (600 g for 3 min). Cells were lysed using cold Nuclear Extraction Buffer containing 20 mM HEPES–KOH pH 7.9, 10 mM KCl, 0.1% Triton X-100, 20% Glycerol supplemented with fresh 0.5 mM Spermidine and 1X protease inhibitor (Roche) for 2 min. Nuclei were pelleted by centrifugation (600 g for 3 min), resuspended in 100 ul/sample Resuspension buffer (20 mM HEPES pH 7.5, 150 mM NaCl supplemented with fresh 0.5 mM Spermidine and 1X protease inhibitor) and incubated with activated ConA beads at room temperature for 15 min. The nuclei-ConA bead complexes were then resuspended in Antibody 150 Buffer containing 20 mM HEPES pH 7.5, 150 mM NaCl, 2 mM EDTA supplemented with fresh 0.5 mM Spermidine, 1X protease inhibitor, 0.01% Digitonin, and 0.5 ug primary antibody/sample. Following overnight incubation at 4 °C on a nutator, the supernatant was discarded, and the ConA-nuclei complexes were then washed twice with Digitonin 150 buffer (20 mM HEPES pH 7.5, 150 mM NaCl, 0.5 mM Spermidine, 1X protease inhibitor, 0.01% Digitonin). They were then resuspended in Digitonin 150 buffer and 2.5 μL of CUTANA pAG-MNase (Epicypher) was added to each sample followed by incubation on a nutator for 30–60 min. The supernatant was then discarded and the ConA-nuclei complexes were washed twice with Digitonin 150 buffer and resuspended in fresh Digitonin 150 buffer supplemented followed by addition of 1 μL of 100 mM CaCl2 to each sample. The samples were then incubated on a nutator for 2 hours at 4 °C, followed by addition of the Stop buffer (340 mM NaCl, 20 mM EDTA, 4 mM EGTA, 50 ug/mL RNase A, 50 ug/ml Glycogen). Samples were then incubated at 37 °C for 10 minutes to release MNase-digested DNA fragments. The supernatants were then transferred to a new tube and DNA was purified using the MinElute Reaction Cleanup Kit (Qiagen). Libraries were prepared using the CUTANA CUT&RUN Library Prep Kit (Epicypher). Size distribution was measured on a D1000 ScreemTape run on a TapeStation 2200 (Agilent). Equimolar amounts of barcoded libraries were pooled and sequenced on a NextSeq 500 (Illumina) using 37 bp pair-end sequencing with the goal of achieving a minimum of 8–10 million reads per library.
NGS Data Processing
CUT&Tag, CUT&RUN, ATAC-Seq, and RNA-Seq samples were sequenced on an Illumina NextSeq500 instrument. RNA-Seq reads were aligned to the hg19 genome with STAR v2.5.2b77, and tracks were generated using the deepTools v2.5.3 bamCoverage function78 with the normalizeUsingRPKM parameter. Output gene count tables from STAR were used as input into the edgeR v3.12.1 R software package77,80 to evaluate differential gene expression. For ATAC-Seq data, read trimming was carried out by Trimmomatic v0.3681, followed by alignment, duplicate read removal, and read quality filtering using Bowtie282, Picard v2.8.0 (http://broadinstitute.github.io/picard/), and SAMtools v 0.1.1983, respectively, and ATAC-seq peaks were called with MACS2 v2.184 using the BAMPE option and a broad peak cutoff of 0.001. For ATAC-Seq track generation, output BAM files were converted into BigWig files using MACS2 and UCSC utilities92 in order to display coverage throughout the genome in RPM values. For CUT&Tag and CUT&RUN libraries, the CutRunTools pipeline was leveraged to perform read trimming, quality filtering, alignment, peak calling, and track building using default parameters85. All sequencing data analyzed in this study have been deposited at NCBI’s Gene Expression Omnibus under accession number GSE209961.
CUT&Tag, CUT&RUN and ATAC-seq data analyses
Heatmaps and metaplots displaying signals aligned to peak centers were generated using ngsplot v2.6386. RPM values were quantile normalized across samples, and K-means clustering was applied to partition the data into groups. The Bedtools multiIntersectBed and merge functions were used for peak merging79, and distance-to-TSS peak distributions were computed utilizing Ensembl gene coordinates provided by the UCSC genome browser. Principle Component Analysis was performed using the wt.scale and fast.svd functions from the corpcor R package on CUT&Tag/CUT&RUN quantile normalized log2-transformed RPKM values within merged peaks87,88. Transcription factor motif enrichment analyses were carried out by the HOMER v4.9 93 software.
cBAF complex purification
mSW/SNF complex purification was performed essentially as described previously21,41. Briefly, HEK293TARID1A/B knock-out cells stably expressing HA-tagged ARID1A WT or mutants under a doxycycline-inducible promoter created using piggybac transfection (described above) were plated in 50–100 15-cm plates. Expression of the bait (HA-ARID1A) was induced by addition of 200 ng/ml Dox for 48 hours. Cells were then scraped from plates, washed with cold PBS, and centrifuged at 5,000 rpm for 5 min at 4 °C. Pellets were resuspended in hypotonic buffer (HB: 10 mM Tris HCl pH 7.5, 10 mM KCl, 1.5 mM MgCl2, supplemented with 1 mM DTT and 1 mM PMSF) and incubated for 5 min on ice.
The suspension was centrifuged at 5,000 rpm for 5 min at 4 °C, and pellets were resuspended in 5 volumes of HB containing protease inhibitor cocktail. The suspension was then homogenized using a glass Dounce homogenizer (Kimble Kontes). Nuclei were pelleted by centrifugation at 5000 rpm for 15 min at 4 °C. Nuclear pellets were resuspended in high salt buffer (HSB: 50 mM Tris HCl pH 7.5, 300 mM KCl, 1 mM MgCl2,1mM EDTA, 1% NP40 supplemented with 1 mM DTT, 1 mM PMSF, and 1X protease inhibitor cocktail). The homogenate was then incubated on a rotator for 1 hr at 4 °C followed by centrifugation at 20,000 rpm for 1 h at 4 °C using a SW32Ti rotor in an ultracentrifuge. The high salt nuclear extract supernatant was filtered through a 5 μm filter (EMD Millipore) and incubated with Pierce Anti-HA Magnetic Beads (Thermo Fisher) overnight at 4 °C. HA beads were washed 6 times in HSB and eluted with HSB containing 2 mg/mL of HA peptide (GenScript) for four elutions of 2 h each followed by one overnight elution. Eluted proteins were then subjected to dialysis (Slide-A-Lyzer MINI Dialysis Device, 10K MWCO, ThermoFisher) using Dialysis Buffer (25 mM HEPES pH 8.0, 0.1 mM EDTA, 100 mM KCl, 1 mM MgCl2, 15% glycerol, and 1 mM DTT) overnight at 4 °C, and finally concentrated using Amicon Ultracentrifugal filters (30kDa MWCO, EMD Millipore). Complexes were aliquoted, flash frozen in liquid nitrogen and stored at −80 °C.
In vitro condensation assay
Purified cBAF complexes containing C-terminally eGFP-tagged ARID1A WT, DBDmut, ΔIDR1 or CBR were stored in 25 mM HEPES pH 8.0, 0.1 mM EDTA, 100 mM KCl,1 mM MgCl2,15% glycerol, and 1 mM DTT, at −80 °C. Reaction chambers for the in vitro assay were prepared by coating the interior glass of a 96-well glass bottom plate (Cellvis, P96–1.5H-N) with 1% w/v PF-127 (Pluronic F-127, ThermoFisher, P3000MP) for 15 minutes. Unused wells were filled with distilled water to maintain humidity in the nearby reaction chambers and prevent sample evaporation. Protein complexes were thawed on ice, then diluted to four concentrations (2, 0.66, 0.22, 0.074 μM) in physiological salt buffer (150 mM NaCl, 25 mM HEPES pH 7.5) in 4 μL reaction volume. For assays containing DNA, nucleosomes, or RNA, each reaction additionally contained 100 ng/μL DNA, 100 ng/μL nucleosomes, or 100 ng/μL RNA. Source of DNA was a linearized double-stranded 10 kb plasmid of random sequence. Nucleosomes were mono- di- and tri-nucleosomes purified from HeLa cells (Epicypher). Source of RNA was in vitro transcribed 18s rRNA from HEK293T cell cDNA (ThermoFisher). Reactions were allowed to equilibrate at room temperature for 30 min for droplets to form and settle onto the coverslip. Visualization of the reaction chambers was performed on a spinning-disk confocal microscope (Yokogawa CSU-X1) with 100X oil immersion Apo TIRF objective (NA 1.49) and Andor DU-897 EMCCD camera on a Nikon Eclipse Ti inverted microscope body. Images were obtained in DIC (Differential Interference Contrast) and GFP (488 nm laser) channels; at least 6 fields of view per sample were gathered. For quantification, images were deidentified, segmented for droplets in the GFP channel using FIJI90, and droplet area measured. ‘Percent Area’ metric was calculated for each image as the area in microns squared covered by droplets over the area in microns square of the entire field of view.
Fluorescence recovery after photobleaching (FRAP)
FRAP assays were performed in AN3CA patient-derived endometrial cells with doxycycline-inducible expression of C-terminally eGFP-tagged ARID1A or ARID1B constructs. Cells were plated in 24-well glass bottom plates (Cellvis) 48 hours prior to imaging. Expression was induced 24 hours prior to imaging by exchanging for media with 200 ng/mL doxycycline (Fisher Scientific). Cells were imaged on a Nikon Ti2 microscope equipped with an A1R HD25mm scanhead, with Plan Apo λ 1.4 NA oil lens, maintained at 37 °C and 5% CO2 with a Tokai Hit Stagetop incubator equipped with a Ti ZWX stage insert. Images were obtained with 0.1–0.8 % laser power 488 nm with 10–70 HU gain at 11.11X zoom, 1 AU pinhole, 256×256 pixels each 0.0625 μm. Three pre-bleach images were acquired, then bleaching was performed with the 488 laser at 10% power. Post-bleach images acquired every 0.25 seconds for the first 10 seconds, every 1 sec for the next 20 sec, then every 5 sec for the next 2 minutes. For each construct, three biological replicates were prepared, and at least 15 cells bleached per replicate. For quantification, movies were registered using StackReg plugin in FIJI94, bleached area recognized by segmentation, then intensity of the bleached area in each frame measured. Measurements were normalized by subtracting the background (nucleoplasmic) intensity, then dividing over the average pre-bleach intensity from three pre-bleach images.
Live time-lapse movies
AN3CA cells expressing ARID1A-WT-eGFP, ARID1A-DBDmut-eGFP, ARID1B-WT-eGFP or ARID1B-DBDmut-eGFP were prepared on the Nikon Ti2 microscope with A1R scanhead and Tokai Hit Stagetop incubator as described above. Images were obtained with 0.1–0.8% laser power 488 nm with 10–70 HU gain at 4X zoom, 1Au pinhole, 512×512 pixels. Images were obtained every 20 seconds for 60 minutes to observe long-term stability of condensates, or every 5 seconds for 10 minutes to observe fusion and coalescence of nuclear puncta.
Immunofluorescence
AN3CA cells were plated in 24-well glass bottom plates at 50% confluency (Cellvis) 48 hours prior to fixation, and expression induced 24 hours prior to fixation by adding 200 ng/mL doxycycline (Fisher Scientific). Cells were washed once with DPBS, then fixed in 4% paraformaldehyde (diluted in DPBS from 16% paraformaldehyde, Electron Micrsocopy Science #15710) for 15 minutes at room temperature. Fixed cells were washed three times, five minutes each in room temperature DPBS, then permeabilized in 0.2% PBST (Triton X-100, ThermoFisher) for 60 minutes with rocking. Permeabilized cells were washed again three times, five minutes each in room temperature DPBS, then blocked in 0.1% PBST with 5% goat serum (Vector Laboratories S-1000–20) + 5% BSA for 60 minutes with rocking. Cells were stained with primary antibody in block overnight at room temperature with rocking (1:500 rabbit mAb anti-p300; 1:500 rabbit mAb anti-SMARCC1; 1:1000 rabbit mAb anti-ARID1A or 1:1000 rabbit mAb anti-ARID1B). Cells were washed three times, five minutes each with DPBS, then stained with secondary antibody (1:5000 Goat anti-rabbit highly cross-adsorbed 568-conjugated antibody) for 3 hours with rocking at room temperature. This antibody staining protocol was developed to faithfully recognize condensates in exogenous ARID1A WT-eGFP-expressing AN3CA cells, then applied to the additional panel of cell types (KLE, CRL-7250, MDA-MB-231, MCF10A, MCF10-CA, C2C12 mouse myoblasts and primary rat cortex neurons). All antibodies are listed in the STAR Methods.
Saturation Concentration Measurement
Microscope fluorescence intensity to concentration calibration
Prior to imaging, the Nikon A1 scanning confocal microscope and oil immersion objective (Plan Apo 60X/1.4, Nikon) were calibrated for fluorescence-to-concentration conversion using Fluorescent Correlation Spectroscopy for mCherry and GFP (568 nm and 488 nm lasers) as in Bracha et al 201842. Briefly, mCherry fluorescence was converted to absolute concentration using FCS, then GFP fluorescence conversion was done by an exact mCherry-to-GFP fluorescence ratio with mCherry-P2A-eGFP construct. Diffusion and concentration were measured with 30 sec FCS measurement time, then a conversion table was created for fluorescence-intensity-to-concentration at specific optical settings. Activation was performed with an 488 nm excitation channel power of 84 uW/um2, measured with an optical power meter (PM100D, Thorlabs), and images obtained with 1% head power on 488 nm laser, with intensity 0.1–1%, gain between 10–70 HU, 1X zoom, 1 AU pinhole (33.2 μm), 1024×1024 pixels.
Measuring saturation concentration
AN3CA cells were plated in 24-well glass bottom plates (Cellvis) 48 hours prior to imaging, and expression induced 24 hours prior to imaging by adding 200 ng/mL doxycycline (Fisher Scientific). Live cells were imaged on a Nikon A1 point-scanning laser confocal with 60X oil immersion lens of NA 1.4. Cells were maintained at 37 °C and 5% CO2 with Okolab stagetop incubation. To quantitatively determine saturation concentration, images of nuclei were obtained with calibrated settings, then nuclei segmented from background in FIJI by Otsu’s method and classified as having no condensates (no PS) or as having condensates (yes PS) by the variance in pixel intensity across a 4μm x 4 μm area within the nucleus that does not overlap a skewing feature like a nucleolus; those areas with no puncta have low variance (<10% of mean intensity), while those with condensates have high variance (>10% of mean intensity). Concentrations of ARID1A/B in each nucleus were mapped and plotted, and the threshold at which the ‘yes PS’ and ‘no PS’ categories are most separated by a logistic regression was marked as the Saturation Concentration.
Condensate count and area measurements
To quantify the number and size of condensates per nucleus, the identified nuclei counted as ‘yes PS’ were subjected to further image analysis. These images of a single z plane within nuclei were segmented by IsoData method in FIJI to recognize the puncta, then their count per nucleus and average size per nucleus was recorded using the Analyze Particles feature in FIJI. To account for cell-to-cell variability, in general three biological replicates were performed with greater than 100 cells measured in each replicate, then the averages of three replicates plotted with standard error shown as error bars.
Light cycling experiments
U2OS cells expressing the Corelet components were subjected to repeated on-off cycles of 488 laser exposure. To do this, the cells were imaged for three ‘pre-activation’ frames, one every five seconds, in only the mCherry (561 nm laser) channel. Then, images were acquired every 5 seconds for 3 minutes in both GFP and mCherry channels, which exposes them to 488 nm light and ‘activates’ the Corelet system to form condensates. Droplets were then dissipated for 5 minutes by only imaging in the mCherry channel and reactivated again for two more cycles of (3 minutes activation + 5 minutes deactivation). Nuclei were registered using HyperStackReg in FIJI (doi:10.5281/zenodo.2252521), then Pearson Correlation Coefficient of nuclear pixel intensities in the last frame of each activation cycle was calculated using the JaCoP plugin95.
Restriction Enzyme Accessibility Assay (REAA)
Purified cBAF complexes carrying ARID1A WT or mutants were quantified using SMARCA4 protein levels via Western Blotting using SMARCA4 standards (Epicypher). Complexes were added to a 30 μL reaction containing 3 μL REAA buffer (20 mM HEPES pH 7.5, 5 mM Tris-HCL pH 7.5, 40 mM KCl, 2 mM MgCl2), 1 mM DTT, 5 nM unmodified nucleosomes (Epidyne Nucleosome Remodeling Assay Substrate ST601-GATC1, 50-N-66, Biotinylated, Epicypher), 10 U/μL DpnII restriction enzyme (New England Biolabs), 0.5 mM ATP (Ultrapure ATP, Promega), °C in a PCR thermocycler. After incubation, 15 μL of the reaction was used to measure ATPase activity using ADP-Glo Max Assay kit (Promega). The rest of the reaction was quenched with 20 mM EDTA and 12 μg Proteinase K (Ambion) and incubated at 55 °C for 1 h and 80 °C for 10 min, followed by DNA purification using 1X AMPure beads (Beckman Coulter) and DS1000 High Sensitivity DNA ScreenTape analysis (Agilent).
ATPase activity measurement
15 μL of the REAA reaction was transferred to a 96-well white bottom plate containing 5 μL water followed by addition and mixing of 20 μL of ADP Glo reagent. The plate was covered in aluminum foil and placed on a shaker for 1 hour. 40 μL of the ADP Glo detection reagent was then added and mixed, followed by another 1 hour incubation on the shaker with the plate covered in foil. Luminescence was measured using a spectrophotometer.
ARID domain purification
The ARID1A ARID domain (amino acids 958–1375) (wild-type and the DNA binding mutant S1086E, S1087E, S1091E) was cloned in an in-house bacterial expression vector downstream of a GST tag and transformed into E. coli Rosetta (DE3) cells. Colonies were grown in Terrific broth at 37 °C in the presence of 100 μg/ml Carbenecillin and 25 μg/ml Chloramphenicol until OD600 was 0.7. Protein expression was then induced with 1 mM IPTG and the culture was incubated at room temperature for 5 hours at 225 rpm, following which cells were pelleted by centrifugation at 5000 rpm for 10 min. Pellets were washed once with cold PBS and frozen at −80 °C. For protein purification, pellets were resuspended in 40 ml cold Lysis buffer (50 mM Tris-HCl pH 7.5, 500 mM NaCl, 1% NP-40, 0.5 mg/ml lysozyme, 1 mM DTT) supplemented with protease inhibitors. Cells were lysed by sonication on ice and the lysate was centrifuged at 20,000 rpm for 1 hour at 4 °C. The clarified lysate was then incubated with magnetic Glutathione beads (ThermoFisher) (washed twice in lysis buffer) on a rotator for 2 hours at 4 °C. The beads were washed five times with Wash buffer (50 mM Tris-HCl pH 8, 500 mM NaCl, 1 mM DTT) supplemented with protease inhibitors. Five elutions were performed using Wash buffer supplemented with 20 mM reduced Glutathione (Boston Bioproducts). 10 μL of each elution fraction was denatured in 2X LDS buffer and subjected to SDS-PAGE. The gel was stained with Coomassie Blue and fractions containing protein were pooled. The pooled fractions were buffer exchanged in dialysis buffer (25 mM HEPES pH 7.5, 100 mM KCl, 1 mM MgCl2, 0.1 mM EDTA, 10% glycerol) overnight at 4 °C. Following dialysis, GST-ARID protein levels were quantified using Protein Qubit (ThermoFisher), aliquoted, flash frozen in liquid Nitrogen and stored at −80 °C.
Electrophoretic mobility shift assay (EMSA)
GST-ARID protein (WT or DBDmut) and an IRDye800-tagged dsDNA probe (random sequence) were incubated in 10 μL EMSA buffer (20 mM Tris-HCl pH 7.5, 20 mM NaCl, 20 mM KCl, 10% glycerol, 10 μg/ml BSA, 1 mM DTT) at room temperature for 30 min. Following incubation, 2 μL of Gel loading dye lacking SDS (New England Biolabs) was added to the reactions and run on 1% TAE agarose gels at 125 V for 20 min. Gels were then imaged using a Li-COR Odyssey CLx imaging system (LI-COR Biosciences).
10–30% glycerol gradient sedimentation
Glycerol gradient-based sedimentation was performed as previously described21. 1 mg nuclear extracts were loaded on top of linear, 11 ml 10%–30% glycerol gradients containing 25 mM HEPES pH 8.0, 0.1 mM EDTA, 12.5 mM MgCl2, 100 mM KCl supplemented with 1 mM DTT and protease inhibitors. Tubes were then loaded into a SW41 rotor and centrifuged at 40,000 rpm for 16 hours at 4 °C. 550μL fractions were manually collected from the top of the gradient, to which 10 μL of Strataclean beads (Agilent) were added and incubated on a rotator for 1 hour at °C for 10 min. The mixture was then spun at 21000 g for 1 min, and the supernatants were loaded onto SDS-PAGE gels followed by Western blot analysis.
Proximity labeling and TMT Mass Spectrometry
Proximity labelling using TurboID
Proximity labelling was performed as previously described51,52. Briefly, no ligase Control or ARID1A-TurboID (WT or mutant) fusion expressing AN3CA cells were treated with 200 μg/ml Doxycycline to induce gene expression for 48 h, following which cells were labelled with 50 μM Biotin (Sigma Aldrich) for 10 min. Media was aspirated and cells were washed five times with sterile cold PBS on the plate. They were then scraped and resuspended in EB0 hypotonic buffer containing 50 mM Tris pH7.5, 0.1% NP-40, 1 mM EDTA, 1 mM MgCl2 supplemented with 1X protease inhibitors. Lysates were pelleted at 5000 rpm for 5 min at 4 °C. Supernatants were discarded, and nuclei were resuspended in EB300 high salt buffer containing 50 mM Tris pH 7.5, 300 mM NaCl, 1% NP-40, 1 mM EDTA, 1 mM MgCl2 supplemented with 1X protease inhibitors. Lysates were incubated on ice for 10 min with occasional vortexing and then spun at 21000 g for 11 min at 4 °C. Supernatants were quantified and supplemented with 1 mM DTT. 1.3 mg nuclear lysate was then incubated with magnetic Streptavidin beads (Thermo Fisher) on a rotator at 4 °C for 2 hours to isolate biotinylated proteins. Beads were then washed twice with EB300, once with 1 M KCl, and five times with 100 mM HEPES pH 8.0, following which they were resuspended in 100 μL of 100 mM HEPES pH 8.0 and flash frozen for mass spectrometry analysis. Each sample was run in biological triplicate.
Protein Digestion
Beads were resuspended in 200 mM HEPES pH 8.5 and digested at room temperature for 13 h with Lys-C protease at a 100:1 protein-to-protease ratio. Trypsin was then added at a 100:1 ratio and the reaction was incubated 6 h at 37 °C. Peptides were separated from beads, vacuum centrifuged to near-dryness and desalted via StageTip.
Tandem mass tag labeling
For labeling, a final acetonitrile concentration of ~30% (v/v) in 200 mM HEPES pH 8.5 was added along with 2 μL of TMT reagent (20 ng/mL) to the peptides in 25 μL total volume. Following incubation at room temperature for 1.5 h, the reaction was quenched with hydroxylamine to a final concentration of 0.3% (v/v) for 15 min. The TMT-labeled samples were pooled at a 1:1 ratio across all samples. The combined sample was vacuum centrifuged to near dryness and subjected to C18 solid-phase extraction (SPE) via Sep-Pak (Waters, Milford, MA).
Off-line basic pH reversed phase (BPRP) fractionation
The pooled TMT-labeled peptide samples were fractionated using the Pierce High pH Reversed-Phase Peptide Fractionation Kit (ThermoFisher). Twelve fractions were collected using: 7.5%, 10%, 12.5%, 15%, 17.5%, 20%, 22.5%, 25%, 27.5%, 30%, 35%, and 60% acetonitrile and every sixth samples was concatenated, resulting in a total of six fractions per experiment. Samples were subsequently acidified with 1% formic acid and vacuum centrifuged to near dryness. Each fraction was desalted via StageTip, dried again via vacuum centrifugation, and reconstituted in 5% acetonitrile, 5% formic acid for LC-MS/MS processing.
Liquid chromatography and tandem mass spectrometry
Mass spectrometry data were collected using an Orbitrap Eclipse mass spectrometer (ThermoFisher) coupled to a Proxeon EASY-nLC 1200 liquid chromatography (LC) pump (ThermoFisher). Peptides were separated on a 100 mm inner diameter microcapillary column packed with ~30 cm of Accucore150 resin (2.6 μm, 150 Å, ThermoFisher). For each analysis, we loaded ~2 μg onto the column and separation was achieved using a 90 min gradient of 5 to 25% acetonitrile in 0.125% formic acid at a flow rate of ~450 nL/min. For the high-resolution MS2 (hrMS2) method, the scan sequence began with an MS1 spectrum (Orbitrap analysis; resolution, 60,000; mass range, 400−1600 Th; automatic gain control (AGC) target 100%; maximum injection time, auto). All data were acquired with FAIMS using three CVs (−40V, −60V, and −80V) each with a 1 sec TopSpeed method. MS2 analysis consisted of high energy collision-induced dissociation (HCD) with the following settings: resolution, 50,000; AGC target, 200%; isolation width, 0.7 Th; normalized collision energy (NCE), 37; maximum injection time, 86 ms.
Data analysis
Mass spectra were processed using a Comet-based software pipeline96,97. Spectra were converted to mzXML using a modified version of ReAdW.exe. Database searching included all entries from the human UniProt database. This database was concatenated with one composed of all protein sequences in the reversed order. Searches were performed using a 50-ppm precursor ion tolerance for total protein level profiling. TMTpro tags on lysine residues and peptide N termini (+304.207 Da) and carbamidomethylation of cysteine residues (+304.207 Da) were set as static modifications, while oxidation of methionine residues (+15.995 Da) was set as a variable modification. Peptide-spectrum matches (PSMs) were adjusted to a 1% false discovery rate (FDR) 98,99. PSM filtering was performed using a linear discriminant analysis, as described previously 100, while considering the following parameters: XCorr, ΔCn, missed cleavages, peptide length, charge state, and precursor mass accuracy. For TMT-based reporter ion quantitation, we extracted the summed signal-to-noise (S/N) ratio for each TMT channel and found the closest matching centroid to the expected mass of the TMT reporter ion. PSMs were identified, quantified, and collapsed to a 1% peptide false discovery rate (FDR) and then collapsed further to a final protein-level FDR of 1%. Moreover, protein assembly was guided by principles of parsimony to produce the smallest set of proteins necessary to account for all observed peptides. Proteins were quantified by summing reporter ion counts across all matching PSMs, as described previously 100. PSMs with poor quality and reporter summed signal-to-noise ratio less than 100, or no MS3 spectra were excluded from quantification101. Data from all samples were normalized to Acetyl-CoA Carboxylase signal (ACACA), an endogenously biotinylated protein present in all Streptavidin precipitations. ACACA was also omitted from downstream analyses. TMT signal of the No Ligase control was subtracted from samples of respective replicates after ACACA signal normalization and peptide filtering. Signals of replicates were averaged between replicates for downstream analyses. Unless otherwise noted, all plots were generated using matplotlib and seaborn.
Coimmunoprecipitation followed by TMT mass spectrometry (IP-Mass Spec)
Cells were scraped from 15-cm plates, washed with cold PBS and resuspended in EB0 hypotonic buffer containing 50 mM Tris pH7.5, 0.1% NP-40, 1 mM EDTA, 1 mM MgCl2 supplemented with 1X protease inhibitors. Lysates were pelleted at 5000 rpm for 5 min at 4 °C. Supernatants were discarded, and nuclei were resuspended in EB150 salt buffer containing 50 mM Tris pH 7.5, 150 mM NaCl, 1% NP-40, 1 mM EDTA, 1 mM MgCl2 supplemented with 1X protease inhibitors. Lysates were incubated on ice for 10 min with occasional vortexing. Nuclear lysate was pelleted at 21000 g for 11 min at 4 °C. Supernatants were quantified and supplemented with 1 mM DTT. 1.5 mg of nuclear lysate was used for immunoprecipitation with rabbit anti-HA antibody (Cell Signaling Technology) overnight at 4 °Cf on a rotator to isolate cBAF complexes with HA-ARID1A as bait. Protein-G Dynabeads were then added and incubated on a rotator for 2 hours, washed thrice with EB150 and thrice with 100 mM HEPES pH 8.0. They were then resuspended in 5% formic acid to elute protein (2 elutions per sample, 50μL 5% formic acid per elution, 6 minutes incubation at room temperature per elution). Elutions were then pooled per sample and frozen at −80 °C.
Protein Digestion
Eluates were dried in a vacuum centrifuge and resuspended in 200 mM HEPES pH 8.5. Proteins were digested at room temperature for 13 h with Lys-C protease at a 100:1 protein-to-protease ratio. Trypsin was then added at a 100:1 ratio and the reaction was incubated 6 h at 37 °C.
Tandem mass tag labeling
For labeling, a final acetonitrile concentration of ~30% (v/v) in 200 mM HEPES pH 8.5 was added along with 3 μL of TMT reagent (20 ng/μL) to the peptides in 25 μL total volume. Following incubation at room temperature for 1.5 h, the reaction was quenched with hydroxylamine to a final concentration of 0.3% (v/v) for 15 min. The TMT-labeled samples were pooled at a 1:1 ratio across all samples. The combined sample was subsequently acidified with 1% formic acid and vacuum centrifuged to near dryness. The sample was desalted via StageTip, dried via vacuum centrifugation, and reconstituted in 5% acetonitrile, 5% formic acid for LC-MS/MS processing.
Liquid chromatography and tandem mass spectrometry
Mass spectrometry data were collected using an Orbitrap Fusion Eclipse mass spectrometer (ThermoFisher) coupled to a Proxeon EASY-nLC 1200 liquid chromatography (LC) pump (ThermoFisher). Peptides were separated on a 100 μm inner diameter microcapillary column packed with ~30 cm of Accucore150 resin (2.6 μm, 150 Å, Thermo Fisher). For each analysis, we loaded one-half of the sample onto the column and separation was achieved using a 150 min gradient of 3 to 25% acetonitrile in 0.125% formic acid at a flow rate of ~450 nL/min. For this high-resolution MS2 (hrMS2) method, the scan sequence began with an MS1 spectrum (Orbitrap analysis; resolution, 120,000; mass range, 400−1500 Th; automatic gain control (AGC) target, “standard”; maximum injection time, “auto”). All data were acquired with FAIMS using three CVs (−40V, −60V, and −80V) each with a 1 sec. TopSpeed method. MS2 analysis consisted of high energy collision-induced dissociation (HCD) with the following settings: resolution, 50,000; AGC target, 300%; isolation width, 0.5 Th; normalized collision energy (NCE), 36; maximum injection time, 250 ms. The second half of the sample was re-analyzed with a similar method which had a different set of CVs (−30V, −50V, and −70V).
Data analysis
Mass spectra were processed using a Comet-based software pipeline96,97. Spectra were converted to mzXML using a modified version of ReAdW.exe. Database searching included all entries from the human UniProt database. This database was concatenated with one composed of all protein sequences in the reversed order. Searches were performed using a 50-ppm precursor ion tolerance for total protein level profiling. TMTpro tags on lysine residues and peptide N termini (+304.207 Da) and carbamidomethylation of cysteine residues (+304.207 Da) were set as static modifications, while oxidation of methionine residues (+15.995 Da) was set as a variable modification. Peptide-spectrum matches (PSMs) were adjusted to a 1% false discovery rate (FDR) 98,99. PSM filtering was performed using a linear discriminant analysis, as described previously 100, while considering the following parameters: XCorr, ΔCn, missed cleavages, peptide length, charge state, and precursor mass accuracy. For TMT-based reporter ion quantitation, we extracted the summed signal-to-noise (S/N) ratio for each TMT channel and found the closest matching centroid to the expected mass of the TMT reporter ion. PSMs were identified, quantified, and collapsed to a 1% peptide false discovery rate (FDR) and then collapsed further to a final protein-level FDR of 1%. Moreover, protein assembly was guided by principles of parsimony to produce the smallest set of proteins necessary to account for all observed peptides. Proteins were quantified by summing reporter ion counts across all matching PSMs, as described previously 100. PSMs with poor quality and reporter summed signal-to-noise ratio less than 100, or no MS3 spectra were excluded from quantification 101. Scaled TMT values were normalized to the control by subtracting the scaled values of the corresponding replicate control from the scaled values of each condition. These control-normalized values were normalized to bait (ARID1A) by dividing the control normalized values for each condition by the control normalized values for ARID1A. Log-2 fold-changes between each condition and ARID1A WT were calculated using the mean control-bait-normalized values for each condition (any mean control-bait-normalized values less than 0 were set to 0) with a pseudocount of 0.0001. Two-sample t-tests (n=2) with equal variance were used to calculate p-values. Only protein isoforms with the greatest detected peptide counts per gene were used for downstream analysis and visualization. Heatmaps were generated using the control-bait-normalized values. Volcano plots were generated using the log2 fold changes and p-values calculated as described above. A log2FC = +/− 1 and p-value = 0.25 were used to define gained and lost proteins. Unless otherwise noted, all plots were generated using matplotlib and seaborn.
Identification of non-random amino acid sequence features in disordered regions of mSWI/SNF subunits
The Swissprot database was used to download the Homo sapiens proteome (May 2015, 20882 entries). Disordered regions were then extracted from each protein sequence using MobiDB3,102. Specifically, a residue was considered disordered if the consensus prediction labeled it as being disordered. Then, all consecutive disordered stretches greater than or equal to 30 residues in length were extracted to create what we refer to as the human IDRome, consisting of 24508 IDRs. Ninety sequence features previously found to be important for IDR conformational ensembles, phase separation, and function were calculated for all IDRs in the human IDRome6,57. Sequence features are split into two broad categories: patterning and composition. To extract patterning z-scores we employed the NARDINI program6 which calculates the degree of blockiness of groups of residues compared to 105 randomly generated sequences with the same composition. Residues are grouped into the following eight types: polar≡(Q, S, H, T, C, N), hydrophobic≡(I, L, M, V), positive≡(K, R), negative≡(D, E), aromatic≡(F, Y, W), alanine≡A, proline≡P, and glycine≡G. Considering all pairs of residue types leads to 36 patterning features. Positive z-scores imply the patterning of the two residue types is more blocky than random, whereas negative z-scores imply the patterning is more well-mixed than random.
Fifty-four compositional features were also calculated for each human IDR. localCIDER7 was utilized to calculate most of the compositional features including amino acid fractions (20 features), fraction of polar, aliphatic, aromatic, positive, negative, charged, chain expanding, and disorder promoting residues (8 features), the ratio of numbers of Rs to Ks and Es to Ds (2 features), and general features such as the net charge per residue, isoelectric point, hydrophobicity, and polyproline II propensity (4 features). We also calculated 20 patch features defined as the fraction of the IDR in a specific residue or RG patch. Here, W was excluded as no W patch was found in the human IDRome. A patch was calculated as a region of the sequence that had at least four occurrences of the given residue or two occurrences of RG and was not allowed to extend past two interruptions. Then, z-scores for each of the 54 compositional features were generated using the mean and standard deviation of the entire human IDRome. Here, positive z-scores imply the compositional feature is enriched in the IDR of interest, whereas negative z-scores imply the compositional feature is depleted in the IDR of interest.
Ninety-one IDRs were extracted from the human IDRome from the 29 mSWI/SNF proteins. Sequence feature z-score vectors of the IDRs were hierarchically clustered using the Euclidean distance and Ward’s linkage method. Only sequence features with a standard deviation > 0.1 across all 91 IDRs are shown in Fig. 6A. The sequence features analyzed were divided into six categories: (1: red) patterning of X residues with Z residues, (2: orange) fraction of X residues, (3: green) fraction of IDR in X residue or RG patch, (4: blue) fraction of X+…+Z residues, (5: purple) ratio of number of X residues to Z residues, and (6: grey) additional compositional features calculated using localCIDER (http://pappulab.github.io/localCIDER/). Four clusters were identified: Cluster 1 (red) consists only of the N-terminal ARID1A and ARID1B IDRs which are enriched in blocks of polar residues, alanines, and glycines, Cluster 2 (orange) consists of IDRs enriched in patches of prolines and glutamines, Cluster 3 (green) consists of highly negatively charged IDRs, and Cluster 4 (blue) consists of IDRs enriched in blocks of positive and negative residues.
To quantitatively determine the sequence features enriched / blocky in each of the four mSWI/SNF IDRome clusters, the z-score distributions from the IDRs in each cluster were compared to the z-score distributions of the remaining human IDRome. Colored values in Figure 6B imply that sequence feature is more enriched or blockier in that cluster compared to the rest of the human IDRome. Specifically, the Kolmogorov-Smirnov test was used to determine if the two distributions were identical and extract a p-value for each of the ninety sequence features. If the p-value was less than 0.05, then the signed log10(p-value) was calculated. A positive/negative log10(p-value) implies the mean z-score was greater/less than the cluster distribution compared to the distribution from the remaining human IDRome. Only features with signed log10(p-value) greater than zero for at least one cluster are shown in Fig. 6B.
NARDINI plots
Non-random sequence patterning features of the ARID1A and ARID1B sequences are calculated6. The 20 canonical amino acids are grouped into eight categories: polar, hydrophobic, positively charged, negatively charged, aromatic, Ala, Pro, and Gly. Here, the polar residue categories are further broken down to Q, S, H, and TCN, as noted in the figure legends. The z-scores are calculated with respect to the null model of 105 randomly scrambled sequences with fixed amino acid composition. Z-scores > 0 indicate clustering of residue category into blocks in the linear sequence, whereas z-score < 0 indicate that the residues are evenly distributed, or well-mixed, throughout the sequence.
Amino acid sequence patterning of the N-terminal IDR of eukaryotic ARID1A orthologs
Eukaryotic ARID1A ortholog sequences were obtained from the EggNOG database (KOG2510, N = 307)103. The N-terminal intrinsically disordered regions were extracted for the analysis. In the heatmap, each row corresponds to an ARID1A ortholog sequence, and each column corresponds to the z-score of a sequence feature. H. sapiens ARID1A IDR sequence is outlined in black. Each sequence (row) is color-coded by its taxonomic ranks in phylum, class, and order. The sequence patterning features were calculated as described70. The sequence composition features were calculated from the primary sequence features and the z-scores were calculated with respect to the null model of all ortholog sequences. The dendrogram was generated using the Frobenius norm of the z-score matrices, where the norms were used as Euclidean distances, and Ward’s clustering was used.
Mapping of cancer- and neurodevelopmental disorder-associated mutations on to ARID1A/B non-random pattern blocks
Cancer- and neurodevelopmental disorder-associated ARID1A/B mutations were obtained from Valencia, Sankar et al., Nature Genetics 2023104. Duplicate amino acid mutations were eliminated from the analyses. Silent mutations were not considered. Mutations found in the list were categorized into five categories: deletion, insertion, substitution, frameshift, and complex. Complex mutations indicate occurrence of more than one type of mutation.
Supplementary Material
A. Left, 3D structure of the human cBAF complex (PDB:6LTJ) with the ARID1A C-terminal Core Binding Region (CBR) highlighted; Right, structure of the yeast SWI/SNF complex (PDB:7EGP) with the ARID1A homolog Swi1 highlighted. Residues of complex subunits within 10Å of ARID1A or Swi1 are highlighted in color. B. Mutational frequencies of ARID1A and ARID1B associated with cancer (TCGA) or neurodevelopmental disorders (NDD) (DECIPHER), respectively. Percentages of total cancer and NDD cases for each are indicated. C. Amino acid level conservation between ARID1A and ARID1B, defined by pairwise alignment using EMBOSS Needle. D. Structural models of ARID1A and ARID1B subunits using Alphafold highlights disordered regions (IDR1 and IDR2). The N- and C-termini of IDR1 and 2 and the ARID and CBR (Arm repeat) domains are labeled. E. Nuclear proteins ranked based on degree of disorder using MobiDB-lite. F. Interaction model of the ARID1A ARID domain and dsDNA (PDB: 1RYU, 1KQQ overlap). Highlighted residues S1086, S1087 and S1090 were mutated to glutamic acid (E) to compromise DNA binding (DBDmut mutant). G. Left, electrophoretic mobility shift assay (EMSA) using GST-tagged wild-type (WT) or DBDmut ARID domain proteins (aa958–1375) and a IRDye800 labeled dsDNA probe. Right, quantification of DNA binding. H. Immunoblot performed on nuclear extracts isolated from naïve HEK293T, HEK293T ΔARID1A/B and AN3CA cells. I. Immunoblots performed on nuclear protein input and anti-HA IPs in ΔARID1A/B HEK293T cells with rescue of HA-tagged ARID1A WT or mutant variants. J. Immunoblot of MG-132 proteasome inhibitor treated AN3CA cells expressing ARID1A WT and mutants. K. Density sedimentation analysis using 1030% glycerol gradients performed on nuclear extracts of AN3CA cells (top) and AN3CA cells rescued with HA-WT ARID1A (bottom). L. Immunoblot and quantitative densitometry for HA, SMARCA4 and SMARCC1 performed on purified WT and mutant cBAF complexes used for in vitro nucleosome remodeling assays. M. TapeStation analysis of REAA-based in vitro nucleosome remodeling assays shown in Fig. 1G.
A. Schematic of eGFP-tagged ARID1A WT and mutant constructs. B. Left, silver stain of purified cBAF complexes containing WT or mutant eGFP-tagged ARID1A, purified from HEK293T ΔARID1A/B cells; Middle, Immunoblot of ATPase and core cBAF subunits using purified complexes; Right, quantitative densitometry of HA (ARID1A), SMARCA4, SMARCC1, and SMARCE1. C. Representative images from in vitro droplet assays performed across a range of concentrations for all eGFP-tagged complexes. Scale bar, 20 μm. D. Left, representative images from in vitro droplet assay, scale bar, 20 μm; Right, quantification of droplet area coverage for WT and mutant ARID1A-containing eGFP-tagged cBAF complexes at 2, 0.66, 0.22 and 0.074 μM, alone or with addition of 100 nM DNA, nucleosomes, or RNA. Error bars represent standard deviation of 8 fields of view in each condition. E. Representative images of in vitro droplet assays with 100 nM DNA added in indicated conditions. Strings of droplets from in in WT ARID1A + DNA condition only. F. (Top) Immunoblot for input and (bottom) anti-HA IP in AN3CA rescued with HA-tagged ARID1A WT or mutant eGFP tagged variants. G. Quantitative densitometry of subunit protein levels across conditions from panel F (input and IP). H. Density sedimentation analysis using nuclear extracts of AN3CA cells rescued with eGFP-tagged ARID1A showing that the eGFP tag does not disrupt complex formation. I. Representative images (left) and saturation concentration (right) of Control and MG-132 proteasome inhibitor treated AN3CA cells expressing ARID1A WT-eGFP or mutants. J. Representative images, puncta count and size of eGFP-tagged ARID1B WT and DBDmut in AN3CA cells (n=25 cells each). ****p<0.0001 by unpaired t-test. K. FRAP curves, half time of recovery (T1/2) and Immobile fraction quantification for ARID1A-eGFP (left) and ARID1B-eGFP (right) containing cBAF complexes. Scale bars, 10 μm. Error bars represent standard deviation. n = 3 biological trials containing 15 cells each. P-values were calculated using an unpaired t-test. ns, not statistically significant. L. Confocal imaging of condensates using anti-ARID1A antibody in CRL-7250, MCF10A, MDA-MB-231, and for anti-ARID1B in primary rat neurons, alongside Hoecht stain. Scale bars, 10 μm. M. Representative images of one nucleus expressing each construct without (- light) and with (+ light) light-induced oligomerization through the Corelet system. Scale bars, 10 μm. N. Corelet system phase diagrams of indicated ARID1A constructs in U2OS cells. O-P. Corelet system Phase Diagrams of indicated ARID1B constructs in U2OS cells. Q. Representative images for repeated light activation-deactivation cycles of indicated constructs in Corelet System in U2OS cells, and subsequent Pearson Correlation Coefficient (PCC) of droplet nuclear localization. Scale bars, 10 μm. R. Quantification of PCC across three activation-deactivation cycles for indicated constructs. Error bars represent standard deviation, n = 32, 20, 20 cells. P-values were calculated using a one-way ANOVA test.
A. Metaplots of HA (ARID1A), SMARCA4, SMARCC1, H3K27ac occupancy and DNA accessibility (ATAC) at Clusters 2, 3, and 4 sites from Figure 3A across Empty and ARID1A WT/ mutant conditions. B. Venn diagrams indicating overlap between accessible sites gained in ARID1A WT (red) and DBDmut, ΔIDR1, CBR mutant conditions (green, purple, brown, respectively) in AN3CA cells. C. Principal Component Analysis (PCA) of all ATAC-Seq sites in AN3CA cells across Empty control and ARID1A WT/ mutant conditions. D. RNA-Seq PCA in AN3CA cells across Empty control and ARID1A WT/ mutant conditions. E. Overlap of gained ATAC sites shared between WT, DBDmut, ΔIDR1, CBR conditions. F. Overlap of WT-only gained ATAC sites not overlapping with DBDmut, ΔIDR1, CBR mutant gained sites. G. cBAF (ARID1A, SMARCA4, SMARCC1) and H3K27ac chromatin occupancy (CUT&Tag) at gained DNA-accessible sites (ATAC-Seq) in AN3CA cells expressing ARID1A WT compared to empty control. H. Transcription factor motif enrichment analysis (HOMER) of Cluster 2 sites from panel G. I. Volcano plots reflecting gene expression changes (RNA-Seq) between conditions indicated. Red and blue dots indicate genes up- and down-regulated with an adjusted p-value cutoff of 0.01 and a log2 fold change threshold of 1. J. Up- and down-regulated genes (DEG count) across comparisons indicated. K. Expression of genes nearest to cBAF-occupied sites in Clusters 1–4 from Fig. 3A across ARID1A WT or mutant conditions relative to empty control. L. Differentially expressed genes (left) with differential cBAF target sites (ARID1A/SMARCA4 sites) within 1 kB of genes (right) in ARID1A WT versus empty vector conditions. L. Metascape enrichment analysis performed on genes closest to Clusters 2/3 sites from Figure 3A. Epithelial cell differentiation term highlighted in red.
A. Schematic of HA-tagged ARID1A WT or mutant variants fused to the biotin ligase TurboID (TbID). B. Immunoblot using nuclear extract from AN3CA cells expressing TbID fused to ARID1A WT or mutant variants labeled with 50 μM Biotin for 10 min. C. Schematic for TbID-TMT mass spectrometry experiments. D. Metascape enrichment analysis of downregulated biotinylated hits in ΔIDR1 and CBR compared to WT. E. Left, heatmap of normalized TMT peptide signal of BAF complex subunits; Right, immunoblot of pan-BAF, cBAF, PBAF and ncBAF specific subunits in AN3CA cells expressing ARID1A WT or mutant TbID fusions. F. Normalized TMT signal heatmaps of Clusters 2/3 motif enriched transcription factors from Figure 3A, Mediator complex and RNA Polymerase II-associated proteins across the same conditions as in I. G. Immunoblot of indicated proteins in AN3CA cells expressing ARID1A WT or mutant TbID fusions. H. Co-immunofluorescence studies performed on AN3CA cells rescued with ARID1A WT and mutant variants and visualized for cBAF (eGFP) and SMARCC1. Arrows indicate co-localization. Scale bars, 10 μm. I. Immunoblot for p300 in AN3CA cells expressing Empty control, ARID1A WT-eGFP or mutants. J. Molecular function (GO) enrichment analysis of proteins overlapping between IP-Mass Spectrometry and proximity labelling experiments. K. Correlation of proximity labeling (TurboID) log2 fold change and changes in DNA accessibility (log2 fold change) at Cluster 2 and Cluster 3 sites from Figure 3A across human transcription factors. Factors corresponding to highly enriched motifs (from Figure 3G) are highlighted in red. L. mRNA expression (CPM) of key TF genes across ARID1A rescue conditions in AN3CA cells shown in Fig. 4H.
A-B. Immunoblot for input and anti-HA IP experiments in AN3CA cells expressing HA-tagged or HA- and eGFP dual tagged ARID1A WT or FUS- and DDX- fusion mutant variants along with densitometry measurements. C. Saturation concentration of WT and mutant variants of ARID1A in AN3CA cells calculated using calibrated fluorescence imaging. PS: Phase Separation. D. Metaplots of HA (ARID1A), SMARCA4, SMARCC1, H3K27ac occupancy and DNA accessibility (ATAC) at Clusters 2 and 3 from Figure 3A, across Empty control, ARID1A WT and mutant conditions. E. PCA of all ATAC-Seq sites in AN3CA cells across Empty control, ARID1A WT and mutants. F. Volcano plots comparing global gene expression profiles (RNA-Seq) of AN3CA cells expressing ARID1A mutants (ΔIDR1, FUSIDR, DDX4IDR) compared to ARID1A WT with an adjusted p-value cutoff of 0.01 and a log2 fold change threshold of 1. G. Normalized TMT-MS signal heatmaps of detected cBAF subunits from IP-MS experiments in AN3CA cells. H. Top, schematic of ARID1A WT and mutant TbID fusions; Bottom, immunoblot using nuclear extract from AN3CA cells expressing ARID1A WT-TbID or mutant variants labeled with 50 μM Biotin for 10 min. I. Volcano plots comparing biotinylated protein levels of cBAF in cells expressing ARID1A variants versus WT TbID fusions. J. Normalized TMT-MS signal heatmaps of detected Mediator complex subunits, RNA Polymerase II associated proteins and Clusters 2,3 motif enriched transcription factors from Figure 3A for indicated conditions. K. Immunofluorescence analysis of ARID1A and SMARCC1 in AN3CA cells expressing ARID1A WT-eGFP or indicated mutants. Scale bars, 10 μm. L. Immunoblot for p300 in AN3CA cells expressing ARID1A WT-eGFP or indicated mutants.
A. Schematic for all IDRs across mSWI/SNF subunits. B. IDR sequence patterning conservation of ARID1A orthologs across eukaryotes. C. FRAP studies for WT and AQG scramble mutant sequences; half time of recovery, and mobility measurements are shown. D. Distance-to-TSS for Clusters A-C from Figure 6H. E. HOMER TF motif analysis from Cluster B sites in Figure 6H. F. PCA analyses of SMARCA4 sites, ATAC-seq, and RNA-seq datasets across empty and ARID1A WT or mutant variant conditions in AN3CA cells. G. Metaplots for HA (ARID1A) and ATAC-Seq for Clusters A-C from Figure 6H. H. Volcano plots reflecting changes in gene expression; significantly downregulated and upregulated genes are highlighted in blue and red, respectively. I. Sequence grammar schematics of FUS and DDX4 IDRs, showing their abundance of aromatic residues but lack of blocky AQG patches. J. PCC correlation between ARID1A and p300 across WT and AQGscram conditions.
A. NDD- and cancer-associated mutations (DECIPHER) plotted across distinct blocks within IDR1 of ARID1AB. Types of mutations are indicated in legend. B. Left, FRAP curves for ARID1B-WT-eGFP, Block 9 del, Block 13 del, and NDD-associated mutant-containing cBAF complexes. Error bars represent standard deviation. n = 3 biological trials containing 15 cells each. P-values were calculated using a one-way ANOVA test. ns, not statistically significant. Right, Immobile fraction and T1/2 for all variants. C. Left, schematic of experiment to test the impact of SMARCA2/4 ATPase inhibiton on cBAF condensate formation; Middle, live cell imaging of eGFP-tagged cBAF complexes containing WT ARID1A across indicated conditions. Scale bars, 10 μm. D. Clustered heatmaps reflecting chromatin occupancy of cBAF complexes marked by HA(ARID1B) and SMARCA4 and DNA accessibility (ATAC-Seq) at cBAF occupied sites. E. Distance-to-TSS plots for Clusters defined in panel D. F. PCA of ATAC-Seq peaks for all ARID1B WT and mutant variants. Clustered heatmaps reflecting chromatin occupancy of cBAF complexes marked by HA(ARID1B) and SMARCA4. G. PCA of ATAC-Seq peaks for all ARID1A/B variants tested.
Supplemental Movie S1: Time lapse live imaging of AN3CA cells expressing eGFP-tagged ARID1A and ARID1B WT and DBDmut constructs, related to Figure 2.
Supplemental Table S1: TMT-Mass Spectrometric analyses of HA-tagged ARID1A/B WT and mutants, related to Figures 4 and 7.
Supplemental Table S2: TMT-Mass Spectrometric analyses of TurboID-based proximity labelling experiments, related to Figures 4 and 6.
Key Resource Table
| REAGENT or RESOURCE | SOURCE | IDENTIFIER |
|---|---|---|
| Antibodies | ||
| HA (Rabbit) | Cell Signaling Technology | Cat#3724; RRID: AB_1549585 |
| HA (Mouse) | Cell Signaling Technology | Cat#2367; RRID: AB_10691311 |
| SMARCA4 (D1Q7F) | Cell Signaling Technology | Cat#49360; RRID: AB_2728743 |
| SMARCC1 | Cell Signaling Technology | Cat#11956; RRID: AB_2797776 |
| SMARCC2 | Cell Signaling Technology | Cat#12760; RRID: AB_2798017 |
| ARID1A | Cell Signaling Technology | Cat# 12354, RRID:AB_2637010 |
| ARID1B | Cell Signaling Technology | Cat#65747; RRID: AB_2799694 |
| ARID1B | Abcam | Cat#ab57461; RRID: AB_2243092 |
| ARID2 | Cell Signaling Technology | Cat#82342; RRID: AB_2799992 |
| GLTSCR1 | Santa Cruz Biotechnology | Cat#sc-515086 |
| DPF2 | Santa Cruz Biotechnology | Cat#sc-514297 |
| SMARCD1 | Santa Cruz Biotechnology | Cat#sc-135843; RRID: AB_2192137 |
| SMARCE1 | Bethyl Laboratories | Cat#A300-810A; RRID: AB_577243 |
| GAPDH | Santa Cruz Biotechnology | Cat#sc-365062; RRID: AB_10847862 |
| SMARCA4 | Santa Cruz Biotechnology | Cat#sc-17796; RRID: AB_ 626762 |
| SMARCA4 | Cell Signaling Technology | Cat#72182; RRID:AB_2799815 |
| SMARCC1 | Santa Cruz Biotechnology | Cat#sc-137138; RRID: AB_ 2191994 |
| SMARCB1 | Santa Cruz Biotechnology | Cat#sc-166165; RRID: AB_2270651 |
| H3K27ac | Cell Signaling Technology | Cat#8173; RRID: AB_10949503 |
| p300 | Cell Signaling Technology | Cat#86377; RRID: AB_2800077 |
| MED1 | Cell Signaling Technology | Cat#51613; RRID: AB_2799397 |
| MED26 | Cell Signaling Technology | Cat#14950; RRID: AB_2798656 |
| BRD4 | Cell Signaling Technology | Cat#13440; RRID: AB_2687578 |
| RPB1 (CTD unmodified, YSPTSPS) | Santa Cruz Biotechnology | Cat# sc-56767, RRID:AB_785522 |
| RPB1 (Ser5 phospho) | Cell Signaling Technology | Cat#13523; RRID: AB_2798246 |
| TEAD1 | Cell Signaling Technology | Cat#12292; RRID: AB_2797873 |
| TEAD1 | Santa Cruz Biotechnology | Cat#sc-393976; RRID: AB_2721186 |
| NFIA | Cell Signaling Technology | Cat#69375 |
| NFIA | Santa Cruz Biotechnology | Cat#sc-74444; RRID: AB_2153048 |
| cJUN | Cell Signaling Technology | Cat#9165; RRID: AB_2130165 |
| cJUN | Santa Cruz Biotechnology | Cat#sc-74543; RRID: AB_1121646 |
| IR800-Streptavidin | LI-COR Biosciences | Cat#926-32230 |
| IR680 anti-mouse secondary | LI-COR Biosciences | Cat#926-68070; RRID: AB_10956588 |
| IR680 anti-rabbit secondary | LI-COR Biosciences | Cat#926-32211; RRID: AB_621843 |
| Goat anti-rabbit highly cross-adsorbed 568-conjugated antibody | ThermoFisher | Cat#A-11036; RRID: AB_10563566 |
| Guinea Pig anti-Rabbit IgG (Heavy & Light Chain) antibody | Antibodies-Online | Cat#ABIN101961; RRID: AB_10775589 |
| Bacterial and virus strains | ||
| One Shot™ Stbl3™ Chemically Competent E. coli | ThermoFisher | Cat#C737303 |
| NEB® Turbo Competent E. coli (High Efficiency) | New England Biolabs | Cat#C2984H |
| Rosetta (DE3) competent cells | Novagen | Cat#70954 |
| Chemicals, peptides, and recombinant proteins | ||
| GST-tagged ARID domain WT | This study | |
| GST-tagged ARID domain DBDmut | This study | |
| Blasticidin S HCl | ThermoFisher | Cat#R21001 |
| Puromycin dihydrochloride | Sigma-Aldrich | Cat#P8833-25MG |
| Doxycycline (hyclate) | Cayman Chemical | Cat#14422 |
| Carbenecillin disodium | Gold Bio | Cat#C-103-5 |
| Chloramphenicol | Gold Bio | Cat#C-105-5 |
| TURBO DNase I | ThermoFisher | Cat#AM2238 |
| Tn5 transposase | Illumina | Cat#20034198 |
| EpiDyne Nucleosome Remodeling Assay Substrate ST601-GATC1, 50-N-66, Biotinylated | Epicypher | Cat#16-4114 |
| HeLa Polynucleosomes, purified | Epicypher | Cat#16-0003 |
| Biomag Plus Concanavalin A (ConA) magnetic beads | Polysciences | Cat#86057-3 |
| CUTANA pAG-Tn5 | Epicypher | Cat#15-1117 |
| CUTANA pAG-MNase | Epicypher | Cat#15-1116 |
| DpnII restriction enzyme | New England Biolabs | Cat#R0543S |
| Recombinant Proteinase K Solution (20mg/mL) | ThermoFisher | Cat#AM2546 |
| Magnetic Streptavidin beads | ThermoFisher | Cat#88817 |
| Protein G Dynabeads | ThermoFisher | Cat#10004D |
| Pierce Anti-HA Magnetic Beads | ThermoFisher | Cat#88837 |
| Critical commercial assays | ||
| NextSeq 500/550 High Output Kit v2.5 (75 Cycles) | Illumina | Cat#20024906 |
| NEBNext® Ultra™ II RNA Library Prep Kit for Illumina | New England Biolabs | Cat#E7770L |
| CUTANA CUT&RUN Library Prep Kit | Epicypher | Cat#14-1001 |
| MinElute Reaction Cleanup Kit | Qiagen | Cat#28206 |
| ADP-Glo Max Assay | Promega | Cat#V7001 |
| BCA Protein Assay Kit | ThermoFisher | Cat#23225 |
| SilverQuest Silver Staining Kit | ThermoFisher | Cat#LC6070 |
| Pierce High pH Reversed-Phase Peptide Fractionation Kit | ThermoFisher | Cat#84868 |
| TMTpro 16plex Label Reagent Set | ThermoFisher | Cat#A44520 |
| Protein Qubit | ThermoFisher | Cat#Q33212 |
| Deposited data | ||
| All AN3CA CUT&Tag, CUT&RUN, ATAC and RNA-Seq data | This study | GEO: GSE209961 |
| Experimental models: Cell lines | ||
| HEK293T ΔARID1A/B | Mashtalir et al.,21 | |
| U2OS | ATCC | Cat#HTB-96; RRID: CVCL_0042 |
| AN3CA | ATCC | Cat#HTB-111; RRID: CVCL_0028 |
| MDA-MB-231 | ATCC | Cat#HTB-26; RRID: CVCL_0062 |
| KLE | ATCC | Cat#CRL-1622; RRID: CVCL_1329 |
| C2C12 | ATCC | Cat#CRL-1772; RRID: CVCL_0188 |
| CRL-7250 | ATCC | Cat#CRL-7250, discontinued; RRID: CVCL_N613 |
| MCF10A | ATCC | Cat#CRL-10317; RRID: CVCL_0598 |
| MCF10-CA | Santner et al.,76 | |
| Primary rat neurons | This study | |
| Recombinant DNA | ||
| piggybac-ARID1A WT | This study | |
| piggybac-ARID1A DBDmut | This study | |
| piggybac-ARID1A ΔIDR1 | This study | |
| piggybac-ARID1A CBR | This study | |
| piggybac-ARID1A WT-eGFP | This study | |
| piggybac-ARID1A DBDmut-eGFP | This study | |
| piggybac-ARID1A ΔIDR1-eGFP | This study | |
| piggybac-ARID1A CBR-eGFP | This study | |
| piggybac-ARID1B WT-eGFP | This study | |
| piggybac-ARID1B DBDmut-eGFP | This study | |
| piggybac-Empty Vector | This study | |
| piggybac-ARID1A WT-TbID | This study | |
| piggybac-ARID1A DBDmut-TbID | This study | |
| piggybac-ARID1A ΔIDR1-TbID | This study | |
| piggybac-ARID1A CBR-TbID | This study | |
| piggybac-FUS IDR-ARID1A | This study | |
| piggybac-DDX4 IDR-ARID1A | This study | |
| piggybac-FUS IDR-ARID1A-eGFP | This study | |
| piggybac-DDX4 IDR-ARID1A-eGFP | This study | |
| piggybac-FUS IDR-ARID1A-TbID | This study | |
| piggybac-ARID1A 42YS | This study | |
| piggybac-ARID1A AQGscram | This study | |
| piggybac-ARID1A 42YS-eGFP | This study | |
| piggybac-ARID1A AQGscram-eGFP | This study | |
| piggybac-ARID1A 42YS-TbID | This study | |
| piggybac-ARID1A AQGscram-TbID | This study | |
| piggybac-ARID1B-WT | This study | |
| piggybac-ARID1B-Block 9 del | This study | |
| piggybac-ARID1B-Block 13 del | This study | |
| piggybac-ARID1B-S320_G327del | This study | |
| piggybac-ARID1B-A457_G461del | This study | |
| piggybac-ARID1B-Block 9 del-eGFP | This study | |
| piggybac-ARID1B-Block 13 del-eGFP | This study | |
| piggybac-ARID1B-S320_G327del-eGFP | This study | |
| piggybac-ARID1B-A457_G461del-eGFP | This study | |
| piggybac transposase | This study | |
| FM5-ARID1A IDR1 | This study | |
| FM5-ARID1A IDR2 | This study | |
| FM5-ARID1A N-term | This study | |
| FM5-ARID1A N-term DBDmut | This study | |
| FM5-ARID1B IDR1 | This study | |
| FM5-ARID1B IDR2 | This study | |
| FM5-ARID1B N-term | This study | |
| Software and algorithms | ||
| STAR v2.5.2b | Dobin et al.,77 | |
| deepTools v2.5.3 | Ramirez et al.,78 | |
| BEDTools | Quinlan et al79 | |
| edgeR v3.12.1 | Dobin et al.,77 Love et al.,80 | |
| Trimmomatic v0.36 | Bolger et al.,81 | |
| Bowtie2 | Langmead et al.,82 | |
| Picard v2.8.0 | Broad Institute | |
| SAMtools v 0.1.19 | Li et al.,83 | |
| MACS2 v2.1 | Zhnag et al.,84 | |
| CutRunTools | Zhu et al.,85 | |
| ngsplot v2.63 | Shen et al.,86 | |
| corpcor R package | Schafer et al.,87 Opgen-Rhein et al.,88 | |
| HOMER v4.9 | Heinz et al.,89 | |
| Integrative Genomics Viewer (IGV) | Broad Institute | |
| Geneious Prime v2023.0.4 | Geneious | |
| NARDINI | Cohan et al.,6 | |
| localCIDER | Holehouse et al.,7 | |
| FIJI | Schindelin et al90 | |
| Other | ||
| Lipofectamine 3000 | ThermoFisher | Cat#L3000015 |
| 0.2μM Nitrocellulose membrane | Biorad | Cat#1620112 |
| HA peptide | GenScript | Cat#RP11735 |
| DS1000 High Sensitivity DNA ScreenTape | Agilent | Cat#5067-5582 |
| Agencourt AMPure XP Beads | Beckman Coulter | Cat#A63881 |
Highlights.
A disordered region of ARID1A/B cBAF subunits controls condensation and interactions
cBAF targeting and activity requires phase separation and functional partner recruitment
Sequence patterning analysis uncouples grammar of self- and non-self interactions
Disease-associated IDR mutations disrupt protein interactions and genomic targeting
Acknowledgements
We thank all members of the Kadoch, Brangwynne, Gygi, and Pappu laboratories for helpful feedback and discussion throughout this project. Jessica Zhao, Lifei Jiang, Yibin Kang, and Jordy Botello gifted cell lines. We thank members of the Molecular Biology Core Facility at DFCI, including Z. Herbert, M. Sullivan, and M. Berkeley. This work was funded in part by the Mark Foundation Emerging Leaders Award (C.K.) NIH/NIGMS R01 GM132129 (J.A.P.), NIH/NIGMS GM67945 (S.P.G.), the AFOSR FA9550-20-1-0241 (C.P.B. and R.V.P.), the St. Jude Research Collaborative on the Biology and Biophysics of RNP granules (C.P.B. and R.V.P), and the Howard Hughes Medical Institute (C.P.B. and C.K.). A.P. was supported by the Fujifilm Fellowship at Harvard Medical School. A.R.S was supported by an LSRF fellowship through the Mark Foundation for Cancer Research (AWD 1006303) and an NIH Pathway to Independence award (NCI K99 CA276887-01). T.W. was supported by a Sir Henry Wellcome Fellowship of the Wellcome Trust [206464/Z/17/Z]. MK.S. is supported by the Center for Biomolecular Condensates in the James F. McKelvey School of Engineering at Washington University in St. Louis. Multiple figure panels were generated using Biorender.com.
C.K. is the scientific founder, Scientific Advisor to the Board of Directors, Scientific Advisory Board member, shareholder, and consultant for Foghorn Therapeutics. C.K. also serves on the Scientific Advisory Boards of Nereid Therapeutics (shareholder and consultant), Nested Therapeutics (shareholder and consultant), Accent Therapeutics (shareholder and consultant) and Fibrogen (consultant) and is a consultant for Cell Signaling Technologies and Google Ventures (shareholder and consultant). C.P.B. is a scientific founder, Scientific Advisory Board member, shareholder, and consultant for Nereid Therapeutics. R.V.P. is a member of the Scientific Advisory Board for Dewpoint Therapeutics (shareholder and consultant).
Footnotes
Conflict of Interest Statement
The other authors declare no competing interests. The authors have submitted a patent application related to this work.
Publisher's Disclaimer: This is a PDF file of an unedited manuscript that has been accepted for publication. As a service to our customers we are providing this early version of the manuscript. The manuscript will undergo copyediting, typesetting, and review of the resulting proof before it is published in its final form. Please note that during the production process errors may be discovered which could affect the content, and all legal disclaimers that apply to the journal pertain.
References
- 1.Oates ME et al. (2013). D(2)P(2): database of disordered protein predictions. Nucleic Acids Res 41, D508–516, doi: 10.1093/nar/gks1226. [DOI] [PMC free article] [PubMed] [Google Scholar]
- 2.Frege T. & Uversky VN (2015). Intrinsically disordered proteins in the nucleus of human cells. Biochem Biophys Rep 1, 33–51, doi: 10.1016/j.bbrep.2015.03.003. [DOI] [PMC free article] [PubMed] [Google Scholar]
- 3.Piovesan D. (2021). MobiDB: intrinsically disordered proteins in 2021. Nucleic Acids Res 49, D361–D367, doi: 10.1093/nar/gkaa1058. [DOI] [PMC free article] [PubMed] [Google Scholar]
- 4.Konrat R. (2014). NMR contributions to structural dynamics studies of intrinsically disordered proteins. J Magn Reson 241, 74–85, doi: 10.1016/j.jmr.2013.11.011. [DOI] [PMC free article] [PubMed] [Google Scholar]
- 5.Cermakova K. & Hodges HC (2023). Interaction modules that impart specificity to disordered protein. Trends Biochem Sci 48, 477–490, doi: 10.1016/j.tibs.2023.01.004. [DOI] [PMC free article] [PubMed] [Google Scholar]
- 6.Cohan MC, Shinn MK, Lalmansingh JM & Pappu RV (2022). Uncovering Non-random Binary Patterns Within Sequences of Intrinsically Disordered Proteins. J Mol Biol 434, 167373, doi: 10.1016/j.jmb.2021.167373. [DOI] [PMC free article] [PubMed] [Google Scholar]
- 7.Holehouse AS, Das RK, Ahad JN, Richardson MO & Pappu RV (2017). CIDER: Resources to Analyze Sequence-Ensemble Relationships of Intrinsically Disordered Proteins. Biophys J 112, 16–21, doi: 10.1016/j.bpj.2016.11.3200. [DOI] [PMC free article] [PubMed] [Google Scholar]
- 8.Holehouse AS in Intrinsically Disordered Proteins (ed Nicola Salvi) 209–255 (Academic Press, 2019). [Google Scholar]
- 9.Kadoch C. et al. (2013). Proteomic and bioinformatic analysis of mammalian SWI/SNF complexes identifies extensive roles in human malignancy. Nat Genet 45, 592–601, doi: 10.1038/ng.2628. [DOI] [PMC free article] [PubMed] [Google Scholar]
- 10.Shain AH & Pollack JR (2013). The spectrum of SWI/SNF mutations, ubiquitous in human cancers. PLoS One 8, e55119, doi: 10.1371/journal.pone.0055119. [DOI] [PMC free article] [PubMed] [Google Scholar]
- 11.McBride MJ et al. (2018). The SS18-SSX Fusion Oncoprotein Hijacks BAF Complex Targeting and Function to Drive Synovial Sarcoma. Cancer Cell 33, 1128–1141 e1127, doi: 10.1016/j.ccell.2018.05.002. [DOI] [PMC free article] [PubMed] [Google Scholar]
- 12.Nakayama RT et al. (2017). SMARCB1 is required for widespread BAF complex-mediated activation of enhancers and bivalent promoters. Nat Genet 49, 1613–1623, doi: 10.1038/ng.3958. [DOI] [PMC free article] [PubMed] [Google Scholar]
- 13.St Pierre R. et al. (2022). SMARCE1 deficiency generates a targetable mSWI/SNF dependency in clear cell meningioma. Nat Genet, doi: 10.1038/s41588-022-01077-0. [DOI] [PubMed]
- 14.Bogershausen N. & Wollnik B. (2018). Mutational Landscapes and Phenotypic Spectrum of SWI/SNF-Related Intellectual Disability Disorders. Front Mol Neurosci 11, 252, doi: 10.3389/fnmol.2018.00252. [DOI] [PMC free article] [PubMed] [Google Scholar]
- 15.Hanly C, Shah H, Au PYB & Murias K. (2021). Description of neurodevelopmental phenotypes associated with 10 genetic neurodevelopmental disorders: A scoping review. Clin Genet 99, 335–346, doi: 10.1111/cge.13882. [DOI] [PubMed] [Google Scholar]
- 16.Santen GW et al. (2012). Mutations in SWI/SNF chromatin remodeling complex gene ARID1B cause Coffin-Siris syndrome. Nat Genet 44, 379–380, doi: 10.1038/ng.2217. [DOI] [PubMed] [Google Scholar]
- 17.Santen GW et al. (2013). Coffin-Siris syndrome and the BAF complex: genotype-phenotype study in 63 patients. Hum Mutat 34, 1519–1528, doi: 10.1002/humu.22394. [DOI] [PubMed] [Google Scholar]
- 18.Santen GW, Kriek M. & van Attikum H. (2012). SWI/SNF complex in disorder: SWItching from malignancies to intellectual disability. Epigenetics 7, 1219–1224, doi: 10.4161/epi.22299. [DOI] [PMC free article] [PubMed] [Google Scholar]
- 19.Satterstrom FK et al. (2020). Large-Scale Exome Sequencing Study Implicates Both Developmental and Functional Changes in the Neurobiology of Autism. Cell 180, 568–584 e523, doi: 10.1016/j.cell.2019.12.036. [DOI] [PMC free article] [PubMed] [Google Scholar]
- 20.Wright CF (2018). Making new genetic diagnoses with old data: iterative reanalysis and reporting from genome-wide data in 1,133 families with developmental disorders. Genet Med 20, 1216–1223, doi: 10.1038/gim.2017.246. [DOI] [PMC free article] [PubMed] [Google Scholar]
- 21.Mashtalir N. et al. (2018). Modular Organization and Assembly of SWI/SNF Family Chromatin Remodeling Complexes. Cell 175, 1272–1288 e1220, doi: 10.1016/j.cell.2018.09.032. [DOI] [PMC free article] [PubMed] [Google Scholar]
- 22.Kadoch C. & Crabtree GR (2015). Mammalian SWI/SNF chromatin remodeling complexes and cancer: Mechanistic insights gained from human genomics. Sci Adv 1, e1500447, doi: 10.1126/sciadv.1500447. [DOI] [PMC free article] [PubMed] [Google Scholar]
- 23.Bailey MH et al. (2018). Comprehensive Characterization of Cancer Driver Genes and Mutations. Cell 174, 1034–1035, doi: 10.1016/j.cell.2018.07.034. [DOI] [PMC free article] [PubMed] [Google Scholar]
- 24.Lawrence MS et al. (2014). Discovery and saturation analysis of cancer genes across 21 tumour types. Nature 505, 495–501, doi: 10.1038/nature12912. [DOI] [PMC free article] [PubMed] [Google Scholar]
- 25.Han Y, Reyes AA, Malik S. & He Y. (2020). Cryo-EM structure of SWI/SNF complex bound to a nucleosome. Nature 579, 452–455, doi: 10.1038/s41586-020-2087-1. [DOI] [PMC free article] [PubMed] [Google Scholar]
- 26.He S. et al. (2020). Structure of nucleosome-bound human BAF complex. Science 367, 875–881, doi: 10.1126/science.aaz9761. [DOI] [PubMed] [Google Scholar]
- 27.Mashtalir N. et al. (2020). A Structural Model of the Endogenous Human BAF Complex Informs Disease Mechanisms. Cell 183, 802–817 e824, doi: 10.1016/j.cell.2020.09.051. [DOI] [PMC free article] [PubMed] [Google Scholar]
- 28.Necci M, Piovesan D, Clementel D, Dosztanyi Z. & Tosatto SCE (2020). MobiDB-lite 3.0: fast consensus annotation of intrinsic disorder flavours in proteins. Bioinformatics, doi: 10.1093/bioinformatics/btaa1045. [DOI] [PubMed]
- 29.Iglesias V. et al. (2019). In silico Characterization of Human Prion-Like Proteins: Beyond Neurological Diseases. Front Physiol 10, 314, doi: 10.3389/fphys.2019.00314. [DOI] [PMC free article] [PubMed] [Google Scholar]
- 30.Boija A. et al. (2018). Transcription Factors Activate Genes through the Phase-Separation Capacity of Their Activation Domains. Cell 175, 1842–1855 e1816, doi: 10.1016/j.cell.2018.10.042. [DOI] [PMC free article] [PubMed] [Google Scholar]
- 31.Wei MT et al. (2020). Nucleated transcriptional condensates amplify gene expression. Nat Cell Biol 22, 1187–1196, doi: 10.1038/s41556-020-00578-6. [DOI] [PubMed] [Google Scholar]
- 32.Koga S, Williams DS, Perriman AW & Mann S. (2011). Peptide-nucleotide microdroplets as a step towards a membrane-free protocell model. Nat Chem 3, 720–724, doi: 10.1038/nchem.1110. [DOI] [PubMed] [Google Scholar]
- 33.Shin Y. & Brangwynne CP (2017). Liquid phase condensation in cell physiology and disease. Science 357, doi: 10.1126/science.aaf4382. [DOI] [PubMed] [Google Scholar]
- 34.Strulson CA, Molden RC, Keating CD & Bevilacqua PC (2012). RNA catalysis through compartmentalization. Nat Chem 4, 941–946, doi: 10.1038/nchem.1466. [DOI] [PubMed] [Google Scholar]
- 35.Strom AR et al. (2017). Phase separation drives heterochromatin domain formation. Nature 547, 241–245, doi: 10.1038/nature22989. [DOI] [PMC free article] [PubMed] [Google Scholar]
- 36.Larson AG et al. (2017). Liquid droplet formation by HP1alpha suggests a role for phase separation in heterochromatin. Nature 547, 236–240, doi: 10.1038/nature22822. [DOI] [PMC free article] [PubMed] [Google Scholar]
- 37.Sabari BR et al. (2018). Coactivator condensation at super-enhancers links phase separation and gene control. Science 361, doi: 10.1126/science.aar3958. [DOI] [PMC free article] [PubMed] [Google Scholar]
- 38.Klein IA (2020). Partitioning of cancer therapeutics in nuclear condensates. Science 368, 1386–1392, doi: 10.1126/science.aaz4427. [DOI] [PMC free article] [PubMed] [Google Scholar]
- 39.Banani SF et al. (2022). Genetic variation associated with condensate dysregulation in disease. Dev Cell, doi: 10.1016/j.devcel.2022.06.010. [DOI] [PMC free article] [PubMed]
- 40.Morin JA et al. (2022). Sequence-dependent surface condensation of a pioneer transcription factor on DNA. Nature Physics 18, 271–276, doi: 10.1038/s41567-021-01462-2. [DOI] [Google Scholar]
- 41.Valencia AM et al. (2019). Recurrent SMARCB1 Mutations Reveal a Nucleosome Acidic Patch Interaction Site That Potentiates mSWI/SNF Complex Chromatin Remodeling. Cell 179, 1342–1356 e1323, doi: 10.1016/j.cell.2019.10.044. [DOI] [PMC free article] [PubMed] [Google Scholar]
- 42.Bracha D. et al. (2019). Mapping Local and Global Liquid Phase Behavior in Living Cells Using Photo-Oligomerizable Seeds. Cell 176, 407, doi: 10.1016/j.cell.2018.12.026. [DOI] [PubMed] [Google Scholar]
- 43.Kaya-Okur HS, Janssens DH, Henikoff JG, Ahmad K. & Henikoff S. (2020). Efficient low-cost chromatin profiling with CUT&Tag. Nat Protoc 15, 3264–3283, doi: 10.1038/s41596-020-0373-x. [DOI] [PMC free article] [PubMed] [Google Scholar]
- 44.Buenrostro JD, Giresi PG, Zaba LC, Chang HY & Greenleaf WJ (2013). Transposition of native chromatin for fast and sensitive epigenomic profiling of open chromatin, DNA-binding proteins and nucleosome position. Nat Methods 10, 1213–1218, doi: 10.1038/nmeth.2688. [DOI] [PMC free article] [PubMed] [Google Scholar]
- 45.Buenrostro JD, Wu B, Chang HY & Greenleaf WJ (2015). ATAC-seq: A Method for Assaying Chromatin Accessibility Genome-Wide. Curr Protoc Mol Biol 109, 21 29 21–21 29 29, doi: 10.1002/0471142727.mb2129s109. [DOI] [PMC free article] [PubMed] [Google Scholar]
- 46.Pan J. et al. (2019). The ATPase module of mammalian SWI/SNF family complexes mediates subcomplex identity and catalytic activity-independent genomic targeting. Nat Genet 51, 618–626, doi: 10.1038/s41588-019-0363-5. [DOI] [PMC free article] [PubMed] [Google Scholar]
- 47.Alver BH et al. (2017). The SWI/SNF chromatin remodelling complex is required for maintenance of lineage specific enhancers. Nat Commun 8, 14648, doi: 10.1038/ncomms14648. [DOI] [PMC free article] [PubMed] [Google Scholar]
- 48.Vierbuchen T. et al. (2017). AP-1 Transcription Factors and the BAF Complex Mediate Signal-Dependent Enhancer Selection. Mol Cell 68, 1067–1082 e1012, doi: 10.1016/j.molcel.2017.11.026. [DOI] [PMC free article] [PubMed] [Google Scholar]
- 49.Gatchalian J. et al. (2018). A non-canonical BRD9-containing BAF chromatin remodeling complex regulates naive pluripotency in mouse embryonic stem cells. Nat Commun 9, 5139, doi: 10.1038/s41467-018-07528-9. [DOI] [PMC free article] [PubMed] [Google Scholar]
- 50.Michel BC et al. (2018). A non-canonical SWI/SNF complex is a synthetic lethal target in cancers driven by BAF complex perturbation. Nat Cell Biol 20, 1410–1420, doi: 10.1038/s41556-018-0221-1. [DOI] [PMC free article] [PubMed] [Google Scholar]
- 51.Branon TC et al. (2018). Efficient proximity labeling in living cells and organisms with TurboID. Nat Biotechnol 36, 880–887, doi: 10.1038/nbt.4201. [DOI] [PMC free article] [PubMed] [Google Scholar]
- 52.Cho KF et al. (2020). Proximity labeling in mammalian cells with TurboID and split-TurboID. Nat Protoc 15, 3971–3999, doi: 10.1038/s41596-020-0399-0. [DOI] [PubMed] [Google Scholar]
- 53.Boulay G. et al. (2017). Cancer-Specific Retargeting of BAF Complexes by a Prion-like Domain. Cell 171, 163–178 e119, doi: 10.1016/j.cell.2017.07.036. [DOI] [PMC free article] [PubMed] [Google Scholar]
- 54.Sandoval GJ et al. (2018). Binding of TMPRSS2-ERG to BAF Chromatin Remodeling Complexes Mediates Prostate Oncogenesis. Mol Cell 71, 554–566 e557, doi: 10.1016/j.molcel.2018.06.040. [DOI] [PMC free article] [PubMed] [Google Scholar]
- 55.Shin Y. et al. (2017). Spatiotemporal Control of Intracellular Phase Transitions Using Light-Activated optoDroplets. Cell 168, 159–171 e114, doi: 10.1016/j.cell.2016.11.054. [DOI] [PMC free article] [PubMed] [Google Scholar]
- 56.Ruff KM et al. (2022). Sequence grammar underlying the unfolding and phase separation of globular proteins. Mol Cell 82, 3193–3208 e3198, doi: 10.1016/j.molcel.2022.06.024. [DOI] [PMC free article] [PubMed] [Google Scholar]
- 57.Zarin T. et al. (2021). Identifying molecular features that are associated with biological function of intrinsically disordered protein regions. Elife 10, doi: 10.7554/eLife.60220. [DOI] [PMC free article] [PubMed] [Google Scholar]
- 58.Lin Y, Currie SL & Rosen MK (2017). Intrinsically disordered sequences enable modulation of protein phase separation through distributed tyrosine motifs. J Biol Chem 292, 19110–19120, doi: 10.1074/jbc.M117.800466. [DOI] [PMC free article] [PubMed] [Google Scholar]
- 59.Brangwynne Clifford P., Tompa P. & Pappu Rohit V. (2015). Polymer physics of intracellular phase transitions. Nature Physics 11, 899–904, doi: 10.1038/nphys3532. [DOI] [Google Scholar]
- 60.Farag M. et al. (2022). Condensates formed by prion-like low-complexity domains have small-world network structures and interfaces defined by expanded conformations. Nat Commun 13, 7722, doi: 10.1038/s41467-022-35370-7. [DOI] [PMC free article] [PubMed] [Google Scholar]
- 61.Papillon JPN et al. (2018). Discovery of Orally Active Inhibitors of Brahma Homolog (BRM)/SMARCA2 ATPase Activity for the Treatment of Brahma Related Gene 1 (BRG1)/SMARCA4-Mutant Cancers. J Med Chem 61, 10155–10172, doi: 10.1021/acs.jmedchem.8b01318. [DOI] [PubMed] [Google Scholar]
- 62.Wei J. et al. (2023). Pharmacological disruption of mSWI/SNF complex activity restricts SARS-CoV-2 infection. Nat Genet 55, 471–483, doi: 10.1038/s41588-023-01307-z. [DOI] [PMC free article] [PubMed] [Google Scholar]
- 63.Iurlaro M. et al. (2021). Mammalian SWI/SNF continuously restores local accessibility to chromatin. Nat Genet 53, 279–287, doi: 10.1038/s41588-020-00768-w. [DOI] [PubMed] [Google Scholar]
- 64.Martin EW et al. (2020). Valence and patterning of aromatic residues determine the phase behavior of prion-like domains. Science 367, 694–699, doi: 10.1126/science.aaw8653. [DOI] [PMC free article] [PubMed] [Google Scholar]
- 65.Nott TJ et al. (2015). Phase transition of a disordered nuage protein generates environmentally responsive membraneless organelles. Mol Cell 57, 936–947, doi: 10.1016/j.molcel.2015.01.013. [DOI] [PMC free article] [PubMed] [Google Scholar]
- 66.Wang J. et al. (2018). A Molecular Grammar Governing the Driving Forces for Phase Separation of Prion-like RNA Binding Proteins. Cell 174, 688–699 e616, doi: 10.1016/j.cell.2018.06.006. [DOI] [PMC free article] [PubMed] [Google Scholar]
- 67.Bremer A. et al. (2022). Deciphering how naturally occurring sequence features impact the phase behaviours of disordered prion-like domains. Nat Chem 14, 196–207, doi: 10.1038/s41557-021-00840-w. [DOI] [PMC free article] [PubMed] [Google Scholar]
- 68.Kar M. et al. (2022). Phase-separating RNA-binding proteins form heterogeneous distributions of clusters in subsaturated solutions. Proc Natl Acad Sci U S A 119, e2202222119, doi: 10.1073/pnas.2202222119. [DOI] [PMC free article] [PubMed] [Google Scholar]
- 69.Pappu RV, Cohen SR, Dar F, Farag M. & Kar M. (2023). Phase Transitions of Associative Biomacromolecules. Chem Rev, doi: 10.1021/acs.chemrev.2c00814. [DOI] [PMC free article] [PubMed]
- 70.Shinn MK et al. (2022). Connecting sequence features within the disordered C-terminal linker of Bacillus subtilis FtsZ to functions and bacterial cell division. Proc Natl Acad Sci U S A 119, e2211178119, doi: 10.1073/pnas.2211178119. [DOI] [PMC free article] [PubMed] [Google Scholar]
- 71.Bergeron-Sandoval LP et al. (2021). Endocytic proteins with prion-like domains form viscoelastic condensates that enable membrane remodeling. Proc Natl Acad Sci U S A 118, doi: 10.1073/pnas.2113789118. [DOI] [PMC free article] [PubMed] [Google Scholar]
- 72.Staller MV et al. (2022). Directed mutational scanning reveals a balance between acidic and hydrophobic residues in strong human activation domains. Cell Syst 13, 334–345 e335, doi: 10.1016/j.cels.2022.01.002. [DOI] [PMC free article] [PubMed] [Google Scholar]
- 73.Zeng X, Ruff KM & Pappu RV (2022). Competing interactions give rise to two-state behavior and switch-like transitions in charge-rich intrinsically disordered proteins. Proc Natl Acad Sci U S A 119, e2200559119, doi: 10.1073/pnas.2200559119. [DOI] [PMC free article] [PubMed] [Google Scholar]
- 74.Greig JA et al. (2020). Arginine-Enriched Mixed-Charge Domains Provide Cohesion for Nuclear Speckle Condensation. Mol Cell 77, 1237–1250 e1234, doi: 10.1016/j.molcel.2020.01.025. [DOI] [PMC free article] [PubMed] [Google Scholar]
- 75.Sherry KP, Das RK, Pappu RV & Barrick D. (2017). Control of transcriptional activity by design of charge patterning in the intrinsically disordered RAM region of the Notch receptor. Proc Natl Acad Sci U S A 114, E9243–E9252, doi: 10.1073/pnas.1706083114. [DOI] [PMC free article] [PubMed] [Google Scholar]
- 76.Santner SJ et al. (2001). Malignant MCF10CA1 cell lines derived from premalignant human breast epithelial MCF10AT cells. Breast Cancer Res Treat 65, 101–110, doi: 10.1023/a:1006461422273. [DOI] [PubMed] [Google Scholar]
- 77.Dobin A. et al. (2013). STAR: ultrafast universal RNA-seq aligner. Bioinformatics 29, 15–21, doi: 10.1093/bioinformatics/bts635. [DOI] [PMC free article] [PubMed] [Google Scholar]
- 78.Ramirez F. et al. (2016). deepTools2: a next generation web server for deep-sequencing data analysis. Nucleic Acids Res 44, W160–165, doi: 10.1093/nar/gkw257. [DOI] [PMC free article] [PubMed] [Google Scholar]
- 79.Quinlan AR & Hall IM (2010). BEDTools: a flexible suite of utilities for comparing genomic features. Bioinformatics 26, 841–842, doi: 10.1093/bioinformatics/btq033. [DOI] [PMC free article] [PubMed] [Google Scholar]
- 80.Love MI, Huber W. & Anders S. (2014). Moderated estimation of fold change and dispersion for RNA-seq data with DESeq2. Genome Biol 15, 550, doi: 10.1186/s13059-014-0550-8. [DOI] [PMC free article] [PubMed] [Google Scholar]
- 81.Bolger AM, Lohse M. & Usadel B. (2012). Trimmomatic: a flexible trimmer for Illumina sequence data. Bioinformatics 30, 2114–2120, doi: 10.1093/bioinformatics/btu170 (2014). [DOI] [PMC free article] [PubMed] [Google Scholar]
- 82.Langmead B. & Salzberg SL (2012). Fast gapped-read alignment with Bowtie 2. Nat Methods 9, 357–359, doi: 10.1038/nmeth.1923. [DOI] [PMC free article] [PubMed] [Google Scholar]
- 83.Li H. et al. (2009). The Sequence Alignment/Map format and SAMtools. Bioinformatics 25, 2078–2079, doi: 10.1093/bioinformatics/btp352. [DOI] [PMC free article] [PubMed] [Google Scholar]
- 84.Zhang Y. et al. (2008). Model-based analysis of ChIP-Seq (MACS). Genome Biol 9, R137, doi: 10.1186/gb-2008-9-9-r137. [DOI] [PMC free article] [PubMed] [Google Scholar]
- 85.Zhu Q, Liu N, Orkin SH & Yuan GC (2019). CUT&RUNTools: a flexible pipeline for CUT&RUN processing and footprint analysis. Genome Biol 20, 192, doi: 10.1186/s13059-019-1802-4. [DOI] [PMC free article] [PubMed] [Google Scholar]
- 86.Shen L, Shao N, Liu X. & Nestler E. (2014). ngs.plot: Quick mining and visualization of next-generation sequencing data by integrating genomic databases. BMC Genomics 15, 284, doi: 10.1186/1471-2164-15-284. [DOI] [PMC free article] [PubMed] [Google Scholar]
- 87.Schafer J. & Strimmer K. (2005). A shrinkage approach to large-scale covariance matrix estimation and implications for functional genomics. Stat Appl Genet Mol Biol 4, Article32, doi: 10.2202/1544-6115.1175. [DOI] [PubMed] [Google Scholar]
- 88.Opgen-Rhein R. & Strimmer K. (2007). Accurate ranking of differentially expressed genes by a distribution-free shrinkage approach. Stat Appl Genet Mol Biol 6, Article9, doi: 10.2202/1544-6115.1252. [DOI] [PubMed] [Google Scholar]
- 89.Heinz S. et al. (2010). Simple combinations of lineage-determining transcription factors prime cis-regulatory elements required for macrophage and B cell identities. Mol Cell 38, 576–589, doi: 10.1016/j.molcel.2010.05.004. [DOI] [PMC free article] [PubMed] [Google Scholar]
- 90.Schindelin J. et al. (2012). Fiji: an open-source platform for biological-image analysis. Nat Methods 9, 676–682, doi: 10.1038/nmeth.2019. [DOI] [PMC free article] [PubMed] [Google Scholar]
- 91.Corces MR et al. (2017). An improved ATAC-seq protocol reduces background and enables interrogation of frozen tissues. Nat Methods 14, 959–962, doi: 10.1038/nmeth.4396. [DOI] [PMC free article] [PubMed] [Google Scholar]
- 92.Kuhn RM, Haussler D. & Kent WJ (2013). The UCSC genome browser and associated tools. Brief Bioinform 14, 144–161, doi: 10.1093/bib/bbs038. [DOI] [PMC free article] [PubMed] [Google Scholar]
- 93.Heinz S. et al. (2010). Simple Combinations of Lineage-Determining Transcription Factors Prime cis-Regulatory Elements Required for Macrophage and B Cell Identities. Molecular cell 38, 576–589, doi: 10.1016/j.molcel.2010.05.004. [DOI] [PMC free article] [PubMed] [Google Scholar]
- 94.Thevenaz P, Ruttimann UE & Unser M. (1998). A pyramid approach to subpixel registration based on intensity. IEEE Trans Image Process 7, 27–41, doi: 10.1109/83.650848. [DOI] [PubMed] [Google Scholar]
- 95.Bolte S. & Cordelieres FP (2006). A guided tour into subcellular colocalization analysis in light microscopy. J Microsc 224, 213–232, doi: 10.1111/j.1365-2818.2006.01706.x. [DOI] [PubMed] [Google Scholar]
- 96.Eng JK et al. (2015). A deeper look into Comet--implementation and features. J Am Soc Mass Spectrom 26, 1865–1874, doi: 10.1007/s13361-015-1179-x. [DOI] [PMC free article] [PubMed] [Google Scholar]
- 97.Eng JK, Jahan TA & Hoopmann MR (2013). Comet: an open-source MS/MS sequence database search tool. Proteomics 13, 22–24, doi: 10.1002/pmic.201200439. [DOI] [PubMed] [Google Scholar]
- 98.Elias JE & Gygi SP (2010). Target-decoy search strategy for mass spectrometry-based proteomics. Methods Mol Biol 604, 55–71, doi: 10.1007/978-1-60761-444-9_5. [DOI] [PMC free article] [PubMed] [Google Scholar]
- 99.Elias JE & Gygi SP (2007). Target-decoy search strategy for increased confidence in large-scale protein identifications by mass spectrometry. Nat Methods 4, 207–214, doi: 10.1038/nmeth1019. [DOI] [PubMed] [Google Scholar]
- 100.Huttlin EL et al. (2010). A tissue-specific atlas of mouse protein phosphorylation and expression. Cell 143, 1174–1189, doi: 10.1016/j.cell.2010.12.001. [DOI] [PMC free article] [PubMed] [Google Scholar]
- 101.McAlister GC et al. (2012). Increasing the multiplexing capacity of TMTs using reporter ion isotopologues with isobaric masses. Analytical chemistry 84, 7469–7478, doi: 10.1021/ac301572t. [DOI] [PMC free article] [PubMed] [Google Scholar]
- 102.UniProt C. (2021). UniProt: the universal protein knowledgebase in 2021. Nucleic Acids Res 49, D480–D489, doi: 10.1093/nar/gkaa1100. [DOI] [PMC free article] [PubMed] [Google Scholar]
- 103.Huerta-Cepas J. et al. (2019). eggNOG 5.0: a hierarchical, functionally and phylogenetically annotated orthology resource based on 5090 organisms and 2502 viruses. Nucleic Acids Res 47, D309–D314, doi: 10.1093/nar/gky1085. [DOI] [PMC free article] [PubMed] [Google Scholar]
- 104.Valencia AM et al. (2023). Landscape of mSWI/SNF chromatin remodeling complex perturbations in neurodevelopmental disorders. Nat Genet, doi: 10.1038/s41588-023-01451-6. [DOI] [PMC free article] [PubMed]
Associated Data
This section collects any data citations, data availability statements, or supplementary materials included in this article.
Supplementary Materials
A. Left, 3D structure of the human cBAF complex (PDB:6LTJ) with the ARID1A C-terminal Core Binding Region (CBR) highlighted; Right, structure of the yeast SWI/SNF complex (PDB:7EGP) with the ARID1A homolog Swi1 highlighted. Residues of complex subunits within 10Å of ARID1A or Swi1 are highlighted in color. B. Mutational frequencies of ARID1A and ARID1B associated with cancer (TCGA) or neurodevelopmental disorders (NDD) (DECIPHER), respectively. Percentages of total cancer and NDD cases for each are indicated. C. Amino acid level conservation between ARID1A and ARID1B, defined by pairwise alignment using EMBOSS Needle. D. Structural models of ARID1A and ARID1B subunits using Alphafold highlights disordered regions (IDR1 and IDR2). The N- and C-termini of IDR1 and 2 and the ARID and CBR (Arm repeat) domains are labeled. E. Nuclear proteins ranked based on degree of disorder using MobiDB-lite. F. Interaction model of the ARID1A ARID domain and dsDNA (PDB: 1RYU, 1KQQ overlap). Highlighted residues S1086, S1087 and S1090 were mutated to glutamic acid (E) to compromise DNA binding (DBDmut mutant). G. Left, electrophoretic mobility shift assay (EMSA) using GST-tagged wild-type (WT) or DBDmut ARID domain proteins (aa958–1375) and a IRDye800 labeled dsDNA probe. Right, quantification of DNA binding. H. Immunoblot performed on nuclear extracts isolated from naïve HEK293T, HEK293T ΔARID1A/B and AN3CA cells. I. Immunoblots performed on nuclear protein input and anti-HA IPs in ΔARID1A/B HEK293T cells with rescue of HA-tagged ARID1A WT or mutant variants. J. Immunoblot of MG-132 proteasome inhibitor treated AN3CA cells expressing ARID1A WT and mutants. K. Density sedimentation analysis using 1030% glycerol gradients performed on nuclear extracts of AN3CA cells (top) and AN3CA cells rescued with HA-WT ARID1A (bottom). L. Immunoblot and quantitative densitometry for HA, SMARCA4 and SMARCC1 performed on purified WT and mutant cBAF complexes used for in vitro nucleosome remodeling assays. M. TapeStation analysis of REAA-based in vitro nucleosome remodeling assays shown in Fig. 1G.
A. Schematic of eGFP-tagged ARID1A WT and mutant constructs. B. Left, silver stain of purified cBAF complexes containing WT or mutant eGFP-tagged ARID1A, purified from HEK293T ΔARID1A/B cells; Middle, Immunoblot of ATPase and core cBAF subunits using purified complexes; Right, quantitative densitometry of HA (ARID1A), SMARCA4, SMARCC1, and SMARCE1. C. Representative images from in vitro droplet assays performed across a range of concentrations for all eGFP-tagged complexes. Scale bar, 20 μm. D. Left, representative images from in vitro droplet assay, scale bar, 20 μm; Right, quantification of droplet area coverage for WT and mutant ARID1A-containing eGFP-tagged cBAF complexes at 2, 0.66, 0.22 and 0.074 μM, alone or with addition of 100 nM DNA, nucleosomes, or RNA. Error bars represent standard deviation of 8 fields of view in each condition. E. Representative images of in vitro droplet assays with 100 nM DNA added in indicated conditions. Strings of droplets from in in WT ARID1A + DNA condition only. F. (Top) Immunoblot for input and (bottom) anti-HA IP in AN3CA rescued with HA-tagged ARID1A WT or mutant eGFP tagged variants. G. Quantitative densitometry of subunit protein levels across conditions from panel F (input and IP). H. Density sedimentation analysis using nuclear extracts of AN3CA cells rescued with eGFP-tagged ARID1A showing that the eGFP tag does not disrupt complex formation. I. Representative images (left) and saturation concentration (right) of Control and MG-132 proteasome inhibitor treated AN3CA cells expressing ARID1A WT-eGFP or mutants. J. Representative images, puncta count and size of eGFP-tagged ARID1B WT and DBDmut in AN3CA cells (n=25 cells each). ****p<0.0001 by unpaired t-test. K. FRAP curves, half time of recovery (T1/2) and Immobile fraction quantification for ARID1A-eGFP (left) and ARID1B-eGFP (right) containing cBAF complexes. Scale bars, 10 μm. Error bars represent standard deviation. n = 3 biological trials containing 15 cells each. P-values were calculated using an unpaired t-test. ns, not statistically significant. L. Confocal imaging of condensates using anti-ARID1A antibody in CRL-7250, MCF10A, MDA-MB-231, and for anti-ARID1B in primary rat neurons, alongside Hoecht stain. Scale bars, 10 μm. M. Representative images of one nucleus expressing each construct without (- light) and with (+ light) light-induced oligomerization through the Corelet system. Scale bars, 10 μm. N. Corelet system phase diagrams of indicated ARID1A constructs in U2OS cells. O-P. Corelet system Phase Diagrams of indicated ARID1B constructs in U2OS cells. Q. Representative images for repeated light activation-deactivation cycles of indicated constructs in Corelet System in U2OS cells, and subsequent Pearson Correlation Coefficient (PCC) of droplet nuclear localization. Scale bars, 10 μm. R. Quantification of PCC across three activation-deactivation cycles for indicated constructs. Error bars represent standard deviation, n = 32, 20, 20 cells. P-values were calculated using a one-way ANOVA test.
A. Metaplots of HA (ARID1A), SMARCA4, SMARCC1, H3K27ac occupancy and DNA accessibility (ATAC) at Clusters 2, 3, and 4 sites from Figure 3A across Empty and ARID1A WT/ mutant conditions. B. Venn diagrams indicating overlap between accessible sites gained in ARID1A WT (red) and DBDmut, ΔIDR1, CBR mutant conditions (green, purple, brown, respectively) in AN3CA cells. C. Principal Component Analysis (PCA) of all ATAC-Seq sites in AN3CA cells across Empty control and ARID1A WT/ mutant conditions. D. RNA-Seq PCA in AN3CA cells across Empty control and ARID1A WT/ mutant conditions. E. Overlap of gained ATAC sites shared between WT, DBDmut, ΔIDR1, CBR conditions. F. Overlap of WT-only gained ATAC sites not overlapping with DBDmut, ΔIDR1, CBR mutant gained sites. G. cBAF (ARID1A, SMARCA4, SMARCC1) and H3K27ac chromatin occupancy (CUT&Tag) at gained DNA-accessible sites (ATAC-Seq) in AN3CA cells expressing ARID1A WT compared to empty control. H. Transcription factor motif enrichment analysis (HOMER) of Cluster 2 sites from panel G. I. Volcano plots reflecting gene expression changes (RNA-Seq) between conditions indicated. Red and blue dots indicate genes up- and down-regulated with an adjusted p-value cutoff of 0.01 and a log2 fold change threshold of 1. J. Up- and down-regulated genes (DEG count) across comparisons indicated. K. Expression of genes nearest to cBAF-occupied sites in Clusters 1–4 from Fig. 3A across ARID1A WT or mutant conditions relative to empty control. L. Differentially expressed genes (left) with differential cBAF target sites (ARID1A/SMARCA4 sites) within 1 kB of genes (right) in ARID1A WT versus empty vector conditions. L. Metascape enrichment analysis performed on genes closest to Clusters 2/3 sites from Figure 3A. Epithelial cell differentiation term highlighted in red.
A. Schematic of HA-tagged ARID1A WT or mutant variants fused to the biotin ligase TurboID (TbID). B. Immunoblot using nuclear extract from AN3CA cells expressing TbID fused to ARID1A WT or mutant variants labeled with 50 μM Biotin for 10 min. C. Schematic for TbID-TMT mass spectrometry experiments. D. Metascape enrichment analysis of downregulated biotinylated hits in ΔIDR1 and CBR compared to WT. E. Left, heatmap of normalized TMT peptide signal of BAF complex subunits; Right, immunoblot of pan-BAF, cBAF, PBAF and ncBAF specific subunits in AN3CA cells expressing ARID1A WT or mutant TbID fusions. F. Normalized TMT signal heatmaps of Clusters 2/3 motif enriched transcription factors from Figure 3A, Mediator complex and RNA Polymerase II-associated proteins across the same conditions as in I. G. Immunoblot of indicated proteins in AN3CA cells expressing ARID1A WT or mutant TbID fusions. H. Co-immunofluorescence studies performed on AN3CA cells rescued with ARID1A WT and mutant variants and visualized for cBAF (eGFP) and SMARCC1. Arrows indicate co-localization. Scale bars, 10 μm. I. Immunoblot for p300 in AN3CA cells expressing Empty control, ARID1A WT-eGFP or mutants. J. Molecular function (GO) enrichment analysis of proteins overlapping between IP-Mass Spectrometry and proximity labelling experiments. K. Correlation of proximity labeling (TurboID) log2 fold change and changes in DNA accessibility (log2 fold change) at Cluster 2 and Cluster 3 sites from Figure 3A across human transcription factors. Factors corresponding to highly enriched motifs (from Figure 3G) are highlighted in red. L. mRNA expression (CPM) of key TF genes across ARID1A rescue conditions in AN3CA cells shown in Fig. 4H.
A-B. Immunoblot for input and anti-HA IP experiments in AN3CA cells expressing HA-tagged or HA- and eGFP dual tagged ARID1A WT or FUS- and DDX- fusion mutant variants along with densitometry measurements. C. Saturation concentration of WT and mutant variants of ARID1A in AN3CA cells calculated using calibrated fluorescence imaging. PS: Phase Separation. D. Metaplots of HA (ARID1A), SMARCA4, SMARCC1, H3K27ac occupancy and DNA accessibility (ATAC) at Clusters 2 and 3 from Figure 3A, across Empty control, ARID1A WT and mutant conditions. E. PCA of all ATAC-Seq sites in AN3CA cells across Empty control, ARID1A WT and mutants. F. Volcano plots comparing global gene expression profiles (RNA-Seq) of AN3CA cells expressing ARID1A mutants (ΔIDR1, FUSIDR, DDX4IDR) compared to ARID1A WT with an adjusted p-value cutoff of 0.01 and a log2 fold change threshold of 1. G. Normalized TMT-MS signal heatmaps of detected cBAF subunits from IP-MS experiments in AN3CA cells. H. Top, schematic of ARID1A WT and mutant TbID fusions; Bottom, immunoblot using nuclear extract from AN3CA cells expressing ARID1A WT-TbID or mutant variants labeled with 50 μM Biotin for 10 min. I. Volcano plots comparing biotinylated protein levels of cBAF in cells expressing ARID1A variants versus WT TbID fusions. J. Normalized TMT-MS signal heatmaps of detected Mediator complex subunits, RNA Polymerase II associated proteins and Clusters 2,3 motif enriched transcription factors from Figure 3A for indicated conditions. K. Immunofluorescence analysis of ARID1A and SMARCC1 in AN3CA cells expressing ARID1A WT-eGFP or indicated mutants. Scale bars, 10 μm. L. Immunoblot for p300 in AN3CA cells expressing ARID1A WT-eGFP or indicated mutants.
A. Schematic for all IDRs across mSWI/SNF subunits. B. IDR sequence patterning conservation of ARID1A orthologs across eukaryotes. C. FRAP studies for WT and AQG scramble mutant sequences; half time of recovery, and mobility measurements are shown. D. Distance-to-TSS for Clusters A-C from Figure 6H. E. HOMER TF motif analysis from Cluster B sites in Figure 6H. F. PCA analyses of SMARCA4 sites, ATAC-seq, and RNA-seq datasets across empty and ARID1A WT or mutant variant conditions in AN3CA cells. G. Metaplots for HA (ARID1A) and ATAC-Seq for Clusters A-C from Figure 6H. H. Volcano plots reflecting changes in gene expression; significantly downregulated and upregulated genes are highlighted in blue and red, respectively. I. Sequence grammar schematics of FUS and DDX4 IDRs, showing their abundance of aromatic residues but lack of blocky AQG patches. J. PCC correlation between ARID1A and p300 across WT and AQGscram conditions.
A. NDD- and cancer-associated mutations (DECIPHER) plotted across distinct blocks within IDR1 of ARID1AB. Types of mutations are indicated in legend. B. Left, FRAP curves for ARID1B-WT-eGFP, Block 9 del, Block 13 del, and NDD-associated mutant-containing cBAF complexes. Error bars represent standard deviation. n = 3 biological trials containing 15 cells each. P-values were calculated using a one-way ANOVA test. ns, not statistically significant. Right, Immobile fraction and T1/2 for all variants. C. Left, schematic of experiment to test the impact of SMARCA2/4 ATPase inhibiton on cBAF condensate formation; Middle, live cell imaging of eGFP-tagged cBAF complexes containing WT ARID1A across indicated conditions. Scale bars, 10 μm. D. Clustered heatmaps reflecting chromatin occupancy of cBAF complexes marked by HA(ARID1B) and SMARCA4 and DNA accessibility (ATAC-Seq) at cBAF occupied sites. E. Distance-to-TSS plots for Clusters defined in panel D. F. PCA of ATAC-Seq peaks for all ARID1B WT and mutant variants. Clustered heatmaps reflecting chromatin occupancy of cBAF complexes marked by HA(ARID1B) and SMARCA4. G. PCA of ATAC-Seq peaks for all ARID1A/B variants tested.
Supplemental Movie S1: Time lapse live imaging of AN3CA cells expressing eGFP-tagged ARID1A and ARID1B WT and DBDmut constructs, related to Figure 2.
Supplemental Table S1: TMT-Mass Spectrometric analyses of HA-tagged ARID1A/B WT and mutants, related to Figures 4 and 7.
Supplemental Table S2: TMT-Mass Spectrometric analyses of TurboID-based proximity labelling experiments, related to Figures 4 and 6.
Data Availability Statement
All genomic data have been deposited on the NCBI Gene Expression Omnibus via GSE209961.
No original code was created in this study.
Any additional information required to reanalyze the data reported in this paper is available from the lead contact upon request.